Embed Size (px)
Citation preview

This PDF is a selection from an out-of-print volume from the National Bureauof Economic Research
Volume Title: The Flow of Capital Funds in the Postwar Economy
Volume Author/Editor: Raymond W. Goldsmith
Volume Publisher: NBER
Volume ISBN: 0-870-14112-0
Volume URL: http://www.nber.org/books/gold65-1
Publication Date: 1965
Chapter Title: The Market for Corporate Bonds
Chapter Author: Raymond W. Goldsmith
Chapter URL: http://www.nber.org/chapters/c1687
Chapter pages in book: (p. 208 - 233)
CHAPTER 8
The Market for Corporate Bonds
Character of the Market
CORPORATE bonds constitute one of the major sectors of the Ameri-can capital market. The total amount outstanding during the post-war period was larger than that of tax-exempt securities or preferredstock, although smaller than Treasury securities, residential mort-gages, or common stock. The corporate bond market is characterizedby the great variety of securities it covers, differing in maturity, call-ability, security, and convertibility, as well as in the variety of issuers,holders, and methods of distribution. Hence, general statements aboutcorporate bonds are more difficult to make than for Treasury or stateand local government securities.
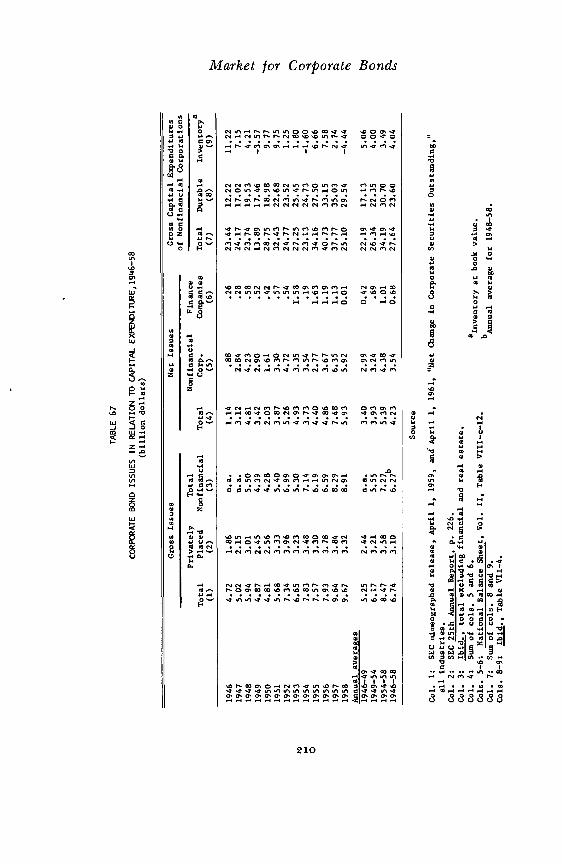
1. While corporate bonds are issued for many purposes, their pro-ceeds are used most commonly to defray fixed capital expenditures,then for the retirement of maturing or called bond issues, the repay-ment of other debt, and the financing of inventories and receivables,particularly bond issues of trade corporations and finance companies.The fluctuations in the volume of net corporate bond issues are there-fore related primarily to those in business expenditures on structuresand equipment.
The volume of offerings of corporate bonds and of the net changein corporate bonds outstanding depends partly on corporate expendi-tures on fixed capital, but the relationship is not a very close or in-variable one. For the postwar period as a whole, aggregate offeringsof bonds and notes by nonfinancial corporations (i.e., all corporationsless those classified by the Securities and Exchange Commission as
208
Market for Corporate Bonds"financial and real estate") averaged one-fourth of their expenditureson fixed capital, while the net increase in bonds and notes outstand-ing was about one-sixth of fixed capital expenditures. The link be-tween these two ratios is that the average net increase in bonded debtwas three-fifths of new bond offerings; these ratios were very similarin Cycles II and III (Table 67).
2. Three main methods of bringing together the issuers and thebuyers of corporate bonds were used on a large scale throughout thepostwar period: negotiated public offerings, competitive public offer-ings, and direct placements. Public offering of corporate bonds ac-quired by investment bankers from the issuers as a result of competi-tive bidding was the prevalent method of distributing public utility(excluding telephone) bonds. The bonds of industrial, telephone, andrailroad corporations, on the other hand, were distributed either bypublic offerings of issues acquired as a result of negotiations betweenthe investment bankers and the issuers, or by direct placement, inwhich a small group of institutional investors acquires the securitiesdirectly from the issuer. Life insurance companies and, to a lesser ex-tent, pension funds acquired most of the directly placed bonds. Pub-lic offerings were absorbed mostly by other institutional investors, al-though insurance companies and pension funds were important buy-ers also.
3. The distribution of corporate bond offerings among the maingroups of issuers can be followed in Table 68, while Table 71 showsthe share of directly placed bonds and notes for the same groups. Oftotal bond offerings of about $90 billion,' approximately 30 per centeach were issued by manufacturing companies and by electric and gasutilities. Communications, primarily the Bell system, accounted for11 per cent and railroads for 6 per cent. The last fourth of corporatebond offerings was divided among finance companies, real estate cor-porations, and trade and miscellaneous corporations. The distributionof bond offerings among the main industries did not significantly dif-fer from one cycle to the other (Table 68). Yet, as shown in Table71, between 1949—54 and 1954—58 the share of privately placed bondsissued by the major industries, such as manufacturing, public utili-ties, and financial and real estate corporations, declined; as a result,the share of total bonds issued and privately placed was only 44 percent in Cycle III compared to 52 per cent in Cycle II.
125th Annual Report, SEC, p. 222.
209
TAB
LE 6
7
BO
ND
ISSU
ESIN RELATION
TOC
AP
ITA
LEX
PEN
DIT
1.JR
E,19
46—
58(b
illio
ndo
llars
)
0 0 0
0
Cross Issues
Net Issues
Gross Capital
of NonfinancialExpenditures
Corporations
Tota
lN
onfin
anci
alC
orp.
Fina
nce
Com
pani
esTo
tal
Priv
atel
yPl
aced
Tota
lN
onfin
anci
alTo
tal
Dur
able
Inve
ntor
ya
(1)
(2)
(3)
(4)
(5)
(6)
(7)
(8)
(9)
1946
4.72
1.86
n.a.
1.14
.88
.26
23.44
12.22
11.22
1947
5.02
2.15
n.a.
3.12
2.84
.28
24.17
17.02
7.15
1948
5.94
3.01
5.50
4.81
4.23
.58
23.74
19.53
4.21
1949
4.87
2.45
4.39
3.42
2.90
.52
13.89
17.46
—3.57
1950
4.81
2.56
4.28
2.03
1.61
.42
28.7
518
.98
9.77
1951
5.68
3.33
5.40
3.87
3.30
.37
32.4
322
.68
9.75
1952
7.34
3.96
6.99
5.26
4.72
.54
24.7
723
.52
1.25
1953
6.65
3.23
5.30
4.93
3.35
1.58
27.25
25.45
1.80
1954
7.83
3.48
7.14
3.73
3.54
.19
23.13
24.73
—1.60
1955
7.57
3.30
6.19
4.40
2.77
1.63
34.16
27.50
6.66
1956
7.93
3.78
6.59
4.86
3.67
1.19
40.73
33.15
7.58
1957
9.64
3.84
8.29
7.48
6.35
1.13
37.77
35.03
2.74
1958
9.67
3.32
8.91
5.93
5.92
0.01
25.10
29.54
—4.44
Annual
averages
1946—49
5.25
2.44
n.a.
3.40
2.99
0.42
22.19
17.13
5.06
1949—54
6.17
3.21
5.55
3.93
3.24
.69
26.34
22.35
4.00
1954—58
1946—58
8.47
6.74
3.58
3.10
7.27
627b
5.39
4.23
4.38
3.54
1.01
0.68
34.19
27.64
30.70
23.60
3.49
4.04
Sou
rce
Col
.1:
SEC
mim
eogr
aphe
d re
leas
e, A
pril
1, 1
959,
and
Apr
il 1
1961, "Net Change
inCorporate
Secu
ritie
sOutstanding,"
all industries.
Col. 2:
SEC 25th Annual Report, p. 226.
Col. 3:
Ibid., total excluding financial
and
real
estate.
Col. 4:
Sum of cols. 5 and
6.at book value.
Cols. 5—6:
National Balance Sheet, Vol. II, Table VIII—c—12.
Col.
7:
Sum of cols. 8 and
9.bAnnual
average for 1948—58.
Cols.
8—9:
Ibid
., Ta
ble
VII
—4.
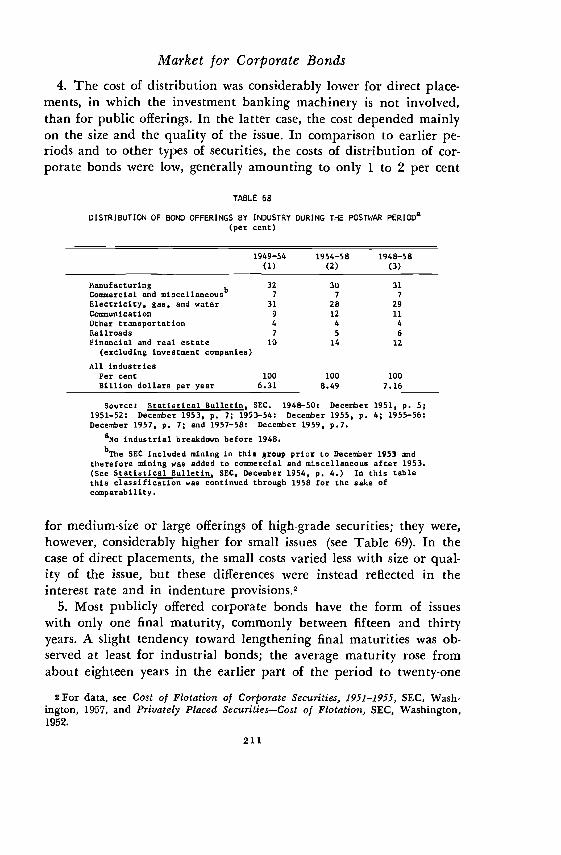
Market for Corporate Bonds4. The cost of distribution was considerably lower for direct place-
ments, in which the investment banking machinery is not involved,than for public offerings. In the latter case, the cost depended mainlyon the size and the quality of the issue. In comparison to earlier pe-riods and to other types of securities, the costs of distribution of cor-porate bonds were low, generally amounting to only 1 to 2 per cent
TABLE 68
DISTRIBUTION OF BOND OFFERINGS BY INDUSTRY DURING POSTWAR pERIODa(per cent)
1949—54(1)
1954—58(2)
1948—58(3)
Manufacturingb
Commercial and miscellaneous32
7
307
31
7
Electricity, gas, and water 31 28 29
Communication 9 12 11
Other transportation 4 4 4
Railroads 7 5 6
Pinancial and real estate 10 14 12
(excluding investment companies)
All industriesPer cent 100 100 100Billion dollars per year 6.31 8.49 7.16
Source: Statistical Bulletin, SEC. 1948—50: December 1951, p. 5;1951—52: December 1953, p. 7; 1953—54: December 1955, P. 4; 1955—56:December 1957, P. 7; and 1957—58: December 1959, p.7.
aN industrial breakdown before 1948.bThe SEC included mining in thia group prior to December 1953 and
therefore mining was added to commercial and miscellaneous after 1953.(See Statistical Bulletin, SEC, December 1954, p. 4.) In this tablethis classification was continued through 1958 for the sake ofcomparability.
for medium-size or large offerings of high-grade securities; they were,however, considerably higher for small issues (see Table 69). In the
case of direct placements, the small costs varied less with size or qual-ity of the issue, but these differences were instead reflected in theinterest rate and in indenture provisions.2
5. Most publicly offered corporate bonds have the form of issueswith only one final maturity, commonly between fifteen and thirtyyears. A slight tendency toward lengthening final maturities was ob-served at least for industrial bonds; the average maturity rose fromabout eighteen years in the earlier part of the period to twenty-one
2 For data, see Cost of Flotation of Corporate Securities, 1951—1955, SEC, Wash-ington, 1957, and Privately Placed Securities—Cost of Flotation, SEC, Washington,
211
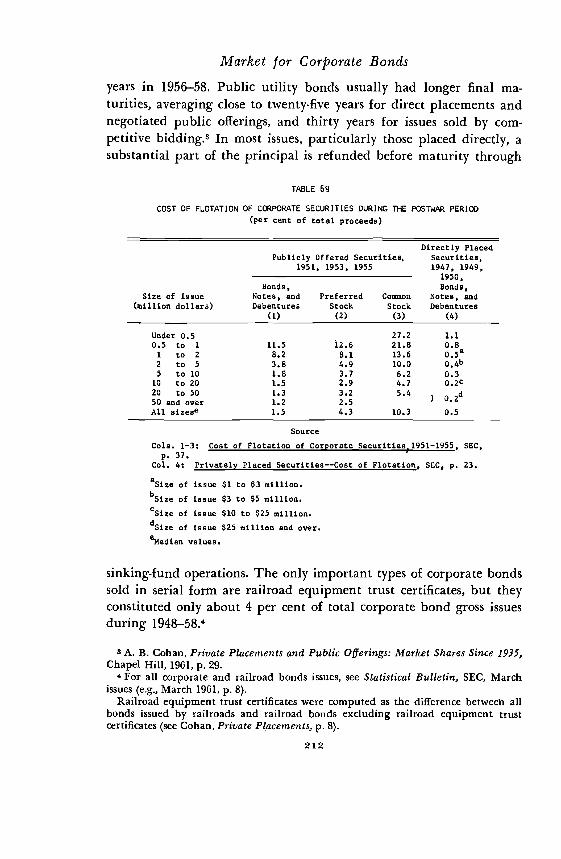
Market for Corporate Bondsyears in 1956—58. Public utility bonds usually had longer final ma-turities, averaging close to twenty-five years for direct placements andnegotiated public offerings, and thirty years for issues sold by com-petitive bidding.3 In most issues, particularly those placed directly, asubstantial part of the principal is refunded before maturity through
TABLE 69
COST OF FLOTATION OF CORPORATE SECURITIES DURING THE POSTWAR PERIOD
(per cent of total proceeds)
Publicly Offered Securities,1951, 1953, 1955
Directly PlacedSecurities,1947, 1949,
1950,
Bonds,Bonds,Size of Issue Notes1 and Preferred Common Notes, and
(million dollars) Debentures
(1)
Stock
(2)
Stock
(3)
Debentures
(4)
Under 0.5 27.2 1.1
0.5 to 1 11.5 12.6 21.8 0.81 to 2 8.2 8.1 13.6
0•5a
2 to 5 3.8 4.9 10.0 04b5 to 10 1.8 3.7 6.2 0.3
10 to 20 1.5 2.9 4.7 O.2C
20 to 5050 and over
1.31.2
3.2
2.55.4 d
) 0.2All aizese 1.5 4.3 10.3 0.5
Source
Cole. 1—3: Cost of of Corporate Securities,195l—l955. SEC,
p. 37.Col. 4: Privately Placed Securities——Cost of Flotation, SEC, p. 23.
of issue $1 to $3 million.
of issue $3 to $5 million.
of issue $10 to $25 million.
dSi of issue $25 million and over.
eMedi values.
sinking-fund operations. The only important types of corporate bondssold in serial form are railroad equipment trust certificates, but theyconstituted only about 4 per cent of total corporate bond gross issuesduring
3 A. B. Cohan, Private Placements and Public Offerings: Market Shares Since 1935,Chapel Hill, 1961, p. 29.
4 For all corporate and railroad bonds issues, see Statistical Bulletin, SEC. Marchissues (e.g., March 1961, p. 8).
Railroad equipment trust certificates were computed as the difference between allbonds issued by railroads and railroad bonds excluding railroad equipment trustcertificates (see Cohan, Private Placements, p. 8).
212
Market for Corporate Bonds6. The size of corporate bond issues varied over a very wide range.
On the average, private placements were considerably smaller thanpublic offerings. For public utility bonds, the size of issues acquiredby bankers through competitive bidding was usually higher than thatof issues obtained through direct negotiation with the issuer. In 1958,for instance, the average size of directly placed issues of more than$1 million was about $6 million, and more than three-fourths of themfell between $1 and $5 million. On the other hand, only 6 per centof the publicly offered issues were in the $1 to $5 million class, while37 per cent exceeded $25 million, and the average size was $25 mil-lion. For industrial bonds (IFS category), the average size of privatelyplaced issues was $8 million compared with an average size of $69million for public
of all corporate bonds is callable atthe option of the issuer, beginning a few years after issuance and usu-ally at small and declining premiums above issue price. This occursbecause many institutional buyers, particularly life insurance coin-panies, with long-term contracts embodying assumptions about aver-age yield rates want to be protected against calls before maturity,which occur only when rates on new issues are low. There was atendency to restrict caflability as the capital market tightened duringthe latter half of the 1950's.
8. Virtually all transactions in corporate bonds occur in the over-the-counter market, the only exceptions being convertible bonds whichresemble common stock. The volume of transactions in corporatebonds after issuance, however, is small. During the only period forwhich statistics are available, a few months in late 1949, the volumeof over-the-counter and exchange transactions was equivalent only toan annual turnover rate of about 10 per cent of corporate bonds out-standing.6 If this ratio applies to the whole period, the volume ofsecondary transactions in corporate bonds is below that of new offer-ings, in contrast to the situation in the markets for corporate stock orfor government securities.
9. The yields of corporate bonds differ according to the size of theissue and the issuer, the type of security pledged, the industry of theissuer, the maturity of the bond and its quality rating, and possiblyother factors.
5 ibid., pp. 27 and 44-45.6 The figures on corporate bond sales are from Irwin Friend, The Over-the-Coun-
ter Securities Markets, New York, 1958, p. 119.213
Market for Corporate Bonds
Developments During the Postwar Period
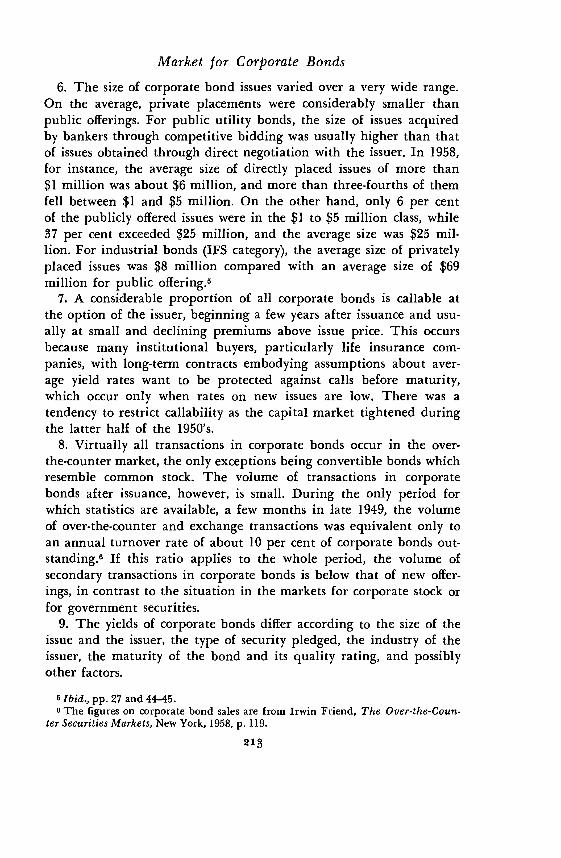
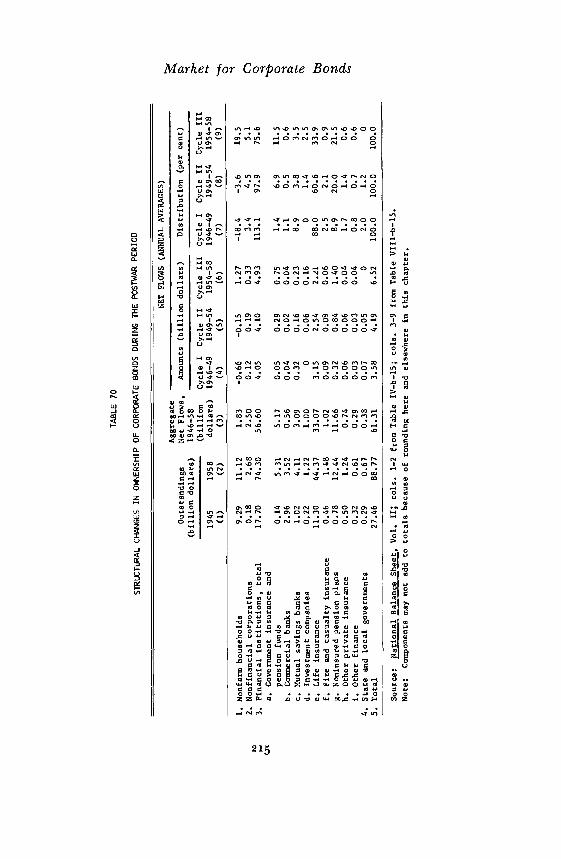
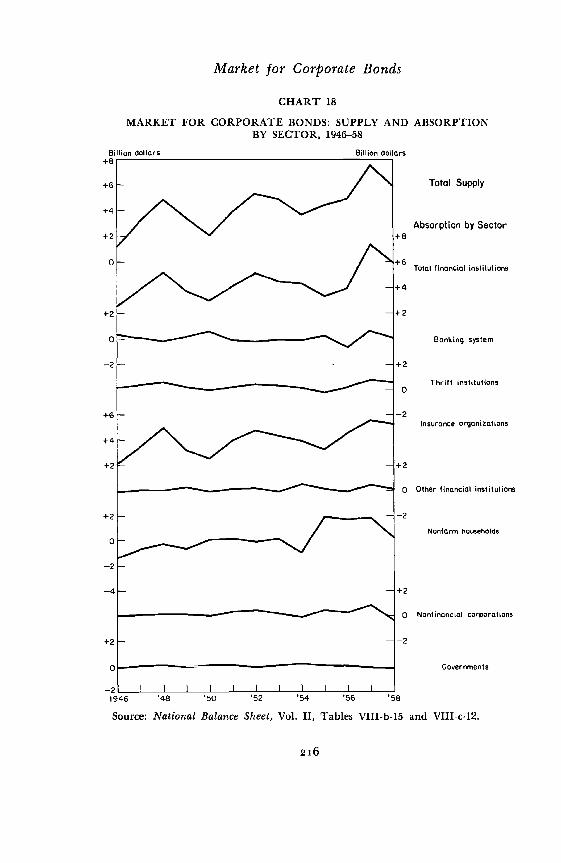
Between the end of 1945 and the end of 1958 the volume of corporatebonds more than tripled, rising from $27 to $89 billion, an averageincrease of 9.5 per cent per year (Table 70 and Chart Cyclicalvariations were considerable, but intercyclical changes point towardan upward trend. The volume of new bond offerings, of course, wasconsiderably higher because some of the new issues were used to re-tire outstanding issues. The ratio between net increase in bonds out-standing and bond offerings, however, was about two-thirds in allthree cycles.8
TIlE ROLE OF CORPORATE BONDS IN FINANCINGNONFINANCIAL CORPORATIONS
Corporate bonds provided approximately one-tenth of total financing,over one-fifth of external financing, and over one-fourth of debt financ-ing of nonfinancial corporations (Table 32). These ratios would beslightly higher if term loans by banks, particularly those with ma-turity of more than five years, were included. The relative importanceof corporate bonds as a means of financing was fairly stable betweenthe three cycles, particularly if bonds are related to total net sourcesof funds.
The share of bonds in total internal or debt financing, of course,varied considerably among industries and among corporations of dif-ferent size or other characteristics. Bonds, for instance, were a muchmore important means of financing for electric and gas utilities thanfor industrial corporations, and for large than for small companies.Thus, for the period 1947—56 long-term debt provided about 14 percent of the total funds of manufacturing and mining corporations,but supplied 34 per cent of the total funds of public utilities. On theother hand, trade corporations raised 6 per cent of their total fundsthrough the issuance of long-term debt.9 (The source does not permitseparation of corporate bonds from other long-term liabilities of morethan one year's maturity.) The share of corporate bonds in externalfinancing amounted to somewhat less than two-fifths in manufactur-
I When figures for all corporate bonds are used, they include a relatively smallamount of foreign government bonds.
8 See Table 67, cols. 1 and 4.9 Figures from Survey of Current Business, various issues, e.g., September 1957,
pp. 10—11.
214
TAB
LE 7
0
STR
UTI
JRA
LCHANGES IN
OF
CO
RP
OR
AT
E B
ON
DS
DU
RIN
G T
hE P
OS
TW
AR
PE
RIO
D
Outstandings
(billion dollars)
Agg
rega
teN
etFlows,
1946—58
(billion
NET
FLO
WS
(AIIN1JAL AVERAGES)
Am
ount
s(billion dollars)
Distribution (per
cent)
Cycle I
Cycle II
Cycle III
Cycle I
Cycle II
Cycle III
1945
1958
dollars)
1946—49
1949—54
1954—58
1946—49
1949—54
1954—58
(1)
(2)
(3)
(4)
(5)
(6)
(7)
(8)
(9)
1.
Nonfarin households
9.29
11.12
1.83
—0.66
—0.15
1.27
—18.4
—3.6
19.5
2.
Nonfinancial corporations
0.18
2.68
2.50
0.12
0.19
0.33
3.4
4.5
5.1
3.
Financial institutions, total
17.70
74.30
56.60
4.05
4.10
4.93
113.1
97.9
75.6
a.
insurance and
pension funds
0.14
5.31
5.17
0.05
0.29
0.75
1.4
6.9
11.5
b. Commercial banks
2.96
3.52
0.56
0.04
0.02
0.04
1.1
0.5
0.6
c. Mutual savings banks
1.02
4.11
3.09
0.32
0.16
0.23
8.9
3.8
3.5
d. Investment companies
0.22
1.22
1.00
00.06
0.16
01.4
2.5
e. Life insurance
11.30
44.37
33.07
3.15
2,54
2.21
88.0
60.6
33.9
f. Fire and casualty insurance
0.46
1.48
1,02
0.09
0.09
0.06
2.5
2.1
0.9
g. Noninsured pension plans
0.78
12.44
11.66
0.32
0,84
1.40
8.9
20.0
21.5
h. Other private insurance
0.50
1.24
0.74
0.06
0.06
0.04
1.7
1.4
0.6
i. Other finance
0.32
0.61
0.29
0.03
0.03
0.04
0.8
0.7
0.6
4.
State and local governments
0.29
0.67
0.38
0.07
0.05
02.0
1.2
0
5.
Totaj
27.46
88.77
61.31
3.58
4.19
6.52
100.0
100.0
100.0
Cl 0 C') 0 0 C
l 0
Source:
National Balance Sheet, Vol. II
cola. 1—2 from Table IV—b—15; cols. 3—9 from Table VI1I—b—15.
Note:
Components may not add to totals because of roundinR here and elsewhere in this chapter.
Market for Corporate Bonds
CHART 18
MARKET FOR CORPORATE BONDS: SUPPLY AND ABSORPTIONBY SECTOR, 1946-58
Billion dollars Billion dollars
o Other financial inStitulioris
—2
Nonform households
+2
0
—21946 '48 '50 '52 '54 '56 '58
Source: National Balance Sheet, Vol. II, Tables VIII-b-15 and VIII-c-12.
216
Total Supply
Absorption by Sector
Total financiol tnstitutions
Banking system
Thrift institutions
Insurance orgOnizations
+2
O Nonfinancial corporations
—2
Governments
Market for Corporate Bondsing and mining corporations, about one-half in public utilities, and70 per cent in railroads, but less than 20 per cent in trade.
The difference in the share of corporate bonds in total and exter-nal financing are due to numerous factors: the character of the usesof funds, particularly the share of fixed capital expenditures againstinventories and receivables; the character of the industry, particularlythe stability of earnings and the influence of regulatory agencies. Themain determinant appears to be the volume of fixed capital expendi-
TABLE 71
SKARE OF PRIVATELY PLACED CORPORATE SECURITIESaIN TOTAL BOND OFFERINGS BY INDUSTRY, 1948-58
(per cent)
1949—54 1954—58 1948—58
ManufacturingCommercial and miscellaneousb
71
88
56
6864
77
Electricity, gas, and water 36 28 31
Communication 11 12 11
Other transportation 84 92 89
Railroads 4 3 3
Financial and real estate 77 63 71
All industries 52 44 48
Source: For numerator, 25th Annual Report, SEC, p. 226; for denomi-nator, see source to Table 68.
numerators include a small amount of corporate stocks privatelyplaced. The source does not provide a breakdown by industry betweenprivately placed bonds and stocks.
bud extractive industry (see note b in Table 68).
tures, although corporate bond issues usually are considerably smallerthan fixed capital expenditures. For all nonfinancial corporations to-gether, corporate bonds provided about one-sixth of fixed capital ex-penditures during the postwar period, and changes in the ratio fromcycle to cycle were moderate.
CHANGES IN METHOD OF MARKETING CORPORATE BONDS
The proportion of corporate bonds placed directly averaged about 45per cent for the entire postwar period. It was highest at slightly above50 per cent in Cycle II, the ratio for Cycle I being 47 per cent, andfor Cycle III 44 per cent.'° As can be seen from Table 71, most in-dustrial subdivisions followed the main pattern, but the level of theshare of private placements varied widely among industries. Of thetwo most important issuer groups, electric utilities had an average
10 Cohan, Private Placements, pp. 6—8.
217
Market for Corporate Bondsratio of direct placements of about 30 per cent since many regulatoryagencies prescribe offerings through competitive bidding, while bondofferings of manufacturing had an average ratio of almost two-thirds.
CHANGE IN DISTRIBUTION OF HOLDINGS
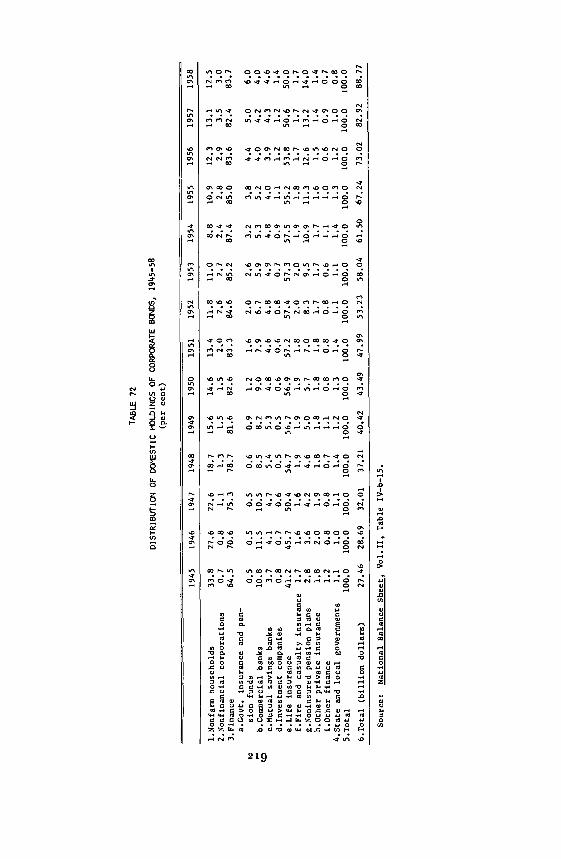
The outstanding characteristic of the distribution of net purchases ofcorporate bonds during the postwar period is the dominance of finan-cial institutions (see Table 70 for cycle averages and Tables 72 and73 for annual data). While financial institutions absorbed only aboutthree-fourths of the total increase in Cycle III, their purchases werevirtually as large as or even larger than the entire increase in supplyin Cycles I and II. In Cycle I the increase in holdings of financial in-stitutions was higher than the rise in total corporate bonds outstand-ing so that all other holders together showed a net sales balance, eventhough the total supply of corporate bonds increased by about 50 percent from 1945 to 1949. The share of financial institutions in the netissuance of corporate bonds, while remaining high throughout thepostwar period, declined from cycle to cycle.
Among financial institutions, the insurance sector was the predom-inant buyer of corporate bonds, and here again private life insurancecompanies were the decisive factor. For the entire postwar period theincrease in the holdings by life insurance companies amounted toslightly more than one-half of the total increase in corporate bondsoutstanding. The addition of private and government pension and so-cial insurance funds brings the share to four-fifths of the total, andto almost nine-tenths of the absorption of corporate bonds for allfinancial institutions. In comparison to the insurance sector, the netpurchases of other financial institutions were relatively small. Mutualsavings banks absorbed about 5 per cent of the total increase in cor-porate bonds outstanding during the postwar period. Net purchasesby commercial banks were virtually nil, but consideration must begiven to the fact that at least part of their term loans are very simi-lar in character to directly placed corporate bonds, such as were pur-chased in large amounts by insurance organizations. If term loanswith a maturity of more than five years are included, the share ofcommercial banks in the net issuance of corporate bonds would riseto about one-tenth of the total, which is still much lower than thepurchases of life insurance companies and private pension plans.
The predominance of life insurance companies is most pronouncedduring Cycle I; their share remained high during Cycle II, but
218
TAB
LE 7
2
OF DOMESTIC
HOLDINGS OF CORPORATE
1945
—58
(per
cent)
1945
1946
1947
1948
1949
1950
1951
1952
1953
1954
1955
1956
1957
1958
l.Nonfarm households
33.8
27.6
22.6
18.7
15.6
14.6
13.4
11.8
11.0
8.8
10.9
12.3
13.1
12.5
2.Nonfinancial corporations
0.7
0.8
1.1
1.3
1.5
1.5
2.0
2.6
2.1
2.4
2.8
2.9
35
3.0
3.Finance
64.5
70.6
75.3
78.7
81.6
82.6
83.3
84.6
85.2
87.4
85.0
83.6
82.4
83.7
a.Covt. insurance and pen-
sion
fund
s0.
50.
50.
50.
60.
91.
21.
62.
02.
63.
23.
84.4
5.0
6.0
b.C
omin
erci
al b
anks
10.8
11.5
10.5
8.5
8.2
9.0
7.9
6.7
5.9
5.3
5.2
4.0
4.2
4.0
c.Nutual savings banks
3.7
4.1
4.7
5.4
5.3
4.8
4.6
4.8
4.9
4.8
4.0
3.9
4.3
4.6
d.Investment companies
0.8
0.7
0.6
0.5
0.5
0.6
0.6
0.8
0.7
0.9
1.1
1.2
1.2
1.4
e.Life insurance
41.2
45.7
50.4
54.7
56.7
56.9
57.2
57.4
57.3
57.5
55.2
53.8
50.6
50.0
f.Ftre and casualty insurance
1.7
1.6
1.6
1.9
1.9
1.9
1.8
2.0
2.0
1.9
1.8
1.7
1.7
1.7
g.Noninsured pension plans
2.8
3.6
4.2
4.6
5.0
5.7
7.0
8.3
9.5
10.9
11.3
12.6
13.2
14.0
h.Other private insurance
1.8
2.0
1.9
1.8
1.8
1.8
1.8
1.7
1.7
1.7
1.6
1.5
1.4
1.4
t.Other finance
1.2
0.8
0.8
0.7
1.1
0.8
0.8
0.8
0.6
1.1
1.0
0.6
0.9
0.7
4.State and
loca
lgovernments
1.1
1.0
1.1
1.4
1.2
1.3
1.4
1.1
1.1
1.4
1.3
1.2
1.0
0.8
S.Total
100.0
100.0
100.0
100.0
100.0
100.0
100.0
100.0
100.0
100.0
100.0
100.0
100.0
100.0
6.Total (billion dollars)
27.46
28.69
32.01
37.21
40.42
43.49
47.99
53.23
58.04
61.50
67.24
73.02
82.92
88.77
Sour
ce:
Nat
iona
l Bal
ance
She
et, V
ol.1
1, T
able
IV—
b—15
.
OF
DO
ME
ST
ICFL
OW
OF
FU
'IDS
,CO
RP
OR
.AT
E B
ON
DS
, l9L
,6_5
8(p
er c
ent)
DIS
TR
IBU
TIO
N
TA
8LE
73
0
1946
1947
1948
1949
1950
1951
1952
1953
1954
1955
1956
1957
1958
1. N
onfa
rm h
ouse
hold
s—111.4
—20.8
—5.
4—
19.6
1.0
1.6
—2.
9.2
.5—
28.0
33.3
287
18.7
4.8
2. Nonfinancial corporations
3.3
3.6
2.7
4.4
1.0
6.7
7.8
3.7
—2.0
7.1
4.0
8.4
—4.4
3. Finance
207.3
116.0
99.4
115.6
96.1
89.6
96.4
92.7
124.3
58.9
67.1
73.9
101.
7a. Government insurance and
pension funds
00.3
1.2
4.7
4.9
5.3
6.5
8.3
16.2
10.3
10.9
9.7
19.7
b. Commercial banks
28.5
1.8
—3.8
4.7
18.9
—2.9
—4.2
—2.5
—4.0
4.2
—11.1
6.1
0.5
c. Mutual savings banks
13.8
9.6
9.6
4.4
2..6
2.9
7.1
6.0
2.6
4.5
2.2
7.5
9.4
d. Investment companies
—1.6
—0.6
0.2
0.6
1.3
1.1
1.9
0.2
4.0
3.1
1.9
1.4
4.1
e. Life insurance
147.2
91,0
81.3
80.1
59.6
60.2
59.2
56.3
60.7
30.5
37.2
27.0
41.4
f. Fire and casualty insurance
01.8
3.3
2.8
1.6
1.1
3.1
2.5
0.9
—0.2
0.5
1.8
1.5
g. Noninsured pension plans
21.1
9.3
6.7
10.6
14.3
19.6
20.2
22.2
35.0
15.9
27.5
17.5
25.8
h. Other private insurance
4.9
1.8
1.2
1.9
1.6
1.3
1.3
1.5
1.7
0.3
1.0
0.3
1.4
1. Other finance
—6.5
0.9
—0.2
5.9
—3.6
0.9
1.3
—1.9
9.2
—0.7
—3.1
2.7
—2.1
4. State and local governments
0.8
1.2
3.3
—0.3
2.0
2.2
—1.3
1.0
5.8
0.7
0.2
—1.0
—2.1
5. Total
100.0
100.0
100.0
100.0
100.0
100.0
100.0
100.0
100.0
100.0
100.0
100.0
100.0
6. Total (billion dollars)
1.23
3.32
5.20
3.21
3.07
4.50
5.24
4.81
3.46
5.74
5.78
9.90
5.85
Source:
National Balance Sheet, Vol. II, Table VtII—b—l.5.
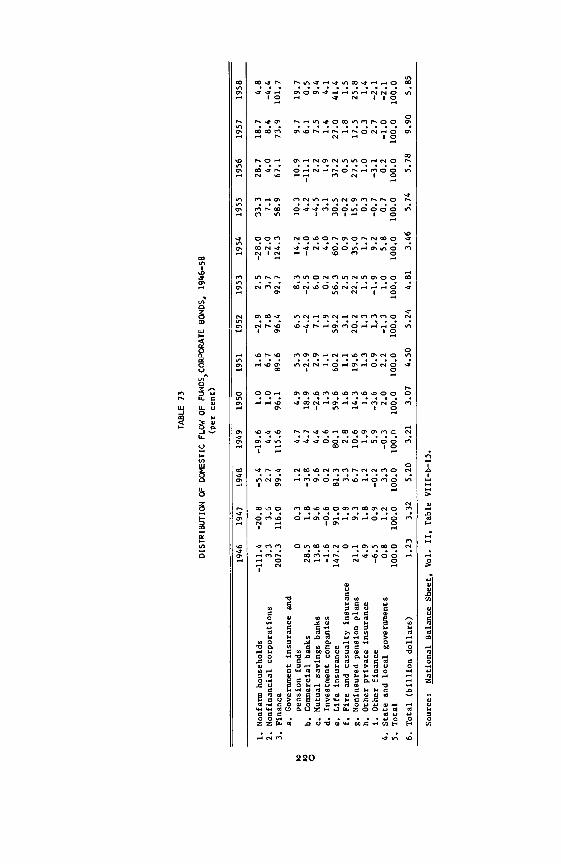
Market for Corporate Bondsdropped markedly in Cycle III. Life insurance companies' purchasesin Cycle III were also considerably below those in Cycles I and IIin absolute figures. On the other hand, the contribution of privatepension plans was more important in Cycle III than in Cycles I orII. In Cycle III the absolute volume of their net purchases equaledtwo-thirds of those of life insurance companies. The importance ofstate and local government insurance and pension funds increasedrapidly during the postwar period until in Cycle HI they had be-come the third most important buyers of corporate bonds. Insuranceorganizations were net buyers of corporate bonds in practically everyyear, as were on a smaller scale mutual savings banks, fire and cas-ualty insurance companies, and investment companies. Commercialbanks, on the other hand, shifted from net buying to selling in sev-eral years of upswing (1948, 1951, 1952, 1953, 1956), and also occa-sionally in recession years (1954).
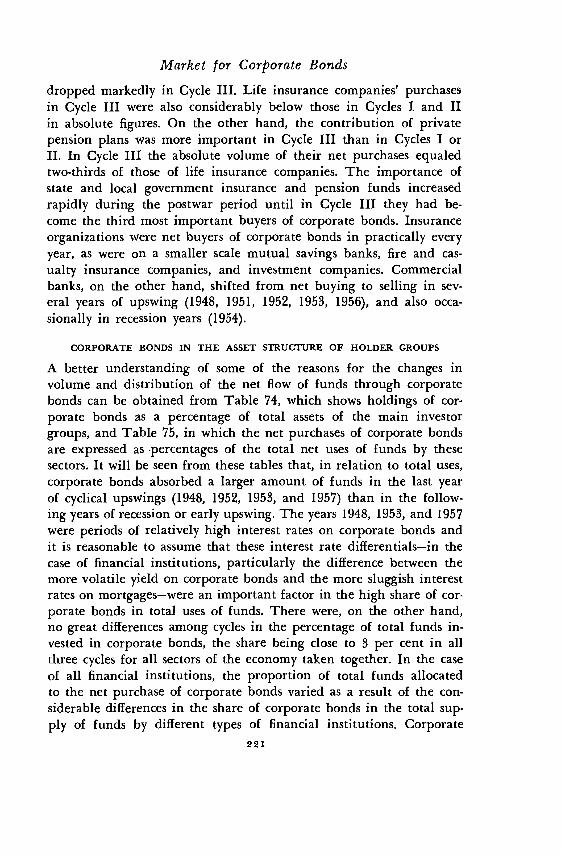
CORPORATE BONDS IN THE ASSET STRUCTURE OF HOLDER GROUPS
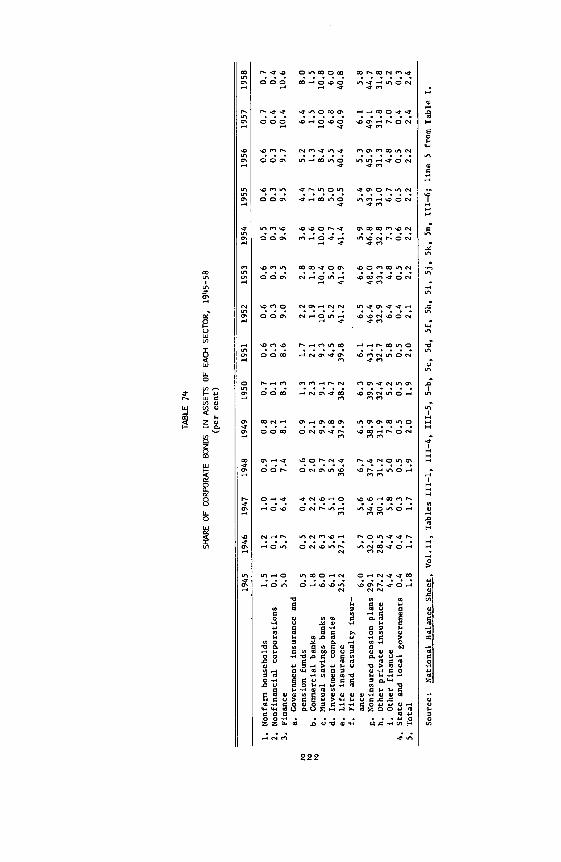
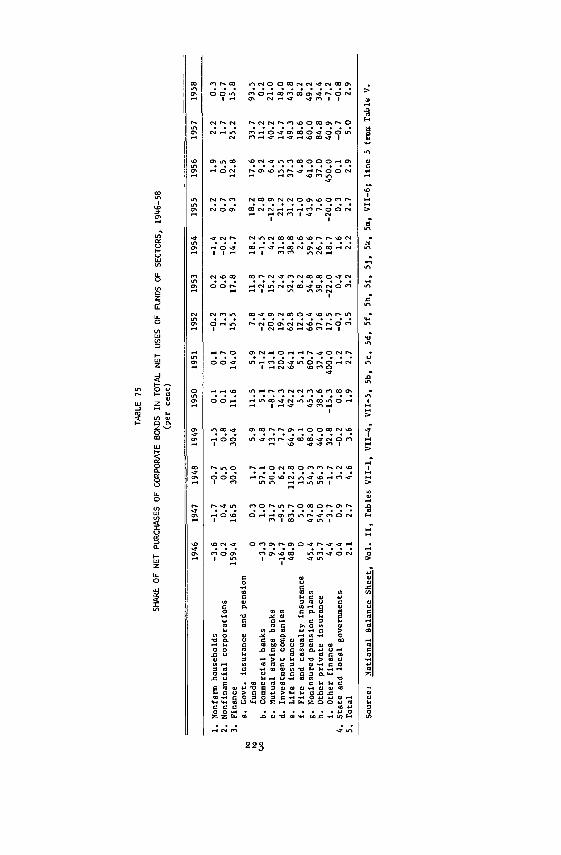
A better understanding of some of the reasons for the changes involume and distribution of the net flow of funds through corporatebonds can be obtained from Table 74, which shows holdings of cor-porate bonds as a percentage of total assets of the main investorgroups, and Table 75, in which the net purchases of corporate bondsare expressed as .percentages of the total net uses of funds by thesesectors. It will be seen from these tables that, in relation to total uses,corporate bonds absorbed a larger amount of funds in the last yearof cyclical upswings (1948, 1952, 1953, and 1957) than in the follow-ing years of recession or early upswing. The years 1948, 1953, and 1957were periods of relatively high interest rates on corporate bonds andit is reasonable to assume that these interest rate differentials—in thecase of financial institutions, particularly the difference between themore volatile yield on corporate bonds and the more sluggish interestrates on mortgages—were an important factor in the high share of cor-porate bonds in total uses of funds. There were, on the other hand,no great differences among cycles in the percentage of total funds in-vested in corporate bonds, the share being close to 3 per cent in allthree cycles for all sectors of the economy taken together. In the caseof all financial institutions, the proportion of total funds allocatedto the net purchase of corporate bonds varied as a result of the con-siderable differences in the share of corporate bonds in the total sup-ply of funds by different types of financial institutions. Corporate
221
TAB
LE
SHARE
OF
CO
RPO
RA
TE B
ON
DS
IN A
SSET
S O
F EA
CH
SEC
TOR
, 19L
.5_5
8(p
ercent)
1945
1946
1947
1948
1949
1950
1951
1952
1953
1954
1955
1956
1957
1958
1. Nonfarm households
1.5
1.2
1.0
0.9
0.8
0.7
0.6
0.6
0.6
0.5
0.6
0.6
0.7
0.7
2. Nonfinancial corporations
0.1
0.1
0.1
0.1
0.2
0.1
0.3
0.3
0.3
0.3
0.3
0.3
0.4
0.4
3.
Fina
nce
5.0
5.7
6.4
7.4
8.1
8.3
8.6
9.0
9,5
9.6
9.5
9,7
10.4
10.6
a.
Gov
ernm
ent i
nsur
ance
and
pens
ion
fund
s0.
50.
50.
40.
60.
91.
31.
72.
22.
83.
64.
45.
26.
48.
0b.
Com
mer
cial
ban
ks1.
82.
22.
22.
02.
12.
32.
11.
91.
81.
61.
71.
31.
51.
5c.
Mutual savings banks
6.0
6.3
7.6
9.7
9.9
9.1
9.3
10.1
10.4
10.0
8.5
8.4
10.0
10.8
d.Investment companies
6.1
5.6
5.1
5.2
4.8
4.7
4.5
5.2
5.0
4.7
5.0
5.5
6.8
6.0
e. Life insurance
25.2
27.1
31.0
36.4
37.9
38.2
39.8
41.2
41.9
41.4
40.5
40.4
40.9
40.8
f. Fire and casualty insur-
ance
6.0
5.7
5.6
6.7
6.5
6.3
6.1
6.5
6.6
5.9
5.4
5.3
6.1
5.8
g. Noninsured pension plans 29.1
32.0
34.6
37.4
38.9
39.9
43.1
46.4
48.0
46.8
43.9
45.9
49.1
44.7
h. Other private insurance
27.2
28.5
30.1
31.2
31.9
32.4
32.7
32.9
33.3
32.8
31.0
31.3
31.8
31.8
j.
Oth
erfinance
4.4
4.4
5.8
5.0
7.8
5.2
5.8
6.4
4.8
7.3
6.7
4.8
7.0
5.2
4. State and local governments
0.4
0.4
0.3
0.5
0.5
0.5
0.5
0.4
0.5
0.6
0.5
0.5
0.4
0.3
5. Total
1.8
1.7
1.7
1.9
2.0
1.9
2.0
2.1
2.2
2.2
2.2
2.2
2.4
2.4
Source:
National Balance Sheet, Vol.11, Tables 111—1, 111—4, 111—5, 5—b, 5c, Sd, 5f, 5h, 5i, 5j, 5k, Sm, 111—6; line 5 from Table I.
TAB
LE 7
5
SH
AR
E O
F N
ET
PU
RC
HA
SE
S O
F C
OR
PO
RA
TE
BO
ND
S IN
TO
TA
L N
ET
US
ES
OF
FU
ND
SO
FS
EC
TO
RS
, 19L
46_5
8(p
erce
nt)
1946
1947
1948
1949
1950
1951
1952
1953
1954
1955
1956
1957
1958
1. N
onfa
rm h
ouse
hold
s—
3.6
—1.
7—
0.7
—1.
50.
10.
1—
0.2
0.2
—1.
42.
21.
92.
20.
32.
Non
finan
cial
cor
pora
tions
0.2
0.4
0.5
0.8
0.1
0.7
1.3
0.6
—0.
20.
70.
51.
7—
0.7
3. F
inan
ce15
9.4
16.5
30.0
30.4
11.6
14.0
15.5
17.8
14.7
9.3
12.8
25.2
15.8
a. G
ovt.
insu
ranc
e an
d pe
nsio
nto
fund
s0
0.3
1.7
5.9
11.5
597.
811
.818
.218
.217
.633
.793
.5b.
Com
mer
cial
ban
ks—
331.
057
.14.
85.
1—
1.2
—2.
4—
2.7
—1.
52.
89.
211
.20.
2c.
Mut
ual
savings
bank
s9.
931
.750
.013
.7—
8.7
13.1
20.9
15.2
4.2
—12
.96.
440
.221
.0d.
Investment
com
pani
es—
16.7
—9.
56.
27.
714
.320
.019
.22.
431
.821
.215
.514
.718
.0a.
Life
insu
ranc
e48
.983
.711
2.8
64.9
42.2
64.1
62.8
52.3
38.8
31.2
37.3
49.3
43.8
f.
Fire
and
cas
ualty
insu
ranc
e0
5.0
15.0
8.1
5.2
5.1
12.0
8.2
2.6
—1.
04.
818
.68.
2g.
Non
insu
red
pens
ion
plan
s45
.447
.854
.348
.045
.360
.766
.454
.859
.643
.961
.060
.049
.2h.
Oth
er p
rivat
e in
sura
nce
53.7
54.0
56.3
44.0
38.6
37.4
37.6
39.8
26.7
7.6
37.0
84.8
34.4
1. O
ther
fina
nce
4.4
—3.
7—
1.7
32.8
—15
.340
0.0
17.5
—22
.018
.7—
20.0
450.
040
.9—
7.2
4. S
tate
and
loca
l gov
ernm
ents
0.4
0.9
3.2
—0.
20.
81.
2—
0.7
0.4
1.6
0.3
0.1
—0.
7—
0.8
5. T
otal
2.1
2.7
4.6
3.6
1.9
2.7
3.5
3.2
2.2
2.7
2.9
5.0
2.9
Sou
rce:
Nat
iona
l Bal
ance
She
et, V
ol. I
I, T
able
s V
u—i,
VII—
4, V
U—
S,
Sb,
Sc,
5d,
5f,
5h, 5
i, 5)
, 5k,
5m
, VII—
6; li
ne 5
frum
Tab
le V
.
Market for Corporate Bondsbonds were very important for life insurance companies and privatepension funds. The share of corporate bonds in total net uses of pri-vate noninsured pension funds averaged over one-half for the entireperiod. For other financial institutions, the net acquisition of corpo-rate bonds was important but more erratic. In the case of mutual sav-ings banks, net purchases of corporate bonds averaged 15 per cent oftotal uses for the entire period, but ranged from negative values intwo early years of upswing (1950, 1955) to more than 30 per cent inthree later years of cyclical rise (1947, 1948, 1957). Fire and casualtyinsurance companies invested relatively most heavily in corporatebonds in the middle or later years of upswings (1948, 1952, 1957) andleast heavily in recessions and in early upswing years (1946—47, 1949—50, 1954-56), but did not show a net sales balance in corporate bondsduring any year except 1955. Commercial and mutual savings banksshowed a more erratic behavior. Mutual savings banks allocated a con-siderable proportion of total net uses of funds to corporate bonds inthe later phases of upswings (1947—48, 1952—53, 1957), but on balancesold corporate bonds in only two years (1950, 1955). Commercial banksreduced their holdings of corporate bonds in about as many years asthey increased them. In relation to total net uses, the purchases weresubstantial only in three years (1957, 1950, 1949), while sales occurredmostly in the later phases of cyclical upswings, being particularly largein relation to total net uses of funds in 1948 and 1956.
Historical Background
A comparison of the market for corporate bonds in the postwar pe-riod with that in the preceding half century, particularly from 1900to 1929, shows that the main structural changes occurred in the dis-tribution of the bonds among the main investor groups, in the meth-ods of marketing them, and in the distribution of the issuance of thebonds among the main industries. Changes in the characteristics ofcorporate bonds (such as maturity, security, and callability), in therole of corporate bonds as a source of finance, and in the cyclical be-havior of new issues, retirements, and interest rates have been lesspronounced.
1. The change in the distribution of corporate bonds outstandingbetween the postwar and the predepression periods is characterized
1. Both net uses of funds and net bond purchases were negative in 1948 (i.e., theyrepresented net sales of assets) and hence the ratio was positive (Table 75).
224
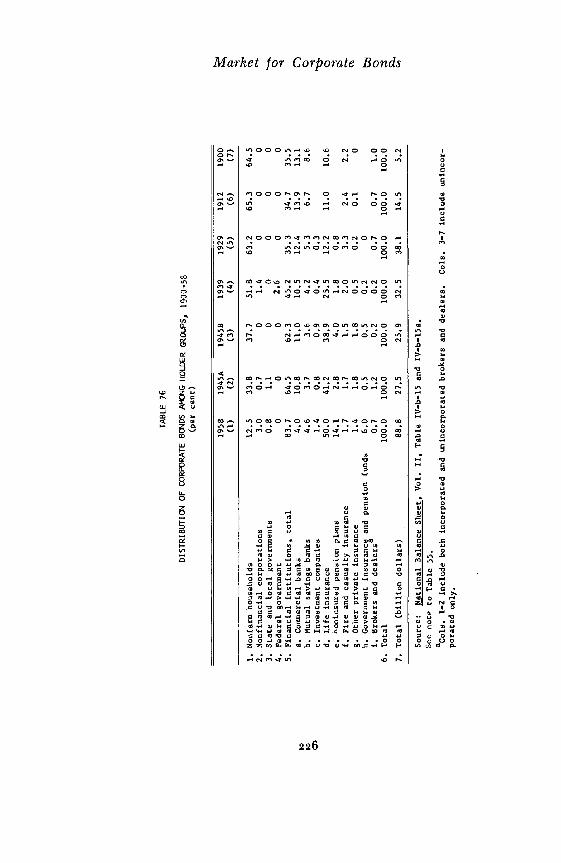
Market for Corporate Bondsby a far-reaching shift toward institutional holdings accompanied bya substantial reduction of individuals' holdings.12 As Table 76 andChart 19 show, individuals accounted for nearly two-thirds of all cor-porate bonds outstanding at the three benchmark dates of 1900, 1912,and 1929. Hence individuals also may be assumed to have absorbedabout two-thirds of all new issues of corporate bonds during thesethirty years. Even as late as 1939, individuals still held more than one-half of all corporate bonds outstanding, although the absolute amountswere considerably lower than ten years earlier, while the holdings byfinancial institutions had increased. This situation is in sharp contrastto the rapid decline during the postwar period of individuals' hold-ings.
The distribution of holdings of corporate bonds among financialinstitutions also shows considerable differences between the prede-pression and the postwar periods. In 1900, 1912, and 1929 commer-cial banks held more corporate bonds than life insurance companies,although there was a slight tendency for the latter to increase rela-tive to the former. During the postwar period on the other hand, theholdings of life insurance companies rose from almost four tO twelvetimes those of commercial banks. As a result, the holdings of com-mercial banks declined between 1945 and 1958 from about one-sixthto one-twentieth of institutional holdings of all financialMutual savings banks and fire and casualty insurance companies alsowere more important among financial institutions as holders of cor-porate bonds during the predepression than during the postwar pe-riod, but the difference was less pronounced than for commercialbanks. The outstanding change, however, occurred in the role of lifeinsurance organizations. While they had held only about one-eighthof total amounts outstanding and one-third of total institutional hold-ings of corporate bonds in 1900, 1912, and 1929, their share in thepostwar period rose to two-fifths of total outstandings in 1945 andto one-half in 1958, and they accounted for three-fifths of institutionalholdings of corporate bonds.
12 Actually a residual, the difference between estimated total bonds outstandingand reported or estimated institutional holdings.
18 The decline in the share of holdings would be partly offset if allowance weremade for the holdings by commercial banks of term loans, particularly loans ofmore than Five years' maturity which expanded considerably during the postwarperiod. Even if these loans are included (Federal Reserve Bulletin, April 1959, p.358), commercial banks in 1958 held only a little over one-tenth of all bonds andterm loans of more than five
225
TAB
LE 7
6
DISTRIBUTICZd
OF
CO
RPO
RA
TE B
Ct'J
DS
HO
LDER
GR
OU
PS, 1
900-
58(p
ercent)
1.958
(1)
1945A
(2)
1945B
(3)
1939
(4)
1929
(5)
1912
(6)
1900
(7)
I.
Nonfarm households
12.5
33.8
37.7
51.8
63.2
65.3
64.5
2.
Nonfinancial corporations
3.0
0.7
01.4
00
0
3.
State and local governments
0.8
1.1
00
00
0
4.
Federal government
00
02.6
00
0
5.
Financial institutions, total
83.7
64.5
62.3
45.2
35.3
34.7
35.5
a. Commercial banks
4.0
10.8
11.0
10.5
12.4
13.9
13.1
b. Mutual savings banks
4.6
3.7
3.6
4.2
5.3
6.7
8.6
c. Investment companies
1.4
0.8
0.9
0.4
0.3
d. Life insurance
50.0
41.2
38.9
25.5
12.2
11.0
10.6
e. ilonjnsured pension plans
14.1
2.8
4.0
1.8
0.8
f. Fire and casualty insurance
1.7
1.7
1.5
2.0
3.3
2.4
2.2
g. Other private insurance
1.4
1.8
1.8
0.5
0.2
0.1
0
h. Government insurance and pension
i. 8rokers and dealersa
funds
6.0
0.7
0.5
1.2
0.5
0.2
0.2
0.2
0
0.7
0.7
1.0
6. Total
100.0
100.0
100.0
100.0
100.0
100.0
100.0
7.
Total (billion dollars)
88.8
27.5
25.9
32.5
38.1
14.5
5.2
Source:
National Balance Sheet, Vol. II, Table IV—b—15 and IV—b—15a.
See note to Table 55.
acols. 1—2 include both incorporated and unincorporated brokers and dealers.
Cole. 3—7 include unincor-
porated only.
0 C-.
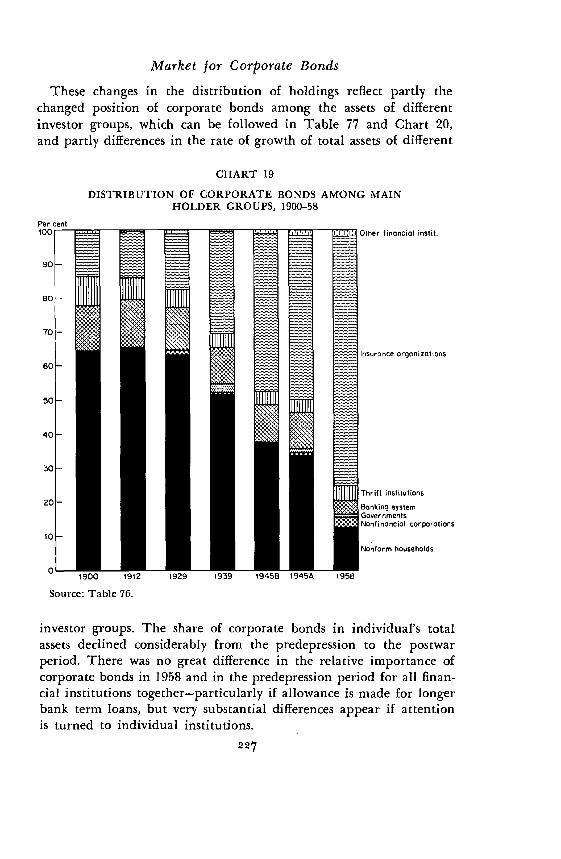
Market for Corporate BondsThese changes in the distribution of holdings reflect partly the
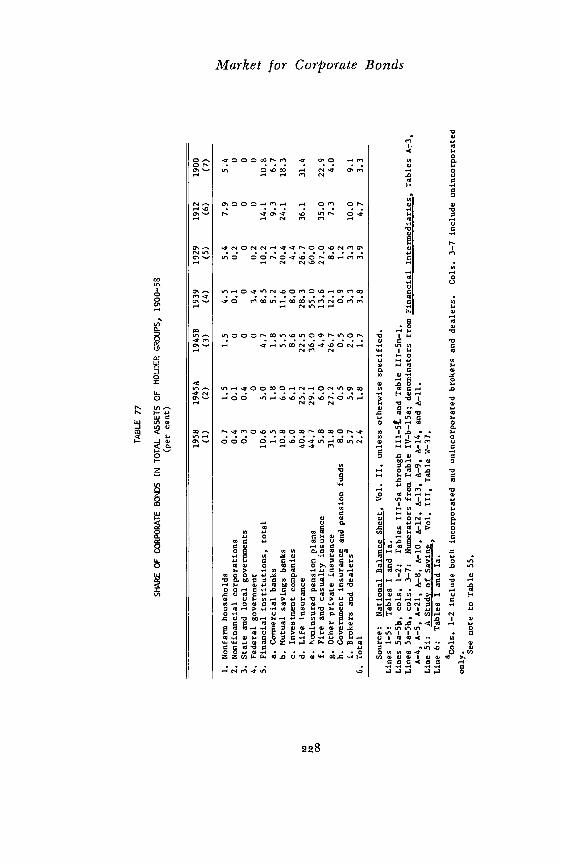
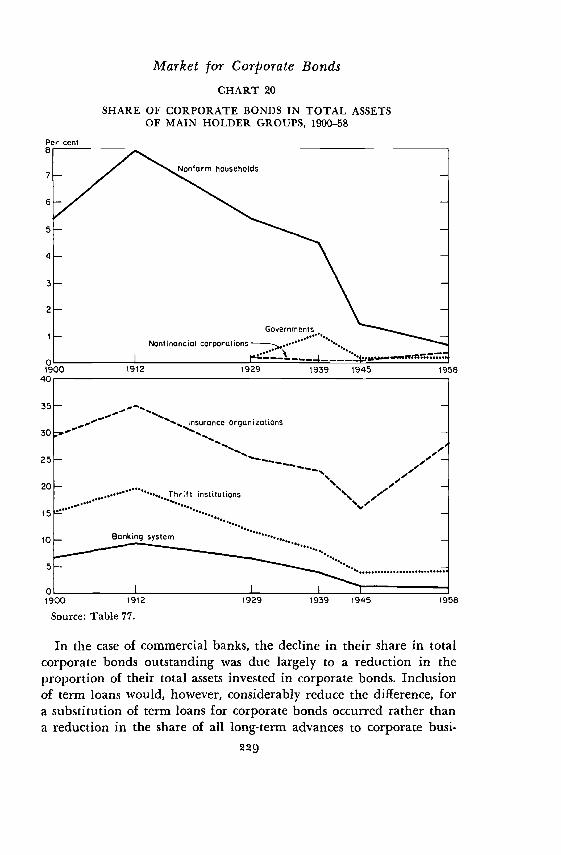
changed position of corporate bonds among the assets of differentinvestor groups, which can be followed in Table 77 and Chart 20,and partly differences in the rate of growth of total assets of different
CHART 19DISTRIBUTION OF CORPORATE BONDS AMONG MAIN
HOLDER GROUPS, 1900-58
Other financial instit.
Insurance organizations
Thrift institutions
Banking systemGovernmentsNonfinancial corporations
Nonform households
investor groups. The share of corporate bonds in individual's totalassets declined considerably from the predepression to the postwarperiod. There was no great difference in the relative importance ofcorporate bonds in 1958 and in the predepression period for all finan-cial institutions together—particularly if allowance is made for longerbank term loans, but very substantial differences appear if attentionis turned to individual institutions.
227
Source: Table 76.
cc
TAB
LE 7
7
SH
AR
E O
FCORPORATE
BO
ND
SIN
TOTAL
AS
SE
TS
OF
HOLDER GROUPS,
1900
—58
(per
cent)
0 0 4 0
1958
(1)
1945A
(2)
1945B
(3)
1939
(4)
1929
(5)
1912
(6)
1900
(7)
1.
Nonfarm households
0.7
1.5
1.5
4.5
5.4
7.9
5.4
2.
Nonfinancial corporations
0.4
0.1
00.1
0.2
00
3.
State and local governments
0.3
0.4
00
00
0
4.
Federal government
00
03.4
0.2
00
5.
Financial institutions, total
10.6
5.0
4.7
8.5
10.2
14.1
10.8
a. Commercial banks
1.5
1.8
1.8
5.2
7.1
9.3
6.7
b. Mutual savings banks
10.8
6.0
5.5
11.6
20.4
24.1
18,3
c. Investment companies
6.0
6.1
8.6
8.0
4.4
d. Life insurance
40.8
25.2
22.5
28.3
26.7
36.1
31.4
a. Noninsured pension plans
44.7
29.1
36.0
55.0
60.0
f. Fire and casualty insurance
5.8
6.0
4.9
13.6
27.0
35.0
22.9
g. Other private insurance
31.8
27.2
26.7
12.1
8.6
7.3
4.0
h. Government insurance and pension funds
8.0
0.5
0.5
0.9
1.2
i. Brokers and dealers
5.7
5.9
2,0
3.3
3.3
10.0
9.1
6.
Total
2.4
1.8
1.7
3.8
3.9
4.7
3.3
Source:
National Balance Sheet. Vol. II. unless otherwise specified.
Lines 1—5:
Tables I and Ia,
Lines 5a—5b. cols. 1—2:
Tables III—5a through III—5t and Table 111—Sm—i,
Lines 5a—Sh, cols. 3—7:
Numerators from Table IV—b—lSa; denominators from Financial Intermediaries, Tables A—3,
A—4, A—5, A—21, A—8, A—10, A-12, A—l3, A—9, A—14, and A—il.
Line 5i:
A Study of Saving
Vol. III, Table W—37.
Line 6:
Tables I and Ia.
aCols. 1—2 include both incorporated and unincorporated brokers and dealers.
Cols. 3—7 include unincorporated
only. See note to Table 55.
Market for Corporate BondsCHART 20
In the case of commercial banks, the decline in their share in totalcorporate bonds outstanding was due largely to a reduction in theproportion of their total assets invested in corporate bonds. Inclusionof term loans would, however, considerably reduce the difference, fora substitution of term loans for corporate bonds occurred rather thana reduction in the share of all long-term advances to corporate busi-
229
SHARE OF CORPORATE BONDS IN TOTAL ASSETSOF MAIN HOLDER GROUPS, 1900-58
01900
Source: Table 77.
Market for Corporate Bondsness in the assets of commercial banks. The increasing importance oflife insurance companies as holders of corporate bonds, on the otherhand, is due mostly to the rapid growth of total assets of these insti-tutions and only secondarily to the increased allocation of funds tocorporate bonds. The 1958 share was considerably higher than theshares of 1929 and 1945, but was not much above the proportionbefore World War I. Mutual savings banks, fire and casualty insur-ance companies, and investment companies showed a considerablylower share of corporate bonds in total assets in the postwar than inthe predepression or prewar period. On the other hand, corporatebonds were much less important in the portfolios of "other privateinsurance" in the predepression period than after World War II. Ina few investor groups corporate bonds, while still representing onlya relatively small proportion of total assets, were essentially intro-duced after World War II, particularly state and local governmentsand their pension and insurance funds.
The second major difference between the postwar and prewar pe-riods is the much greater importance of railroad bonds compared topublic utility, and particularly to industrial bonds, in the prewar pe-riod. The decline in the share of railroad issues, however, was alreadyevident during the prewar period, foreshadowing their precipitous de-cline in 1958 (see Table 78). The share of railroads in net new cor-porate bond issues showed the same movement in still more pro-nounced form falling almost one-half in 1900—12 to about one-fifth in 1913—29, and almost to zero in the postwar period.14
2. The combination of the shift from railroad to public utility andindustrial bonds and from scattered individual to relatively concen-trated institutional holdings resulted in considerable differences inthe methods used in offering and marketing corporate bonds. Before1929, public offering by groups of investment bankers on the basisof direct negotiation with the issuers was predominant. Direct place-ments were virtually unknown and competitive bidding rare exceptfor railroad equipment trust certificates. This difference was accom-panied by considerably higher costs of offerings before the 1930's, re-flecting the much smaller average amount per sale and the relianceon retail bond salesmen. Thus publicly offered larger corporate bondissues ($5 million or over) in the postwar period carried an invest-
14 A Study of Saving, Vol. I, Table V.15, and David Meiselman and Eli Shapiro,The Measurement of Corporate Sources and Uses of Funds, Technical Paper 18,New York, NBER, 1964, Table C-23.
230
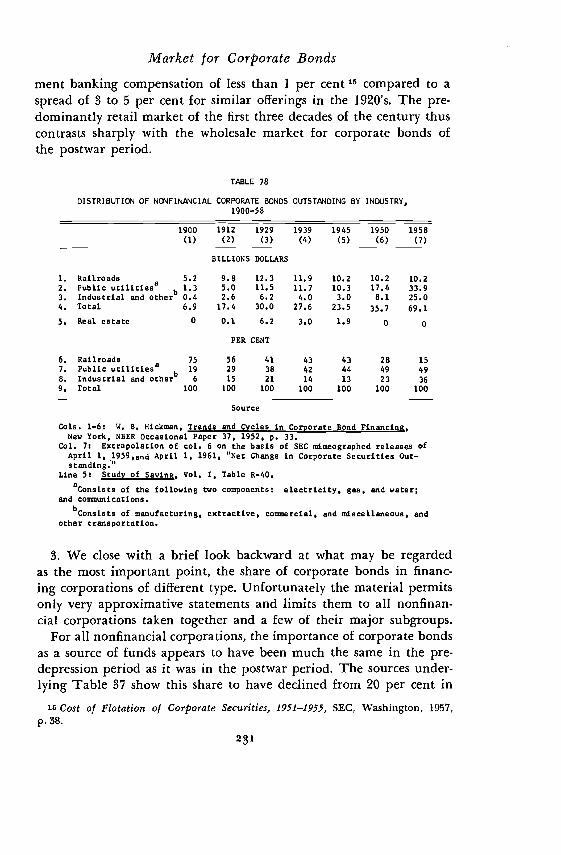
Market for Corporate Bondsment banking compensation of less than 1 per cent compared to aspread of 3 to 5 per cent for similar offerings in the 1920's. The pre-dominantly retail market of the first three decades of the century thuscontrasts sharply with the wholesale market for corporate bonds ofthe postwar period.
TABLE 78
DISTRIBUTION OF NONFINANCIAL CORPORATE BONDS OUTSTANDING BY INDUSTRY,190 0—5 8
1900
(1)
1912
(2)
1929
(3)
1939
(4)
1945
(5)
1950
(6)
1958
(7)
BILLIONS DOLLARS
1.
2.
3.
4.
5.
RailroadsPublic utilittesa
Industrial and otherTotal
Real eState
5.2
b1.30.4
6.9
0
9.85.02.6
17.4
0.1.
PER
12.311.56.2
30.0
6.2
CENT
11.9
11.74.0
27.6
3.0
10.210.33.0
23.5
1.9
10.217.48.1
35.7
o
10.2
33.925.0
69.1
o
6.
7.
8.
9.
RailroadsPublic utilitiesa
Industrial and otherTotal
75
b19
6
100
56
29
15
100
41
38
21
100
43
42
14
100
43
44
13
100
2849
23100
15
49
36100
Source
Cola. 1—6: 14. 8. Hickman, Trends and Cycles in Corporate Bond Financing,New York, NBER Occasional Paper 37, 1952, p. 33.
Col. 7: Extrapolation of col. 6 on the basis of SEC mimeographed of
April 1, i959,and April 1, 1961, "Net Change in Corporate Securities Out—standing."
Line 5: Study of Saving, Vol. I, Table R—40.of the following two components: electricity, gas, and water;
and communications.
of manufacturing, extractive, conunercial, and miscellaneous, andother transportation.
3. We close with a brief look backward at what may be regardedas the most important point, the share of corporate bonds in financ-ing corporations of different type. Unfortunately the material permitsonly very approximative statements and limits them to all nonfinan-cial corporations taken together and a few of their major subgroups.
For all nonfinancial corporations, the importance of corporate bondsas a source of funds appears to have been much the same in the pre-depression period as it was in the postwar period. The sources under-lying Table 37 show this share to have declined from 20 per cent in
'5 Cost of Flotation of Corporate Securities, 1951—1955, SEC, Washington, 1957,p. 38.
231

Market for Corporate Bonds1901—12 and 14 per cent in 1923—29 to 10 per cent in 1945—58. Thedifference would be reduced, possibly by about 2 per cent, if allow-ance were made for term loans of more than five years by commer-cial banks.
While this similarity in the role of corporate bonds in providingfunds may hide important differences in size or other characteristicsamong industries and among corporations, this does not seem to bethe case in the only direction in which at least rough comparisonscan be made between the predepression and the postwar periods,that is, the share of corporate bonds in total sources of funds of rail-roads, electric light and power companies, and industrial and manu-facturing corporations, which together account for the bulk of cor-porate bonds issued.
Among manufacturing and mining corporations, bonds accountedfor 12 per cent of internal financing plus net sales of securities in1900—14 and 5 per cent in 1919—29 against a share of 10 per cent in1946_53.b6 The difference is even smaller for electric light and powerutilities. In this industry bonds supplied about 40 per cent of all netfunds for compared to a share of about 32 per cent in1950—55 for electric and gas corporations,18 so that there is hardly anydifference if allowance is made for bank term loans. In the case ofrailroads, on the other hand, the role of corporate bonds declinedconsiderably. Here bonds predominated among sources of funds untilWorld War I and still accounted for more than one-third in 1914—3Q,19 but their contribution to total net funds was very small in thepostwar period.
Hence, corporate bonds (including bank term loans of over fiveyears' inactivity) played about the same role, notwithstanding manychanges in detail, in total and in external financing of corporationsin the postwar period as during the generation before the Great De-pression; but great changes occurred in the distribution of corporatebonds among issuers, the share of industrials increasing at the ex-
16 Daniel Creamer, Sergei Dobrovoisky, and Israel Borenstein, Capital in Manu-facturing and Mining, Princeton for NBER, 1960, pp. 121, 331—332. Figures for long-term external financing other than bonds and for short-term financing are not givenin the source and are not easily obtainable elsewhere.
iT Melville J. Ulmer, Capital in Transportation, Communications, and Public Util-ities, Princeton for NBER, 1960, p. 151.
18 Meiselman and Shapiro, Measurement of Corporate Sources and Uses of Funds,Table 9.
19 Ulmer, Capital in Transportation, p. 150.232

Market for Corporate Bondspense of railroads; in the distribution among investor groups, finan-cial institutions, particularly insurance organizations, almost entirelysupplanting individual holders; and in market techniques, direct place-ment and competitive bidding acquiring equal importance with nego-tiated public offerings. Another important change, which has not beendocumented here, is the increasing flexibility of corporate bonds asinstruments of financing. This is evidenced in a wider range of ma-turity, security, and callability provisions and an increasing ease ofmodifying original bond indenture provisions, all contributing toadapting corporate bonds to the specific needs of individual borrowerand lender groups.
233