Embed Size (px)
Citation preview
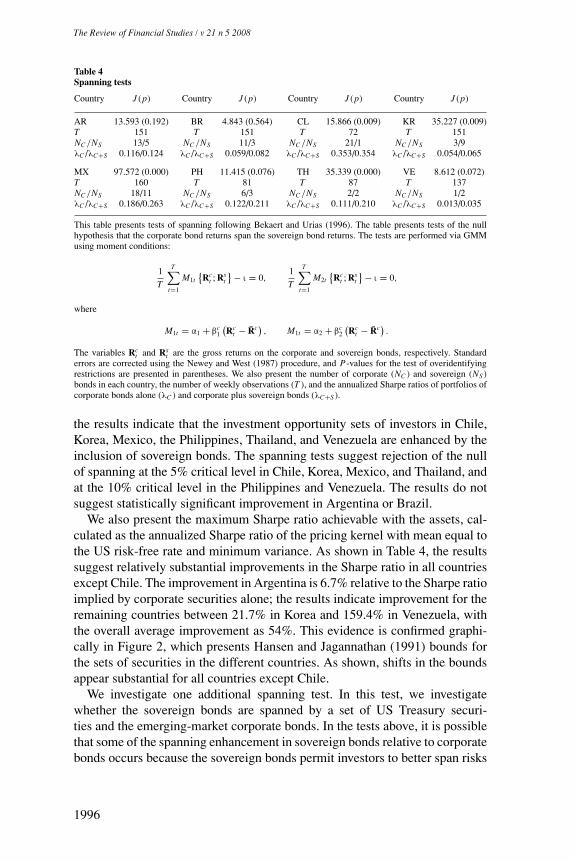
Do Sovereign Bonds Benefit Corporate Bondsin Emerging Markets?
Robert F. Dittmar and Kathy YuanStephen M. Ross School of Business, University of Michigan
We analyze the impact of emerging-market sovereign bonds on emerging-market corporatebonds by examining their spanning enhancement, price discovery, and issuance effects.We find that the effect of spanning enhancement is positive and large; over one-fifth of theinformation in corporate yield spreads is traced to innovations in sovereign bonds; and mostof these effects are due to discovery and spanning of systematic risks. Further, issuance ofsovereign bonds, controlling for endogeneity of market-timing decisions, lowers corporateyield and bid-ask spreads. Our results indicate that sovereign securities act as benchmarksand suggest they promote a vibrant corporate bond market. (JEL G10, G12, G14)
Corporations in emerging market countries, large or small, typically do notdepend on bond markets to raise capital because emerging bond markets areextremely under-developed. To increase these corporations’ access to externalcapital and to facilitate the growth of the bond market, many emerging marketgovernments believe that they first need to establish an active sovereign bondmarket. Their argument is that sovereign bonds provide benchmarks againstwhich to value corporate bonds, and hence serve as catalysts for the develop-ment of the country’s corporate bond market (Fabella and Madhur, 2003). Thisclaim is supported by the casual observation that the liquid corporate bondmarkets in developed countries are often accompanied by active governmentbond issuance and trading. Following this argument, on 20 April 1999, theChilean government issued a dollar-denominated sovereign bond, its first ineight years. The issuance, a $500 million 10-year global bond, was meant asa benchmark for Chilean corporate bonds, to facilitate the access of Chileancorporations to international capital markets.1 Similarly, several developing
We thank Drausio Giacomelli and Jesse Yan at JPMorgan-Chase, and David Li at Integrated Finance Limited, forhelp with the data, as well as the editor, Cam Harvey, two anonymous referees, Jeremy Stein, Stew Myers, SendhilMullainathan, Tyler Shumway, David Brophy, Alfonso Dufour, and the seminar participants at MassachusettsInstitute of Technology, University of Michigan, the NBER 2001 Summer Institute, the 2002 AFA annualconference, the 2002 Utah Winter Finance Conference, the 2006 MTS Conference on Financial Markets, theInternational Monetary Fund, and JP Morgan-Chase Emerging Market Bond Trading Desk for helpful discussions;and Qin Lei for research assistance. A previous version of this paper was circulated under the title “The PricingImpact of Sovereign Bonds.” The usual disclaimer applies. Address correspondence to: Kathy Yuan, Stephen M.Ross School of Business, University of Michigan, 701 Tappan Street, Ann Arbor, MI 48109; Tel: 7347636039;Fax: 7349368715; e-mail: [email protected].
1 This objective is drawn from remarks made by the Chilean Minister of Finance, Dr. Eduardo Aninat, reportedby the Financial Times on 21 April 1999. The Chilean government did not issue the bond to finance a budgetdeficit as it had a fiscal surplus of 131.2 billion pesos in 1998 and 623.2 billion pesos in 1997. Nor did it issue
C© The Author 2008. Published by Oxford University Press on behalf of The Society for Financial Studies. Allrights reserved. For Permissions, please email: [email protected]:10.1093/rfs/hhn015 Advance Access publication March 14, 2008
The Review of Financial Studies / v 21 n 5 2008
east Asian governments with minimal government budget deficits, and henceminimal financing needs, are examining the possibility of issuing governmentbonds for the development of their corporate bond markets.2
Although these governments’ claims seem plausible,3 the academic litera-ture suggests that the pricing impact of sovereign bonds is not so clear-cut.Sovereign bonds represent benchmark securities; since these bonds are claimson the government of origin, their value depends only on factors systematicto the country.4 In contrast, emerging market corporate bonds not only de-pend on these systematic factors, but also bear idiosyncratic risk specific tothe company issuing the bond. The academic literature on benchmark securi-ties suggests conflicting possibilities in terms of a sovereign bond issuance’simpact on the existing bonds in the market. One argument, consistent with theaforementioned governments’ intuition about their benefits, is that benchmarksecurities improve the market through making it more complete, reducing ad-verse selection costs, and improving liquidity by acting as hedging instruments(see Subrahmanyam, 1991; Gorton and Pennacchi, 1993; Shiller, 1993; andYuan, 2005).5 However, the introduction of benchmark securities may also in-hibit price discovery, crowding out the trading of all or a fraction of the existingsecurities (see Subrahmanyam, 1991; and Gorton and Pennacchi, 1993). This isa real possibility in emerging markets, in which the sovereign issues typicallyhave a higher credit rating than their counterparts. As a result, sovereign issuesmay be more attractive to international investors as a substitute for corporatebonds, reducing the liquidity in the corporate bond market. Further, the literature
the bond to time the market, as the risk premium for emerging market securities was quite high at the time. TheJPMorgan emerging-market bond index (EMBI) was priced at an average of 618 basis points over comparabletreasuries from 1997 to 1998, but was priced at an average of 1130 basis points for the first four months of 1999.
2 In October 2004, the Chinese government issued a $1.5 billion 10-year and $500 million 5-year global bond,denominated in euros. The 10-year bond is the largest issue and has the longest maturity of euro-denominatedbonds sold by an Asian country. The purpose, quoted by a Chinese officer in charge of foreign debt under theMinistry of Finance, “is to establish a benchmark bond with more liquidity instead of just raising money. . . and tolower the costs of bond issuances for those Chinese enterprises who plan to finance overseas” (Bloomberg.com,19 October 2004). Verifying this claim, Wang Zhao, a senior researcher at the State Council’s DevelopmentResearch Center, said that, in fact, China does not need foreign currency because it has sufficient foreignexchange reserves. He pointed out that the country’s foreign exchange reserves reached $514.5 billion by the endof September 2004, an increase of US $111.2 billion from the beginning of the year (Financial Times, 25 October2004).
3 A cursory examination of the time series relationship patterns of sovereign issuances relative to the correspondingexchange rate movements in our sample suggests that the issuing decision of sovereign bonds in emerging marketsis not solely motivated by favorable exchange rate conditions and could be motivated by financing budget deficitsor enhancing bond market liquidity.
4 By benchmark securities, we refer to securities that are influenced only by systematic factors, which may includeglobally systematic factors. We are not attempting to define the benchmark status of the bond, which is a separateissue discussed in detail, for example, in Dunne, Moore, and Portes (2003).
5 In addition to the standard market microstructure benefits of hedging adverse selection risks, sovereign bondscan allow emerging markets investors to hedge international trade risks. This benefit is a potential additionalstrength of the benchmark status of sovereign bonds. For countries in our sample, risks in international trade canbe quite large. For example, the magnitude and percentage of total trade of these countries with the United Statesis quite large. We thank an anonymous referee for making this point.
1984
Sovereign Bonds in Emerging Markets
on financial innovation suggests that introduction of securities into an incom-plete market may have negative welfare impacts (see Hart, 1975; Elul, 1994;Cass and Citanna, 1998; Dow, 1998; and Marın and Rahi, 1998).6
In this paper, we attempt to empirically distinguish whether the effect ofsovereign issuance is beneficial or harmful to emerging bond markets.7 Weexamine these issues by considering three channels in which the literature hassuggested that benchmark securities, such as sovereign bonds, may affect theprices of other securities in the market. The first channel is the completionof an incomplete market. For example, Shiller (1993) points out that macrosecurities (i.e., securities that represent systematic risk factors) help to completethe market by allowing investors to hedge against major income risks. Yuan(2005) argues that in the presence of information asymmetry, even if investorsare risk-neutral, benchmark securities help to complete the market and enhancethe investment opportunity set by allowing heterogeneously informed investorsto hedge against adverse selection. This mechanism is especially relevant foremerging financial markets, particularly those at the early stage of development,since these markets are characterized by severe incompleteness and intenseinformation asymmetry. Furthermore, the volatility of exchange rates in thesecountries also suggests the presence of substantial systematic risks and, hence,the need to hedge these risks. Our results indicate that, in the majority ofemerging markets that we analyze, sovereign bonds do indeed improve theopportunity set relative to corporate securities alone. The average annual Sharperatio improvement over all markets is 0.041 or, on an average percentage basis,approximately 54%.
The second channel by which benchmark securities may benefit existingsecurities in a market is price discovery. We examine whether the introduc-tion of benchmark securities promotes price discovery by contributing to theprice informativeness of existing securities. According to Yuan (2005), sinceinvestors are able to better hedge adverse selection costs with the addition ofbenchmark securities, these investors are encouraged to acquire more system-atic and firm-specific information. As a result, the price informativeness of allsecurities improves. The degree of this price discovery is closely related tothe number of benchmark securities in the market. However, under certain cir-cumstances, theoretical evidence also indicates that benchmark securities mayhamper the price discovery in existing securities. For example, Gorton andPennacchi (1993) argue that the introduction of a benchmark security couldcrowd out the trading of all other securities; Subrahmanyam (1991) points out
6 The recent work by Krishnamurthy and Vissing-Jorgensen (2006) shows that the size of Treasury debt in theUnited States is negatively correlated with the spread between corporate bond yields and Treasury bond yields.This result indicates Treasury securities provide a “convenience” value, which is consistent with the findings ofour paper.
7 This study investigates the spill-over effect of sovereign bonds on corporate bonds, rather than the primaryreasons why sovereign entities issue bonds. Governments issue bonds for a number of reasons. For example,they may issue bonds to finance fiscal deficits or to refinance existing debt at better terms.
1985
The Review of Financial Studies / v 21 n 5 2008
that only a fraction of the existing securities may experience increases in priceinformativeness.8
In our empirical work, we find that in most markets, innovations in yieldspreads on sovereign bonds have a large impact on the volatility of corporatebond yield spreads. For example, in Argentina, the lower bound on the portion ofthe variability in corporate yield spreads attributed to innovations in sovereignyield spreads is 28%. Put differently, information does appear to flow fromthe sovereign market to the corporate market, implying that the presence ofsovereign bonds enhances the price discovery process. Most of these gains inspanning and price discovery appear to be attributable to an improvement incapturing the effects of systematic risks.
The final mechanism by which benchmark securities may benefit a market isan increase in liquidity. That is, benchmark securities provide a liquidity servicefor existing securities. This liquidity service translates into reduced liquiditypremiums and decreased bid-ask spreads. Subrahmanyam (1991); Gorton andPennacchi (1993); and Yuan (2005) all point out that improved liquidity resultsdirectly from increased price informativeness following the introduction ofbenchmark securities.
We address this final issue by examining bid-ask and yield spreads on corpo-rate bonds in excess of comparable treasuries, net of information contained inthe default-free yield curve, the default risk, and exchange rates, controlling forthe endogeneity coming from the market timing decision of governments. Wedo so by using the country’s JPMorgan emerging-market bond index (EMBI)spread as an instrument for the government’s market timing decision. If thegovernment is timing the market when issuing bonds, the timing effect shouldbe present in the sovereign spread, as measured by the EMBI spread, as well.By stripping the EMBI spread from the corporate bond spreads, we are able tocontrol for this market timing effect. We find that the issuance of a sovereignbond lowers both the yield spreads and the bid-ask spreads of existing corpo-rate bonds. For example, the magnitude of reduction upon sovereign issuance is1.89% for corporate-stripped spreads, and 25.8% for corporate bid-ask spreadsin Argentina using a [−7-week, +7-week] event window. This 1.89% exceedsthe average bid-ask spread in the Argentinean corporate bond market, indicatingthat the reduction in spread is economically significant and exceeds transactioncosts. Thus, the evidence suggests a favorable impact of the issuance of a newsovereign bond on the price of existing corporate bonds.
These results have several implications for governments’ bond issuance pol-icy and the pricing impact of sovereign bonds. The development of a corporatebond market is, as documented in this paper, enhanced by the establishment of
8 More precisely, in Subrahmanyam (1991), the benchmark security is the basket of existing securities. He findsthat the introduction of a basket security may lower the price informativeness for securities that have lowerweights in the benchmark. Gorton and Pennacchi (1993) find that the introduction of a benchmark securityeliminates all trading in the individual securities when traders have homogeneous preferences and endowmentdistributions.
1986
Sovereign Bonds in Emerging Markets
an active sovereign bond market. In earlier stages of a market’s development,the sovereign market contributes to the corporate market by allowing investorsto hedge sovereign risks in an incomplete market. In later stages of develop-ment, the sovereign market contributes by promoting the price discovery relatedto systematic risk. This favorable impact of new sovereign issuances on yieldand bid-ask spreads of corporate bonds further establishes the liquidity serviceof these bonds in emerging markets.
The remainder of this paper is organized as follows. Section 1 discussesthe definition of a sovereign bond and a simple theoretical framework for ourempirical work. Section 2 describes the data used in our analysis. Section 3presents our empirical approaches and results for the analysis of the hypotheses.Section 4 concludes.
1. Sovereign Bonds as Benchmark Securities
1.1 Defining a sovereign bondIn this section, we briefly discuss the characteristics and definition of a sovereignbond. In referring to sovereign bonds, we mean bonds issued by governmentsor government agencies in international markets, whose payments are guar-anteed by these governments. These bonds are different than those issued bygovernments in their domestic markets. The majority of these bonds are issuedas straightforward coupon-bearing debentures; put-and-call features found inother bond markets are rare. Most sovereign bonds are denominated in foreigncurrencies; only a few countries (essentially the G-8) are able to issue bonds ininternational markets denominated in local currency. Eichenbaum, Hausmann,and Panizza (2004) note that of the $434 billion of developing country debt is-sued in international markets between 1999 and 2001, less than $12 billion wasdenominated in local currency. This decision is motivated by issues of mon-etary and fiscal policy credibility, inflation, and default risk. Over the period1980–2002, approximately 55% of sovereign debt was issued in US dollars,26% in euros or Euro-area currencies, and 14% in Japanese yen (Chamon,et al., 2004). The most liquid issues are denominated in US dollars; JP Morganconstructs its EMBI index from dollar-denominated sovereign bonds becausethese issues have historically been the most liquid.
A distinguishing feature of a sovereign bond is that it bears only macroeco-nomic risks for a given country rather than macroeconomic and firm-specificrisks in the sense discussed in Shiller (1993). That is, the set of factors thatimpact other bonds, specifically corporate bonds, in the country of interestare common to both the sovereign bonds and the corporate bonds, but addi-tional risks exist that impact the prices of corporate bonds. As an example,US Treasury bonds are affected only by macroeconomic risk, whereas US cor-porate bonds are also affected by firm-specific default risk. Emerging-marketsovereign bonds are affected by these same macroeconomic risks, with the ad-dition of country-specific macroeconomic (default risk). These country-specific
1987
The Review of Financial Studies / v 21 n 5 2008
risks affect the corporate bonds in the market as well. Consequently, emergingmarket sovereigns may serve as benchmarks for these emerging-market corpo-rate bonds, as they embody the same macroeconomic risks. Indeed, the mostcommon benchmark for emerging market bonds is the EMBI indices composedby JPMorgan-Chase, which, as discussed above, are constructed only from USdollar-denominated sovereign bonds.
Although, as we note above, sovereign bonds may serve as benchmark secu-rities, our focus in this paper is not on defining benchmark status. Rather, wesimply wish to analyze the impact of bonds that may serve as benchmarks dueto the fact that their payoffs are subject only to common systematic risks in acountry’s bond markets, following the theoretical work in Yuan (2005). Defin-ing benchmark status is an interesting issue in and of itself, and is extensivelyexplored in Dunne, Moore, and Portes (2003). Our concern instead is on theimpact of the introduction of a “macro” security in the sense of Shiller (1993)on the pricing of other bonds in the economy.
1.2 Theoretical backgroundGiven the definition of the characteristics of a sovereign bond, we summarizea simple theoretical framework to motivate our empirical investigation of theimpact of sovereign bonds on a country’s bond market. We assume a standardfactor structure for (log) bond prices, as is common in the fixed-income litera-ture. More specifically, assume that corporate bond prices can be expressed asan exponential affine function,
ln Pct = �c0 + �′c Xt + vt , (1)
where Xt is a vector of common state variables and vt is a bond-specific risk.A continuous time version of this specification is expressed in the context ofsovereign bonds in Duffie, Pedersen, and Singleton (2003). We assume that theprice of a sovereign instrument is affected only by the common state variablespresent in the pricing of all bonds in a country,
ln Pst = �s0 + �′s Xt . (2)
We further assume that the state variables, Xt , evolve according to a vectorautoregression (VAR),
�(L)Xt = µ + εt , (3)
where �(L) denotes a polynomial in the lag operator.In the absence of asymmetric information, sovereign securities play a role
in potentially enhancing spanning in the domestic bond market, as discussedin Shiller (1993). We express the bond pricing equations in return form as
� ln Pct = αc + β′c�Xt + ξct . (4)
� ln Pst = αs + β′s�Xt . (5)
1988
Sovereign Bonds in Emerging Markets
Standard arbitrage arguments suggest that with a sufficient number of corporatesecurities with linearly independent factor loadings, we can form portfolios ofthe corporate bonds that mimic the factors, thereby spanning systematic risk.In this case, the introduction of a sovereign security, which is subject onlyto common factor risk, would not produce a spanning enhancement since itspayoff could be replicated by the corporate securities. If, however, mimickingportfolios cannot be formed with the corporate bonds, the sovereign securitiesrepresent assets free of unsystematic risk, and their inclusion in the marketgenerates a spanning enhancement. Whether the sovereign bonds enhance thespanning ability of the corporate bonds alone is an empirical question that weaddress later in the paper.9
The presence of asymmetric information offers alternative channels by whichsovereign securities may be beneficial to a market. Yuan (2005) presents sucha model, in which agents can choose to become informed about the asset-specific innovations in asset payoffs, vct in our notation above, or innovationsto the systematic factors, εt . A market maker sets prices to clear the marketin a standard Kyle (1985) framework, with losses to informed traders offsetby gains from liquidity traders. The author shows that prices become moreinformative in this setting if benchmark securities are present. Further, liquidityimproves in the market as well. Intuitively, the presence of benchmark securitiesallows investors to more precisely infer factor risk, which leads to greaterfactor information acquisition. In turn, investors informed in asset-specificrisk can now more easily separate factor and systematic risks, enabling themto gather more asset-specific information. We address this issue empiricallybelow by examining the effect of sovereign securities on bid-ask spreads andprice discovery in emerging markets.
2. Emerging Market Bond Data
The initial sample period considered is 3 January 1996 through 20 November2000. The primary data source is JPMorgan-Chase, a major market maker foremerging market bonds. We focus on fixed-income securities with a specifiedmaturity, face value, and coupon.10 We limit our study to bonds issued by emerg-ing market borrowers placed on international markets. As discussed above, thevast majority of sovereign bonds are denominated in US dollar terms, and thesebonds are the most liquid. Our raw sample includes only dollar-denominatedbonds.
9 We note that a special feature of sovereign bonds is that they are subject to sovereign default risk. This risk isgenerally political rather than economic in nature. If the payoffs on the corporate assets are independent of thispolitical risk, it will be impossible for corporate bonds to span sovereign bonds. However, sovereign defaults dogenerally impact the prices of corporate bonds in the country, as observed in the Russian default in 1998. Thus,the corporate bonds’ payoff is most likely not independent of this political risk factor.
10 We exclude convertible and floating rates bond issues on the grounds that the risks and relationships to funda-mentals are different and warrant a separate analysis.
1989
The Review of Financial Studies / v 21 n 5 2008
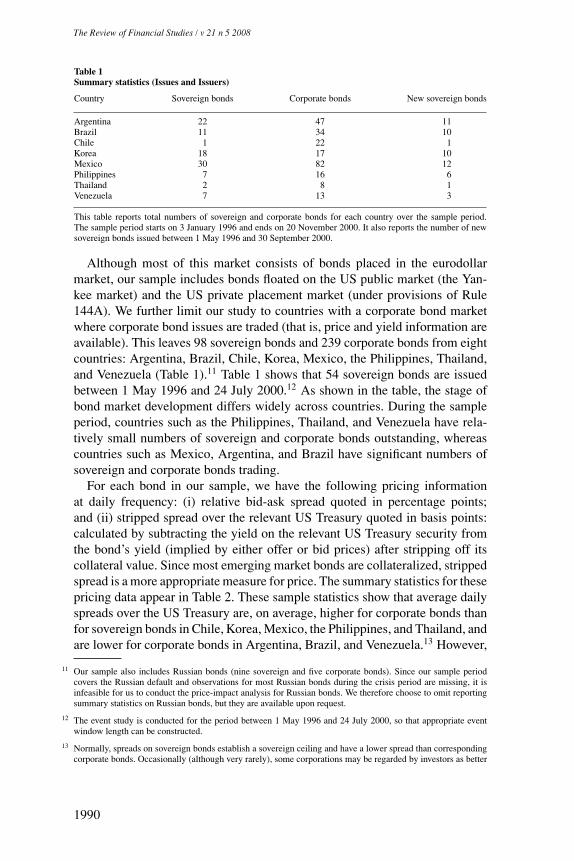
Table 1Summary statistics (Issues and Issuers)
Country Sovereign bonds Corporate bonds New sovereign bonds
Argentina 22 47 11Brazil 11 34 10Chile 1 22 1Korea 18 17 10Mexico 30 82 12Philippines 7 16 6Thailand 2 8 1Venezuela 7 13 3
This table reports total numbers of sovereign and corporate bonds for each country over the sample period.The sample period starts on 3 January 1996 and ends on 20 November 2000. It also reports the number of newsovereign bonds issued between 1 May 1996 and 30 September 2000.
Although most of this market consists of bonds placed in the eurodollarmarket, our sample includes bonds floated on the US public market (the Yan-kee market) and the US private placement market (under provisions of Rule144A). We further limit our study to countries with a corporate bond marketwhere corporate bond issues are traded (that is, price and yield information areavailable). This leaves 98 sovereign bonds and 239 corporate bonds from eightcountries: Argentina, Brazil, Chile, Korea, Mexico, the Philippines, Thailand,and Venezuela (Table 1).11 Table 1 shows that 54 sovereign bonds are issuedbetween 1 May 1996 and 24 July 2000.12 As shown in the table, the stage ofbond market development differs widely across countries. During the sampleperiod, countries such as the Philippines, Thailand, and Venezuela have rela-tively small numbers of sovereign and corporate bonds outstanding, whereascountries such as Mexico, Argentina, and Brazil have significant numbers ofsovereign and corporate bonds trading.
For each bond in our sample, we have the following pricing informationat daily frequency: (i) relative bid-ask spread quoted in percentage points;and (ii) stripped spread over the relevant US Treasury quoted in basis points:calculated by subtracting the yield on the relevant US Treasury security fromthe bond’s yield (implied by either offer or bid prices) after stripping off itscollateral value. Since most emerging market bonds are collateralized, strippedspread is a more appropriate measure for price. The summary statistics for thesepricing data appear in Table 2. These sample statistics show that average dailyspreads over the US Treasury are, on average, higher for corporate bonds thanfor sovereign bonds in Chile, Korea, Mexico, the Philippines, and Thailand, andare lower for corporate bonds in Argentina, Brazil, and Venezuela.13 However,
11 Our sample also includes Russian bonds (nine sovereign and five corporate bonds). Since our sample periodcovers the Russian default and observations for most Russian bonds during the crisis period are missing, it isinfeasible for us to conduct the price-impact analysis for Russian bonds. We therefore choose to omit reportingsummary statistics on Russian bonds, but they are available upon request.
12 The event study is conducted for the period between 1 May 1996 and 24 July 2000, so that appropriate eventwindow length can be constructed.
13 Normally, spreads on sovereign bonds establish a sovereign ceiling and have a lower spread than correspondingcorporate bonds. Occasionally (although very rarely), some corporations may be regarded by investors as better
1990
Sovereign Bonds in Emerging Markets
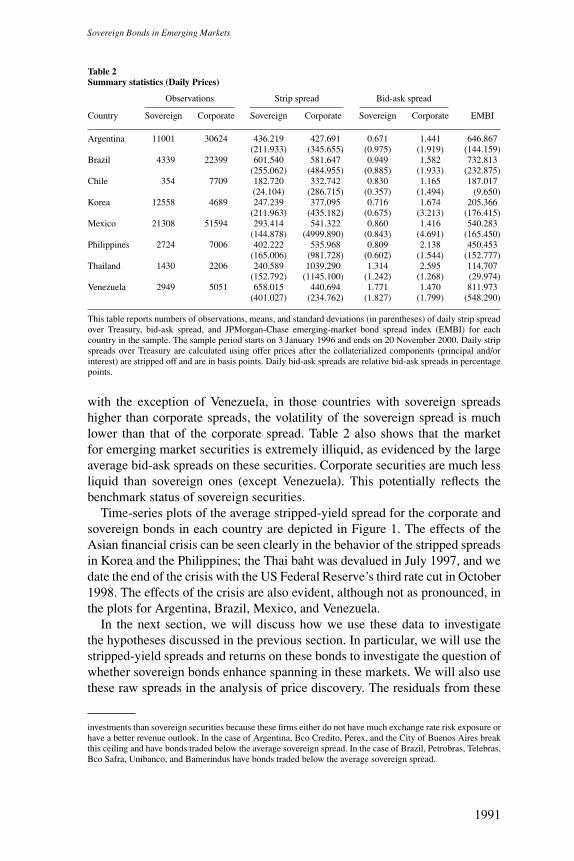
Table 2Summary statistics (Daily Prices)
Observations Strip spread Bid-ask spread
Country Sovereign Corporate Sovereign Corporate Sovereign Corporate EMBI
Argentina 11001 30624 436.219 427.691 0.671 1.441 646.867(211.933) (345.655) (0.975) (1.919) (144.159)
Brazil 4339 22399 601.540 581.647 0.949 1.582 732.813(255.062) (484.955) (0.885) (1.933) (232.875)
Chile 354 7709 182.720 332.742 0.830 1.165 187.017(24.104) (286.715) (0.357) (1.494) (9.650)
Korea 12558 4689 247.239 377.095 0.716 1.674 205.366(211.963) (435.182) (0.675) (3.213) (176.415)
Mexico 21308 51594 293.414 541.322 0.860 1.416 540.283(144.878) (4999.890) (0.843) (4.691) (165.450)
Philippines 2724 7006 402.222 535.968 0.809 2.138 450.453(165.006) (981.728) (0.602) (1.544) (152.777)
Thailand 1430 2206 240.589 1039.290 1.314 2.595 114.707(152.792) (1145.100) (1.242) (1.268) (29.974)
Venezuela 2949 5051 658.015 440.694 1.771 1.470 811.973(401.027) (234.762) (1.827) (1.799) (548.290)
This table reports numbers of observations, means, and standard deviations (in parentheses) of daily strip spreadover Treasury, bid-ask spread, and JPMorgan-Chase emerging-market bond spread index (EMBI) for eachcountry in the sample. The sample period starts on 3 January 1996 and ends on 20 November 2000. Daily stripspreads over Treasury are calculated using offer prices after the collaterialized components (principal and/orinterest) are stripped off and are in basis points. Daily bid-ask spreads are relative bid-ask spreads in percentagepoints.
with the exception of Venezuela, in those countries with sovereign spreadshigher than corporate spreads, the volatility of the sovereign spread is muchlower than that of the corporate spread. Table 2 also shows that the marketfor emerging market securities is extremely illiquid, as evidenced by the largeaverage bid-ask spreads on these securities. Corporate securities are much lessliquid than sovereign ones (except Venezuela). This potentially reflects thebenchmark status of sovereign securities.
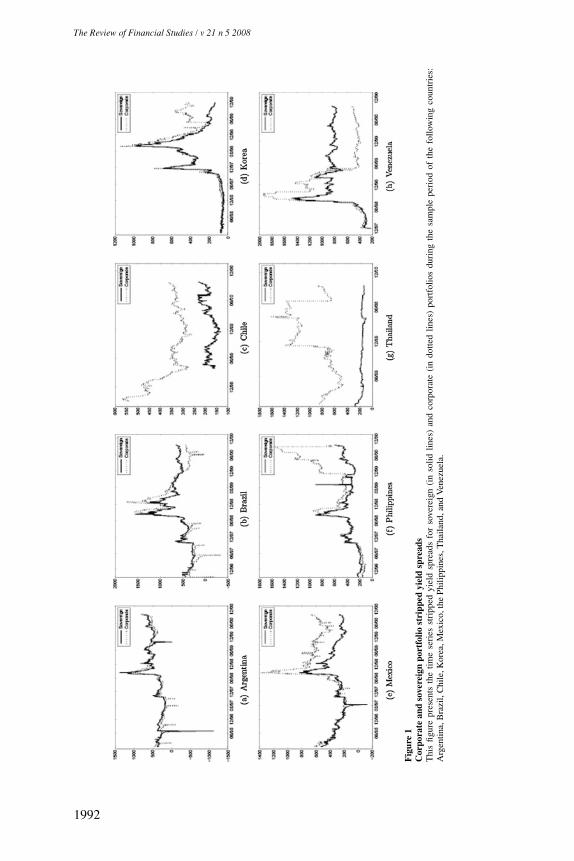
Time-series plots of the average stripped-yield spread for the corporate andsovereign bonds in each country are depicted in Figure 1. The effects of theAsian financial crisis can be seen clearly in the behavior of the stripped spreadsin Korea and the Philippines; the Thai baht was devalued in July 1997, and wedate the end of the crisis with the US Federal Reserve’s third rate cut in October1998. The effects of the crisis are also evident, although not as pronounced, inthe plots for Argentina, Brazil, Mexico, and Venezuela.
In the next section, we will discuss how we use these data to investigatethe hypotheses discussed in the previous section. In particular, we will use thestripped-yield spreads and returns on these bonds to investigate the question ofwhether sovereign bonds enhance spanning in these markets. We will also usethese raw spreads in the analysis of price discovery. The residuals from these
investments than sovereign securities because these firms either do not have much exchange rate risk exposure orhave a better revenue outlook. In the case of Argentina, Bco Credito, Perex, and the City of Buenos Aires breakthis ceiling and have bonds traded below the average sovereign spread. In the case of Brazil, Petrobras, Telebras,Bco Safra, Unibanco, and Bamerindus have bonds traded below the average sovereign spread.
1991
The Review of Financial Studies / v 21 n 5 2008
Fig
ure
1C
orpo
rate
and
sove
reig
npo
rtfo
liost
ripp
edyi
eld
spre
ads
Thi
sfig
ure
pres
ents
the
time
seri
esst
ripp
edyi
eld
spre
ads
for
sove
reig
n(i
nso
lidlin
es)
and
corp
orat
e(i
ndo
tted
lines
)po
rtfo
lios
duri
ngth
esa
mpl
epe
riod
ofth
efo
llow
ing
coun
trie
s:A
rgen
tina,
Bra
zil,
Chi
le,K
orea
,Mex
ico,
the
Phili
ppin
es,T
haila
nd,a
ndV
enez
uela
.
1992
Sovereign Bonds in Emerging Markets
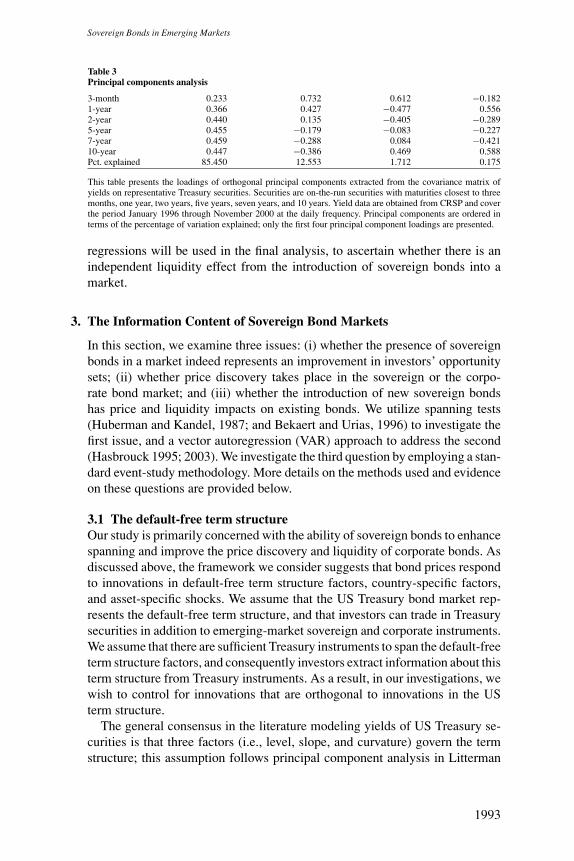
Table 3Principal components analysis
3-month 0.233 0.732 0.612 −0.1821-year 0.366 0.427 −0.477 0.5562-year 0.440 0.135 −0.405 −0.2895-year 0.455 −0.179 −0.083 −0.2277-year 0.459 −0.288 0.084 −0.42110-year 0.447 −0.386 0.469 0.588Pct. explained 85.450 12.553 1.712 0.175
This table presents the loadings of orthogonal principal components extracted from the covariance matrix ofyields on representative Treasury securities. Securities are on-the-run securities with maturities closest to threemonths, one year, two years, five years, seven years, and 10 years. Yield data are obtained from CRSP and coverthe period January 1996 through November 2000 at the daily frequency. Principal components are ordered interms of the percentage of variation explained; only the first four principal component loadings are presented.
regressions will be used in the final analysis, to ascertain whether there is anindependent liquidity effect from the introduction of sovereign bonds into amarket.
3. The Information Content of Sovereign Bond Markets
In this section, we examine three issues: (i) whether the presence of sovereignbonds in a market indeed represents an improvement in investors’ opportunitysets; (ii) whether price discovery takes place in the sovereign or the corpo-rate bond market; and (iii) whether the introduction of new sovereign bondshas price and liquidity impacts on existing bonds. We utilize spanning tests(Huberman and Kandel, 1987; and Bekaert and Urias, 1996) to investigate thefirst issue, and a vector autoregression (VAR) approach to address the second(Hasbrouck 1995; 2003). We investigate the third question by employing a stan-dard event-study methodology. More details on the methods used and evidenceon these questions are provided below.
3.1 The default-free term structureOur study is primarily concerned with the ability of sovereign bonds to enhancespanning and improve the price discovery and liquidity of corporate bonds. Asdiscussed above, the framework we consider suggests that bond prices respondto innovations in default-free term structure factors, country-specific factors,and asset-specific shocks. We assume that the US Treasury bond market rep-resents the default-free term structure, and that investors can trade in Treasurysecurities in addition to emerging-market sovereign and corporate instruments.We assume that there are sufficient Treasury instruments to span the default-freeterm structure factors, and consequently investors extract information about thisterm structure from Treasury instruments. As a result, in our investigations, wewish to control for innovations that are orthogonal to innovations in the USterm structure.
The general consensus in the literature modeling yields of US Treasury se-curities is that three factors (i.e., level, slope, and curvature) govern the termstructure; this assumption follows principal component analysis in Litterman
1993
The Review of Financial Studies / v 21 n 5 2008
and Scheinkman (1991). We follow Brandt and Kavajecz (2004), among oth-ers, and extract the first three orthogonal principal components from a set ofTreasury securities, performed on the covariance matrix of the yields. Thesecomponents are ordered by the percentage of variation explained. We use thebid yields on the on-the-run Treasury securities closest to 90 days, one year,two years, five years, seven years, and ten years. The data are obtained fromCRSP. In Table 3, we present the percentage of variation explained by eachprincipal component, and the slope of the regression of bond yields on thecomponents. As discussed, three principal components appear to be relatedto the term structure of yields. Further, these components are consistent withearlier interpretations; the first component has a positive loading for the yield,increasing in maturity, suggesting that it represents a “level” factor in the termstructure. The second component affects short-term yields positively and long-term yields negatively, consistent with the interpretation of a “slope” factor.Finally, the third component affects short-term and long-term yields positively,while affecting medium-term yields negatively, consistent with the interpreta-tion of a “curvature” factor.
3.2 Spanning enhancementIn order to examine whether the presence of sovereign bonds in a market servesto help complete the market, we examine tests of spanning from de Santis(1993); and Bekaert and Urias (1996). Denote the gross returns on the set ofcorporate bonds at time t as Rc
t and the gross returns on the set of sovereignbonds as Rs
t . We estimate the parameters {βc1, β
s1, β
c2, β
s2} of two pricing kernels,
M1t = α1 + βc1
(Rc
t − E[Rc
t
]) + βs1
(Rs
t − E[Rs
t
]), (6)
M2t = α2 + βc2
(Rc
t − E[Rc
t
]) + βs2
(Rs
t − E[Rs
t
]). (7)
At first glance, the two pricing kernels appear nearly identical, as they are bothlinear functions of the demeaned returns on the corporate and sovereign bonds.However, the means of the pricing kernels, α1 and α2, are constrained to differ,which affects the parameter estimates. We discuss this issue in more detailbelow. The parameters of the pricing kernel are estimated via GMM using themoment restrictions,
1
T
T∑
t=1
M1t {Rct ; Rs
t } − ι = 0 (8)
1
T
T∑
t=1
M2t {Rct ; Rs
t } − ι = 0, (9)
where ι represents a conforming vector of ones. That is, the parameters areestimated so that the pricing kernels M1t and M2t satisfy the sample analogueof the standard Euler equation.
1994
Sovereign Bonds in Emerging Markets
As discussed in Bekaert and Urias (1996), under the null hypothesis thatthe corporate bonds span the sovereign bonds, the information in the sovereignbonds will not be important for pricing the corporate bonds. That is, followingHansen and Jagannathan (1991), given the mean of the pricing kernel, α, we canconstruct a minimum variance pricing kernel that is in the linear span of the assetpayoffs. If this pricing kernel prices both the corporate and sovereign bonds,but depends only on the payoffs of the corporate bonds, the bounds intersect. Ifthis result holds for pricing kernels with different means, the corporate bondsspan the sovereign bonds. That is, since any minimum variance pricing kernelis a linear combination of two other minimum variance pricing kernels, in ananalogue to the mean-variance frontier, any two minimum variance pricingkernels with arbitrary (and different) means and different variances describethe frontier. We set these means to α1 = 0.99 and α2 = 1.01; results are notsensitive to alternate specifications of these means. We test the null hypothesis,
H0 : βs1 = βs
2 = 0, (10)
by imposing the null hypothesis as a restriction on the pricing kernels. Asdiscussed in Bekaert and Urias, the test of GMM overidentifying restrictions isa likelihood ratio test of the null hypothesis of spanning.
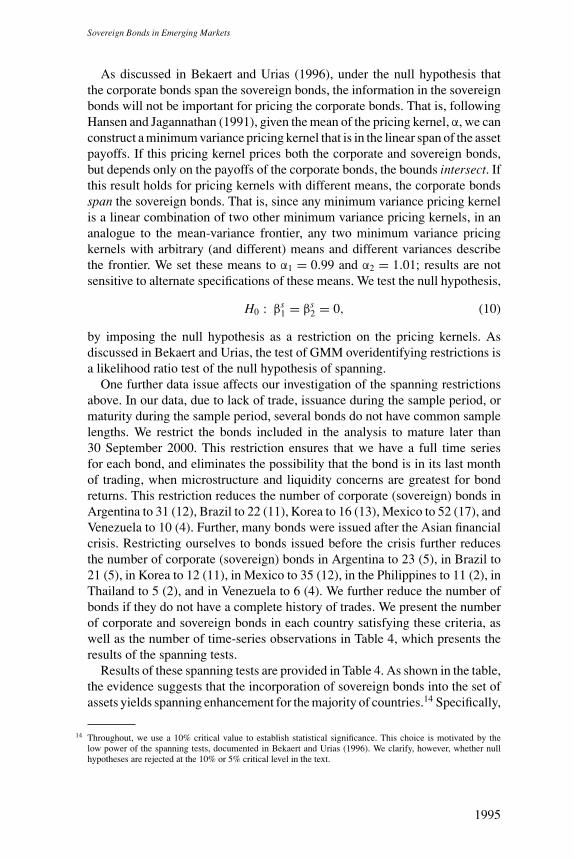
One further data issue affects our investigation of the spanning restrictionsabove. In our data, due to lack of trade, issuance during the sample period, ormaturity during the sample period, several bonds do not have common samplelengths. We restrict the bonds included in the analysis to mature later than30 September 2000. This restriction ensures that we have a full time seriesfor each bond, and eliminates the possibility that the bond is in its last monthof trading, when microstructure and liquidity concerns are greatest for bondreturns. This restriction reduces the number of corporate (sovereign) bonds inArgentina to 31 (12), Brazil to 22 (11), Korea to 16 (13), Mexico to 52 (17), andVenezuela to 10 (4). Further, many bonds were issued after the Asian financialcrisis. Restricting ourselves to bonds issued before the crisis further reducesthe number of corporate (sovereign) bonds in Argentina to 23 (5), in Brazil to21 (5), in Korea to 12 (11), in Mexico to 35 (12), in the Philippines to 11 (2), inThailand to 5 (2), and in Venezuela to 6 (4). We further reduce the number ofbonds if they do not have a complete history of trades. We present the numberof corporate and sovereign bonds in each country satisfying these criteria, aswell as the number of time-series observations in Table 4, which presents theresults of the spanning tests.
Results of these spanning tests are provided in Table 4. As shown in the table,the evidence suggests that the incorporation of sovereign bonds into the set ofassets yields spanning enhancement for the majority of countries.14 Specifically,
14 Throughout, we use a 10% critical value to establish statistical significance. This choice is motivated by thelow power of the spanning tests, documented in Bekaert and Urias (1996). We clarify, however, whether nullhypotheses are rejected at the 10% or 5% critical level in the text.
1995
The Review of Financial Studies / v 21 n 5 2008
Table 4Spanning tests
Country J (p) Country J (p) Country J (p) Country J (p)
AR 13.593 (0.192) BR 4.843 (0.564) CL 15.866 (0.009) KR 35.227 (0.009)T 151 T 151 T 72 T 151NC /NS 13/5 NC /NS 11/3 NC /NS 21/1 NC /NS 3/9λC /λC+S 0.116/0.124 λC /λC+S 0.059/0.082 λC /λC+S 0.353/0.354 λC /λC+S 0.054/0.065
MX 97.572 (0.000) PH 11.415 (0.076) TH 35.339 (0.000) VE 8.612 (0.072)T 160 T 81 T 87 T 137NC /NS 18/11 NC /NS 6/3 NC /NS 2/2 NC /NS 1/2λC /λC+S 0.186/0.263 λC /λC+S 0.122/0.211 λC /λC+S 0.111/0.210 λC /λC+S 0.013/0.035
This table presents tests of spanning following Bekaert and Urias (1996). The table presents tests of the nullhypothesis that the corporate bond returns span the sovereign bond returns. The tests are performed via GMMusing moment conditions:
1
T
T∑
t=1
M1t{Rc
t ; Rst
} − ι = 0,1
T
T∑
t=1
M2t{Rc
t ; Rst
} − ι = 0,
where
M1t = α1 + βc1
(Rc
t − Rc) , M1t = α2 + βc2
(Rc
t − Rc) .
The variables Rct and Rs
t are the gross returns on the corporate and sovereign bonds, respectively. Standarderrors are corrected using the Newey and West (1987) procedure, and P-values for the test of overidentifyingrestrictions are presented in parentheses. We also present the number of corporate (NC ) and sovereign (NS )bonds in each country, the number of weekly observations (T ), and the annualized Sharpe ratios of portfolios ofcorporate bonds alone (λC ) and corporate plus sovereign bonds (λC+S ).
the results indicate that the investment opportunity sets of investors in Chile,Korea, Mexico, the Philippines, Thailand, and Venezuela are enhanced by theinclusion of sovereign bonds. The spanning tests suggest rejection of the nullof spanning at the 5% critical level in Chile, Korea, Mexico, and Thailand, andat the 10% critical level in the Philippines and Venezuela. The results do notsuggest statistically significant improvement in Argentina or Brazil.
We also present the maximum Sharpe ratio achievable with the assets, cal-culated as the annualized Sharpe ratio of the pricing kernel with mean equal tothe US risk-free rate and minimum variance. As shown in Table 4, the resultssuggest relatively substantial improvements in the Sharpe ratio in all countriesexcept Chile. The improvement in Argentina is 6.7% relative to the Sharpe ratioimplied by corporate securities alone; the results indicate improvement for theremaining countries between 21.7% in Korea and 159.4% in Venezuela, withthe overall average improvement as 54%. This evidence is confirmed graphi-cally in Figure 2, which presents Hansen and Jagannathan (1991) bounds forthe sets of securities in the different countries. As shown, shifts in the boundsappear substantial for all countries except Chile.
We investigate one additional spanning test. In this test, we investigatewhether the sovereign bonds are spanned by a set of US Treasury securi-ties and the emerging-market corporate bonds. In the tests above, it is possiblethat some of the spanning enhancement in sovereign bonds relative to corporatebonds occurs because the sovereign bonds permit investors to better span risks
1996
Sovereign Bonds in Emerging Markets
Fig
ure
2H
anse
n-Ja
gann
atha
nbo
unds
Thi
sfig
ure
pres
ents
Han
sen-
Jaga
nnat
han
(199
1)bo
unds
onad
mis
sibl
epr
icin
gke
rnel
sfo
rtw
oas
sets
ets;
corp
orat
ebo
nds
alon
ein
solid
lines
and
corp
orat
ebo
nds
plus
sove
reig
nbo
nds
indo
tted
lines
.The
boun
dsar
eco
nstr
ucte
dus
ing
wee
kly
retu
rns
onva
lue-
wei
ghte
dpo
rtfo
lios
ofso
vere
ign
and
corp
orat
ebo
nds.
All
plot
sar
ebo
unde
dby
[0.9
7,1.
01]
inth
ex-
axis
.
1997
The Review of Financial Studies / v 21 n 5 2008
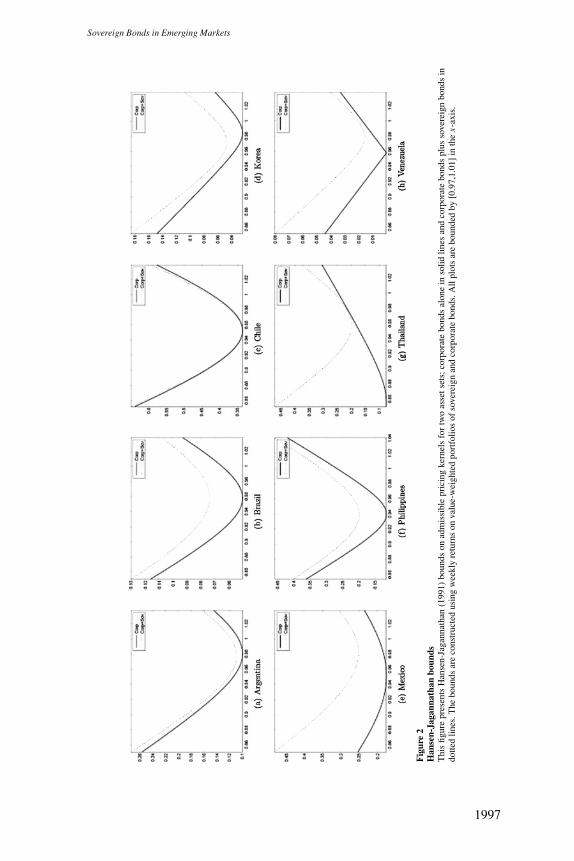
Table 5Spanning tests: US and corporate vs. sovereign
Country J (p) Country J (p) Country J (p) Country J (p)
AR 21.384 (0.019) BR 2.187 (0.902) CL 9.467 (0.009) KR 39.862 (0.002)λU+C 0.355 λU+C 0.336 λU+C 0.793 λU+C 0.295λU+C+S 0.361 λU+C+S 0.339 λU+C+S 0.812 λU+C+S 0.304
MX 99.337 (0.000) PH 8.956 (0.176) TH 9.227 (0.056) VE 4.540 (0.338)λU+C 0.402 λU+C 0.405 λU+C 0.677 λU+C 0.297λU+C+S 0.494 λU+C+S 0.429 λU+C+S 0.699 λU+C+S 0.300
This table presents tests of spanning following Bekaert and Urias (1996). The table presents tests of the nullhypothesis that the US Treasury and corporate bond returns span the sovereign bond returns. The tests areperformed via GMM using moment conditions:
1
T
T∑
t=1
M1t{Rc
t ; Rut ; Rs
t
} − ι = 0,1
T
T∑
t=1
M2t{Rc
t ; Rut ; Rs
t
} − ι = 0,
where
M1t = α1 + βc1
(Rc
t − Rc) + βu1
(Ru
t − Ru), M1t = α2 + βc
2(Rct − Rc) + βu
2
(Ru
t − Ru).
The variables Rct , Ru
t , and Rst are the gross returns on the corporate, US Treasury, and sovereign bonds,
respectively. The means of the pricing kernels are set to α1 = 0.99 and α2 = 1.01. Standard errors are correctedusing the Newey and West (1987) procedure, and P-values for the test of overidentifying restrictions are presentedin parentheses. We also present the annualized Sharpe ratios of portfolios of corporate and US Treasury bonds(λU+C ) and corporate and US Treasury plus sovereign bonds (λU+C+S ).
in the default-free term structure. If investors are able to invest in US Treasurysecurities, these securities provide a natural way of extracting these risks ratherthan sovereign securities.15
Results of these tests are presented in Table 5. We utilize the six US Treasurysecurity returns discussed in the previous section to represent the set of default-free assets available to investors. As shown in the table, the inclusion of theTreasury securities suggests that the corporate and Treasury securities span thesovereign securities in the Philippines and Venezuela, in addition to Brazil, asdiscussed above. The null hypothesis of spanning is rejected at the 5% levelin Chile, Korea, and Mexico, and at the 10% level in Thailand. Curiously, thespanning tests suggest that the set of corporate plus Treasury securities do notspan the sovereign bonds in Argentina, rejecting the null at the 5% level, whilethe earlier evidence suggests that corporate bonds alone span the sovereignsecurities. We conjecture that these results are due to the statistical propertiesof the test; in particular, Bekaert and Urias (1996) show that increasing thenumber of securities in the spanning test can affect the size and power of thetest. The increase in Sharpe ratio in Argentina is only 1.5%; indeed, the averageincrease in Sharpe ratio is considerably smaller than the previous case, at 5.1%.Nonetheless, the results suggest that for half of the countries, the inclusionof sovereign bonds in addition to corporate and US Treasury bonds enhancesinvestors’ opportunity set. In these four countries, Chile, Korea, Mexico, and
15 We thank a referee for suggesting that we investigate this issue.
1998
Sovereign Bonds in Emerging Markets
Thailand, the average Sharpe ratio improvement from the inclusion of sovereignsecurities is 7.9%.
In summary, the evidence presented in this section suggests that the presenceof sovereign bonds in a market contributes to an improvement in investors’opportunity sets. The evidence points to a statistically significant shift in theopportunity set in six of the eight countries, and an economically significantshift in seven of the eight countries. These results suggest that sovereign bondssystematically improve investors’ opportunities and information sets in emerg-ing markets. In the next section, we more formally consider the informationcontent of these bonds, and examine whether pricing information is conveyedthrough the sovereign or the corporate bond channel.
3.3 Price discoveryThe second impact that sovereign securities may have on a market is pricediscovery. As discussed above, and detailed in Yuan (2005), the presence of abenchmark security can enhance price discovery, since agents are better ableto gather information about systematic factors. This improvement allows moreagents to gather information on firm-specific innovations, improving pricediscovery in these securities as well. In this section, we address the questionof where price discovery occurs in emerging bond markets—in the sovereignor the corporate issues. The information transmission story suggested in Yuan(2005) suggests that common information is discovered in the sovereign market,leading to a transmission of information from the sovereign instruments to thecorporate instruments.
3.3.1 Empirical methodology. As in Hasbrouck (1995, 2003), we utilizevariance decompositions from a vector autoregression representation of theyield spreads on corporate and sovereign securities to assess the contribution ofeach asset to price discovery. In contrast to the spanning tests above, we utilizedaily data on the stripped-yield spread over treasuries. Further, since we areinterested in analyzing an average impact on price informativeness in a market,we simply create equal-weighted portfolios of the corporate and the sovereigninstruments in the market. We confine our attention to the set of instruments andtime frame represented by the time-homogeneous set of securities consideredin the analysis on spanning.
One issue that is apparent in the series is the effect of the Russian defaultand Asian financial crisis. The data for Argentina, Brazil, Mexico, Korea, andVenezuela span the currency crisis, which we define as beginning 2 July 1997with the devaluation of the Thai baht, and ending 17 October 1998 with the USFederal Reserve’s third interest rate cut. The crisis appears to generate threedistinct periods in the series: the precrisis period, with relatively low yieldspreads; the crisis period, with quite high spreads; and a postcrisis period, inwhich spreads are higher than precrisis, but lower than during the crisis period.
1999
The Review of Financial Studies / v 21 n 5 2008
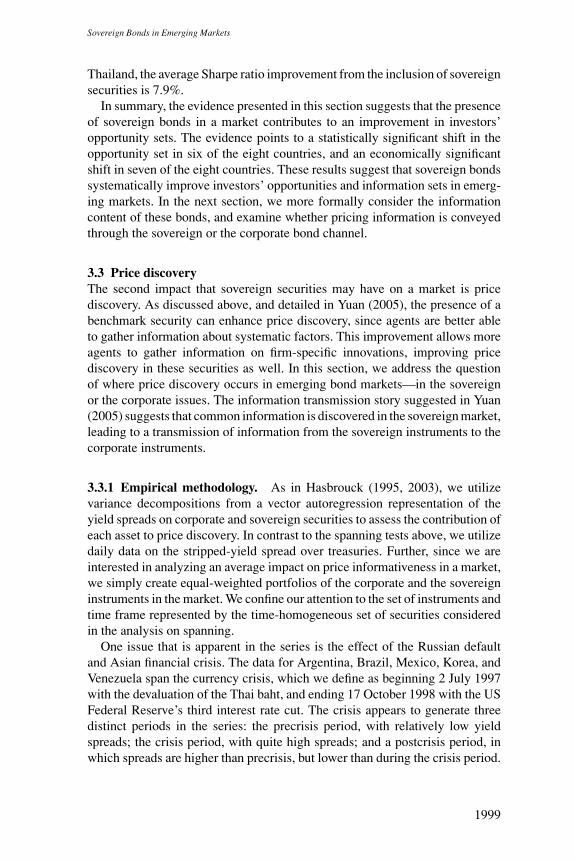
Table 6ADF tests: Corporate and sovereign portfolio spreads
Corporate Sovereign
ADF Crit. ADF Crit.
Argentina −2.787 −1.957 −2.932 −1.957Brazil −3.339 −1.957 −3.468 −1.957Chile −3.662 −1.964 −4.227 −1.964Korea −4.046 −1.957 −3.096 −1.957Mexico −3.943 −1.957 −7.841 −1.957Philippines −2.598 −1.939 −2.610 −1.939Thailand −3.158 −1.968 −3.689 −1.991Venezuela −3.795 −1.957 −2.231 −1.957
This table presents augmented Dickey-Fuller (ADF) tests for the stationarity of the orthogonalized spreads oncorporate and sovereign portfolios. Spreads are orthogonalized using the regression
ys⊥{c,s},t = ys{c,s},t − (δ0 + δ1 Icrisis,t + δ2 Ipostcrisis,t + β′ Xt ),
where Icrisis,t is an indicator variable that takes on value 1 during the Asian currency crisis period and zerootherwise; Ipostcrisis,t takes on a value 1 after the crisis, and zero otherwise; and Xt represents the vector of threeprincipal components retrieved from the US term structure. The ADF lags are determined using the recursiveprocedure suggested in Campbell and Perron (1991). We present the ADF test statistic and the 5% critical valuefor the null hypothesis of a unit root.
We elect to deal with the crisis in a straightforward manner; as discussedabove, we wish to explore the impact on price discovery beyond the impact ofthe US Treasury market. Therefore, we examine orthogonalized yield spreadsas the residual in a regression,
ys{c,s},t = δ0 + δ1 Icrisis,t + δ2 Ipostcrisis,t + β′ Xt + ys⊥{c,s},t , (11)
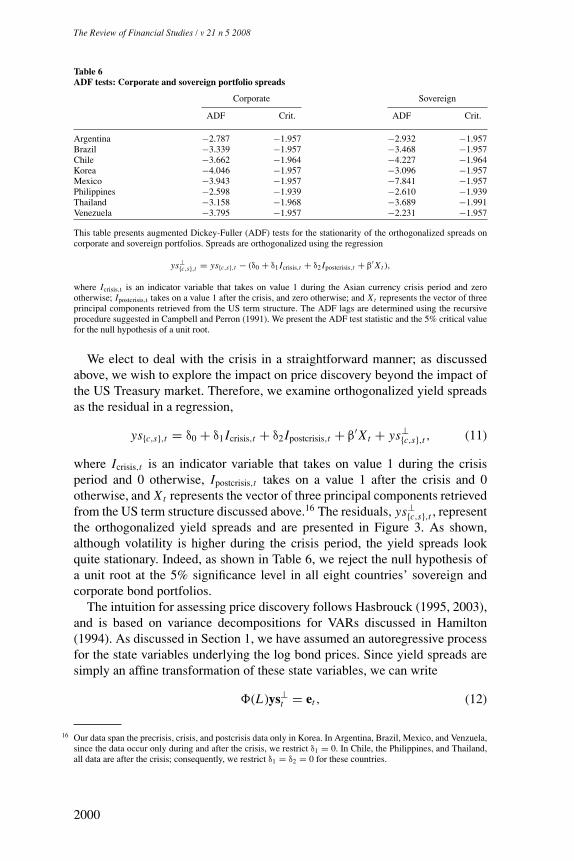
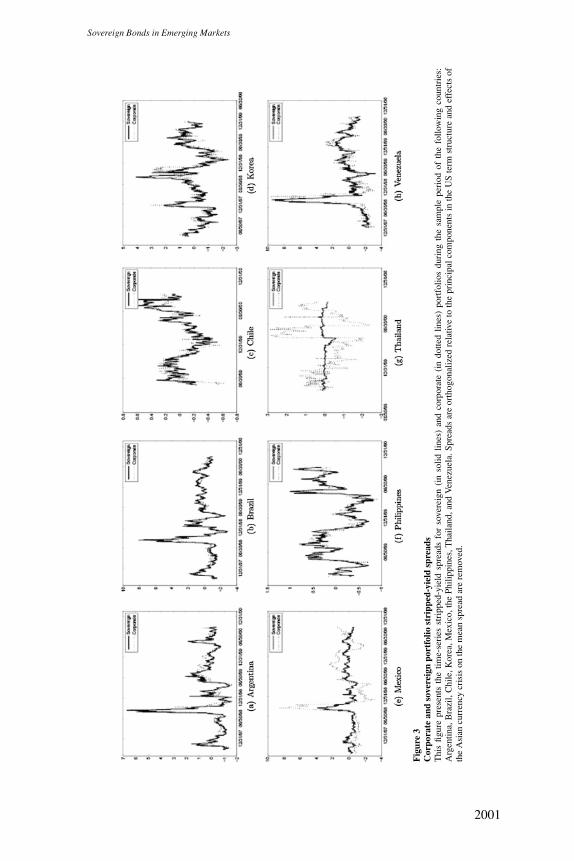
where Icrisis,t is an indicator variable that takes on value 1 during the crisisperiod and 0 otherwise, Ipostcrisis,t takes on a value 1 after the crisis and 0otherwise, and Xt represents the vector of three principal components retrievedfrom the US term structure discussed above.16 The residuals, ys⊥
{c,s},t , representthe orthogonalized yield spreads and are presented in Figure 3. As shown,although volatility is higher during the crisis period, the yield spreads lookquite stationary. Indeed, as shown in Table 6, we reject the null hypothesis ofa unit root at the 5% significance level in all eight countries’ sovereign andcorporate bond portfolios.
The intuition for assessing price discovery follows Hasbrouck (1995, 2003),and is based on variance decompositions for VARs discussed in Hamilton(1994). As discussed in Section 1, we have assumed an autoregressive processfor the state variables underlying the log bond prices. Since yield spreads aresimply an affine transformation of these state variables, we can write
�(L)ys⊥t = et , (12)
16 Our data span the precrisis, crisis, and postcrisis data only in Korea. In Argentina, Brazil, Mexico, and Venzuela,since the data occur only during and after the crisis, we restrict δ1 = 0. In Chile, the Philippines, and Thailand,all data are after the crisis; consequently, we restrict δ1 = δ2 = 0 for these countries.
2000
Sovereign Bonds in Emerging Markets
Fig
ure
3C
orpo
rate
and
sove
reig
npo
rtfo
liost
ripp
ed-y
ield
spre
ads
Thi
sfig
ure
pres
ents
the
time-
seri
esst
ripp
ed-y
ield
spre
ads
for
sove
reig
n(i
nso
lidlin
es)
and
corp
orat
e(i
ndo
tted
lines
)po
rtfo
lios
duri
ngth
esa
mpl
epe
riod
ofth
efo
llow
ing
coun
trie
s:A
rgen
tina,
Bra
zil,
Chi
le,K
orea
,Mex
ico,
the
Phili
ppin
es,T
haila
nd,a
ndV
enez
uela
.Spr
eads
are
orth
ogon
aliz
edre
lativ
eto
the
prin
cipa
lcom
pone
nts
inth
eU
Ste
rmst
ruct
ure
and
effe
cts
ofth
eA
sian
curr
ency
cris
ison
the
mea
nsp
read
are
rem
oved
.
2001
The Review of Financial Studies / v 21 n 5 2008
where �(L) is a polynomial in the lag operator, ys⊥t is a vector of the orthogo-
nalized corporate and sovereign portfolio yield spread from the regression (11),and et is an i.i.d. error term. The first step of our procedure is to estimate theparameters � of this VAR and retrieve the residuals. We discuss the lag lengthin the VAR in greater detail below.
Given the residuals, et , of the VAR, we construct their sample covariancematrix �. As discussed in Hamilton (1994), since this matrix is positive definite,we can decompose the covariance matrix into a unique lower triangular matrixA and diagonal matrix D, such that
� = ADA′. (13)
The elements of D are the diagonal elements of �. We then construct a set oforthogonal residuals using A,
ut = A−1et . (14)
Again, these residuals represent orthogonalized shocks to corporate andsovereign bond yield spreads in the VAR.
The orthogonalized residuals, ut , are used in conjunction with the vectormoving average (VMA) representation of the VAR to decompose the varianceof yield spreads into components attributable to shocks in corporate yieldspreads, ec,t , and sovereign yield spreads, es,t . The propagation of these shocksthrough the yield-spread system is characterized by this companion movingaverage representation,
ys⊥t = �(L)et . (15)
The VMA representation allows us to express the mean-squared error of aτ-period forecast of the yield spread as
MSE(ys⊥
t+τ|t) =
τ−1∑
k=0
�k�� ′k (16)
with �0 = I. The orthogonalized residuals allow us to separate the componentsof this MSE into components attributable solely to innovations in the corporateyield spreads and to innovations in the sovereign yield spreads. Noting that� = AE[ut u′
t ]A′, we can re-express the forecast mean-squared error as
MSE(ys⊥
t+τ|t) =
∑
j=c,s
τ−1∑
k=0
�ka j a′j�
′kVar(u jt ), (17)
where ac and as are the columns of the matrix A corresponding to the corporateand sovereign bonds, respectively.
2002
Sovereign Bonds in Emerging Markets
As discussed, construction of the forecast mean-squared error as above allowsus to separate the forecast error into components related solely to innovations incorporate bond yield spreads and to innovations in sovereign bond yield spreads.In the limiting case τ → ∞, the forecast mean-squared error converges to theunconditional covariance matrix of the yield spreads. Hasbrouck (1995, 2003)refers to the portion of the unconditional variance attributable to an elementof the VAR as the “information share” of the market, since innovations in theseries represent unanticipated news. We report the fraction of the unconditionalvariance in corporate yield spreads that can be attributed to orthogonalizedvariations in sovereign yield spreads and, following Hasbrouck, interpret thisquantity as a measure of how much of the corporate market-relevant informationis discovered in the sovereign market.
If the matrix A is diagonal, the orthogonalization will be exact, and we willhave a perfect representation of the proportion of variation coming from in-novations in each market. Unfortunately, in general, A will not be diagonal.However, we can place bounds on the variance contribution by simply reorder-ing the spreads in the VAR. If the sovereign spread is the first variable in theVAR, we will obtain an upper bound on the proportion of volatility in the cor-porate market attributable to the sovereign market. Estimating the VAR withthe corporate spread as the first variable provides the complementary lowerbound.
In addition to the variance decompositions, we also examine the impact ofinnovations in the corporate and sovereign yield spreads on future realizationsof the yield spreads. We do so by examining the impulse-response function forthe VAR system in each country. Specifically, we consider the orthogonalizedimpact of a unit shock to each equation in the system on the future realizationof the system. That is, we can calculate the impact of a shock to the system athorizon τ as
�ys⊥t+τ = �τa j , (18)
where a j again represents the j th column of the matrix A above, with j = {c, s}.Of particular interest in our case is the cumulative impulse-response function
ys⊥t+τ =
∑
τ
�τa j. (19)
This quantity informs us of the long-run impact of a shock in the system on theyield spread.
3.3.2 Empirical results. We estimate VARs for the sovereign and corporatebond portfolios of the eight countries in our sample. The lag length in the VARis determined via a recursive likelihood ratio test with the null hypothesis that a
2003
The Review of Financial Studies / v 21 n 5 2008
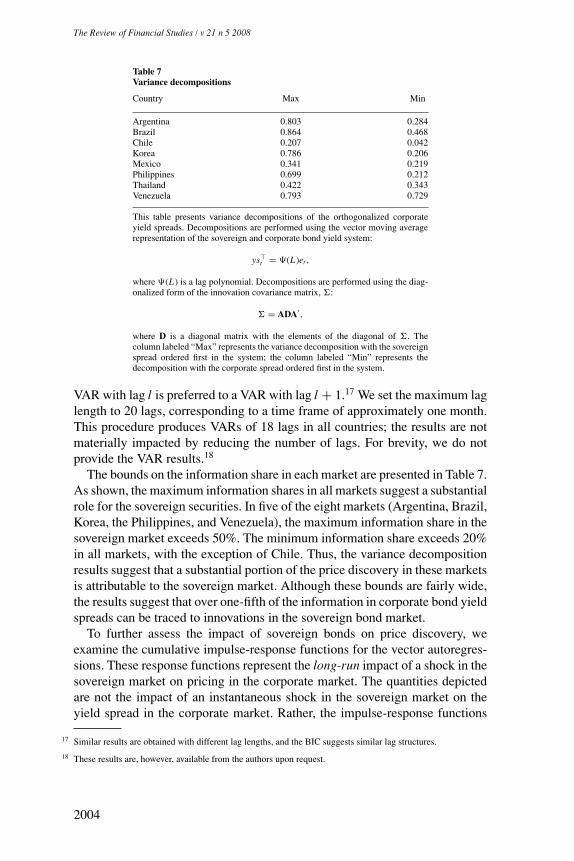
Table 7Variance decompositions
Country Max Min
Argentina 0.803 0.284Brazil 0.864 0.468Chile 0.207 0.042Korea 0.786 0.206Mexico 0.341 0.219Philippines 0.699 0.212Thailand 0.422 0.343Venezuela 0.793 0.729
This table presents variance decompositions of the orthogonalized corporateyield spreads. Decompositions are performed using the vector moving averagerepresentation of the sovereign and corporate bond yield system:
ys�t = �(L)et ,
where �(L) is a lag polynomial. Decompositions are performed using the diag-onalized form of the innovation covariance matrix, �:
� = ADA′,
where D is a diagonal matrix with the elements of the diagonal of �. Thecolumn labeled “Max” represents the variance decomposition with the sovereignspread ordered first in the system; the column labeled “Min” represents thedecomposition with the corporate spread ordered first in the system.
VAR with lag l is preferred to a VAR with lag l + 1.17 We set the maximum laglength to 20 lags, corresponding to a time frame of approximately one month.This procedure produces VARs of 18 lags in all countries; the results are notmaterially impacted by reducing the number of lags. For brevity, we do notprovide the VAR results.18
The bounds on the information share in each market are presented in Table 7.As shown, the maximum information shares in all markets suggest a substantialrole for the sovereign securities. In five of the eight markets (Argentina, Brazil,Korea, the Philippines, and Venezuela), the maximum information share in thesovereign market exceeds 50%. The minimum information share exceeds 20%in all markets, with the exception of Chile. Thus, the variance decompositionresults suggest that a substantial portion of the price discovery in these marketsis attributable to the sovereign market. Although these bounds are fairly wide,the results suggest that over one-fifth of the information in corporate bond yieldspreads can be traced to innovations in the sovereign bond market.
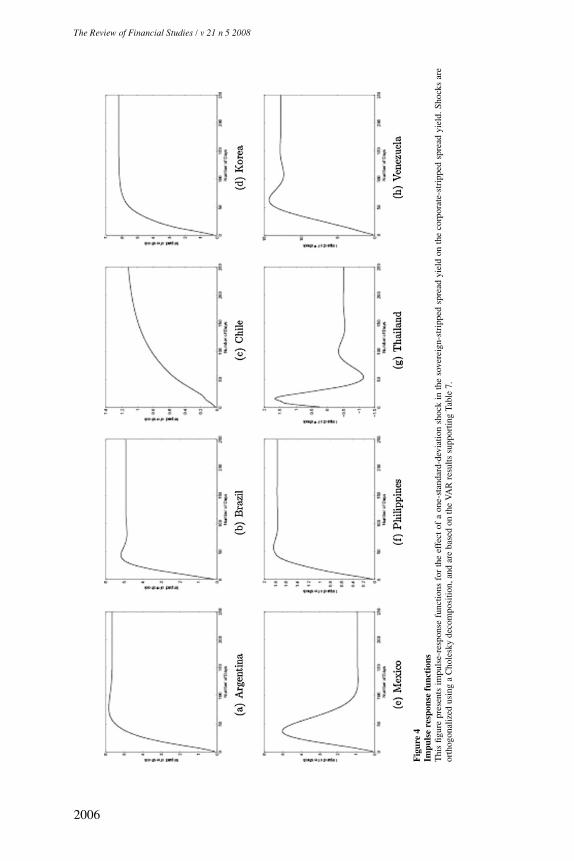
To further assess the impact of sovereign bonds on price discovery, weexamine the cumulative impulse-response functions for the vector autoregres-sions. These response functions represent the long-run impact of a shock in thesovereign market on pricing in the corporate market. The quantities depictedare not the impact of an instantaneous shock in the sovereign market on theyield spread in the corporate market. Rather, the impulse-response functions
17 Similar results are obtained with different lag lengths, and the BIC suggests similar lag structures.
18 These results are, however, available from the authors upon request.
2004
Sovereign Bonds in Emerging Markets
indicate the eventual impact of a shock in the sovereign market on the yieldspread in the corporate market if there are no shocks to the corporate market andno new information arrives in the market. That is, the impulse-response func-tions indicate the eventual impact of discovery of information in the sovereignmarket on pricing in the corporate market.
These response functions are plotted in Figure 4 and represent the cumula-tive impact of a one-standard-deviation change in the logged, demeaned, anddetrended yield spread on sovereign bond issues on the logged, demeaned, anddetrended yield spread on corporate bond issues. As shown in the figure, formost of the countries (Argentina, Brazil, Chile, Mexico, the Philippines, andVenezuela), shocks propagate relatively slowly through the system and thenplateau after a period of about 50 to 100 days. In each of these six markets,the standard deviation of a demeaned and detrended shock is just over 1 ba-sis point. The long-run impact of this shock on the corporate yield spread isapproximately 5.7 basis points in Argentina, 4.9 basis points in Brazil, 1.1basis points in Chile, 6.2 basis points in Korea, 0.9 basis points in Mexico, 1.8basis points in the Philippines, and 12.8 basis points in Venezuela. Given thesmall size of a one-standard-deviation shock, the economic magnitude of theseshocks is quite large.
Thailand presents a somewhat different picture than the remaining countries.Like Mexico and, to a lesser extent, Argentina, Brazil, the Philippines, andVenezuela, the impact of the shock reverts at some point over the function.As stated, this effect is most pronounced in Mexico, where the cumulativeimpulse-response function peaks at approximately 5 basis points, but reverts toa bit less than 1 basis point in the long run. Thailand represents more oscillatorybehavior: the cumulative impulse-response function peaks in excess of 1.5 basispoints, drops below −1 basis point, and stabilizes around −0.5 basis points.Our suspicion is that, as the Thai series is the shortest of those examined, weare unable to accurately capture the dynamics of price discovery in this market.However, with the exception of the Thai market, we conclude that an innovationin the sovereign market has a large impact for most markets on future yieldspreads.
3.4 Price impact of sovereign bond issuance on existing bondsTo test the liquidity effect of new benchmark sovereign issues on corporatebonds, we employ a standard event-study methodology. We construct a timewindow around each benchmark sovereign issue date and estimate the liquidityeffect as the change in corporate bonds’ stripped-yield spreads and bid-askspreads in response to a new sovereign issue within the time window for eachcountry. If the introduction of a sovereign benchmark lowers the liquidity pre-mium on corporate bonds, as suggested by Subrahmanyam (1991); Gortonand Pennacchi (1993); and Yuan (2005), we should observe that corporateyield and bid-ask spreads drop relatively more than the corresponding spreadson sovereign bonds. The reason is that corporate bonds are exposed to both
2005
The Review of Financial Studies / v 21 n 5 2008
Fig
ure
4Im
puls
ere
spon
sefu
ncti
ons
Thi
sfig
ure
pres
ents
impu
lse-
resp
onse
func
tions
for
the
effe
ctof
aon
e-st
anda
rd-d
evia
tion
shoc
kin
the
sove
reig
n-st
ripp
edsp
read
yiel
don
the
corp
orat
e-st
ripp
edsp
read
yiel
d.Sh
ocks
are
orth
ogon
aliz
edus
ing
aC
hole
sky
deco
mpo
sitio
n,an
dar
eba
sed
onth
eV
AR
resu
ltssu
ppor
ting
Tabl
e7.
2006
Sovereign Bonds in Emerging Markets
systematic and idiosyncratic risk factors, while sovereign bonds are only ex-posed to the systematic risk factor. Upon the introduction of a benchmark,adverse selection is lower in the trading of both systematic and idiosyncraticrisk factors. This in turn promotes information production and lowers the liq-uidity premia associated with the trading of both risk factors.
As in most event studies, the issue decision may be endogenous. That is, thegovernment may time sovereign issuances and choose to issue when yields arelow and liquidity is high. Endogeneity may result in upward-biased estimatesof the mean liquidity effect of sovereign bonds. To address these concerns, weproject stripped-yield spreads on the first three principal components of thedefault-free term structure, EMBI spread, and exchange rate, similar to ouranalysis in the preceding section,
ys{c,s},t = δ10 + β′1 Xt + γ11ext + γ12embit + uys
{c,s},t , (20)
bs{c,s},t = δ20 + β′2 Xt + γ21ext + γ22embit + ubs
{c,s},t , (21)
where ys{c,s},t represents the stripped-yield spread on corporate (c) andsovereign (s) instruments and bs{c,s},t represents the bid-ask spread on corpo-rate and sovereign instruments. The variables, Xt , are the principal componentsin the US term structure discussed above, ext is the local currency–US dollarexchange rate, and embit is the stripped-yield spread on the country EMBIindex. All variables are expressed in logs.
The objects of interest in our analysis are the residuals in the above ex-pression, uys
{c,s},t and ubs{c,s},t , which represent the innovation in the yield and
bid-ask spreads, respectively, independent of information in the default-freeterm structure, exchange rates, or average yield movements in the country. Weexamine the impact of a sovereign issue on these residuals for existing corpo-rate and sovereign bonds. Our motivation for using these controls is to removeas much of the effects of the default-free term structure and timing concernsas possible. In particular, the EMBI spread represents an instrument for thegovernment market timing decision. This spread is the spread on an averageexisting sovereign bond. Consequently, if market liquidity or yield conditionsare favorable, independent of the new bond issuance, these conditions shouldbe reflected in the existing sovereign bonds and, hence, the EMBI spread. Inthis case, we expect to see no reduction in the spread differential betweencorporate and corresponding sovereign bonds after the sovereign benchmarkissuance.
Our specific framework is as follows. Define an indicator variable, I st , where
I st = 1 after a new sovereign issue is traded and 0 otherwise. We omit Thailand
and Chile because there is no EMBI available. For each of the remaining sixcountries, Argentina, Brazil, Korea, Mexico, the Philippines, and Venezuela,we estimate the coefficients of the following regression using fixed effects on
2007
The Review of Financial Studies / v 21 n 5 2008
each sovereign issue window for corresponding corporate bonds,19
uysi, j = αs + βs I s
t +∑
k
κk I ssk +∑
l
κlNewl +∑
t
κt t + εysi, j , (22)
ubsi, j = αb + βb I s
t +∑
k
κk I ssk +∑
l
κlNewl +∑
t
κt t + εbsi, j , (23)
where k refers to the kth issuer; l indicates the lth new sovereign issue; and I ssk ,Newl , and t are dummy variables for each issuer, each event window, and eachdistinct month and year combination, respectively. The parameters (αs and βs)are constrained to be the same across issuers in the same country. Therefore, inthis specification, as yield and bid-ask spread residuals, uys
i, j,t and ubsi, j,t , are net
of term-structure effects and default risk factors, the coefficient on I st measures
only the liquidity service of a new sovereign issue: a negative coefficientindicates that sovereign bonds have a liquidity service and the magnitudeof the liquidity service is measured by the absolute value of the coefficient.All estimation is conducted using fixed effects on each sovereign issue eventwindow, where standard errors are corrected based on Newey and West (1987).The estimation is performed for six event windows, ranging from 7 weeks to 2weeks prior and subsequent to the sovereign issue date.20
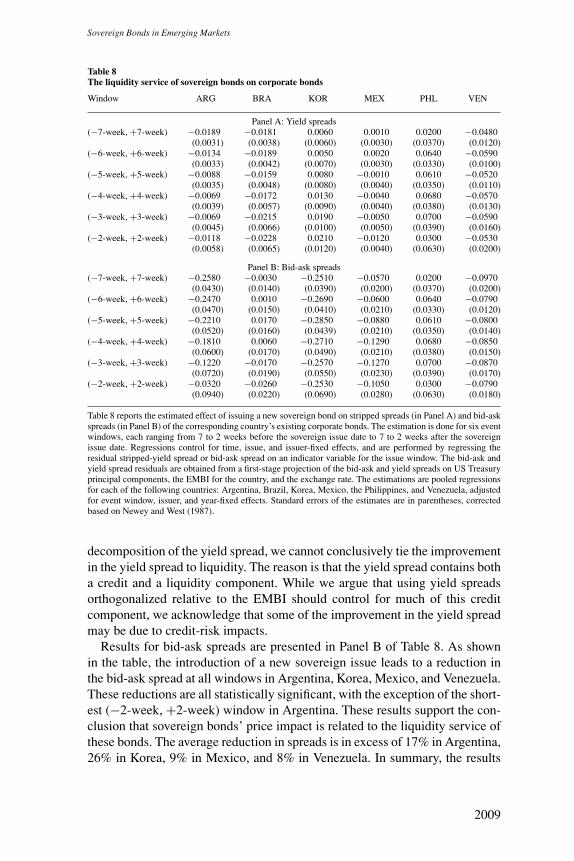
Results of estimation using stripped-yield spreads are reported in Panel A ofTable 8. As indicated in the table, the introduction of a sovereign bond has astatistically significant impact on the stripped-yield spreads of corporate bondsin Argentina, Brazil, Mexico, and Venezuela. The results suggest that the in-troduction of a new sovereign bond results in a reduction in the stripped-yieldspread of bonds in these countries, consistent with the hypothesis advancedabove. That is, the evidence suggests that the introduction of a new sovereignissue results in greater ability to hedge systematic risk, which in turn lowers ad-verse selection costs and improves liquidity. Results for Mexico are statisticallysignificant only at the −2-week, +2-week window, but indicate a reduction inthe yield spread out to the −5-week, +5-week window. Results in Korea andthe Philippines are not statistically significant.
In order to interpret these results, consider the Venezuelan corporate market.In this market, the average reduction in spread upon the introduction of a newsovereign bond is 5.9% or, evaluated at the average daily corporate spread,approximately 26 basis points. This 26 basis points quantity is approximatelyfour times the average bid-ask spread in the Venezuelan corporate bond market.Thus, the reduction in spread is economically significant and far exceeds trans-action costs. Again, the result is indicative of a price impact of new sovereignissues on the pricing of corporate bonds. We note, however, that without further
19 We report the estimation results for corporate issues in excess of the $200 million face value at issuance, as smallerissues are very thinly traded. The results are similar when we include all corporate bonds in the estimation.
20 We have examined windows as long as 12 months before and after a new sovereign issue date. The results arequalitatively similar, but exhibit weaker statistical significance.
2008
Sovereign Bonds in Emerging Markets
Table 8The liquidity service of sovereign bonds on corporate bonds
Window ARG BRA KOR MEX PHL VEN
Panel A: Yield spreads(−7-week, +7-week) −0.0189 −0.0181 0.0060 0.0010 0.0200 −0.0480
(0.0031) (0.0038) (0.0060) (0.0030) (0.0370) (0.0120)(−6-week, +6-week) −0.0134 −0.0189 0.0050 0.0020 0.0640 −0.0590
(0.0033) (0.0042) (0.0070) (0.0030) (0.0330) (0.0100)(−5-week, +5-week) −0.0088 −0.0159 0.0080 −0.0010 0.0610 −0.0520
(0.0035) (0.0048) (0.0080) (0.0040) (0.0350) (0.0110)(−4-week, +4-week) −0.0069 −0.0172 0.0130 −0.0040 0.0680 −0.0570
(0.0039) (0.0057) (0.0090) (0.0040) (0.0380) (0.0130)(−3-week, +3-week) −0.0069 −0.0215 0.0190 −0.0050 0.0700 −0.0590
(0.0045) (0.0066) (0.0100) (0.0050) (0.0390) (0.0160)(−2-week, +2-week) −0.0118 −0.0228 0.0210 −0.0120 0.0300 −0.0530
(0.0058) (0.0065) (0.0120) (0.0040) (0.0630) (0.0200)
Panel B: Bid-ask spreads(−7-week, +7-week) −0.2580 −0.0030 −0.2510 −0.0570 0.0200 −0.0970
(0.0430) (0.0140) (0.0390) (0.0200) (0.0370) (0.0200)(−6-week, +6-week) −0.2470 0.0010 −0.2690 −0.0600 0.0640 −0.0790
(0.0470) (0.0150) (0.0410) (0.0210) (0.0330) (0.0120)(−5-week, +5-week) −0.2210 0.0170 −0.2850 −0.0880 0.0610 −0.0800
(0.0520) (0.0160) (0.0439) (0.0210) (0.0350) (0.0140)(−4-week, +4-week) −0.1810 0.0060 −0.2710 −0.1290 0.0680 −0.0850
(0.0600) (0.0170) (0.0490) (0.0210) (0.0380) (0.0150)(−3-week, +3-week) −0.1220 −0.0170 −0.2570 −0.1270 0.0700 −0.0870
(0.0720) (0.0190) (0.0550) (0.0230) (0.0390) (0.0170)(−2-week, +2-week) −0.0320 −0.0260 −0.2530 −0.1050 0.0300 −0.0790
(0.0940) (0.0220) (0.0690) (0.0280) (0.0630) (0.0180)
Table 8 reports the estimated effect of issuing a new sovereign bond on stripped spreads (in Panel A) and bid-askspreads (in Panel B) of the corresponding country’s existing corporate bonds. The estimation is done for six eventwindows, each ranging from 7 to 2 weeks before the sovereign issue date to 7 to 2 weeks after the sovereignissue date. Regressions control for time, issue, and issuer-fixed effects, and are performed by regressing theresidual stripped-yield spread or bid-ask spread on an indicator variable for the issue window. The bid-ask andyield spread residuals are obtained from a first-stage projection of the bid-ask and yield spreads on US Treasuryprincipal components, the EMBI for the country, and the exchange rate. The estimations are pooled regressionsfor each of the following countries: Argentina, Brazil, Korea, Mexico, the Philippines, and Venezuela, adjustedfor event window, issuer, and year-fixed effects. Standard errors of the estimates are in parentheses, correctedbased on Newey and West (1987).
decomposition of the yield spread, we cannot conclusively tie the improvementin the yield spread to liquidity. The reason is that the yield spread contains botha credit and a liquidity component. While we argue that using yield spreadsorthogonalized relative to the EMBI should control for much of this creditcomponent, we acknowledge that some of the improvement in the yield spreadmay be due to credit-risk impacts.
Results for bid-ask spreads are presented in Panel B of Table 8. As shownin the table, the introduction of a new sovereign issue leads to a reduction inthe bid-ask spread at all windows in Argentina, Korea, Mexico, and Venezuela.These reductions are all statistically significant, with the exception of the short-est (−2-week, +2-week) window in Argentina. These results support the con-clusion that sovereign bonds’ price impact is related to the liquidity service ofthese bonds. The average reduction in spreads is in excess of 17% in Argentina,26% in Korea, 9% in Mexico, and 8% in Venezuela. In summary, the results
2009
The Review of Financial Studies / v 21 n 5 2008
suggest that the issuance of sovereign bonds has an impact on the pricing ofcorporate bonds in the secondary market after controlling for potential sourcesof systematic risk, indicating that the price impact comes from liquidity im-provement. The liquidity service of sovereign bonds appears both economicallyand statistically significant across most of the bond markets in our study.21
Since our data are quote data, a natural concern is whether these quotesreflect information or stale prices. Several studies, including Lesmond, Schill,and Zhou (2004); Bekaert, Harvey, and Lundblad (2007); and Chen, Lesmond,and Wei (2005), examine the extent of stable prices by computing the percentageof zero returns. Chen, Lesmond, and Wei study the percentage of zero returnsin US corporate bonds and find the percentage ranges from 3.88% to 41%. Asa robustness check, we also calculate the percentage of zero returns, returnsless than 5 basis points in absolute value, and returns less than 10 basis pointsin absolute value.22 The percentage of zero returns in our sample range from0.005% to 0.265% of quotes; results are similar for the 5-basis-point screenand approach those in other studies only for the 10-basis-point screen. As a 5-basis-point spread exceeds the bid-ask spread, we suggest that stale quotes arenot responsible for the low percentage of zero returns; market makers would beproviding arbitrage opportunities by moving quotes in this magnitude withoutinformation. However, we acknowledge that, due to the fact that we only havequote data available, stale quotes are a potential concern.
3.5 Interpreting the results across countriesThus far, we have found that for many countries, the presence of a sovereignbond market leads to spanning enhancement, improved price discovery throughthe sovereign market, and improvement in liquidity as measured by the bid-askspread. However, these gains are not universal across countries in our sample.A natural question to ask is whether there are any differences among thesecountries that can help us understand why some of these countries improve incertain regards and others do not.
Our ability to investigate this issue is limited by the fact that we have onlyeight countries in our sample, significantly impacting any statistical power intests that we may conduct. We confine our discussion in this section to largelyqualitative discussions of the correlations between the measures of improve-ment that we discuss in the paper and cross-sectional variables measuringdifferences among the countries. In particular, we examine: (i) the Sharpe ratioimprovement of corporates, sovereigns, and US Treasuries relative to corporatesand US Treasuries; (ii) the minimum corporate information share attributableto sovereigns; and (iii) the (−7,+7)-week window bid-ask spread change. Wecompare these variables to the Index of Economic Freedom variables from the
21 As a robustness check, we have also estimated Equations (16) and (17) excluding the crisis period (from 2 July1997 to 17 October 1998). The results are similar, with a slight improvement in the level of statistical significance.
22 These results are available from the authors upon request.
2010
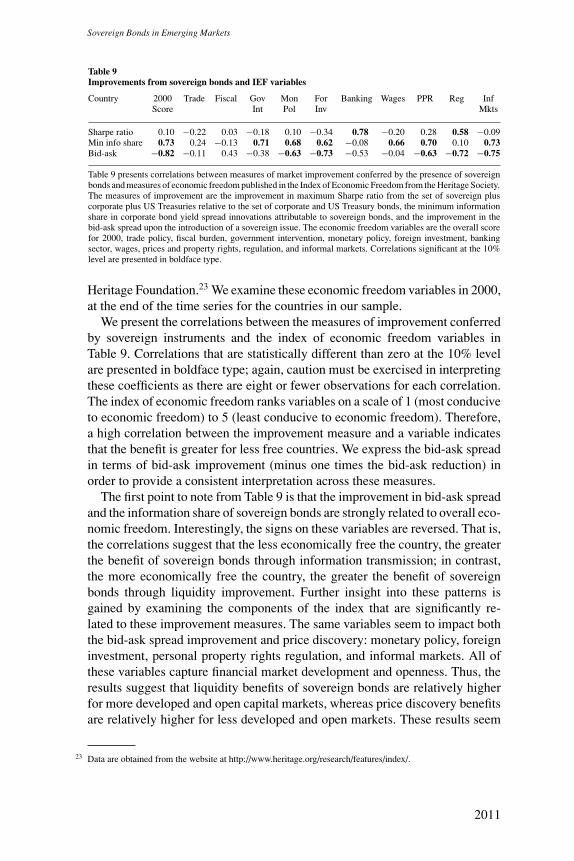
Sovereign Bonds in Emerging Markets
Table 9Improvements from sovereign bonds and IEF variables
Country 2000 Trade Fiscal Gov Mon For Banking Wages PPR Reg InfScore Int Pol Inv Mkts
Sharpe ratio 0.10 −0.22 0.03 −0.18 0.10 −0.34 0.78 −0.20 0.28 0.58 −0.09Min info share 0.73 0.24 −0.13 0.71 0.68 0.62 −0.08 0.66 0.70 0.10 0.73Bid-ask −0.82 −0.11 0.43 −0.38 −0.63 −0.73 −0.53 −0.04 −0.63 −0.72 −0.75
Table 9 presents correlations between measures of market improvement conferred by the presence of sovereignbonds and measures of economic freedom published in the Index of Economic Freedom from the Heritage Society.The measures of improvement are the improvement in maximum Sharpe ratio from the set of sovereign pluscorporate plus US Treasuries relative to the set of corporate and US Treasury bonds, the minimum informationshare in corporate bond yield spread innovations attributable to sovereign bonds, and the improvement in thebid-ask spread upon the introduction of a sovereign issue. The economic freedom variables are the overall scorefor 2000, trade policy, fiscal burden, government intervention, monetary policy, foreign investment, bankingsector, wages, prices and property rights, regulation, and informal markets. Correlations significant at the 10%level are presented in boldface type.
Heritage Foundation.23 We examine these economic freedom variables in 2000,at the end of the time series for the countries in our sample.
We present the correlations between the measures of improvement conferredby sovereign instruments and the index of economic freedom variables inTable 9. Correlations that are statistically different than zero at the 10% levelare presented in boldface type; again, caution must be exercised in interpretingthese coefficients as there are eight or fewer observations for each correlation.The index of economic freedom ranks variables on a scale of 1 (most conduciveto economic freedom) to 5 (least conducive to economic freedom). Therefore,a high correlation between the improvement measure and a variable indicatesthat the benefit is greater for less free countries. We express the bid-ask spreadin terms of bid-ask improvement (minus one times the bid-ask reduction) inorder to provide a consistent interpretation across these measures.
The first point to note from Table 9 is that the improvement in bid-ask spreadand the information share of sovereign bonds are strongly related to overall eco-nomic freedom. Interestingly, the signs on these variables are reversed. That is,the correlations suggest that the less economically free the country, the greaterthe benefit of sovereign bonds through information transmission; in contrast,the more economically free the country, the greater the benefit of sovereignbonds through liquidity improvement. Further insight into these patterns isgained by examining the components of the index that are significantly re-lated to these improvement measures. The same variables seem to impact boththe bid-ask spread improvement and price discovery: monetary policy, foreigninvestment, personal property rights regulation, and informal markets. All ofthese variables capture financial market development and openness. Thus, theresults suggest that liquidity benefits of sovereign bonds are relatively higherfor more developed and open capital markets, whereas price discovery benefitsare relatively higher for less developed and open markets. These results seem
23 Data are obtained from the website at http://www.heritage.org/research/features/index/.
2011
The Review of Financial Studies / v 21 n 5 2008
sensible; for liquidity to be a dominating concern for investors, capital marketsmust be relatively free, open, and well functioning. In contrast, in financialmarkets in which governments frequently intervene and regulation is poor,informational benefits are likely to dominate other benefits for investors.
The Sharpe ratio improvement is not significantly related to overall economicfreedom, but does show strong correlation with the freedom of the banking cen-ter and government regulation. Our interpretation of spanning enhancement isthat sovereign bonds permit investors to isolate systematic risk components ofasset payoffs from firm-specific components. In an economy where the gov-ernment tightly regulates and restricts entry into business and interferes in thebanking and financial markets, the transparency of corporate fundamentals willbe quite low; it will be difficult to disentangle these fundamentals from gov-ernment interference. With the addition of sovereign bonds, with prices thatare less subject to these concerns, investors can isolate the firm-specific com-ponents of asset payoffs from the systematic components, allowing a spanningenhancement.
In general, these results suggest that the less economically free the country,the greater the improvements conferred by sovereign bonds in terms of en-hancing the investment opportunity set and conveying information. In contrast,the more free the country, the greater the benefits from liquidity improvement.Again, we caution against an overly strong interpretation of these results dueto the small sample size, but suggest that these measures of economic devel-opment seem to provide further insight into why different countries benefitdifferently from the presence of sovereign bonds.
4. Conclusion
In this paper, we ask the question of whether sovereign bonds represent animprovement or a drain on emerging corporate bond markets. The evidencesuggests that the answer is that these bonds improve the corporate bond market.We investigate the benchmark role of sovereign bonds in three ways: examiningimprovements in investors’ opportunity sets derived from the inclusion ofsovereign bonds in a market, investigating whether the existence of sovereignbonds contributes to price discovery in a market, and determining whetherthese bonds have an effect on the pricing of corporate securities above andbeyond that represented by improved spanning of systematic market factors.The answer to all of these questions, based on the evidence, is yes.
The source of the gains from the presence of sovereign bonds in a marketappears to be spanning, price discovery, and liquidity enhancement. The evi-dence suggests that introducing sovereign bonds improves investors’ abilitiesto span the systematic risks of the market, which in turn allows traders incorporate markets to better understand systematic pricing risks. Through theirimproved ability to hedge these risks and price bonds, we observe greater infor-mation production due to lower adverse selection costs. Consequently, we see
2012
Sovereign Bonds in Emerging Markets
a large impact of price discovery in sovereign markets on corporate markets,and witness a reduction in yield and bid-ask spreads in the corporate markets.In other words, sovereign bonds enhance corporate bond markets in emergingeconomies by providing more information, stimulating information production,and thereby generating reduced adverse selection costs and improved liquidity.
As we note, several east Asian countries are preparing to launch or haverecently launched sovereign bonds, most notably China. Our results suggestthat the issuance of these bonds will represent an improvement for the Chinesebond market.24 As the sovereign market grows in these countries, we expect tosee overall information revelation and the liquidity of corporate bond marketsin these countries improve. In summary, our evidence suggests that sovereignbond issuances are essential for developing vibrant corporate bond markets inemerging economies.
ReferencesBekaert, G., C. R. Harvey, and C. T. Lundblad. 2007. Liquidity and Expected Returns: Lessons from EmergingMarkets. Review of Financial Studies 20:1783–831.
Bekaert, G., and M. Urias. 1996. Diversification, Integration, and Emerging Market Closed-End Funds. Journalof Finance 51:835–69.
Brandt, M., and K. Kavajecz. 2004. Price Discovery in the U.S. Treasury Market: The Impact of Orderflow andLiquidity on the Yield Curve. Journal of Finance 59:2623–54.
Campbell, J. Y., and P. Perron. 1991. Pitfalls and Opportunities: What Macroeconomists Should Know aboutUnit Roots, in Olivier J. Blanchard and Stanley Fischer (eds.), National Bureau of Economic Research Macro-economics Annual. Cambridge, MA: MIT Press, 141–201.
Cass, D., and A. Citanna. 1998. Pareto Improving Financial Innovation in Incomplete Markets. Economic Theory11:467–94.
Chamon, M., E. Borensztein, O. Jeanne, P. Mauro, and J. Zettelmeyer. 2004. Sovereign Debt Structure for CrisisPrevention. Occasional Paper No. 237, IMF.
Chen, L., D. A. Lesmond, and J. Wei. 2005. Corporate Yield Spreads and Bond Liquidity. Journal of Finance62:119–49.
de Santis, G. 1993. Volatility Bounds for Stochastic Discount Factors: Tests and Implications from InternationalFinancial Markets. Discussion Paper, University of Chicago.
Dow, J. 1998. Arbitrage, Hedging, and Financial Innovation. Review of Financial Studies 11:739–55.
Duffie, D., L. Pedersen, and K. J. Singleton. 2003. Modeling Sovereign Yield Spreads: A Case Study of RussianDebt. Journal of Finance 58:119–59.
Dunne, P. G., M. J. Moore, and R. Portes. 2003. Defining Benchmark Status: An Application Using Euro-AreaBonds. Working Paper No. 9087, NBER.
Eichenbaum, B., R. Hausmann, and U. Panizza. 2004. The Pain of Original Sin, in Other People’s Money: DebtDenomination and Financial Instability in Emerging Market Economics. Chicago, IL: University of ChicagoPress.
24 The 10-year and 5-year benchmark bonds issued by the Chinese government in October 2004 were heavilyoversubscribed. The 10-year tranche saw demand of approximately 4.2 times the allocation, while the 5-yeartranche received orders three times the allocation. The issuance was hailed as a “landmark achievement” bypractitioners. According to Cristian Jonsson, the head of Asia debt syndicate at UBS, China has “established thefirst major euro benchmark and set an example to the Asian sovereign and corporate issues in the euro market”(South China Morning Post, 22 October 2004).
2013
The Review of Financial Studies / v 21 n 5 2008
Elul, R. 1994. Welfare Effects of Financial Innovation in Incomplete Market Economies with Several Consump-tion Goods. Journal of Economic Theory 65:43–78.
Fabella, R., and S. Madhur. 2003. Bond Market Development in East Asia: Issues and Challenges. ERD WorkingPaper No. 35, Asian Development Bank.
Gorton, G. N., and G. G. Pennacchi. 1993. Security Baskets and Index-Linked Securities. Journal of Business66:1–27.
Hamilton, J. D. 1994. Time Series Analysis. Princeton, NJ: Princeton University Press.
Hansen, L. P., and R. Jagannathan. 1991. Implications of Security Market Data for Models of DynamicEconomies. Journal of Political Economy 99:225–62.
Hart, O. 1975. On the Optimality of Equilibrium When the Market Structure Is Incomplete. Journal of EconomicTheory 11:418–43.
Hasbrouck, J. 1995. One Security, Many Markets: Determining the Contributions to Price Discovery. Journal ofFinance 50:1175–99.
Hasbrouck, J. 2003. Intraday Price Formation in U.S. Equity Markets. Journal of Finance 6:2375–99.
Huberman, G., and E. Kandel. 1987. Mean-Variance Spanning. Journal of Finance 42:873–88.
Krishnamurthy, A., and A. Vissing-Jorgensen. 2006. The Demand for Treasury Debt. Working Paper, North-western University.
Kyle, A. 1985. Continuous Auctions and Insider Trading. Econometrica 53:1315–35.
Lesmond, D. A., M. J. Schill, and C. Zhou. 2004. The Illusory Nature of Momentum Profits. Journal of FinancialEconomics 71:349–80.
Litterman, R., and J. Scheinkman. 1991. Common Factors Affecting Bond Returns. Journal of Fixed Income1:54–61.
Marın, J. M., and R. Rahi. 1998. Information Revelation and Market Incompleteness. Review of Economic Studies67:455–81.
Newey, W., and K. West. 1987. A Simple, Positive-Definite, Heteroskedacity and Autocorrelation ConsistentCovariance Matrix. Econometrica 55:703–8.
Shiller, R. J. 1993. Macro Markets. Oxford: Oxford University Press.
Subrahmanyam, A. 1991. A Theory of Trading in Stock Index Futures. Review of Financial Studies 4:17–51.
Yuan, K. 2005. The Liquidity Service of Benchmark Securities. Journal of European Economic Association3:1156–80.
2014