Embed Size (px)
Citation preview
AFRICAN CORPORATE BOND MARKET
1
AFRICAN HIGH YIELD CORPORATE BOND MARKET
October 2012
AFRICAN HIGH YIELD CORPORATE BOND MARKET
2
CONTENTS
1 EXECUTIVE SUMMARY .........................................................................................................5
1.1 Introduction ...............................................................................................................5
1.2 Research methodology ..............................................................................................5
1.3 Africa bottom-up analysis ..........................................................................................5
1.4 Africa top-down analysis ............................................................................................7
1.5 Latin America .............................................................................................................7
1.6 Asia ............................................................................................................................8
2 AFRICA BOTTOM UP ANALYSIS ...........................................................................................11
2.1 Bond categories .......................................................................................................11
2.2 Extended sub-investment grade bond category .......................................................12
2.3 Non-South African extended sub-investment grade bond category .........................15
2.4 Bondholder Analysis ................................................................................................18
3 AFRICA TOP-DOWN ANALYSIS ............................................................................................22
3.1 Introduction & Methodology ...................................................................................22
3.2 Overview of the SSA (EX-South Africa) corporate bond market ................................23
3.3 Insights on the South African sub-investment grade corporate bond market ...........29
3.4 Insight on the investor base .....................................................................................31
3.5 Looking forward and conclusions .............................................................................35
4 LATIN AMERICA .................................................................................................................36
4.1 Development of corporate bond market: 1990s - 2004 ............................................36
4.2 Development of corporate bond market: 2007 – 2012 ............................................39
4.3 Factors contributing to development of corporate bond markets ............................40
4.4 Current corporate bond market characteristics .......................................................40
4.5 Recent trends in corporate debt markets .................................................................42
4.6 High yield debt funds ...............................................................................................48
5 ASIA ...................................................................................................................................52
5.1 History and overview of the Asian corporate bond market ......................................52
5.2 Current Asian corporate bond market characteristics, sentiment and activity..........56
5.3 Factors contributing to the development of Asian corporate bond markets ............64
6 SOURCES ............................................................................................................................69
AFRICAN HIGH YIELD CORPORATE BOND MARKET
3
TABLE OF FIGURES
Figure 1: Breakdown of bonds listed on Bloomberg ..................................................................12
Figure 2: Extended sub-investment grade bond category by country ........................................13
Figure 3: Extended sub-investment grade bond category by currency .......................................13
Figure 4: Extended sub-investment grade bond category by coupon type .................................14
Figure 5: Extended sub-investment grade bond category by year of issue .................................14
Figure 6: Extended sub-investment grade bond category by term .............................................15
Figure 7: Non-South African extended sub-investment grade bond category by country...........15
Figure 8: Non-South African extended sub-investment grade bond category by currency .........16
Figure 9: Non-South African extended sub-investment grade bond category by coupon type ...16
Figure 10: Non-South African extended sub-investment grade bond category by year of issue .17
Figure 11: Non-South African extended sub-investment grade bond category by term .............17
Figure 12: Summary of bonds from Bloomberg .........................................................................18
Figure 13: Emerging market corporate bond issuance (USD Billions) .........................................23
Figure 14: Total African corporate bonds, 2012 (USD Billions) ...................................................24
Figure 15: Corporate bonds as a % of GDP ................................................................................36
Figure 16: State of bond markets in 2004 ..................................................................................36
Figure 17: Composition of bonds Issued between 2000 - 2005 ..................................................37
Figure 18: LatAM Corporate Bond Issuance (USD and Local Currency) ......................................39
Figure 19: LatAM High Yield vs. Investment Grade Corporate Bond Issuance (USD and Local
Currency) ..................................................................................................................................39
Figure 20: EM USD corporate bonds outstanding by region at the end of 2011 ($ millions) .......41
Figure 21: Local currency corporate bonds outstanding as of May 2012 ($ billions) ..................41
Figure 22: LatAm Mutual Fund Industry – Flows by asset class / Investment ($ billions) ............42
Figure 23: Local LatAm Mutual Fund Industry – Total Asset Flows .............................................43
Figure 24: Yields on emerging market $ debt is highest globally ................................................43
Figure 25: EM real yields (5 yr swap minus CPI) .........................................................................44
Figure 26: Yields on emerging market local currency debt over US Treasuries ...........................44
Figure 27: Leverage and spread per turn of net leverage ...........................................................45
Figure 28: LatAM HY vs. US HY spreads .....................................................................................46
Figure 29: LatAM HY vs. US HY returns ......................................................................................46
AFRICAN HIGH YIELD CORPORATE BOND MARKET
4
Figure 30: LatAM HY vs. US HY interest cover ratios ..................................................................46
Figure 31: HY defaults US (blue), LatAm (grey) ..........................................................................47
Figure 32: Yields CEMBI HY vs. HG .............................................................................................47
Figure 33: Spreads CEMBI HY vs. HG ..........................................................................................48
Figure 34: Comparison of local Latin America USD HY funds ......................................................49
Figure 35: Top 15 largest (by AUM) Local Currency Latin America Domiciled Bond Funds .........51
Figure 36: Corporate bond Issuance in Asia by country of origin (in USD billion) .......................53
Figure 37: The global market for corporate bonds .....................................................................54
Figure 38: Asian bond issuance returns by issuer segment ........................................................55
Figure 39: Bond issuance breakdown by issuer segment across Asia .........................................56
Figure 40: Selection of Asian bond indices .................................................................................56
Figure 41: 10 year yields of Asian bonds versus developed markets ..........................................58
Figure 42: Issuance of Asian corporate bonds split by rating (USD millions)...............................59
Figure 43: Asian corporate credit spreads relative to US corporate bonds .................................60
Figure 44: Continuing expansion of Asian corporate bond universe ..........................................60
Figure 45: Asian local currency bonds universe (in USD billion) .................................................62
Figure 46: Growing size of the Asian (local currency) bond market* (in USD billion) ..................62
Figure 47: Asian USD investment grade bonds universe ............................................................63
Figure 48: Asian USD non-investment grade bonds universe .....................................................63
Figure 49: Growing size of the Asian (foreign currency) bond market* (in USD billion) ..............64
Figure 50: Comparison of global sales and earnings growth in 2010 ..........................................65
Figure 51: Key barriers to developing deep corporate bond markets in emerging economies ...68
AFRICAN HIGH YIELD CORPORATE BOND MARKET
5
1 EXECUTIVE SUMMARY
1.1 Introduction
This report analyses the African corporate bond market, covering specifically the following
aspects:
Overview of “High Yield” Corporate Bond Market (HY = BB+ & below)
Competitive Landscape: Bond funds which invest exclusively in “High Yield” issuances
Who are the main “High Yield” Corporate Bond holders (direct and indirect)?
Who are the main “High Yield” Corporate Bond holders in Latin America and Asia (direct and
indirect)?
1.2 Research methodology
We have approached the research for the African Corporate Bond Market in the following
ways:
Bottom up: We have obtained all the African Corporate Bond issuances that are listed on
Bloomberg. We are performing a detailed analysis of each of the individual bonds. We will
then drill upwards to better understand who the investors are in each of these bond
issuances.
Top Down: We are performing searches using various research platforms in order to
ascertain a list of the funds which invest in “High-Yield” bond issuances. Once this
information has been obtained we will drill downwards in order to obtain a list of “High
Yield” bond issuances.
We feel that by approaching this research in this way we will obtain a thorough understanding
of the High Yield Corporate Bond Market.
1.3 Africa bottom-up analysis
The 1,573 bonds were separated into various categories relevant to our analysis and we have
identified 230 sub-investment grade bonds ($34.5bn). We have also conducted a separate
analysis excluding South African bonds returned 446 corporate bonds with a combined value of
$33.4bn excluding South African Corporates, including 156 bonds in the extended sub-
investment grade category ($21.9bn) excluding South African Corporates.
We have identified the following key take insights from the analysis:
AFRICAN HIGH YIELD CORPORATE BOND MARKET
6
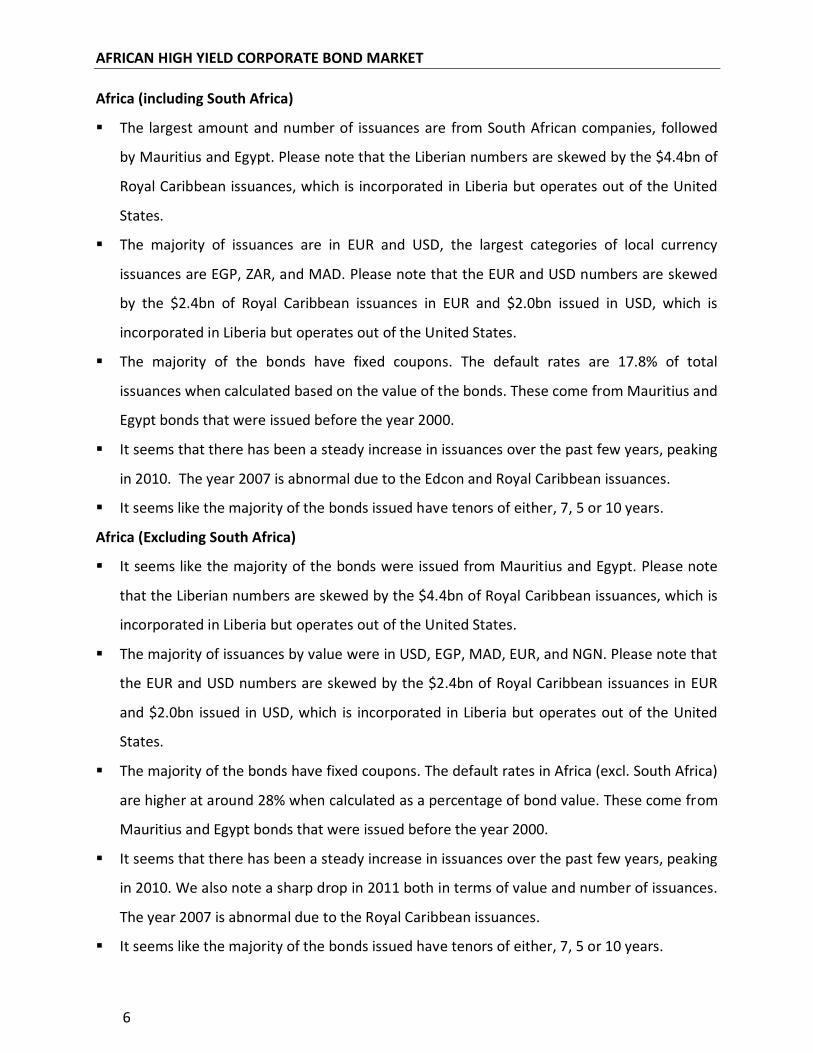
Africa (including South Africa)
The largest amount and number of issuances are from South African companies, followed
by Mauritius and Egypt. Please note that the Liberian numbers are skewed by the $4.4bn of
Royal Caribbean issuances, which is incorporated in Liberia but operates out of the United
States.
The majority of issuances are in EUR and USD, the largest categories of local currency
issuances are EGP, ZAR, and MAD. Please note that the EUR and USD numbers are skewed
by the $2.4bn of Royal Caribbean issuances in EUR and $2.0bn issued in USD, which is
incorporated in Liberia but operates out of the United States.
The majority of the bonds have fixed coupons. The default rates are 17.8% of total
issuances when calculated based on the value of the bonds. These come from Mauritius and
Egypt bonds that were issued before the year 2000.
It seems that there has been a steady increase in issuances over the past few years, peaking
in 2010. The year 2007 is abnormal due to the Edcon and Royal Caribbean issuances.
It seems like the majority of the bonds issued have tenors of either, 7, 5 or 10 years.
Africa (Excluding South Africa)
It seems like the majority of the bonds were issued from Mauritius and Egypt. Please note
that the Liberian numbers are skewed by the $4.4bn of Royal Caribbean issuances, which is
incorporated in Liberia but operates out of the United States.
The majority of issuances by value were in USD, EGP, MAD, EUR, and NGN. Please note that
the EUR and USD numbers are skewed by the $2.4bn of Royal Caribbean issuances in EUR
and $2.0bn issued in USD, which is incorporated in Liberia but operates out of the United
States.
The majority of the bonds have fixed coupons. The default rates in Africa (excl. South Africa)
are higher at around 28% when calculated as a percentage of bond value. These come from
Mauritius and Egypt bonds that were issued before the year 2000.
It seems that there has been a steady increase in issuances over the past few years, peaking
in 2010. We also note a sharp drop in 2011 both in terms of value and number of issuances.
The year 2007 is abnormal due to the Royal Caribbean issuances.
It seems like the majority of the bonds issued have tenors of either, 7, 5 or 10 years.
AFRICAN HIGH YIELD CORPORATE BOND MARKET
7
1.4 Africa top-down analysis
Looking forward there remain a number of hurdles that stand in the way of a significantly
deeper African corporate bond market (ex-South Africa), however, all interviewees expect the
market to continue to grow over the next 3-5 years. Amongst interviewees most expected
corporates to tap the LCY markets, with only the resource, infrastructure and banking sector
looking to tap the FCY markets, Importantly the introduction of Basel III is expected to decrease
the ability of banks across the continent to under-price bonds by a significant margin – and
should lead to further development of the bond market across the continent.
South Africa has already started to see the development of LCY HY Corporate funds focused
exclusively on the local market, with Investec starting to look to the rest of Africa for potential
corporate bond issuance. Opportunity exists for a fund in the LCY space that is able to
understand the credit risk behind various corporates (as most bonds are un-rated), and offer
exposure to more risk seeking investors (i.e. HNW, Private Banking and potentially Sovereign
Wealth Funds).
Please see section 3 for details on competitors active in in Africa, investors’ appetite and an
overview of each of the African markets.
1.5 Latin America
The Latin America (LatAm) region experienced strong growth in corporate bond issuance from
2009 onwards, predominantly due to the increase in demand from overseas investors as seen
by the large inflows of capital. The LatAm USD corporate bond market was c. USD280bn at the
end of 2011.
The high yield bond market represents on average 20% of the total corporate bond issuance in
the region. Local currency bonds are a small part of the market, reaching between 0.3% and
3.7% of the total market. The largest corporate bond markets (by value) in the region are Brazil
and Mexico.
The strong growth in the corporate bond market can be attributed to macroeconomic
stabilization and the privatization of pension systems in the region. In addition, regulatory
restrictions and reforms have played an important role in corporate bond financing.
The region saw strong yields of over 5% for investment grade bonds and over 11% for high yield
bonds prior to September 2011; however these yields have declined since to over 3% and 7%
AFRICAN HIGH YIELD CORPORATE BOND MARKET
8
respectively. The spread between High Yield and High Grade (HG) bonds from the CEMBI Broad
Latin America index was 460bps in August 2012 and seen a tightening of 14bps to date.
There are 3 types of bond funds in the region: USD, local currency and those that can choose
either such as The Fidelity New Markets Income fund. There are very few LatAm domiciled
funds focussing purely on high yield LatAm corporate bonds including Moneda, Lv Deuda
Latam, BTG Pactual, Celfin and Copernico. Majority of these funds are managed by the largest
banks and top hedge funds. They are onshore funds, listed locally, either open or closed ended
and have a Fitch Class 1 Level 4 rating. Investors in these funds tend to be local pension funds,
insurance companies and family offices.
On the other hand there are several overseas funds (USD) that invest in high yield bonds in
emerging markets including Latin America. Some of big name asset managers include BlackRock
High Yield Bond Fund, Baillie Gifford HY Bond Fund, Pimco Emerging Market Local Bond Fund,
AGF Global High Yield Bond Fund and Excel Latin America Bond Fund.
Local currency bond funds investing broadly into emerging market debt have done well over
the last few years, but the returns are declining as the market matures. The top 15 largest local
currency funds received returns of an average of 30% over the last 3 years, 12% over the last 1
year and 3% over the last 6 months.
1.6 Asia
The Asian financial crisis in 1997 caused Asian corporate bond markets to grow rapidly as Asian
borrowers switched from short-term bank loans to longer term debt financing. Across Asia,
bond market development varies considerably. In terms of amount of corporate bonds
outstanding, Japan, China and South Korea are the largest markets. The Asian Development
Bank has observed the emergence of a broader high yield corporate issuer base in Asia with
companies in energy, commodities, transportation, telecom and real estate beginning to
dominate the region’s high yield issuance base, as these sectors are experiencing strong
growth. In late September 2012, the FT reported an uptick in global funds directed to Asian
fixed income, as the higher growth and yields in Asia look increasingly attractive versus bond
markets in the US or Europe. The two major Asian bond indices are the HSBC Asian Bond Index
and the JPM JACI Index. The high yield portion of the JACI has grown from around 30% in 2006
to 39% in 2011. At the end of 2011, the global market for corporate bonds totalled about USD 4
trillion. However, Asia makes up less than 3%of this (USD 130 billion) – but this figure is
AFRICAN HIGH YIELD CORPORATE BOND MARKET
9
growing. Despite a challenging year in 2011, including the downgrade of the U.S. and trouble
brewing in the Eurozone, the JACI stayed positive and returned 4.12%. The investment grade
rated portion (61% of the index) returned 4.92% and the sub-investment grade rated portion
(39%) returned 2.85% - the index has returned 7% on an annualized basis between 2007 to
2011. The Asian bond markets can be broken down into two segments: (a) the regional bond
market in USD-denominated instruments; and (b) local currency bond markets. Since 2008, USD
275 billion or 86% of Asian corporate bond issuances have been those denominated in local
currencies.
The evolution of domestic (particularly local currency) bond markets in Asia has been a success
story. The main drivers of growth in these bond markets have been economic performance and
governmental promotion. Asian countries have weathered the global downtrend better than
the West due to strong economic fundamentals (i.e. lower fiscal deficits, lower debt ratios,
higher GDP growth) and Asian bonds provide for better yield n vs. developed markets. In
addition, there are currently three major government-sponsored initiatives in play; APEC -
which facilitates the development of securitization and credit guarantee mechanisms, ABMI -
which is creating regional market infrastructure (ratings agencies and settlement procedures)
and EMEAP - which pools and invests Asian forex reserves to stimulate local bond markets.
However, during the global financial crisis, major economies in Asia experienced sharp capital
outflows from their bond markets. Thus, Asian governments continue to consider ways to
develop Asian bond markets. ACMF, a forum of securities regulators, has drafted an
Implementation Plan for ASEAN member countries to achieve capital market integration. This
three-phased approach, with key milestones, is due to complete in 2015. It also remains to be
seen whether heightened interest in Asian high-yield corporate bonds is the outcome of the
search for yield in a low-interest rate environment or a structural shift towards greater
weighting of Asian bonds in global portfolios. Moreover, although domestic markets have been
doing well, the regional Asian bond market has yet to develop as much. Based on 2010 data,
90% of bonds issued by ASEAN+3 borrowers are either held outside the region or in their own
country. Consequently, at a roundtable in Manila in May 2012, Asian government
representatives noted the following work still required to develop deep and liquid corporate
bond markets in Asia:
Linking payment systems to incentivize interregional trading, settlement and custody.

AFRICAN HIGH YIELD CORPORATE BOND MARKET
10
The creation of a pan-Asian or regional credit ratings agency.
Standardization of practices in terms of offering, documentation.
Reciprocal regulatory approval to make cross-border issuance and marketing easier.
AFRICAN HIGH YIELD CORPORATE BOND MARKET
11
2 AFRICA BOTTOM UP ANALYSIS
For our bottom-up analysis of the African bond landscape we have analysed all the African
corporate bonds listed on Bloomberg. The Bloomberg download returned 1,573 corporate
bonds with a combined value of $120.2bn (We converted all non-USD bonds to USD).
For each bond we have downloaded the following categories:
Bond Bloomberg ID and Short name
Issuer industry and industry sub-group
Country of issuer
Currency of issue
Issue date
Maturity date and type
Size of issue
Coupon rate and type
Fitch, S&P, Moodys and GCR rating (we
included both national and international
rating scales where appropriate)
Current price
Current yield
Exchange where listed
2.1 Bond categories
The 1,573 bonds were separated into various categories relevant to our analysis. Refer to the
figure below for a breakdown of the bonds listed on Bloomberg.
Rated bonds: Out of the 1,573 corporate bonds, 179 bonds ($44.6bn) have ratings (all
ratings, including Withdrawn and Not Rated). The rest do not have any ratings data in
Bloomberg.
Rated sub-investment grade bonds: Out of the 179 rated bonds, 93 bonds ($22.1bn) have
been identified as sub-investment grade. When national rating scales were provided,
equivalent international ratings were determined in order to identify sub-investment grade
bonds.
Assumed sub-investment grade bonds: We have classified an additional 137 bonds
($12.5bn) as sub-investment grade even though they did not have any ratings. These
assumed sub-investment grade bonds where individually identified based on our knowledge
of the individual companies or if they were issued from a country with a sub-investment
grade sovereign rating.
AFRICAN HIGH YIELD CORPORATE BOND MARKET
12
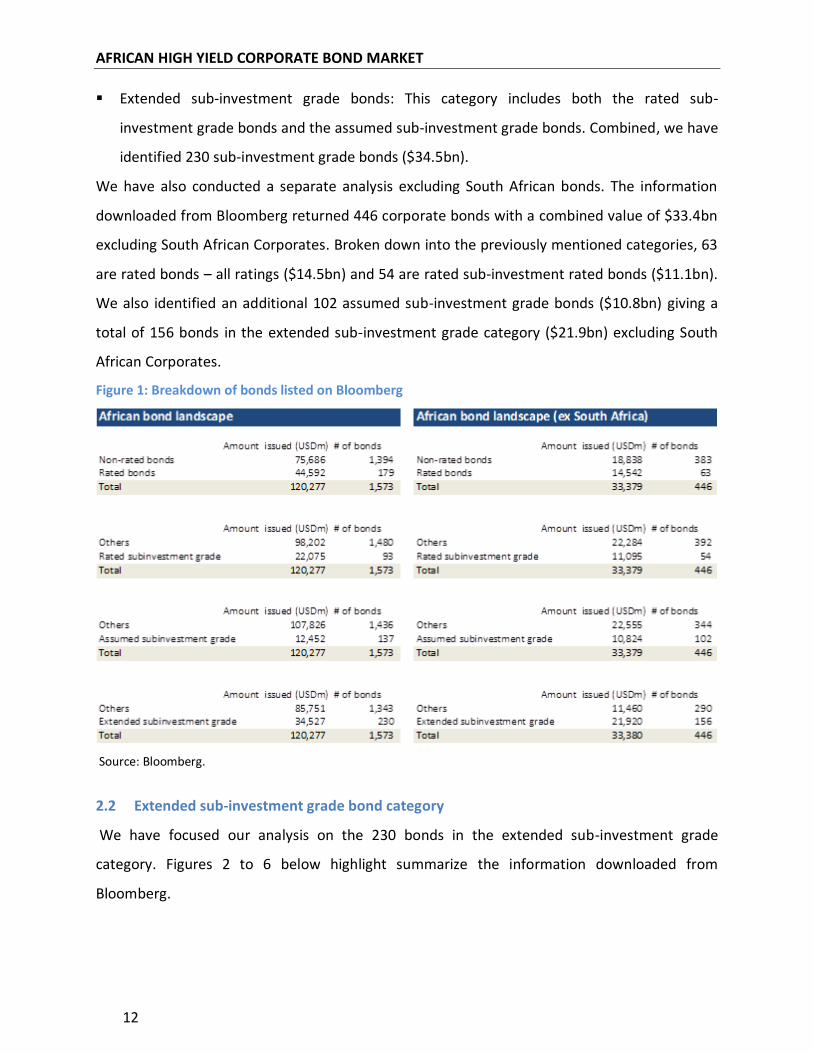
Extended sub-investment grade bonds: This category includes both the rated sub-
investment grade bonds and the assumed sub-investment grade bonds. Combined, we have
identified 230 sub-investment grade bonds ($34.5bn).
We have also conducted a separate analysis excluding South African bonds. The information
downloaded from Bloomberg returned 446 corporate bonds with a combined value of $33.4bn
excluding South African Corporates. Broken down into the previously mentioned categories, 63
are rated bonds – all ratings ($14.5bn) and 54 are rated sub-investment rated bonds ($11.1bn).
We also identified an additional 102 assumed sub-investment grade bonds ($10.8bn) giving a
total of 156 bonds in the extended sub-investment grade category ($21.9bn) excluding South
African Corporates.
Figure 1: Breakdown of bonds listed on Bloomberg
Source: Bloomberg.
2.2 Extended sub-investment grade bond category
We have focused our analysis on the 230 bonds in the extended sub-investment grade
category. Figures 2 to 6 below highlight summarize the information downloaded from
Bloomberg.
AFRICAN HIGH YIELD CORPORATE BOND MARKET
13
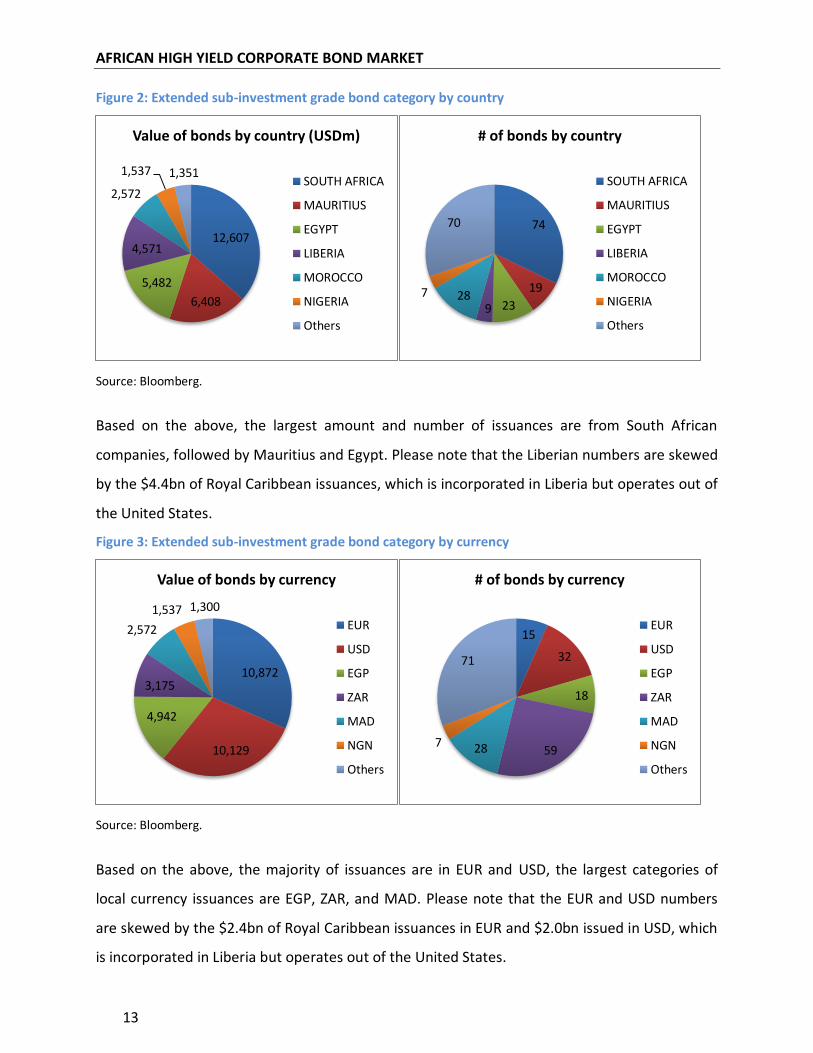
Figure 2: Extended sub-investment grade bond category by country
Source: Bloomberg.
Based on the above, the largest amount and number of issuances are from South African
companies, followed by Mauritius and Egypt. Please note that the Liberian numbers are skewed
by the $4.4bn of Royal Caribbean issuances, which is incorporated in Liberia but operates out of
the United States.
Figure 3: Extended sub-investment grade bond category by currency
Source: Bloomberg.
Based on the above, the majority of issuances are in EUR and USD, the largest categories of
local currency issuances are EGP, ZAR, and MAD. Please note that the EUR and USD numbers
are skewed by the $2.4bn of Royal Caribbean issuances in EUR and $2.0bn issued in USD, which
is incorporated in Liberia but operates out of the United States.
12,607
6,408
5,482
4,571
2,572
1,537 1,351
Value of bonds by country (USDm)
SOUTH AFRICA
MAURITIUS
EGYPT
LIBERIA
MOROCCO
NIGERIA
Others
74
19
23 9 28 7
70
# of bonds by country
SOUTH AFRICA
MAURITIUS
EGYPT
LIBERIA
MOROCCO
NIGERIA
Others
10,872
10,129
4,942
3,175
2,572
1,537 1,300
Value of bonds by currency
EUR
USD
EGP
ZAR
MAD
NGN
Others
15
32
18
59 28 7
71
# of bonds by currency
EUR
USD
EGP
ZAR
MAD
NGN
Others
AFRICAN HIGH YIELD CORPORATE BOND MARKET
14
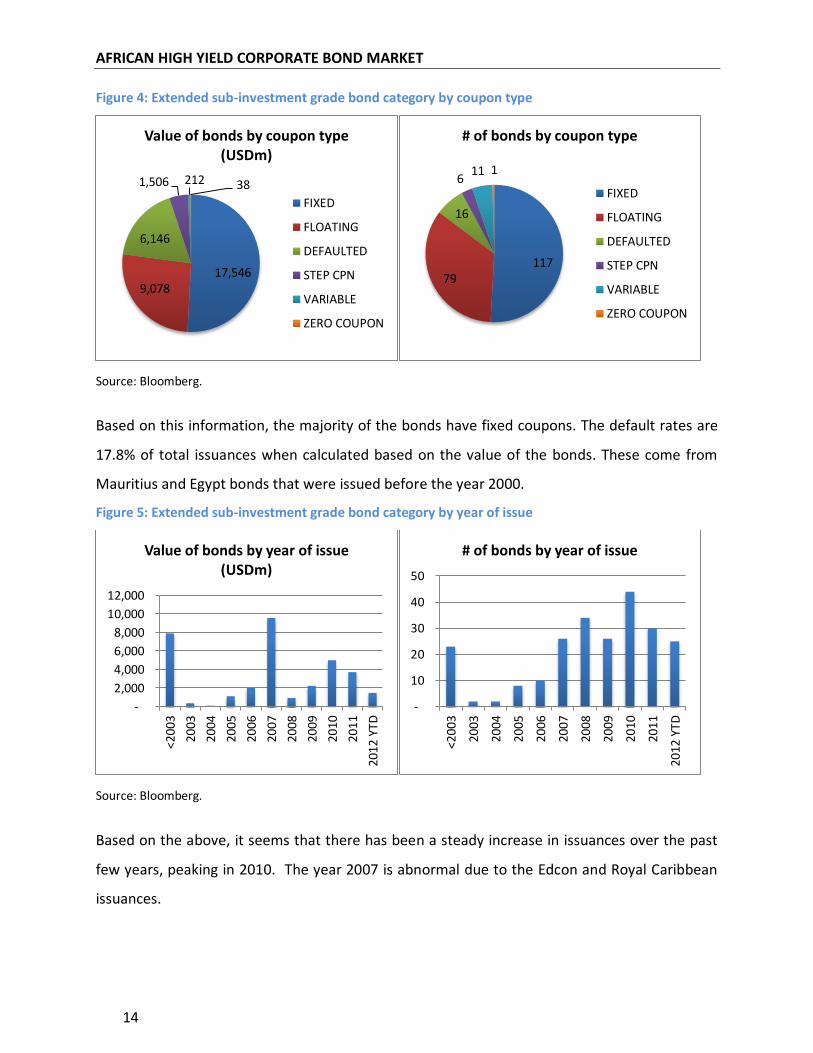
Figure 4: Extended sub-investment grade bond category by coupon type
Source: Bloomberg.
Based on this information, the majority of the bonds have fixed coupons. The default rates are
17.8% of total issuances when calculated based on the value of the bonds. These come from
Mauritius and Egypt bonds that were issued before the year 2000.
Figure 5: Extended sub-investment grade bond category by year of issue
Source: Bloomberg.
Based on the above, it seems that there has been a steady increase in issuances over the past
few years, peaking in 2010. The year 2007 is abnormal due to the Edcon and Royal Caribbean
issuances.
17,546 9,078
6,146
1,506 212 38
Value of bonds by coupon type (USDm)
FIXED
FLOATING
DEFAULTED
STEP CPN
VARIABLE
ZERO COUPON
117 79
16
6 11 1
# of bonds by coupon type
FIXED
FLOATING
DEFAULTED
STEP CPN
VARIABLE
ZERO COUPON
-
2,000
4,000
6,000
8,000
10,000
12,000
<200
3
2003
2004
2005
2006
2007
2008
2009
2010
2011
2012
YTD
Value of bonds by year of issue (USDm)
-
10
20
30
40
50
<200
3
2003
2004
2005
2006
2007
2008
2009
2010
2011
2012
YTD
# of bonds by year of issue
AFRICAN HIGH YIELD CORPORATE BOND MARKET
15
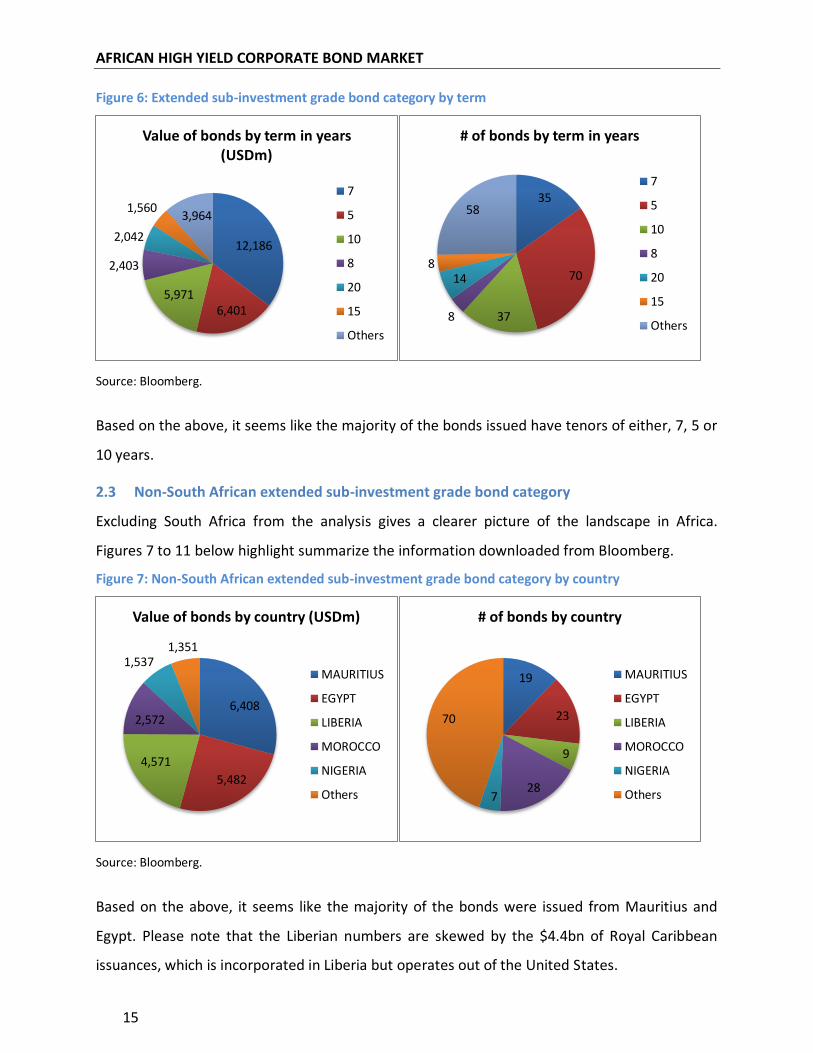
Figure 6: Extended sub-investment grade bond category by term
Source: Bloomberg.
Based on the above, it seems like the majority of the bonds issued have tenors of either, 7, 5 or
10 years.
2.3 Non-South African extended sub-investment grade bond category
Excluding South Africa from the analysis gives a clearer picture of the landscape in Africa.
Figures 7 to 11 below highlight summarize the information downloaded from Bloomberg.
Figure 7: Non-South African extended sub-investment grade bond category by country
Source: Bloomberg.
Based on the above, it seems like the majority of the bonds were issued from Mauritius and
Egypt. Please note that the Liberian numbers are skewed by the $4.4bn of Royal Caribbean
issuances, which is incorporated in Liberia but operates out of the United States.
12,186
6,401 5,971
2,403
2,042
1,560 3,964
Value of bonds by term in years (USDm)
7
5
10
8
20
15
Others
35
70
37 8
14 8
58
# of bonds by term in years
7
5
10
8
20
15
Others
6,408
5,482
4,571
2,572
1,537 1,351
Value of bonds by country (USDm)
MAURITIUS
EGYPT
LIBERIA
MOROCCO
NIGERIA
Others
19
23
9
28 7
70
# of bonds by country
MAURITIUS
EGYPT
LIBERIA
MOROCCO
NIGERIA
Others
AFRICAN HIGH YIELD CORPORATE BOND MARKET
16
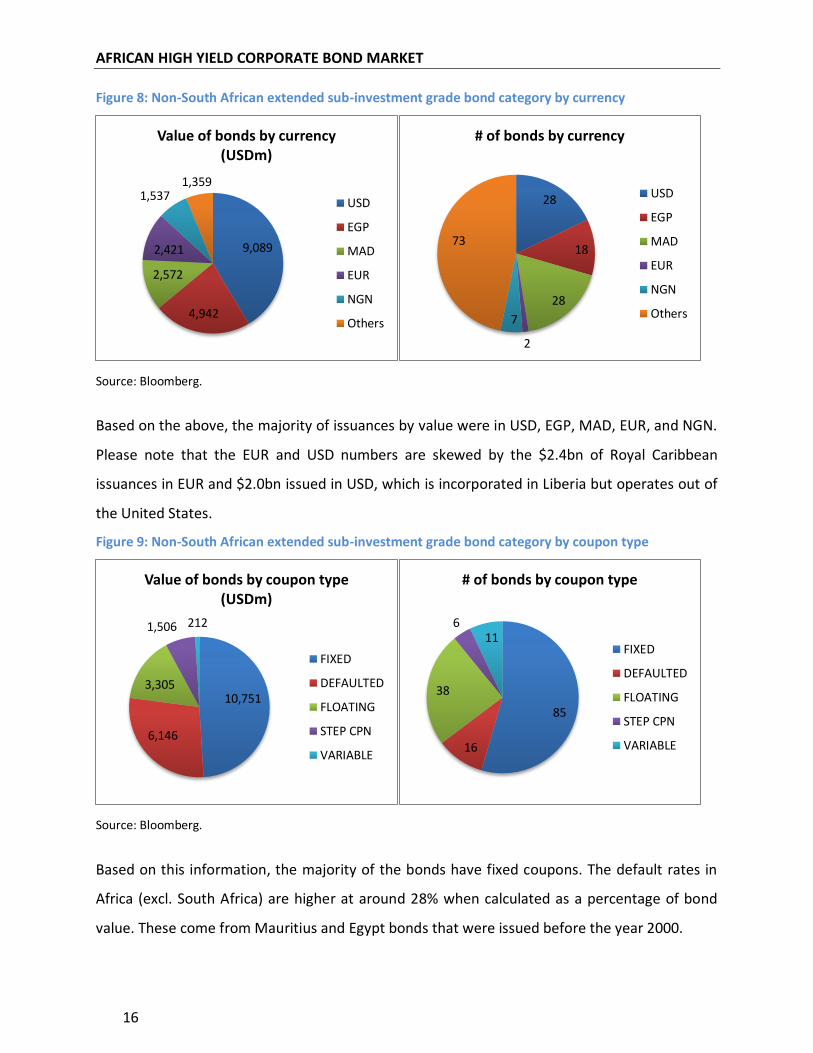
Figure 8: Non-South African extended sub-investment grade bond category by currency
Source: Bloomberg.
Based on the above, the majority of issuances by value were in USD, EGP, MAD, EUR, and NGN.
Please note that the EUR and USD numbers are skewed by the $2.4bn of Royal Caribbean
issuances in EUR and $2.0bn issued in USD, which is incorporated in Liberia but operates out of
the United States.
Figure 9: Non-South African extended sub-investment grade bond category by coupon type
Source: Bloomberg.
Based on this information, the majority of the bonds have fixed coupons. The default rates in
Africa (excl. South Africa) are higher at around 28% when calculated as a percentage of bond
value. These come from Mauritius and Egypt bonds that were issued before the year 2000.
9,089
4,942
2,572
2,421
1,537 1,359
Value of bonds by currency (USDm)
USD
EGP
MAD
EUR
NGN
Others
28
18
28
2
7
73
# of bonds by currency
USD
EGP
MAD
EUR
NGN
Others
10,751
6,146
3,305
1,506 212
Value of bonds by coupon type (USDm)
FIXED
DEFAULTED
FLOATING
STEP CPN
VARIABLE
85
16
38
6 11
# of bonds by coupon type
FIXED
DEFAULTED
FLOATING
STEP CPN
VARIABLE
AFRICAN HIGH YIELD CORPORATE BOND MARKET
17
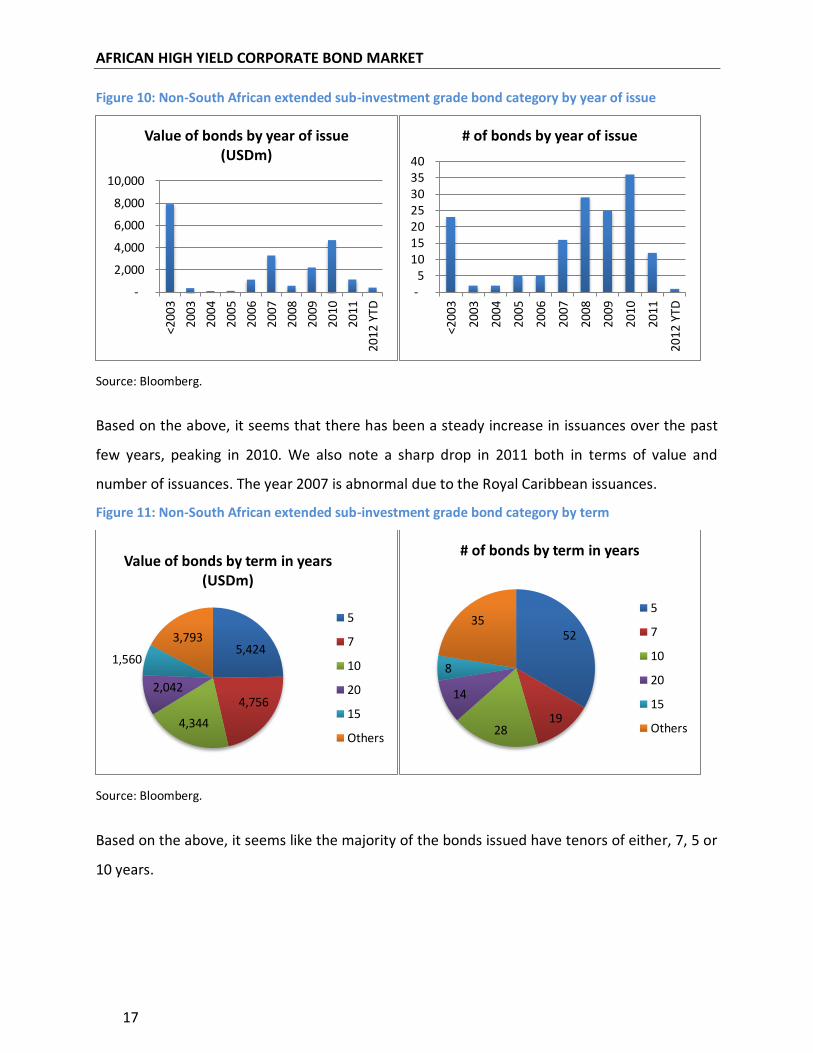
Figure 10: Non-South African extended sub-investment grade bond category by year of issue
Source: Bloomberg.
Based on the above, it seems that there has been a steady increase in issuances over the past
few years, peaking in 2010. We also note a sharp drop in 2011 both in terms of value and
number of issuances. The year 2007 is abnormal due to the Royal Caribbean issuances.
Figure 11: Non-South African extended sub-investment grade bond category by term
Source: Bloomberg.
Based on the above, it seems like the majority of the bonds issued have tenors of either, 7, 5 or
10 years.
-
2,000
4,000
6,000
8,000
10,000<2
003
2003
2004
2005
2006
2007
2008
2009
2010
2011
2012
YTD
Value of bonds by year of issue (USDm)
- 5
10 15 20 25 30 35 40
<200
3
2003
2004
2005
2006
2007
2008
2009
2010
2011
2012
YTD
# of bonds by year of issue
5,424
4,756
4,344
2,042
1,560
3,793
Value of bonds by term in years (USDm)
5
7
10
20
15
Others
52
19 28
14
8
35
# of bonds by term in years
5
7
10
20
15
Others
AFRICAN HIGH YIELD CORPORATE BOND MARKET
18
2.4 Bondholder Analysis
In order to obtain information relating to the investors who hold sub-investment grade bonds,
we performed the following analysis:
Bloomberg Data - we were able to obtain bondholder information directly from Bloomberg;
Exchanges where bonds are listed – we contacted all exchanges which have sub-
investment grade bonds listed on them to request bondholder information;
Bond issuers – we sent emails directly to those companies who have issued sub-investment
grade bonds.
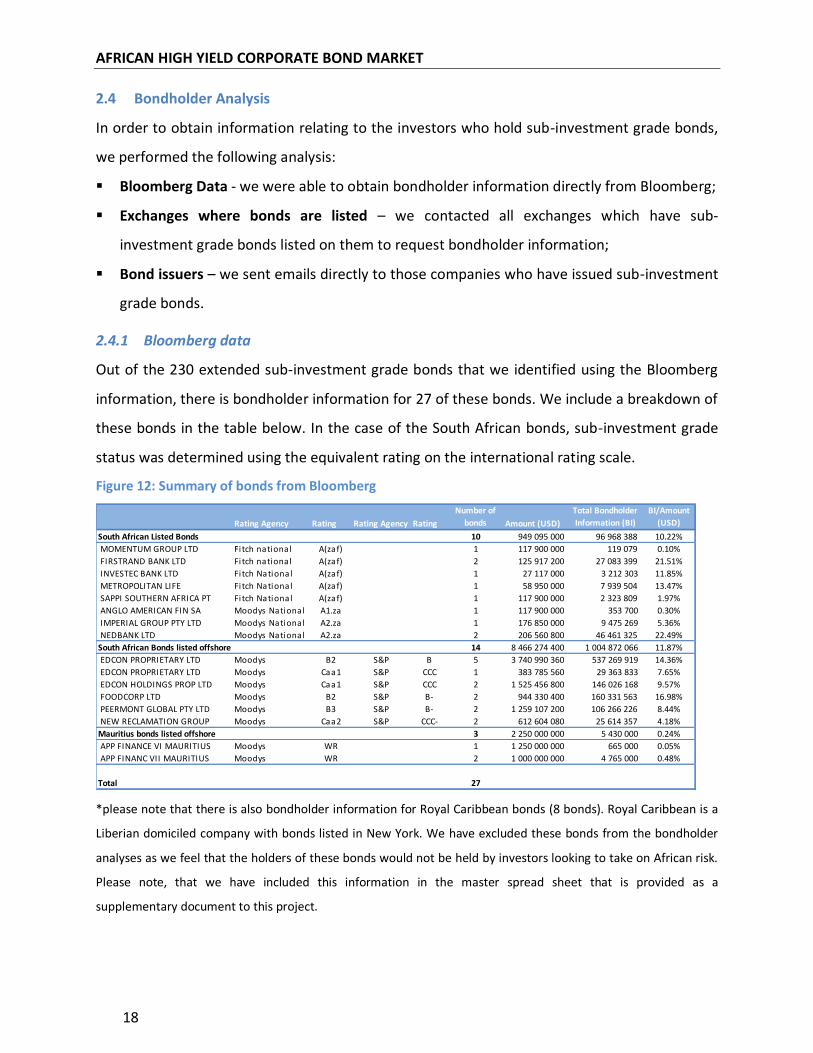
2.4.1 Bloomberg data
Out of the 230 extended sub-investment grade bonds that we identified using the Bloomberg
information, there is bondholder information for 27 of these bonds. We include a breakdown of
these bonds in the table below. In the case of the South African bonds, sub-investment grade
status was determined using the equivalent rating on the international rating scale.
Figure 12: Summary of bonds from Bloomberg
*please note that there is also bondholder information for Royal Caribbean bonds (8 bonds). Royal Caribbean is a
Liberian domiciled company with bonds listed in New York. We have excluded these bonds from the bondholder
analyses as we feel that the holders of these bonds would not be held by investors looking to take on African risk.
Please note, that we have included this information in the master spread sheet that is provided as a
supplementary document to this project.
Summary of bonds from Bloomberg
Rating Agency Rating Rating Agency Rating
Number of
bonds Amount (USD)
Total Bondholder
Information (BI)
BI/Amount
(USD)
South African Listed Bonds 10 949 095 000 96 968 388 10.22%
MOMENTUM GROUP LTD Fitch national A(zaf) 1 117 900 000 119 079 0.10%
FIRSTRAND BANK LTD Fitch national A(zaf) 2 125 917 200 27 083 399 21.51%
INVESTEC BANK LTD Fitch National A(zaf) 1 27 117 000 3 212 303 11.85%
METROPOLITAN LIFE Fitch National A(zaf) 1 58 950 000 7 939 504 13.47%
SAPPI SOUTHERN AFRICA PT Fitch National A(zaf) 1 117 900 000 2 323 809 1.97%
ANGLO AMERICAN FIN SA Moodys National A1.za 1 117 900 000 353 700 0.30%
IMPERIAL GROUP PTY LTD Moodys National A2.za 1 176 850 000 9 475 269 5.36%
NEDBANK LTD Moodys National A2.za 2 206 560 800 46 461 325 22.49%
South African Bonds listed offshore 14 8 466 274 400 1 004 872 066 11.87%
EDCON PROPRIETARY LTD Moodys B2 S&P B 5 3 740 990 360 537 269 919 14.36%
EDCON PROPRIETARY LTD Moodys Caa1 S&P CCC 1 383 785 560 29 363 833 7.65%
EDCON HOLDINGS PROP LTD Moodys Caa1 S&P CCC 2 1 525 456 800 146 026 168 9.57%
FOODCORP LTD Moodys B2 S&P B- 2 944 330 400 160 331 563 16.98%
PEERMONT GLOBAL PTY LTD Moodys B3 S&P B- 2 1 259 107 200 106 266 226 8.44%
NEW RECLAMATION GROUP Moodys Caa2 S&P CCC- 2 612 604 080 25 614 357 4.18%
Mauritius bonds listed offshore 3 2 250 000 000 5 430 000 0.24%
APP FINANCE VI MAURITIUS Moodys WR 1 1 250 000 000 665 000 0.05%
APP FINANC VII MAURITIUS Moodys WR 2 1 000 000 000 4 765 000 0.48%
Total 27
AFRICAN HIGH YIELD CORPORATE BOND MARKET
19
It is important to note that this analysis is not exhaustive as the information in Bloomberg is
limited (bond holder information only representing 10% of the total issue size). Based on this
information, funds that hold investments greater than US$1 million are listed below:
Metropolitan Income Plus Portfolio
Nedbank Bond Fund
Nedgroup Investments Optimal Income
Fund
Cadiz Collective Investment-Absolute
Yield Fund
Community Gilt Fund (managed by Old
Mutual)
Old Mutual Enhanced Income Fund
Old Mutual Income Fund
Stanlib Bond Fund
Stanlib Income Fund
Stanlib Multi-Manager Absolute Income
Fund
Stanlib Managed Flexible Fund
Investec Absolute Income Fund
Investec Opportunity Income Fund
Momentum Diversified Yield Fund
Momentum Maximum Income Fund
Sanlam Absolute Return Income Fund
Investment Solutions Income Fund
Investment Solutions Pure Fixed Interest
Fund
Prudential Inflation Plus fund
Personal Trust Income Fund
Allan Gray Balanced Fund
As can be seen, the list above is made up of the larger asset managers and institutions in South
Africa. There is overlap between this list of funds as well as the funds that were identified
during the interviews that were conducted.
It is also interesting to note that funds managed by BNP Paribas, Fortis and Swisscanto hold
stakes in the Momentum Group Limited bond which is a LCY issuance.
We have also analysed the list of bond holders of South African sub-investment grade bonds
which are listed offshore (FCY bonds). As before, it is important to note that the Bloomberg
information is limited. We only have bondholder information for 12% of the bond’s total value.
We have listed funds that have investments greater than US$10 million below:
AFRICAN HIGH YIELD CORPORATE BOND MARKET
20
Franklin Templeton Investment Funds –
Templeton Global Total Return
Franklin Templeton Investment Funds –
Templeton Emerging Markets Bond Fund
Franklin Templeton Investment Funds -
Templeton Emerging Markets Income
Fund
Sparinvest – High Yield Value Bonds
Sparinvest Global Value
Sparinvest High Yield Value Bonds UDB
Alliance Bernstein – Global High Yield
Portfolio
Alliance Bernstein – High Income Fund
Goldman Sachs Global Emerging Markets
Debt
Goldman Sachs Global High Yield
Portfolio
Goldman Sachs High Yield Fund
Mellon Investment Funds ICVC – Newton
Balanced Fund
Mellon Investment Funds ICVC – Newton
Real Return
Legal & General High Income Trust
Aberdeen Investment Services -
Aberdeen Global – Euro High Yield Bond
Blackrock Asset Management - iShares
Markit IBOXX Euro High Yield Bond
Swisscanto (CH) Institutional Bond fund
– Global High Yield
Petercam L-Bonds Higher Yield
Artemis Strategic Bond Fund
Pioneer Global High Yield Fund
Pimco Global High Yield Bond Fund
Pimco High Yield Spectrum Fund
Picet-Euro Short Term High Yield
As can be seen from the above, most of these funds are managed by large global asset
managers. Furthermore, it seems that the funds that invest in South African sub-investment
grade FCY bonds do so as part of global (and in some cases, emerging market) focused funds.
Accordingly, from this information it does seem that there are any funds which are purely
focused on making high.
Finally, for the 3 bonds which are listed in Mauritius we obtained a list of the funds that have
invested in these bonds. This analysis is very limited as there was only bondholder information
in relation to 0.25% of these bonds. Nevertheless, we identified the following bonds using this
analysis:
Worldwide Investors – Emerging Markets Fixed Income
Prudential Insurance Company of America
UOB Optimix Asian Bond Funds
AFRICAN HIGH YIELD CORPORATE BOND MARKET
21
2.4.2 Exchanges where bonds are listed
We tried to supplement the above information by contacting 11 bond exchanges requesting
information requesting information relating to the holders of the bonds listed on their
respective exchanges. We requested bondholder information for the extended set of sub-
investment grade bonds. This approach was not successful and we were advised by the various
exchanges that they cannot release the information and suggested that we contact the
respective companies individually in order to obtain this information.
2.4.3 Bond issuers
Accordingly, we have emailed 54 companies directly and we have requested details regarding
their bondholders. These 54 companies have issued 104 bonds between them. We had tried to
obtain contact details for 70 companies (representing 130 bonds) but we could not obtain
contact email addresses or our emails were returned when we contacted these companies.
The feedback that we have received thus far from the companies that we have contacted has
not been positive. The companies that we have heard back from have stated that they do not
track their bond holders or that they would not be prepared to share the bondholder
information.
We have been successful in obtaining information in relation to bond holders from only one
company which has bonds listed in Rwanda - Banque Commerciale du Rwanda. They have
responding by stating that the holders of their bonds include 3 local insurance companies:
Compagnie Rwandaise d'Assurances et de Réassurance
Soras Group Limited
Societe Nouvelle d'Assurances du Rwanda
Rwanda Social Security Board which administers social security in Rwanda (equivalent of a
national pension fund)
AFRICAN HIGH YIELD CORPORATE BOND MARKET
22
3 AFRICA TOP-DOWN ANALYSIS
3.1 Introduction & Methodology
The African Corporate bond market can be broken down into three distinct segments:
South Africa, with a deep and established bond market (both FCY and LCY), a large and
established investor base. The South African market has seen strong growth in HY
Corporate bond issuance, with Investec analysts expecting the HY market to increase ten-
fold over the next five years (from a current ZAR1.5b per annum to a forecast ZAR15b in
2015) – largely in LCY issuance.
Rest of Saharan African, where corporate bond activity has been mainly limited to Nigeria
most recently, alongside Kenya and Botswana historically – currently only Botswana,
Namibia and Mauritius have IG status amongst SSA nations, thus all corporate activity
outside of these countries is HY by definition.
North Africa: Led by Egypt these markets form a middle ground between the deeper South
African market and newer SSA (ex-SA) market. Discussions with investors have indicated
that North African debt is largely viewed as part of a MENA proposition and distinct from
SSA. Additionally, recent and continued turmoil across the region have significantly limited
investor demand for North African assets
For the purpose of this paper, we considered the development of the South African and Sub-
Saharan African market only. We complemented desktop research with a total of 13 interviews
with three specific segments of the bond market, specifically – interview notes from all
participants will be made available:
Debt Origination and Sales: Goldman Sachs, Standard Chartered Bank, Standard Bank,
Investec, Rand Merchant Bank, Nedbank and one other international bank
International Funds: Stone Harbor, Threadneedle and BlueBay
South African Funds: Stanlib, FutureGrowth and Sanlam
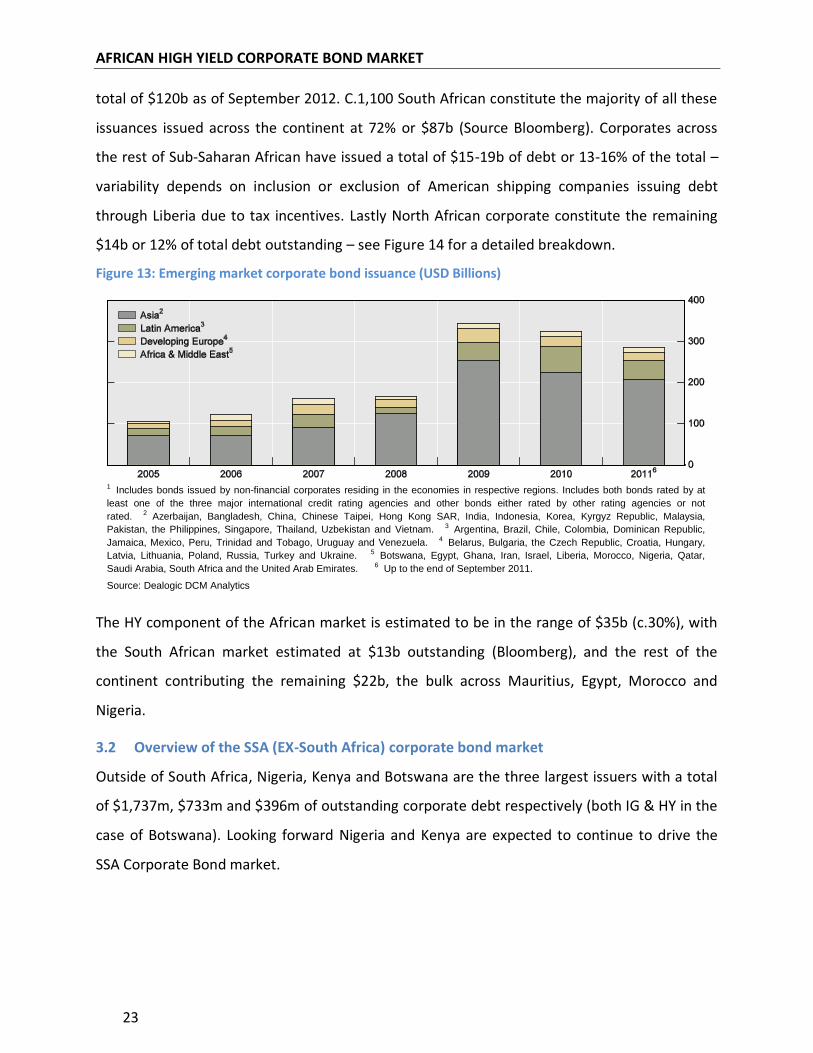
Despite a growing appetite amongst investors for EM Corporate debt, Africa continues to lag
the more established emerging markets of Asia and Latin America. Over a period of five years,
through to the end of September 2011, Corporate Bond issuance across MEA (Middle East &
Africa) contributed on average 2-3% of all emerging market issuance (c. $8-12b per annum) –
See Figure 13. Across the continent, c.1500 bonds have been issued (both IG and HY) worth a
AFRICAN HIGH YIELD CORPORATE BOND MARKET
23
total of $120b as of September 2012. C.1,100 South African constitute the majority of all these
issuances issued across the continent at 72% or $87b (Source Bloomberg). Corporates across
the rest of Sub-Saharan African have issued a total of $15-19b of debt or 13-16% of the total –
variability depends on inclusion or exclusion of American shipping companies issuing debt
through Liberia due to tax incentives. Lastly North African corporate constitute the remaining
$14b or 12% of total debt outstanding – see Figure 14 for a detailed breakdown.
Figure 13: Emerging market corporate bond issuance (USD Billions)
The HY component of the African market is estimated to be in the range of $35b (c.30%), with
the South African market estimated at $13b outstanding (Bloomberg), and the rest of the
continent contributing the remaining $22b, the bulk across Mauritius, Egypt, Morocco and
Nigeria.
3.2 Overview of the SSA (EX-South Africa) corporate bond market
Outside of South Africa, Nigeria, Kenya and Botswana are the three largest issuers with a total
of $1,737m, $733m and $396m of outstanding corporate debt respectively (both IG & HY in the
case of Botswana). Looking forward Nigeria and Kenya are expected to continue to drive the
SSA Corporate Bond market.
BIS Papers No 63 7
Graph 1
Emerging market corporate bond issuance1
In billions of US dollars
1 Includes bonds issued by non-financial corporates residing in the economies in respective regions. Includes both bonds rated by at
least one of the three major international credit rating agencies and other bonds either rated by other rating agencies or not
rated. 2 Azerbaijan, Bangladesh, China, Chinese Taipei, Hong Kong SAR, India, Indonesia, Korea, Kyrgyz Republic, Malaysia,
Pakistan, the Philippines, Singapore, Thailand, Uzbekistan and Vietnam. 3 Argentina, Brazil, Chile, Colombia, Dominican Republic,
Jamaica, Mexico, Peru, Trinidad and Tobago, Uruguay and Venezuela. 4 Belarus, Bulgaria, the Czech Republic, Croatia, Hungary,
Latvia, Lithuania, Poland, Russia, Turkey and Ukraine. 5 Botswana, Egypt, Ghana, Iran, Israel, Liberia, Morocco, Nigeria, Qatar,
Saudi Arabia, South Africa and the United Arab Emirates. 6 Up to the end of September 2011.
Source: Dealogic DCM Analytics
Despite declining issuance of internationally rated bonds through 2008, the amount of emerging Asian corporate bond issuances unrated or rated only by local credit rating agencies increased from 2005 to 2009 (Table 1, bottom two rows). This suggests that the corporate bond market in the region, supported by local rating agencies as well as local investors, may have fulfilled a “spare tyre” function for corporate financing during the crisis, insuring against fluctuating sentiment in global markets as well as slowing banking credit.
Graph 2
Amount outstanding of bonds issued by corporates
Levels, in billions of US dollars1 As a percentage of 2010 GDP
1
AU = Australia; CN = China; HK = Hong Kong SAR; ID = Indonesia; IN = India; JP = Japan; KR = Korea; MY = Malaysia;
SG = Singapore; TH = Thailand.
1 Economies are listed, in descending order, according to the size of amount outstanding as of Q1 2011.
Source: BIS.
AFRICAN HIGH YIELD CORPORATE BOND MARKET
24
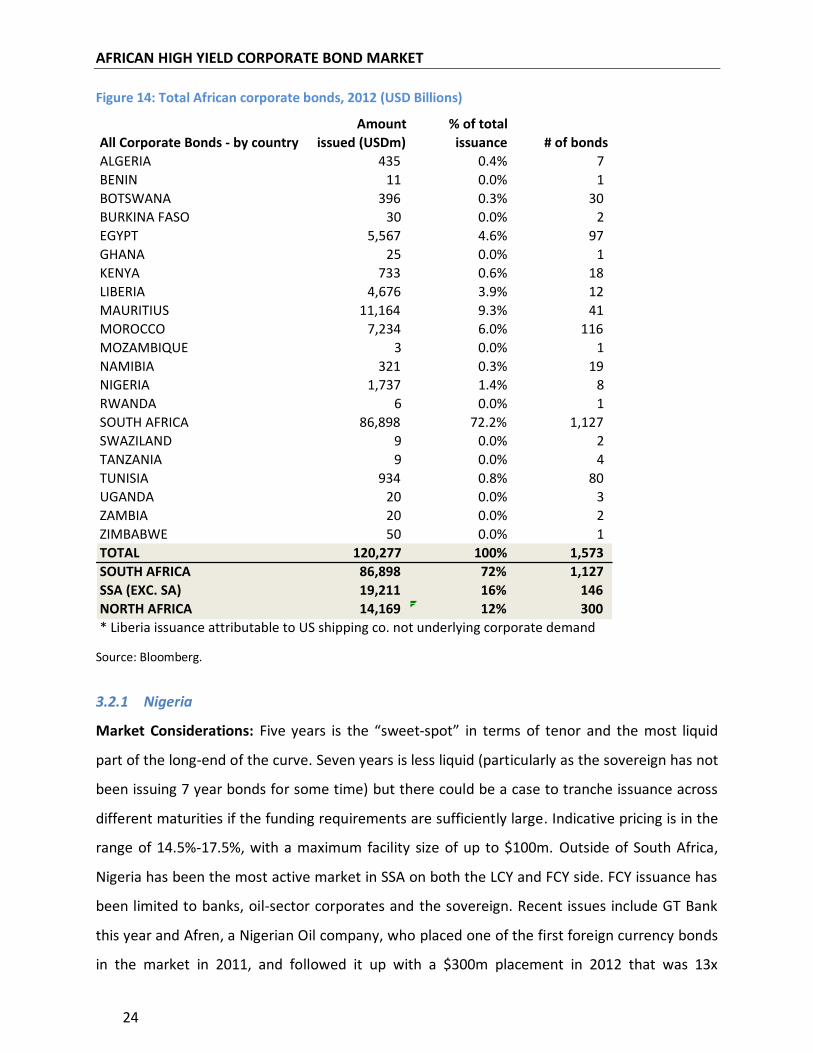
Figure 14: Total African corporate bonds, 2012 (USD Billions)
Source: Bloomberg.
3.2.1 Nigeria
Market Considerations: Five years is the “sweet-spot” in terms of tenor and the most liquid
part of the long-end of the curve. Seven years is less liquid (particularly as the sovereign has not
been issuing 7 year bonds for some time) but there could be a case to tranche issuance across
different maturities if the funding requirements are sufficiently large. Indicative pricing is in the
range of 14.5%-17.5%, with a maximum facility size of up to $100m. Outside of South Africa,
Nigeria has been the most active market in SSA on both the LCY and FCY side. FCY issuance has
been limited to banks, oil-sector corporates and the sovereign. Recent issues include GT Bank
this year and Afren, a Nigerian Oil company, who placed one of the first foreign currency bonds
in the market in 2011, and followed it up with a $300m placement in 2012 that was 13x
AllCorporateBonds-bycountry
Amount
issued(USDm)
%oftotal
issuance #ofbonds
ALGERIA 435 0.4% 7
BENIN 11 0.0% 1
BOTSWANA 396 0.3% 30
BURKINAFASO 30 0.0% 2
EGYPT 5,567 4.6% 97
GHANA 25 0.0% 1
KENYA 733 0.6% 18
LIBERIA 4,676 3.9% 12
MAURITIUS 11,164 9.3% 41
MOROCCO 7,234 6.0% 116
MOZAMBIQUE 3 0.0% 1
NAMIBIA 321 0.3% 19
NIGERIA 1,737 1.4% 8
RWANDA 6 0.0% 1
SOUTHAFRICA 86,898 72.2% 1,127
SWAZILAND 9 0.0% 2
TANZANIA 9 0.0% 4
TUNISIA 934 0.8% 80
UGANDA 20 0.0% 3
ZAMBIA 20 0.0% 2
ZIMBABWE 50 0.0% 1
TOTAL 120,277 100% 1,573
SOUTHAFRICA 86,898 72% 1,127
SSA(EXC.SA) 19,211 16% 146
NORTHAFRICA 14,169 12% 300
*LiberiaissuanceattributabletoUSshippingco.notunderlyingcorporatedemand
AFRICAN HIGH YIELD CORPORATE BOND MARKET
25
oversubscribed – to appeal to international investors the bond was listed in Luxembourg with
the required RegS and 144A documentation.
The corporate LCY market is limited to local banks and pension funds, although investor
demand is muted, local regulation limits foreign investors from accessing the market. Liquidity
in the market is almost non-existent with most investors holding to maturity. See African LCY
issuance PPT for a full breakdown of current Nigerian corporate bonds outstanding.
Looking forward: Strong growth on the LCY issuance side is expected in Nigeria, with interest
rates expected to stabilize and exchange rates expected to hold flat with the dollar (c 161-163
NGN/USD). Nigeria is likely to join the JP Morgan Government Bond Index – Emerging Markets
(GBI-EM) Government Bond Index-Emerging Markets towards the end of this year, early 2013.
This is likely to drive a significant inflow of funds to the sovereign bonds, and increase investor
acceptance of Nigerian paper. Key hurdle however, as with most countries outside of South
Africa, is accounting and governance standards across the corporates who are looking to come
to the market. Despite this the government continues to try and deepen the LCY bond market
and in April 2012, NASD limited, who operate the Nigeria OTC platform, announced that they
have shortlisted 3 vendors to develop a electronic trading platform by the end of 2012 / first
quarter of 2013.
3.2.2 Kenya
Market Considerations: There is a preference for fixed issues as the market is liquidity driven.
The market tends to be quite selective with a great focus is on the quality of the credit. Local
Asset Managers tend to prefer longer tenors (can consider 5 to 10 years). When investing in this
market, considerations need to be given to the approval of the Capital Markets Authority and
NSE requirements. The market is significantly influenced by local funds managers and banks –
largely due to the small size of the banking and investor community. Currently, the local market
is awash with excess liquidity but despite this we are seeing rates tick up due to inflationary
pressures. Import duty for wheat and maize for private millers have been removed to quell
inflationary pressures. Government has attempted to issue a FCY sovereign bond since 2008,
but without success thus far. 2010 saw the Kenyan government introduce an automated
trading to support the corporate bond market (initially with 10 corporate bonds listed),
reducing processing and settlement from seven to three days.
AFRICAN HIGH YIELD CORPORATE BOND MARKET
26
It seems that the preferred tenor is 3-7 years for local issuance in LCY, (although as highlighted
up to 10 can be considered) The current reference rate is the 364 days T-bill (6.93%), with
average spread in the range of 100-350bps over. Maximum facility size in the market is c. $90-
330m thus far. The market is largely illiquid with most investors holding bonds through to
maturity.
Looking forward: There has been limited bond issuance from Kenyan corporates due to high
interest rates (combat inflationary environment), which has resulted in a lack of demand for
bonds. There has only been one issuance over the last two years (Shelter Afrique). Action on
behalf of the central bank seems to have gone some way to quell inflationary environment, and
bankers expect a more robust issuance market from 2013 onwards. Local demand for corporate
bonds remains healthy, with most local asset manager’s dedicating c.60% of AuM to fixed
income. Bankers expect limited interest in the LCY Corporate bond market from International
investors, partially due to risk appetite; lack of documentation at levels preferred by the
international investor base (e.g. RegS and Rule 144a); and an continued weakening of the
currency from 92 KES/USD to 104 KES/USD through to 2014. Interviewees expect the market to
remain a key market outside of South Africa and the largest market in East Africa. A number
noted that on average banks in the region continue to aggressively expand their loan book, with
rates on bank debt often more competitive than the bond market, and requiring less disclosure,
this is likely to somewhat mute bond issuance in the short-to-medium term. – see African LCY
issuance PPT for a full breakdown of current Kenyan corporate bonds outstanding.
3.2.3 Botswana
Market considerations: The market preference is for floating rate issues. Banks do not usually
hold corporate bonds on their books, hence it is probable that the issue will be marketed to the
6 major Asset Managers / Pension funds in the market. Investor preference is for bond
proceeds to be utilized locally in the Botswana economy.
Rates have been on a downward spiral and general expectation is that this trend is almost
played out and upward revisions should not be surprising. Last week the MPC left rates
unchanged at 10% and spoke of a positive medium term inflation outlook. This was largely
expected since BOB normally tracks South Africa and there are no expectations that rates will
be cut at the next MPC there either. Reserve requirements on local deposits were however
raised 150 bps to 6.50%. This is expected to bring a slight amount of tightness in to the market
AFRICAN HIGH YIELD CORPORATE BOND MARKET
27
– current reference rate is 91-day Bank of Botswana Certificates (BoBC) at c.6.97%. Preferred
tenor in the market is 3-5 years, with less illiquidity towards the end of the range. Indicative
pricing is in the range of 250-300bps over BoBC, with a maximum facility size of USD20-30m in
the market.
Looking forward: Botswana saw two placements in 2011 (Standard Chartered Bank), and none
thus far in 2012. Expectations are for a continued steady stream of issuance from a select group
of banks and parastatals (e.g. Botswana Building Society, Botswana Vaccine Institute and the
Water Utilities Corporation). Stable country ratings and a flat currency expectations (versus the
USD) will continue to drive yields significantly below African peers - current coupons in the 8-
9% range – see African LCY issuance PPT for a full breakdown of current Botswana corporate
bonds outstanding. Finally, the Local stock exchange is in the process developing an electronic
trading system to standardise pricing alongside a local bond index.
3.2.4 Others
3.2.4.1 Ghana:
An expanding economy and recent oil finds are expected to position Ghana to become a more
established player in the corporate bond market, specifically to finance increased infrastructure
requirements. Historically, issuance has been limited to large state owned entities (e.g. Ghana
Cocoa Board), although expectations are that private enterprises involved in the development
of Harbours, Roads, Airports, etc. will look to tap the debt market over the next 2-3 years.
Reforms and government actions are further bolstering the emerging debt market with the
Ghanaian government having recently issued a 5 year note for benchmark purposes.
Additionally, the government is looking to reform the local pension industry, from largely a
monopoly (SSNIT), towards an increased number of asset managers each managing a portion of
state funds. This is expected to increase liquidity and thus the viability of the local debt market.
Yields have already risen on the back of increased supply in the secondary market. A significant
arbitrage between the bank lending (c. 22% p.a.) and a note issued as a FRN off the 182-day T-
bill (c. 12% + spread) is likely to drive corporates towards the debt markets as a cheaper funding
source. Indicative spread for corporates on LCY debt is in the range of 15-17% fixed, with a
maximum facility of c.$30m in the market. Finally, limited depreciation of the local currency is
expected (from 1.68 GHS/USD to 1.80 GHS/USD through to 2014) making offshore markets a
AFRICAN HIGH YIELD CORPORATE BOND MARKET
28
viable alternative as well for more established corporates (although likely to be only a pool of 2-
4 names).
3.2.4.2 Uganda:
Currently, there has been limited issuance from Ugandan corporates, on the back of high
interest rates to curb inflation, which hit an 18 year high in August at 28.3% (similar to Kenya),
although interest rates are expected to ease back towards the second half of 2013, making the
bond market a more attractive alternative for corporates. Assuming stabilization of the
inflationary environment, economists are forecasting a slight appreciation of the local currency
of c. 10-15% over the next 4 years - from 2,600 UGX/USD to 2,300 UGX/USD through to 2014.
The Ugandan market is unique in that it does not allow any private placement of debt – all bond
issuance needs to be listed – this partially limits the attractiveness of the local debt markets, as
corporates are then required to provide an additional level of disclosure. Looking forward,
bankers expect the market to recover and the debt markets to largely consist of bank and
supra-national debt, with the odd high quality corporate name (likely to be on the back of
financing infrastructure to realize recent oil finds).
3.2.4.3 TANZANIA and ZAMBIA:
Both countries have established benchmark government bond spreads that stretch out 15 years
(Zambia) and 10 years (Tanzania). Corporate issuance in both markets has been almost non-
existent over the last 2-3 years. However, the recent strong issuance of Zambian government
debt is likely to increase investor awareness to Zambian debt and establish strong benchmark
rates for corporates to issue against. A stable USD outlook for Zambia and slight deprecation for
Tanzania (c. 5%) is likely to increase investor acceptance for some of the higher quality names
in these countries. Indicative pricing in these markets is competitive with bank debt at 16-18%
(or 200-400bps above reference rate) for 5 year fixed debt in Tanzania; and 16.5-18% (or 300-
450bps above reference rates) for similar 5 years fixed debt in Zambia.
3.2.5 Hurdles to the development of the bond market across rest of Africa
All interviewees were positive about the development of Africa debt markets, however most
pointed to a significant amount of hurdles that stood in the way of a market that was truly an
alternative source to traditional bank funding, key amongst these were:
AFRICAN HIGH YIELD CORPORATE BOND MARKET
29
Benchmark Yields: A number of countries (e.g. Ghana) have yield curves that cover 5 years
or less significantly limiting the ability for corporate to issue debt
Costs: Corporate coupons are often higher than bank funding once all costs have been
included
Size: Difficult for large international investors to consider tickets sizes below $50-100m
limiting the available investor pool for corporate bonds
Marketing: Significant investment required in internal controls and marketing prior to being
able to issue debt into the market
Regulators: In a number of countries regulatory hurdles can take a significant period of time
to address, thus limiting the viability of bonds as an alternative financing source
Disclosure: Bank debt reduces the level of disclosure required by corporates
High Fees: Even in larger markets (e.g. Kenya), fees have been in the range of 3-4% for
corporates versus 1-2% for bank loans. Nigeria has seen corp. bond fees in the range of 5-
6%
Secondary market Fees: Secondary market activities tend to be costly (Nigeria fees were
3.75% of notional as recently as 2006-7 for secondary trading)
3.3 Insights on the South African sub-investment grade corporate bond market
The South African market has seen a significant increase in the level of HY issuance coming to
the market, with Investec analysts highlighting an expected growth in the market of over ten-
fold over the by 2015 to $15b – such growth would significantly outpace the continent, and
drive South Africa from a current estimated market share of c.70% to 85-90% of the overall
market. Increase in supply is best demonstrated by a ZAR750m issuance in late 2010 by
BrandCorp and more recently (July 2012) the ZAR1.6b issuance by Idwala Industrial holdings
(Ethos backed), the largest HY issuance ever in the African market. In short, any African focused
fund active in this area will need to ensure it is able to compete in South Africa in order to
attract Western investors.
3.3.1 Current market environment
Currently, there is significant demand in the local market for sub-investment grade issuance.
This demand has compressed yield quite significantly thus far. For example a recent listing by
Idwala priced 4-year debt at 380-390bps over JIBAR, comparatively bank funding was available
AFRICAN HIGH YIELD CORPORATE BOND MARKET
30
in the market for c. 400bps over JIBAR for the same tenor. Some of the smaller funds (e.g.
FutureGrowth) view the current pricing as not being reflective of the underlying credit risk, and
have opted instead to focus on smaller private placement issues where they are able to
negotiate rates more effectively. As with the two examples above, a significant amount of the
volume is being by sponsor-led deals, with local bankers seeing a long list of first and second
tier Private Equity shops turning to the bond market as a means to partially take some cash off
the table given limited IPO environment. Gearing expectations in the market remain more
conservative than international standards with c 3.5-4.0x seen as acceptable. Expectations are
that the development of bank + debt market structures will allow c. ZAR4b+ issuances or more
in the near future.
3.3.2 LCY versus FCY issuance
Historically South African corporates have provided the majority of African hard currency
issues. Although industry experts continue to see South African corporates tap the international
bond market, they believe that the majority of growth is likely to come from LCY issuances.
FCY issuances are likely to continue from corporates with a history of placing hard currency
debt (E.g. Anglo American, Old Mutual, SA Banks), or selective cases where issuance value is
greater than the local South African market is able to absorb (currently industry experts believe
that ZAR1.5-2.0b would be the largest transaction that could be placed locally). Finally, the one-
side nature of the ZAR-USD exchange makes cross-currency swaps expensive, and thus limits
the attractiveness of foreign funding for corporates with ZAR expenses.
3.3.3 Market Liquidity
A preference for liquidity was mentioned a number of time through interviews, with funds
highlighting that the majority of global investors are moving towards requiring more – rather
than less – liquidity. In contrast to this requirement all investors interviewed in the South
African HY Corporate bond space noted that the majority – if not all – of their portfolio was
held to maturity. A typical fund would review their bond portfolio on an annual basis, with
some expectation that they would be able to trade out of undesirable bonds over the course of
a year. Assuming nothing was wrong with the actual credit, funds would need to identify a
buyer in the secondary market, with both buyer and seller running their own internal process
prior to conclusion of any sale – in the HY market it is likely that such a process would take a
AFRICAN HIGH YIELD CORPORATE BOND MARKET
31
least a month. In terms of the offshore market, there exists significantly more liquidity, and
asset managers would make use of an investment bank to offload any paper. However fees are
significant (c. 1-2%) which limits the amount of turns on corporate paper.
In almost all cases, investors preferred bonds which were listed, despite the lack of liquidity as
it at least made the process of any sales simpler, and provided increased transparency of
current market prices. The listing of corporate bonds is likely to become market norm should
laws be passed that exempt withholding tax only on listed instruments versus private
placements. Finally, investors highlighted that a significant hurdle to both the development and
the liquidity of the HY Corporate bond market was the lack of standardized docs. Experts
highlighted that the market norm was to start with IG documentation and adjust to reflect the
HY nature of the corporate. This delayed the time that corporates took to come to market, and
the time to conclude secondary sales. SECA (The Stock Exchanges Control Act), is currently
attempting to standardise terms across the HY bond market – the aim is for this to establish a
broad understanding amongst banks on market norms for legal docs (although unlikely to enter
legislation).
3.4 Insight on the investor base
There are a number of investors who are active in the African debt market. Currently, none
except perhaps Investec Asset management, offer an exclusively pan-Africa HY Corporate Debt
fund. For the purpose of segmenting these competitors we have broken them into three
segments, namely:
South African Funds: South African based funds that focus almost exclusively on LCY, and
are active in the HY Corporate debt space, and to a very limited degree FCY HY Corporate
debt
Rest of African Funds: Real Money Funds (Pension, life insurance, Asset managers) based in
Africa, who invest solely in HY Corporate bond issuance in their resident country, exclusively
in LCY. Across most of the African market, banks will also be active investors in Corporate
debt, and are counted in this segment
FCY focused International Funds: Western funds split into either niche EM specific funds
(e.g. BlueBay, Ashmore, etc) or large global asset managers that will invest a very small
portion (c.1-3%) of global HY funds into predominantly South African debt.
AFRICAN HIGH YIELD CORPORATE BOND MARKET
32
LCY focused international Funds: Very small set of investors who are willing to accept both
currency and country risk, thus far largely limited to boutiques and hedge funds.
3.4.1 South African funds
The South African market is highly concentrated with only 4-6 funds very active in the LCY HY
space, and perhaps a further 4 smaller funds which would selectively consider LCY HY Debt. As
such, despite bonds being listed the market largely works on a private placement basis. One
expert interviewed highlighted that they are beginning to see smaller funds (largely family
office type vehicles) selectively acquire HY corporate debt, but that thus far it has largely been
the exception rather than the rule. Within South Africa seven funds have been highlighted as
active or likely participants in the LCY HY Market – with Investec and OM being the most active
players (i.e. able to write tickets in excess of ZAR500m, versus most investors targeting ZAR50-
150m). The majority of these funds are open-ended funds investing solely in ZAR.
Investec: Investec Asset Management has very strong demand for high yield bonds (and are
the market leader in terms of acquiring and understanding LCY debt). Investec will consider
each name as presented, but would generally stay away from the mining sector. They are
willing to take tenors up to 7-years and are willing to underwrite bonds
Old Mutual Special Situations: OM has funds available to invest in high yield and generally
seek an above average yield i.e. >600 bps. Are active investors who are willing to
restructure current loans and switch their exposure into the bond
Sanlam Capital Markets: SCM are becoming increasingly active in the high yield market, and
are willing to consider ticket sizes of up to ZAR150m, with target returns of over 400bps on
sub-investment grade paper. Only focused on the South African market for HY, but are
willing to consider any credit within the market
RMB Asset Management: RMBAM are starting to show interest in the HY Market, although
generally focusing on smaller tickets sizes (up to ZAR 50m)
Future Growth: Offer a high yielding fund (HY Enhanced Geared BB STeFI+ Composite),
which consists of funds with an average rating of BB+. Funds are usually acquired on a
private placement basis, where greater flexibility on terms can be negotiated
Cadiz: Starting to consider HY bonds, and looking to raise a fund focused on HY credit
Coronation: Thus far have shown some willingness to invest in the HY segment, and are
considering individual bonds on merit
AFRICAN HIGH YIELD CORPORATE BOND MARKET
33
Although fees vary significantly interviews have highlighted an average of 2% management fee,
with some form of inventive fee based on beating a specific hurdle rate. Interviews revealed
that these funds have done relatively well (e.g. Investec Asset management has had returns
well in excess of 10%) especially as the credit quality of South African corporates has held up
quite well.
3.4.2 Rest of Africa funds
Across the rest of the continent (e.g. Nigeria, Kenya, Botswana, etc) the majority of the investor
base in LCY debt are the local real money funds. Whilst relatively small, these funds are well
positioned to understand the credit risk of individual corporates and have no exposure to the
currency risk. Regulations are underway (e.g. Ghana) to increase the competitive ness and size
(e.g. Nigeria) of this segment and it is expected that the investors will continue to provide the
bulk of the investor base. All interviewees stressed that these players acquire the vast majority
of any LCY issuance, and are almost exclusively “buy to hold” investors.
3.4.3 FCY focused international funds
Investors in the FCY HY bond issuances have been significantly more diverse (please see earlier
section for full list from selected bonds). These funds can be broken into two specific segments.
Large global full mandate funds: Specifically these refer to funds such as Pimco, Franklin
Templeton, Blackrock, Mellon, Aberdeen, etc. These funds will selectively acquire FCY debt
from South African corporates as part of a global fund, e.g. Global HY funds, EM HY funds or EM
Corporate funds. In all these cases, exposure to South African names is likely to be only a small
part of their the overall fund (c. 1-3%) and acquired on an opportunistic basis.
Niche international funds: A number of “Western” funds have started to target EM HY FCY
Corporate debt on a global allocation basis. In most cases these funds have only a small
percentage of global allocation invested in African corporates and in these cases predominantly
South African. Good examples of these funds include:
Ashmore Emerging Markets Corporate High Yield Fund: Global EM High Yield debt fund,
open ended. (http://www.bloomberg.com/quote/EMCHYID:GU)
PineBridge Emerging Market High Yield Bond Fund: Global EM High Yield debt fund, open
ended. (http://www.bloomberg.com/quote/PINEMHY:TT)
AFRICAN HIGH YIELD CORPORATE BOND MARKET
34
Van Eck (Market Vectors) EM High Yield Corporate Debt ETF: Emphasis is on USD-
denominated corporate debt, which now accounts for over 10% of the global high-yield
corporate bond market
Pioneer Funds Emerging Market Corporate High Yield Index: The Fund invests in a
diversified portfolio of U.S. dollar and other OECD currency denominated debt and debt-
related instruments issued by sub-Investment.
(http://www.bloomberg.com/quote/PFEMCHI:LX)
iShares Emerging Markets High Yield Bond Fund (EM Corp Bond Fund): Both bonds have
sub-investment grade bond allocation (although only a minority) on a global basis
Bluebay Emerging Market High Yield Corporate Bond Fund: The Fund invests at least 2/3 of
its assets in fixed-income securities rated below investment grade by issuers domiciled
within an EM Country (http://www.bloomberg.com/quote/BEMHCIE:LX)
Morning Star EM High Yield: The Morningstar Emerging Markets High Yield Bond Index
includes below-investment-grade corporate and sovereign bonds issued in US Dollars (USD)
by corporations and governments of emerging markets
Across these funds, the focus thus far has been almost exclusively on FCY issuance thus far, as
western funds have been hesitant to gain exposure to the currency risk, and limited liquidity
associated with LCY issuances. Within these funds, all are currently structured as open-ended
funds with an management fee in the range of 80bps-125bps. Various interviewees stressed the
need for liquidity as a pre-requisite to gaining investment from traditional western investors
(e.g. pension funds, asset managers, insurers).
Ashmore was highlighted in a number of interviews as the leader in this market, and the likely
benefactor of any shift towards EM debt by western investors. Importantly, they also seem to
lead the way in product development, and have reportedly recently establishing a close-ended
LCY HY EM Fund – although initial focus is largely going to be on Asian and LatAm LCY HY debt.
3.4.4 LCY focused international funds
Lastly, the smaller set of investors, are the international hedge funds and boutique investment
houses that focus on acquiring corporate debt across the continent. Increasingly Private Equity
houses in Africa are looking at establishing credit desks to take advantage of their on the
ground presence and access to international investors in an attempt to tap this market. Some
notable examples are:
AFRICAN HIGH YIELD CORPORATE BOND MARKET
35
Helios: Looking to establish an Africa focused credit desk, which will target pan-African HY
debt. Likely to provide a compelling option to their investor base which is already
comfortable with the fund and their understanding of the African market
Nubuke: Multi-asset Africa only fund, limited information but likely to be active on the LCY
debt side across the continent
Exotic: Strong African focused investor targeting illiquid and distressed bonds
Renaissance Asset Management: Russian based asset manager / investment bank with
operations across Africa. Likely to consider HY Corporate debt on an opportunistic basis
3.5 Looking forward and conclusions
Looking forward there remain a number of hurdles that stand in the way of a significantly
deeper African corporate bond market (ex-South Africa), however, all interviewees expect the
market to continue to grow over the next 3-5 years. Amongst interviewees most expected
corporate to tap the LCY markets, with only the resource, infrastructure and banking sector
looking to tap the FCY markets, Importantly the introduction of Basel III is expected to decrease
the ability of banks across the continent to under-price bonds by a significant margin – and
should lead to further development of the bond market across the continent.
South Africa has already started to see the development of LCY HY Corporate funds focused
exclusively on the local market, with Investec starting to look to the rest of Africa for potential
corporate bond issuance. Opportunity exists for a fund in the LCY space that is able to
understand the credit risk behind various corporates (as most bonds are un-rated), and offer
exposure to more risk seeking investors (i.e. HNW, Private Banking and potentially Sovereign
Wealth Funds).
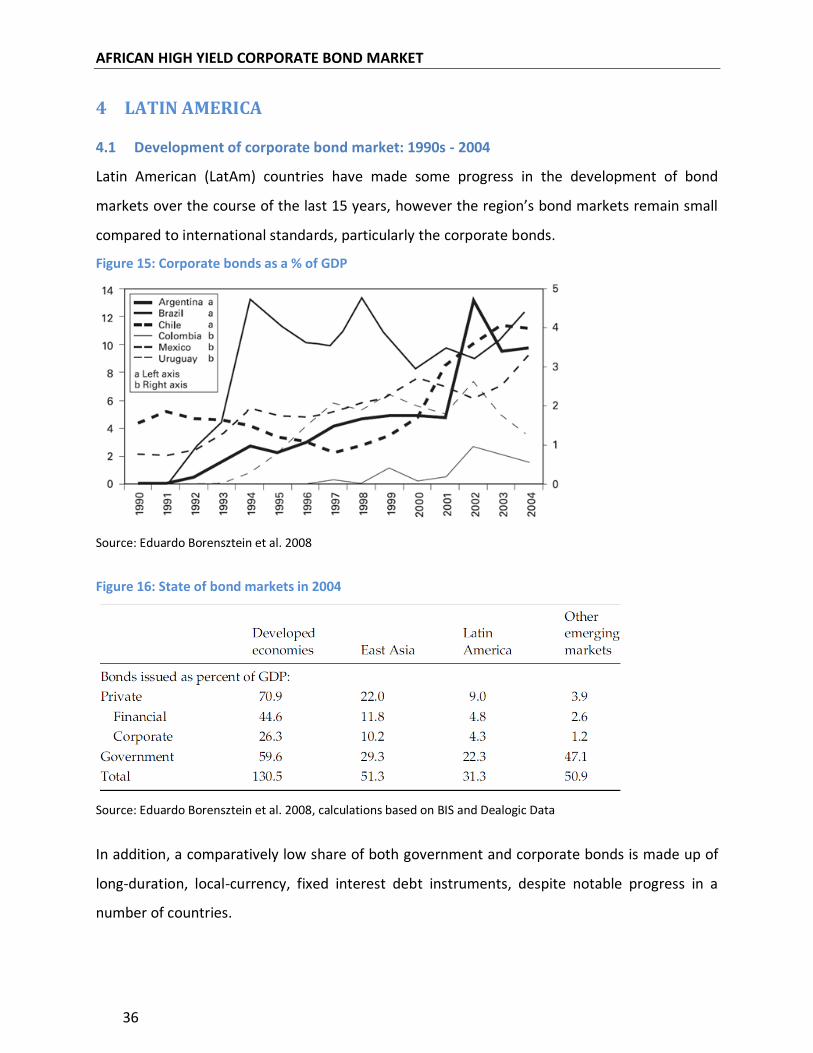
AFRICAN HIGH YIELD CORPORATE BOND MARKET
36
4 LATIN AMERICA
4.1 Development of corporate bond market: 1990s - 2004
Latin American (LatAm) countries have made some progress in the development of bond
markets over the course of the last 15 years, however the region’s bond markets remain small
compared to international standards, particularly the corporate bonds.
Figure 15: Corporate bonds as a % of GDP
Source: Eduardo Borensztein et al. 2008
Figure 16: State of bond markets in 2004
Source: Eduardo Borensztein et al. 2008, calculations based on BIS and Dealogic Data
In addition, a comparatively low share of both government and corporate bonds is made up of
long-duration, local-currency, fixed interest debt instruments, despite notable progress in a
number of countries.
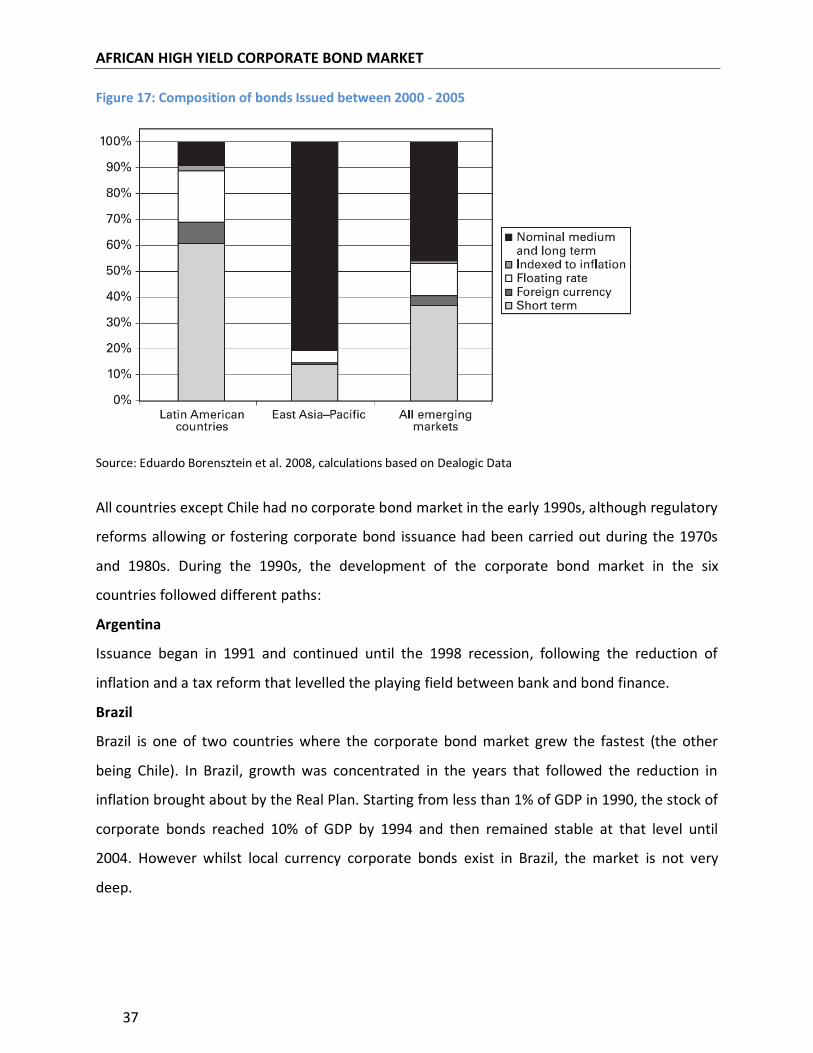
AFRICAN HIGH YIELD CORPORATE BOND MARKET
37
Figure 17: Composition of bonds Issued between 2000 - 2005
Source: Eduardo Borensztein et al. 2008, calculations based on Dealogic Data
All countries except Chile had no corporate bond market in the early 1990s, although regulatory
reforms allowing or fostering corporate bond issuance had been carried out during the 1970s
and 1980s. During the 1990s, the development of the corporate bond market in the six
countries followed different paths:
Argentina
Issuance began in 1991 and continued until the 1998 recession, following the reduction of
inflation and a tax reform that levelled the playing field between bank and bond finance.
Brazil
Brazil is one of two countries where the corporate bond market grew the fastest (the other
being Chile). In Brazil, growth was concentrated in the years that followed the reduction in
inflation brought about by the Real Plan. Starting from less than 1% of GDP in 1990, the stock of
corporate bonds reached 10% of GDP by 1994 and then remained stable at that level until
2004. However whilst local currency corporate bonds exist in Brazil, the market is not very
deep.
AFRICAN HIGH YIELD CORPORATE BOND MARKET
38
Chile
Chile has enjoyed relative macroeconomic stability since the mid-1980s, and not surprisingly its
corporate bond markets were the earliest to develop, reaching 5% of GDP by 1990—below
developed country standards but substantially higher than other LatAm countries.
In Chile, the corporate bond market started expanding after 1998; this recent growth was due
to factors affecting both the demand and supply of corporate bonds:
On the supply side, the two contributing factors were:
Central Bank’s defence of the peso exchange rate in the aftermath of the Russian crisis in
1998 led to a sharp increase in short-term rates and a credit crunch, which increased the
attractiveness of long-term, non-bank finance and encouraged borrowers to turn to the
bond market
Financial requirements of the large private infrastructure programs that were undertaken in
the 1990s
On the demand side, placement of these bonds was facilitated by large local institutional
investors who were forced by regulation to buy domestic assets and, in an environment of
decreasing public debt, needed to find alternatives to their traditional strategy of investing
most of their assets in government bonds.
Colombia
Colombia is the outlier as its corporate bond market experienced almost no growth over the
period 1990s to 2004. The key reason cited by analysts is the crowding out by increasing public
debt which played a key role in stunting demand for corporate bonds.
Mexico
Although the market for Mexican bonds grew continuously (if slowly) during the 1990s, that
new regulations approved in 2001, especially the creation of a new flexible debt instrument
(the certificados bursa´tiles) and improvement in corporate governance laws, stimulated
growth in bond issuance in recent years.
Uruguay
The Uruguayan market had a brief renaissance following the enactment of the Securities
Market Law in 1996, but financial scandals that erupted in 1998 halted issuance of new bonds.
Lack of transparency and poor corporate governance are two of the key obstacles to the
development of the Uruguayan corporate bond market.
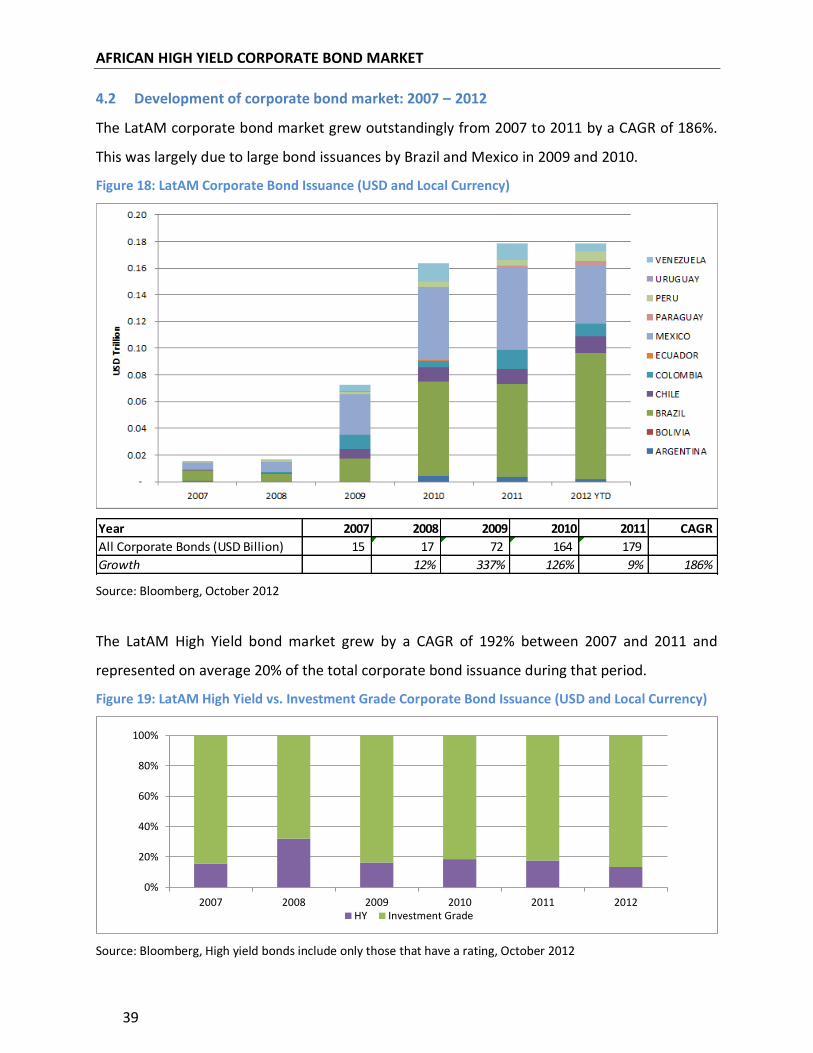
AFRICAN HIGH YIELD CORPORATE BOND MARKET
39
4.2 Development of corporate bond market: 2007 – 2012
The LatAM corporate bond market grew outstandingly from 2007 to 2011 by a CAGR of 186%.
This was largely due to large bond issuances by Brazil and Mexico in 2009 and 2010.
Figure 18: LatAM Corporate Bond Issuance (USD and Local Currency)
Source: Bloomberg, October 2012
The LatAM High Yield bond market grew by a CAGR of 192% between 2007 and 2011 and
represented on average 20% of the total corporate bond issuance during that period.
Figure 19: LatAM High Yield vs. Investment Grade Corporate Bond Issuance (USD and Local Currency)
Source: Bloomberg, High yield bonds include only those that have a rating, October 2012
Year 2007 2008 2009 2010 2011 CAGR
All Corporate Bonds (USD Billion) 15 17 72 164 179
Growth 12% 337% 126% 9% 186%
0%
20%
40%
60%
80%
100%
2007 2008 2009 2010 2011 2012HY Investment Grade
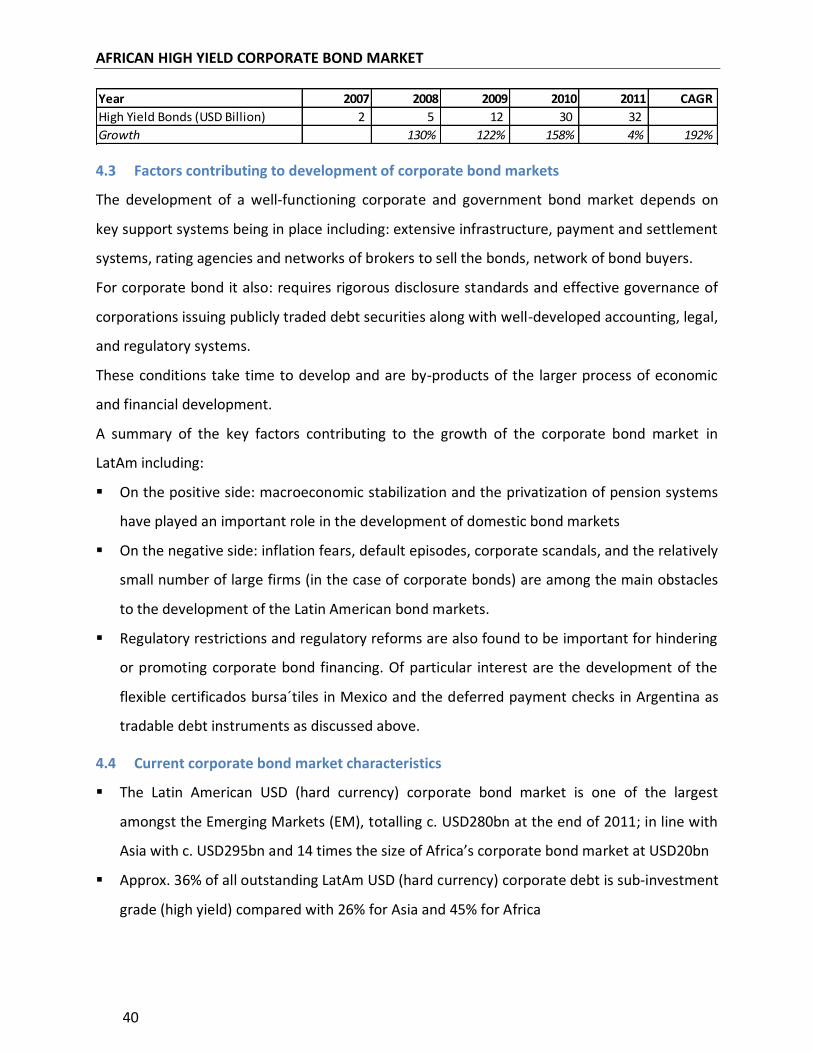
AFRICAN HIGH YIELD CORPORATE BOND MARKET
40
4.3 Factors contributing to development of corporate bond markets
The development of a well-functioning corporate and government bond market depends on
key support systems being in place including: extensive infrastructure, payment and settlement
systems, rating agencies and networks of brokers to sell the bonds, network of bond buyers.
For corporate bond it also: requires rigorous disclosure standards and effective governance of
corporations issuing publicly traded debt securities along with well-developed accounting, legal,
and regulatory systems.
These conditions take time to develop and are by-products of the larger process of economic
and financial development.
A summary of the key factors contributing to the growth of the corporate bond market in
LatAm including:
On the positive side: macroeconomic stabilization and the privatization of pension systems
have played an important role in the development of domestic bond markets
On the negative side: inflation fears, default episodes, corporate scandals, and the relatively
small number of large firms (in the case of corporate bonds) are among the main obstacles
to the development of the Latin American bond markets.
Regulatory restrictions and regulatory reforms are also found to be important for hindering
or promoting corporate bond financing. Of particular interest are the development of the
flexible certificados bursa´tiles in Mexico and the deferred payment checks in Argentina as
tradable debt instruments as discussed above.
4.4 Current corporate bond market characteristics
The Latin American USD (hard currency) corporate bond market is one of the largest
amongst the Emerging Markets (EM), totalling c. USD280bn at the end of 2011; in line with
Asia with c. USD295bn and 14 times the size of Africa’s corporate bond market at USD20bn
Approx. 36% of all outstanding LatAm USD (hard currency) corporate debt is sub-investment
grade (high yield) compared with 26% for Asia and 45% for Africa
Year 2007 2008 2009 2010 2011 CAGR
High Yield Bonds (USD Billion) 2 5 12 30 32
Growth 130% 122% 158% 4% 192%
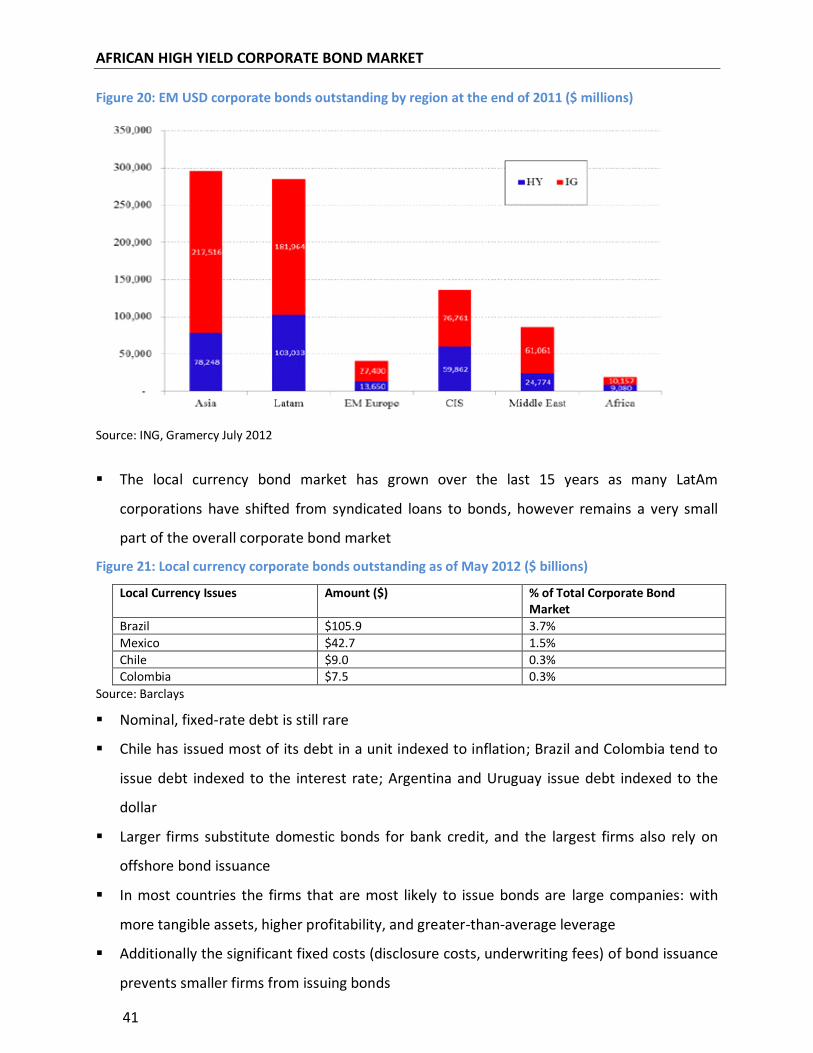
AFRICAN HIGH YIELD CORPORATE BOND MARKET
41
Figure 20: EM USD corporate bonds outstanding by region at the end of 2011 ($ millions)
Source: ING, Gramercy July 2012
The local currency bond market has grown over the last 15 years as many LatAm
corporations have shifted from syndicated loans to bonds, however remains a very small
part of the overall corporate bond market
Figure 21: Local currency corporate bonds outstanding as of May 2012 ($ billions)
Local Currency Issues Amount ($) % of Total Corporate Bond Market
Brazil $105.9 3.7%
Mexico $42.7 1.5%
Chile $9.0 0.3% Colombia $7.5 0.3%
Source: Barclays
Nominal, fixed-rate debt is still rare
Chile has issued most of its debt in a unit indexed to inflation; Brazil and Colombia tend to
issue debt indexed to the interest rate; Argentina and Uruguay issue debt indexed to the
dollar
Larger firms substitute domestic bonds for bank credit, and the largest firms also rely on
offshore bond issuance
In most countries the firms that are most likely to issue bonds are large companies: with
more tangible assets, higher profitability, and greater-than-average leverage
Additionally the significant fixed costs (disclosure costs, underwriting fees) of bond issuance
prevents smaller firms from issuing bonds
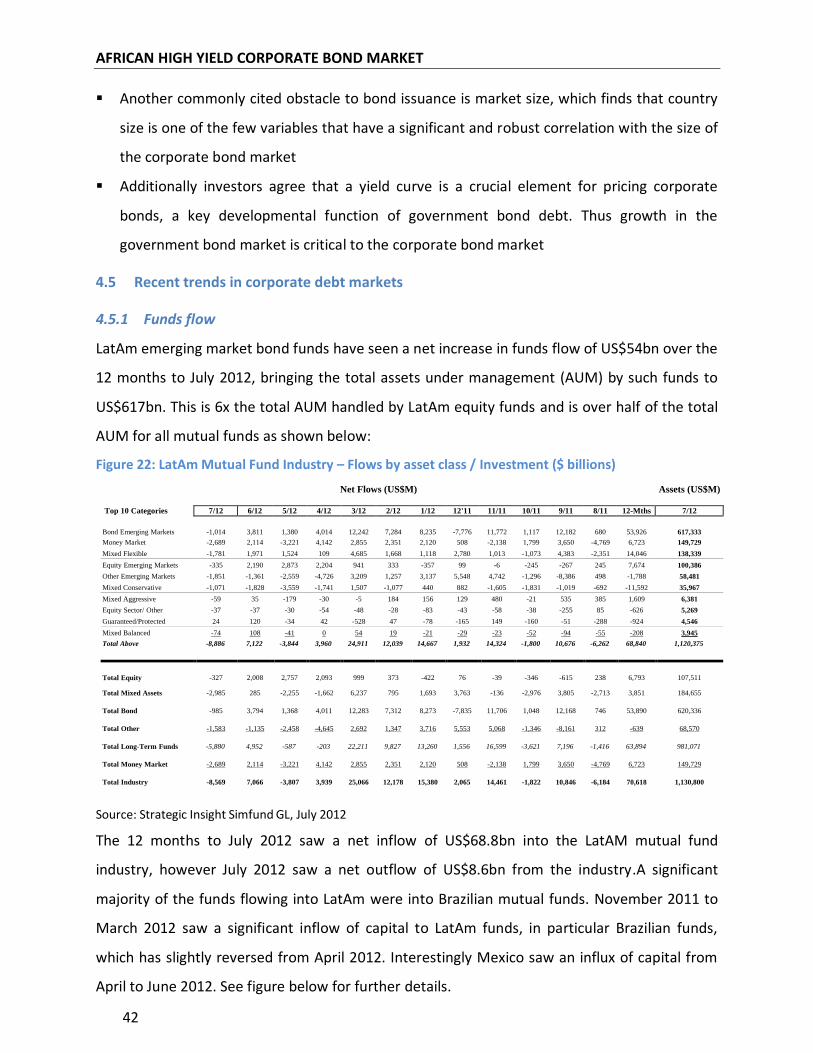
AFRICAN HIGH YIELD CORPORATE BOND MARKET
42
Another commonly cited obstacle to bond issuance is market size, which finds that country
size is one of the few variables that have a significant and robust correlation with the size of
the corporate bond market
Additionally investors agree that a yield curve is a crucial element for pricing corporate
bonds, a key developmental function of government bond debt. Thus growth in the
government bond market is critical to the corporate bond market
4.5 Recent trends in corporate debt markets
4.5.1 Funds flow
LatAm emerging market bond funds have seen a net increase in funds flow of US$54bn over the
12 months to July 2012, bringing the total assets under management (AUM) by such funds to
US$617bn. This is 6x the total AUM handled by LatAm equity funds and is over half of the total
AUM for all mutual funds as shown below:
Figure 22: LatAm Mutual Fund Industry – Flows by asset class / Investment ($ billions)
Source: Strategic Insight Simfund GL, July 2012
The 12 months to July 2012 saw a net inflow of US$68.8bn into the LatAM mutual fund
industry, however July 2012 saw a net outflow of US$8.6bn from the industry.A significant
majority of the funds flowing into LatAm were into Brazilian mutual funds. November 2011 to
March 2012 saw a significant inflow of capital to LatAm funds, in particular Brazilian funds,
which has slightly reversed from April 2012. Interestingly Mexico saw an influx of capital from
April to June 2012. See figure below for further details.
Net Flows (US$M) Assets (US$M)
Top 10 Categories 7/12 6/12 5/12 4/12 3/12 2/12 1/12 12'11 11/11 10/11 9/11 8/11 12-Mths 7/12
Bond Emerging Markets
-1,014
3,811
1,380
4,014
12,242
7,284
8,235
-7,776
11,772
1,117
12,182
680
53,926
617,333
Money Market -2,689 2,114 -3,221 4,142 2,855 2,351 2,120 508 -2,138 1,799 3,650 -4,769 6,723 149,729 Mixed Flexible -1,781 1,971 1,524 109 4,685 1,668 1,118 2,780 1,013 -1,073 4,383 -2,351 14,046 138,339 Equity Emerging Markets -335 2,190 2,873 2,204 941 333 -357 99 -6 -245 -267 245 7,674 100,386 Other Emerging Markets -1,851 -1,361 -2,559 -4,726 3,209 1,257 3,137 5,548 4,742 -1,296 -8,386 498 -1,788 58,481 Mixed Conservative -1,071 -1,828 -3,559 -1,741 1,507 -1,077 440 882 -1,605 -1,831 -1,019 -692 -11,592 35,967 Mixed Aggressive -59 35 -179 -30 -5 184 156 129 480 -21 535 385 1,609 6,381 Equity Sector/ Other -37 -37 -30 -54 -48 -28 -83 -43 -58 -38 -255 85 -626 5,269 Guaranteed/Protected 24 120 -34 42 -528 47 -78 -165 149 -160 -51 -288 -924 4,546 Mixed Balanced -74 108 -41 0 54 19 -21 -29 -23 -52 -94 -55 -208 3,945 Total Above -8,886 7,122 -3,844 3,960 24,911 12,039 14,667 1,932 14,324 -1,800 10,676 -6,262 68,840 1,120,375
Total Equity
-327
2,008
2,757
2,093
999
373
-422
76
-39
-346
-615
238
6,793
107,511
Total Mixed Assets
-2,985
285
-2,255
-1,662
6,237
795
1,693
3,763
-136
-2,976
3,805
-2,713
3,851
184,655
Total Bond
-985
3,794
1,368
4,011
12,283
7,312
8,273
-7,835
11,706
1,048
12,168
746
53,890
620,336
Total Other
-1,583
-1,135
-2,458
-4,645
2,692
1,347
3,716
5,553
5,068
-1,346
-8,161
312
-639
68,570
Total Long-Term Funds
-5,880
4,952
-587
-203
22,211
9,827
13,260
1,556
16,599
-3,621
7,196
-1,416
63,894
981,071
Total Money Market
-2,689
2,114
-3,221
4,142
2,855
2,351
2,120
508
-2,138
1,799
3,650
-4,769
6,723
149,729
Total Industry
-8,569
7,066
-3,807
3,939
25,066
12,178
15,380
2,065
14,461
-1,822
10,846
-6,184
70,618
1,130,800
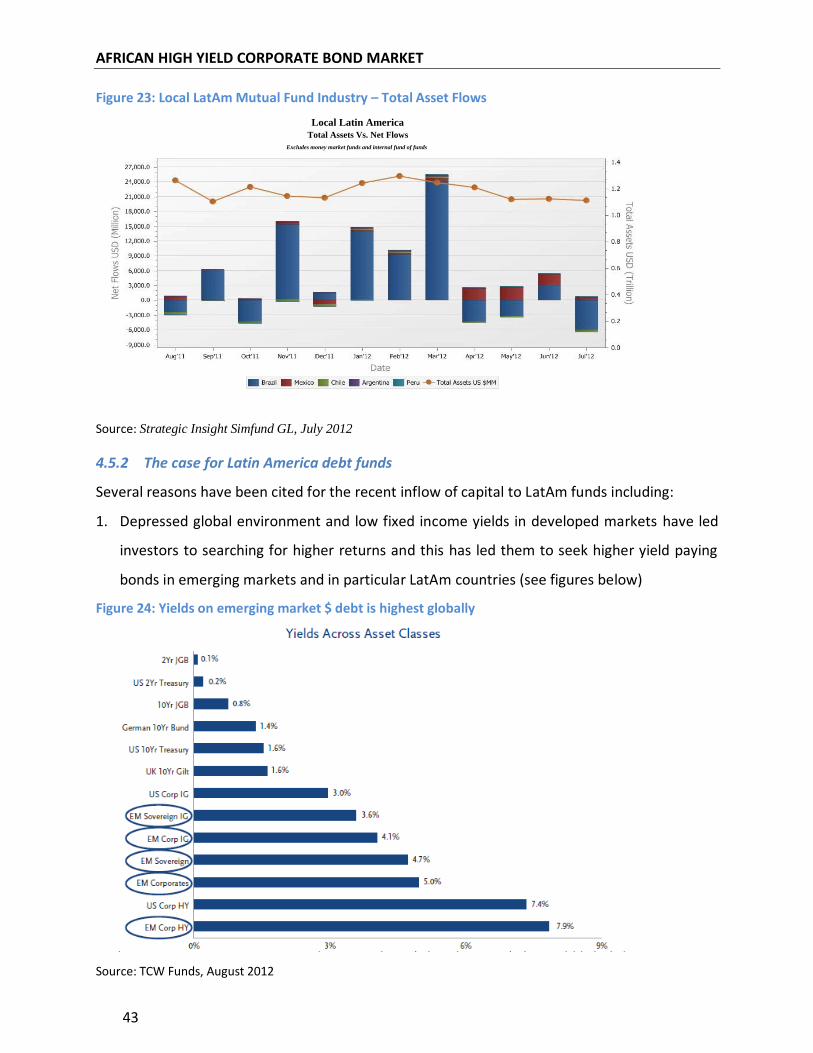
AFRICAN HIGH YIELD CORPORATE BOND MARKET
43
Figure 23: Local LatAm Mutual Fund Industry – Total Asset Flows
Source: Strategic Insight Simfund GL, July 2012
4.5.2 The case for Latin America debt funds
Several reasons have been cited for the recent inflow of capital to LatAm funds including:
1. Depressed global environment and low fixed income yields in developed markets have led
investors to searching for higher returns and this has led them to seek higher yield paying
bonds in emerging markets and in particular LatAm countries (see figures below)
Figure 24: Yields on emerging market $ debt is highest globally
Source: TCW Funds, August 2012
Local Latin America
Total Assets Vs. Net Flows
Excludes money market funds and internal fund of funds
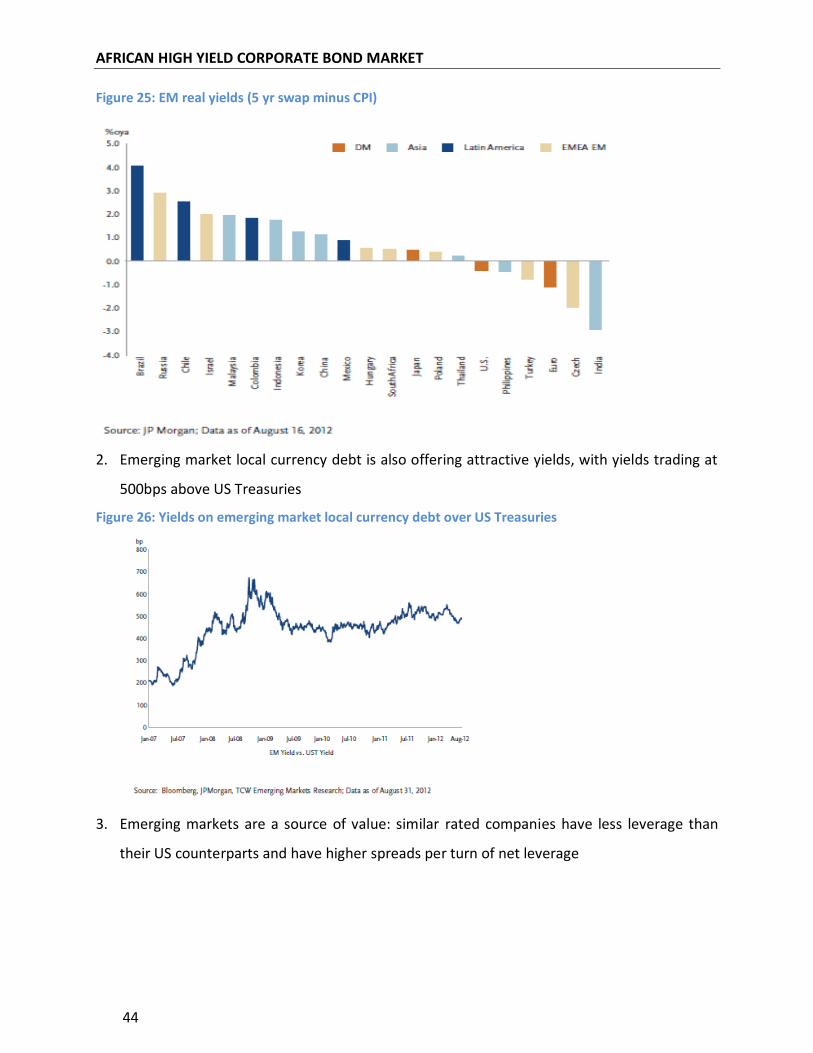
AFRICAN HIGH YIELD CORPORATE BOND MARKET
44
Figure 25: EM real yields (5 yr swap minus CPI)
2. Emerging market local currency debt is also offering attractive yields, with yields trading at
500bps above US Treasuries
Figure 26: Yields on emerging market local currency debt over US Treasuries
3. Emerging markets are a source of value: similar rated companies have less leverage than
their US counterparts and have higher spreads per turn of net leverage
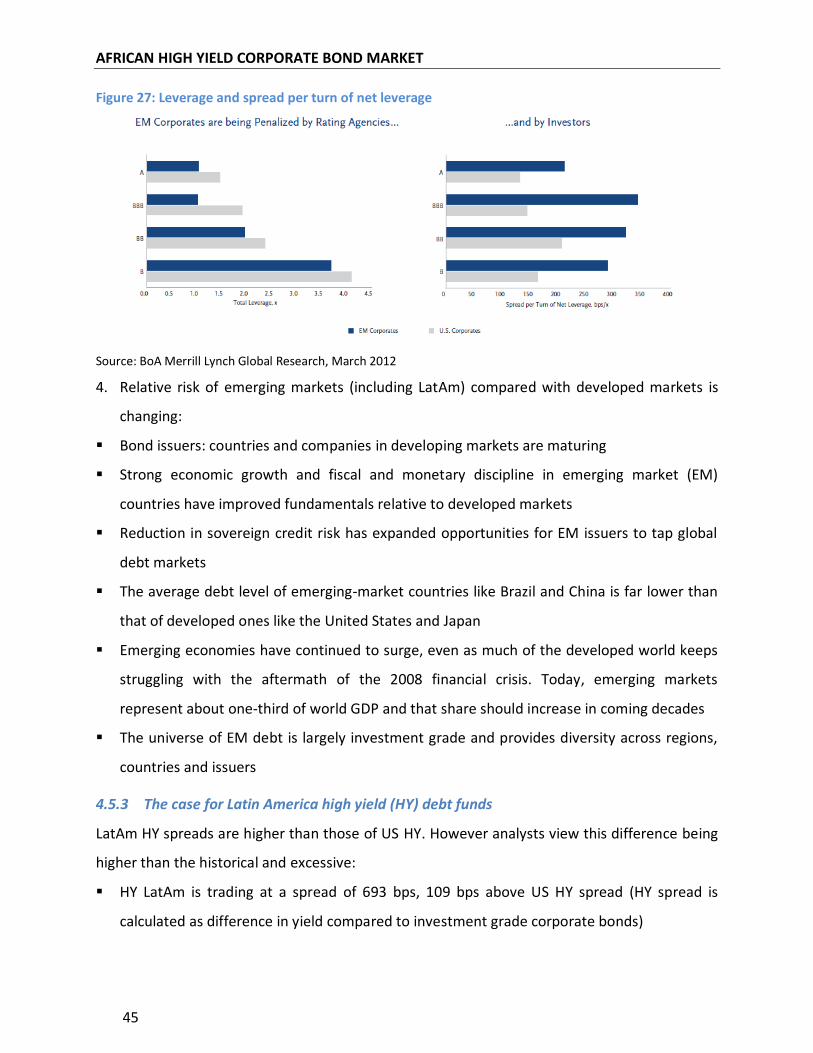
AFRICAN HIGH YIELD CORPORATE BOND MARKET
45
Figure 27: Leverage and spread per turn of net leverage
Source: BoA Merrill Lynch Global Research, March 2012
4. Relative risk of emerging markets (including LatAm) compared with developed markets is
changing:
Bond issuers: countries and companies in developing markets are maturing
Strong economic growth and fiscal and monetary discipline in emerging market (EM)
countries have improved fundamentals relative to developed markets
Reduction in sovereign credit risk has expanded opportunities for EM issuers to tap global
debt markets
The average debt level of emerging-market countries like Brazil and China is far lower than
that of developed ones like the United States and Japan
Emerging economies have continued to surge, even as much of the developed world keeps
struggling with the aftermath of the 2008 financial crisis. Today, emerging markets
represent about one-third of world GDP and that share should increase in coming decades
The universe of EM debt is largely investment grade and provides diversity across regions,
countries and issuers
4.5.3 The case for Latin America high yield (HY) debt funds
LatAm HY spreads are higher than those of US HY. However analysts view this difference being
higher than the historical and excessive:
HY LatAm is trading at a spread of 693 bps, 109 bps above US HY spread (HY spread is
calculated as difference in yield compared to investment grade corporate bonds)
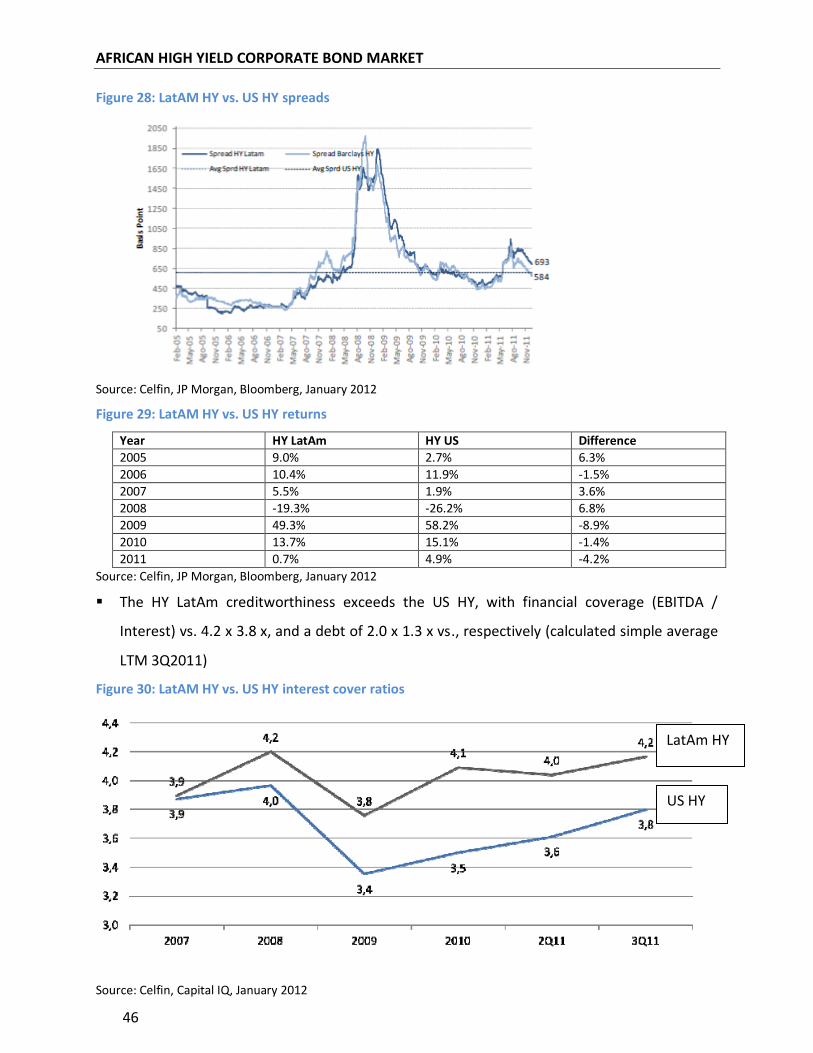
AFRICAN HIGH YIELD CORPORATE BOND MARKET
46
Figure 28: LatAM HY vs. US HY spreads
Source: Celfin, JP Morgan, Bloomberg, January 2012
Figure 29: LatAM HY vs. US HY returns
Year HY LatAm HY US Difference
2005 9.0% 2.7% 6.3%
2006 10.4% 11.9% -1.5%
2007 5.5% 1.9% 3.6%
2008 -19.3% -26.2% 6.8%
2009 49.3% 58.2% -8.9%
2010 13.7% 15.1% -1.4%
2011 0.7% 4.9% -4.2%
Source: Celfin, JP Morgan, Bloomberg, January 2012
The HY LatAm creditworthiness exceeds the US HY, with financial coverage (EBITDA /
Interest) vs. 4.2 x 3.8 x, and a debt of 2.0 x 1.3 x vs., respectively (calculated simple average
LTM 3Q2011)
Figure 30: LatAM HY vs. US HY interest cover ratios
Source: Celfin, Capital IQ, January 2012
LatAm HY
US HY
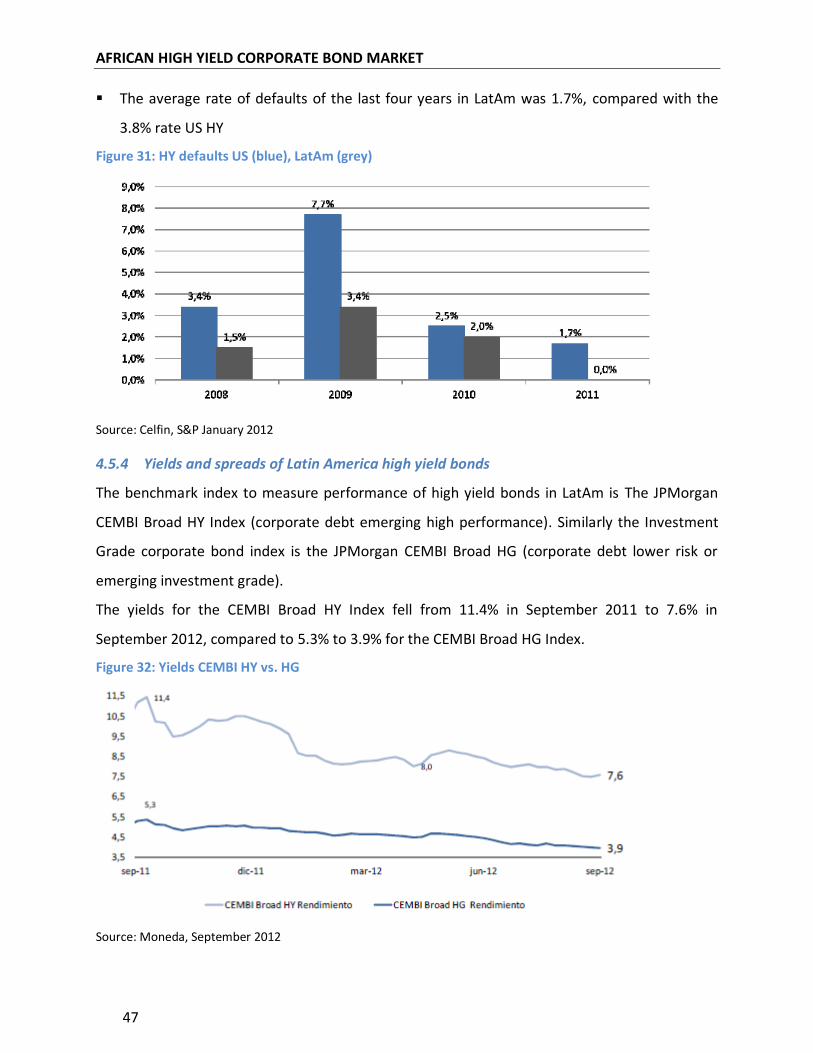
AFRICAN HIGH YIELD CORPORATE BOND MARKET
47
The average rate of defaults of the last four years in LatAm was 1.7%, compared with the
3.8% rate US HY
Figure 31: HY defaults US (blue), LatAm (grey)
Source: Celfin, S&P January 2012
4.5.4 Yields and spreads of Latin America high yield bonds
The benchmark index to measure performance of high yield bonds in LatAm is The JPMorgan
CEMBI Broad HY Index (corporate debt emerging high performance). Similarly the Investment
Grade corporate bond index is the JPMorgan CEMBI Broad HG (corporate debt lower risk or
emerging investment grade).
The yields for the CEMBI Broad HY Index fell from 11.4% in September 2011 to 7.6% in
September 2012, compared to 5.3% to 3.9% for the CEMBI Broad HG Index.
Figure 32: Yields CEMBI HY vs. HG
Source: Moneda, September 2012
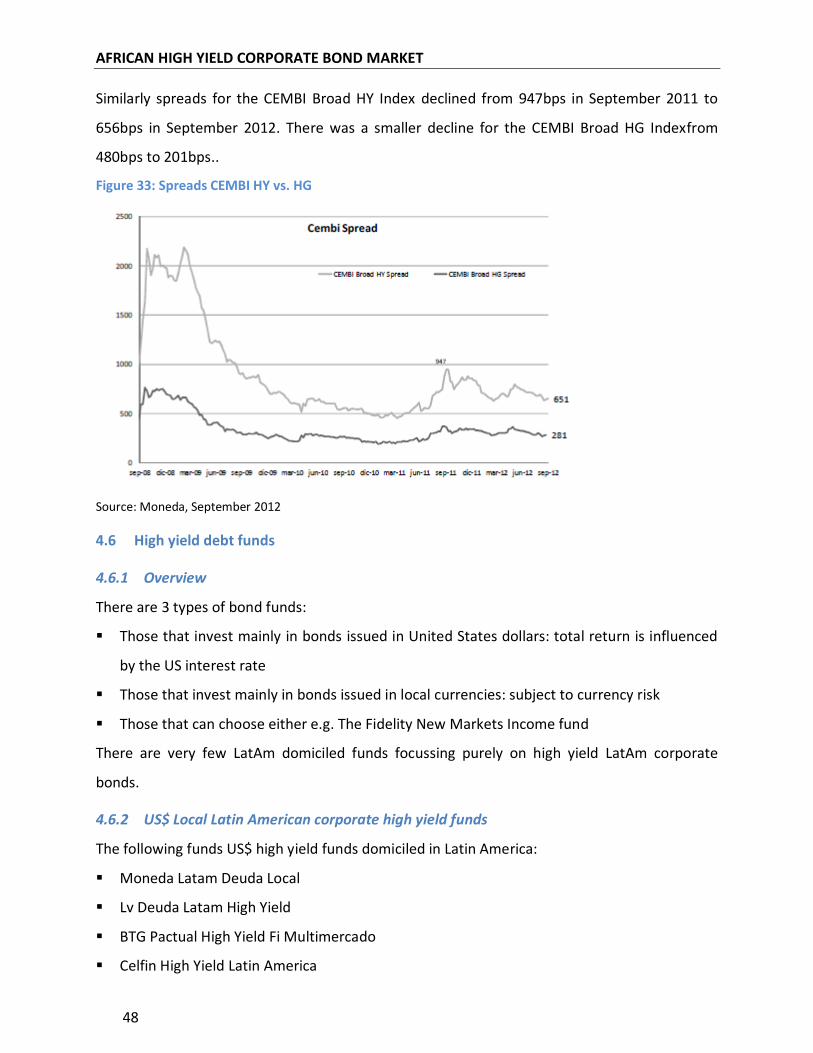
AFRICAN HIGH YIELD CORPORATE BOND MARKET
48
Similarly spreads for the CEMBI Broad HY Index declined from 947bps in September 2011 to
656bps in September 2012. There was a smaller decline for the CEMBI Broad HG Indexfrom
480bps to 201bps..
Figure 33: Spreads CEMBI HY vs. HG
Source: Moneda, September 2012
4.6 High yield debt funds
4.6.1 Overview
There are 3 types of bond funds:
Those that invest mainly in bonds issued in United States dollars: total return is influenced
by the US interest rate
Those that invest mainly in bonds issued in local currencies: subject to currency risk
Those that can choose either e.g. The Fidelity New Markets Income fund
There are very few LatAm domiciled funds focussing purely on high yield LatAm corporate
bonds.
4.6.2 US$ Local Latin American corporate high yield funds
The following funds US$ high yield funds domiciled in Latin America:
Moneda Latam Deuda Local
Lv Deuda Latam High Yield
BTG Pactual High Yield Fi Multimercado
Celfin High Yield Latin America
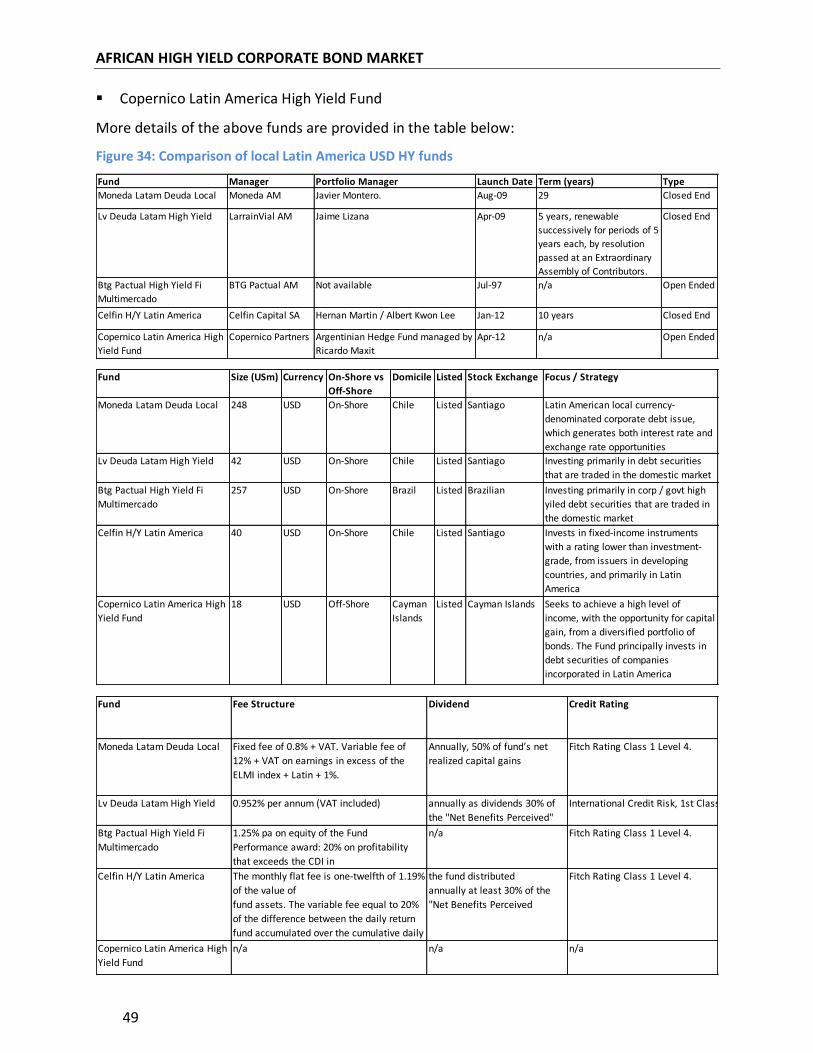
AFRICAN HIGH YIELD CORPORATE BOND MARKET
49
Copernico Latin America High Yield Fund
More details of the above funds are provided in the table below:
Figure 34: Comparison of local Latin America USD HY funds
Fund Manager Portfolio Manager Launch Date Term (years) Type
Moneda Latam Deuda Local Moneda AM Javier Montero. Aug-09 29 Closed End
Lv Deuda Latam High Yield LarrainVial AM Jaime Lizana Apr-09 5 years, renewable
successively for periods of 5
years each, by resolution
passed at an Extraordinary
Assembly of Contributors.
Closed End
Btg Pactual High Yield Fi
Multimercado
BTG Pactual AM Not available Jul-97 n/a Open Ended
Celfin H/Y Latin America Celfin Capital SA Hernan Martin / Albert Kwon Lee Jan-12 10 years Closed End
Copernico Latin America High
Yield Fund
Copernico Partners Argentinian Hedge Fund managed by
Ricardo Maxit
Apr-12 n/a Open Ended
Fund Size (USm) Currency On-Shore vs
Off-Shore
Domicile Listed Stock Exchange Focus / Strategy
Moneda Latam Deuda Local 248 USD On-Shore Chile Listed Santiago Latin American local currency-
denominated corporate debt issue,
which generates both interest rate and
exchange rate opportunities
Lv Deuda Latam High Yield 42 USD On-Shore Chile Listed Santiago Investing primarily in debt securities
that are traded in the domestic market
Btg Pactual High Yield Fi
Multimercado
257 USD On-Shore Brazil Listed Brazilian Investing primarily in corp / govt high
yiled debt securities that are traded in
the domestic market
Celfin H/Y Latin America 40 USD On-Shore Chile Listed Santiago Invests in fixed-income instruments
with a rating lower than investment-
grade, from issuers in developing
countries, and primarily in Latin
America
Copernico Latin America High
Yield Fund
18 USD Off-Shore Cayman
Islands
Listed Cayman Islands Seeks to achieve a high level of
income, with the opportunity for capital
gain, from a diversified portfolio of
bonds. The Fund principally invests in
debt securities of companies
incorporated in Latin America
Fund Fee Structure Dividend Credit Rating
Moneda Latam Deuda Local Fixed fee of 0.8% + VAT. Variable fee of
12% + VAT on earnings in excess of the
ELMI index + Latin + 1%.
Annually, 50% of fund’s net
realized capital gains
Fitch Rating Class 1 Level 4.
Lv Deuda Latam High Yield 0.952% per annum (VAT included) annually as dividends 30% of
the "Net Benefits Perceived"
by the Fund
International Credit Risk, 1st Class Level 4
Btg Pactual High Yield Fi
Multimercado
1.25% pa on equity of the Fund
Performance award: 20% on profitability
that exceeds the CDI in
period, the value of the appropriate daily
n/a Fitch Rating Class 1 Level 4.
Celfin H/Y Latin America The monthly flat fee is one-twelfth of 1.19%
of the value of
fund assets. The variable fee equal to 20%
of the difference between the daily return
fund accumulated over the cumulative daily
return of the benchmark
the fund distributed
annually at least 30% of the
"Net Benefits Perceived
Fitch Rating Class 1 Level 4.
Copernico Latin America High
Yield Fund
n/a n/a n/a
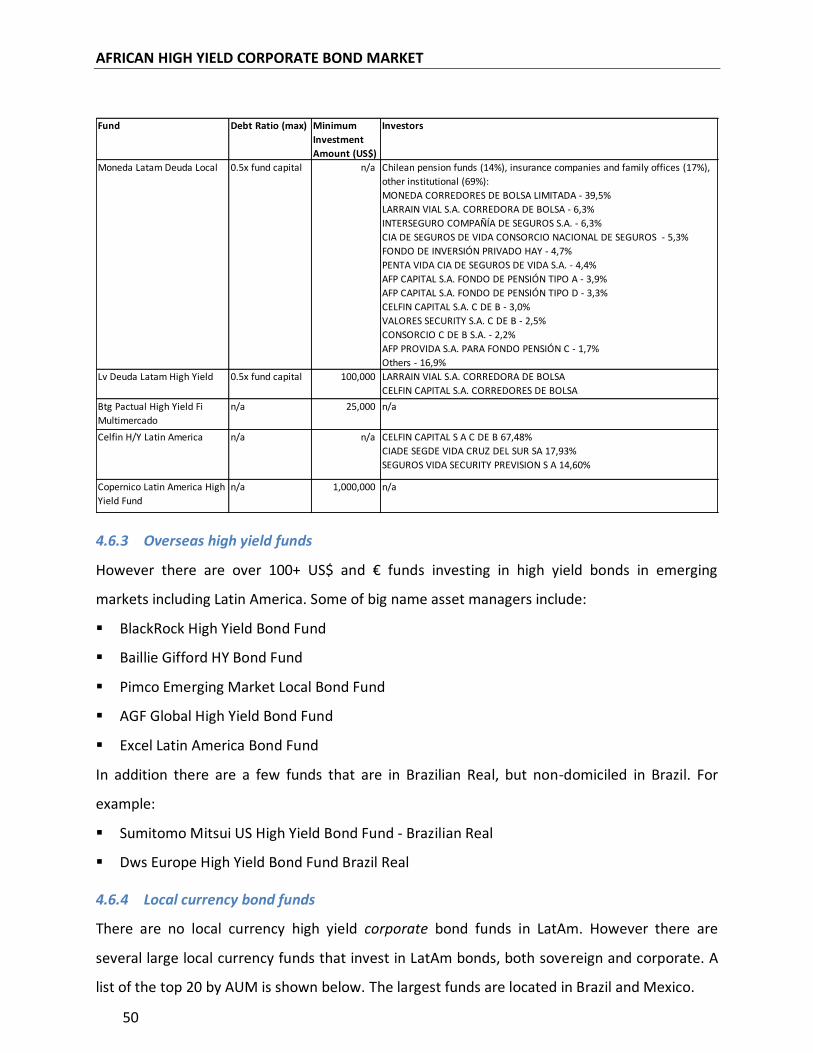
AFRICAN HIGH YIELD CORPORATE BOND MARKET
50
4.6.3 Overseas high yield funds
However there are over 100+ US$ and € funds investing in high yield bonds in emerging
markets including Latin America. Some of big name asset managers include:
BlackRock High Yield Bond Fund
Baillie Gifford HY Bond Fund
Pimco Emerging Market Local Bond Fund
AGF Global High Yield Bond Fund
Excel Latin America Bond Fund
In addition there are a few funds that are in Brazilian Real, but non-domiciled in Brazil. For
example:
Sumitomo Mitsui US High Yield Bond Fund - Brazilian Real
Dws Europe High Yield Bond Fund Brazil Real
4.6.4 Local currency bond funds
There are no local currency high yield corporate bond funds in LatAm. However there are
several large local currency funds that invest in LatAm bonds, both sovereign and corporate. A
list of the top 20 by AUM is shown below. The largest funds are located in Brazil and Mexico.
Fund Debt Ratio (max) Minimum
Investment
Amount (US$)
Investors
Moneda Latam Deuda Local 0.5x fund capital n/a Chilean pension funds (14%), insurance companies and family offices (17%),
other institutional (69%):
MONEDA CORREDORES DE BOLSA LIMITADA - 39,5%
LARRAIN VIAL S.A. CORREDORA DE BOLSA - 6,3%
INTERSEGURO COMPAÑÍA DE SEGUROS S.A. - 6,3%
CIA DE SEGUROS DE VIDA CONSORCIO NACIONAL DE SEGUROS - 5,3%
FONDO DE INVERSIÓN PRIVADO HAY - 4,7%
PENTA VIDA CIA DE SEGUROS DE VIDA S.A. - 4,4%
AFP CAPITAL S.A. FONDO DE PENSIÓN TIPO A - 3,9%
AFP CAPITAL S.A. FONDO DE PENSIÓN TIPO D - 3,3%
CELFIN CAPITAL S.A. C DE B - 3,0%
VALORES SECURITY S.A. C DE B - 2,5%
CONSORCIO C DE B S.A. - 2,2%
AFP PROVIDA S.A. PARA FONDO PENSIÓN C - 1,7%
Others - 16,9%
Lv Deuda Latam High Yield 0.5x fund capital 100,000 LARRAIN VIAL S.A. CORREDORA DE BOLSA
CELFIN CAPITAL S.A. CORREDORES DE BOLSA
Btg Pactual High Yield Fi
Multimercado
n/a 25,000 n/a
Celfin H/Y Latin America n/a n/a CELFIN CAPITAL S A C DE B 67,48%
CIADE SEGDE VIDA CRUZ DEL SUR SA 17,93%
SEGUROS VIDA SECURITY PREVISION S A 14,60%
Copernico Latin America High
Yield Fund
n/a 1,000,000 n/a
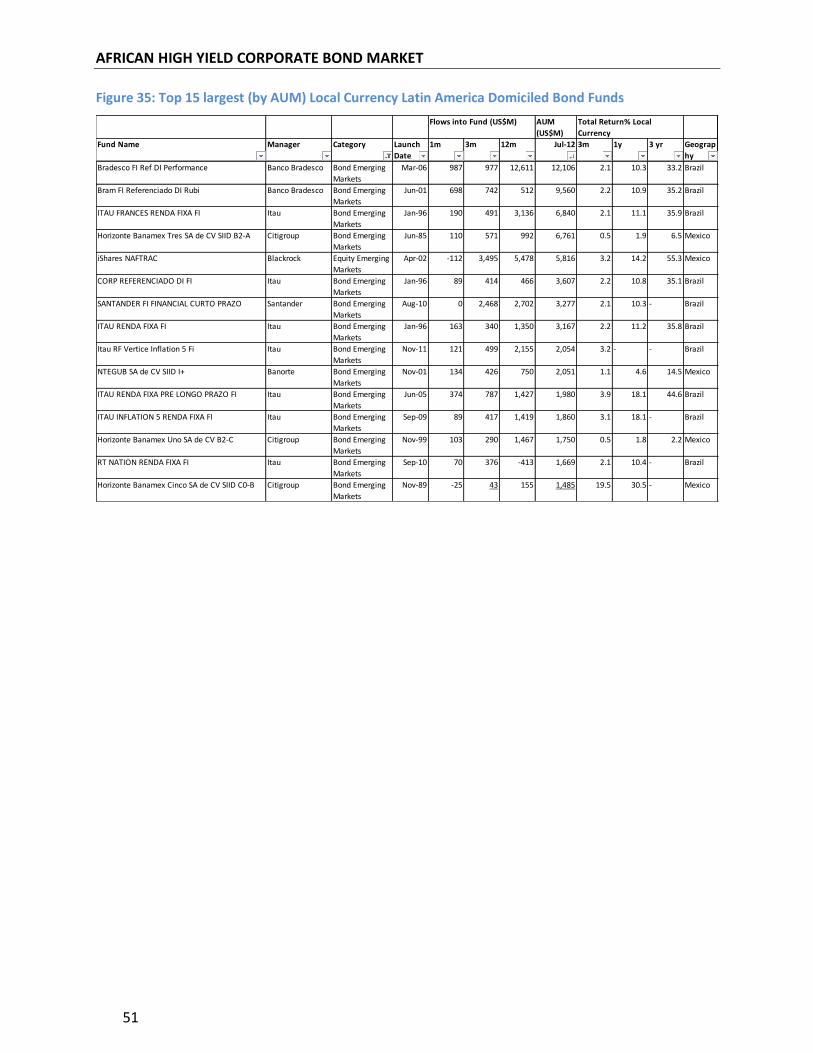
AFRICAN HIGH YIELD CORPORATE BOND MARKET
51
Figure 35: Top 15 largest (by AUM) Local Currency Latin America Domiciled Bond Funds
AUM
(US$M)
Fund Name Manager Category Launch
Date
1m 3m 12m Jul-12 3m 1y 3 yr Geograp
hy
Bradesco FI Ref DI Performance Banco Bradesco Bond Emerging
Markets
Mar-06 987 977 12,611 12,106 2.1 10.3 33.2 Brazil
Bram FI Referenciado DI Rubi Banco Bradesco Bond Emerging
Markets
Jun-01 698 742 512 9,560 2.2 10.9 35.2 Brazil
ITAU FRANCES RENDA FIXA FI Itau Bond Emerging
Markets
Jan-96 190 491 3,136 6,840 2.1 11.1 35.9 Brazil
Horizonte Banamex Tres SA de CV SIID B2-A Citigroup Bond Emerging
Markets
Jun-85 110 571 992 6,761 0.5 1.9 6.5 Mexico
iShares NAFTRAC Blackrock Equity Emerging
Markets
Apr-02 -112 3,495 5,478 5,816 3.2 14.2 55.3 Mexico
CORP REFERENCIADO DI FI Itau Bond Emerging
Markets
Jan-96 89 414 466 3,607 2.2 10.8 35.1 Brazil
SANTANDER FI FINANCIAL CURTO PRAZO Santander Bond Emerging
Markets
Aug-10 0 2,468 2,702 3,277 2.1 10.3 - Brazil
ITAU RENDA FIXA FI Itau Bond Emerging
Markets
Jan-96 163 340 1,350 3,167 2.2 11.2 35.8 Brazil
Itau RF Vertice Inflation 5 Fi Itau Bond Emerging
Markets
Nov-11 121 499 2,155 2,054 3.2 - - Brazil
NTEGUB SA de CV SIID I+ Banorte Bond Emerging
Markets
Nov-01 134 426 750 2,051 1.1 4.6 14.5 Mexico
ITAU RENDA FIXA PRE LONGO PRAZO FI Itau Bond Emerging
Markets
Jun-05 374 787 1,427 1,980 3.9 18.1 44.6 Brazil
ITAU INFLATION 5 RENDA FIXA FI Itau Bond Emerging
Markets
Sep-09 89 417 1,419 1,860 3.1 18.1 - Brazil
Horizonte Banamex Uno SA de CV B2-C Citigroup Bond Emerging
Markets
Nov-99 103 290 1,467 1,750 0.5 1.8 2.2 Mexico
RT NATION RENDA FIXA FI Itau Bond Emerging
Markets
Sep-10 70 376 -413 1,669 2.1 10.4 - Brazil
Horizonte Banamex Cinco SA de CV SIID C0-B Citigroup Bond Emerging
Markets
Nov-89 -25 43 155 1,485 19.5 30.5 - Mexico
Flows into Fund (US$M) Total Return% Local
Currency
AFRICAN HIGH YIELD CORPORATE BOND MARKET
52
5 ASIA
5.1 History and overview of the Asian corporate bond market
In the 1990s, emerging Asian economies experienced recurring financial crises associated with
sudden reversals of capital flows and liquidity shortages due to their excessive reliance on
short-term foreign borrowing. Consequently, the deep impact of the 1997 Asian financial crisis
highlighted the urgent need to develop local-currency bond markets, as the source of longer-
term financing, and reduce the vulnerabilities to double mismatches in maturity and currency in
these economies. Nowadays, given stockpiles of foreign reserves that are close to two-thirds of
the world’s reserves (Chaipravat, 2004), many commentators point out that a bigger problem is
one of inefficiency - Asians are investing heavily in low-yielding foreign assets while foreigners
are investing in high-yielding assets in the Asian domestic markets. As a result, Asian corporate
bond markets have been growing rapidly as Asian borrowers switch from short-term bank loans
towards longer term debt financing.
During the global financial crisis, Asian corporate issuers with low ratings from the international
rating agencies were almost completely shut out from the bond markets. In 2008, Asian high
yield corporate bond issuances constituted only 3% of all bonds with international ratings.
However, by 2011, Asia’s share of foreign currency denominated high yield corporate bond
issuances rated by international agencies had come back to the level of 2005 (approx. 32%).
The two major Asian bond indices are the HSBC Asian Bond Index and the JP Morgan JACI Index.
The Asian high yield corporate bond sector is dominated by China and Indonesia, but also
includes South Korea, the Philippines and Singapore. The high yield portion of the above indices
has grown over the years from around 30% in 2006 to 39% at the end of 2011. The
development of the overall Asian bond market, meaning the bond market for both local and
foreign currencies, has occurred at different speeds to date. The market for bonds
denominated in local currencies totaled USD 5.6 trillion in 2011 (in 1995 this figure was at just
USD 126 billion). However, this includes both corporate and government bonds. And, for
example, government bonds make up almost 75 % of the overall Chinese bond market.
Although the market for Asian corporate bonds is still in its relative youth, corporations from
countries like India and South Korea have issued a large volume of bonds in the past few years.
Further, in the past five years, Chinese companies have issued almost USD 14 billion in local
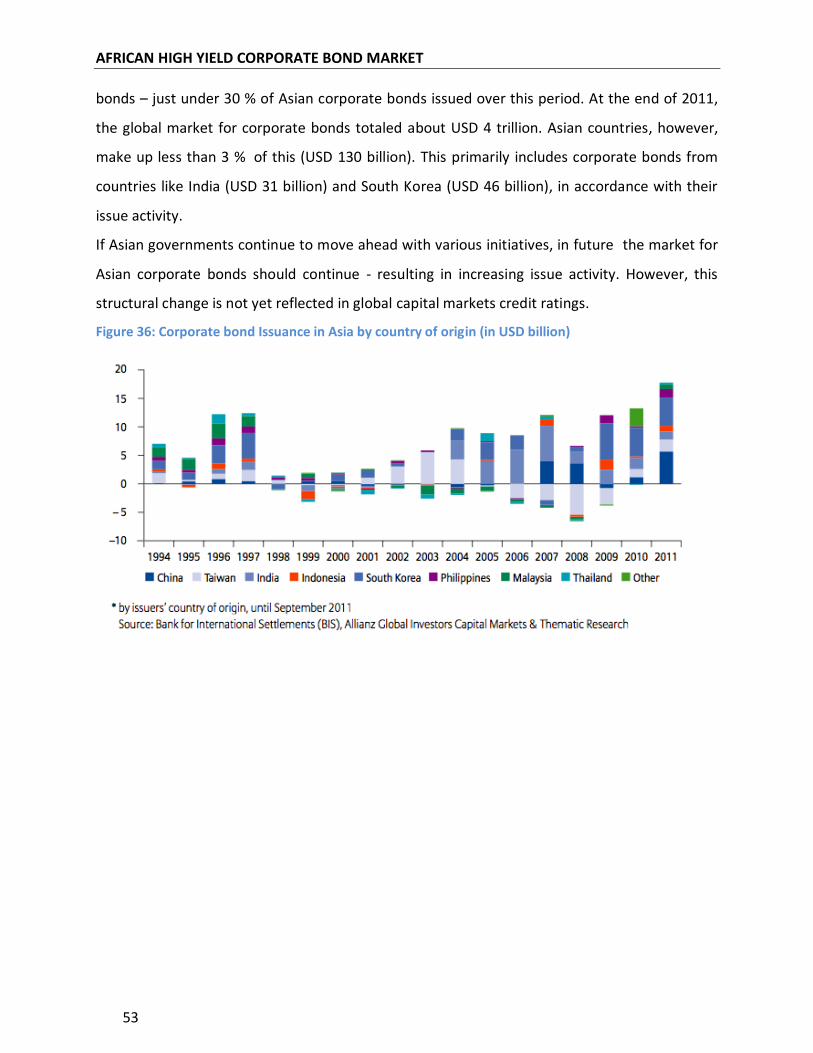
AFRICAN HIGH YIELD CORPORATE BOND MARKET
53
bonds – just under 30 % of Asian corporate bonds issued over this period. At the end of 2011,
the global market for corporate bonds totaled about USD 4 trillion. Asian countries, however,
make up less than 3 %of this (USD 130 billion). This primarily includes corporate bonds from
countries like India (USD 31 billion) and South Korea (USD 46 billion), in accordance with their
issue activity.
If Asian governments continue to move ahead with various initiatives, in futurethe market for
Asian corporate bonds should continue - resulting in increasing issue activity. However, this
structural change is not yet reflected in global capital markets credit ratings.
Figure 36: Corporate bond Issuance in Asia by country of origin (in USD billion)
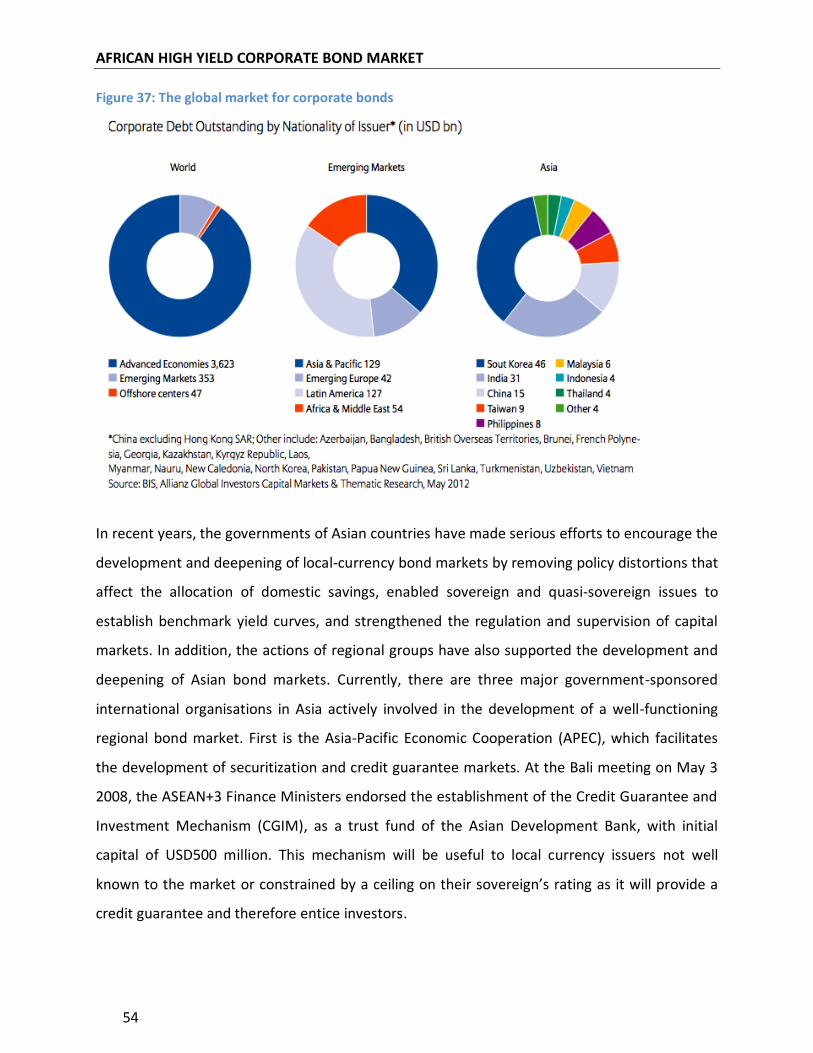
AFRICAN HIGH YIELD CORPORATE BOND MARKET
54
Figure 37: The global market for corporate bonds
In recent years, the governments of Asian countries have made serious efforts to encourage the
development and deepening of local-currency bond markets by removing policy distortions that
affect the allocation of domestic savings, enabled sovereign and quasi-sovereign issues to
establish benchmark yield curves, and strengthened the regulation and supervision of capital
markets. In addition, the actions of regional groups have also supported the development and
deepening of Asian bond markets. Currently, there are three major government-sponsored
international organisations in Asia actively involved in the development of a well-functioning
regional bond market. First is the Asia-Pacific Economic Cooperation (APEC), which facilitates
the development of securitization and credit guarantee markets. At the Bali meeting on May 3
2008, the ASEAN+3 Finance Ministers endorsed the establishment of the Credit Guarantee and
Investment Mechanism (CGIM), as a trust fund of the Asian Development Bank, with initial
capital of USD500 million. This mechanism will be useful to local currency issuers not well
known to the market or constrained by a ceiling on their sovereign’s rating as it will provide a
credit guarantee and therefore entice investors.
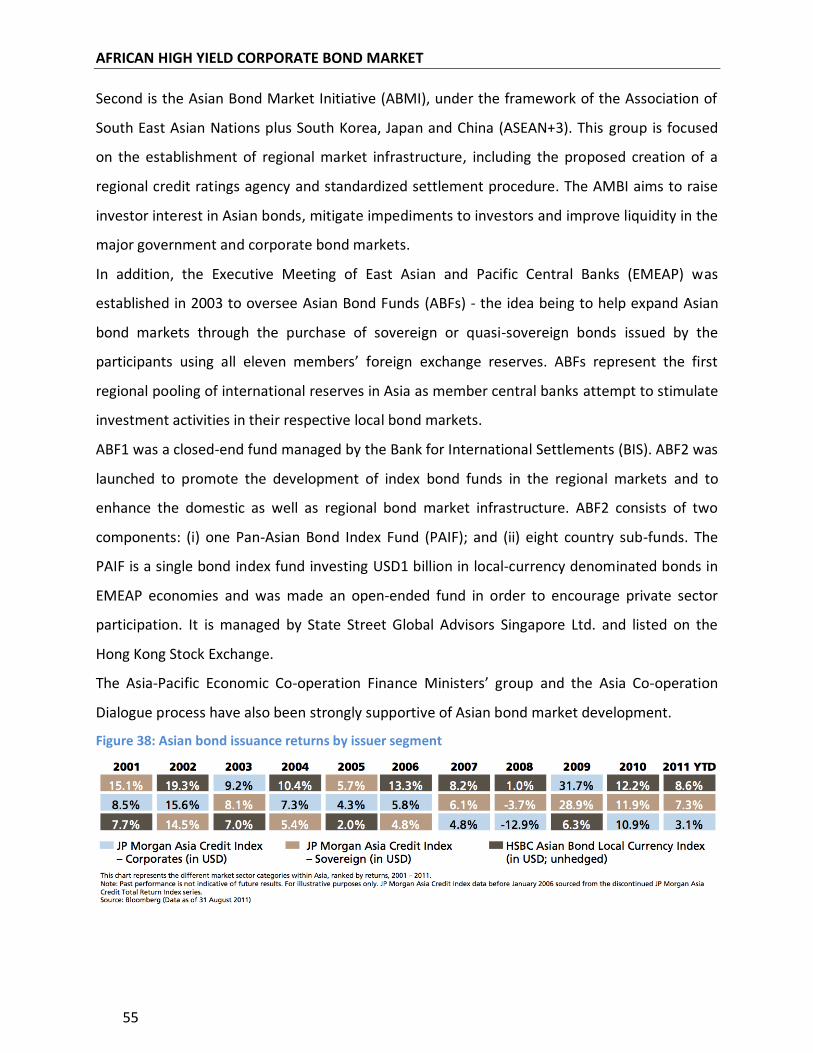
AFRICAN HIGH YIELD CORPORATE BOND MARKET
55
Second is the Asian Bond Market Initiative (ABMI), under the framework of the Association of
South East Asian Nations plus South Korea, Japan and China (ASEAN+3). This group is focused
on the establishment of regional market infrastructure, including the proposed creation of a
regional credit ratings agency and standardized settlement procedure. The AMBI aims to raise
investor interest in Asian bonds, mitigate impediments to investors and improve liquidity in the
major government and corporate bond markets.
In addition, the Executive Meeting of East Asian and Pacific Central Banks (EMEAP) was
established in 2003 to oversee Asian Bond Funds (ABFs) - the idea being to help expand Asian
bond markets through the purchase of sovereign or quasi-sovereign bonds issued by the
participants using all eleven members’ foreign exchange reserves. ABFs represent the first
regional pooling of international reserves in Asia as member central banks attempt to stimulate
investment activities in their respective local bond markets.
ABF1 was a closed-end fund managed by the Bank for International Settlements (BIS). ABF2 was
launched to promote the development of index bond funds in the regional markets and to
enhance the domestic as well as regional bond market infrastructure. ABF2 consists of two
components: (i) one Pan-Asian Bond Index Fund (PAIF); and (ii) eight country sub-funds. The
PAIF is a single bond index fund investing USD1 billion in local-currency denominated bonds in
EMEAP economies and was made an open-ended fund in order to encourage private sector
participation. It is managed by State Street Global Advisors Singapore Ltd. and listed on the
Hong Kong Stock Exchange.
The Asia-Pacific Economic Co-operation Finance Ministers’ group and the Asia Co-operation
Dialogue process have also been strongly supportive of Asian bond market development.
Figure 38: Asian bond issuance returns by issuer segment
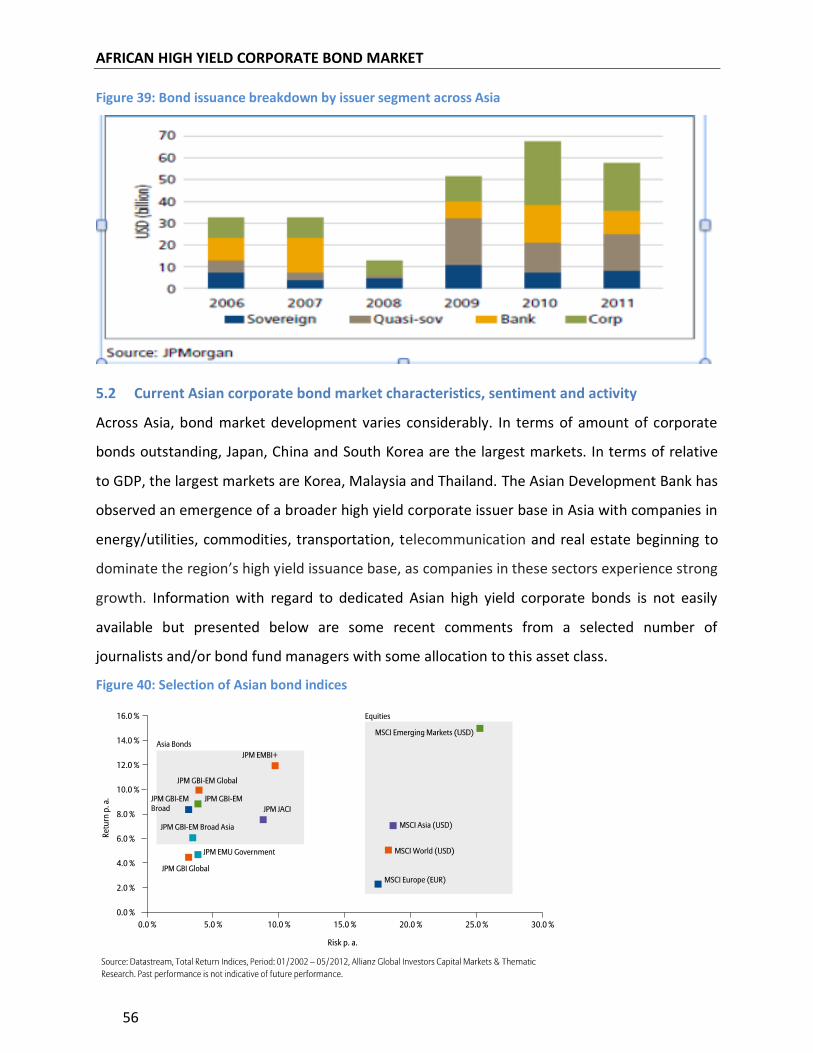
AFRICAN HIGH YIELD CORPORATE BOND MARKET
56
Figure 39: Bond issuance breakdown by issuer segment across Asia
5.2 Current Asian corporate bond market characteristics, sentiment and activity
Across Asia, bond market development varies considerably. In terms of amount of corporate
bonds outstanding, Japan, China and South Korea are the largest markets. In terms of relative
to GDP, the largest markets are Korea, Malaysia and Thailand. The Asian Development Bank has
observed an emergence of a broader high yield corporate issuer base in Asia with companies in
energy/utilities, commodities, transportation, telecommunication and real estate beginning to
dominate the region’s high yield issuance base, as companies in these sectors experience strong
growth. Information with regard to dedicated Asian high yield corporate bonds is not easily
available but presented below are some recent comments from a selected number of
journalists and/or bond fund managers with some allocation to this asset class.
Figure 40: Selection of Asian bond indices
AFRICAN HIGH YIELD CORPORATE BOND MARKET
57
In late September 2012, the FT reported that international bond issuance from Asia,
excluding Japan, burst past the USD 100 billion mark, outstripping by more than USD 20
billion the full-year record set in 2010, as companies and banks look to exploit cheap rates
and a step-up in investor demand. The market has seen USD 106 billion worth of bonds in
the three main international currencies – US dollars, yen and euros – so far this year,
according to Dealogic. Terence Chia, co-head of debt syndicate for Citibank in Asia, said the
USD 100 billion mark was a significant milestone for a market that was issuing just USD 10
billion annually a decade ago. Much of the new debt has come from companies, which have
issued a total of USD 57.4 billion worth of deals, which is USD 20 billion ahead of the same
time last year and USD 14 billion ahead of last year’s full-year total, which was itself a
record. There has also been an uptick in global funds directed to Asian fixed income as the
higher growth and higher yields available in Asia have looked increasingly attractive versus
bond markets in the US or Europe.
Natasha Fukui of the WSJ reported in early 2012 that riskier Asian corporate-bond issuers
are creeping back to the international market. Most of the region's high-yield issuers have
been priced out of the USD market for months, as concerns about the Eurozone and global
economy made investors less risk seeking.
Analysts expect some companies to face liquidity issues if they can't sell bonds in the
coming months. Philipp Lotter at Moody's noted that the ratio of Asian high yield
companies with weak liquidity rose to 12.5% in January 2012, from 9.3% in December.
"There was a notable turn going into 2012. Conditions vary depending on the type of
company, but for every month that passes there will be a build-up in the refinancing
required." China's property sector is experiencing the most serious liquidity pressures, he
added.
However, investors also seem to be paying more attention to the merits and shortcomings
of individual issuers rather than dismissing all speculative-grade borrowers as too risky.
"Going forward, it'll be nice to see high yields more as a function of corporate balance
sheets rather than of geography," said Jim Veneau at HSBC Global Asset Management. "In
contrast to last year, in 2012 we expect to see performance at an individual bond level”.
In China, yields on debt from top-tier high-yield companies have dropped significantly,
making new issuance more affordable. But for a much larger group—including property
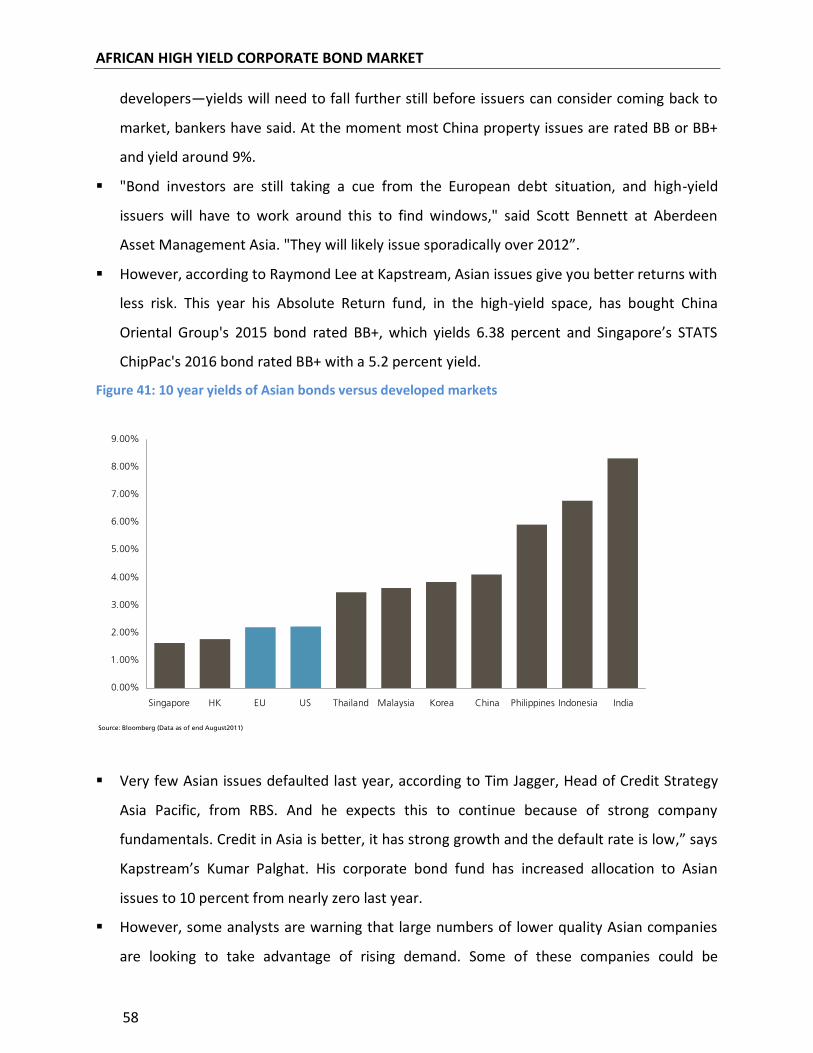
AFRICAN HIGH YIELD CORPORATE BOND MARKET
58
developers—yields will need to fall further still before issuers can consider coming back to
market, bankers have said. At the moment most China property issues are rated BB or BB+
and yield around 9%.
"Bond investors are still taking a cue from the European debt situation, and high-yield
issuers will have to work around this to find windows," said Scott Bennett at Aberdeen
Asset Management Asia. "They will likely issue sporadically over 2012”.
However, according to Raymond Lee at Kapstream, Asian issues give you better returns with
less risk. This year his Absolute Return fund, in the high-yield space, has bought China
Oriental Group's 2015 bond rated BB+, which yields 6.38 percent and Singapore’s STATS
ChipPac's 2016 bond rated BB+ with a 5.2 percent yield.
Figure 41: 10 year yields of Asian bonds versus developed markets
Very few Asian issues defaulted last year, according to Tim Jagger, Head of Credit Strategy
Asia Pacific, from RBS. And he expects this to continue because of strong company
fundamentals. Credit in Asia is better, it has strong growth and the default rate is low,” says
Kapstream’s Kumar Palghat. His corporate bond fund has increased allocation to Asian
issues to 10 percent from nearly zero last year.
However, some analysts are warning that large numbers of lower quality Asian companies
are looking to take advantage of rising demand. Some of these companies could be
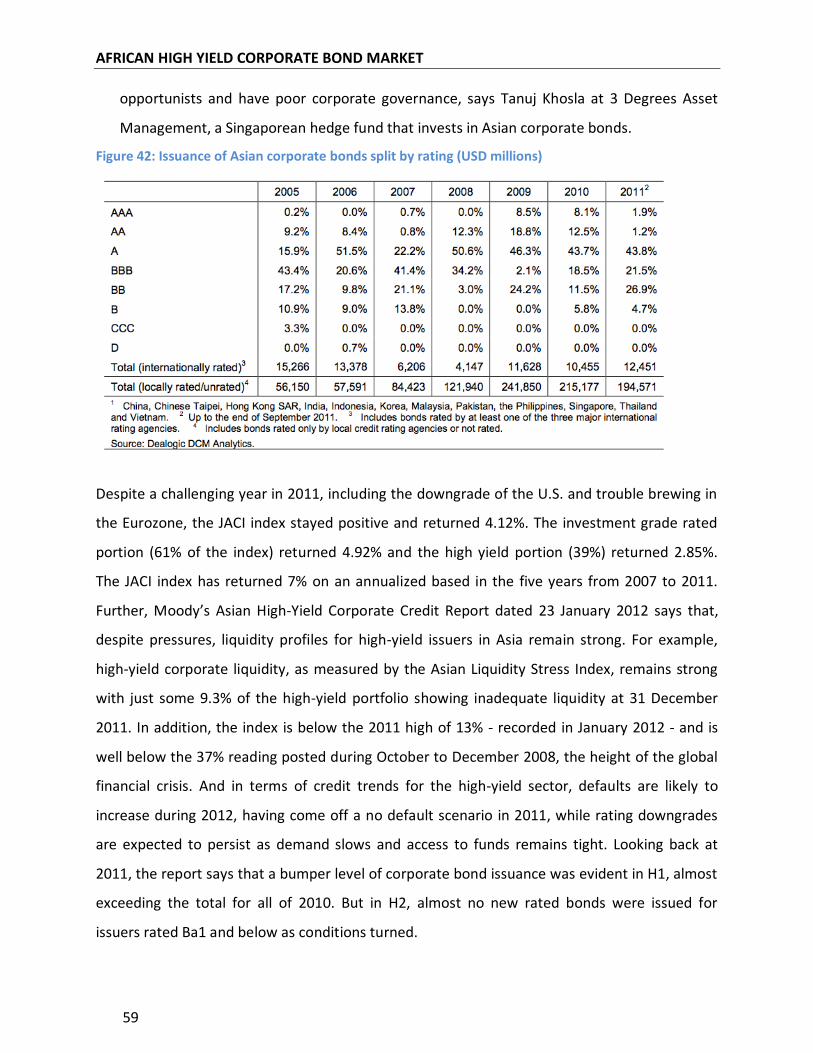
AFRICAN HIGH YIELD CORPORATE BOND MARKET
59
opportunists and have poor corporate governance, says Tanuj Khosla at 3 Degrees Asset
Management, a Singaporean hedge fund that invests in Asian corporate bonds.
Figure 42: Issuance of Asian corporate bonds split by rating (USD millions)
Despite a challenging year in 2011, including the downgrade of the U.S. and trouble brewing in
the Eurozone, the JACI index stayed positive and returned 4.12%. The investment grade rated
portion (61% of the index) returned 4.92% and the high yield portion (39%) returned 2.85%.
The JACI index has returned 7% on an annualized based in the five years from 2007 to 2011.
Further, Moody’s Asian High-Yield Corporate Credit Report dated 23 January 2012 says that,
despite pressures, liquidity profiles for high-yield issuers in Asia remain strong. For example,
high-yield corporate liquidity, as measured by the Asian Liquidity Stress Index, remains strong
with just some 9.3% of the high-yield portfolio showing inadequate liquidity at 31 December
2011. In addition, the index is below the 2011 high of 13% - recorded in January 2012 - and is
well below the 37% reading posted during October to December 2008, the height of the global
financial crisis. And in terms of credit trends for the high-yield sector, defaults are likely to
increase during 2012, having come off a no default scenario in 2011, while rating downgrades
are expected to persist as demand slows and access to funds remains tight. Looking back at
2011, the report says that a bumper level of corporate bond issuance was evident in H1, almost
exceeding the total for all of 2010. But in H2, almost no new rated bonds were issued for
issuers rated Ba1 and below as conditions turned.
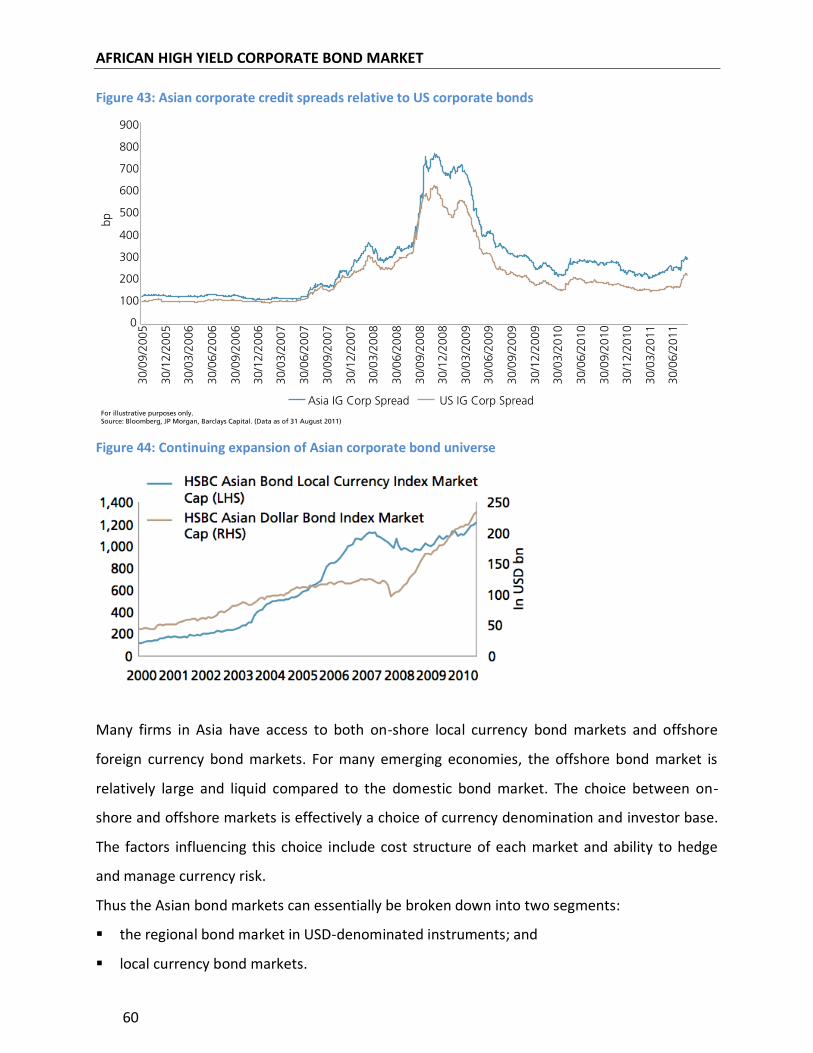
AFRICAN HIGH YIELD CORPORATE BOND MARKET
60
Figure 43: Asian corporate credit spreads relative to US corporate bonds
Figure 44: Continuing expansion of Asian corporate bond universe
Many firms in Asia have access to both on-shore local currency bond markets and offshore
foreign currency bond markets. For many emerging economies, the offshore bond market is
relatively large and liquid compared to the domestic bond market. The choice between on-
shore and offshore markets is effectively a choice of currency denomination and investor base.
The factors influencing this choice include cost structure of each market and ability to hedge
and manage currency risk.
Thus the Asian bond markets can essentially be broken down into two segments:
the regional bond market in USD-denominated instruments; and
local currency bond markets.
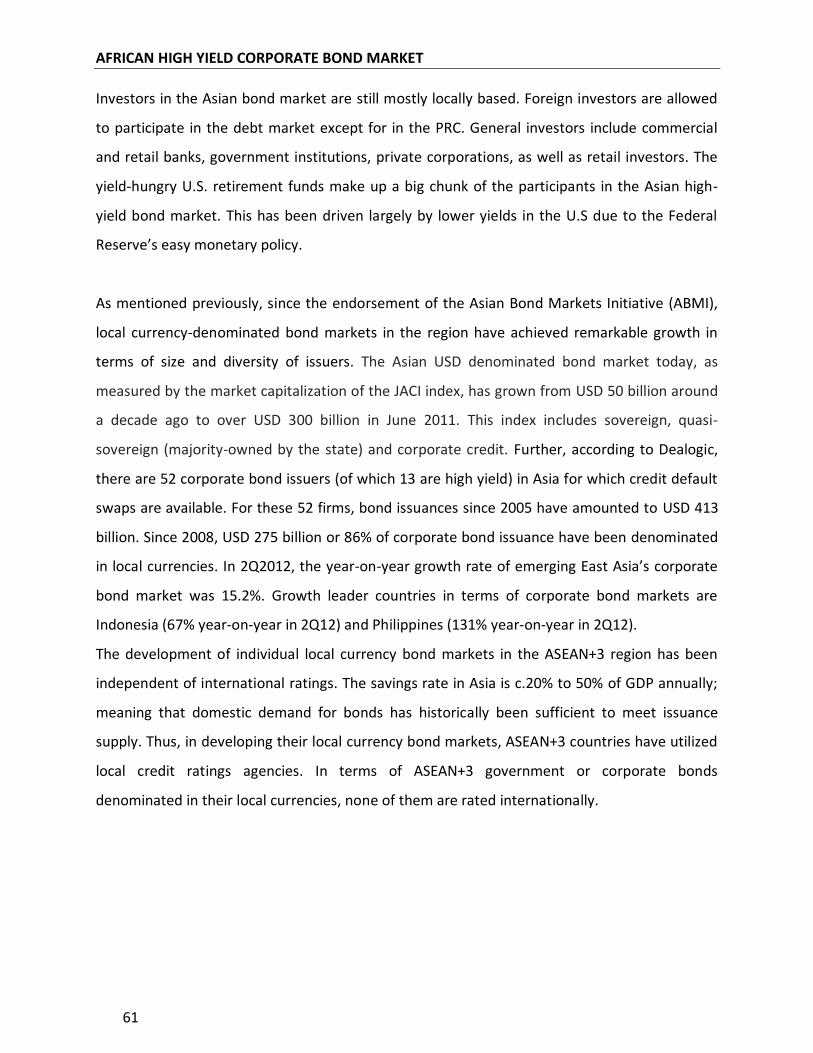
AFRICAN HIGH YIELD CORPORATE BOND MARKET
61
Investors in the Asian bond market are still mostly locally based. Foreign investors are allowed
to participate in the debt market except for in the PRC. General investors include commercial
and retail banks, government institutions, private corporations, as well as retail investors. The
yield-hungry U.S. retirement funds make up a big chunk of the participants in the Asian high-
yield bond market. This has been driven largely by lower yields in the U.S due to the Federal
Reserve’s easy monetary policy.
As mentioned previously, since the endorsement of the Asian Bond Markets Initiative (ABMI),
local currency-denominated bond markets in the region have achieved remarkable growth in
terms of size and diversity of issuers. The Asian USD denominated bond market today, as
measured by the market capitalization of the JACI index, has grown from USD 50 billion around
a decade ago to over USD 300 billion in June 2011. This index includes sovereign, quasi-
sovereign (majority-owned by the state) and corporate credit. Further, according to Dealogic,
there are 52 corporate bond issuers (of which 13 are high yield) in Asia for which credit default
swaps are available. For these 52 firms, bond issuances since 2005 have amounted to USD 413
billion. Since 2008, USD 275 billion or 86% of corporate bond issuance have been denominated
in local currencies. In 2Q2012, the year-on-year growth rate of emerging East Asia’s corporate
bond market was 15.2%. Growth leader countries in terms of corporate bond markets are
Indonesia (67% year-on-year in 2Q12) and Philippines (131% year-on-year in 2Q12).
The development of individual local currency bond markets in the ASEAN+3 region has been
independent of international ratings. The savings rate in Asia is c.20% to 50% of GDP annually;
meaning that domestic demand for bonds has historically been sufficient to meet issuance
supply. Thus, in developing their local currency bond markets, ASEAN+3 countries have utilized
local credit ratings agencies. In terms of ASEAN+3 government or corporate bonds
denominated in their local currencies, none of them are rated internationally.
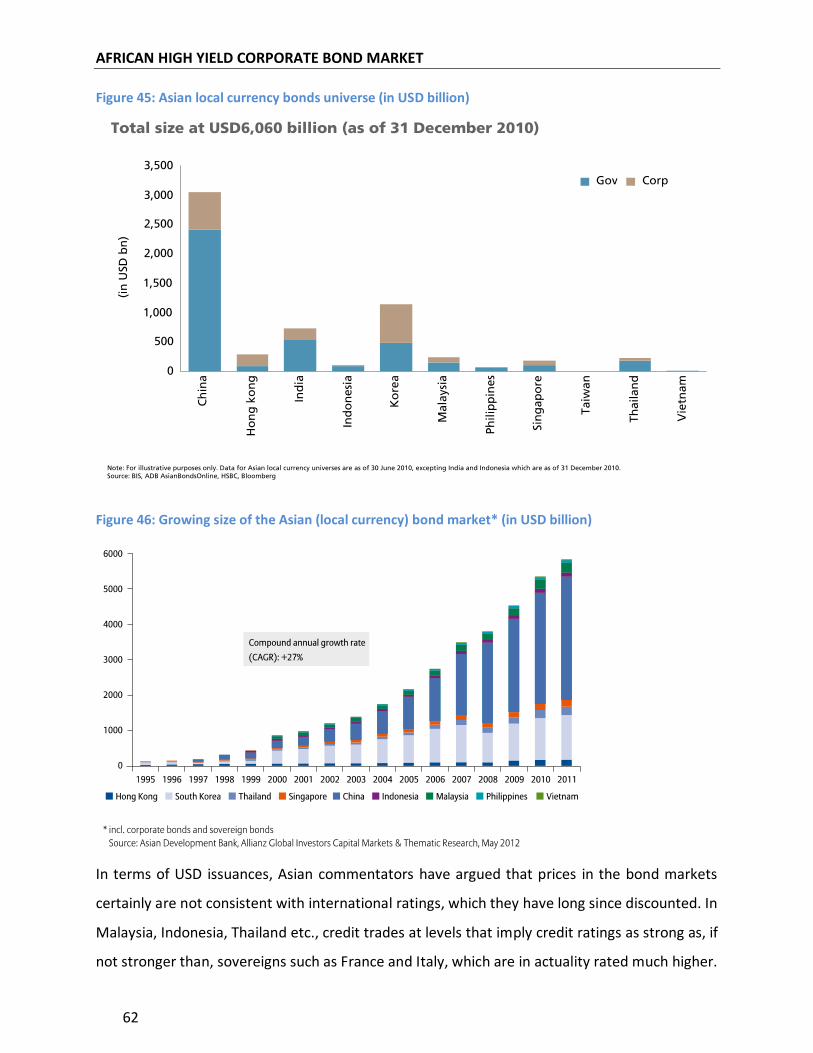
AFRICAN HIGH YIELD CORPORATE BOND MARKET
62
Figure 45: Asian local currency bonds universe (in USD billion)
Figure 46: Growing size of the Asian (local currency) bond market* (in USD billion)
In terms of USD issuances, Asian commentators have argued that prices in the bond markets
certainly are not consistent with international ratings, which they have long since discounted. In
Malaysia, Indonesia, Thailand etc., credit trades at levels that imply credit ratings as strong as, if
not stronger than, sovereigns such as France and Italy, which are in actuality rated much higher.
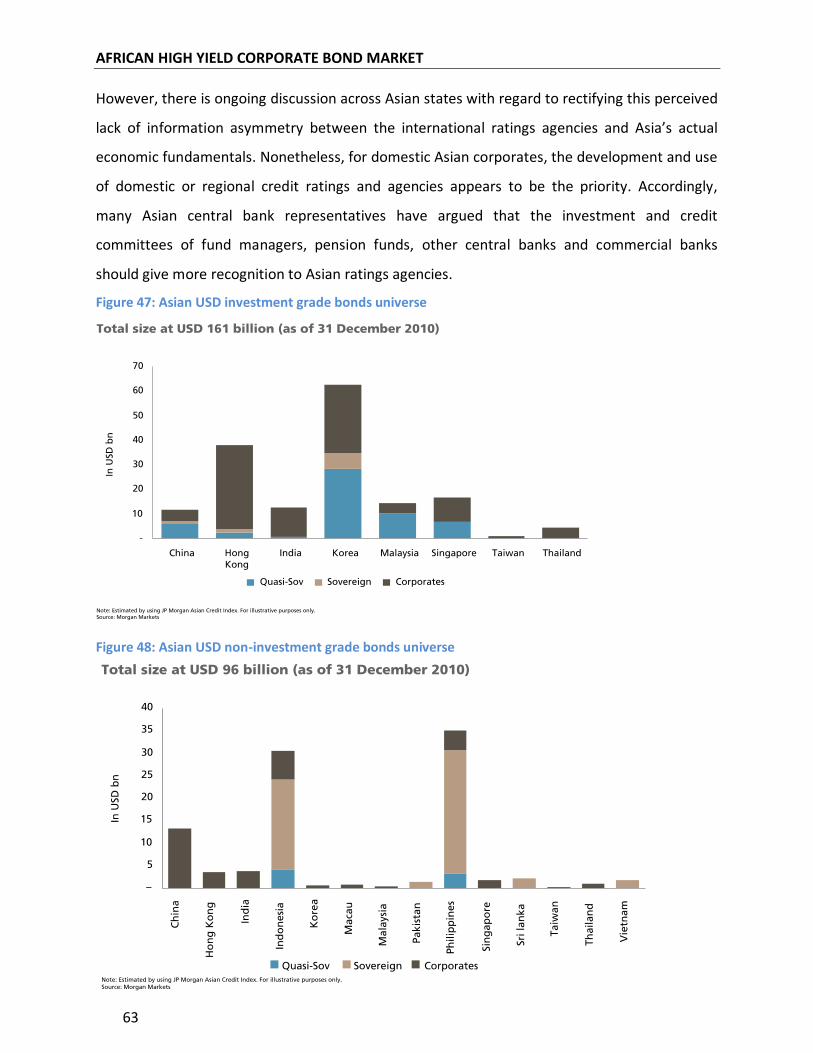
AFRICAN HIGH YIELD CORPORATE BOND MARKET
63
However, there is ongoing discussion across Asian states with regard to rectifying this perceived
lack of information asymmetry between the international ratings agencies and Asia’s actual
economic fundamentals. Nonetheless, for domestic Asian corporates, the development and use
of domestic or regional credit ratings and agencies appears to be the priority. Accordingly,
many Asian central bank representatives have argued that the investment and credit
committees of fund managers, pension funds, other central banks and commercial banks
should give more recognition to Asian ratings agencies.
Figure 47: Asian USD investment grade bonds universe
Figure 48: Asian USD non-investment grade bonds universe
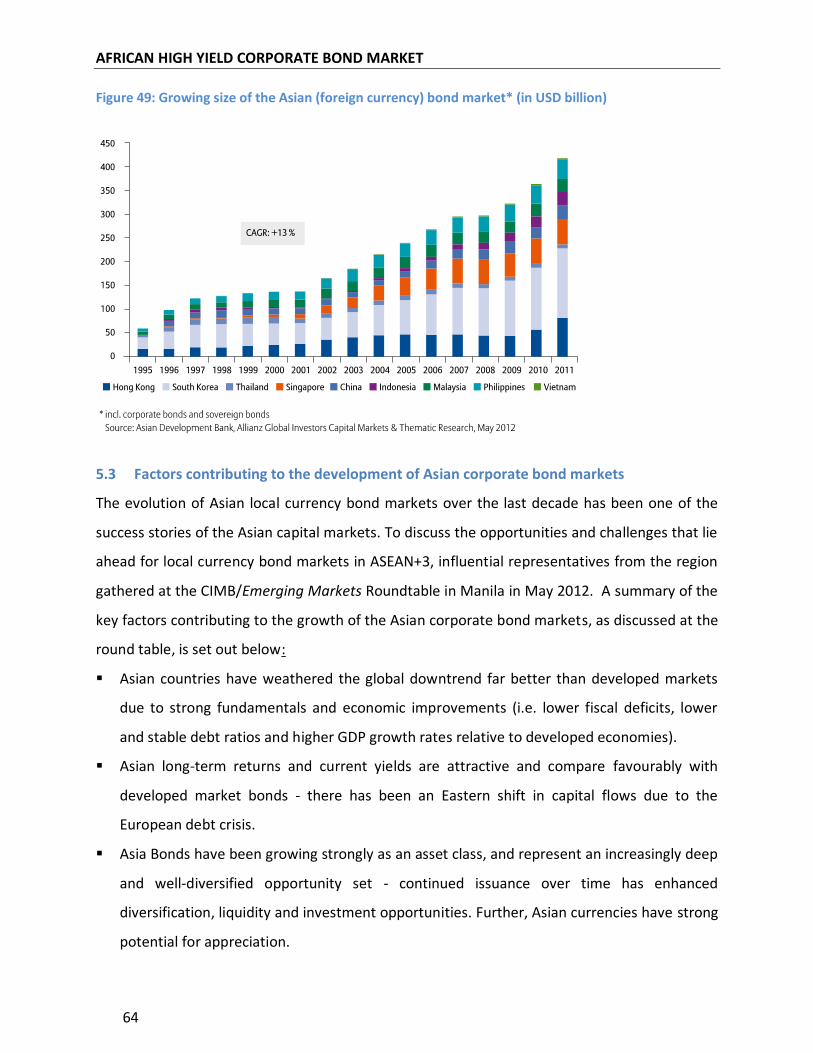
AFRICAN HIGH YIELD CORPORATE BOND MARKET
64
Figure 49: Growing size of the Asian (foreign currency) bond market* (in USD billion)
5.3 Factors contributing to the development of Asian corporate bond markets
The evolution of Asian local currency bond markets over the last decade has been one of the
success stories of the Asian capital markets. To discuss the opportunities and challenges that lie
ahead for local currency bond markets in ASEAN+3, influential representatives from the region
gathered at the CIMB/Emerging Markets Roundtable in Manila in May 2012. A summary of the
key factors contributing to the growth of the Asian corporate bond markets, as discussed at the
round table, is set out below:
Asian countries have weathered the global downtrend far better than developed markets
due to strong fundamentals and economic improvements (i.e. lower fiscal deficits, lower
and stable debt ratios and higher GDP growth rates relative to developed economies).
Asian long-term returns and current yields are attractive and compare favourably with
developed market bonds - there has been an Eastern shift in capital flows due to the
European debt crisis.
Asia Bonds have been growing strongly as an asset class, and represent an increasingly deep
and well-diversified opportunity set - continued issuance over time has enhanced
diversification, liquidity and investment opportunities. Further, Asian currencies have strong
potential for appreciation.
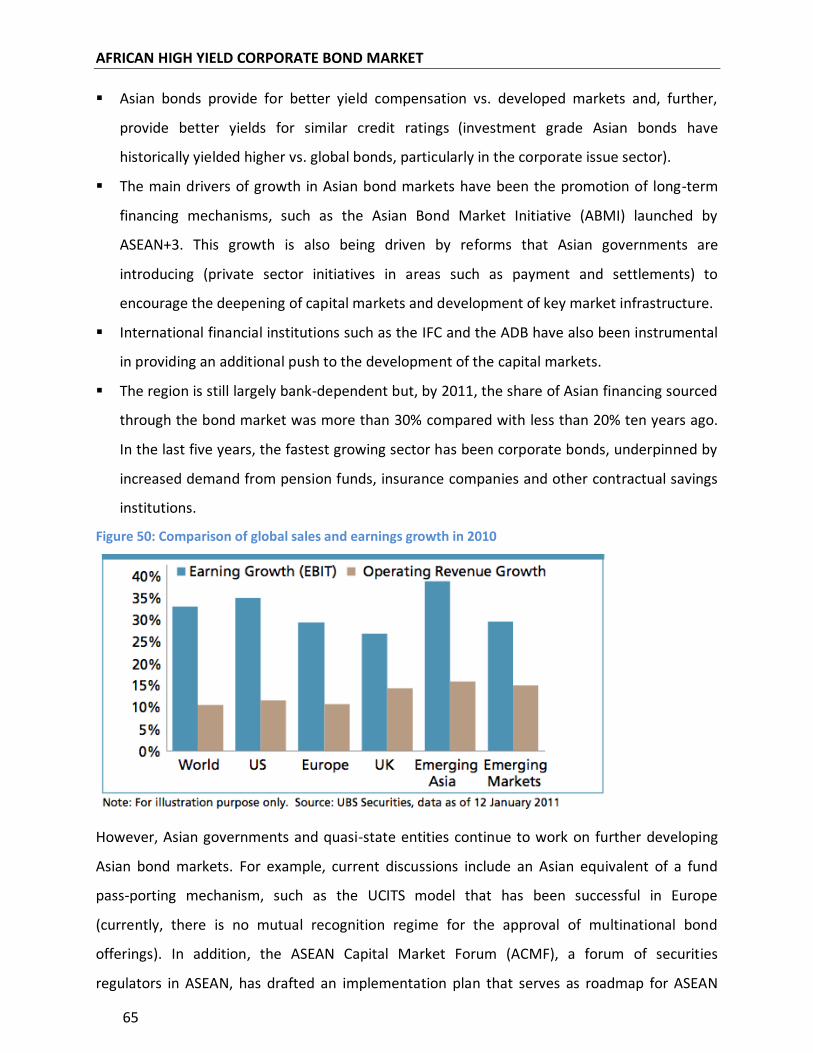
AFRICAN HIGH YIELD CORPORATE BOND MARKET
65
Asian bonds provide for better yield compensation vs. developed markets and, further,
provide better yields for similar credit ratings(investment grade Asian bonds have
historically yielded higher vs. global bonds, particularly in the corporate issue sector).
The main drivers of growth in Asian bond markets have been the promotion of long-term
financing mechanisms, such as the Asian Bond Market Initiative (ABMI) launched by
ASEAN+3. This growth is also being driven by reforms that Asian governments are
introducing (private sector initiatives in areas such as payment and settlements) to
encourage the deepening of capital markets and development of key market infrastructure.
International financial institutions such as the IFC and the ADB have also been instrumental
in providing an additional push to the development of the capital markets.
The region is still largely bank-dependent but, by 2011, the share of Asian financing sourced
through the bond market was more than 30% compared with less than 20% ten years ago.
In the last five years, the fastest growing sector has been corporate bonds, underpinned by
increased demand from pension funds, insurance companies and other contractual savings
institutions.
Figure 50: Comparison of global sales and earnings growth in 2010
However, Asian governments and quasi-state entities continue to work on further developing
Asian bond markets. For example, current discussions include an Asian equivalent of a fund
pass-porting mechanism, such as the UCITS model that has been successful in Europe
(currently, there is no mutual recognition regime for the approval of multinational bond
offerings). In addition, the ASEAN Capital Market Forum (ACMF), a forum of securities
regulators in ASEAN, has drafted an implementation plan that serves as roadmap for ASEAN
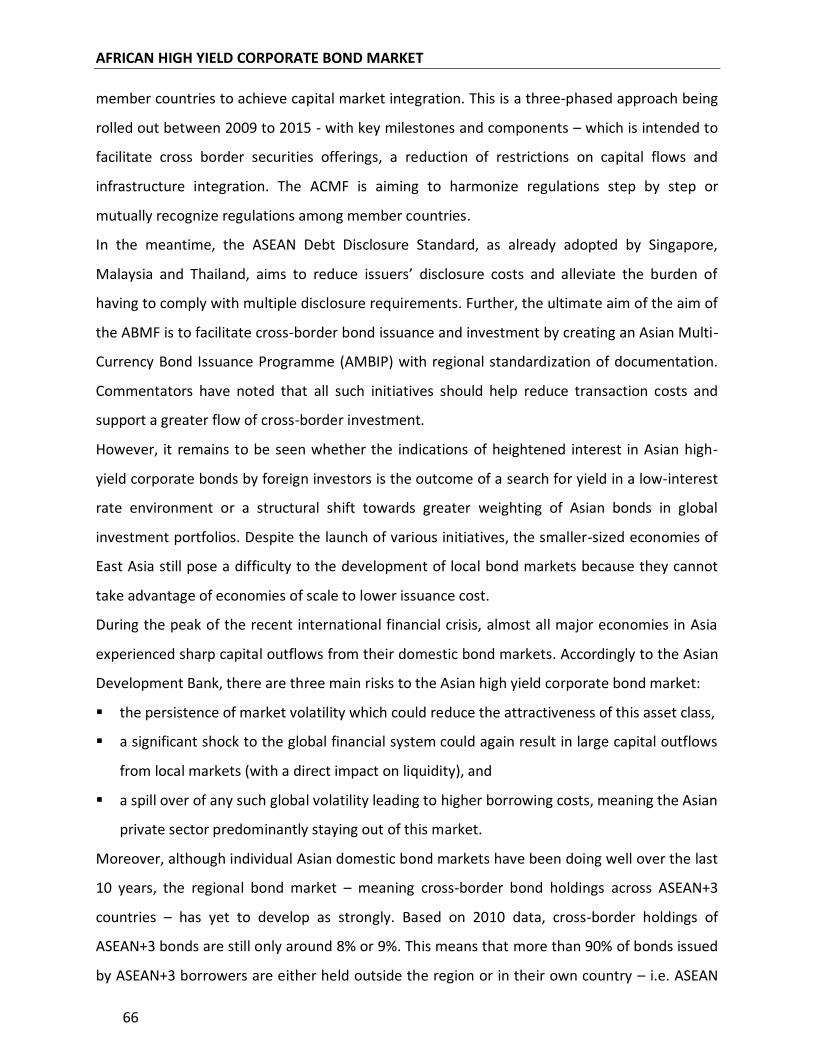
AFRICAN HIGH YIELD CORPORATE BOND MARKET
66
member countries to achieve capital market integration. This is a three-phased approach being
rolled out between 2009 to 2015 - with key milestones and components – which is intended to
facilitate cross border securities offerings, a reduction of restrictions on capital flows and
infrastructure integration. The ACMF is aiming to harmonize regulations step by step or
mutually recognize regulations among member countries.
In the meantime, the ASEAN Debt Disclosure Standard, as already adopted by Singapore,
Malaysia and Thailand, aims to reduce issuers’ disclosure costs and alleviate the burden of
having to comply with multiple disclosure requirements. Further, the ultimate aim of the aim of
the ABMF is to facilitate cross-border bond issuance and investment by creating an Asian Multi-
Currency Bond Issuance Programme (AMBIP) with regional standardization of documentation.
Commentators have noted that all such initiatives should help reduce transaction costs and
support a greater flow of cross-border investment.
However, it remains to be seen whether the indications of heightened interest in Asian high-
yield corporate bonds by foreign investors is the outcome of a search for yield in a low-interest
rate environment or a structural shift towards greater weighting of Asian bonds in global
investment portfolios. Despite the launch of various initiatives, the smaller-sized economies of
East Asia still pose a difficulty to the development of local bond markets because they cannot
take advantage of economies of scale to lower issuance cost.
During the peak of the recent international financial crisis, almost all major economies in Asia
experienced sharp capital outflows from their domestic bond markets. Accordingly to the Asian
Development Bank, there are three main risks to the Asian high yield corporate bond market:
the persistence of market volatility which could reduce the attractiveness of this asset class,
a significant shock to the global financial system could again result in large capital outflows
from local markets (with a direct impact on liquidity), and
a spill over of any such global volatility leading to higher borrowing costs, meaning the Asian
private sector predominantly staying out of this market.
Moreover, although individual Asian domestic bond markets have been doing well over the last
10 years, the regional bond market – meaning cross-border bond holdings across ASEAN+3
countries – has yet to develop as strongly. Based on 2010 data, cross-border holdings of
ASEAN+3 bonds are still only around 8% or 9%. This means that more than 90% of bonds issued
by ASEAN+3 borrowers are either held outside the region or in their own country – i.e. ASEAN
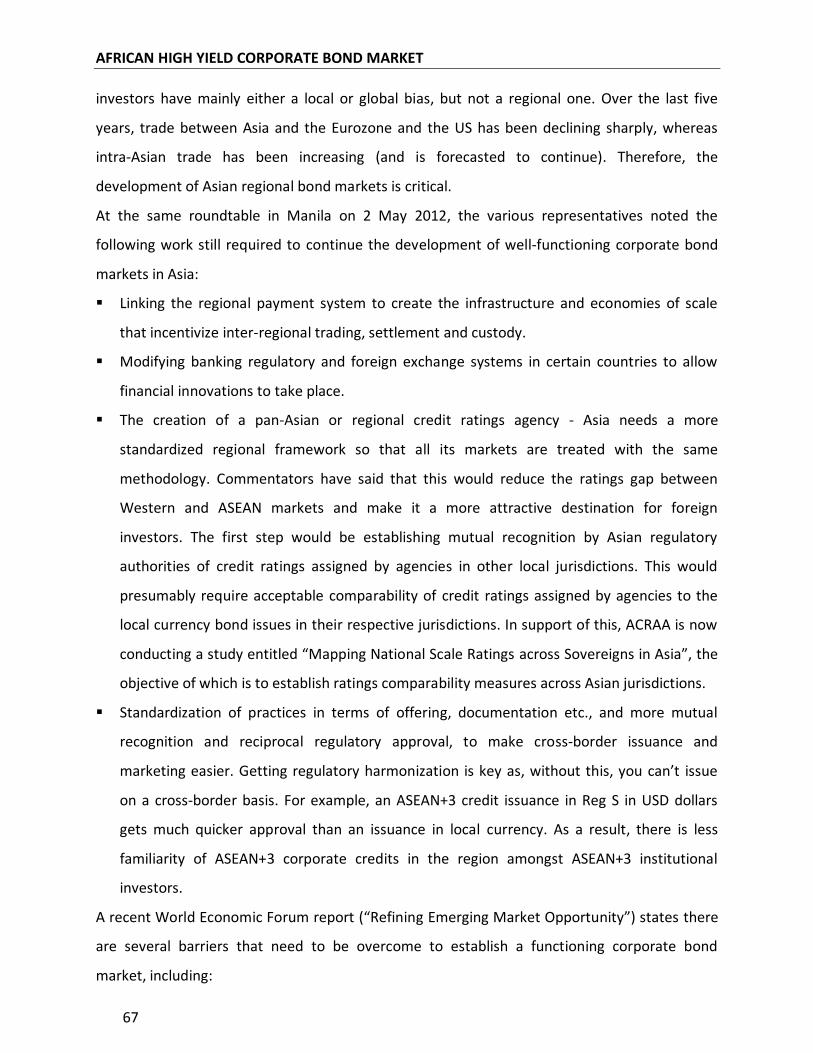
AFRICAN HIGH YIELD CORPORATE BOND MARKET
67
investors have mainly either a local or global bias, but not a regional one. Over the last five
years, trade between Asia and the Eurozone and the US has been declining sharply, whereas
intra-Asian trade has been increasing (and is forecasted to continue). Therefore, the
development of Asian regional bond markets is critical.
At the same roundtable in Manila on 2 May 2012, the various representatives noted the
following work still required to continue the development of well-functioning corporate bond
markets in Asia:
Linking the regional payment system to create the infrastructure and economies of scale
that incentivize inter-regional trading, settlement and custody.
Modifying banking regulatory and foreign exchange systems in certain countries to allow
financial innovations to take place.
The creation of a pan-Asian or regional credit ratings agency - Asia needs a more
standardized regional framework so that all its markets are treated with the same
methodology. Commentators have said that this would reduce the ratings gap between
Western and ASEAN markets and make it a more attractive destination for foreign
investors. The first step would be establishing mutual recognition by Asian regulatory
authorities of credit ratings assigned by agencies in other local jurisdictions. This would
presumably require acceptable comparability of credit ratings assigned by agencies to the
local currency bond issues in their respective jurisdictions. In support of this, ACRAA is now
conducting a study entitled “Mapping National Scale Ratings across Sovereigns in Asia”, the
objective of which is to establish ratings comparability measures across Asian jurisdictions.
Standardization of practices in terms of offering, documentation etc., and more mutual
recognition and reciprocal regulatory approval, to make cross-border issuance and
marketing easier. Getting regulatory harmonization is key as, without this, you can’t issue
on a cross-border basis. For example, an ASEAN+3 credit issuance in Reg S in USD dollars
gets much quicker approval than an issuance in local currency. As a result, there is less
familiarity of ASEAN+3 corporate credits in the region amongst ASEAN+3 institutional
investors.
A recent World Economic Forum report (“Refining Emerging Market Opportunity”) states there
are several barriers that need to be overcome to establish a functioning corporate bond
market, including:
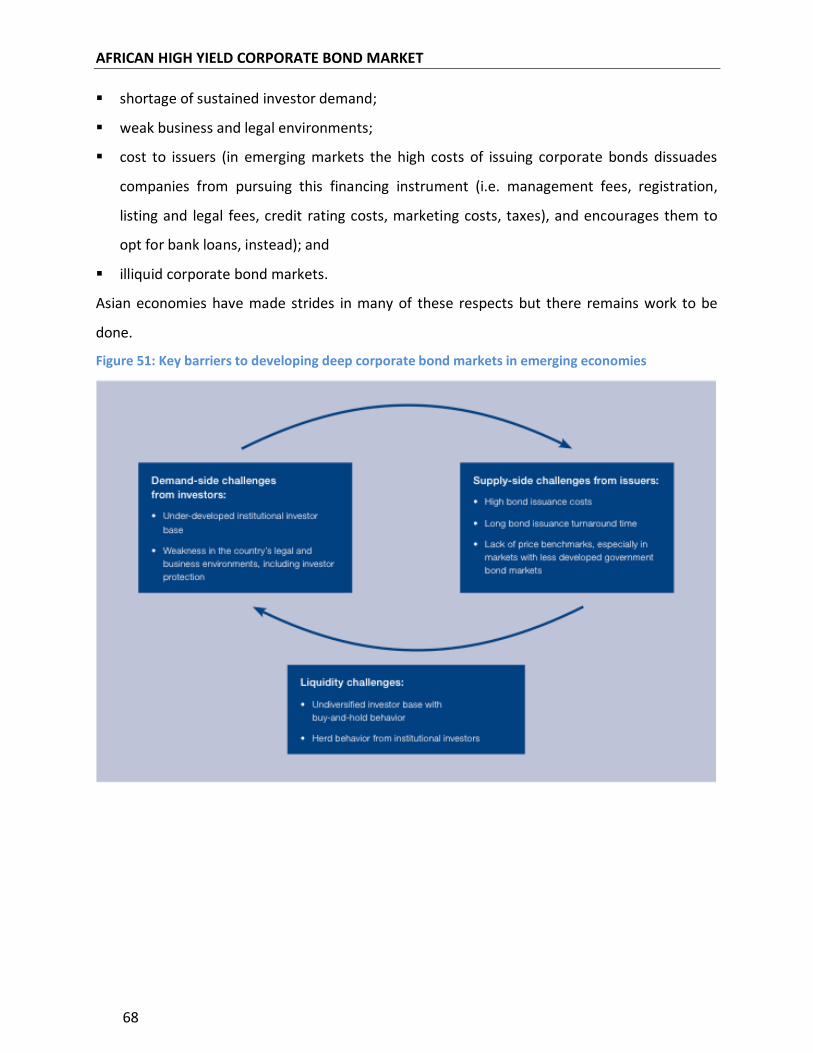
AFRICAN HIGH YIELD CORPORATE BOND MARKET
68
shortage of sustained investor demand;
weak business and legal environments;
cost to issuers (in emerging markets the high costs of issuing corporate bonds dissuades
companies from pursuing this financing instrument (i.e. management fees, registration,
listing and legal fees, credit rating costs, marketing costs, taxes), and encourages them to
opt for bank loans, instead); and
illiquid corporate bond markets.
Asian economies have made strides in many of these respects but there remains work to be
done.
Figure 51: Key barriers to developing deep corporate bond markets in emerging economies

AFRICAN HIGH YIELD CORPORATE BOND MARKET
69
6 SOURCES
Various website (a detailed list can be provided on request), Bloomberg, ADB publications, BIS
working papers, selected financial press articles, other financial websites, Moody’s, Asiamoney,
Dealogic, FT.com, World Economic Forum papers, Asian+3 working papers/reports, selected
equity research, selected academic articles, IMF publications.