Embed Size (px)
Citation preview
November 2018
Page Content 3 Executive Summary: The Mid-Atlantic Metropolitan Statistical Areas ‘At A Glance’ 6 Washington D.C. Metropolitan Area 15 Baltimore Metropolitan Area 24 Richmond Metropolitan Area 33 Philadelphia Metropolitan Area 42 The Triangle, NC Area 51 Charlottesville Area 60 Hampton Roads Area 69 Roanoke, VA Area 78 Wilmington, DE Area 87 Eastern Shore MD/DE Area
Appendix 96 References & Definitions 98 Contacts & Disclaimers
2
3
Baltimore Metropolitan Area
Sold vs. List Price
Vs. Year AgoVs. Year Ago
Units Sold Active Inventory Median Sale Price Days On Market
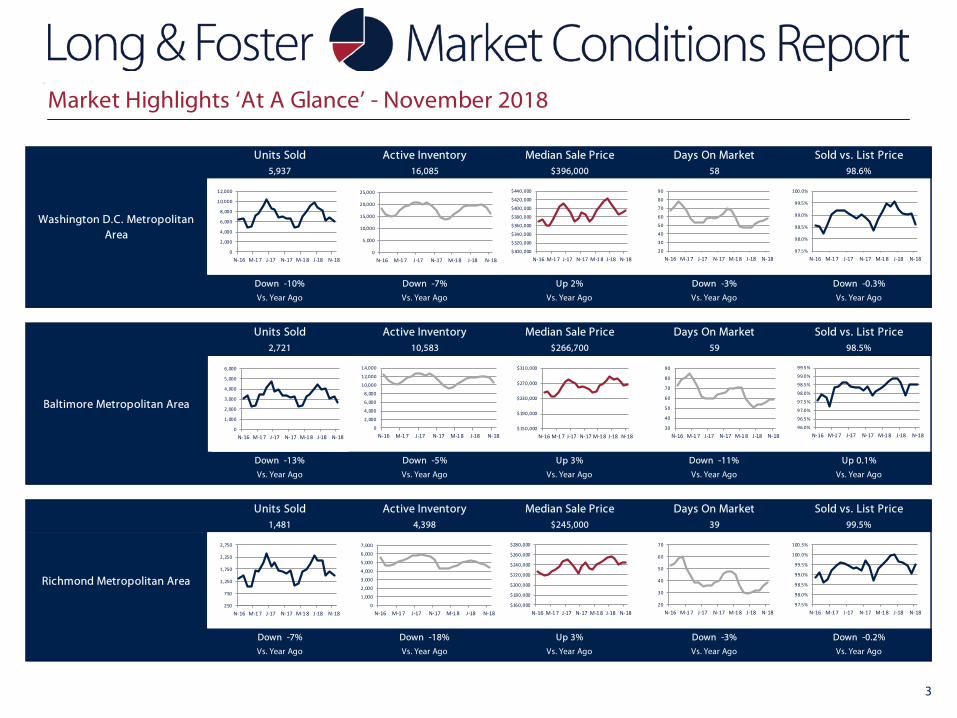
Down -13% Down -5% Up 3%
Vs. Year Ago Vs. Year Ago Vs. Year Ago
Down -11% Up 0.1%
98.5%2,721 10,583 $266,700 59
Units Sold Active Inventory Median Sale Price Days On Market Sold vs. List Price5,937 16,085 $396,000 58 98.6%
Washington D.C. Metropolitan Area
Down -10% Down -7% Up 2% Down -3% Down -0.3%
Vs. Year Ago Vs. Year Ago Vs. Year Ago Vs. Year Ago Vs. Year Ago
Units Sold Active Inventory Median Sale Price Days On Market Sold vs. List Price1,481 4,398 $245,000 39 99.5%
Richmond Metropolitan Area
Down -7% Down -18% Up 3% Down -3% Down -0.2%
Vs. Year Ago Vs. Year Ago Vs. Year Ago Vs. Year Ago Vs. Year Ago
0
1,000
2,000
3,000
4,000
5,000
6,000
N-16 M-1 7 J-17 N-17 M-1 8 J-18 N-18
0
2,000
4,000
6,000
8,000
10,000
12,000
14,000
N-16 M-1 7 J-17 N-17 M-1 8 J-18 N-18$150,000
$190,000
$230,000
$270,000
$310,000
N-16 M-1 7 J-17 N-17 M-1 8 J-18 N-1830
40
50
60
70
80
90
N-16 M-1 7 J-17 N-17 M-1 8 J-18 N-18
0
2,000
4,000
6,000
8,000
10,000
12,000
N-16 M-1 7 J-17 N-17 M-1 8 J-18 N-18$300,000
$320,000
$340,000
$360,000
$380,000
$400,000
$420,000
$440,000
N-16 M-1 7 J-17 N-17 M-1 8 J-18 N-1820
30
40
50
60
70
80
90
N-16 M-1 7 J-17 N-17 M-1 8 J-18 N-180
5,000
10,000
15,000
20,000
25,000
N-16 M-1 7 J-17 N-17 M-1 8 J-18 N-18
97.5%
98.0%
98.5%
99.0%
99.5%
100.0%
N-16 M-1 7 J-17 N-17 M-1 8 J-18 N-18
250
750
1,250
1,750
2,250
2,750
N-16 M-1 7 J-17 N-17 M-1 8 J-18 N-18$160,000
$180,000
$200,000
$220,000
$240,000
$260,000
$280,000
N-16 M-1 7 J-17 N-17 M-1 8 J-18 N-1820
30
40
50
60
70
N-16 M-1 7 J-17 N-17 M-1 8 J-18 N-180
1,000
2,000
3,000
4,000
5,000
6,000
7,000
N-16 M-1 7 J-17 N-17 M-1 8 J-18 N-1897.5%
98.0%
98.5%
99.0%
99.5%
100.0%
100.5%
N-16 M-1 7 J-17 N-17 M-1 8 J-18 N-18
96.0%
96.5%
97.0%
97.5%
98.0%
98.5%
99.0%
99.5%
N-16 M-1 7 J-17 N-17 M-1 8 J-18 N-18
Market Highlights ‘At A Glance’ - November 2018

4
Up 3.0%
Vs. Year Ago Vs. Year Ago Vs. Year Ago Vs. Year Ago Vs. Year Ago
Charlottesville Area
Down -4% Down -12% Up 14% No Change
252 983 $320,000 79 97.7%
Units Sold Active Inventory Median Sale Price Days On Market Sold vs. List Price
Up 0.3%
Vs. Year Ago Vs. Year Ago Vs. Year Ago Vs. Year Ago Vs. Year Ago
Philadelphia Metropolitan Area
Down -2% Down -20% Up 3% Down -2%
5,448 18,596 $230,000 52 97.6%
Units Sold Active Inventory Median Sale Price Days On Market Sold vs. List Price
Units Sold Active Inventory Median Sale Price Days On Market Sold vs. List Price2,841 7,246 $280,000 53 98.9%
The Triangle, NC Area
Down -1% Down -5% Up 7% Up 15% Up 0.2%
Vs. Year Ago Vs. Year Ago Vs. Year Ago Vs. Year Ago Vs. Year Ago
1,0002,0003,0004,0005,0006,0007,0008,0009,000
N-16 M-1 7 J-17 N-17 M-1 8 J-18 N-18$170,000
$190,000
$210,000
$230,000
$250,000
$270,000
N-16 M-1 7 J-17 N-17 M-1 8 J-18 N-1840
50
60
70
80
N-16 M-1 7 J-17 N-17 M-1 8 J-18 N-180
5,000
10,000
15,000
20,000
25,000
30,000
N-16 M-1 7 J-17 N-17 M-1 8 J-18 N-1895.5%
96.0%
96.5%
97.0%
97.5%
98.0%
98.5%
N-16 M-1 7 J-17 N-17 M-1 8 J-18 N-18
5001,0001,5002,0002,5003,0003,5004,0004,500
N-16 M-1 7 J-17 N-17 M-1 8 J-18 N-18$210,000$220,000$230,000$240,000$250,000$260,000$270,000$280,000$290,000
N-16 M-1 7 J-17 N-17 M-1 8 J-18 N-1830
35
40
45
50
55
60
N-16 M-1 7 J-17 N-17 M-1 8 J-18 N-180
2,000
4,000
6,000
8,000
10,000
N-16 M-1 7 J-17 N-17 M-1 8 J-18 N-1897.0%
97.5%
98.0%
98.5%
99.0%
99.5%
100.0%
N-16 M-1 7 J-17 N-17 M-1 8 J-18 N-18
0
100
200
300
400
500
N-16 M-1 7 J-17 N-17 M-1 8 J-18 N-18$200,000$220,000$240,000$260,000$280,000$300,000$320,000$340,000$360,000
N-16 M-1 7 J-17 N-17 M-1 8 J-18 N-18
40
50
60
70
80
90
100
110
N-16 M-1 7 J-17 N-17 M-1 8 J-18 N-180
300
600
900
1,200
1,500
1,800
N-16 M-1 7 J-17 N-17 M-1 8 J-18 N-1893.0%
94.0%
95.0%
96.0%
97.0%
98.0%
99.0%
N-16 M-1 7 J-17 N-17 M-1 8 J-18 N-18
Market Highlights ‘At A Glance’ - November 2018
5
Market Highlights ‘At A Glance’ - November 2018
Roanoke Metropolitan Area
Units Sold Active Inventory Median Sale Price Days On Market Sold vs. List Price
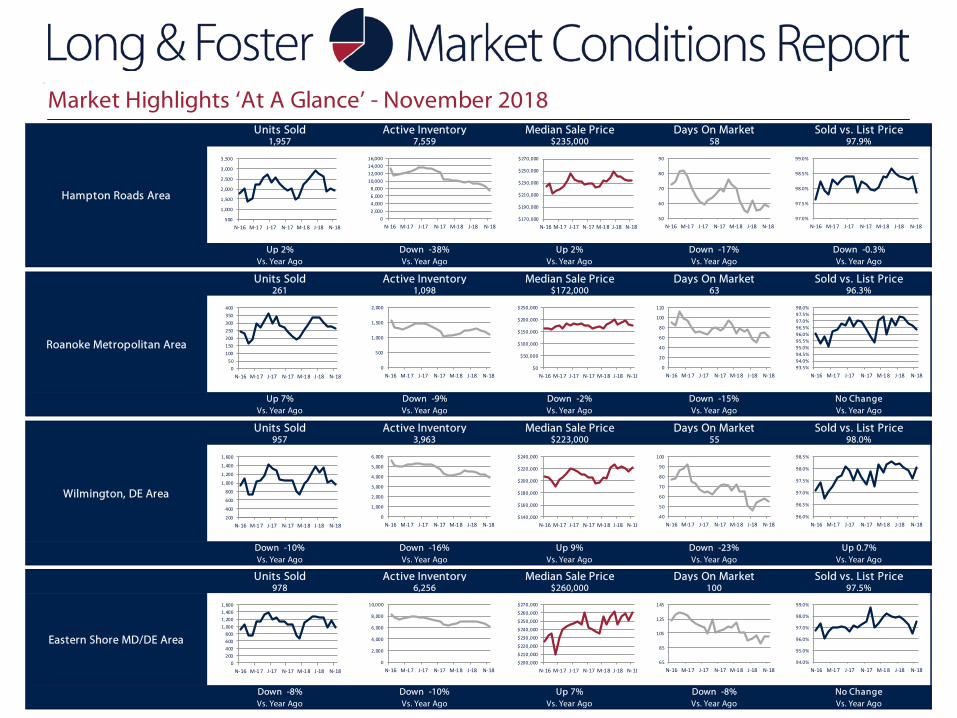
Vs. Year Ago Vs. Year Ago Vs. Year Ago Vs. Year Ago Vs. Year AgoUp 7% Down -9% Down -2% Down -15% No Change
261 1,098 $172,000 63 96.3%
Up 0.7%Vs. Year Ago Vs. Year Ago Vs. Year Ago Vs. Year Ago Vs. Year Ago
Wilmington, DE Area
Down -10% Down -16% Up 9% Down -23%
957 3,963 $223,000 55 98.0%Units Sold Active Inventory Median Sale Price Days On Market Sold vs. List Price
Down -0.3%Vs. Year Ago Vs. Year Ago Vs. Year Ago Vs. Year Ago Vs. Year Ago
Hampton Roads Area
Up 2% Down -38% Up 2% Down -17%
1,957 7,559 $235,000 58 97.9%Units Sold Active Inventory Median Sale Price Days On Market Sold vs. List Price
Units Sold Active Inventory Median Sale Price Days On Market Sold vs. List Price978 6,256 $260,000 100 97.5%
Eastern Shore MD/DE Area
Down -8% Down -10% Up 7% Down -8% No ChangeVs. Year Ago Vs. Year Ago Vs. Year Ago Vs. Year Ago Vs. Year Ago
500
1,000
1,500
2,000
2,500
3,000
3,500
N-16 M-1 7 J-17 N-17 M-1 8 J-18 N-18$170,000
$190,000
$210,000
$230,000
$250,000
$270,000
N-16 M-1 7 J-17 N-17 M-1 8 J-18 N-1850
60
70
80
90
N-16 M-1 7 J-17 N-17 M-1 8 J-18 N-180
2,0004,0006,0008,000
10,00012,00014,00016,000
N-16 M-1 7 J-17 N-17 M-1 8 J-18 N-1897.0%
97.5%
98.0%
98.5%
99.0%
N-16 M-1 7 J-17 N-17 M-1 8 J-18 N-18
200
400
600
800
1,000
1,200
1,400
1,600
N-16 M-1 7 J-17 N-17 M-1 8 J-18 N-18$140,000
$160,000
$180,000
$200,000
$220,000
$240,000
N-16 M-1 7 J-17 N-17 M-1 8 J-18 N-1840
50
60
70
80
90
100
N-16 M-1 7 J-17 N-17 M-1 8 J-18 N-180
1,000
2,000
3,000
4,000
5,000
6,000
N-16 M-1 7 J-17 N-17 M-1 8 J-18 N-1896.0%
96.5%
97.0%
97.5%
98.0%
98.5%
N-16 M-1 7 J-17 N-17 M-1 8 J-18 N-18
0200400600800
1,0001,2001,4001,600
N-16 M-1 7 J-17 N-17 M-1 8 J-18 N-18$200,000
$210,000
$220,000
$230,000
$240,000
$250,000
$260,000
$270,000
N-16 M-1 7 J-17 N-17 M-1 8 J-18 N-1865
85
105
125
145
N-16 M-1 7 J-17 N-17 M-1 8 J-18 N-180
2,000
4,000
6,000
8,000
10,000
N-16 M-1 7 J-17 N-17 M-1 8 J-18 N-1894.0%
95.0%
96.0%
97.0%
98.0%
99.0%
N-16 M-1 7 J-17 N-17 M-1 8 J-18 N-18
050
100150200250300350400
N-16 M-1 7 J-17 N-17 M-1 8 J-18 N-18$0
$50,000
$100,000
$150,000
$200,000
$250,000
N-16 M-1 7 J-17 N-17 M-1 8 J-18 N-180
20
40
60
80
100
120
N-16 M-1 7 J-17 N-17 M-1 8 J-18 N-180
500
1,000
1,500
2,000
N-16 M-1 7 J-17 N-17 M-1 8 J-18 N-1893.5%94.0%94.5%95.0%95.5%96.0%96.5%97.0%97.5%98.0%
N-16 M-1 7 J-17 N-17 M-1 8 J-18 N-18
6
November 2018
$370
,000
$373
,000
$360
,000
$360
,000 $3
75,0
00
$395
,000
$403
,562
$409
,990
$399
,894
$390
,000
$370
,000
$377
,450
$389
,970
$385
,000
$368
,000
$375
,000
$395
,000
$407
,136
$415
,000
$423
,000
$408
,430
$401
,000
$385
,000
$390
,000
$396
,000
$320,000
$330,000
$340,000
$350,000
$360,000
$370,000
$380,000
$390,000
$400,000
$410,000
$420,000
$430,000
Median Sales Price
$485
,000
$425
,000
$275
,000 $5
50,0
00
$465
,000
$500
,000
$452
,000
$288
,750 $6
00,0
00
$485
,000
$0
$200,000
$400,000
$600,000
$800,000
Fairfax County MontgomeryCounty
PrinceGeorge'sCounty
District ofColumbia
LoudounCounty
Median Sale PriceOf Top Five Counties/Cities Based on Total Units Sold
One Year Ago Current Month
1%
5%
3% 4% 4%
5%
4%
4% 4%
3%
1%
3%
5%
3%
2%
4%
5%
3% 3% 3%
2%
3%
4%
3%
2%
-5%
0%
5%
10%
Median Sale PricePercent Change Year/Year
7
●
●
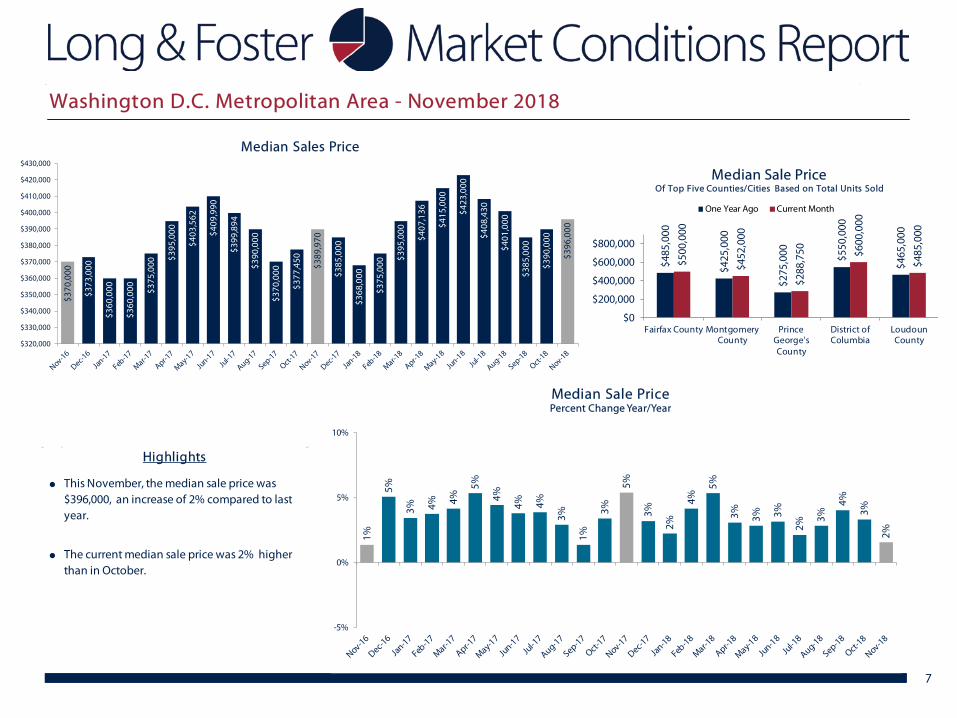
This November, the median sale price was $396,000, an increase of 2% compared to last year.
The current median sale price was 2% higher than in October.
Highlights
Washington D.C. Metropolitan Area - November 2018
18%
-4%
11%
8%
16%
1%
6% 6%
4%
-1%
-3%
8%
5%
0%
-3% -2%
-4%
4%
-1%
-6%
2%
-2%
-10%
-6%
-10%
-25%
-20%
-15%
-10%
-5%
0%
5%
10%
15%
20%
25%
Total Units SoldPercent Change Year/Year
6,32
3
6,57
6
4,93
8
5,12
7
7,25
0
7,63
1
9,29
8 10,3
73
8,61
4
8,42
1
6,87
6
7,15
5
6,61
3
6,54
5
4,78
4
5,02
4
6,97
2 7,93
8
9,24
1
9,78
5
8,77
7
8,28
5
6,17
1
6,75
2
5,93
7
0
2,000
4,000
6,000
8,000
10,000
12,000
Total Units Sold
1,13
2
950
897
735
509
1,11
7
854
792
615
462
0200400600800
1,0001,2001,400
Fairfax County MontgomeryCounty
Prince George'sCounty
District ofColumbia
LoudounCounty
Total Units SoldOf Top Five Counties/Cities Based on Total Units Sold
One Year Ago Current Month
8
●
●
Highlights
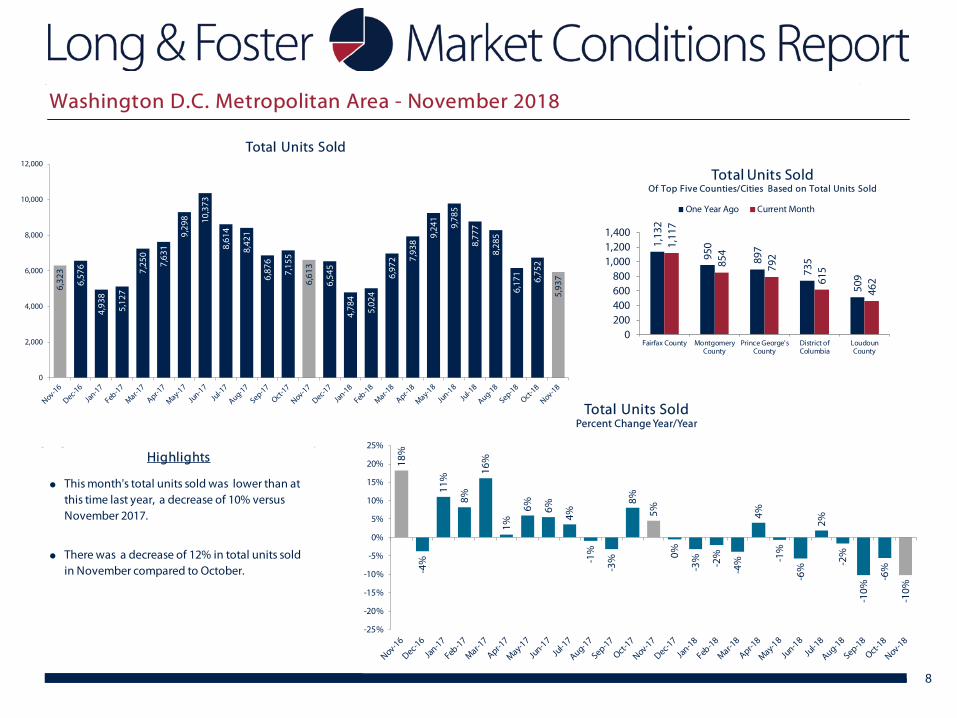
This month's total units sold was lower than at this time last year, a decrease of 10% versus November 2017.
There was a decrease of 12% in total units sold in November compared to October.
Washington D.C. Metropolitan Area - November 2018
0
2,000
4,000
6,000
8,000
10,000
12,000
Total Units Sold by Type
Detached Attached Condo
0
500
1,000
1,500
2,000
2,500
3,000
3,500
Total Units Sold by Price Range
< 150K 150K to < 300K 300K to < 450K 450K to < 600K 600K and up
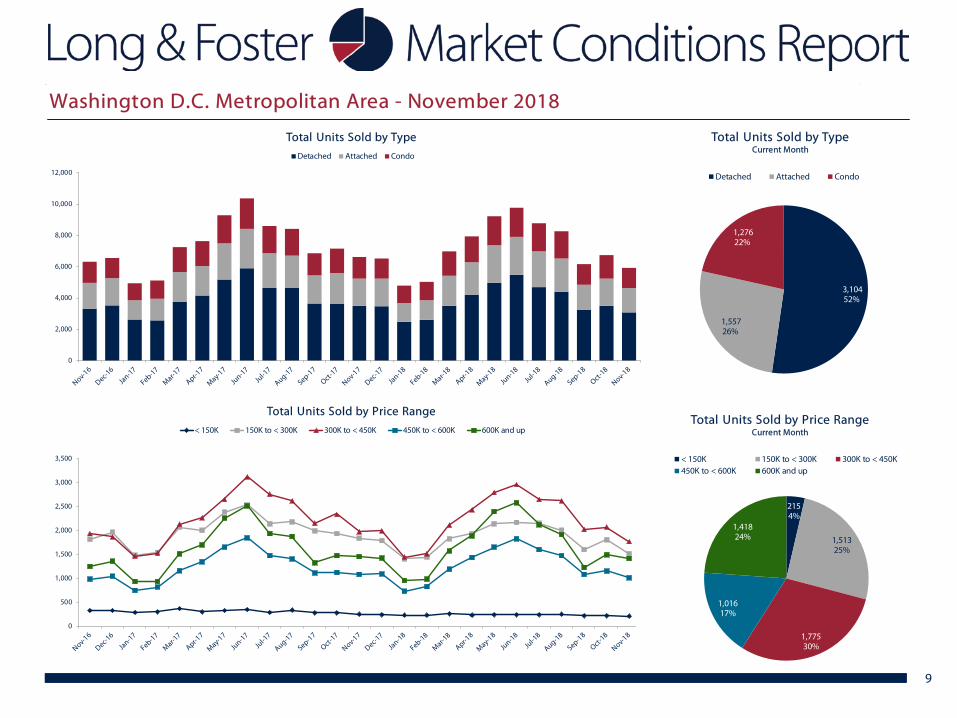
3,104 52%
1,557 26%
1,276 22%
Total Units Sold by TypeCurrent Month
Detached Attached Condo
2154%
1,51325%
1,77530%
1,01617%
1,41824%
Total Units Sold by Price RangeCurrent Month
< 150K 150K to < 300K 300K to < 450K450K to < 600K 600K and up
9
Washington D.C. Metropolitan Area - November 2018
-16%
- 16%
-16%
-13%
-13%
-15% -1
3% -10% -9
% -6% -4
%
-4%
-6%
-8%
-10% -9
%
-11%
-8%
-4%
-5%
-6% -3
%
-5%
-5%
-7%
-25%
-20%
-15%
-10%
-5%
0%
5%
10%
Total Active InventoryPercent Change Year/Year
2,50
2
2,30
9
2,54
5
1,71
0
1,16
22,28
7
2,23
0
2,31
0
1,71
9
966
0
1,000
2,000
3,000
4,000
5,000
FairfaxCounty
MontgomeryCounty
PrinceGeorge'sCounty
District ofColumbia
LoudounCounty
Total Active InventoryOf Top Five Counties/Cities Based on Total Units Sold
One Year Ago Current Month
18,4
07
15,8
34
14,9
67
15,5
13 17,6
15 19,0
67
19,7
39
20,6
32
20,5
14
20,1
17
21,0
54
19,8
50
17,3
69
14,5
95
13,5
42
14,1
18 15,7
35 17,6
06 19,0
37
19,6
22
19,3
47
19,4
55
19,9
43
18,8
28
16,0
85
0
5,000
10,000
15,000
20,000
25,000
Total Active Inventory
10
●
●
Highlights
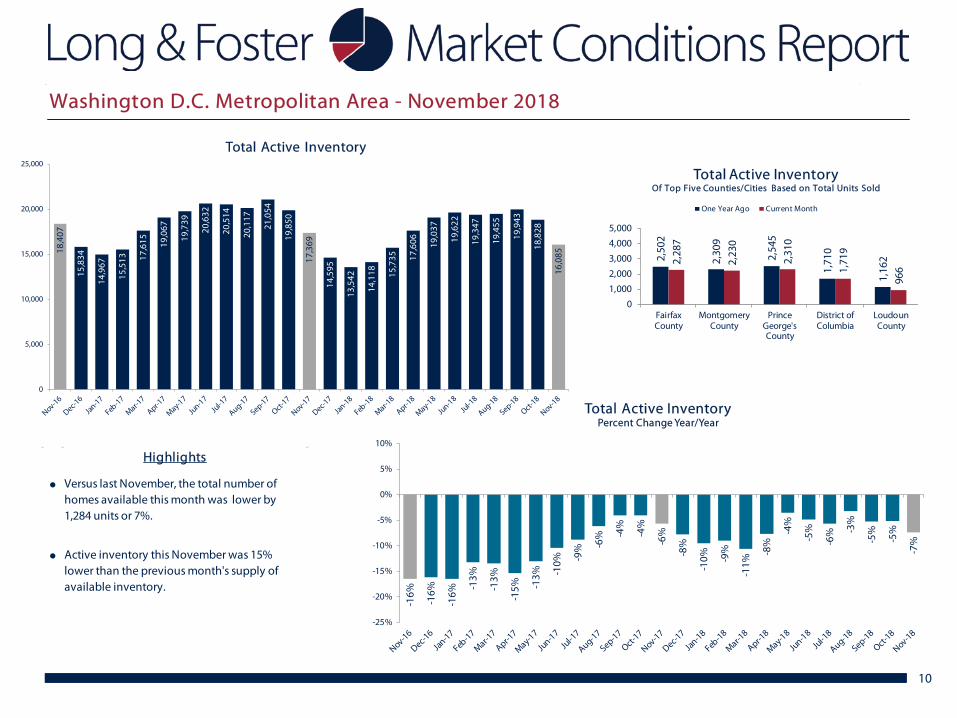
Versus last November, the total number of homes available this month was lower by 1,284 units or 7%.
Active inventory this November was 15% lower than the previous month's supply of available inventory.
Washington D.C. Metropolitan Area - November 2018
0
5,000
10,000
15,000
20,000
25,000
Total Active Inventory by TypeDetached Attached Condo
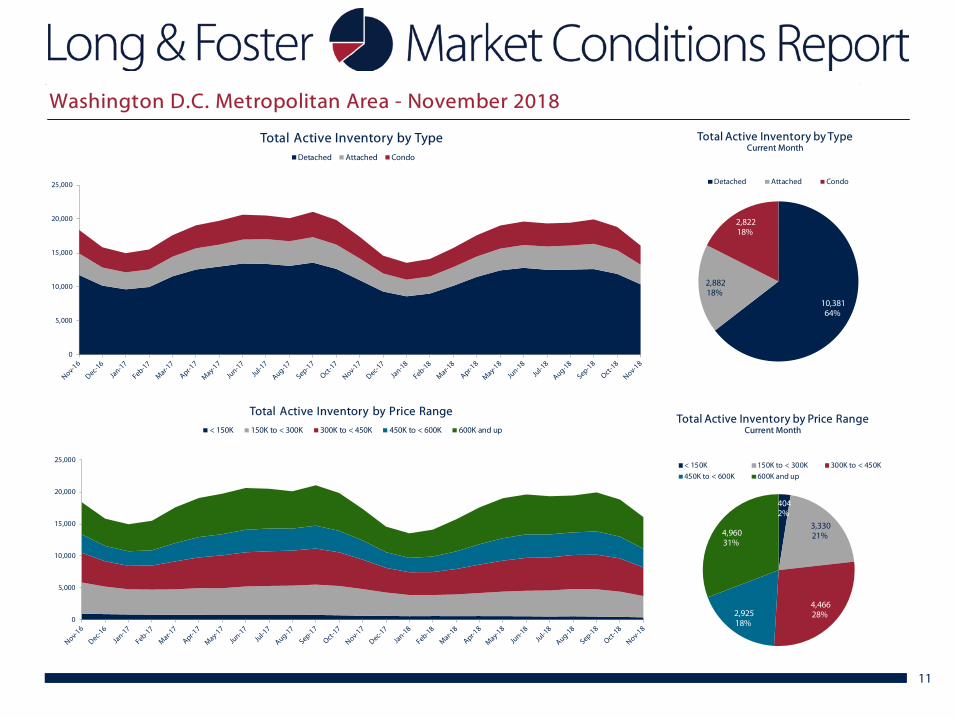
10,381 64%
2,882 18%
2,822 18%
Total Active Inventory by TypeCurrent Month
Detached Attached Condo
404 2%
3,330 21%
4,466 28%2,925
18%
4,960 31%
Total Active Inventory by Price RangeCurrent Month
< 150K 150K to < 300K 300K to < 450K450K to < 600K 600K and up
0
5,000
10,000
15,000
20,000
25,000
Total Active Inventory by Price Range
< 150K 150K to < 300K 300K to < 450K 450K to < 600K 600K and up
11
Washington D.C. Metropolitan Area - November 2018
98.6
%
98.5
%
98.2
%
98.6
%
99.0
% 99.2
%
99.2
%
99.2
%
99.1
%
99.0
%
98.8
% 99.0
%
98.9
%
98.7
%
98.4
%
98.8
%
99.1
%
99.5
%
99.3
% 99.6
%
99.2
%
99.0
%
99.0
%
99.1
%
98.6
%
97.5%
98.0%
98.5%
99.0%
99.5%
100.0%
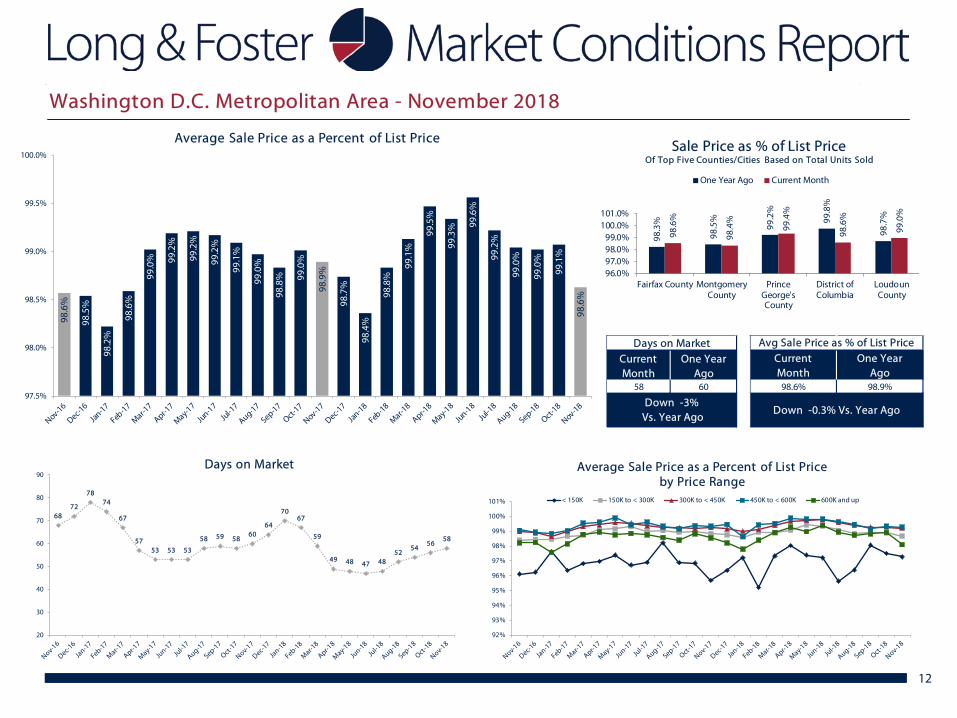
Average Sale Price as a Percent of List Price
98.3
%
98.5
%
99.2
%
99.8
%
98.7
%
98.6
%
98.4
%
99.4
%
98.6
%
99.0
%
96.0%97.0%98.0%99.0%
100.0%101.0%
Fairfax County MontgomeryCounty
PrinceGeorge'sCounty
District ofColumbia
LoudounCounty
Sale Price as % of List PriceOf Top Five Counties/Cities Based on Total Units Sold
One Year Ago Current Month
Days on MarketCurrentMonth
One YearAgo
58 60
Down -3% Vs. Year Ago
Avg Sale Price as % of List PriceCurrentMonth
One YearAgo
98.6% 98.9%
Down -0.3% Vs. Year Ago
92%
93%
94%
95%
96%
97%
98%
99%
100%
101%
Average Sale Price as a Percent of List Price by Price Range
< 150K 150K to < 300K 300K to < 450K 450K to < 600K 600K and up
6872
7874
67
5753 53 53
58 59 5860
64
7067
59
49 48 47 4852
5456
58
20
30
40
50
60
70
80
90Days on Market
12
Washington D.C. Metropolitan Area - November 2018

$2,8
07,7
03
$2,9
76,8
52
$2,1
80,4
71
$2,2
99,8
23 $3,2
94,8
61
$3,5
78,3
52 $4,5
22,6
21
$5,0
66,3
13
$4,1
56,1
34
$3,9
31,2
39
$3,0
57,5
30
$3,2
79,5
53
$3,1
17,6
13
$3,0
95,7
02
$2,1
54,9
28
$2,2
65,6
73 $3,2
72,9
65
$3,8
46,0
91
$4,6
91,2
35
$4,9
08,6
45
$4,2
83,7
98
$4,0
33,9
37
$2,8
31,5
95
$3,1
78,5
67
$2,8
70,9
27
$0
$1,000,000
$2,000,000
$3,000,000
$4,000,000
$5,000,000
$6,000,000
Total Dollar Volume SoldIn Thousands
Total Dollar Volume SoldCurrentMonth
One YearAgo
$2,870,927,444 $3,117,613,472
Down -8% Vs. Year Ago
Months of SupplyCurrentMonth
One YearAgo
2.7 2.6
Up 3% Vs. Year Ago
2.9
2.4
3.0
3.0
2.4 2.5
2.1
2.0
2.4
2.4
3.1
2.8
2.6
2.2
2.8
2.8
2.3
2.2
2.1
2.0 2.
2 2.4
3.2
2.8
2.7
0
1
2
3
4
Months of SupplyCurrent Month's Active Inventory/Current Month's Unit Sales
13
●
●
Highlights
Total volume sold this November was 8% less than the same month one year ago.
In November, there was 2.7 months of supply available, compared to 2.6 in November 2017. That was an increase of 3% versus a year ago.
Washington D.C. Metropolitan Area - November 2018
6,74
0
4,99
9
7,36
8 9,02
2
13,4
39
12,5
43
13,1
19
12,5
89
10,4
37
9,98
9
10,5
18
9,26
9
6,88
0
4,76
9
7,08
3
8,76
6
12,4
33 13,4
40
13,5
83
11,9
78
10,4
51
10,1
83
10,0
59
9,65
0
6,98
4
5,70
7
4,90
5
5,78
0 6,78
1
9,14
3
9,01
6
9,71
6
8,71
8
7,52
7
7,13
3
6,72
7
6,97
9
5,94
6
4,67
5 5,64
1
6,49
4
8,71
7
9,31
9
9,35
5
8,45
3
7,64
6
6,79
2
6,24
4
6,99
3
6,22
2
0
2,000
4,000
6,000
8,000
10,000
12,000
14,000
16,000
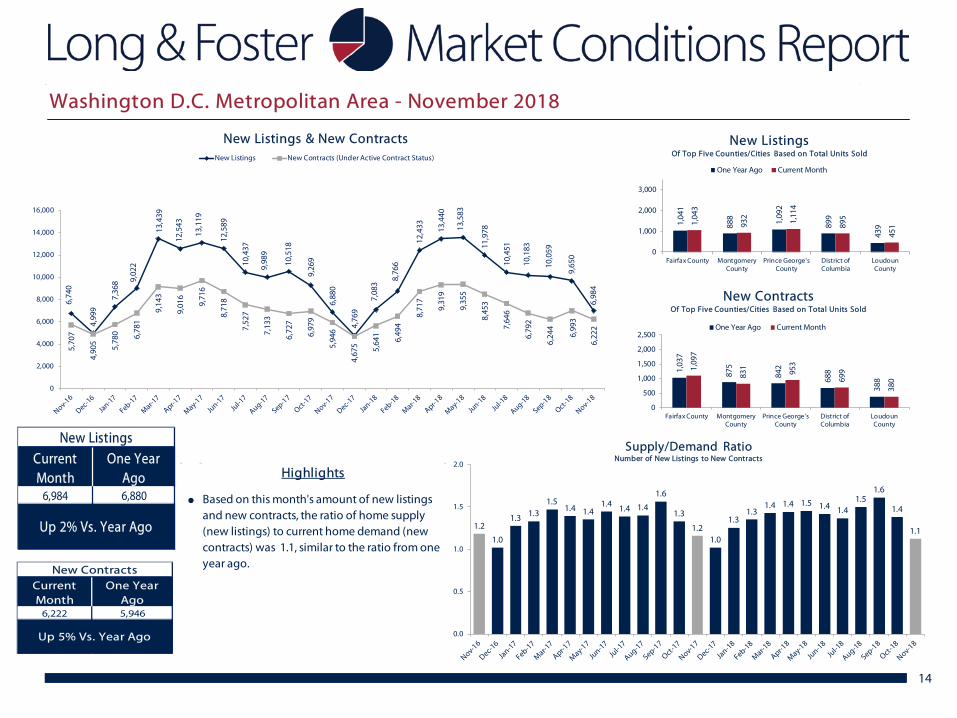
New Listings & New ContractsNew Listings New Contracts (Under Active Contract Status)
New ListingsCurrent Month
One Year Ago
6,984 6,880
Up 2% Vs. Year Ago
New ContractsCurrent Month
One Year Ago
6,222 5,946
Up 5% Vs. Year Ago
1.2
1.0
1.3 1.31.5
1.4 1.41.4 1.4 1.4
1.6
1.3
1.21.0
1.31.3
1.4 1.4 1.5 1.4 1.41.5
1.6
1.4
1.1
0.0
0.5
1.0
1.5
2.0
Supply/Demand RatioNumber of New Listings to New Contracts
1,04
1
888 1,09
2
899
4391,
043
932
1,11
4
895
451
0
1,000
2,000
3,000
Fairfax County MontgomeryCounty
Prince George'sCounty
District ofColumbia
LoudounCounty
New ListingsOf Top Five Counties/Cities Based on Total Units Sold
One Year Ago Current Month
1,03
7
875
842
688
388
1,09
7
831
953
699
380
0
500
1,000
1,500
2,000
2,500
Fairfax County MontgomeryCounty
Prince George'sCounty
District ofColumbia
LoudounCounty
New ContractsOf Top Five Counties/Cities Based on Total Units Sold
One Year Ago Current Month
14
●
Highlights
Based on this month's amount of new listings and new contracts, the ratio of home supply (new listings) to current home demand (new contracts) was 1.1, similar to the ratio from one year ago.
Washington D.C. Metropolitan Area - November 2018
15
November 2018
4%
5%
6%
4%
3%
5% 5%
2% 2%
4%
1%
3%
6%
2%
4%
6%
7%
4%
1%
3%
2%
6% 6%
1%
3%
-5%
0%
5%
10%
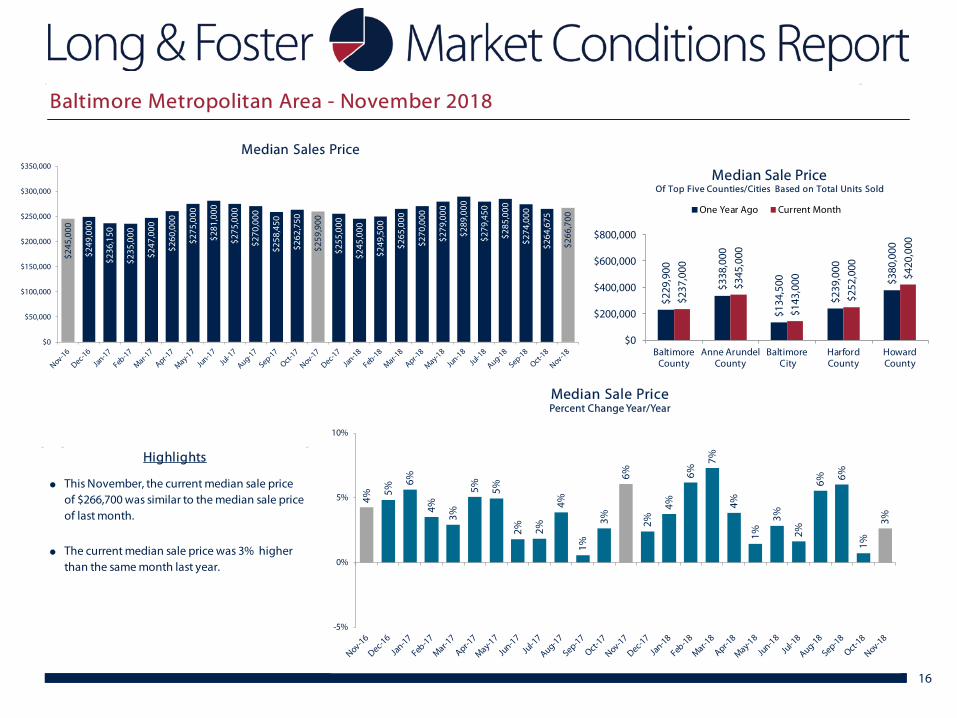
Median Sale PricePercent Change Year/Year
$229
,900
$338
,000
$134
,500
$239
,000
$380
,000
$237
,000
$345
,000
$143
,000
$252
,000
$420
,000
$0
$200,000
$400,000
$600,000
$800,000
BaltimoreCounty
Anne ArundelCounty
Baltimore City
HarfordCounty
HowardCounty
Median Sale PriceOf Top Five Counties/Cities Based on Total Units Sold
One Year Ago Current Month
16
$245
,000
$249
,000
$236
,150
$235
,000
$247
,000
$260
,000
$275
,000
$281
,000
$275
,000
$270
,000
$258
,450
$262
,750
$259
,900
$255
,000
$245
,000
$249
,500
$265
,000
$270
,000
$279
,000
$289
,000
$279
,450
$285
,000
$274
,000
$264
,675
$266
,700
$0
$50,000
$100,000
$150,000
$200,000
$250,000
$300,000
$350,000
Median Sales Price
●
●
Highlights
The current median sale price was 3% higher than the same month last year.
This November, the current median sale price of $266,700 was similar to the median sale price of last month.
Baltimore Metropolitan Area - November 2018
19%
5% 4%
1%
17%
2%
5% 6%
1% 1%
-2%
4% 4%
-3%
2%
0%
-7%
1%
-3%
-7%
5%
3%
-8%
-3%
-13%
-25%
-20%
-15%
-10%
-5%
0%
5%
10%
15%
20%
25%
Total Units SoldPercent Change Year/Year
3,03
5 3,36
3
2,31
8
2,39
3
3,49
8
3,47
4
4,16
5 4,76
9
3,79
9
3,97
3
3,35
2
3,31
9
3,14
5
3,25
2
2,35
9
2,39
2
3,26
4
3,51
4 4,05
3 4,43
3
4,00
3
4,07
5
3,07
2
3,22
9
2,72
1
0
1,000
2,000
3,000
4,000
5,000
6,000
Total Units Sold
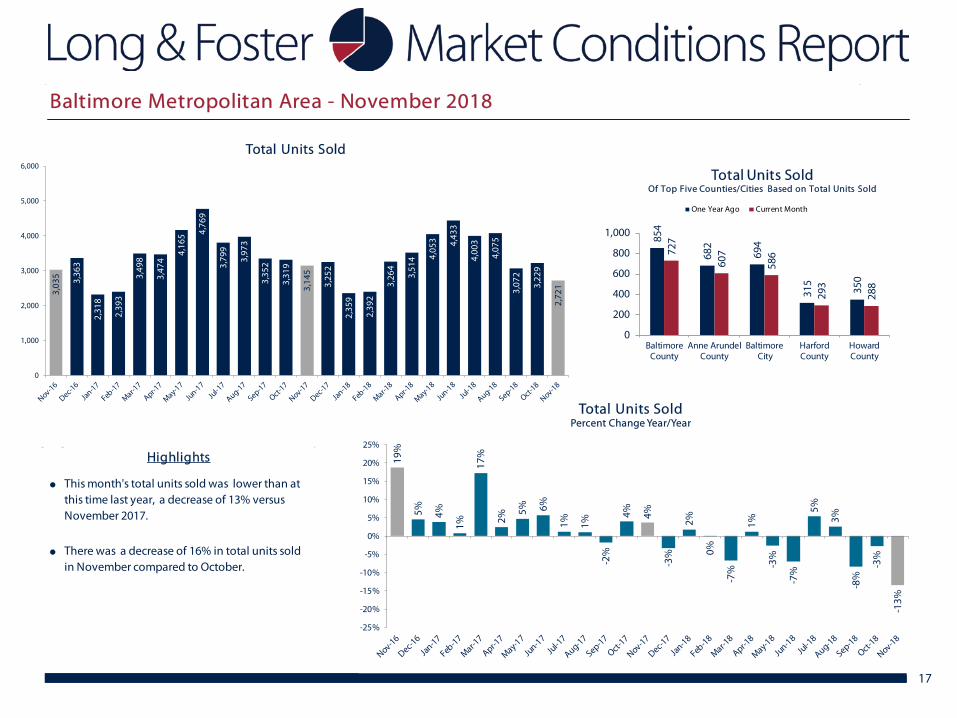
854
682
694
315
350
727
607
586
293
288
0
200
400
600
800
1,000
BaltimoreCounty
Anne ArundelCounty
Baltimore City
HarfordCounty
HowardCounty
Total Units SoldOf Top Five Counties/Cities Based on Total Units Sold
One Year Ago Current Month
17
●
● There was a decrease of 16% in total units sold in November compared to October.
Highlights
This month's total units sold was lower than at this time last year, a decrease of 13% versus November 2017.
Baltimore Metropolitan Area - November 2018
0
200
400
600
800
1,000
1,200
1,400
1,600
1,800
2,000
Total Units Sold by Price Range
< 150K 150K to < 300K 300K to < 450K 450K to < 600K 600K and up
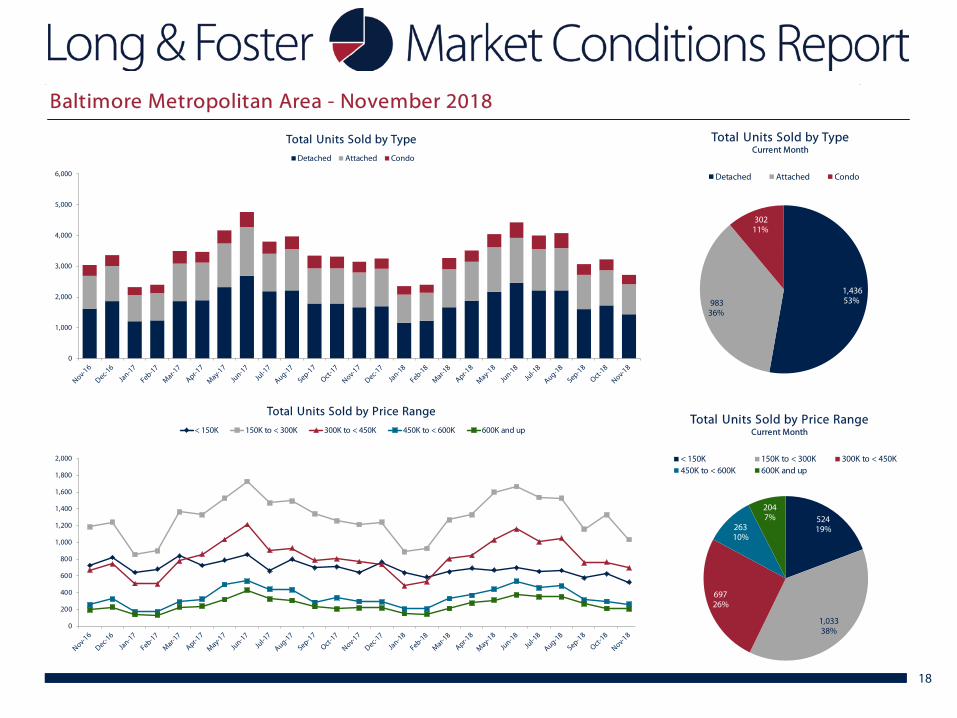
52419%
1,03338%
69726%
26310%
2047%
Total Units Sold by Price RangeCurrent Month
< 150K 150K to < 300K 300K to < 450K450K to < 600K 600K and up
1,436 53%983
36%
302 11%
Total Units Sold by TypeCurrent Month
Detached Attached Condo
0
1,000
2,000
3,000
4,000
5,000
6,000
Total Units Sold by Type
Detached Attached Condo
18
Baltimore Metropolitan Area - November 2018
-15%
-16%
-16% -1
5%
-15% -1
5% -14% -1
3%
-13% -1
2% -11%
-10% -10%
-11%
-11%
-9% -8
%
-8%
-5%
-6%
-6%
-4%
-4% - 3
%
-5%
-25%
-20%
-15%
-10%
-5%
0%
Total Active InventoryPercent Change Year/Year
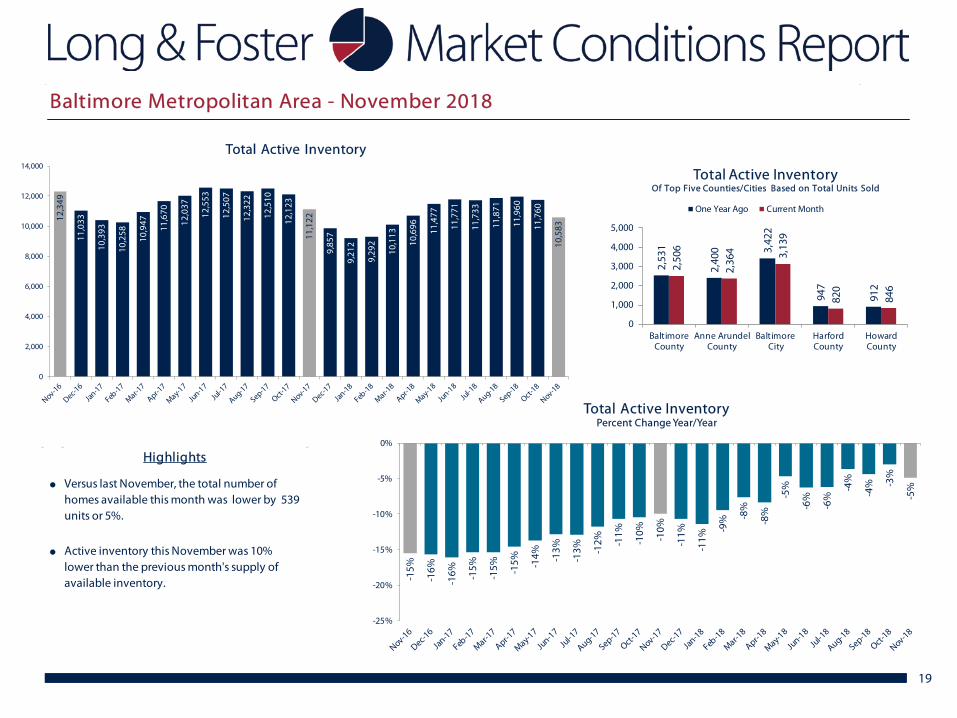
2,53
1
2,40
0 3,42
2
947
912
2,50
6
2,36
4 3,13
9
820
846
0
1,000
2,000
3,000
4,000
5,000
BaltimoreCounty
Anne ArundelCounty
Baltimore City
HarfordCounty
HowardCounty
Total Active InventoryOf Top Five Counties/Cities Based on Total Units Sold
One Year Ago Current Month
12,3
49
11,0
33
10,3
93
10,2
58
10,9
47
11,6
70
12,0
37
12,5
53
12,5
07
12,3
22
12,5
10
12,1
23
11,1
22
9,85
7
9,21
2
9,29
2
10,1
13
10,6
96 11,4
77
11,7
71
11,7
33
11,8
71
11,9
60
11,7
60
10,5
83
0
2,000
4,000
6,000
8,000
10,000
12,000
14,000
Total Active Inventory
19
●
● Active inventory this November was 10% lower than the previous month's supply of available inventory.
Highlights
Versus last November, the total number of homes available this month was lower by 539 units or 5%.
Baltimore Metropolitan Area - November 2018
0
2,000
4,000
6,000
8,000
10,000
12,000
14,000
Total Active Inventory by Price Range
< 150K 150K to < 300K 300K to < 450K 450K to < 600K 600K and up
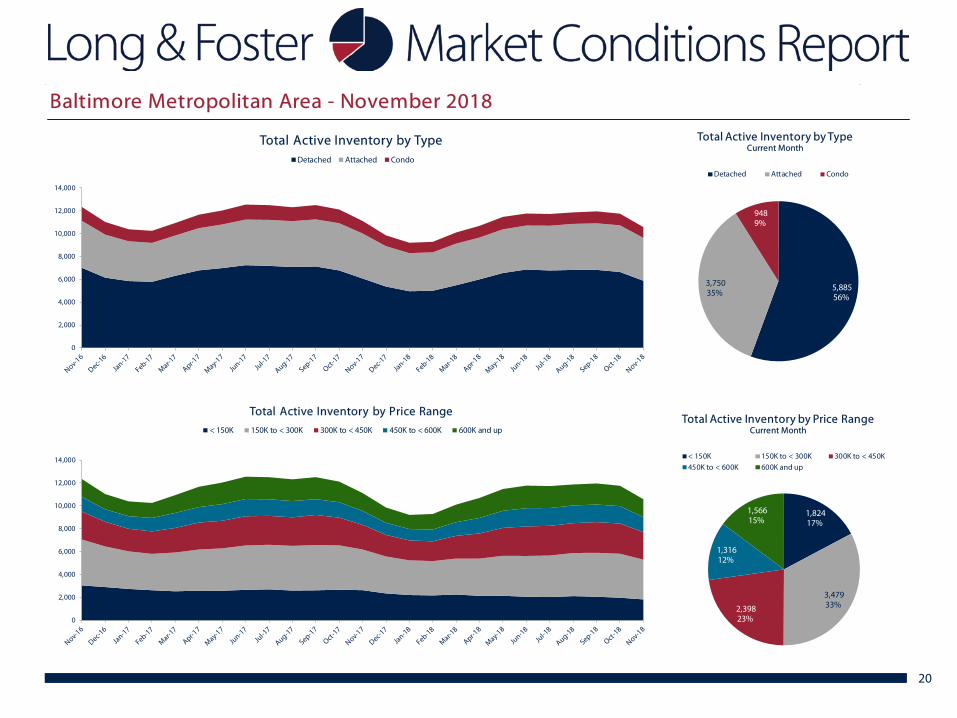
1,824 17%
3,479 33%2,398
23%
1,316 12%
1,566 15%
Total Active Inventory by Price RangeCurrent Month
< 150K 150K to < 300K 300K to < 450K450K to < 600K 600K and up
5,885 56%
3,750 35%
948 9%
Total Active Inventory by TypeCurrent Month
Detached Attached Condo
0
2,000
4,000
6,000
8,000
10,000
12,000
14,000
Total Active Inventory by TypeDetached Attached Condo
20
Baltimore Metropolitan Area - November 2018
73
7981
85
79
72
6260 60 60
64 65 66
70 70 71 71
60
55
5154 54
5659 59
30
40
50
60
70
80
90Days on Market
88%
90%
92%
94%
96%
98%
100%
102%
Average Sale Price as a Percent of List Price by Price Range
< 150K 150K to < 300K 300K to < 450K 450K to < 600K 600K and up
Days on MarketCurrentMonth
One YearAgo
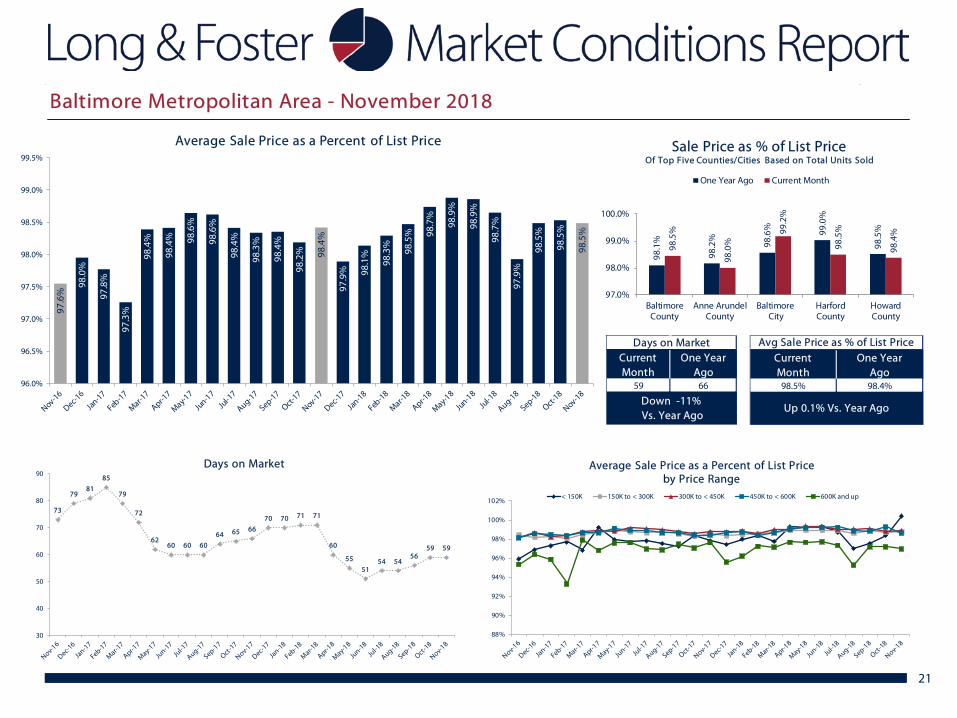
59 66
Down -11% Vs. Year Ago
98.1
%
98.2
%
98.6
% 99.0
%
98.5
%
98.5
%
98.0
%
99.2
%
98.5
%
98.4
%
97.0%
98.0%
99.0%
100.0%
BaltimoreCounty
Anne ArundelCounty
Baltimore City
HarfordCounty
HowardCounty
Sale Price as % of List PriceOf Top Five Counties/Cities Based on Total Units Sold
One Year Ago Current Month
97.6
%
98.0
%
97.8
%
97.3
%
98.4
%
98.4
% 98.6
%
98.6
%
98.4
%
98.3
%
98.4
%
98.2
% 98.4
%
97.9
% 98.1
%
98.3
%
98.5
% 98.7
%
98.9
%
98.9
%
98.7
%
97.9
%
98.5
%
98.5
%
98.5
%
96.0%
96.5%
97.0%
97.5%
98.0%
98.5%
99.0%
99.5%
Average Sale Price as a Percent of List Price
21
Avg Sale Price as % of List PriceCurrentMonth
One YearAgo
98.5% 98.4%
Up 0.1% Vs. Year Ago
Baltimore Metropolitan Area - November 2018

4.1
3.3
4.5
4.3
3.1 3.
4
2.9
2.6
3.3
3.1
3.7
3.7
3.5
3.0
3.9
3.9
3.1
3.0
2.8
2.7 2.
9
2.9
3.9
3.6 3.
90
1
2
3
4
5
Months of SupplyCurrent Month's Active Inventory/Current Month's Unit Sales
Months of SupplyCurrentMonth
One YearAgo
3.9 3.5
Up 10% Vs. Year Ago
Total Dollar Volume SoldCurrentMonth
One YearAgo
$836,502,644 $933,092,309
Down -10% Vs. Year Ago
$869
,742
$971
,910
$633
,053
$640
,801
$985
,534
$1,0
42,9
13
$1,2
96,3
16
$1,5
32,5
89
$1,2
15,8
59
$1,2
32,0
19
$992
,261
$984
,398
$933
,092
$946
,763
$648
,529
$671
,497 $9
69,4
29
$1,0
87,3
98
$1,2
78,7
79
$1,4
39,8
39
$1,2
88,2
86
$1,3
26,9
89
$963
,842
$969
,158
$836
,503
$0
$200,000
$400,000
$600,000
$800,000
$1,000,000
$1,200,000
$1,400,000
$1,600,000
$1,800,000
Total Dollar Volume SoldIn Thousands
22
●
● In November, there was 3.9 months of supply available, compared to 3.5 in November 2017. That was an increase of 10% versus a year ago.
Highlights
Total volume sold this November was 10% less than the same month one year ago.
Baltimore Metropolitan Area - November 2018
789
599 74
8
284
282
810
595 75
9
281
293
0
250
500
750
1,000
1,250
1,500
BaltimoreCounty
Anne ArundelCounty
Baltimore City
HarfordCounty
HowardCounty
New ContractsOf Top Five Counties/Cities Based on Total Units Sold
One Year Ago Current Month
948
752 1,
069
326
359
1,00
5
758 1,
061
314
332
0
400
800
1,200
1,600
2,000
BaltimoreCounty
Anne ArundelCounty
Baltimore City
HarfordCounty
HowardCounty
New ListingsOf Top Five Counties/Cities Based on Total Units Sold
One Year Ago Current Month
1.2 1.21.3 1.3
1.4 1.4 1.41.5
1.4 1.41.5
1.4
1.3
1.1
1.31.3
1.51.4
1.51.5 1.4
1.6 1.61.5
1.3
0.0
0.5
1.0
1.5
2.0
Supply/Demand RatioNumber of New Listings to New Contracts
New ContractsCurrent Month
One Year Ago
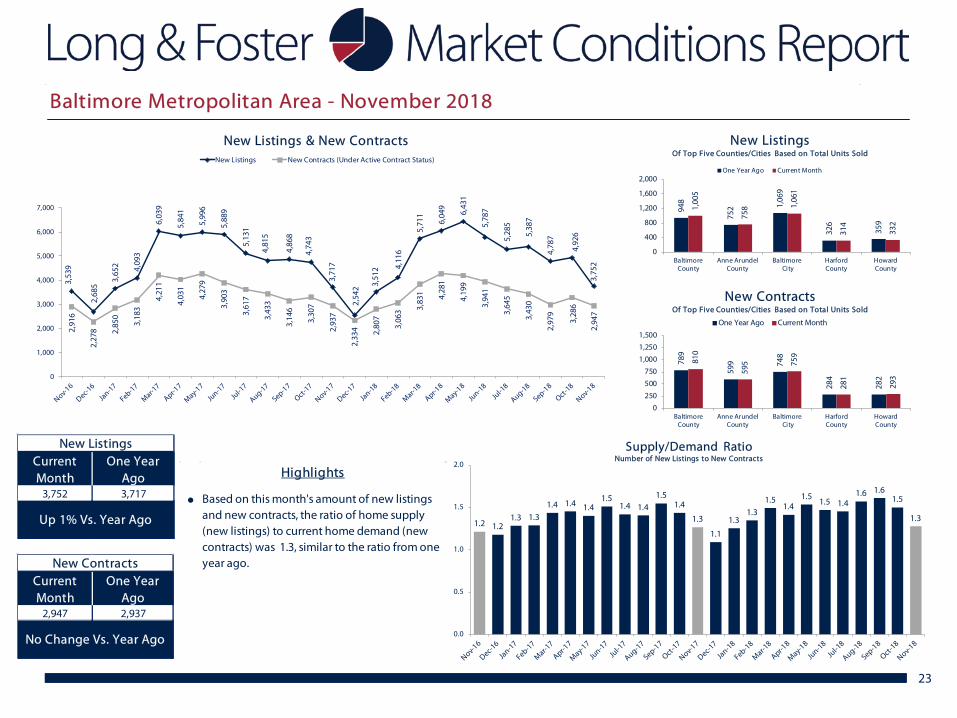
2,947 2,937
No Change Vs. Year Ago
3,53
9
2,68
5
3,65
2 4,09
3
6,03
9
5,84
1
5,99
6
5,88
9
5,13
1
4,81
5
4,86
8
4,74
3
3,71
7
2,54
2 3,51
2 4,11
6
5,71
1
6,04
9
6,43
1
5,78
7
5,28
5
5,38
7
4,78
7
4,92
6
3,75
2
2,91
6
2,27
8 2,85
0
3,18
3
4,21
1
4,03
1
4,27
9
3,90
3
3,61
7
3,43
3
3,14
6
3,30
7
2,93
7
2,33
4 2,80
7
3,06
3 3,83
1 4,28
1
4,19
9
3,94
1
3,64
5
3,43
0
2,97
9
3,28
6
2,94
7
0
1,000
2,000
3,000
4,000
5,000
6,000
7,000
New Listings & New ContractsNew Listings New Contracts (Under Active Contract Status)
New ListingsCurrent Month
One Year Ago
3,752 3,717
Up 1% Vs. Year Ago
23
● Based on this month's amount of new listings and new contracts, the ratio of home supply (new listings) to current home demand (new contracts) was 1.3, similar to the ratio from one year ago.
Highlights
Baltimore Metropolitan Area - November 2018
24
November 2018
5%
2%
9%
10%
6% 6% 6%
5%
8% 8% 7%
-1%
4%
10%
6%
5%
6% 7%
5%
3%
3%
3%
2%
10%
3%
-5%
0%
5%
10%
15%
Median Sale PricePercent Change Year/Year
25
$226
,750
$223
,200
$218
,375
$220
,000
$226
,000
$229
,900
$237
,700 $2
46,6
40
$250
,000
$245
,000
$234
,990
$222
,750
$236
,910
$244
,975
$231
,900
$230
,000 $2
40,3
51
$245
,000
$249
,000
$255
,100
$256
,250
$253
,500
$240
,000
$244
,500
$245
,000
$190,000
$200,000
$210,000
$220,000
$230,000
$240,000
$250,000
$260,000
Median Sales Price
$244
,445
$242
,705
$230
,000
$288
,975
$314
,950
$264
,500
$247
,500
$234
,000
$279
,900
$330
,044
$0
$200,000
$400,000
$600,000
ChesterfieldCounty
HenricoCounty
RichmondCity
HanoverCounty
PowhatanCounty
Median Sale PriceOf Top Five Counties/Cities Based on Total Units Sold
One Year Ago Current Month
●
●
Highlights
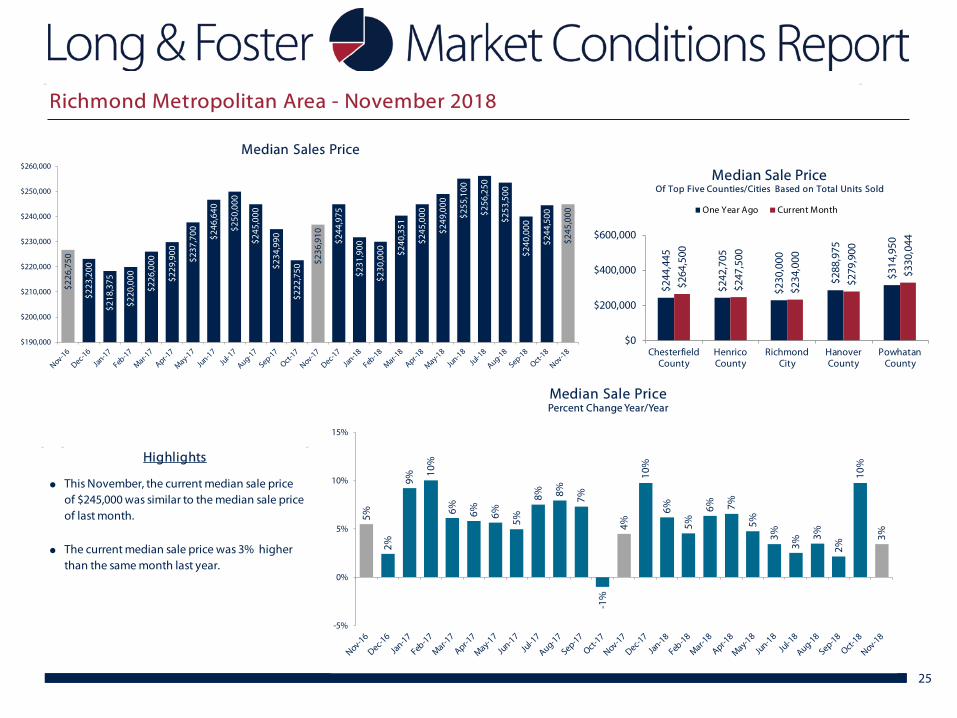
The current median sale price was 3% higher than the same month last year.
This November, the current median sale price of $245,000 was similar to the median sale price of last month.
Richmond Metropolitan Area - November 2018
22%
7%
13%
1%
25%
2%
13%
9%
1%
5% 6%
14% 16
%
14%
5%
11%
-1%
3%
-3%
-3%
13%
3%
-12%
1%
-7%
-25%
-20%
-15%
-10%
-5%
0%
5%
10%
15%
20%
25%
30%
Total Units SoldPercent Change Year/Year
1,36
7
1,49
1
1,05
0
1,04
7
1,69
1
1,67
9
2,04
2
2,38
7
1,88
6
2,02
2
1,69
5
1,64
1
1,58
7
1,70
0
1,10
5
1,16
0
1,67
9
1,72
6 1,98
0
2,31
3
2,13
4
2,08
5
1,49
1 1,65
6
1,48
1
0
500
1,000
1,500
2,000
2,500
3,000
Total Units Sold
26
488
442
256
109
36
469
369
218
115
40
0
100
200
300
400
500
600
ChesterfieldCounty
HenricoCounty
RichmondCity
HanoverCounty
PowhatanCounty
Total Units SoldOf Top Five Counties/Cities Based on Total Units Sold
One Year Ago Current Month
●
●
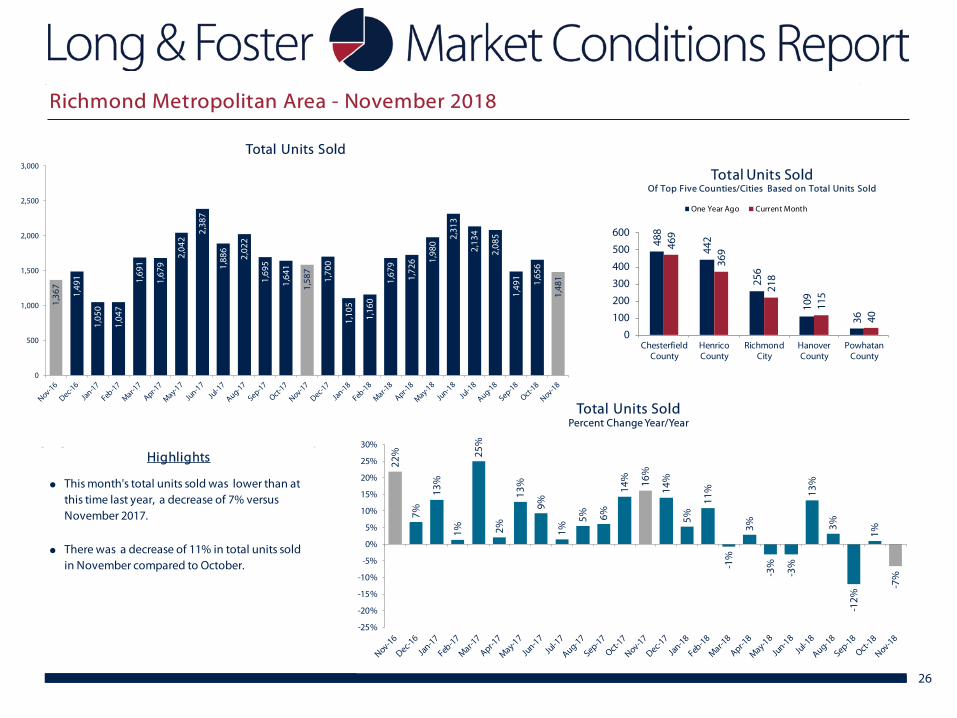
Highlights
There was a decrease of 11% in total units sold in November compared to October.
This month's total units sold was lower than at this time last year, a decrease of 7% versus November 2017.
Richmond Metropolitan Area - November 2018
27
0
500
1,000
1,500
2,000
2,500
3,000
Total Units Sold by Type
Detached Attached Condo
1,237 84%
163 11%
81 5%
Total Units Sold by TypeCurrent Month
Detached Attached Condo
23416%
74350%
31621%
1027%
866%
Total Units Sold by Price RangeCurrent Month
< 150K 150K to < 300K 300K to < 450K450K to < 600K 600K and up
0
200
400
600
800
1,000
1,200
1,400
Total Units Sold by Price Range
< 150K 150K to < 300K 300K to < 450K 450K to < 600K 600K and up
Richmond Metropolitan Area - November 2018
-17% -16%
-18%
-15%
-12% -12%
-9%
-6% -5% -4
%
-5%
-5% -4%
-8%
-9%
-9%
-11% -1
0%
-8%
-12%
-11%
-14%
-15%
-16%
-18%
-25%
-20%
-15%
-10%
-5%
0%
5%
Total Active InventoryPercent Change Year/Year
28
5,62
2
4,69
3
4,69
8
4,74
5
5,07
3
5,20
0
5,47
9
5,78
4
5,82
7
5,93
4
5,84
7
5,72
8
5,37
0
4,33
2
4,26
4
4,30
7
4,49
3
4,70
2
5,05
5
5,09
8
5,15
7
5,11
9
4,95
8
4,78
7
4,39
8
0
1,000
2,000
3,000
4,000
5,000
6,000
7,000
Total Active Inventory
1,73
3
1,03
7
607
494
155
1,36
8
862
536
401
130
0
500
1,000
1,500
2,000
ChesterfieldCounty
HenricoCounty
RichmondCity
HanoverCounty
PowhatanCounty
Total Active InventoryOf Top Five Counties/Cities Based on Total Units Sold
One Year Ago Current Month
●
●
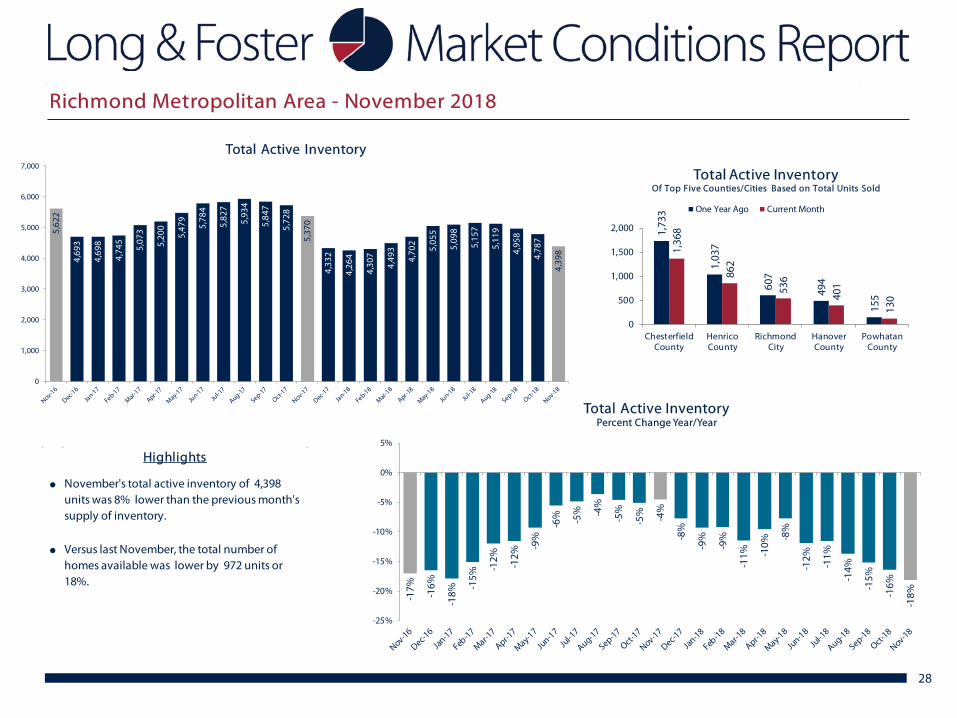
Highlights
Versus last November, the total number of homes available was lower by 972 units or 18%.
November's total active inventory of 4,398 units was 8% lower than the previous month's supply of inventory.
Richmond Metropolitan Area - November 2018
29
0
1,000
2,000
3,000
4,000
5,000
6,000
7,000
Total Active Inventory by TypeDetached Attached Condo
3,757 85%
462 11%
179 4%
Total Active Inventory by TypeCurrent Month
Detached Attached Condo
608 14%
1,662 38%1,170
26%
523 12%
435 10%
Total Active Inventory by Price RangeCurrent Month
< 150K 150K to < 300K 300K to < 450K450K to < 600K 600K and up
0
1,000
2,000
3,000
4,000
5,000
6,000
7,000
Total Active Inventory by Price Range
< 150K 150K to < 300K 300K to < 450K 450K to < 600K 600K and up
Richmond Metropolitan Area - November 2018
30
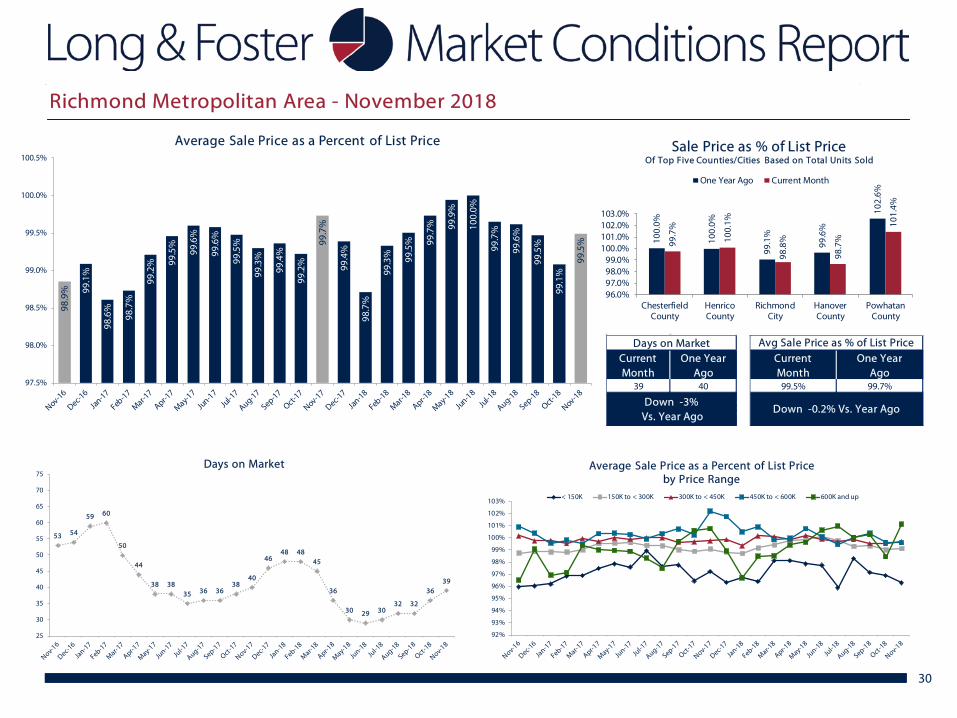
98.9
% 99.1
%
98.6
%
98.7
%
99.2
% 99.5
%
99.6
%
99.6
%
99.5
%
99.3
%
99.4
%
99.2
%
99.7
%
99.4
%
98.7
%
99.3
% 99.5
% 99.7
% 99.9
%
100.
0%
99.7
%
99.6
%
99.5
%
99.1
%
99.5
%
97.5%
98.0%
98.5%
99.0%
99.5%
100.0%
100.5%
Average Sale Price as a Percent of List Price
100.
0%
100.
0%
99.1
%
99.6
%
102.
6%
99.7
%
100.
1%
98.8
%
98.7
%
101.
4%
96.0%97.0%98.0%99.0%
100.0%101.0%102.0%103.0%
ChesterfieldCounty
HenricoCounty
RichmondCity
HanoverCounty
PowhatanCounty
Sale Price as % of List PriceOf Top Five Counties/Cities Based on Total Units Sold
One Year Ago Current Month
53 54
59 60
50
44
38 3835 36 36
3840
4648 48
45
36
30 29 3032 32
3639
25
30
35
40
45
50
55
60
65
70
75Days on Market
92%
93%
94%
95%
96%
97%
98%
99%
100%
101%
102%
103%
Average Sale Price as a Percent of List Price by Price Range
< 150K 150K to < 300K 300K to < 450K 450K to < 600K 600K and up
Days on MarketCurrentMonth
One YearAgo
39 40
Down -3% Vs. Year Ago
Avg Sale Price as % of List PriceCurrentMonth
One YearAgo
99.5% 99.7%
Down -0.2% Vs. Year Ago
Richmond Metropolitan Area - November 2018
31
$359
,951
$382
,605
$262
,672
$268
,339
$432
,101
$443
,717 $5
58,3
72 $672
,986
$540
,516
$570
,518
$448
,668
$419
,338
$432
,186
$481
,559
$297
,367
$298
,365
$452
,253
$476
,558
$559
,376 $6
82,0
40
$618
,349
$612
,763
$402
,173
$461
,319
$425
,628
$0
$100,000
$200,000
$300,000
$400,000
$500,000
$600,000
$700,000
$800,000
Total Dollar Volume SoldIn Thousands
4.1
3.2
4.5 4.5
3.0 3.1
2.7
2.4
3.1
2.9
3.5 3.5
3.4
2.6
3.9
3.7
2.7 2.7
2.6
2.2 2.
4 2.5
3.3
2.9 3.0
0
1
2
3
4
5
Months of SupplyCurrent Month's Active Inventory/Current Month's Unit Sales
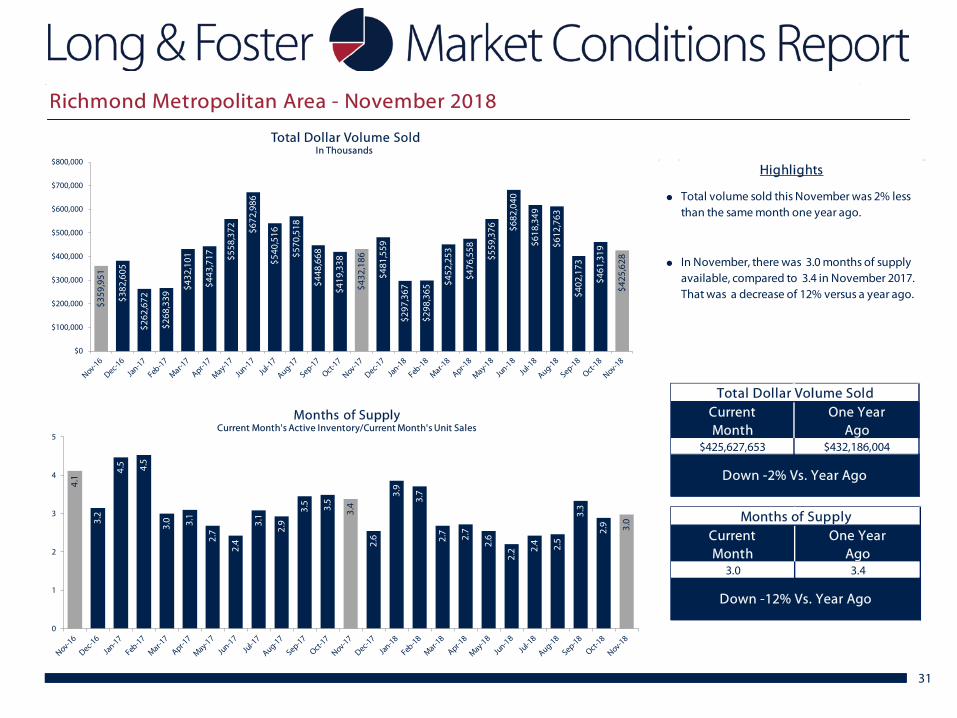
Total Dollar Volume SoldCurrentMonth
One YearAgo
$425,627,653 $432,186,004
Down -2% Vs. Year Ago
Months of SupplyCurrentMonth
One YearAgo
3.0 3.4
Down -12% Vs. Year Ago
●
●
Highlights
Total volume sold this November was 2% less than the same month one year ago.
In November, there was 3.0 months of supply available, compared to 3.4 in November 2017. That was a decrease of 12% versus a year ago.
Richmond Metropolitan Area - November 2018
32
1,47
4
1,17
5
1,91
8 2,26
6
2,93
3
2,71
8
2,86
2
2,80
8
2,37
9
2,41
2
2,17
2
2,18
2
1,62
2
1,21
8
1,89
9 2,11
8
2,72
8
2,80
9
2,95
4
2,69
0
2,53
8
2,47
3
2,06
5
2,11
5
1,74
9
1,22
7
1,03
8 1,34
1 1,74
0 2,11
7
2,07
7
2,15
5
1,96
0
1,79
7
1,70
3
1,56
0
1,65
4
1,31
9
1,16
8 1,42
1 1,64
8 2,02
9
2,12
2
2,09
6
2,01
5
1,83
5
1,70
4
1,47
3
1,57
6
1,39
3
0
500
1,000
1,500
2,000
2,500
3,000
3,500
New Listings & New ContractsNew Listings New Contracts (Under Active Contract Status)
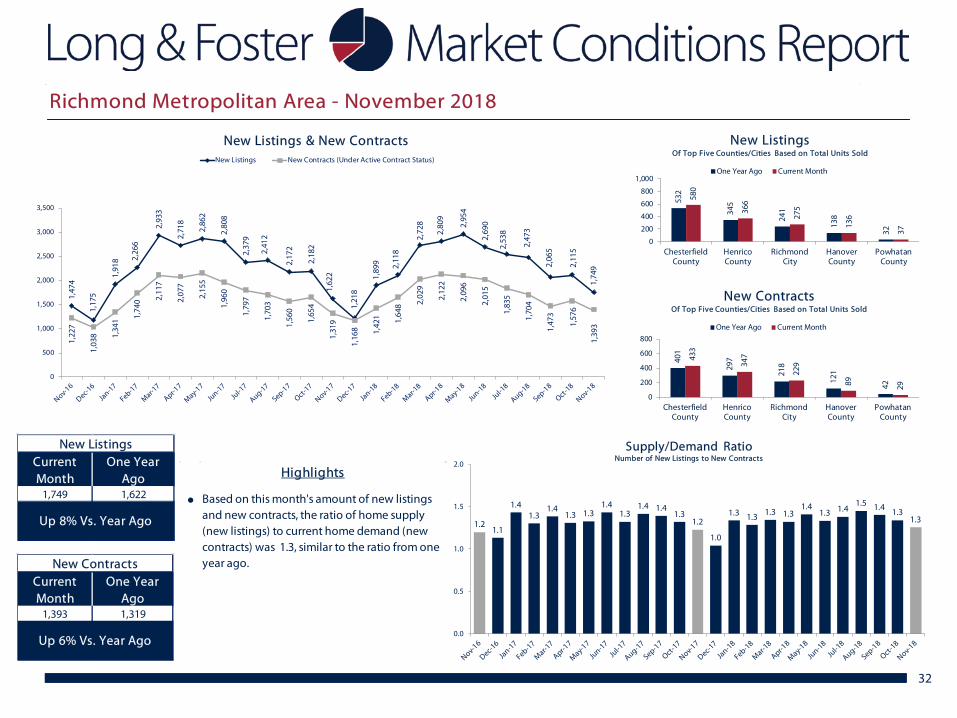
New ListingsCurrent Month
One Year Ago
1,749 1,622
Up 8% Vs. Year Ago
New ContractsCurrent Month
One Year Ago
1,393 1,319
Up 6% Vs. Year Ago
532
345
241
138
32
580
366
275
136
37
0
200
400
600
800
1,000
ChesterfieldCounty
HenricoCounty
RichmondCity
HanoverCounty
PowhatanCounty
New ListingsOf Top Five Counties/Cities Based on Total Units Sold
One Year Ago Current Month
401
297
218
121
42
433
347
229
89 29
0
200
400
600
800
ChesterfieldCounty
HenricoCounty
RichmondCity
HanoverCounty
PowhatanCounty
New ContractsOf Top Five Counties/Cities Based on Total Units Sold
One Year Ago Current Month
1.21.1
1.41.3
1.41.3 1.3
1.41.3
1.4 1.41.3
1.2
1.0
1.3 1.3 1.3 1.31.4
1.3 1.41.5 1.4
1.31.3
0.0
0.5
1.0
1.5
2.0
Supply/Demand RatioNumber of New Listings to New Contracts
●
Highlights
Based on this month's amount of new listings and new contracts, the ratio of home supply (new listings) to current home demand (new contracts) was 1.3, similar to the ratio from one year ago.
Richmond Metropolitan Area - November 2018
33
November 2018
7%
4%
-1%
2%
5% 4% 4% 4%
3%
1% 0%
1%
2%
5%
3%
8%
6%
2%
1%
0%
2%
4%
6%
3% 3%
-5%
0%
5%
10%
15%
Median Sale PricePercent Change Year/Year
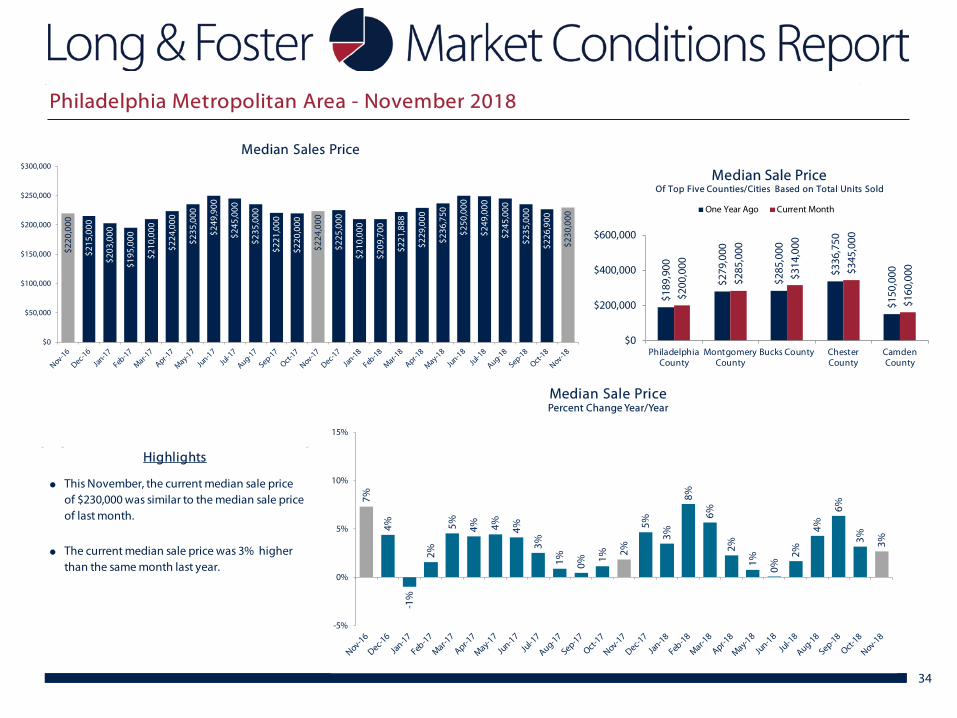
34
$220
,000
$215
,000
$203
,000
$195
,000
$210
,000
$224
,000
$235
,000
$249
,900
$245
,000
$235
,000
$221
,000
$220
,000
$224
,000
$225
,000
$210
,000
$209
,700
$221
,888
$229
,000
$236
,750
$250
,000
$249
,000
$245
,000
$235
,000
$226
,900
$230
,000
$0
$50,000
$100,000
$150,000
$200,000
$250,000
$300,000
Median Sales Price
$189
,900
$279
,000
$285
,000
$336
,750
$150
,000
$200
,000
$285
,000
$314
,000
$345
,000
$160
,000
$0
$200,000
$400,000
$600,000
PhiladelphiaCounty
MontgomeryCounty
Bucks County ChesterCounty
CamdenCounty
Median Sale PriceOf Top Five Counties/Cities Based on Total Units Sold
One Year Ago Current Month
●
●
Highlights
The current median sale price was 3% higher than the same month last year.
This November, the current median sale price of $230,000 was similar to the median sale price of last month.
Philadelphia Metropolitan Area - November 2018
28%
6% 6%
3%
19%
6%
13%
5%
8%
6% 5%
11%
6%
2%
5%
-5%
-5%
1%
-2% -1%
5%
2%
-8%
-1%
-2%
-20%
-15%
-10%
-5%
0%
5%
10%
15%
20%
25%
30%
35%
Total Units SoldPercent Change Year/Year
35
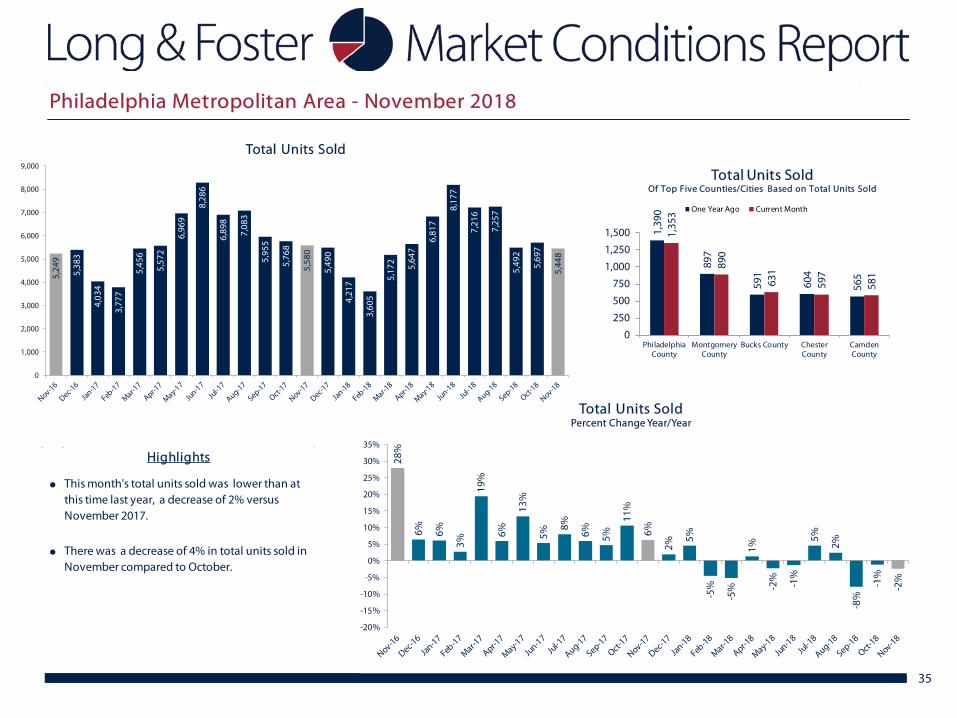
5,24
9
5,38
3
4,03
4
3,77
7
5,45
6
5,57
2
6,96
9
8,28
6
6,89
8
7,08
3
5,95
5
5,76
8
5,58
0
5,49
0
4,21
7
3,60
5
5,17
2
5,64
7
6,81
7
8,17
7
7,21
6
7,25
7
5,49
2
5,69
7
5,44
8
0
1,000
2,000
3,000
4,000
5,000
6,000
7,000
8,000
9,000
Total Units Sold
1,39
0
897
591
604
565
1,35
3
890
631
597
581
0
250
500
750
1,000
1,250
1,500
PhiladelphiaCounty
MontgomeryCounty
Bucks County ChesterCounty
CamdenCounty
Total Units SoldOf Top Five Counties/Cities Based on Total Units Sold
One Year Ago Current Month
●
●
Highlights
There was a decrease of 4% in total units sold in November compared to October.
This month's total units sold was lower than at this time last year, a decrease of 2% versus November 2017.
Philadelphia Metropolitan Area - November 2018
36
0
1,000
2,000
3,000
4,000
5,000
6,000
7,000
8,000
9,000
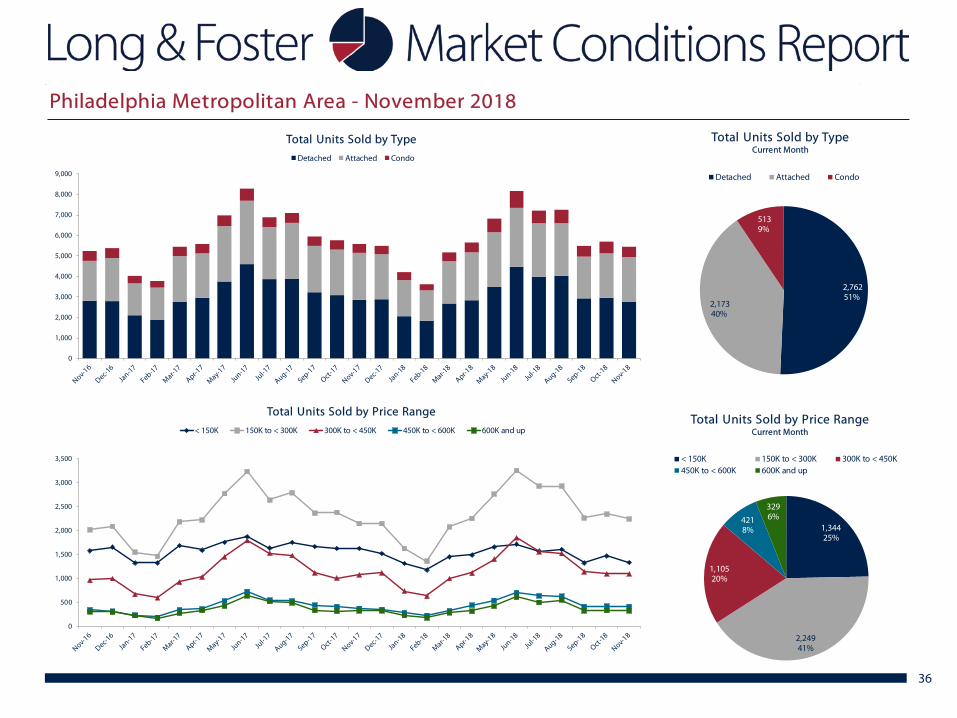
Total Units Sold by Type
Detached Attached Condo
2,762 51%
2,173 40%
513 9%
Total Units Sold by TypeCurrent Month
Detached Attached Condo
1,34425%
2,24941%
1,10520%
4218%
3296%
Total Units Sold by Price RangeCurrent Month
< 150K 150K to < 300K 300K to < 450K450K to < 600K 600K and up
0
500
1,000
1,500
2,000
2,500
3,000
3,500
Total Units Sold by Price Range
< 150K 150K to < 300K 300K to < 450K 450K to < 600K 600K and up
Philadelphia Metropolitan Area - November 2018
-15%
-15%
-15% -1
4%
-15% -15% -1
3% -12%
-12% -1
0%
-10% -9
%
-10% -9
%
-11%
-12%
-15% -1
4%
-13%
-14%
-15%
-17%
-17%
-17%
-20%
-30%
-25%
-20%
-15%
-10%
-5%
0%
5%
Total Active InventoryPercent Change Year/Year
37
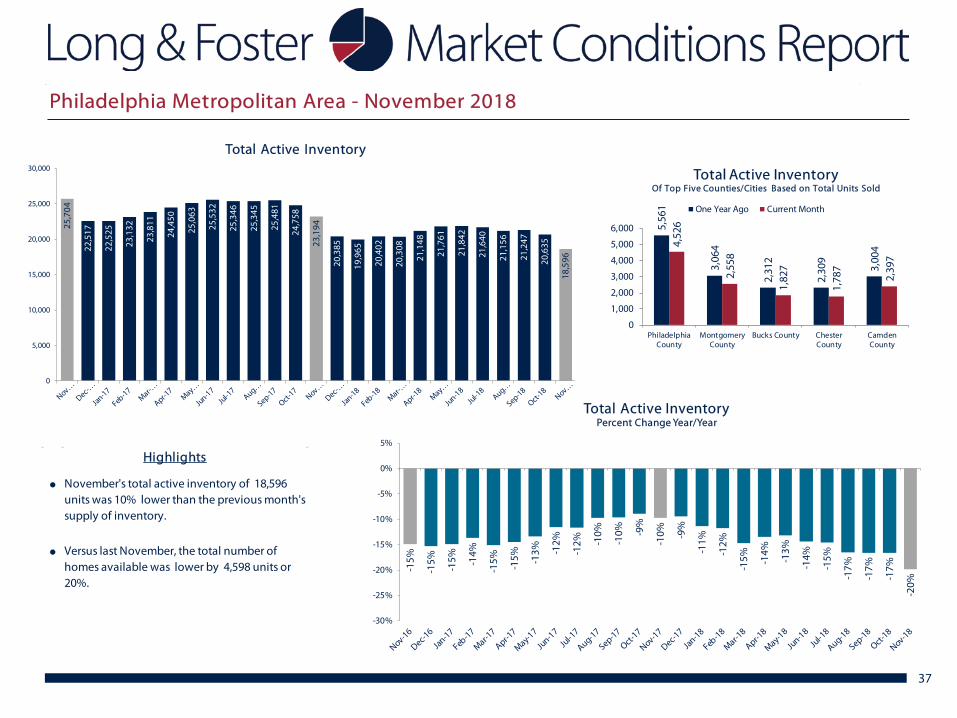
25,7
04
22,5
17
22,5
25
23,1
32
23,8
11
24,4
50
25,0
63
25,5
32
25,3
46
25,3
45
25,4
81
24,7
58
23,1
94
20,3
85
19,9
65
20,4
02
20,3
08
21,1
48
21,7
61
21,8
42
21,6
40
21,1
56
21,2
47
20,6
35
18,5
96
0
5,000
10,000
15,000
20,000
25,000
30,000
Total Active Inventory
5,56
1
3,06
4
2,31
2
2,30
9
3,00
44,52
6
2,55
8
1,82
7
1,78
7
2,39
7
0
1,000
2,000
3,000
4,000
5,000
6,000
PhiladelphiaCounty
MontgomeryCounty
Bucks County ChesterCounty
CamdenCounty
Total Active InventoryOf Top Five Counties/Cities Based on Total Units Sold
One Year Ago Current Month
●
●
Highlights
Versus last November, the total number of homes available was lower by 4,598 units or 20%.
November's total active inventory of 18,596 units was 10% lower than the previous month's supply of inventory.
Philadelphia Metropolitan Area - November 2018
38
0
5,000
10,000
15,000
20,000
25,000
30,000
Total Active Inventory by TypeDetached Attached Condo
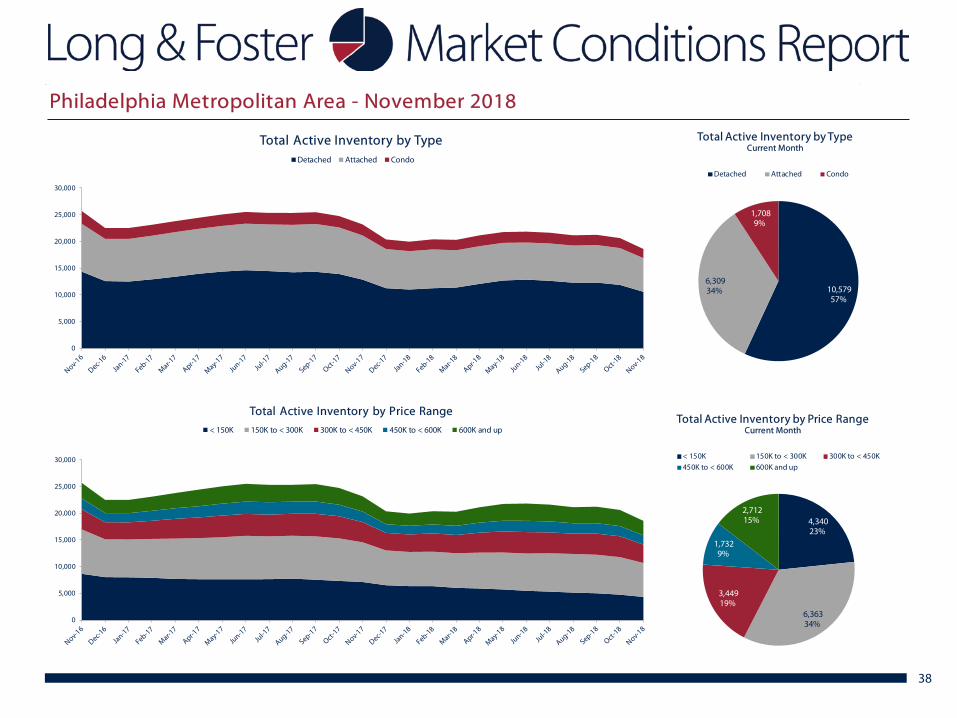
10,579 57%
6,309 34%
1,708 9%
Total Active Inventory by TypeCurrent Month
Detached Attached Condo
4,340 23%
6,363 34%
3,449 19%
1,732 9%
2,712 15%
Total Active Inventory by Price RangeCurrent Month
< 150K 150K to < 300K 300K to < 450K450K to < 600K 600K and up
0
5,000
10,000
15,000
20,000
25,000
30,000
Total Active Inventory by Price Range
< 150K 150K to < 300K 300K to < 450K 450K to < 600K 600K and up
Philadelphia Metropolitan Area - November 2018
39
96.9
% 97.1
%
96.7
%
97.2
%
97.3
% 97.5
%
98.0
%
98.0
%
98.1
%
97.9
%
97.8
%
97.8
%
97.4
%
97.3
%
97.3
% 97.5
% 97.8
% 98.0
%
98.4
%
98.3
%
98.3
%
98.1
%
98.0
%
98.0
%
97.6
%
95.5%
96.0%
96.5%
97.0%
97.5%
98.0%
98.5%
Average Sale Price as a Percent of List Price
97.5
%
97.4
% 98.0
% 98.5
%
97.3
%
97.2
%
97.5
%
97.7
%
98.8
%
97.5
%
96.0%
97.0%
98.0%
99.0%
PhiladelphiaCounty
MontgomeryCounty
Bucks County ChesterCounty
CamdenCounty
Sale Price as % of List PriceOf Top Five Counties/Cities Based on Total Units Sold
One Year Ago Current Month
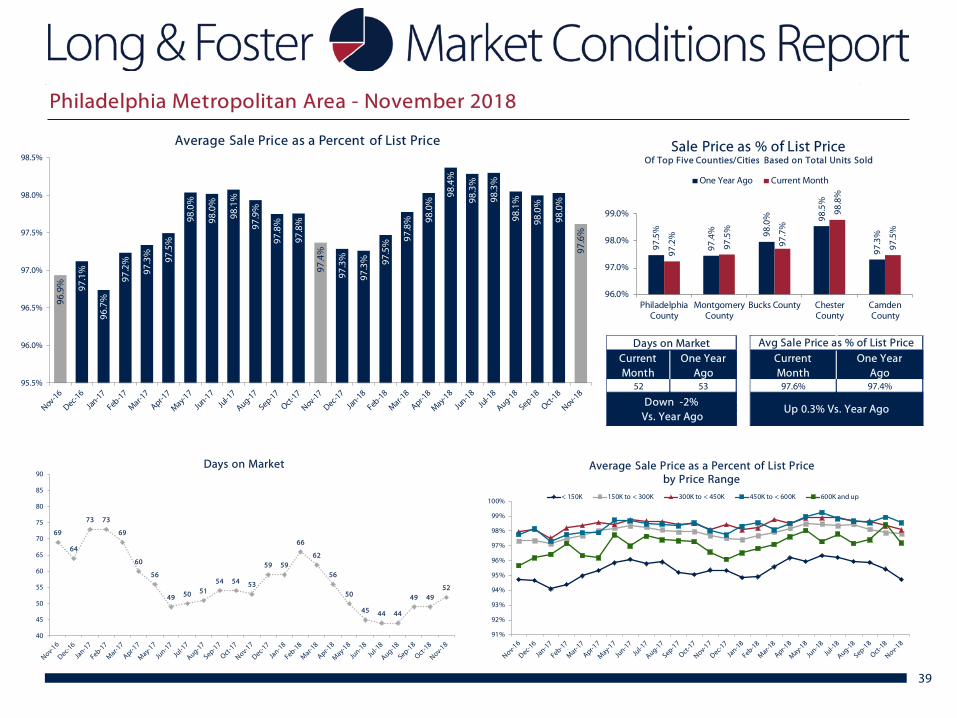
Days on MarketCurrentMonth
One YearAgo
52 53
Down -2% Vs. Year Ago
Avg Sale Price as % of List PriceCurrentMonth
One YearAgo
97.6% 97.4%
Up 0.3% Vs. Year Ago
69
64
73 73
69
60
56
49 50 5154 54 53
59 59
66
62
56
50
45 44 44
49 4952
40
45
50
55
60
65
70
75
80
85
90Days on Market
91%
92%
93%
94%
95%
96%
97%
98%
99%
100%
Average Sale Price as a Percent of List Price by Price Range
< 150K 150K to < 300K 300K to < 450K 450K to < 600K 600K and up
Philadelphia Metropolitan Area - November 2018
40
$1,3
98,0
38
$1,4
05,3
37
$1,0
31,7
44
$891
,218 $1
,393
,450
$1,5
05,4
36
$1,9
61,6
52 $2,4
98,9
87
$2,0
38,8
44
$2,0
36,7
04
$1,5
99,4
29
$1,5
25,0
88
$1,5
07,3
97
$1,5
09,6
70
$1,0
90,3
42
$898
,120 $1
,370
,702
$1,5
56,9
02
$1,9
23,4
02 $2,4
72,9
71
$2,1
37,7
22
$2,1
67,3
91
$1,5
41,7
64
$1,5
67,9
86
$1,5
13,4
65
$0
$500,000
$1,000,000
$1,500,000
$2,000,000
$2,500,000
$3,000,000
Total Dollar Volume SoldIn Thousands
4.9
4.2
5.6
6.1
4.4
4.4
3.6
3.1
3.7
3.6
4.3
4.3
4.2
3.7
4.7
5.7
3.9
3.7
3.2
2.7 3.
0
2.9
3.9
3.6
3.4
0
1
2
3
4
5
6
7
Months of SupplyCurrent Month's Active Inventory/Current Month's Unit Sales
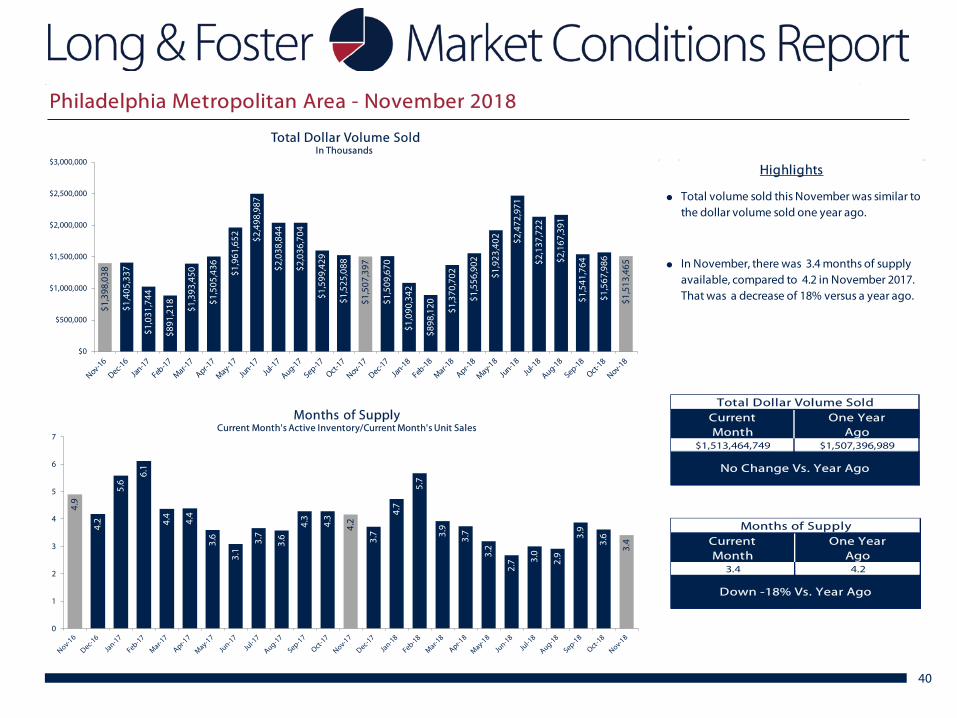
Total Dollar Volume SoldCurrentMonth
One YearAgo
$1,513,464,749 $1,507,396,989
No Change Vs. Year Ago
Months of SupplyCurrentMonth
One YearAgo
3.4 4.2
Down -18% Vs. Year Ago
●
●
Highlights
Total volume sold this November was similar to the dollar volume sold one year ago.
In November, there was 3.4 months of supply available, compared to 4.2 in November 2017. That was a decrease of 18% versus a year ago.
Philadelphia Metropolitan Area - November 2018
41
6,04
5
4,46
6
7,09
4 8,15
9
10,2
18
9,86
9
10,4
75
9,63
1
8,32
2
8,51
8
8,22
2
7,78
5
6,41
6
4,29
3
6,72
3 7,67
1 8,86
7
10,4
39
10,5
60
9,64
9
8,57
3
8,35
5
8,15
9
8,24
0
5,98
2
4,62
1
3,82
7 4,72
5 5,53
5
7,20
3
7,14
7
7,49
0
6,77
2
5,99
4
6,11
5
5,40
3
5,67
5
4,89
8
3,73
1 4,64
8
5,25
3
6,80
9 7,56
4
7,46
0
6,98
9
6,23
4
5,98
1
5,23
8
5,73
1
4,75
5
0
2,000
4,000
6,000
8,000
10,000
12,000
New Listings & New ContractsNew Listings New Contracts (Under Active Contract Status)
1,67
5
864
589
707
803
1,71
9
832
582
575
661
0500
1,0001,5002,0002,5003,000
PhiladelphiaCounty
MontgomeryCounty
Bucks County ChesterCounty
CamdenCounty
New ListingsOf Top Five Counties/Cities Based on Total Units Sold
One Year Ago Current Month
1,28
7
748
532
501
509
1,20
7
768
514
451
522
0
500
1,000
1,500
PhiladelphiaCounty
MontgomeryCounty
Bucks County Chester County CamdenCounty
New ContractsOf Top Five Counties/Cities Based on Total Units Sold
One Year Ago Current Month
1.31.2
1.5 1.5 1.4 1.4 1.4 1.4 1.4 1.41.5
1.41.3
1.2
1.4 1.5
1.31.4 1.4 1.4 1.4 1.4
1.61.4
1.3
0.0
0.5
1.0
1.5
2.0
Supply/Demand RatioNumber of New Listings to New Contracts
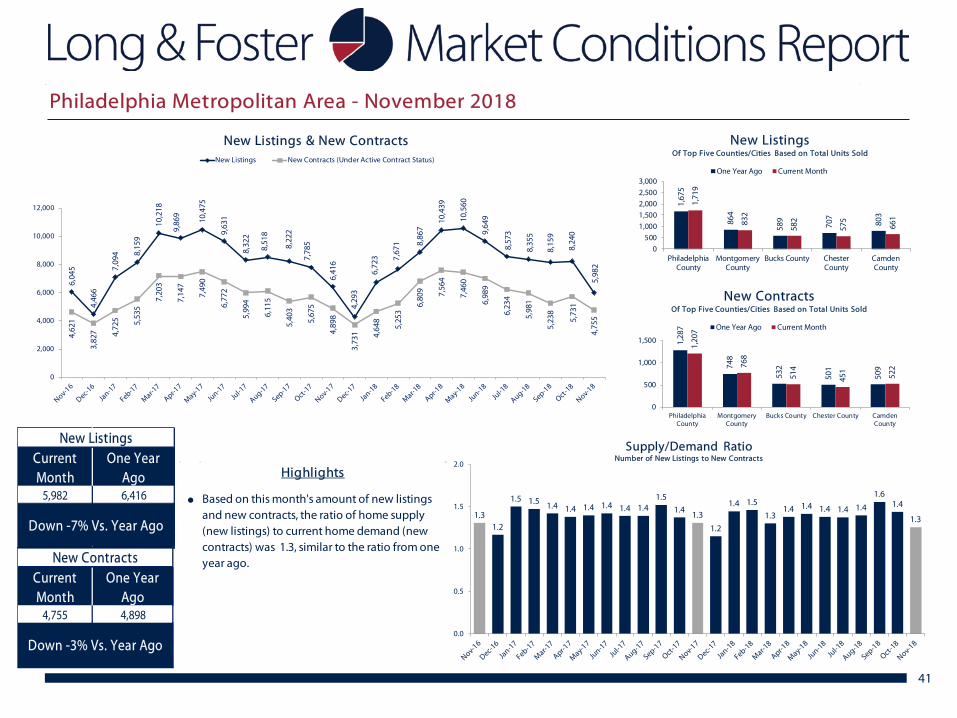
New ListingsCurrent Month
One Year Ago
5,982 6,416
Down -7% Vs. Year Ago
New ContractsCurrent Month
One Year Ago
4,755 4,898
Down -3% Vs. Year Ago
●
Highlights
Based on this month's amount of new listings and new contracts, the ratio of home supply (new listings) to current home demand (new contracts) was 1.3, similar to the ratio from one year ago.
Philadelphia Metropolitan Area - November 2018
42
November 2018
3%
9%
7% 7%
8%
10%
9%
6%
7%
9%
5%
8%
8%
6%
10%
13%
10%
5% 6% 6%
7% 7% 7%
5%
7%
0%
5%
10%
15%
Median Sale PricePercent Change Year/Year
43
$241
,500
$250
,000
$235
,730
$240
,000 $2
50,0
00
$258
,500
$260
,000
$265
,000
$260
,000
$258
,000
$252
,500
$257
,600
$260
,638
$265
,000
$259
,900 $2
70,0
00
$275
,000
$272
,500
$275
,000
$281
,000
$278
,000
$275
,000
$270
,000
$269
,950 $2
80,0
00
$210,000
$220,000
$230,000
$240,000
$250,000
$260,000
$270,000
$280,000
$290,000
Median Sales Price
$292
,000
$240
,000
$207
,500 $3
57,0
00
$365
,715
$316
,000
$254
,950
$223
,500
$291
,828
$415
,330
$0
$200,000
$400,000
$600,000
WakeCounty
DurhamCounty
JohnstonCounty
OrangeCounty
ChathamCounty
Median Sale PriceOf Top Five Counties/Cities Based on Total Units Sold
One Year Ago Current Month
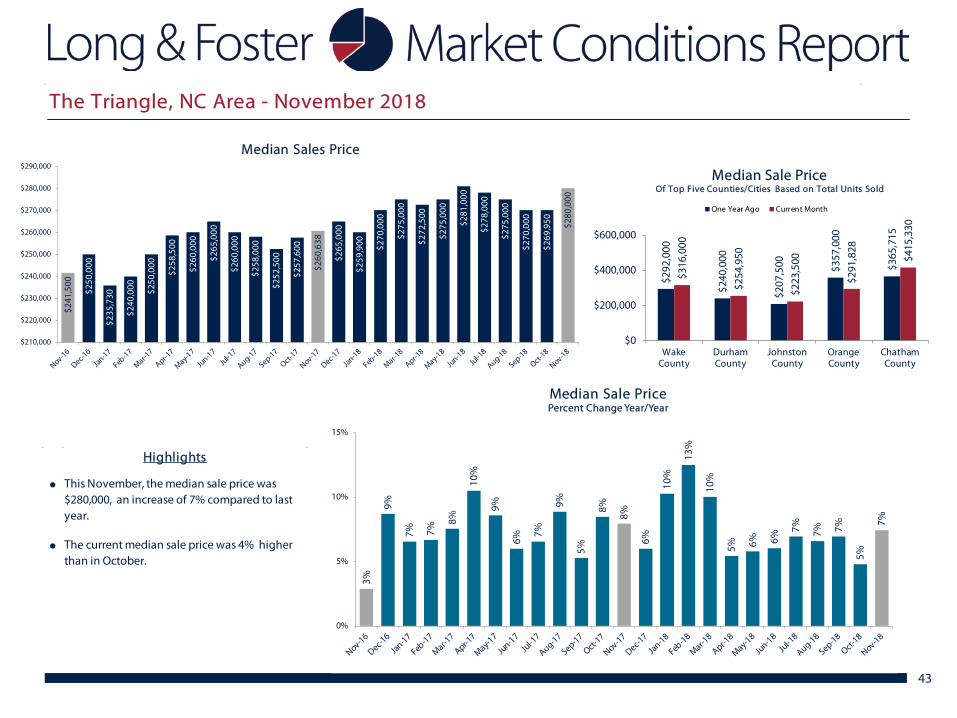
●
●
Highlights
The current median sale price was 4% higher than in October.
This November, the median sale price was $280,000, an increase of 7% compared to last year.
The Triangle, NC Area - November 2018
26%
4%
7% 8%
16%
2% 3% 3% 2%
5%
0%
4%
12%
6%
2%
1%
-3%
9%
1%
-3%
11%
0%
-11%
-2%
-1%
-20%
-15%
-10%
-5%
0%
5%
10%
15%
20%
25%
30%
Total Units SoldPercent Change Year/Year
44
1,61
3
386
347
113
115
1,53
9
388
383
122
104
0
500
1,000
1,500
2,000
WakeCounty
DurhamCounty
JohnstonCounty
OrangeCounty
ChathamCounty
Total Units SoldOf Top Five Counties/Cities Based on Total Units Sold
One Year Ago Current Month
2,56
3 2,81
7
1,95
7
2,09
2
3,21
2
3,01
5
3,69
1
4,17
8
3,42
7 3,68
5
3,04
2
2,92
4
2,87
5
2,98
6
2,00
5
2,10
6
3,12
3
3,28
7 3,73
8 4,03
4
3,80
1
3,68
4
2,71
0
2,87
6
2,84
1
0
500
1,000
1,500
2,000
2,500
3,000
3,500
4,000
4,500
Total Units Sold
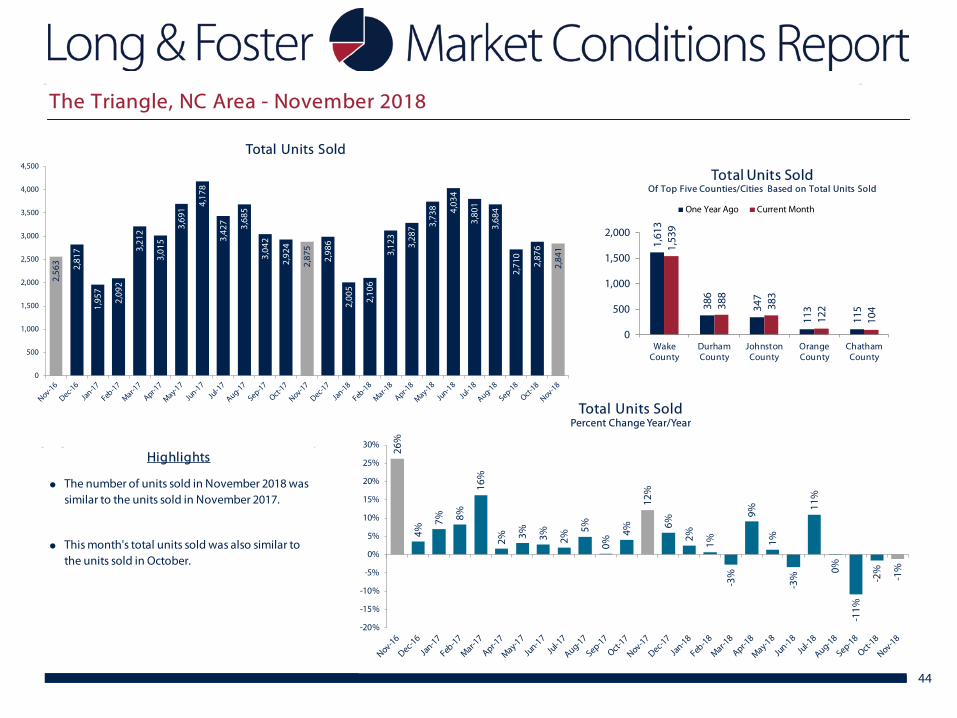
●
●
Highlights
This month's total units sold was also similar to the units sold in October.
The number of units sold in November 2018 was similar to the units sold in November 2017.
The Triangle, NC Area - November 2018
45
0
500
1,000
1,500
2,000
2,500
3,000
3,500
4,000
4,500
Total Units Sold by Type
Detached Attached Condo
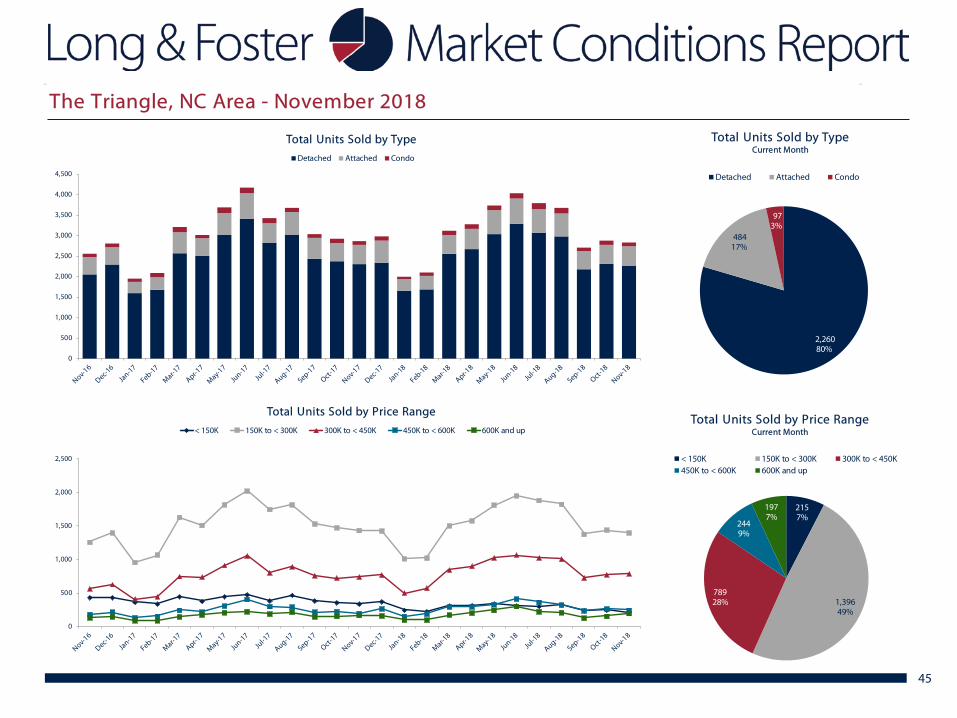
2,260 80%
484 17%
97 3%
Total Units Sold by TypeCurrent Month
Detached Attached Condo
2157%
1,39649%
78928%
2449%
1977%
Total Units Sold by Price RangeCurrent Month
< 150K 150K to < 300K 300K to < 450K450K to < 600K 600K and up
0
500
1,000
1,500
2,000
2,500
Total Units Sold by Price Range
< 150K 150K to < 300K 300K to < 450K 450K to < 600K 600K and up
The Triangle, NC Area - November 2018
-8% -7
%
-6%
-2%
0%
0%
-1%
-3%
-5%
-3%
-4% -3%
-5%
-5% -5%
-3%
-5%
-3%
2%
-1%
-2%
-2%
-3%
-4%
-5%
-15%
-10%
-5%
0%
5%
Total Active InventoryPercent Change Year/Year
46
8,00
0
7,07
5
7,03
9
7,17
0 7,78
6
7,95
0
8,04
1
8,23
9
8,19
7
8,34
9
8,39
8
8,23
2
7,63
5
6,71
3
6,70
7
6,94
9
7,38
3
7,69
1 8,19
1
8,16
7
8,05
4
8,16
3
8,17
6
7,86
7
7,24
6
0
1,000
2,000
3,000
4,000
5,000
6,000
7,000
8,000
9,000
Total Active Inventory
3,97
3
756
944
419
430
3,76
4
713 1,00
4
403
428
0
1,000
2,000
3,000
4,000
5,000
WakeCounty
DurhamCounty
JohnstonCounty
OrangeCounty
ChathamCounty
Total Active InventoryOf Top Five Counties/Cities Based on Total Units Sold
One Year Ago Current Month
●
●
Highlights
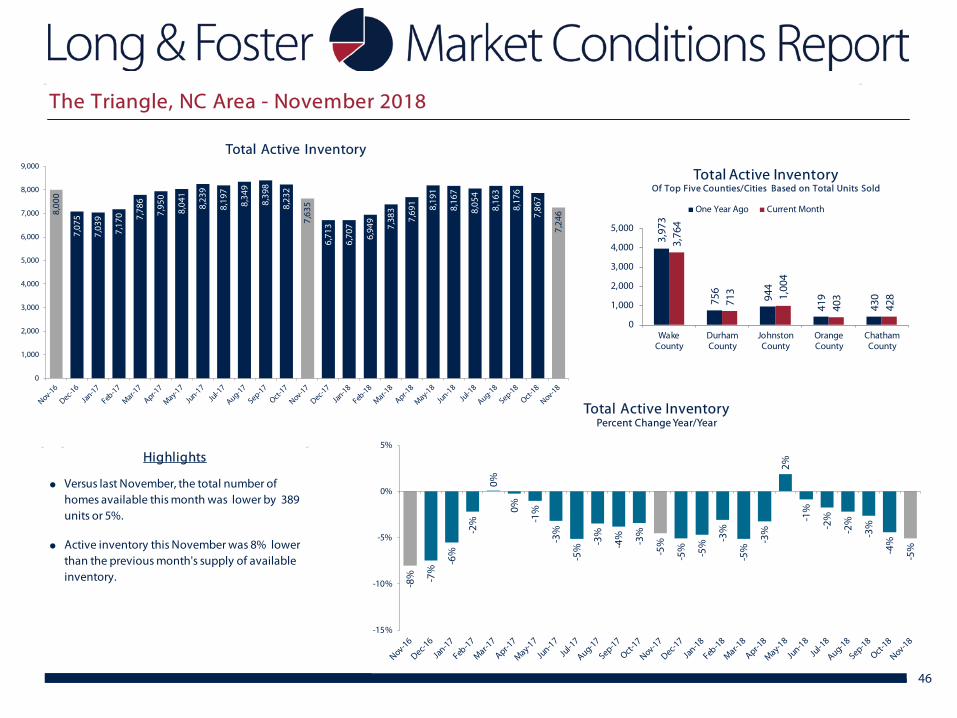
Active inventory this November was 8% lower than the previous month's supply of available inventory.
Versus last November, the total number of homes available this month was lower by 389 units or 5%.
The Triangle, NC Area - November 2018
47
0
1,000
2,000
3,000
4,000
5,000
6,000
7,000
8,000
9,000
Total Active Inventory by TypeDetached Attached Condo
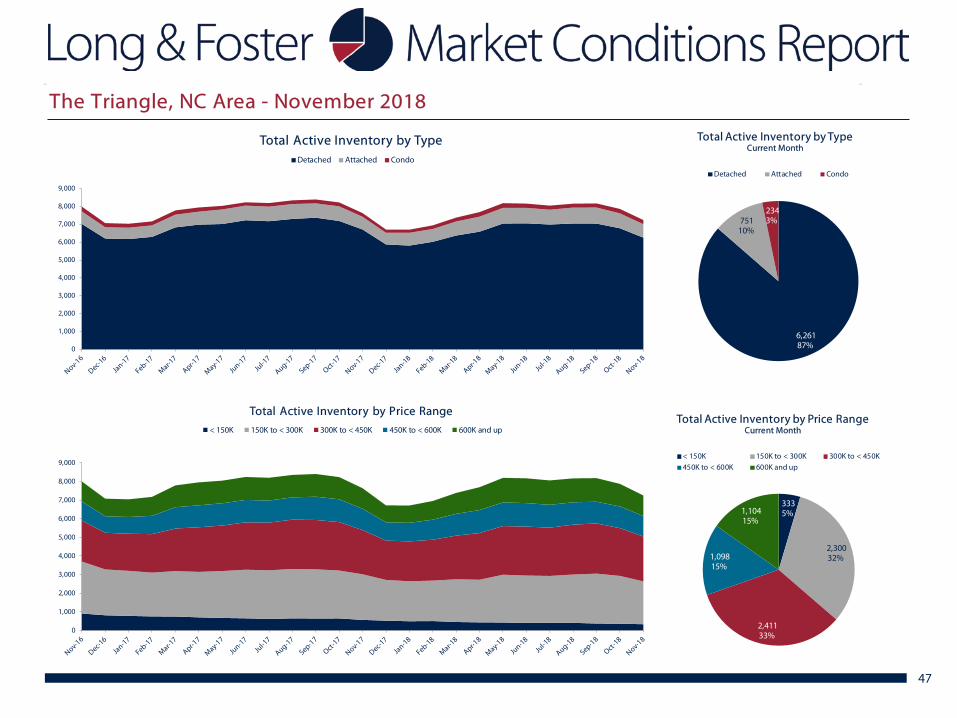
6,261 87%
751 10%
234 3%
Total Active Inventory by TypeCurrent Month
Detached Attached Condo
333 5%
2,300 32%
2,411 33%
1,098 15%
1,104 15%
Total Active Inventory by Price RangeCurrent Month
< 150K 150K to < 300K 300K to < 450K450K to < 600K 600K and up
0
1,000
2,000
3,000
4,000
5,000
6,000
7,000
8,000
9,000
Total Active Inventory by Price Range
< 150K 150K to < 300K 300K to < 450K 450K to < 600K 600K and up
The Triangle, NC Area - November 2018
48
98.4
%
98.7
%
98.6
%
98.6
%
99.0
%
99.2
%
99.2
% 99.3
%
99.1
%
99.1
%
99.0
%
99.0
%
98.7
% 98.9
%
98.6
% 98.7
%
99.2
% 99.4
% 99.5
%
99.4
%
99.4
%
99.1
% 99.2
%
98.9
%
98.9
%
97.8%
98.0%
98.2%
98.4%
98.6%
98.8%
99.0%
99.2%
99.4%
99.6%
99.8%
Average Sale Price as a Percent of List Price
46
5354
58
52
46
4240
3840
43 43
46
53
50
55 55
4341
4342
4546 46
53
35
40
45
50
55
60
65
70Days on Market
94%
95%
96%
97%
98%
99%
100%
101%
Average Sale Price as a Percent of List Price by Price Range
< 150K 150K to < 300K 300K to < 450K 450K to < 600K 600K and up
99.0
%
99.1
%
99.4
%
98.2
%
95.8
%
98.9
%
99.2
%
99.3
%
97.5
% 99.0
%
93.0%94.0%95.0%96.0%97.0%98.0%99.0%
100.0%
WakeCounty
DurhamCounty
JohnstonCounty
OrangeCounty
ChathamCounty
Sale Price as % of List PriceOf Top Five Counties/Cities Based on Total Units Sold
One Year Ago Current Month
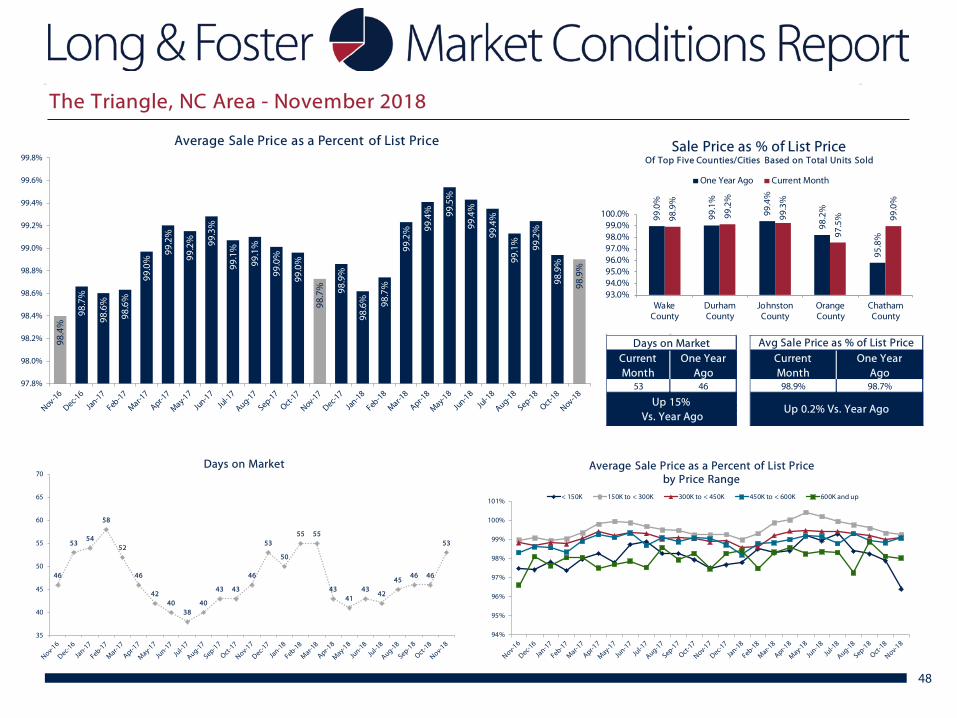
Days on MarketCurrentMonth
One YearAgo
53 46
Up 15% Vs. Year Ago
Avg Sale Price as % of List PriceCurrentMonth
One YearAgo
98.9% 98.7%
Up 0.2% Vs. Year Ago
The Triangle, NC Area - November 2018
49
$729
,065
$809
,648
$540
,138
$585
,953
$917
,559
$894
,784 $1
,115
,188
$1,2
89,6
87
$1,0
32,7
25
$1,1
00,2
64
$883
,531
$864
,503
$866
,957
$907
,812
$594
,652
$634
,259
$966
,249
$1,0
21,4
25
$1,1
80,9
12
$1,3
19,6
60
$1,1
99,3
54
$1,1
50,5
83
$821
,842
$887
,889
$908
,388
$0
$200,000
$400,000
$600,000
$800,000
$1,000,000
$1,200,000
$1,400,000
Total Dollar Volume SoldIn Thousands
3.1
2.5
3.6
3.4
2.4 2.
6
2.2
2.0
2.4
2.3
2.8 2.8
2.7
2.3
3.4
3.3
2.4
2.3
2.2
2.0 2.
1 2.2
3.0
2.7
2.6
0
1
2
3
4
Months of SupplyCurrent Month's Active Inventory/Current Month's Unit Sales
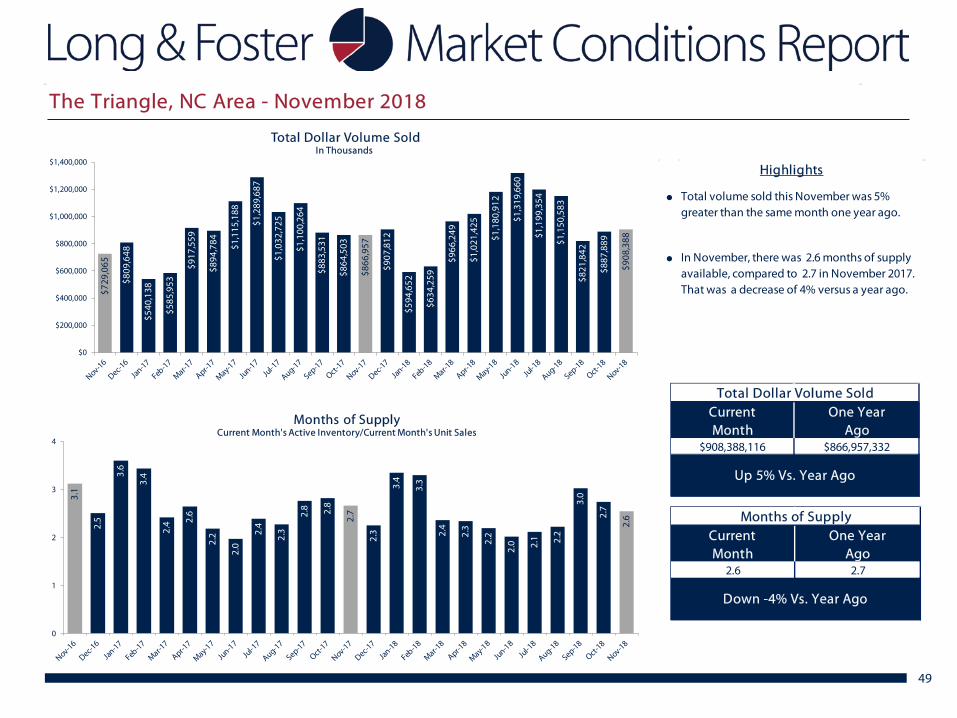
Total Dollar Volume SoldCurrentMonth
One YearAgo
$908,388,116 $866,957,332
Up 5% Vs. Year Ago
Months of SupplyCurrentMonth
One YearAgo
2.6 2.7
Down -4% Vs. Year Ago
●
●
Highlights
Total volume sold this November was 5% greater than the same month one year ago.
In November, there was 2.6 months of supply available, compared to 2.7 in November 2017. That was a decrease of 4% versus a year ago.
The Triangle, NC Area - November 2018
50
2,65
2
1,94
9
3,06
6 3,55
0
4,93
2
4,32
1
4,39
1
4,37
9
4,00
2
3,97
4
3,55
7
3,32
4
2,64
7
2,05
4
3,14
1 3,69
6
4,62
3
4,56
0
4,88
3
4,23
4
3,88
0
4,01
3
3,01
9
3,38
2
2,82
8
2,36
3
2,02
6 2,46
7 2,94
0
3,77
4
3,66
3
3,72
8
3,54
7
3,37
4
3,18
0
2,84
8
2,76
8
2,54
4
2,07
7 2,62
8
3,06
5
3,72
6
3,85
6
3,90
1
3,72
9
3,47
1
3,26
7
2,42
6
3,00
9
2,61
5
0
1,000
2,000
3,000
4,000
5,000
6,000
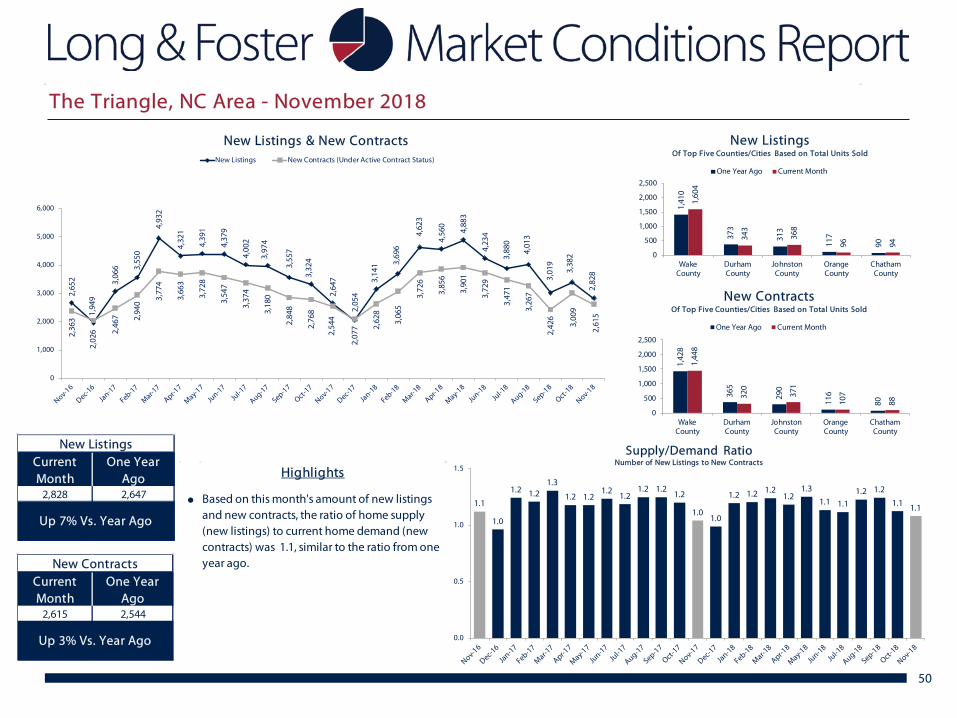
New Listings & New ContractsNew Listings New Contracts (Under Active Contract Status)
New ListingsCurrent Month
One Year Ago
2,828 2,647
Up 7% Vs. Year Ago
New ContractsCurrent Month
One Year Ago
2,615 2,544
Up 3% Vs. Year Ago
1.1
1.0
1.2 1.21.3
1.2 1.21.2
1.21.2 1.2
1.2
1.01.0
1.2 1.2 1.21.2
1.3
1.1 1.11.2 1.2
1.1 1.1
0.0
0.5
1.0
1.5
Supply/Demand RatioNumber of New Listings to New Contracts
1,41
0
373
313
117
90
1,60
4
343
368
96 94
0
500
1,000
1,500
2,000
2,500
WakeCounty
DurhamCounty
JohnstonCounty
OrangeCounty
ChathamCounty
New ListingsOf Top Five Counties/Cities Based on Total Units Sold
One Year Ago Current Month
1,42
8
365
290
116
80
1,44
8
320
371
107
88
0
500
1,000
1,500
2,000
2,500
WakeCounty
DurhamCounty
JohnstonCounty
OrangeCounty
ChathamCounty
New ContractsOf Top Five Counties/Cities Based on Total Units Sold
One Year Ago Current Month
●
Highlights
Based on this month's amount of new listings and new contracts, the ratio of home supply (new listings) to current home demand (new contracts) was 1.1, similar to the ratio from one year ago.
The Triangle, NC Area - November 2018
51
November 2018
5%
-3%
13%
6%
12%
4% 5% 5%
18%
6% 6%
20%
4%
15%
3%
12% 16
%
10%
0%
-2%
0%
8%
4%
-13%
14%
-20%
-15%
-10%
-5%
0%
5%
10%
15%
20%
25%
Median Sale PricePercent Change Year/Year
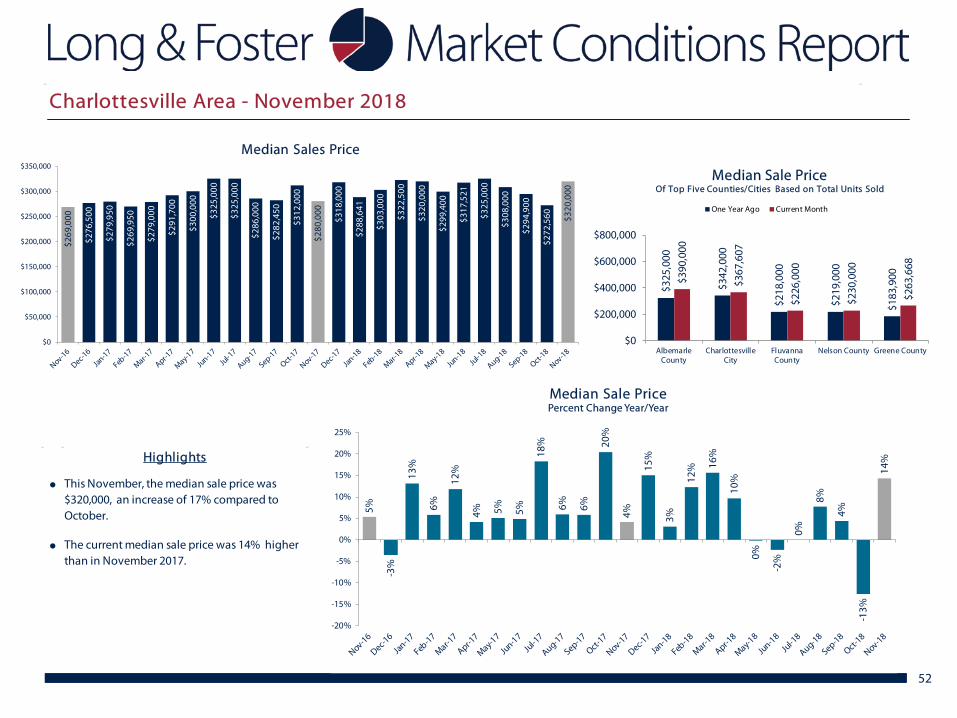
52
$269
,000
$276
,500
$279
,950
$269
,950
$279
,000
$291
,700
$300
,000
$325
,000
$325
,000
$286
,000
$282
,450
$312
,000
$280
,000
$318
,000
$288
,641
$303
,000
$322
,500
$320
,000
$299
,400
$317
,521
$325
,000
$308
,000
$294
,900
$272
,560 $3
20,0
00
$0
$50,000
$100,000
$150,000
$200,000
$250,000
$300,000
$350,000
Median Sales Price
$325
,000
$342
,000
$218
,000
$219
,000
$183
,900$3
90,0
00
$367
,607
$226
,000
$230
,000
$263
,668
$0
$200,000
$400,000
$600,000
$800,000
AlbemarleCounty
CharlottesvilleCity
FluvannaCounty
Nelson County Greene County
Median Sale PriceOf Top Five Counties/Cities Based on Total Units Sold
One Year Ago Current Month
●
●
Highlights
The current median sale price was 14% higher than in November 2017.
This November, the median sale price was $320,000, an increase of 17% compared to October.
Charlottesville Area - November 2018
29%
13% 16
%
- 6%
0%
22%
5%
1%
-5%
11%
-8%
15%
15%
-4%
-12%
34%
27%
17%
12%
-3%
15%
0%
-4%
-6% -4
%
-20%
-15%
-10%
-5%
0%
5%
10%
15%
20%
25%
30%
35%
Total Units SoldPercent Change Year/Year
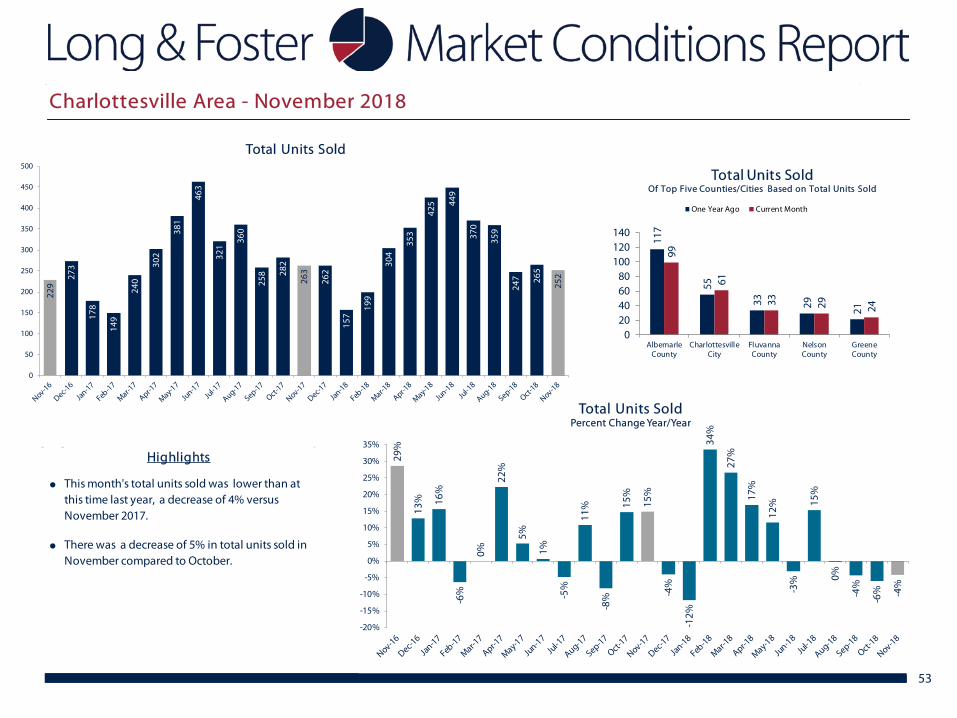
53
229
273
178
149
240
302
381
463
321
360
258 28
2
263
262
157
199
304
353
425 44
9
370
359
247 26
5
252
0
50
100
150
200
250
300
350
400
450
500
Total Units Sold
117
55
33 29 21
99
61
33 29 24
020406080
100120140
AlbemarleCounty
CharlottesvilleCity
FluvannaCounty
NelsonCounty
GreeneCounty
Total Units SoldOf Top Five Counties/Cities Based on Total Units Sold
One Year Ago Current Month
●
●
Highlights
There was a decrease of 5% in total units sold in November compared to October.
This month's total units sold was lower than at this time last year, a decrease of 4% versus November 2017.
Charlottesville Area - November 2018
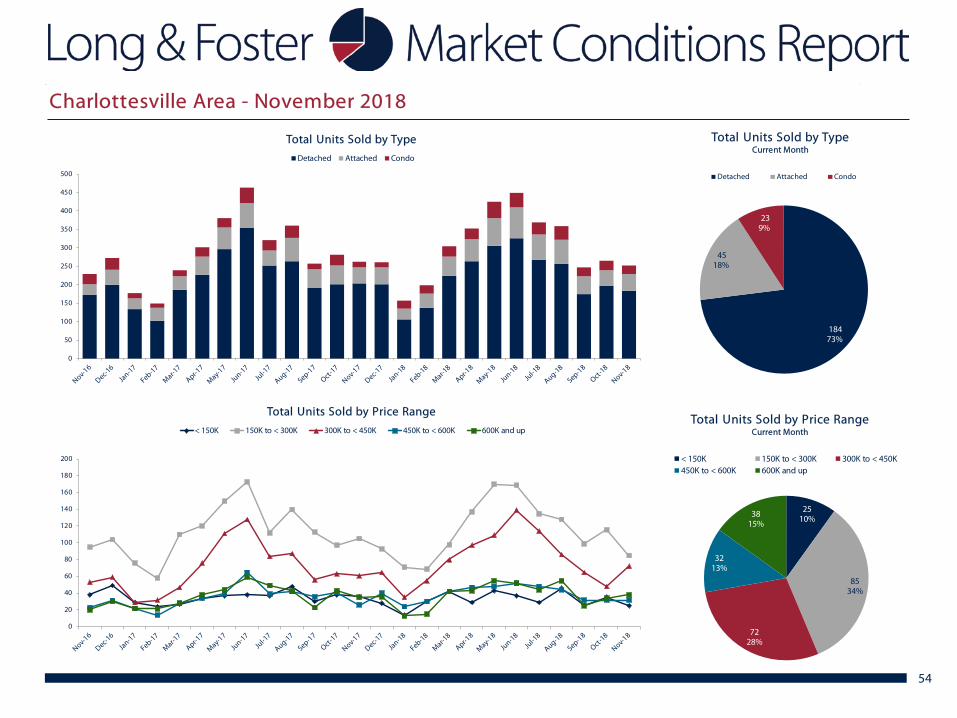
54
0
50
100
150
200
250
300
350
400
450
500
Total Units Sold by Type
Detached Attached Condo
184 73%
45 18%
23 9%
Total Units Sold by TypeCurrent Month
Detached Attached Condo
2510%
8534%
7228%
3213%
3815%
Total Units Sold by Price RangeCurrent Month
< 150K 150K to < 300K 300K to < 450K450K to < 600K 600K and up
0
20
40
60
80
100
120
140
160
180
200
Total Units Sold by Price Range
< 150K 150K to < 300K 300K to < 450K 450K to < 600K 600K and up
Charlottesville Area - November 2018
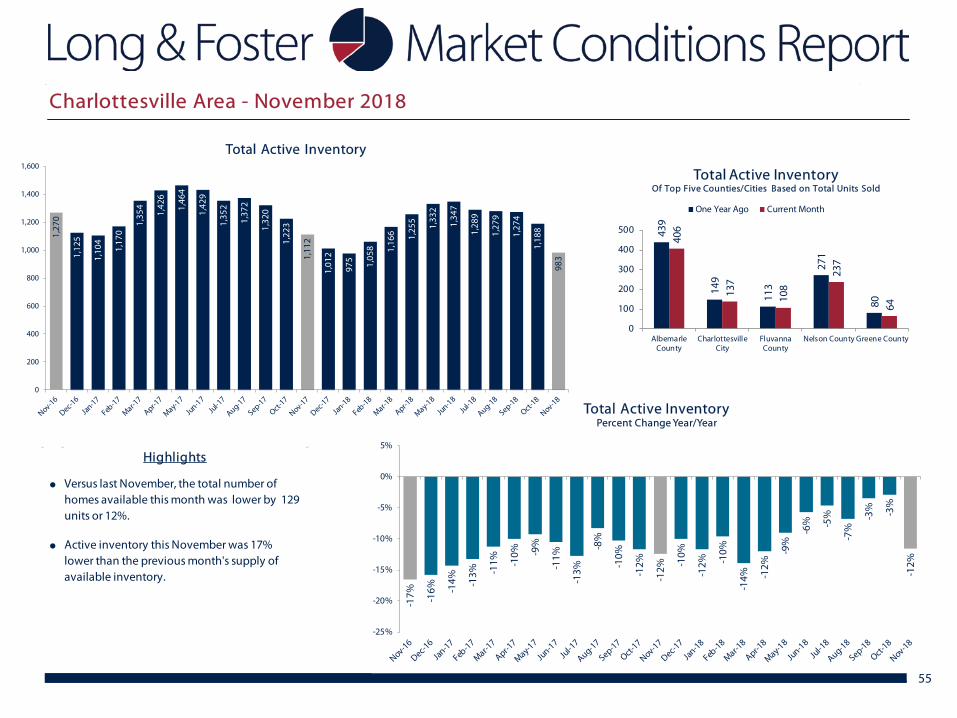
-17% - 1
6% -14% -1
3% -11% -1
0% -9%
-11%
-13%
-8%
-10%
-12%
-12%
-10%
-12% -1
0%
-14% -1
2%
-9%
-6% -5
%
-7%
-3% -3%
-12%
-25%
-20%
-15%
-10%
-5%
0%
5%
Total Active InventoryPercent Change Year/Year
55
1,27
0
1,12
5
1,10
4
1,17
0
1,35
4
1,42
6
1,46
4
1,42
9
1,35
2
1,37
2
1,32
0
1,22
3
1,11
2
1,01
2
975 1,05
8 1,16
6 1,25
5
1,33
2
1,34
7
1,28
9
1,27
9
1,27
4
1,18
8
983
0
200
400
600
800
1,000
1,200
1,400
1,600
Total Active Inventory
439
149
113
271
80
406
137
108
237
64
0
100
200
300
400
500
AlbemarleCounty
CharlottesvilleCity
FluvannaCounty
Nelson County Greene County
Total Active InventoryOf Top Five Counties/Cities Based on Total Units Sold
One Year Ago Current Month
●
●
Highlights
Active inventory this November was 17% lower than the previous month's supply of available inventory.
Versus last November, the total number of homes available this month was lower by 129 units or 12%.
Charlottesville Area - November 2018
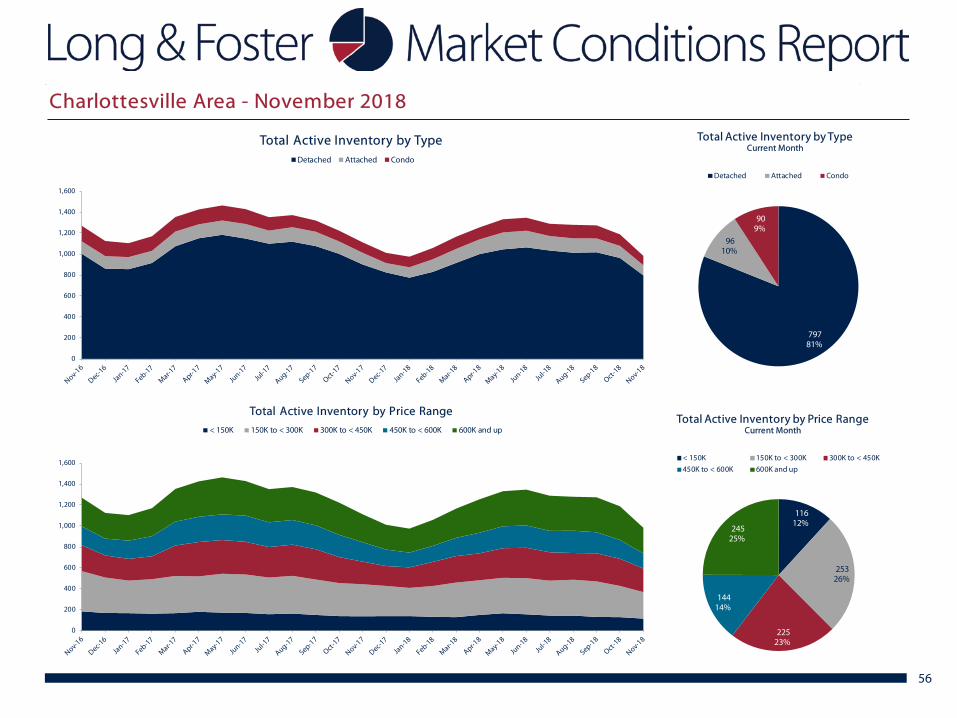
56
0
200
400
600
800
1,000
1,200
1,400
1,600
Total Active Inventory by TypeDetached Attached Condo
797 81%
96 10%
90 9%
Total Active Inventory by TypeCurrent Month
Detached Attached Condo
116 12%
253 26%
225 23%
144 14%
245 25%
Total Active Inventory by Price RangeCurrent Month
< 150K 150K to < 300K 300K to < 450K
450K to < 600K 600K and up
0
200
400
600
800
1,000
1,200
1,400
1,600
Total Active Inventory by Price Range
< 150K 150K to < 300K 300K to < 450K 450K to < 600K 600K and up
Charlottesville Area - November 2018
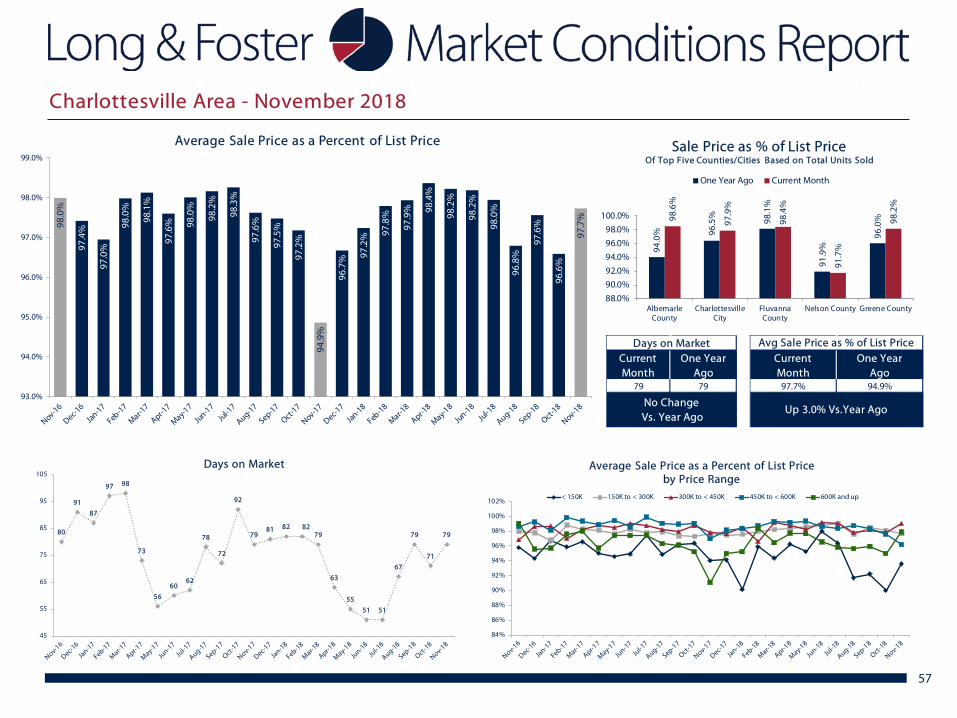
57
98.0
%
97.4
%
97.0
%
98.0
%
98.1
%
97.6
% 98.0
%
98.2
%
98.3
%
97.6
%
97.5
%
97.2
%
94.9
%
96.7
% 97.2
% 97.8
%
97.9
% 98.4
%
98.2
%
98.2
%
98.0
%
96.8
%
97.6
%
96.6
%
97.7
%
93.0%
94.0%
95.0%
96.0%
97.0%
98.0%
99.0%
Average Sale Price as a Percent of List Price
Days on MarketCurrentMonth
One YearAgo
79 79
No Change Vs. Year Ago
Avg Sale Price as % of List PriceCurrentMonth
One YearAgo
97.7% 94.9%
Up 3.0% Vs.Year Ago
94.0
% 96.5
%
98.1
%
91.9
%
96.0
%98.6
%
97.9
%
98.4
%
91.7
%
98.2
%
88.0%
90.0%
92.0%
94.0%
96.0%
98.0%
100.0%
AlbemarleCounty
CharlottesvilleCity
FluvannaCounty
Nelson County Greene County
Sale Price as % of List PriceOf Top Five Counties/Cities Based on Total Units Sold
One Year Ago Current Month
80
91
87
97 98
73
56
6062
78
72
92
7981 82 82
79
63
55
51 51
67
79
71
79
45
55
65
75
85
95
105Days on Market
84%
86%
88%
90%
92%
94%
96%
98%
100%
102%
Average Sale Price as a Percent of List Price by Price Range
< 150K 150K to < 300K 300K to < 450K 450K to < 600K 600K and up
Charlottesville Area - November 2018
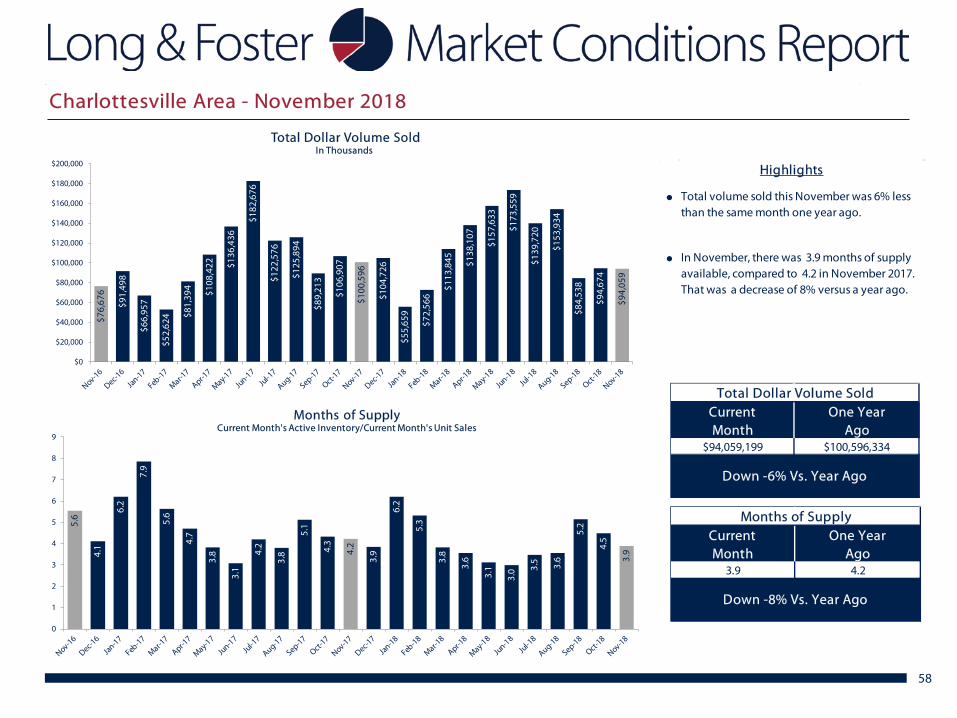
58
5.6
4.1
6.2
7.9
5.6
4.7
3.8
3.1
4.2
3.8
5.1
4.3
4.2
3.9
6.2
5.3
3.8
3.6
3.1
3.0 3.
5 3.6
5.2
4.5
3.9
0
1
2
3
4
5
6
7
8
9
Months of SupplyCurrent Month's Active Inventory/Current Month's Unit Sales
$76,
676
$91,
498
$66,
957
$52,
624 $8
1,39
4
$108
,422 $1
36,4
36
$182
,676
$122
,576
$125
,894
$89,
213
$106
,907
$100
,596
$104
,726
$55,
659
$72,
566
$113
,845 $1
38,1
07
$157
,633
$173
,559
$139
,720
$153
,934
$84,
538
$94,
674
$94,
059
$0
$20,000
$40,000
$60,000
$80,000
$100,000
$120,000
$140,000
$160,000
$180,000
$200,000
Total Dollar Volume SoldIn Thousands
Total Dollar Volume SoldCurrentMonth
One YearAgo
$94,059,199 $100,596,334
Down -6% Vs. Year Ago
Months of SupplyCurrentMonth
One YearAgo
3.9 4.2
Down -8% Vs. Year Ago
●
●
Highlights
Total volume sold this November was 6% less than the same month one year ago.
In November, there was 3.9 months of supply available, compared to 4.2 in November 2017. That was a decrease of 8% versus a year ago.
Charlottesville Area - November 2018
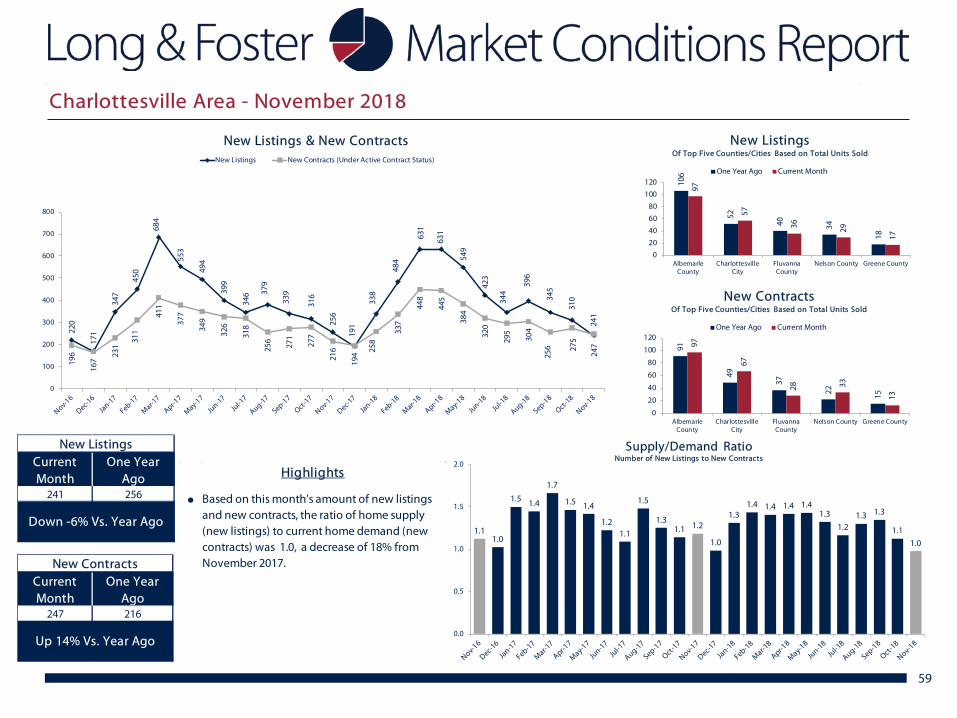
59
220
171
347
450
684
553
494
399
346 37
9
339
316
256
191
338
484
631
631
549
423
344
396
345
310
241
196
167
231
311
411
377
349
326
318
256
271
277
216
194 25
8
337
448
445
384
320
295
304
256 27
5
247
0
100
200
300
400
500
600
700
800
New Listings & New ContractsNew Listings New Contracts (Under Active Contract Status)
New ListingsCurrent Month
One Year Ago
241 256
Down -6% Vs. Year Ago
New ContractsCurrent Month
One Year Ago
247 216
Up 14% Vs. Year Ago
1.11.0
1.5 1.4
1.7
1.5 1.4
1.21.1
1.5
1.31.1 1.2
1.0
1.31.4 1.4 1.4 1.4
1.3
1.21.3 1.3
1.1
1.0
0.0
0.5
1.0
1.5
2.0
Supply/Demand RatioNumber of New Listings to New Contracts
106
52
40 34
18
97
57
36 29
17
0
20
40
60
80
100
120
AlbemarleCounty
CharlottesvilleCity
FluvannaCounty
Nelson County Greene County
New ListingsOf Top Five Counties/Cities Based on Total Units Sold
One Year Ago Current Month
91
49
37
22 15
97
67
28 33
13
0
20
40
60
80
100
120
AlbemarleCounty
CharlottesvilleCity
FluvannaCounty
Nelson County Greene County
New ContractsOf Top Five Counties/Cities Based on Total Units Sold
One Year Ago Current Month
●
Highlights
Based on this month's amount of new listings and new contracts, the ratio of home supply (new listings) to current home demand (new contracts) was 1.0, a decrease of 18% from November 2017.
Charlottesville Area - November 2018
60
November 2018
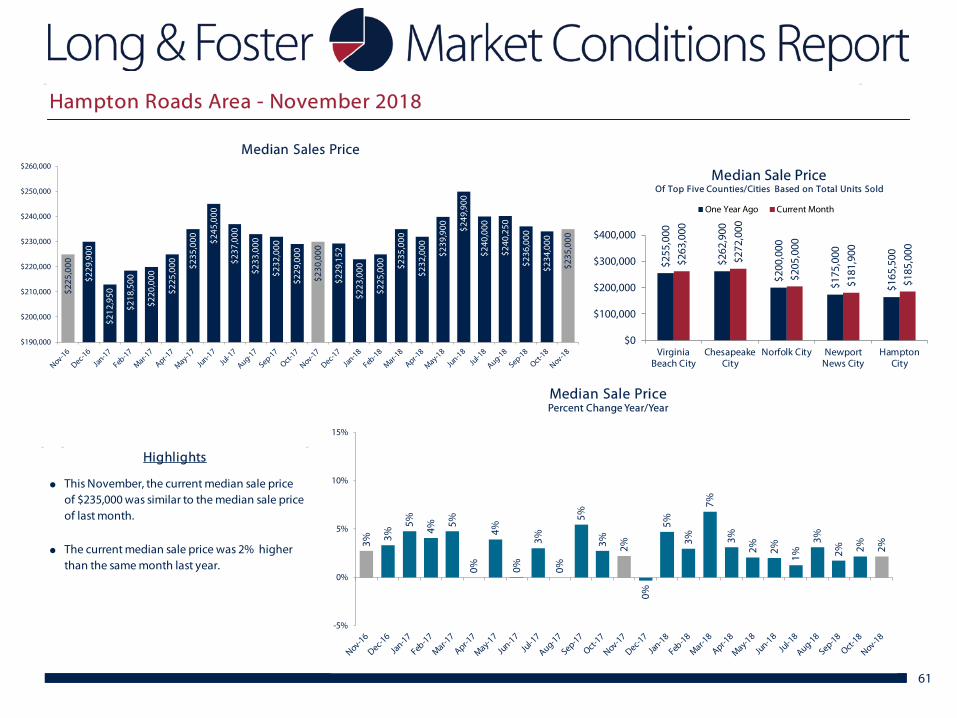
3% 3%
5%
4%
5%
0%
4%
0%
3%
0%
5%
3% 2%
0%
5%
3%
7%
3%
2% 2%
1%
3%
2% 2% 2%
-5%
0%
5%
10%
15%
Median Sale PricePercent Change Year/Year
61
$225
,000
$229
,900
$212
,950
$218
,500
$220
,000
$225
,000 $2
35,0
00 $245
,000
$237
,000
$233
,000
$232
,000
$229
,000
$230
,000
$229
,152
$223
,000
$225
,000 $2
35,0
00
$232
,000
$239
,900 $2
49,9
00
$240
,000
$240
,250
$236
,000
$234
,000
$235
,000
$190,000
$200,000
$210,000
$220,000
$230,000
$240,000
$250,000
$260,000
Median Sales Price
$255
,000
$262
,900
$200
,000
$175
,000
$165
,500$2
63,0
00
$272
,000
$205
,000
$181
,900
$185
,000
$0
$100,000
$200,000
$300,000
$400,000
VirginiaBeach City
ChesapeakeCity
Norfolk City NewportNews City
HamptonCity
Median Sale PriceOf Top Five Counties/Cities Based on Total Units Sold
One Year Ago Current Month
●
●
Highlights
The current median sale price was 2% higher than the same month last year.
This November, the current median sale price of $235,000 was similar to the median sale price of last month.
Hampton Roads Area - November 2018
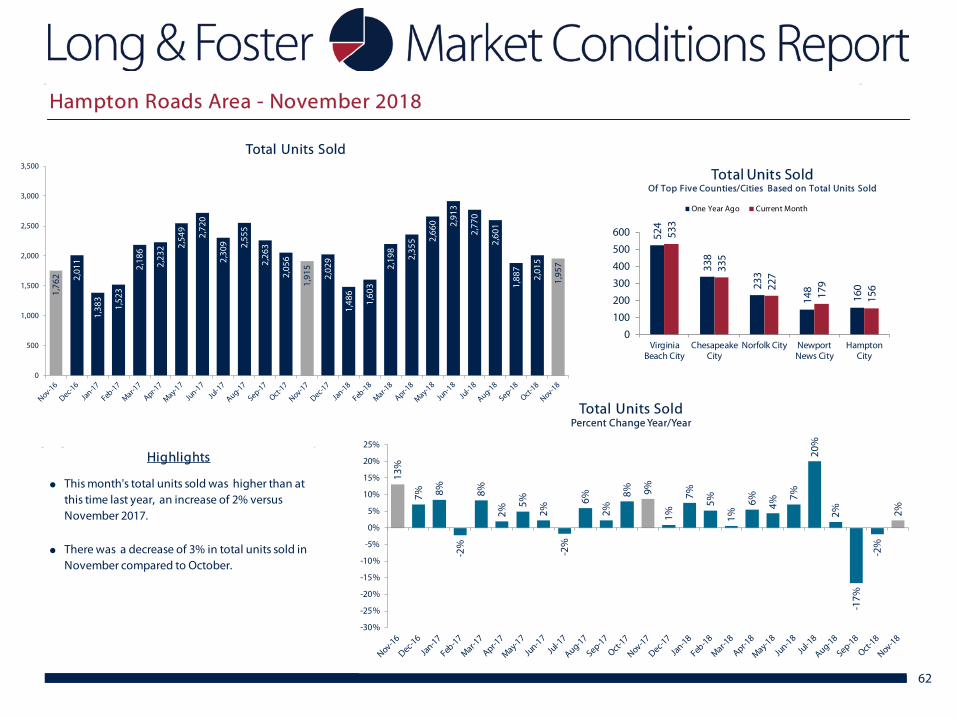
13%
7% 8%
-2%
8%
2%
5%
2%
-2%
6%
2%
8% 9%
1%
7%
5%
1%
6% 4%
7%
20%
2%
-17%
-2%
2%
-30%
-25%
-20%
-15%
-10%
-5%
0%
5%
10%
15%
20%
25%
Total Units SoldPercent Change Year/Year
62
1,76
2 2,01
1
1,38
3
1,52
3
2,18
6
2,23
2 2,54
9
2,72
0
2,30
9 2,55
5
2,26
3
2,05
6
1,91
5
2,02
9
1,48
6
1,60
3
2,19
8
2,35
5 2,66
0 2,91
3
2,77
0
2,60
1
1,88
7
2,01
5
1,95
7
0
500
1,000
1,500
2,000
2,500
3,000
3,500
Total Units Sold
524
338
233
148
160
533
335
227
179
156
0
100
200
300
400
500
600
VirginiaBeach City
ChesapeakeCity
Norfolk City NewportNews City
HamptonCity
Total Units SoldOf Top Five Counties/Cities Based on Total Units Sold
One Year Ago Current Month
●
●
Highlights
There was a decrease of 3% in total units sold in November compared to October.
This month's total units sold was higher than at this time last year, an increase of 2% versus November 2017.
Hampton Roads Area - November 2018
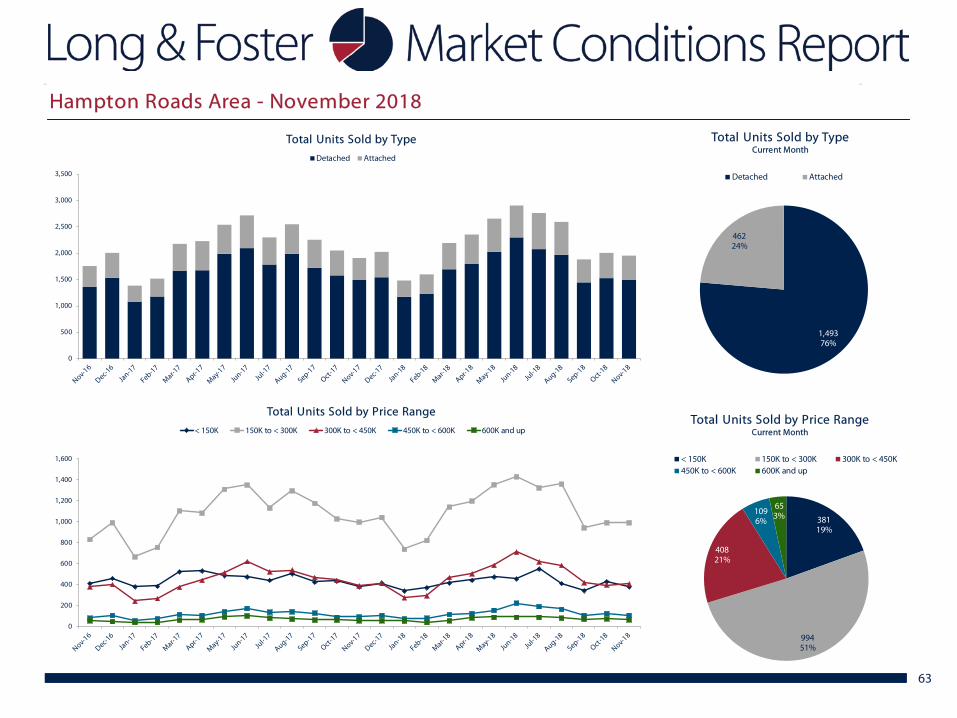
63
0
500
1,000
1,500
2,000
2,500
3,000
3,500
Total Units Sold by Type
Detached Attached
1,49376%
46224%
Total Units Sold by TypeCurrent Month
Detached Attached
38119%
99451%
40821%
1096%
653%
Total Units Sold by Price RangeCurrent Month
< 150K 150K to < 300K 300K to < 450K450K to < 600K 600K and up
0
200
400
600
800
1,000
1,200
1,400
1,600
Total Units Sold by Price Range
< 150K 150K to < 300K 300K to < 450K 450K to < 600K 600K and up
Hampton Roads Area - November 2018
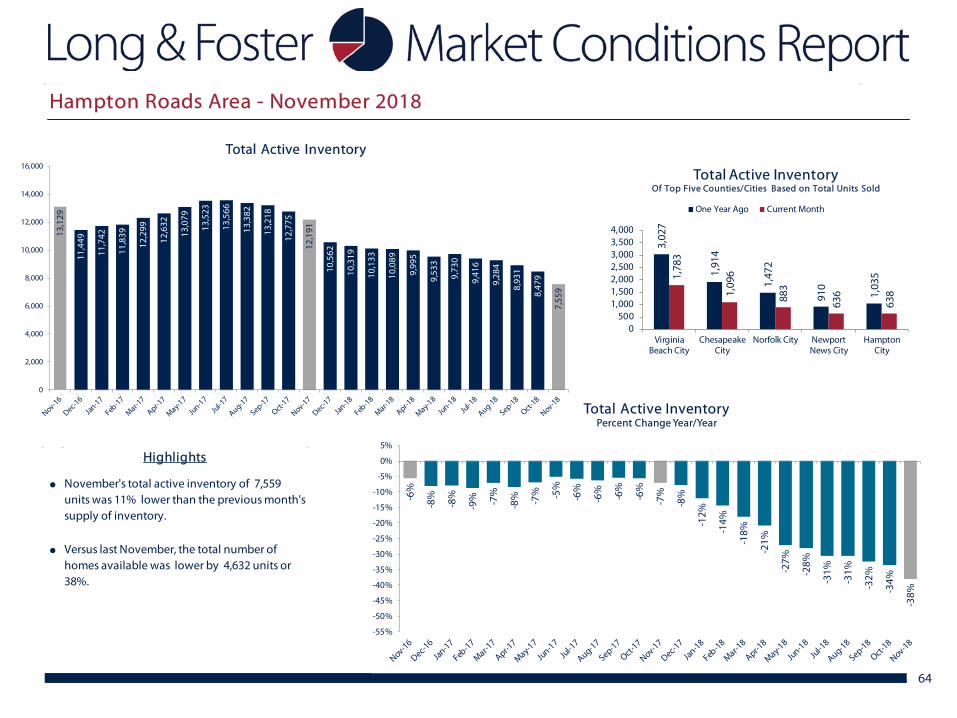
-6%
-8%
-8%
-9% -7
%
-8% -7% -5
%
-6%
-6%
-6%
-6%
-7%
-8%
-12%
-14%
-18%
-21%
-27%
-28%
-31%
-31%
-32%
-34%
-38%
-55%
-50%
-45%
-40%
-35%
-30%
-25%
-20%
-15%
-10%
-5%
0%
5%
Total Active InventoryPercent Change Year/Year
64
13,1
29
11,4
49
11,7
42
11,8
39
12,2
99
12,6
32
13,0
79
13,5
23
13,5
66
13,3
82
13,2
18
12,7
75
12,1
91
10,5
62
10,3
19
10,1
33
10,0
89
9,99
5
9,53
3
9,73
0
9,41
6
9,28
4
8,93
1
8,47
9
7,55
9
0
2,000
4,000
6,000
8,000
10,000
12,000
14,000
16,000
Total Active Inventory
3,02
7
1,91
4
1,47
2
910
1,03
51,78
3
1,09
6
883
636
638
0500
1,0001,5002,0002,5003,0003,5004,000
VirginiaBeach City
ChesapeakeCity
Norfolk City NewportNews City
HamptonCity
Total Active InventoryOf Top Five Counties/Cities Based on Total Units Sold
One Year Ago Current Month
●
●
Highlights
Versus last November, the total number of homes available was lower by 4,632 units or 38%.
November's total active inventory of 7,559 units was 11% lower than the previous month's supply of inventory.
Hampton Roads Area - November 2018
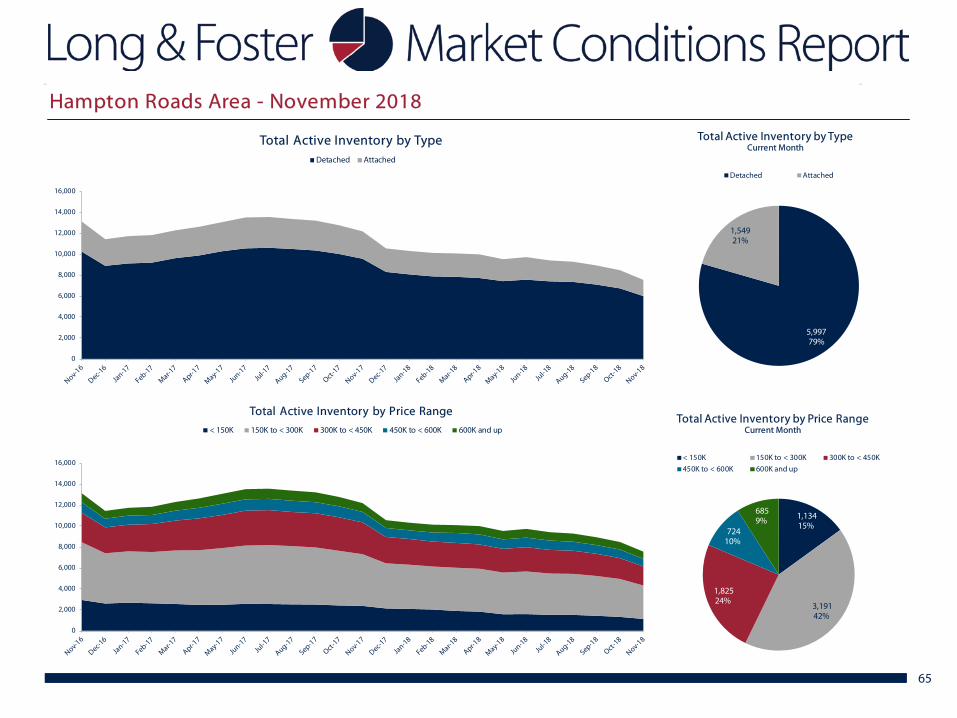
65
0
2,000
4,000
6,000
8,000
10,000
12,000
14,000
16,000
Total Active Inventory by TypeDetached Attached
5,99779%
1,54921%
Total Active Inventory by TypeCurrent Month
Detached Attached
1,134 15%
3,191 42%
1,825 24%
724 10%
685 9%
Total Active Inventory by Price RangeCurrent Month
< 150K 150K to < 300K 300K to < 450K
450K to < 600K 600K and up
0
2,000
4,000
6,000
8,000
10,000
12,000
14,000
16,000
Total Active Inventory by Price Range
< 150K 150K to < 300K 300K to < 450K 450K to < 600K 600K and up
Hampton Roads Area - November 2018
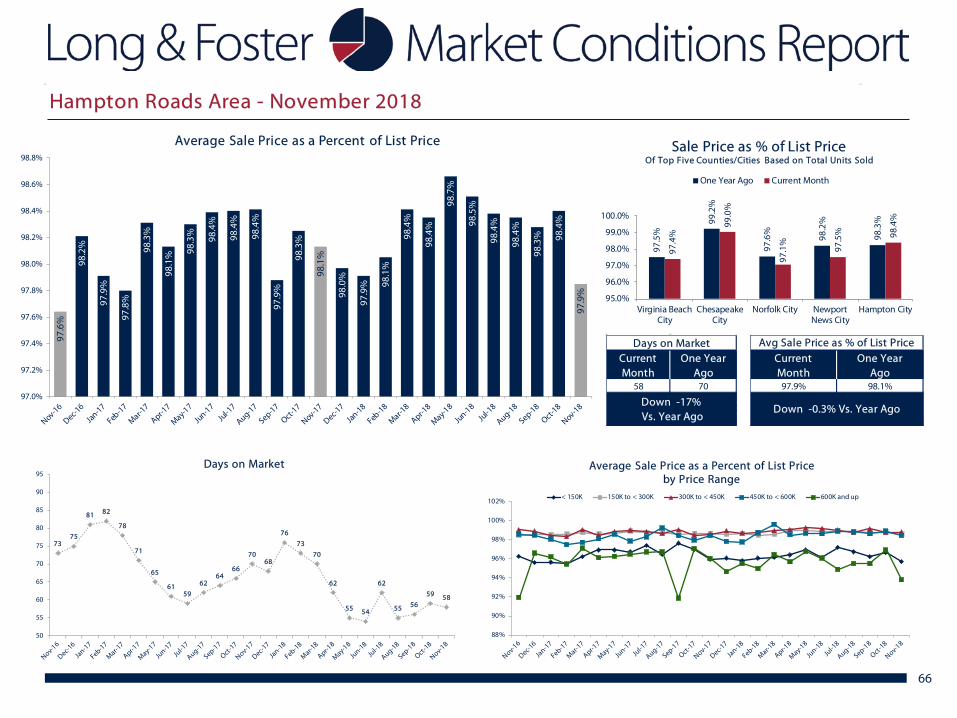
66
97.6
%
98.2
%
97.9
%
97.8
%
98.3
%
98.1
% 98.3
%
98.4
%
98.4
%
98.4
%
97.9
%
98.3
%
98.1
%
98.0
%
97.9
% 98.1
%
98.4
%
98.4
%
98.7
%
98.5
%
98.4
%
98.4
%
98.3
% 98.4
%
97.9
%
97.0%
97.2%
97.4%
97.6%
97.8%
98.0%
98.2%
98.4%
98.6%
98.8%
Average Sale Price as a Percent of List Price
97.5
%
99.2
%
97.6
%
98.2
%
98.3
%
97.4
%
99.0
%
97.1
%
97.5
% 98.4
%
95.0%
96.0%
97.0%
98.0%
99.0%
100.0%
Virginia BeachCity
ChesapeakeCity
Norfolk City NewportNews City
Hampton City
Sale Price as % of List PriceOf Top Five Counties/Cities Based on Total Units Sold
One Year Ago Current Month
Days on MarketCurrentMonth
One YearAgo
58 70
Down -17% Vs. Year Ago
Avg Sale Price as % of List PriceCurrentMonth
One YearAgo
97.9% 98.1%
Down -0.3% Vs. Year Ago
7375
81 82
78
71
65
6159
6264
66
7068
76
73
70
62
55 54
62
55 56
59 58
50
55
60
65
70
75
80
85
90
95Days on Market
88%
90%
92%
94%
96%
98%
100%
102%
Average Sale Price as a Percent of List Price by Price Range
< 150K 150K to < 300K 300K to < 450K 450K to < 600K 600K and up
Hampton Roads Area - November 2018
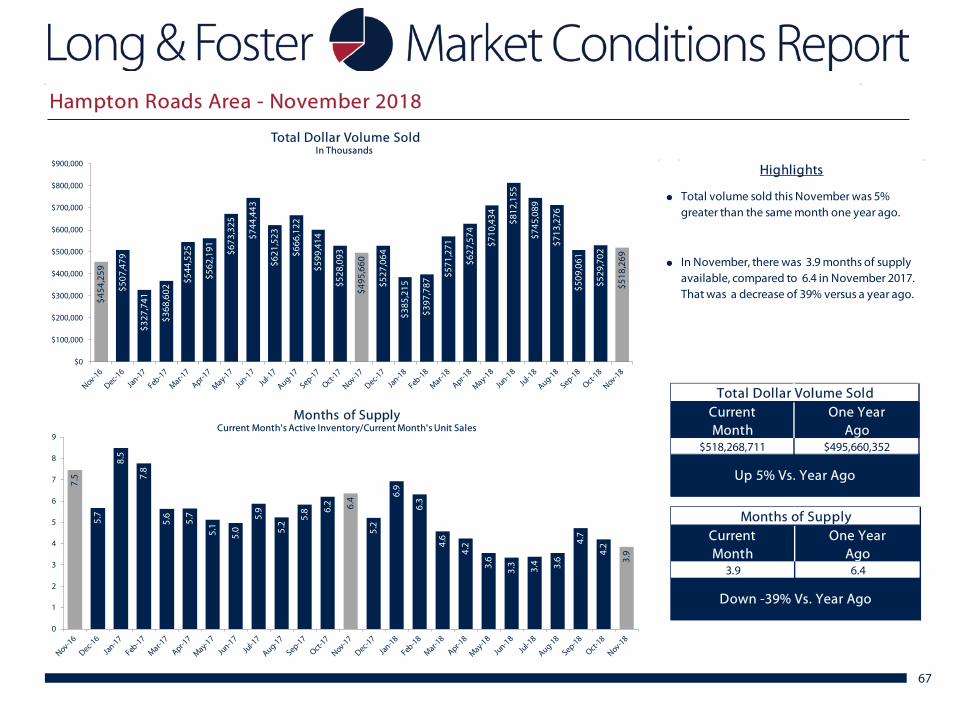
67
$454
,259
$507
,479
$327
,741
$368
,602
$544
,525
$562
,191 $6
73,3
25
$744
,443
$621
,523
$666
,122
$599
,414
$528
,093
$495
,660
$527
,064
$385
,215
$397
,787
$571
,271
$627
,574
$710
,434 $8
12,1
55
$745
,089
$713
,276
$509
,061
$529
,702
$518
,269
$0
$100,000
$200,000
$300,000
$400,000
$500,000
$600,000
$700,000
$800,000
$900,000
Total Dollar Volume SoldIn Thousands
Total Dollar Volume SoldCurrentMonth
One YearAgo
$518,268,711 $495,660,352
Up 5% Vs. Year Ago
Months of SupplyCurrentMonth
One YearAgo
3.9 6.4
Down -39% Vs. Year Ago
7.5
5.7
8.5
7.8
5.6
5.7
5.1
5.0
5.9
5.2
5.8 6.
2 6.4
5.2
6.9
6.3
4.6
4.2
3.6
3.3
3.4 3.6
4.7
4.2
3.9
0
1
2
3
4
5
6
7
8
9
Months of SupplyCurrent Month's Active Inventory/Current Month's Unit Sales
●
●
Highlights
Total volume sold this November was 5% greater than the same month one year ago.
In November, there was 3.9 months of supply available, compared to 6.4 in November 2017. That was a decrease of 39% versus a year ago.
Hampton Roads Area - November 2018
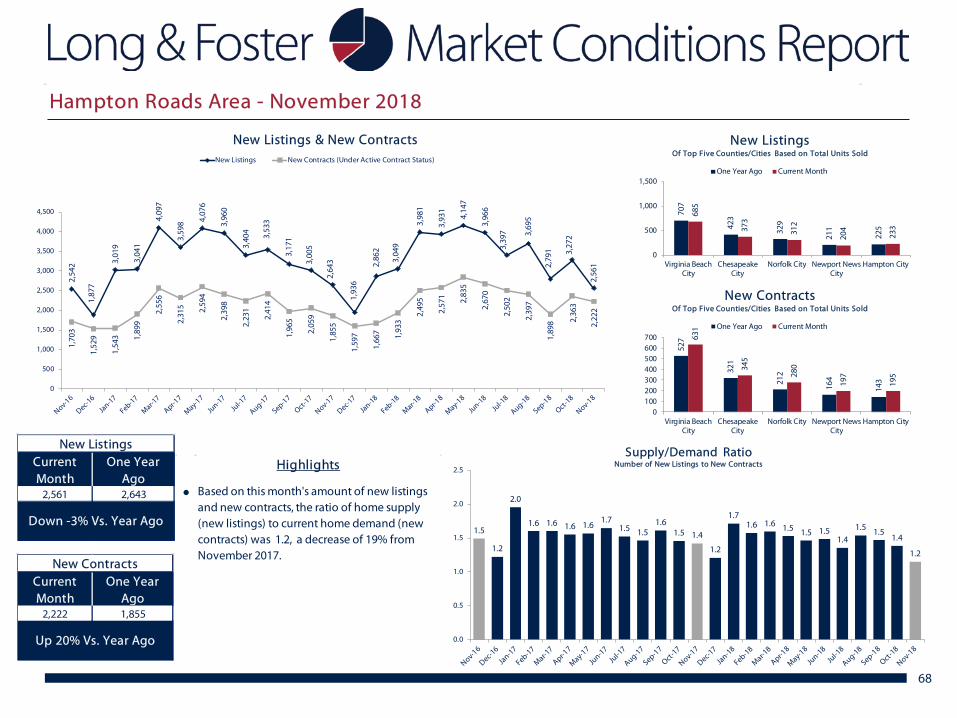
68
2,54
2
1,87
7
3,01
9
3,04
1
4,09
7
3,59
8 4,07
6
3,96
0
3,40
4
3,53
3
3,17
1
3,00
5
2,64
3
1,93
6
2,86
2
3,04
9
3,98
1
3,93
1
4,14
7
3,96
6
3,39
7 3,69
5
2,79
1 3,27
2
2,56
1
1,70
3
1,52
9
1,54
3 1,89
9
2,55
6
2,31
5 2,59
4
2,39
8
2,23
1
2,41
4
1,96
5
2,05
9
1,85
5
1,59
7
1,66
7 1,93
3
2,49
5
2,57
1 2,83
5
2,67
0
2,50
2
2,39
7
1,89
8 2,36
3
2,22
2
0
500
1,000
1,500
2,000
2,500
3,000
3,500
4,000
4,500
New Listings & New ContractsNew Listings New Contracts (Under Active Contract Status)
New ListingsCurrent Month
One Year Ago
2,561 2,643
Down -3% Vs. Year Ago
New ContractsCurrent Month
One Year Ago
2,222 1,855
Up 20% Vs. Year Ago
707
423
329
211
225
685
373
312
204
233
0
500
1,000
1,500
Virginia BeachCity
ChesapeakeCity
Norfolk City Newport NewsCity
Hampton City
New ListingsOf Top Five Counties/Cities Based on Total Units Sold
One Year Ago Current Month
527
321
212
164
143
631
345
280
197
195
0100200300400500600700
Virginia BeachCity
ChesapeakeCity
Norfolk City Newport NewsCity
Hampton City
New ContractsOf Top Five Counties/Cities Based on Total Units Sold
One Year Ago Current Month
1.5
1.2
2.0
1.6 1.6 1.6 1.61.7
1.5 1.51.6
1.5 1.4
1.2
1.71.6 1.6 1.5 1.5 1.5
1.41.5 1.5
1.4
1.2
0.0
0.5
1.0
1.5
2.0
2.5
Supply/Demand RatioNumber of New Listings to New Contracts
●
Highlights
Based on this month's amount of new listings and new contracts, the ratio of home supply (new listings) to current home demand (new contracts) was 1.2, a decrease of 19% from November 2017.
Hampton Roads Area - November 2018
69
November 2018
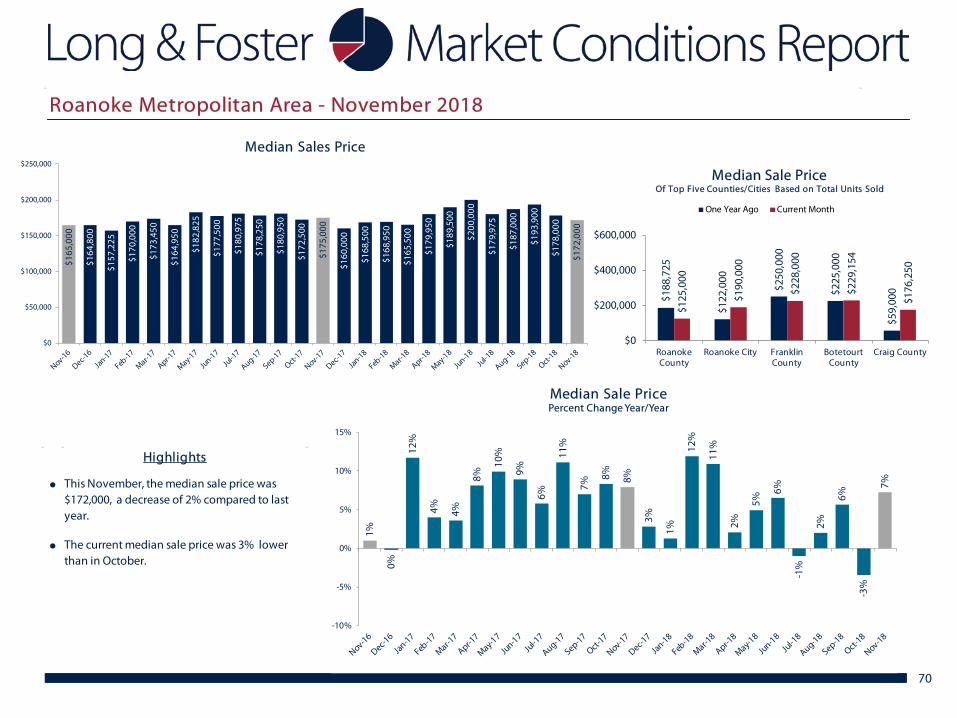
Roanoke Metropolitan Area - November 2018
1%
0%
12%
4% 4%
8%
10%
9%
6%
11%
7%
8% 8%
3%
1%
12%
11%
2%
5%
6%
-1%
2%
6%
-3%
7%
-10%
-5%
0%
5%
10%
15%
Median Sale PricePercent Change Year/Year
70
$165
,000
$164
,800
$157
,225
$170
,000
$173
,450
$164
,950
$182
,825
$177
,500
$180
,975
$178
,250
$180
,950
$172
,500
$175
,000
$160
,000
$168
,500
$168
,950
$165
,500
$179
,950
$189
,500
$200
,000
$179
,975
$187
,000
$193
,900
$178
,000
$172
,000
$0
$50,000
$100,000
$150,000
$200,000
$250,000
Median Sales Price
$188
,725
$122
,000
$250
,000
$225
,000
$59,
000
$125
,000
$190
,000
$228
,000
$229
,154
$176
,250
$0
$200,000
$400,000
$600,000
RoanokeCounty
Roanoke City FranklinCounty
BotetourtCounty
Craig County
Median Sale PriceOf Top Five Counties/Cities Based on Total Units Sold
One Year Ago Current Month
●
●
Highlights
This November, the median sale price was $172,000, a decrease of 2% compared to last year.
The current median sale price was 3% lower than in October.
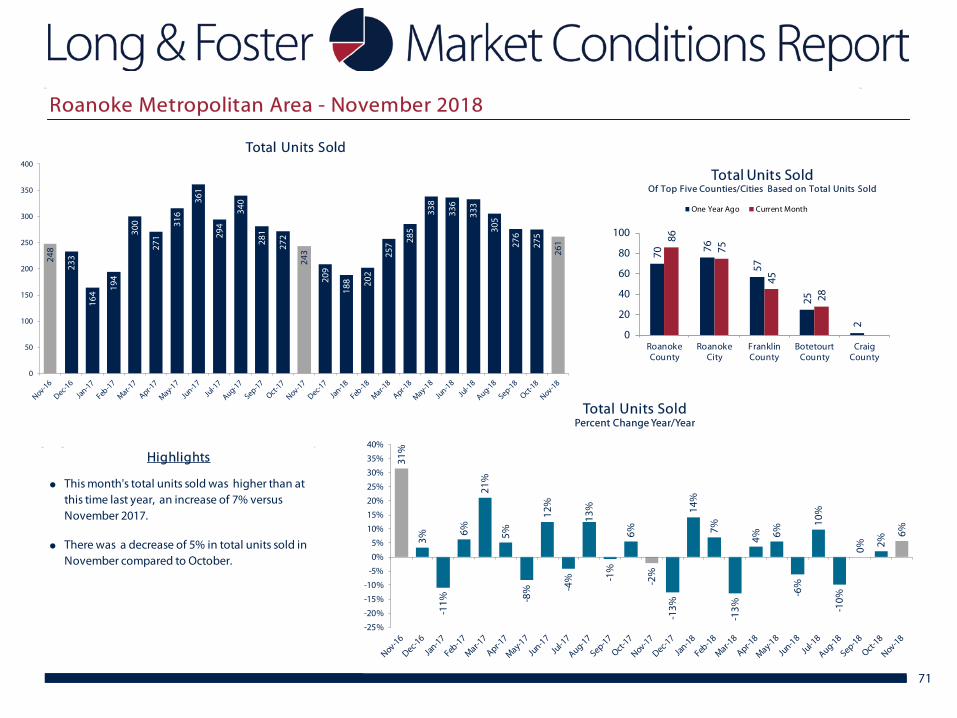
71
31%
3%
-11%
6%
21%
5%
-8%
12%
-4%
13%
-1%
6%
-2%
-13%
14%
7%
-13%
4% 6%
-6%
10%
-10%
0% 2%
6%
-25%
-20%
-15%
-10%
-5%
0%
5%
10%
15%
20%
25%
30%
35%
40%
Total Units SoldPercent Change Year/Year
248
233
164
194
300
271
316
361
294
340
281
272
243
209
188 20
2
257 28
5
338
336
333
305
276
275
261
0
50
100
150
200
250
300
350
400
Total Units Sold
70 76
57
25
2
86
75
45
28
0
20
40
60
80
100
RoanokeCounty
RoanokeCity
FranklinCounty
BotetourtCounty
CraigCounty
Total Units SoldOf Top Five Counties/Cities Based on Total Units Sold
One Year Ago Current Month
●
●
Highlights
This month's total units sold was higher than at this time last year, an increase of 7% versus November 2017.
There was a decrease of 5% in total units sold in November compared to October.
Roanoke Metropolitan Area - November 2018
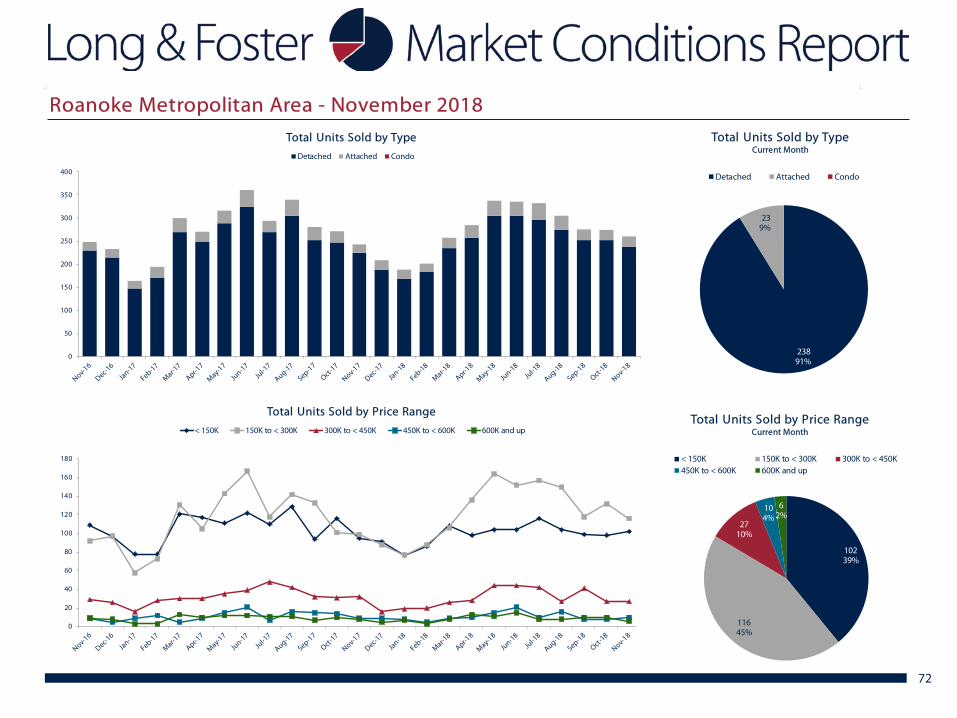
72
Wilmington, DE Area - November 2018
0
50
100
150
200
250
300
350
400
Total Units Sold by Type
Detached Attached Condo
0
20
40
60
80
100
120
140
160
180
Total Units Sold by Price Range
< 150K 150K to < 300K 300K to < 450K 450K to < 600K 600K and up
238 91%
23 9%
Total Units Sold by TypeCurrent Month
Detached Attached Condo
10239%
11645%
2710%
104%
62%
Total Units Sold by Price RangeCurrent Month
< 150K 150K to < 300K 300K to < 450K450K to < 600K 600K and up
Roanoke Metropolitan Area - November 2018
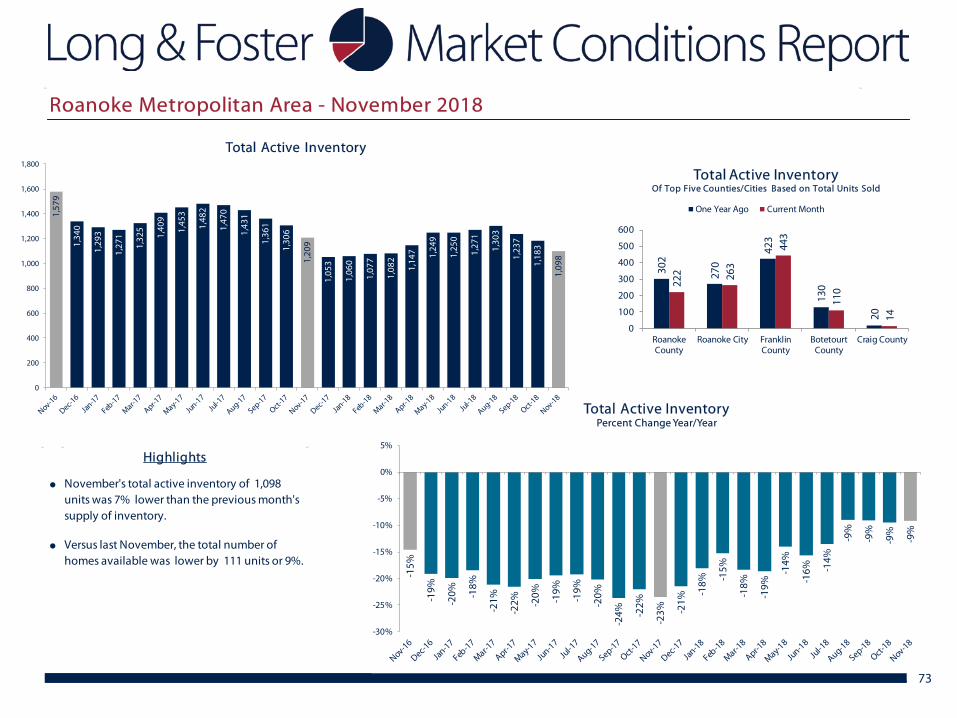
-15%
-19%
-20% -1
8%
-21%
-22% -2
0% -19%
-19%
-20%
-24% -2
2%
-23% -2
1%
-18% -1
5%
-18%
-19%
-14%
-16% -1
4%
-9%
-9%
-9%
-9%
-30%
-25%
-20%
-15%
-10%
-5%
0%
5%
Total Active InventoryPercent Change Year/Year
73
1,57
9
1,34
0
1,29
3
1,27
1
1,32
5
1,40
9
1,45
3
1,48
2
1,47
0
1,43
1
1,36
1
1,30
6
1,20
9
1,05
3
1,06
0
1,07
7
1,08
2
1,14
7 1,24
9
1,25
0
1,27
1
1,30
3
1,23
7
1,18
3
1,09
8
0
200
400
600
800
1,000
1,200
1,400
1,600
1,800
Total Active Inventory
302
270
423
130
20
222 26
3
443
110
14
0
100
200
300
400
500
600
RoanokeCounty
Roanoke City FranklinCounty
BotetourtCounty
Craig County
Total Active InventoryOf Top Five Counties/Cities Based on Total Units Sold
One Year Ago Current Month
●
●
Highlights
November's total active inventory of 1,098 units was 7% lower than the previous month's supply of inventory.
Versus last November, the total number of homes available was lower by 111 units or 9%.
Roanoke Metropolitan Area - November 2018
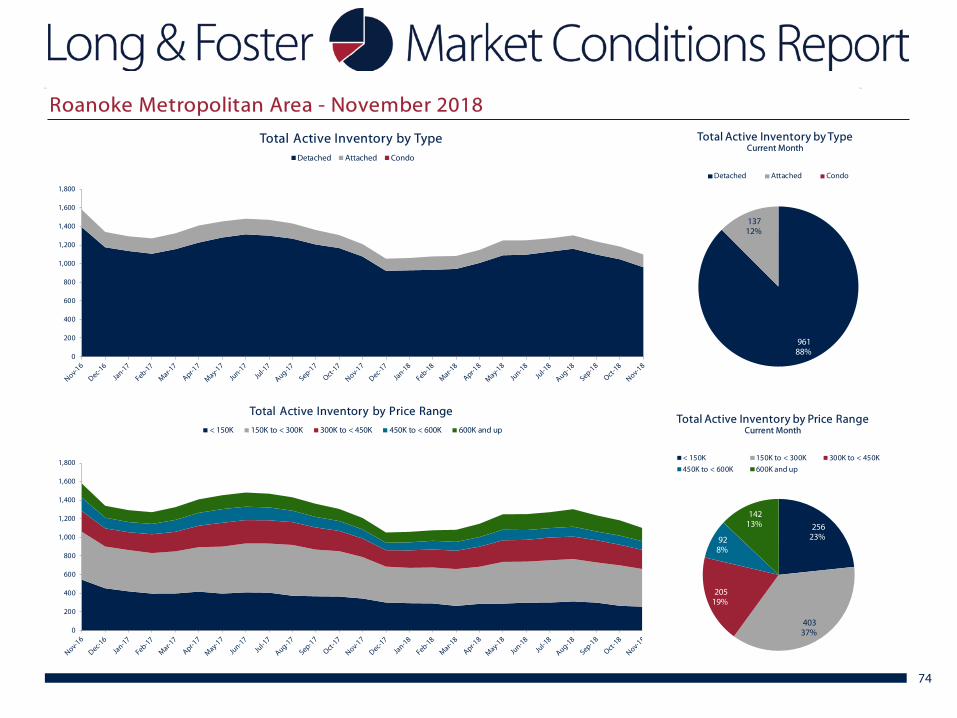
74
0
200
400
600
800
1,000
1,200
1,400
1,600
1,800
Total Active Inventory by TypeDetached Attached Condo
961 88%
137 12%
Total Active Inventory by TypeCurrent Month
Detached Attached Condo
0
200
400
600
800
1,000
1,200
1,400
1,600
1,800
Total Active Inventory by Price Range
< 150K 150K to < 300K 300K to < 450K 450K to < 600K 600K and up
256 23%
403 37%
205 19%
92 8%
142 13%
Total Active Inventory by Price RangeCurrent Month
< 150K 150K to < 300K 300K to < 450K
450K to < 600K 600K and up
Roanoke Metropolitan Area - November 2018
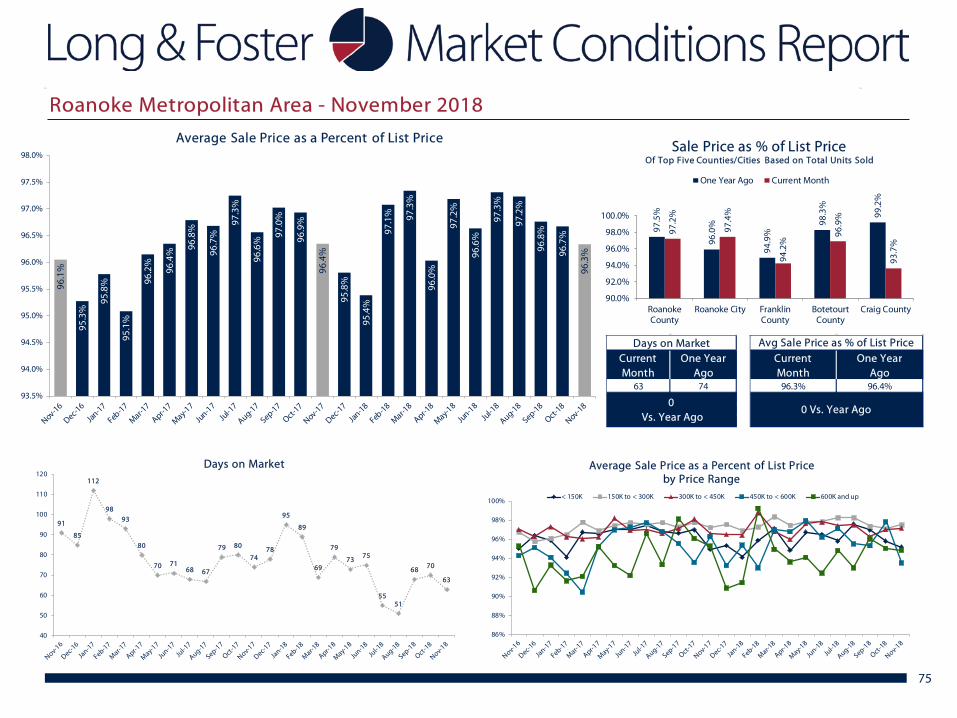
75
96.1
%
95.3
%
95.8
%
95.1
%
96.2
%
96.4
% 96.8
%
96.7
%
97.3
%
96.6
%
97.0
%
96.9
%
96.4
%
95.8
%
95.4
%
97.1
% 97.3
%
96.0
%
97.2
%
96.6
%
97.3
%
97.2
%
96.8
%
96.7
%
96.3
%
93.5%
94.0%
94.5%
95.0%
95.5%
96.0%
96.5%
97.0%
97.5%
98.0%
Average Sale Price as a Percent of List Price
91
85
112
9893
80
70 7168 67
79 80
7478
95
89
69
79
73 75
5551
68 70
63
40
50
60
70
80
90
100
110
120Days on Market
97.5
%
96.0
%
94.9
%
98.3
%
99.2
%
97.2
%
97.4
%
94.2
%
96.9
%
93.7
%
90.0%
92.0%
94.0%
96.0%
98.0%
100.0%
RoanokeCounty
Roanoke City FranklinCounty
BotetourtCounty
Craig County
Sale Price as % of List PriceOf Top Five Counties/Cities Based on Total Units Sold
One Year Ago Current Month
86%
88%
90%
92%
94%
96%
98%
100%
Average Sale Price as a Percent of List Price by Price Range
< 150K 150K to < 300K 300K to < 450K 450K to < 600K 600K and up
Days on MarketCurrentMonth
One YearAgo
63 74
0 Vs. Year Ago
Avg Sale Price as % of List PriceCurrentMonth
One YearAgo
96.3% 96.4%
0 Vs. Year Ago
Roanoke Metropolitan Area - November 2018
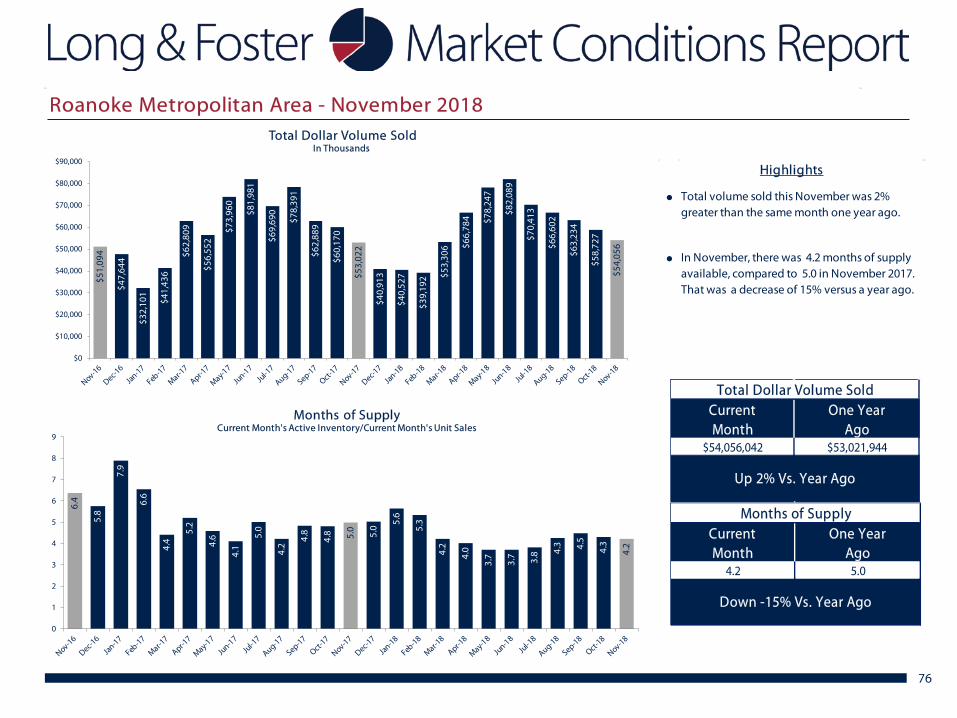
76
$51,
094
$47,
644
$32,
101
$41,
436
$62,
809
$56,
552
$73,
960
$81,
981
$69,
690
$78,
391
$62,
889
$60,
170
$53,
022
$40,
913
$40,
527
$39,
192 $5
3,30
6 $66,
784 $7
8,24
7
$82,
089
$70,
413
$66,
602
$63,
234
$58,
727
$54,
056
$0
$10,000
$20,000
$30,000
$40,000
$50,000
$60,000
$70,000
$80,000
$90,000
Total Dollar Volume SoldIn Thousands
6.4
5.8
7.9
6.6
4.4
5.2
4.6
4.1
5.0
4.2
4.8
4.8 5.0
5.0
5.6
5.3
4.2
4.0
3.7
3.7 3.8 4.
3 4.5
4.3
4.2
0
1
2
3
4
5
6
7
8
9
Months of SupplyCurrent Month's Active Inventory/Current Month's Unit Sales
●
●
Highlights
Total volume sold this November was 2% greater than the same month one year ago.
In November, there was 4.2 months of supply available, compared to 5.0 in November 2017. That was a decrease of 15% versus a year ago.
Total Dollar Volume SoldCurrentMonth
One YearAgo
$54,056,042 $53,021,944
Up 2% Vs. Year Ago
Months of SupplyCurrentMonth
One YearAgo
4.2 5.0
Down -15% Vs. Year Ago
Roanoke Metropolitan Area - November 2018
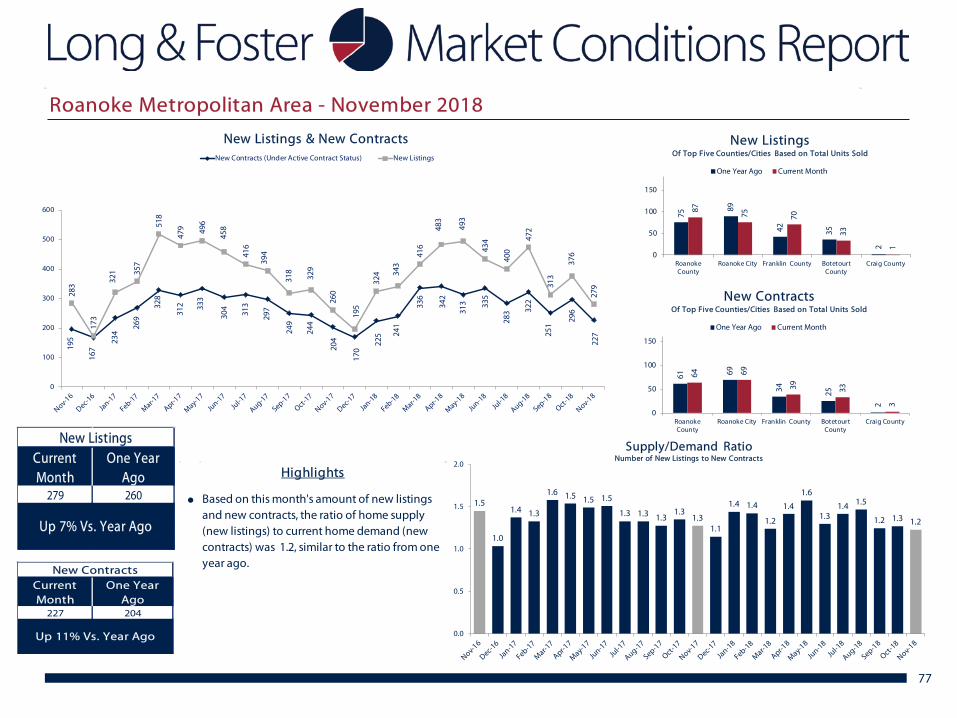
77
195
167
234
269
328
312 33
3
304
313
297
249
244
204
170
225 24
1
336
342
313 33
5
283 32
2
251
296
227
283
173
321 35
7
518
479 49
6
458
416
394
318
329
260
195
324 34
3
416
483
493
434
400
472
313
376
279
0
100
200
300
400
500
600
New Listings & New ContractsNew Contracts (Under Active Contract Status) New Listings
75
89
42 35
2
87
75 70
33
1
0
50
100
150
RoanokeCounty
Roanoke City Franklin County BotetourtCounty
Craig County
New ListingsOf Top Five Counties/Cities Based on Total Units Sold
One Year Ago Current Month
61 69
34 25
2
64 69
39 33
3
0
50
100
150
RoanokeCounty
Roanoke City Franklin County BotetourtCounty
Craig County
New ContractsOf Top Five Counties/Cities Based on Total Units Sold
One Year Ago Current Month
New ListingsCurrent Month
One Year Ago
279 260
Up 7% Vs. Year Ago
New ContractsCurrent Month
One Year Ago
227 204
Up 11% Vs. Year Ago
●
Highlights
Based on this month's amount of new listings and new contracts, the ratio of home supply (new listings) to current home demand (new contracts) was 1.2, similar to the ratio from one year ago.
1.5
1.0
1.4 1.3
1.6 1.5 1.5 1.5
1.3 1.3 1.31.3
1.31.1
1.4 1.4
1.2
1.4
1.6
1.31.4 1.5
1.2 1.3 1.2
0.0
0.5
1.0
1.5
2.0
Supply/Demand RatioNumber of New Listings to New Contracts
Roanoke Metropolitan Area - November 2018
78
November 2018
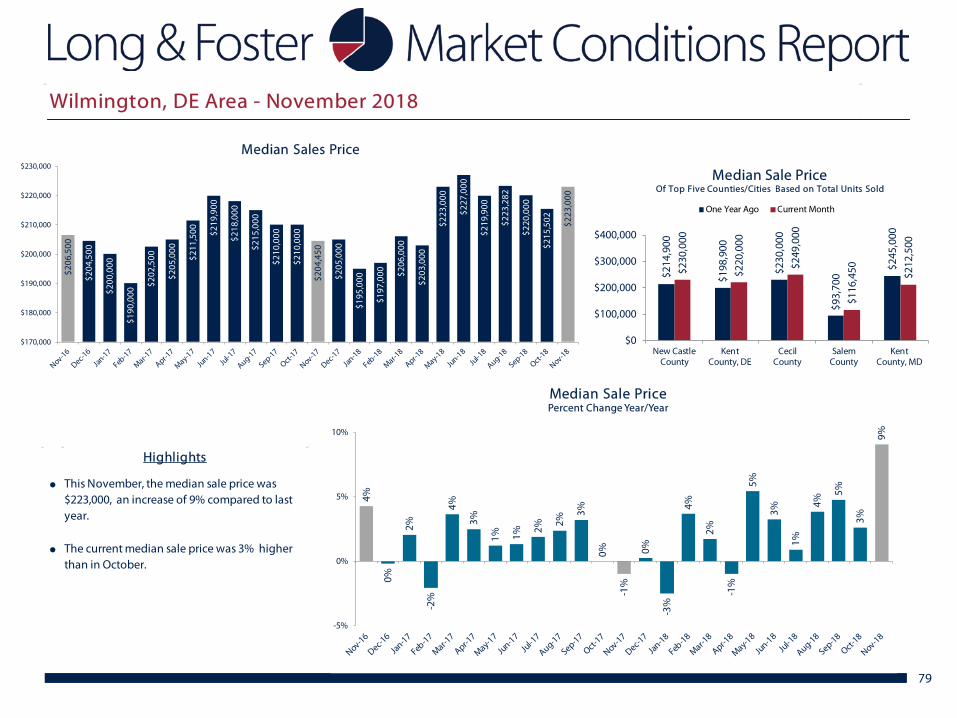
4%
0%
2%
-2%
4%
3%
1% 1%
2%
2%
3%
0%
-1%
0%
-3%
4%
2%
-1%
5%
3%
1%
4%
5%
3%
9%
-5%
0%
5%
10%
Median Sale PricePercent Change Year/Year
79
$206
,500
$204
,500
$200
,000
$190
,000
$202
,500
$205
,000
$211
,500 $2
19,9
00
$218
,000
$215
,000
$210
,000
$210
,000
$204
,450
$205
,000
$195
,000
$197
,000 $2
06,0
00
$203
,000
$223
,000
$227
,000
$219
,900
$223
,282
$220
,000
$215
,502 $2
23,0
00
$170,000
$180,000
$190,000
$200,000
$210,000
$220,000
$230,000
Median Sales Price
$214
,900
$198
,900
$230
,000
$93,
700
$245
,000
$230
,000
$220
,000
$249
,000
$116
,450 $2
12,5
00
$0
$100,000
$200,000
$300,000
$400,000
New CastleCounty
KentCounty, DE
CecilCounty
SalemCounty
KentCounty, MD
Median Sale PriceOf Top Five Counties/Cities Based on Total Units Sold
One Year Ago Current Month
●
●
This November, the median sale price was $223,000, an increase of 9% compared to last year.
The current median sale price was 3% higher than in October.
Highlights
Wilmington, DE Area - November 2018
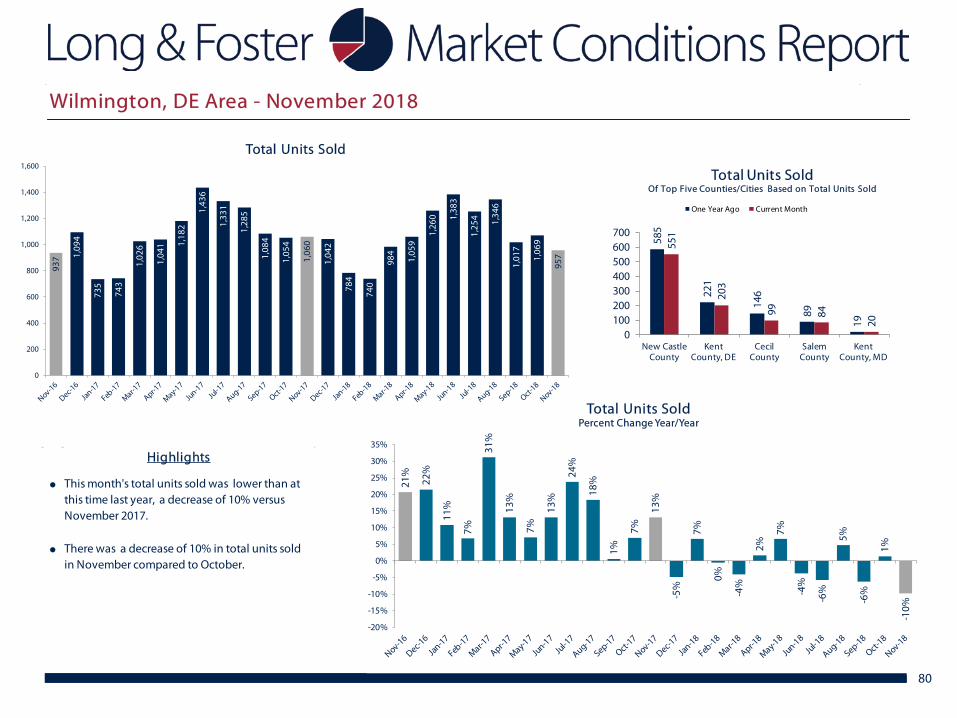
21%
22%
11%
7%
31%
13%
7%
13%
24%
18%
1%
7%
13%
-5%
7%
0%
-4%
2%
7%
-4%
-6%
5%
-6%
1%
-10%
-20%
-15%
-10%
-5%
0%
5%
10%
15%
20%
25%
30%
35%
Total Units SoldPercent Change Year/Year
80
937 1,
094
735
743
1,02
6
1,04
1 1,18
2
1,43
6
1,33
1
1,28
5
1,08
4
1,05
4
1,06
0
1,04
2
784
740
984
1,05
9
1,26
0 1,38
3
1,25
4 1,34
6
1,01
7
1,06
9
957
0
200
400
600
800
1,000
1,200
1,400
1,600
Total Units Sold
585
221
146
89
19
551
203
99 84
20
0100200300400500600700
New CastleCounty
KentCounty, DE
CecilCounty
SalemCounty
KentCounty, MD
Total Units SoldOf Top Five Counties/Cities Based on Total Units Sold
One Year Ago Current Month
●
●
This month's total units sold was lower than at this time last year, a decrease of 10% versus November 2017.
There was a decrease of 10% in total units sold in November compared to October.
Highlights
Wilmington, DE Area - November 2018
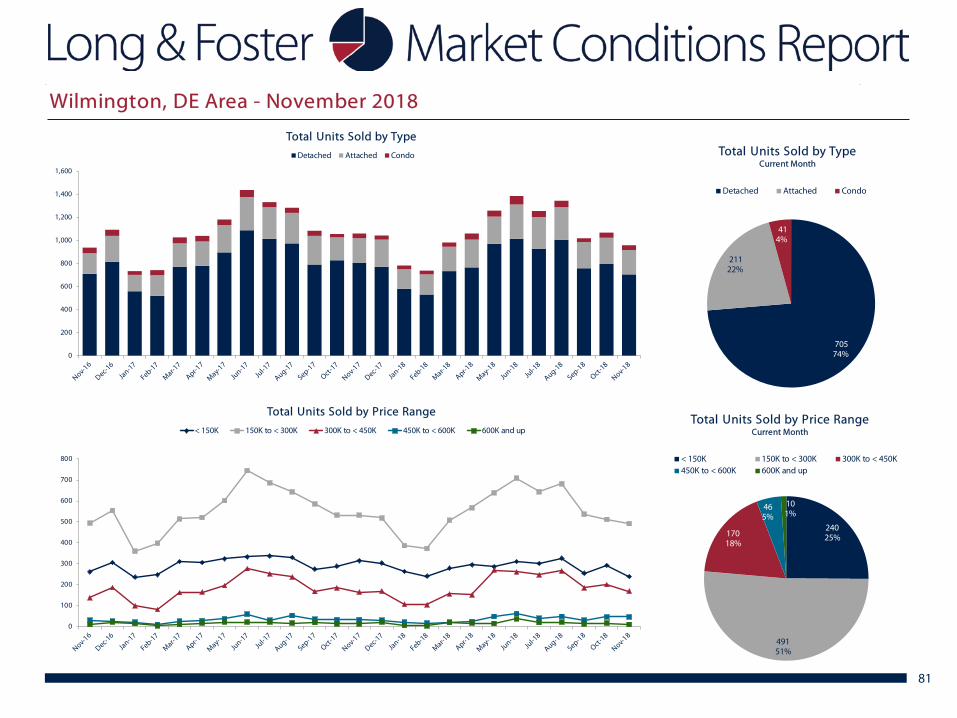
81
0
200
400
600
800
1,000
1,200
1,400
1,600
Total Units Sold by Type
Detached Attached Condo
705 74%
211 22%
41 4%
Total Units Sold by TypeCurrent Month
Detached Attached Condo
24025%
49151%
17018%
465%
101%
Total Units Sold by Price RangeCurrent Month
< 150K 150K to < 300K 300K to < 450K450K to < 600K 600K and up
0
100
200
300
400
500
600
700
800
Total Units Sold by Price Range
< 150K 150K to < 300K 300K to < 450K 450K to < 600K 600K and up
Wilmington, DE Area - November 2018
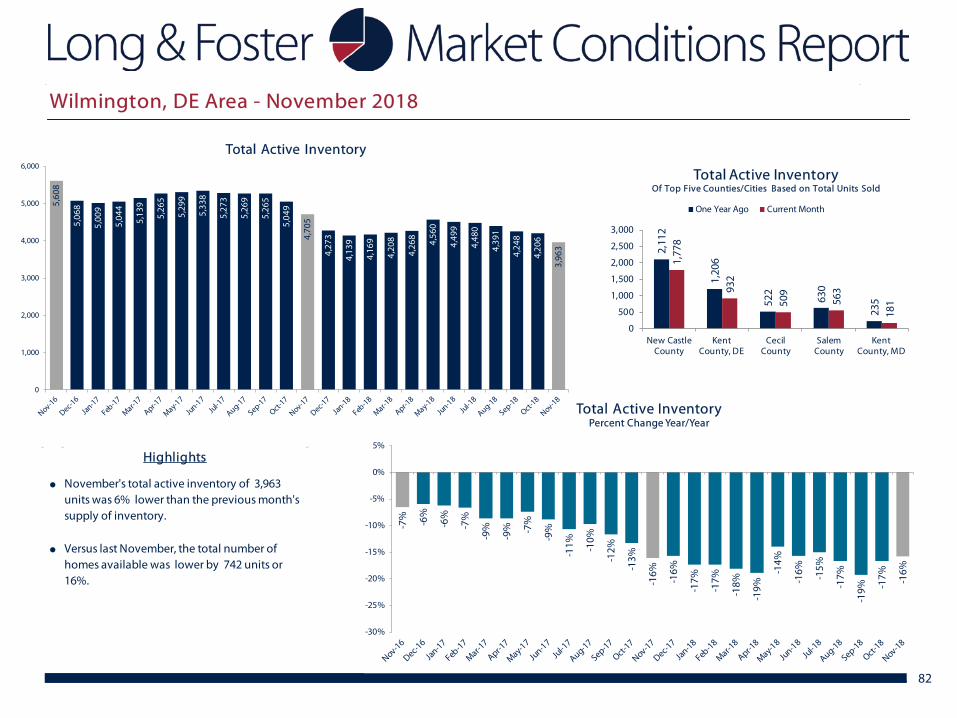
-7% -6%
-6%
-7%
-9%
-9% -7
%
-9%
-11% -1
0%
-12%
-13%
-16%
-16%
-17%
-17%
-18%
-19%
-14%
-16% -15%
-17%
-19% -1
7% -16%
-30%
-25%
-20%
-15%
-10%
-5%
0%
5%
Total Active InventoryPercent Change Year/Year
82
5,60
8
5,06
8
5,00
9
5,04
4
5,13
9
5,26
5
5,29
9
5,33
8
5,27
3
5,26
9
5,26
5
5,04
9
4,70
5
4,27
3
4,13
9
4,16
9
4,20
8
4,26
8
4,56
0
4,49
9
4,48
0
4,39
1
4,24
8
4,20
6
3,96
3
0
1,000
2,000
3,000
4,000
5,000
6,000
Total Active Inventory
2,11
2
1,20
6
522
630
235
1,77
8
932
509
563
181
0
500
1,000
1,500
2,000
2,500
3,000
New CastleCounty
KentCounty, DE
CecilCounty
SalemCounty
KentCounty, MD
Total Active InventoryOf Top Five Counties/Cities Based on Total Units Sold
One Year Ago Current Month
●
●
November's total active inventory of 3,963 units was 6% lower than the previous month's supply of inventory.
Versus last November, the total number of homes available was lower by 742 units or 16%.
Highlights
Wilmington, DE Area - November 2018
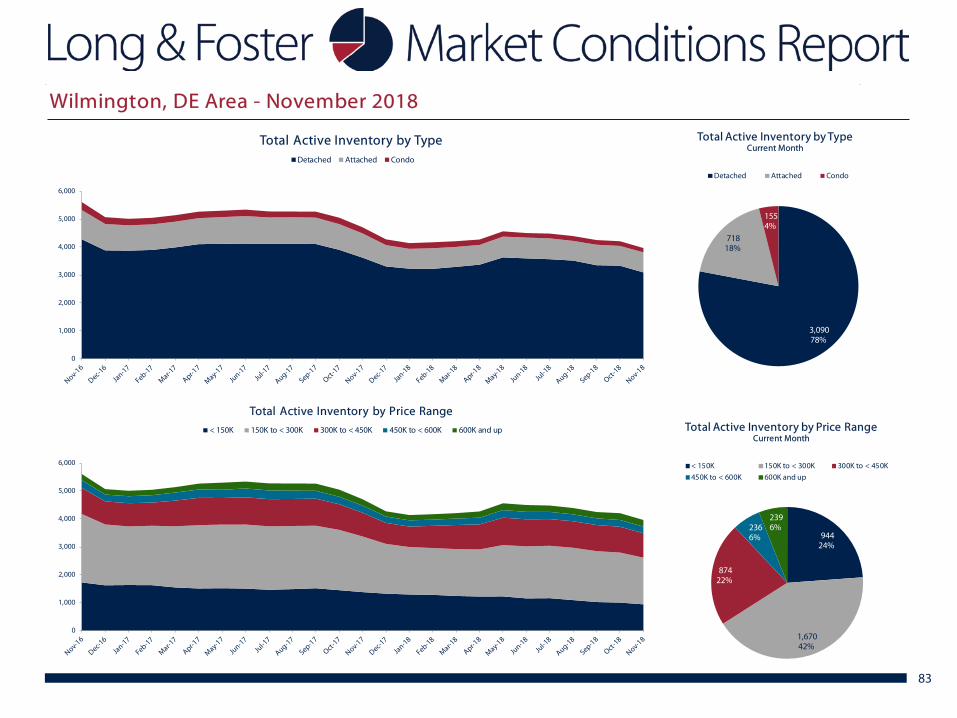
83
0
1,000
2,000
3,000
4,000
5,000
6,000
Total Active Inventory by TypeDetached Attached Condo
3,090 78%
718 18%
155 4%
Total Active Inventory by TypeCurrent Month
Detached Attached Condo
944 24%
1,670 42%
874 22%
236 6%
239 6%
Total Active Inventory by Price RangeCurrent Month
< 150K 150K to < 300K 300K to < 450K
450K to < 600K 600K and up
0
1,000
2,000
3,000
4,000
5,000
6,000
Total Active Inventory by Price Range
< 150K 150K to < 300K 300K to < 450K 450K to < 600K 600K and up
Wilmington, DE Area - November 2018
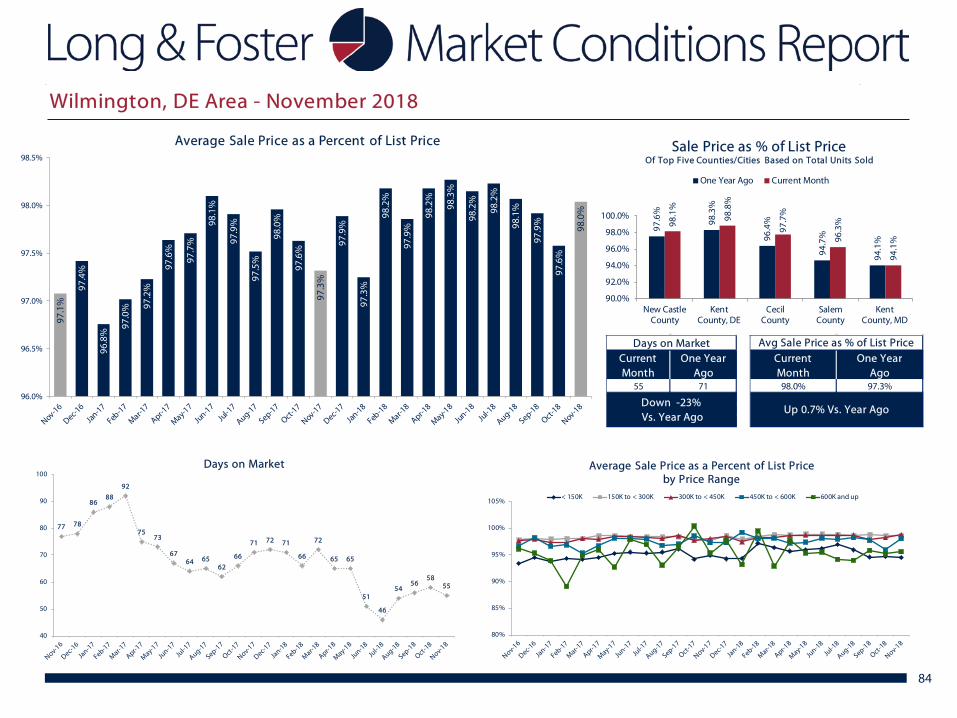
84
97.1
%
97.4
%
96.8
%
97.0
% 97.2
%
97.6
%
97.7
%
98.1
%
97.9
%
97.5
%
98.0
%
97.6
%
97.3
%
97.9
%
97.3
%
98.2
%
97.9
%
98.2
%
98.3
%
98.2
%
98.2
%
98.1
%
97.9
%
97.6
%
98.0
%
96.0%
96.5%
97.0%
97.5%
98.0%
98.5%
Average Sale Price as a Percent of List Price
Days on MarketCurrentMonth
One YearAgo
55 71
Down -23% Vs. Year Ago
Avg Sale Price as % of List PriceCurrentMonth
One YearAgo
98.0% 97.3%
Up 0.7% Vs. Year Ago
97.6
%
98.3
%
96.4
%
94.7
%
94.1
%
98.1
%
98.8
%
97.7
%
96.3
%
94.1
%
90.0%
92.0%
94.0%
96.0%
98.0%
100.0%
New CastleCounty
KentCounty, DE
CecilCounty
SalemCounty
KentCounty, MD
Sale Price as % of List PriceOf Top Five Counties/Cities Based on Total Units Sold
One Year Ago Current Month
77 78
8688
92
7573
6764 65
62
66
71 72 71
66
72
65 65
51
46
5456
5855
40
50
60
70
80
90
100Days on Market
80%
85%
90%
95%
100%
105%
Average Sale Price as a Percent of List Price by Price Range
< 150K 150K to < 300K 300K to < 450K 450K to < 600K 600K and up
Wilmington, DE Area - November 2018
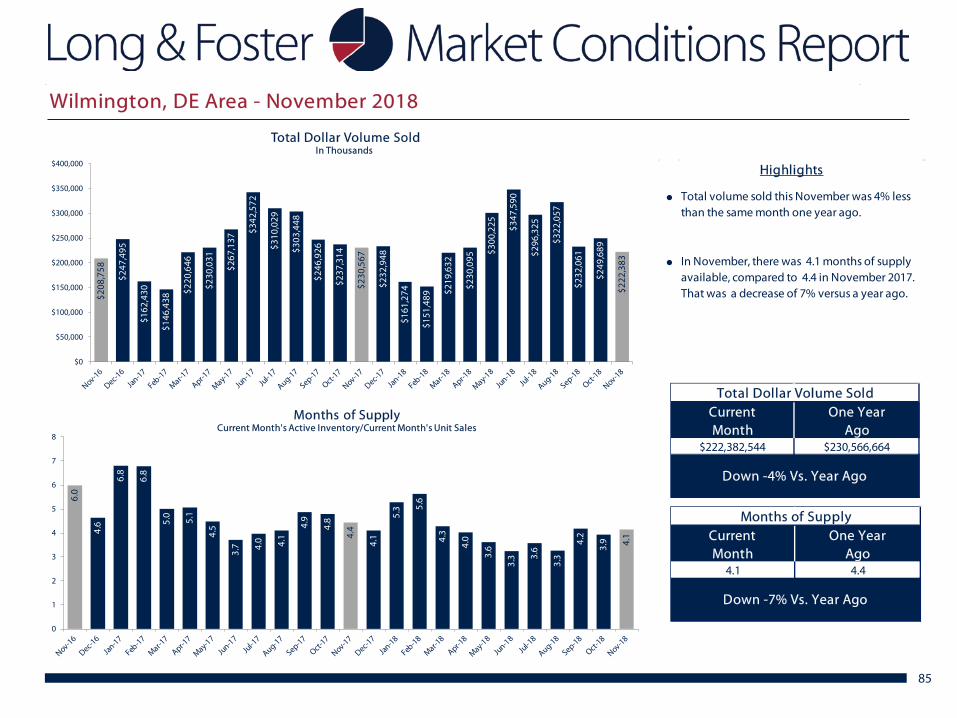
85
$208
,758
$247
,495
$162
,430
$146
,438
$220
,646
$230
,031
$267
,137
$342
,572
$310
,029
$303
,448
$246
,926
$237
,314
$230
,567
$232
,948
$161
,274
$151
,489
$219
,632
$230
,095
$300
,225 $3
47,5
90
$296
,325
$322
,057
$232
,061
$249
,689
$222
,383
$0
$50,000
$100,000
$150,000
$200,000
$250,000
$300,000
$350,000
$400,000
Total Dollar Volume SoldIn Thousands
Total Dollar Volume SoldCurrentMonth
One YearAgo
$222,382,544 $230,566,664
Down -4% Vs. Year Ago
Months of SupplyCurrentMonth
One YearAgo
4.1 4.4
Down -7% Vs. Year Ago
6.0
4.6
6.8
6.8
5.0
5.1
4.5
3.7 4.
0 4.1
4.9
4.8
4.4
4.1
5.3 5.
6
4.3
4.0
3.6
3.3 3.
6
3.3
4.2
3.9 4.
10
1
2
3
4
5
6
7
8
Months of SupplyCurrent Month's Active Inventory/Current Month's Unit Sales
●
●
Total volume sold this November was 4% less than the same month one year ago.
In November, there was 4.1 months of supply available, compared to 4.4 in November 2017. That was a decrease of 7% versus a year ago.
Highlights
Wilmington, DE Area - November 2018
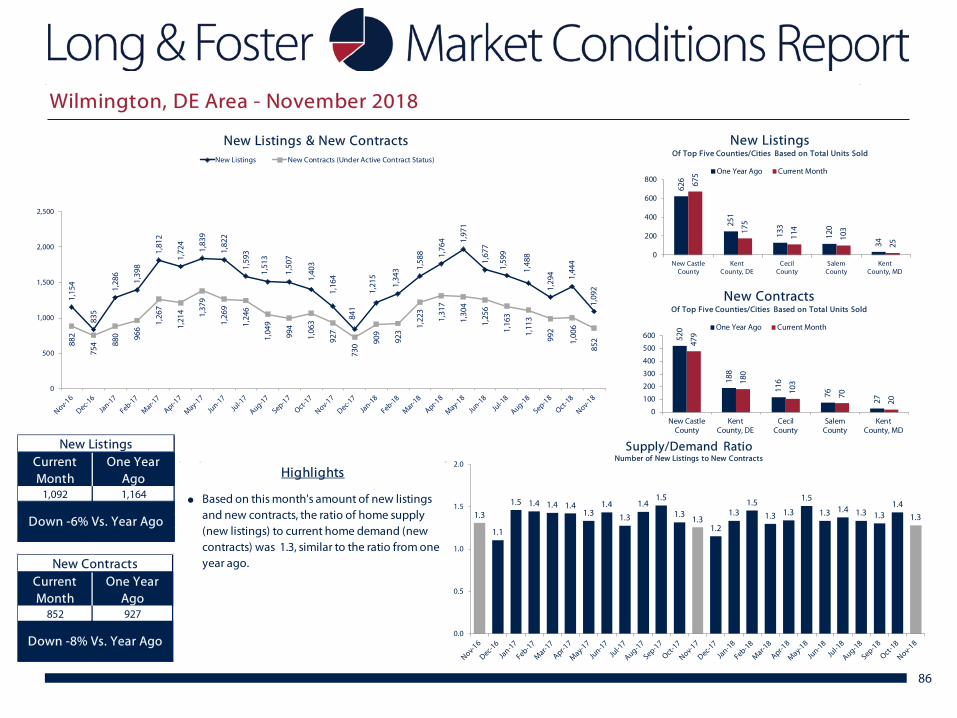
86
1,15
4
835
1,28
6
1,39
8
1,81
2
1,72
4
1,83
9
1,82
2
1,59
3
1,51
3
1,50
7
1,40
3
1,16
4
841
1,21
5
1,34
3 1,58
8 1,76
4 1,97
1
1,67
7
1,59
9
1,48
8
1,29
4 1,44
4
1,09
2
882
754 88
0 966
1,26
7
1,21
4 1,37
9
1,26
9
1,24
6
1,04
9
994
1,06
3
927
730 90
9
923
1,22
3
1,31
7
1,30
4
1,25
6
1,16
3
1,11
3
992
1,00
6
852
0
500
1,000
1,500
2,000
2,500
New Listings & New ContractsNew Listings New Contracts (Under Active Contract Status)
New ListingsCurrent Month
One Year Ago
1,092 1,164
Down -6% Vs. Year Ago
New ContractsCurrent Month
One Year Ago
852 927
Down -8% Vs. Year Ago
1.3
1.1
1.5 1.4 1.4 1.41.3
1.4
1.3
1.41.5
1.31.3
1.2
1.31.5
1.3 1.3
1.5
1.3 1.4 1.3 1.31.4
1.3
0.0
0.5
1.0
1.5
2.0
Supply/Demand RatioNumber of New Listings to New Contracts
626
251
133
120
34
675
175
114
103
25
0
200
400
600
800
New CastleCounty
KentCounty, DE
CecilCounty
SalemCounty
KentCounty, MD
New ListingsOf Top Five Counties/Cities Based on Total Units Sold
One Year Ago Current Month
520
188
116
76
27
479
180
103
70
20
0
100
200
300
400
500
600
New CastleCounty
KentCounty, DE
CecilCounty
SalemCounty
KentCounty, MD
New ContractsOf Top Five Counties/Cities Based on Total Units Sold
One Year Ago Current Month
● Based on this month's amount of new listings and new contracts, the ratio of home supply (new listings) to current home demand (new contracts) was 1.3, similar to the ratio from one year ago.
Highlights
Wilmington, DE Area - November 2018
87
November 2018
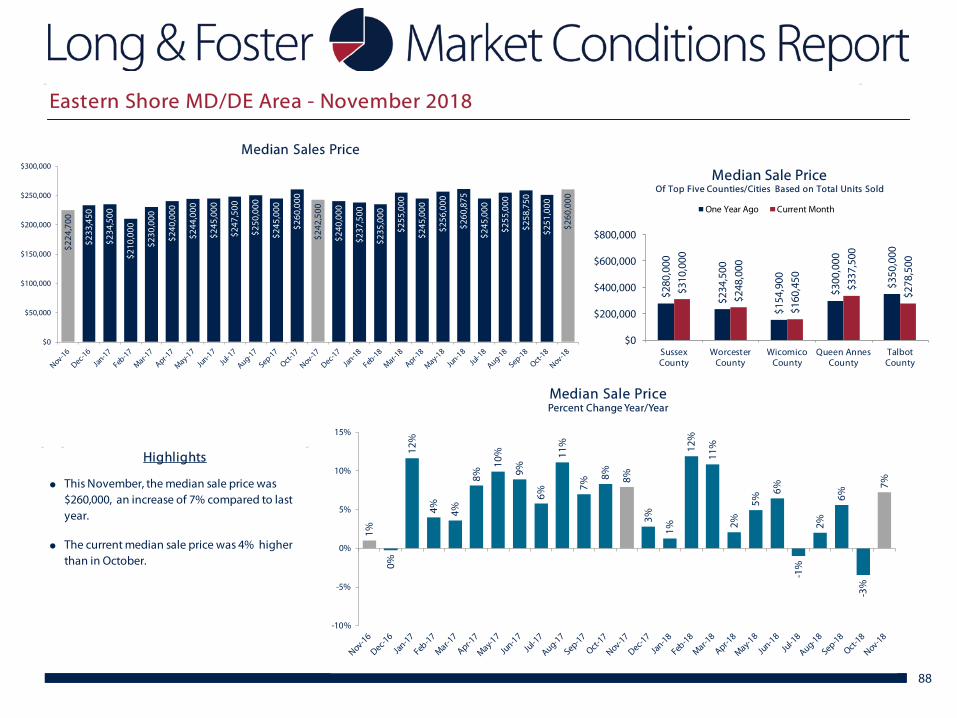
1%
0%
12%
4% 4%
8%
10%
9%
6%
11%
7%
8% 8%
3%
1%
12%
11%
2%
5%
6%
-1%
2%
6%
-3%
7%
-10%
-5%
0%
5%
10%
15%
Median Sale PricePercent Change Year/Year
88
$224
,700
$233
,450
$234
,500
$210
,000
$230
,000
$240
,000
$244
,000
$245
,000
$247
,500
$250
,000
$245
,000
$260
,000
$242
,500
$240
,000
$237
,500
$235
,000
$255
,000
$245
,000
$256
,000
$260
,875
$245
,000
$255
,000
$258
,750
$251
,000
$260
,000
$0
$50,000
$100,000
$150,000
$200,000
$250,000
$300,000
Median Sales Price
$280
,000
$234
,500
$154
,900
$300
,000
$350
,000
$310
,000
$248
,000
$160
,450
$337
,500
$278
,500
$0
$200,000
$400,000
$600,000
$800,000
SussexCounty
WorcesterCounty
WicomicoCounty
Queen AnnesCounty
TalbotCounty
Median Sale PriceOf Top Five Counties/Cities Based on Total Units Sold
One Year Ago Current Month
●
●
Highlights
This November, the median sale price was $260,000, an increase of 7% compared to last year.
The current median sale price was 4% higher than in October.
Eastern Shore MD/DE Area - November 2018
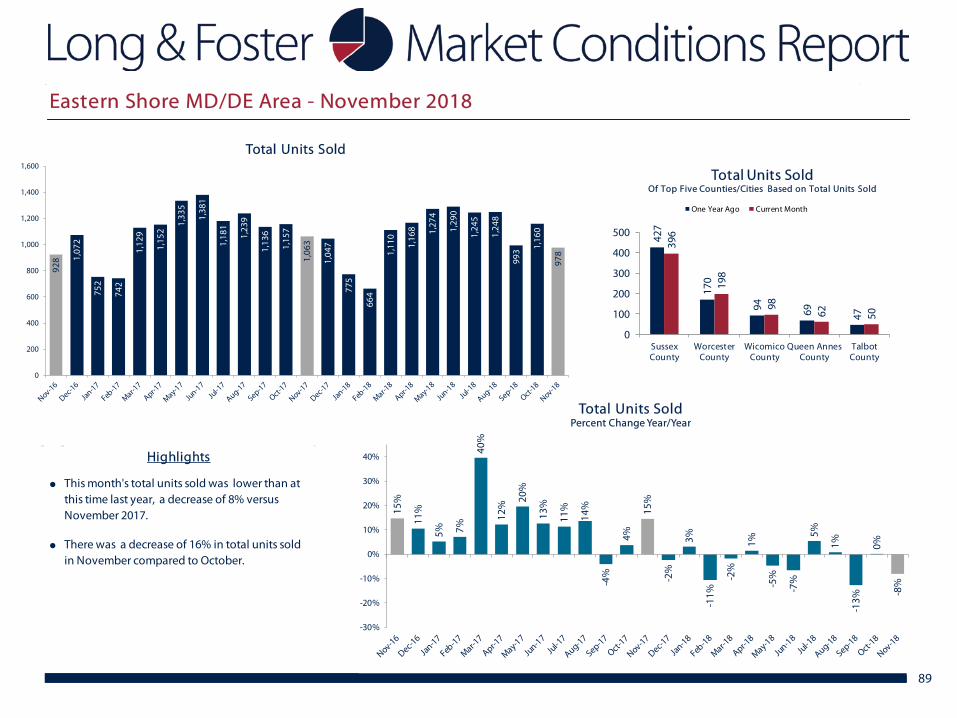
15%
11%
5% 7%
40%
12%
20%
13%
11%
14%
-4%
4%
15%
-2%
3%
-11%
-2%
1%
-5%
-7%
5%
1%
-13%
0%
-8%
-30%
-20%
-10%
0%
10%
20%
30%
40%
Total Units SoldPercent Change Year/Year
89
928 1,
072
752
742
1,12
9
1,15
2
1,33
5
1,38
1
1,18
1
1,23
9
1,13
6
1,15
7
1,06
3
1,04
7
775
664
1,11
0
1,16
8 1,27
4
1,29
0
1,24
5
1,24
8
993 1,
160
978
0
200
400
600
800
1,000
1,200
1,400
1,600
Total Units Sold
427
170
94 69 47
396
198
98
62 50
0
100
200
300
400
500
SussexCounty
WorcesterCounty
WicomicoCounty
Queen AnnesCounty
TalbotCounty
Total Units SoldOf Top Five Counties/Cities Based on Total Units Sold
One Year Ago Current Month
●
●
Highlights
This month's total units sold was lower than at this time last year, a decrease of 8% versus November 2017.
There was a decrease of 16% in total units sold in November compared to October.
Eastern Shore MD/DE Area - November 2018
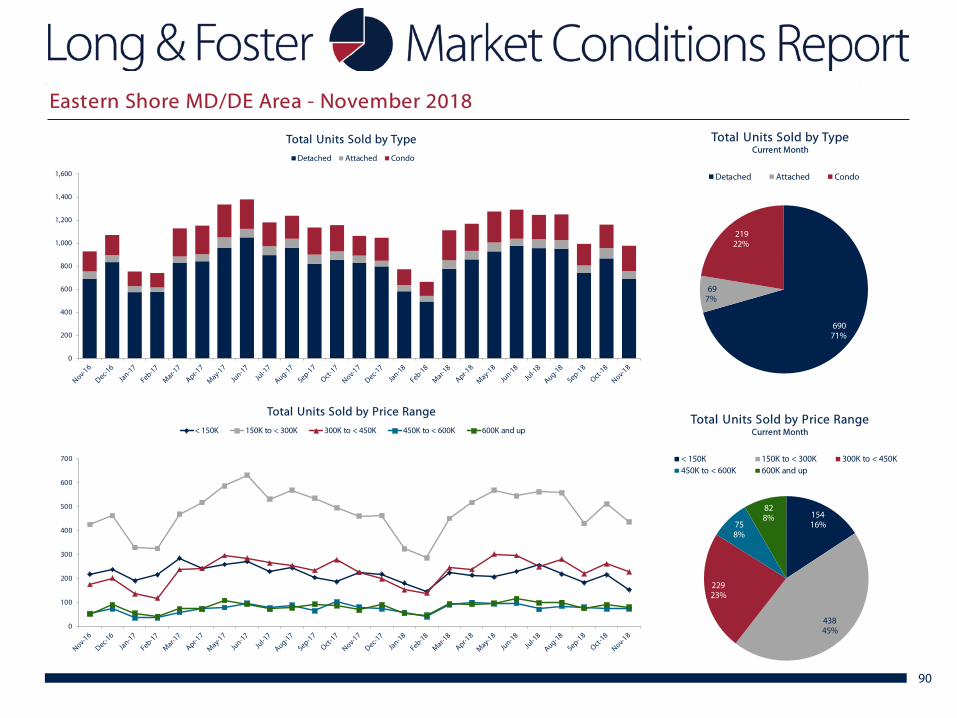
90
0
200
400
600
800
1,000
1,200
1,400
1,600
Total Units Sold by Type
Detached Attached Condo
690 71%
69 7%
219 22%
Total Units Sold by TypeCurrent Month
Detached Attached Condo
15416%
43845%
22923%
758%
828%
Total Units Sold by Price RangeCurrent Month
< 150K 150K to < 300K 300K to < 450K450K to < 600K 600K and up
0
100
200
300
400
500
600
700
Total Units Sold by Price Range
< 150K 150K to < 300K 300K to < 450K 450K to < 600K 600K and up
Eastern Shore MD/DE Area - November 2018
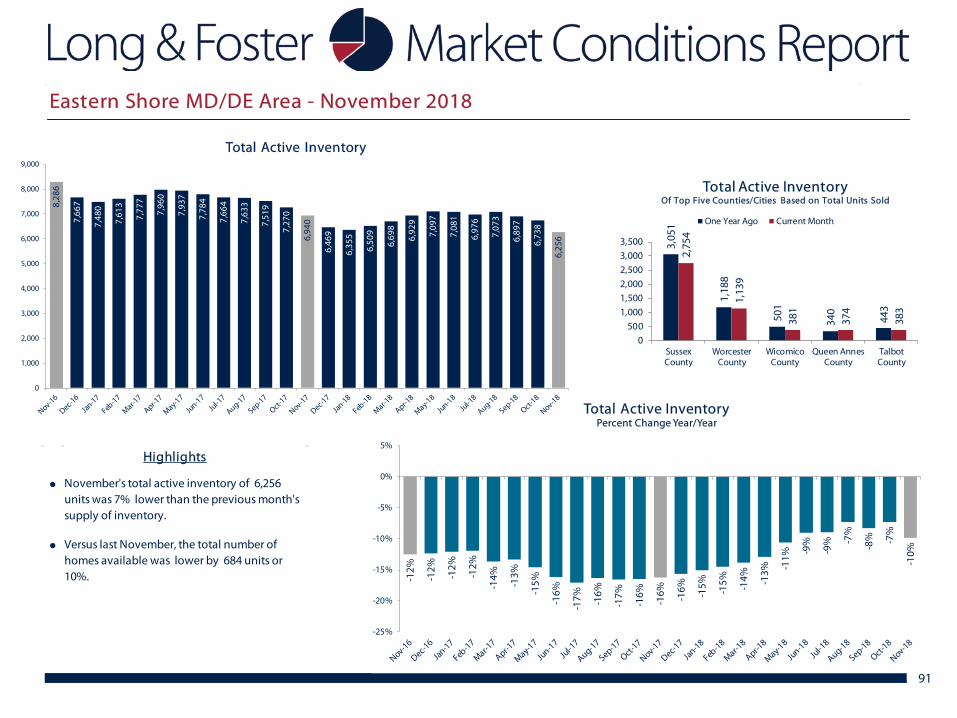
-12%
-12%
-12%
-12%
-14%
-13%
-15%
-16%
-17% -1
6%
-17%
-16%
-16% -16% -15% -15% -14% -1
3% -11%
-9%
-9% -7
%
-8% -7
%
-10%
-25%
-20%
-15%
-10%
-5%
0%
5%
Total Active InventoryPercent Change Year/Year
91
8,28
6
7,66
7
7,48
0
7,61
3
7,77
7
7,96
0
7,93
7
7,78
4
7,66
4
7,63
3
7,51
9
7,27
0
6,94
0
6,46
9
6,35
5
6,50
9
6,69
8
6,92
9
7,09
7
7,08
1
6,97
6
7,07
3
6,89
7
6,73
8
6,25
6
0
1,000
2,000
3,000
4,000
5,000
6,000
7,000
8,000
9,000
Total Active Inventory
3,05
1
1,18
8
501
340
443
2,75
4
1,13
9
381
374
383
0500
1,0001,5002,0002,5003,0003,500
SussexCounty
WorcesterCounty
WicomicoCounty
Queen AnnesCounty
TalbotCounty
Total Active InventoryOf Top Five Counties/Cities Based on Total Units Sold
One Year Ago Current Month
●
●
Highlights
November's total active inventory of 6,256 units was 7% lower than the previous month's supply of inventory.
Versus last November, the total number of homes available was lower by 684 units or 10%.
Eastern Shore MD/DE Area - November 2018
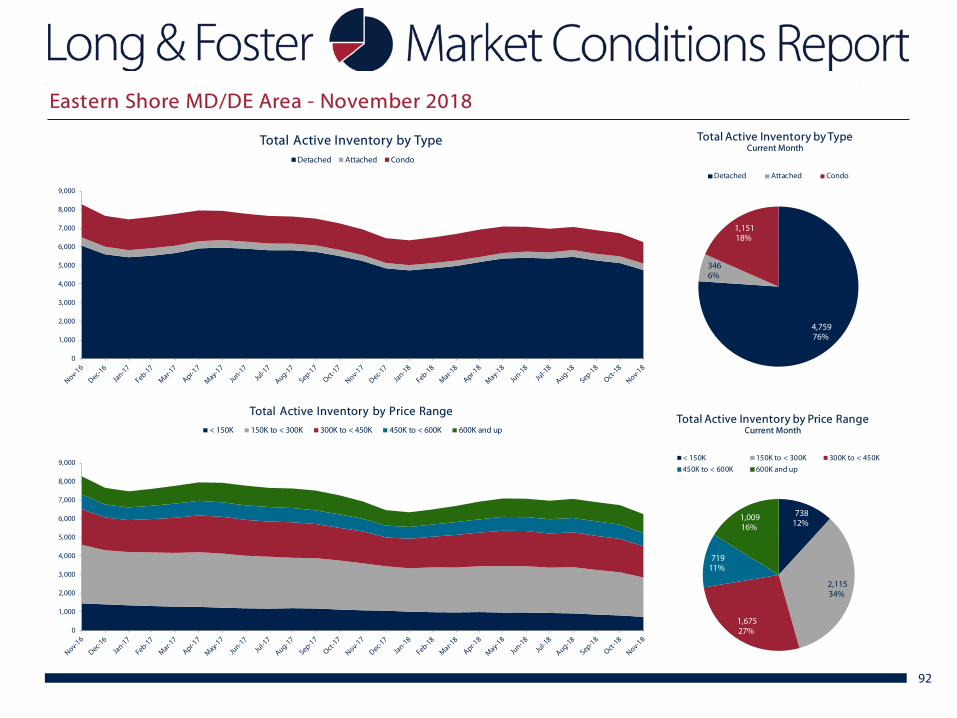
92
0
1,000
2,000
3,000
4,000
5,000
6,000
7,000
8,000
9,000
Total Active Inventory by TypeDetached Attached Condo
4,759 76%
346 6%
1,151 18%
Total Active Inventory by TypeCurrent Month
Detached Attached Condo
738 12%
2,115 34%
1,675 27%
719 11%
1,009 16%
Total Active Inventory by Price RangeCurrent Month
< 150K 150K to < 300K 300K to < 450K
450K to < 600K 600K and up
0
1,000
2,000
3,000
4,000
5,000
6,000
7,000
8,000
9,000
Total Active Inventory by Price Range
< 150K 150K to < 300K 300K to < 450K 450K to < 600K 600K and up
Eastern Shore MD/DE Area - November 2018
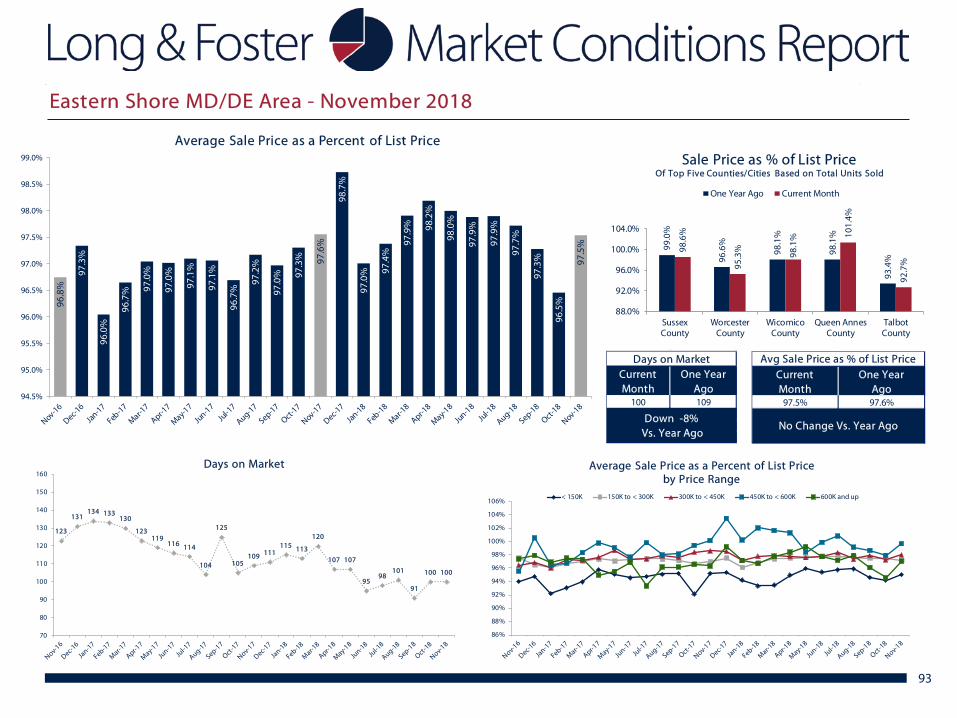
93
96.8
%
97.3
%
96.0
%
96.7
% 97.0
%
97.0
%
97.1
%
97.1
%
96.7
%
97.2
%
97.0
% 97.3
% 97.6
%
98.7
%
97.0
% 97.4
%
97.9
% 98.2
%
98.0
%
97.9
%
97.9
%
97.7
%
97.3
%
96.5
%
97.5
%
94.5%
95.0%
95.5%
96.0%
96.5%
97.0%
97.5%
98.0%
98.5%
99.0%
Average Sale Price as a Percent of List Price
99.0
%
96.6
%
98.1
%
98.1
%
93.4
%
98.6
%
95.3
%
98.1
% 101.
4%
92.7
%
88.0%
92.0%
96.0%
100.0%
104.0%
SussexCounty
WorcesterCounty
WicomicoCounty
Queen AnnesCounty
TalbotCounty
Sale Price as % of List PriceOf Top Five Counties/Cities Based on Total Units Sold
One Year Ago Current Month
Days on MarketCurrentMonth
One YearAgo
100 109
Down -8% Vs. Year Ago
123
131134 133
130
123119
116 114
104
125
105109 111
115 113
120
107 107
9598
101
91
100 100
70
80
90
100
110
120
130
140
150
160Days on Market
86%
88%
90%
92%
94%
96%
98%
100%
102%
104%
106%
Average Sale Price as a Percent of List Price by Price Range
< 150K 150K to < 300K 300K to < 450K 450K to < 600K 600K and up
Avg Sale Price as % of List PriceCurrentMonth
One YearAgo
97.5% 97.6%
No Change Vs. Year Ago
Eastern Shore MD/DE Area - November 2018
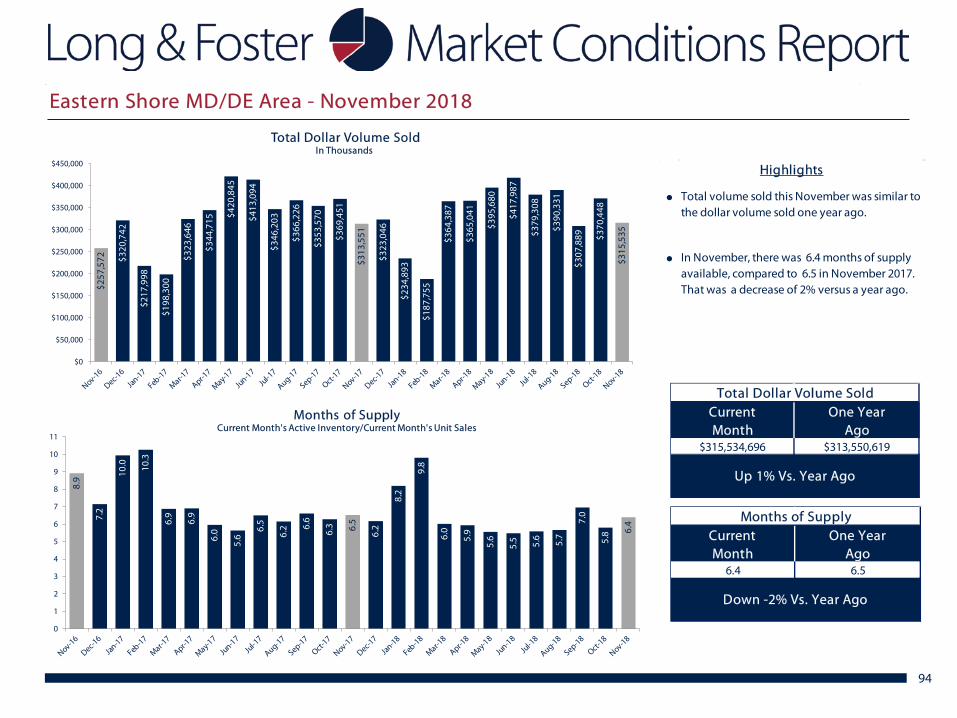
94
$257
,572 $3
20,7
42
$217
,998
$198
,300
$323
,646
$344
,715
$420
,845
$413
,094
$346
,203
$366
,226
$353
,570
$369
,451
$313
,551
$323
,046
$234
,893
$187
,755
$364
,387
$365
,041
$395
,680
$417
,987
$379
,308
$390
,331
$307
,889 $3
70,4
48
$315
,535
$0
$50,000
$100,000
$150,000
$200,000
$250,000
$300,000
$350,000
$400,000
$450,000
Total Dollar Volume SoldIn Thousands
Total Dollar Volume SoldCurrentMonth
One YearAgo
$315,534,696 $313,550,619
Up 1% Vs. Year Ago
Months of SupplyCurrentMonth
One YearAgo
6.4 6.5
Down -2% Vs. Year Ago
8.9
7.2
10.0 10
.3
6.9
6.9
6.0
5.6
6.5
6.2 6.
6
6.3 6.
5
6.2
8.2
9.8
6.0
5.9
5.6
5.5 5.6
5.7
7.0
5.8 6.
40
1
2
3
4
5
6
7
8
9
10
11
Months of SupplyCurrent Month's Active Inventory/Current Month's Unit Sales
●
●
Highlights
Total volume sold this November was similar to the dollar volume sold one year ago.
In November, there was 6.4 months of supply available, compared to 6.5 in November 2017. That was a decrease of 2% versus a year ago.
Eastern Shore MD/DE Area - November 2018
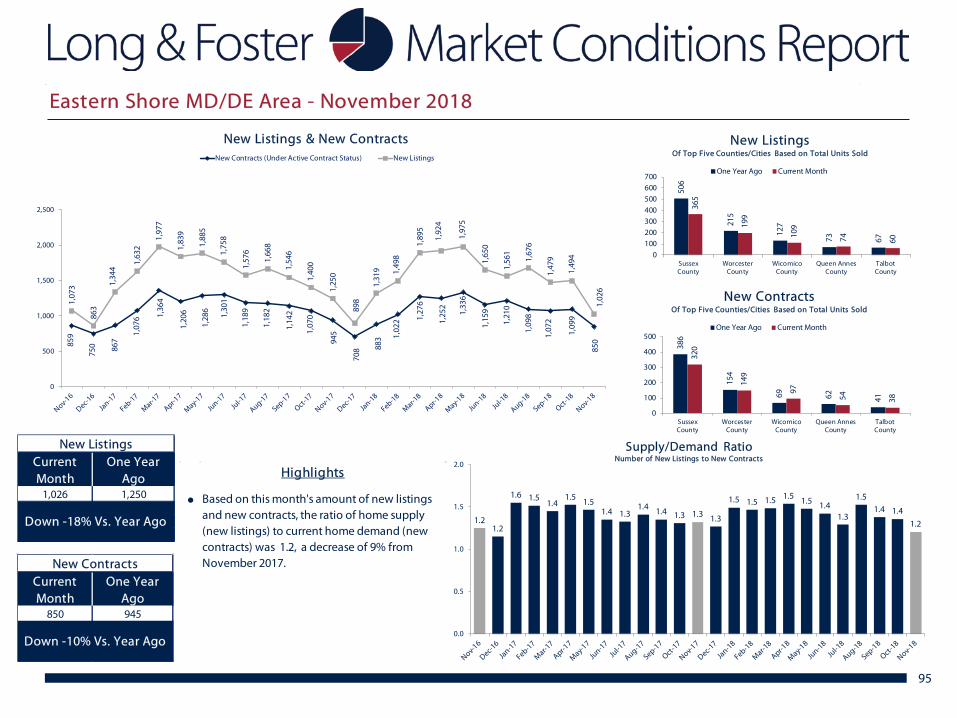
95
●
Highlights
Based on this month's amount of new listings and new contracts, the ratio of home supply (new listings) to current home demand (new contracts) was 1.2, a decrease of 9% from November 2017.
859
750 86
7
1,07
6 1,36
4
1,20
6
1,28
6
1,30
1
1,18
9
1,18
2
1,14
2
1,07
0
945
708 88
3 1,02
2 1,27
6
1,25
2
1,33
6
1,15
9
1,21
0
1,09
8
1,07
2
1,09
9
850
1,07
3
863
1,34
4
1,63
2
1,97
7
1,83
9
1,88
5
1,75
8
1,57
6
1,66
8
1,54
6
1,40
0
1,25
0
898
1,31
9 1,49
8
1,89
5
1,92
4
1,97
5
1,65
0
1,56
1
1,67
6
1,47
9
1,49
4
1,02
6
0
500
1,000
1,500
2,000
2,500
New Listings & New ContractsNew Contracts (Under Active Contract Status) New Listings
New ListingsCurrent Month
One Year Ago
1,026 1,250
Down -18% Vs. Year Ago
New ContractsCurrent Month
One Year Ago
850 945
Down -10% Vs. Year Ago
1.21.2
1.6 1.51.4
1.5 1.51.4 1.3
1.4 1.4 1.3 1.3 1.3
1.5 1.5 1.5 1.5 1.5 1.41.3
1.51.4 1.4
1.2
0.0
0.5
1.0
1.5
2.0
Supply/Demand RatioNumber of New Listings to New Contracts
506
215
127
73 67
365
199
109
74 60
0100200300400500600700
SussexCounty
WorcesterCounty
WicomicoCounty
Queen AnnesCounty
TalbotCounty
New ListingsOf Top Five Counties/Cities Based on Total Units Sold
One Year Ago Current Month
386
154
69 62 41
320
149
97
54 38
0
100
200
300
400
500
SussexCounty
WorcesterCounty
WicomicoCounty
Queen AnnesCounty
TalbotCounty
New ContractsOf Top Five Counties/Cities Based on Total Units Sold
One Year Ago Current Month
Eastern Shore MD/DE Area - November 2018
96
References & Definitions WASHINGTON D.C. METROPOLITAN AREA: LISTING SOURCE, REPORTING AREA, & DEFINITION Based on data supplied by Bright MLS and its member Association(s) of REALTORS, who are not responsible for its accuracy. Does not reflect all activity in the marketplace. Counties & cities included in this area are: District of Columbia; Arlington, Clarke, Fairfax, Fauquier, Loudoun, Prince William, Spotsylvania, Stafford, Warren Counties and Alexandria, Fairfax, Falls Church, Fredericksburg, Manassas, Manassas Park Cities in Virginia; Calvert, Charles, Prince George’s, Frederick, Montgomery Counties in Maryland; Jefferson County in West Virginia. BALTIMORE METROPOLITAN AREA: LISTING SOURCE, REPORTING AREA, & DEFINITION Based on data supplied by Bright MLS and its member Association(s) of REALTORS, who are not responsible for its accuracy. Does not reflect all activity in the marketplace. Counties & cities included in this area are: Anne Arundel, Baltimore, Carroll, Harford, Howard, and Queen Anne’s Counties and Baltimore City in Maryland. RICHMOND METROPOLITAN AREA: LISTING SOURCE, REPORTING AREA, & DEFINITION Data for all counties except for Caroline County (Virginia) is supplied by Central Virginia Regional MLS and its member Association(s) of REALTORS, who are not responsible for its accuracy. Data for Caroline County data based on Bright MLS and its member Association(s) of REALTORS, who are not responsible for its accuracy. Does not reflect all activity in the marketplace. Counties & cities included in this area are: Amelia, Caroline, Charles City, Chesterfield, Cumberland, Dinwiddie, Goochland, Hanover, Henrico, King and Queen, King William, Louisa, New Kent, Powhatan, Prince George, and Sussex Counties and Colonial Heights, Hopewell, Petersburg, and Richmond Cities in Virginia. PHILADELPHIA METROPOLITAN AREA: LISTING SOURCE, REPORTING AREA, & DEFINITION Based on data supplied by Bright MLS and its member Association(s) of REALTORS, who are not responsible for its accuracy. Does not reflect all activity in the marketplace. Counties & cities included in this area are: Bucks, Chester, Delaware, Montgomery, and Philadelphia Counties in Pennsylvania and Gloucester, Camden, Burlington, and Mercer in New Jersey. THE TRIANGLE NORTH CAROLINA AREA: LISTING SOURCE, REPORTING AREA, & DEFINITION Based on data supplied by the Triangle MLS and its and its member Association(s) of REALTORS, who are not responsible for its accuracy. Does not reflect all activity in the marketplace. Counties include in this area are: Alamance, Chatham, Durham, Franklin, Granville, Harnett, Johnston, Orange, and Wake in North Carolina.
Analysis dates for all regions: November 1, 2016 through November 30, 2018.
97
References & Definitions CHARLOTTESVILLE AREA: LISTING SOURCE, REPORTING AREA, & DEFINITION Based on data supplied by CAAR MLS and its member Association(s) of REALTORS, who are not responsible for its accuracy. Does not reflect all activity in the marketplace. Counties & cities included in this area are: City of Charlottesville and Albemarle, Buckingham, Fluvanna County, Greene County and Nelson counties in Virginia. HAMPTON ROADS AREA: LISTING SOURCE, REPORTING AREA, & DEFINITION Data for all counties except for Gloucester and Mathews Counties in Virginia is supplied by Real Estate Information Network MLS and its member Association(s) of REALTORS, who are not responsible for its accuracy. Data for Gloucester and Mathews Counties is supplied by Chesapeake Bay & Rivers MLS and its member Association(s) of REALTORS, who are not responsible for its accuracy. Does not reflect all activity in the marketplace. Counties & cities included in this area are: Gloucester, Isle of Wight, James City, Mathews, Surry, and York Counties and Chesapeake, Hampton, Newport News, Norfolk, Poquoson, Portsmouth, Suffolk, Virginia Beach, and Williamsburg Cites in Virginia; Currituck County in North Carolina. ROANOKE METROPOLITAN AREA: LISTING SOURCE, REPORTING AREA & DEFINITION Based on data supplied by Roanoke Valley Association of REALTORS (RVAR) and its member Association(s) of REALTORS, who are not responsible for its accuracy. Does not reflect all activity in the marketplace as some brokerages choose not to provide transaction information. This may result in an understatement of completed sales and available listings. Information contained in this report is deemed reliable but not guaranteed, should be independently verified, and does not constitute an opinion of RVAR or Long & Foster Real Estate, Inc. Counties & cities included in this area are: Botetourt, Craig, Franklin, and Roanoke Counties and Roanoke and Salem Cities in Virginia. WILMINGTON, DE AREA: LISTING SOURCE, REPORTING AREA & DEFINITION Based on data supplied by Bright MLS and its member Association(s) of REALTORS, who are not responsible for its accuracy. Does not reflect all activity in the marketplace. Counties & cities included in this area are: Kent and New Castle Counties in Delaware, Cecil and Kent Counties in Maryland, and Salem County in New Jersey. EASTERN SHORE MD/DE AREA: LISTING SOURCE, REPORTING AREA, & DEFINITION Based on data supplied by Bright MLS and its member Association(s) of REALTORS, who are not responsible for its accuracy. Does not reflect all activity in the marketplace. Counties & cities include in this area are: Caroline, Dorchester, Kent, Queen Anne’s, Somerset, Talbot, Wicomico, and Worcester Counties in Maryland and Sussex County in Delaware.
Analysis dates for all regions: November 1, 2016 through November 30, 2018.
98
Contacts & Disclaimers MEDIA CONTACT Vicki Bendure, Bendure Communications Email: [email protected] Phone: (540) 687-3360 CREATED BY Michael Bystry, Long & Foster Real Estate, Inc. Senior Market Research Analyst DISCLAIMER Information contained in this report is based on data provided by the local area Multiple Listing Service and its member Association(s) of REALTORS®. No representation, expressed or implied should be taken from information herein. Neither these organizations nor Long & Foster Real Estate, Inc. guarantee or are in any way responsible for the accuracy of these results, which do not reflect all activity in the marketplace. “Detached”, “Attached”, and “Condo” varies by local area Multiple Listing Service (MLS) definition. For more information regarding your specific market, contact one of Long & Foster’s knowledgeable and experienced sales associates. Information contained in this report is not limited to transactions done by Long & Foster Real Estate, Inc. The data reported is solely for residential real estate transactions. Information contained in this report is deemed reliable but not guaranteed, should be independently verified and does not constitute an opinion of Long & Foster Real Estate, Inc. Material appearing in this report may be reproduced or copied without permission. Please use the following acknowledgement for citation: Source: Long & Foster Real Estate, Inc. and also cite the appropriate MLS.