Embed Size (px)
Citation preview
® The Long & Foster Market Conditions Report
- August 2013 Release -www.longandfoster.com
® The Long & Foster Market Conditions Report
2
Page Content 3 Executive Summary: The Mid-Atlantic Metropolitan Statistical Areas ‘At A Glance’
6 Washington D.C. Metropolitan Area
14 Baltimore Metropolitan Area
22 Richmond Metropolitan Area
30 Philadelphia Metropolitan Area
38 The Triangle, NC Area 46 Hampton Roads Area 54 Roanoke Metropolitan Area
62 Wilmington, DE Area 70 Eastern Shore MD/DE Area (Includes Caroline, Dorchester, Kent, Queen Anne's, Somerset, Talbot, Wicomico, and
Worcester Counties in Maryland and Sussex County in Delaware)
Appendix
78 References & Definitions
80 Contacts & Disclaimers
® The Long & Foster Market Conditions Report
3
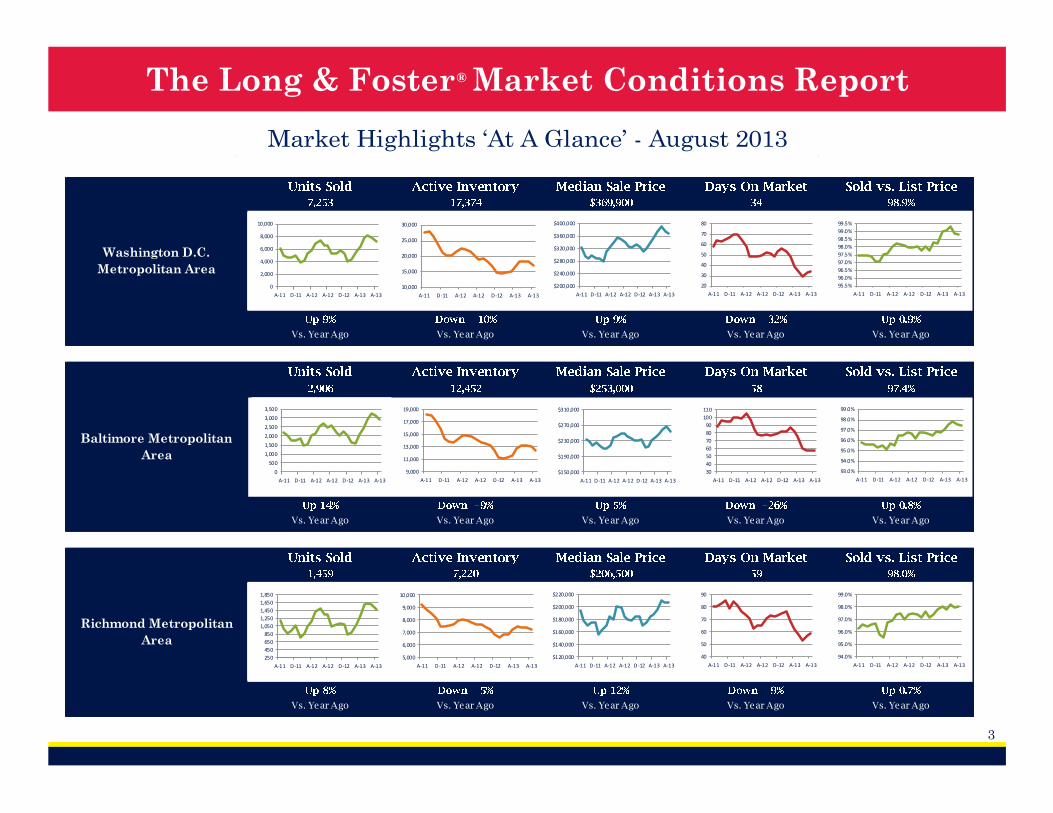
Market Highlights ‘At A Glance’ - August 2013
Richmond Metropolitan
Area
Vs. Year Ago Vs. Year Ago Vs. Year Ago Vs. Year Ago Vs. Year Ago
Washington D.C.
Metropolitan Area
Vs. Year Ago Vs. Year Ago Vs. Year Ago Vs. Year Ago Vs. Year Ago
Baltimore Metropolitan
Area
Vs. Year AgoVs. Year AgoVs. Year Ago Vs. Year Ago Vs. Year Ago
0
500
1,000
1,500
2,000
2,500
3,000
3,500
A-11 D-11 A-12 A-12 D-12 A-13 A-13
9,000
11,000
13,000
15,000
17,000
19,000
A-11 D-11 A-12 A-12 D-12 A-13 A-13
$150,000
$190,000
$230,000
$270,000
$310,000
A-11 D-11 A-12 A-12 D-12 A-13 A-13
30
40
50
60
70
80
90
100
110
A-11 D-11 A-12 A-12 D-12 A-13 A-13
0
2,000
4,000
6,000
8,000
10,000
A-11 D-11 A-12 A-12 D-12 A-13 A-13
$200,000
$240,000
$280,000
$320,000
$360,000
$400,000
A-11 D-11 A-12 A-12 D-12 A-13 A-13
20
30
40
50
60
70
80
A-11 D-11 A-12 A-12 D-12 A-13 A-1310,000
15,000
20,000
25,000
30,000
A-11 D-11 A-12 A-12 D-12 A-13 A-13
95.5%
96.0%
96.5%
97.0%
97.5%
98.0%
98.5%
99.0%
99.5%
A-11 D-11 A-12 A-12 D-12 A-13 A-13
250
450
650
850
1,050
1,250
1,450
1,650
1,850
A-11 D-11 A-12 A-12 D-12 A-13 A-13
$120,000
$140,000
$160,000
$180,000
$200,000
$220,000
A-11 D-11 A-12 A-12 D-12 A-13 A-13
40
50
60
70
80
90
A-11 D-11 A-12 A-12 D-12 A-13 A-13
5,000
6,000
7,000
8,000
9,000
10,000
A-11 D-11 A-12 A-12 D-12 A-13 A-13
94.0%
95.0%
96.0%
97.0%
98.0%
99.0%
A-11 D-11 A-12 A-12 D-12 A-13 A-13
93.0%
94.0%
95.0%
96.0%
97.0%
98.0%
99.0%
A-11 D-11 A-12 A-12 D-12 A-13 A-13
® The Long & Foster Market Conditions Report
4
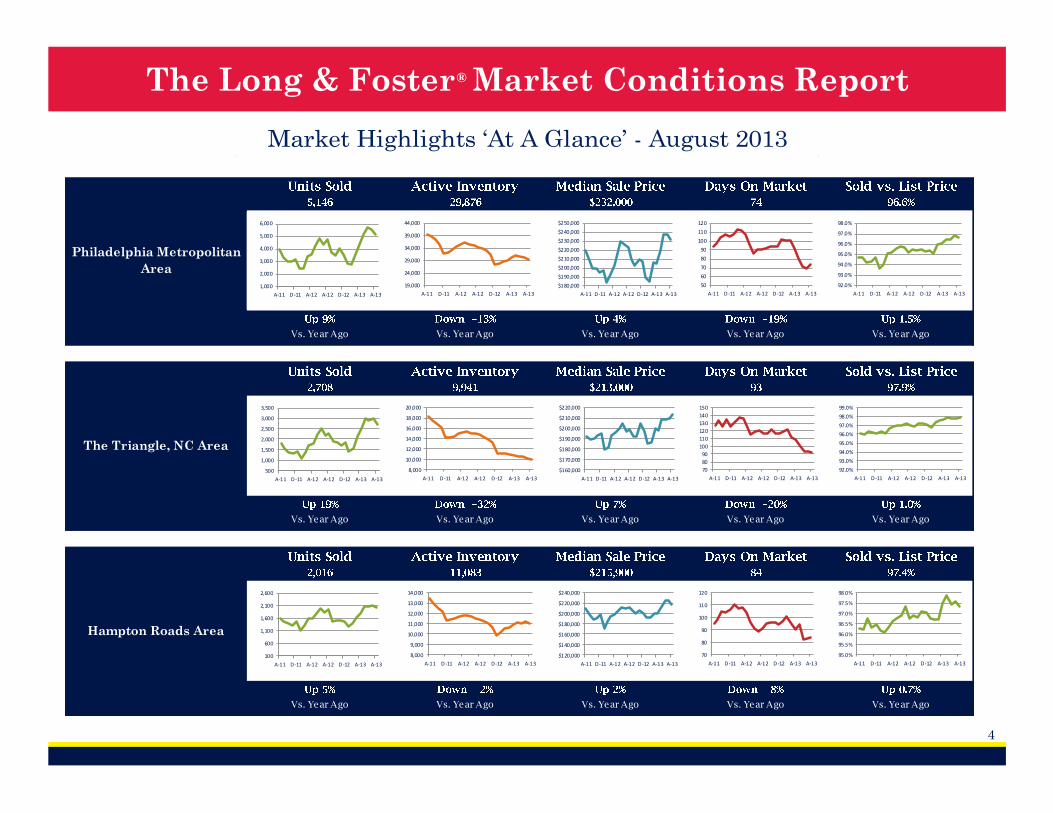
Market Highlights ‘At A Glance’ - August 2013
The Triangle, NC Area
Vs. Year Ago Vs. Year Ago Vs. Year Ago Vs. Year Ago Vs. Year Ago
Vs. Year Ago Vs. Year Ago Vs. Year Ago Vs. Year Ago Vs. Year Ago
Philadelphia Metropolitan
Area
Vs. Year Ago Vs. Year Ago Vs. Year Ago Vs. Year Ago Vs. Year Ago
Hampton Roads Area
1,000
2,000
3,000
4,000
5,000
6,000
A-11 D-11 A-12 A-12 D-12 A-13 A-13
$180,000
$190,000
$200,000
$210,000
$220,000
$230,000
$240,000
$250,000
A-11 D-11 A-12 A-12 D-12 A-13 A-13
50
60
70
80
90
100
110
120
A-11 D-11 A-12 A-12 D-12 A-13 A-13
19,000
24,000
29,000
34,000
39,000
44,000
A-11 D-11 A-12 A-12 D-12 A-13 A-13
92.0%
93.0%
94.0%
95.0%
96.0%
97.0%
98.0%
A-11 D-11 A-12 A-12 D-12 A-13 A-13
500
1,000
1,500
2,000
2,500
3,000
3,500
A-11 D-11 A-12 A-12 D-12 A-13 A-13
$160,000
$170,000
$180,000
$190,000
$200,000
$210,000
$220,000
A-11 D-11 A-12 A-12 D-12 A-13 A-13
70
80
90
100
110
120
130
140
150
A-11 D-11 A-12 A-12 D-12 A-13 A-13
8,000
10,000
12,000
14,000
16,000
18,000
20,000
A-11 D-11 A-12 A-12 D-12 A-13 A-13
92.0%
93.0%
94.0%
95.0%
96.0%
97.0%
98.0%
99.0%
A-11 D-11 A-12 A-12 D-12 A-13 A-13
100
600
1,100
1,600
2,100
2,600
A-11 D-11 A-12 A-12 D-12 A-13 A-13
$120,000
$140,000
$160,000
$180,000
$200,000
$220,000
$240,000
A-11 D-11 A-12 A-12 D-12 A-13 A-13
70
80
90
100
110
120
A-11 D-11 A-12 A-12 D-12 A-13 A-13
8,000
9,000
10,000
11,000
12,000
13,000
14,000
A-11 D-11 A-12 A-12 D-12 A-13 A-13
95.0%
95.5%
96.0%
96.5%
97.0%
97.5%
98.0%
A-11 D-11 A-12 A-12 D-12 A-13 A-13
® The Long & Foster Market Conditions Report
5
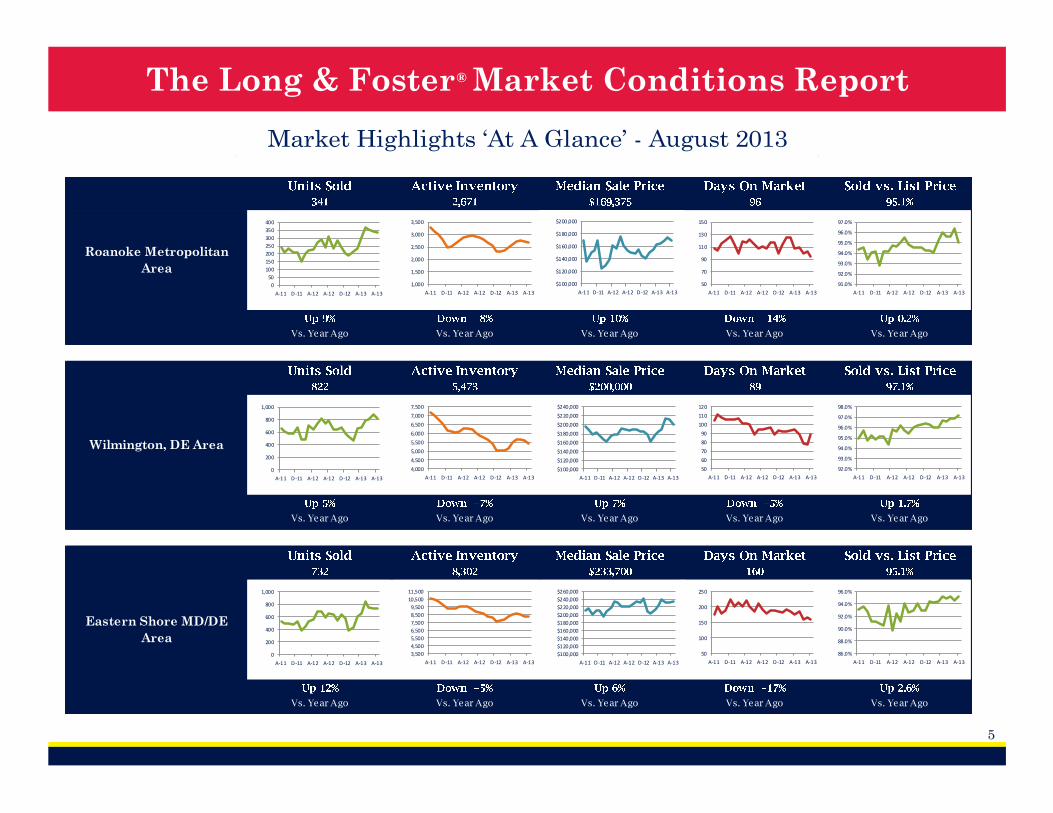
Market Highlights ‘At A Glance’ - August 2013
Eastern Shore MD/DE
Area
Vs. Year Ago Vs. Year Ago Vs. Year Ago Vs. Year Ago Vs. Year Ago
Vs. Year Ago Vs. Year Ago Vs. Year Ago Vs. Year Ago Vs. Year Ago
Roanoke Metropolitan
Area
Vs. Year Ago Vs. Year Ago Vs. Year Ago Vs. Year Ago Vs. Year Ago
Wilmington, DE Area
0
50
100
150
200
250
300
350
400
A-11 D-11 A-12 A-12 D-12 A-13 A-13
$100,000
$120,000
$140,000
$160,000
$180,000
$200,000
A-11 D-11 A-12 A-12 D-12 A-13 A-13
50
70
90
110
130
150
A-11 D-11 A-12 A-12 D-12 A-13 A-13
1,000
1,500
2,000
2,500
3,000
3,500
A-11 D-11 A-12 A-12 D-12 A-13 A-13
91.0%
92.0%
93.0%
94.0%
95.0%
96.0%
97.0%
A-11 D-11 A-12 A-12 D-12 A-13 A-13
0
200
400
600
800
1,000
A-11 D-11 A-12 A-12 D-12 A-13 A-13
$100,000
$120,000
$140,000
$160,000
$180,000
$200,000
$220,000
$240,000
A-11 D-11 A-12 A-12 D-12 A-13 A-13
50
60
70
80
90
100
110
120
A-11 D-11 A-12 A-12 D-12 A-13 A-13
4,000
4,500
5,000
5,500
6,000
6,500
7,000
7,500
A-11 D-11 A-12 A-12 D-12 A-13 A-13
92.0%
93.0%
94.0%
95.0%
96.0%
97.0%
98.0%
A-11 D-11 A-12 A-12 D-12 A-13 A-13
0
200
400
600
800
1,000
A-11 D-11 A-12 A-12 D-12 A-13 A-13
$100,000
$120,000
$140,000
$160,000
$180,000
$200,000
$220,000
$240,000
$260,000
A-11 D-11 A-12 A-12 D-12 A-13 A-13
50
100
150
200
250
A-11 D-11 A-12 A-12 D-12 A-13 A-13
3,500
4,500
5,500
6,500
7,500
8,500
9,500
10,500
11,500
A-11 D-11 A-12 A-12 D-12 A-13 A-13
86.0%
88.0%
90.0%
92.0%
94.0%
96.0%
A-11 D-11 A-12 A-12 D-12 A-13 A-13
® The Long & Foster Market Conditions Report
6
Washington D.C. Metropolitan Area - August 2013
●
●
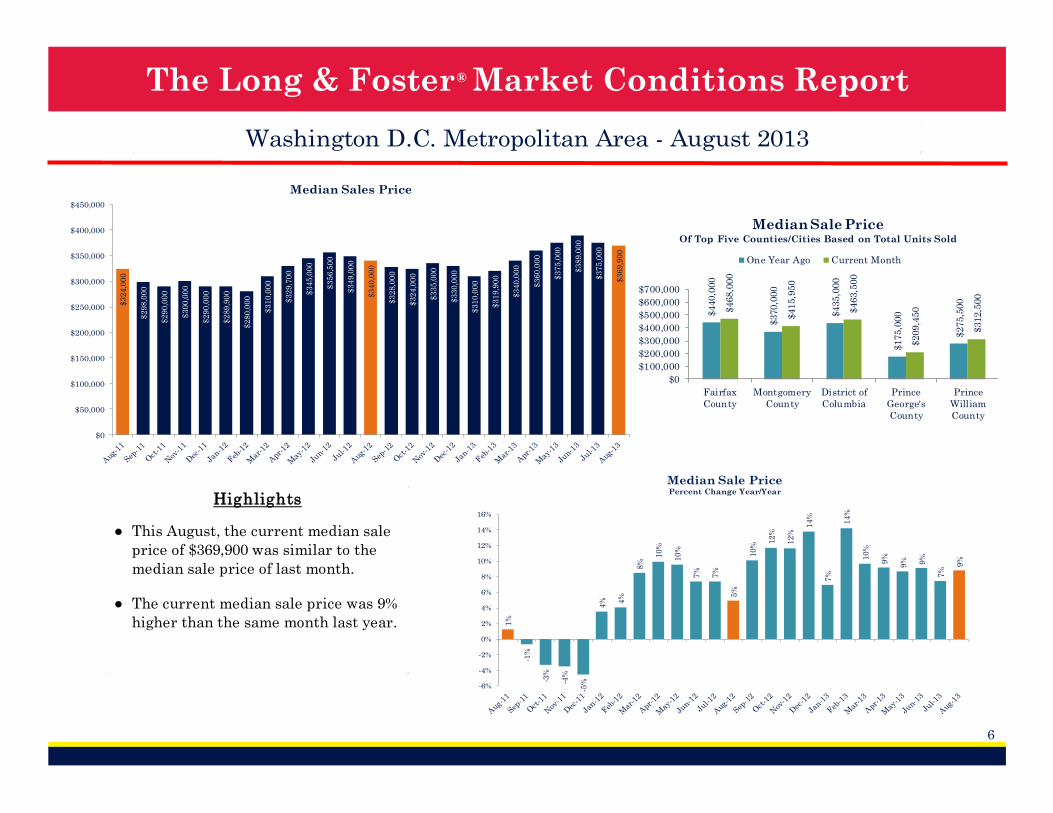
This August, the current median sale
price of $369,900 was similar to the
median sale price of last month.
The current median sale price was 9%
higher than the same month last year.
Highlights
$3
24
,00
0
$2
98
,00
0
$2
90
,00
0
$3
00
,00
0
$2
90
,00
0
$2
89
,90
0
$2
80
,00
0
$3
10
,00
0
$3
29
,70
0
$3
45
,00
0
$3
56
,50
0
$3
49
,00
0
$3
40
,00
0
$3
28
,00
0
$3
24
,00
0
$3
35
,00
0
$3
30
,00
0
$3
10
,00
0
$3
19
,90
0
$3
40
,00
0
$3
60
,00
0
$3
75
,00
0
$3
89
,00
0
$3
75
,00
0
$3
69
,90
0
$0
$50,000
$100,000
$150,000
$200,000
$250,000
$300,000
$350,000
$400,000
$450,000
Median Sales Price
$440,0
00
$370,0
00
$435,0
00
$175,0
00
$275,5
00
$468,0
00
$415,9
50
$463,5
00
$209,4
50
$312,5
00
$0
$100,000
$200,000
$300,000
$400,000
$500,000
$600,000
$700,000
Fairfax
County
Montgomery
County
District of
Columbia
Prince
George's
County
Prince
William
County
Median Sale PriceOf Top Five Counties/Cities Based on Total Units Sold
One Year Ago Current Month
1%
-1%
-3%
-4%
-5%
4% 4
%
8%
10
%
10
%
7%
7%
5%
10
%
12
%
12
%
14
%
7%
14
%
10
%
9%
9% 9%
7%
9%
-6%
-4%
-2%
0%
2%
4%
6%
8%
10%
12%
14%
16%
Median Sale PricePercent Change Year/Year
® The Long & Foster Market Conditions Report
7
Washington D.C. Metropolitan Area - August 2013
6,1
58
5,1
14
4,6
14
4,6
83
5,0
87
3,8
22
4,2
30
5,3
29 5,9
01
6,9
68
7,3
80
6,6
09
6,6
57
5,3
56
5,3
36 5,8
61
5,3
88
4,1
96
4,3
46
5,7
30
6,4
88
7,8
70
8,2
19
7,8
44
7,2
53
0
1,000
2,000
3,000
4,000
5,000
6,000
7,000
8,000
9,000
Total Units Sold
1,4
12
977
645 779
627
1,4
98
1,1
20
760
716
626
0
200
400
600
800
1,000
1,200
1,400
1,600
Fairfax
County
Montgomery
County
District of
Columbia
Prince
George's
County
Prince
William
County
Total Units SoldOf Top Five Counties/Cities Based on Total Units
Sold
One Year Ago Current Month
●
●
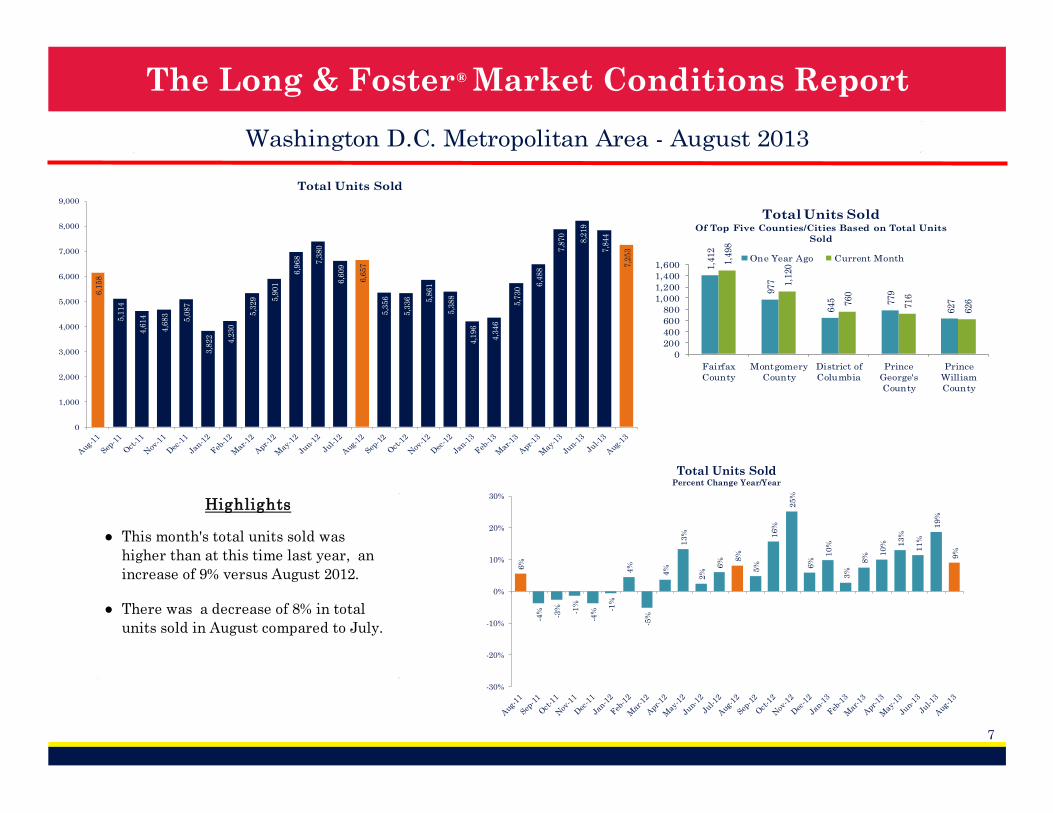
This month's total units sold was
higher than at this time last year, an
increase of 9% versus August 2012.
There was a decrease of 8% in total
units sold in August compared to July.
Highlights6
%
-4% -3% -1%
-4% -1
%
4%
-5%
4%
13
%
2%
6% 8
%
5%
16
%
25
%
6%
10
%
3%
8% 1
0% 1
3%
11
%
19
%
9%
-30%
-20%
-10%
0%
10%
20%
30%
Total Units SoldPercent Change Year/Year
® The Long & Foster Market Conditions Report
8
Washington D.C. Metropolitan Area - August 2013
0
1,000
2,000
3,000
4,000
5,000
6,000
7,000
8,000
9,000
Total Units Sold by Type
Detached Attached Condo
3,960
55%2,135
29%
1,158
16%
Total Units Sold by TypeCurrent Month
Detached Attached Condo
562
8%
2,042
28%
2,082
29%
1,132
15%
1,435
20%
Total Units Sold by Price RangeCurrent Month
< 150K 150K to < 300K 300K to < 450K
450K to < 600K 600K and up
0
500
1,000
1,500
2,000
2,500
Total Units Sold by Price Range
< 150K 150K to < 300K 300K to < 450K 450K to < 600K 600K and up
® The Long & Foster Market Conditions Report
9
Washington D.C. Metropolitan Area - August 2013
27
,55
5
27
,97
0
26
,55
1
24
,33
8
21
,33
0
20
,35
3
20
,34
7
21
,70
3
22
,52
7
22
,25
6
21
,89
4
20
,55
0
19
,23
6
19
,36
4
18
,38
0
16
,84
2
14
,93
5
14
,52
9
14
,72
5
15
,47
7
17
,07
1
18
,66
7
18
,69
2
18
,39
2
17
,37
4
0
5,000
10,000
15,000
20,000
25,000
30,000
Total Active Inventory
2,8
44
2,7
17
1,5
43 3
,082
1,3
432,6
82
2,3
40
1,2
07
1,9
35
1,3
71
0
1,000
2,000
3,000
4,000
5,000
6,000
7,000
Fairfax
County
Montgomery
County
District of
Columbia
Prince
George's
County
Prince
William
County
Total Active InventoryOf Top Five Counties/Cities Based on Total Units Sold
One Year Ago Current Month
-10
%
-11
%
-15
%
-17
%
-23
%
-24
%
-23
%
-22
%
-23
%
-24
%
-25
%
-27
%
-30
%
-31
%
-31
%
-31
%
-30
%
-29
%
-28
%
-29
%
-24
%
-16
%
-15
%
-11
%
-10
%
-45%
-40%
-35%
-30%
-25%
-20%
-15%
-10%
-5%
0%
Total Active InventoryPercent Change Year/Year
●
●
Highlights
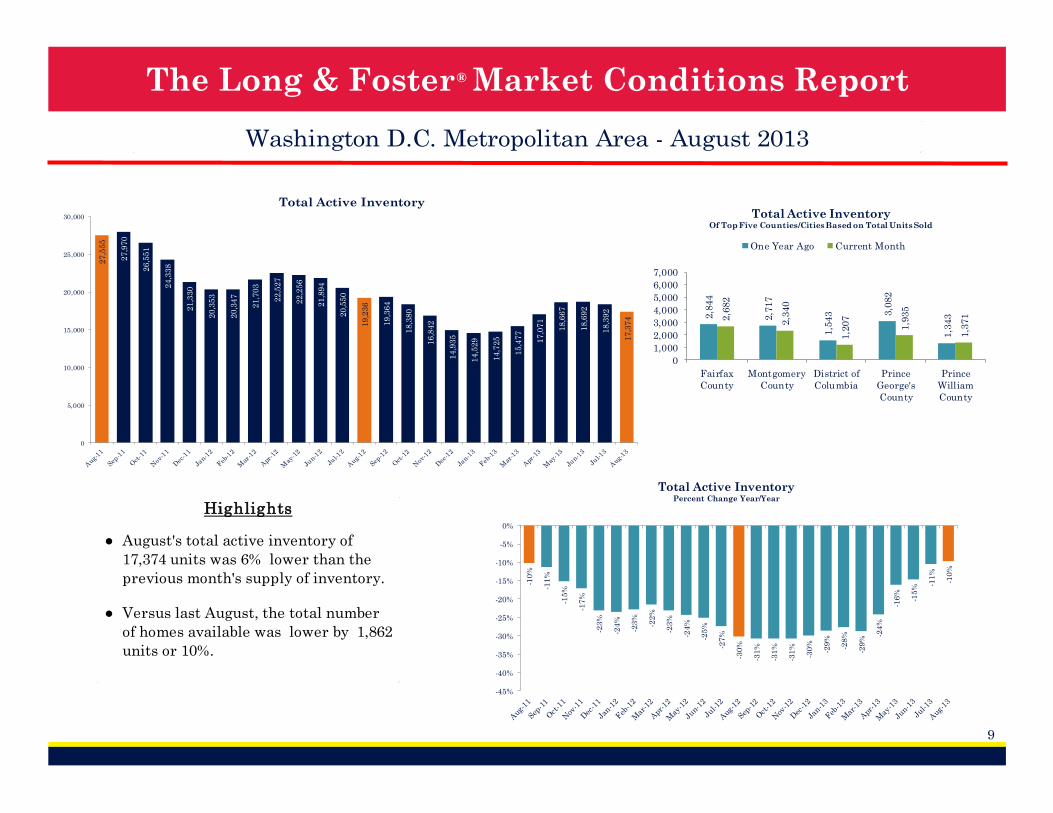
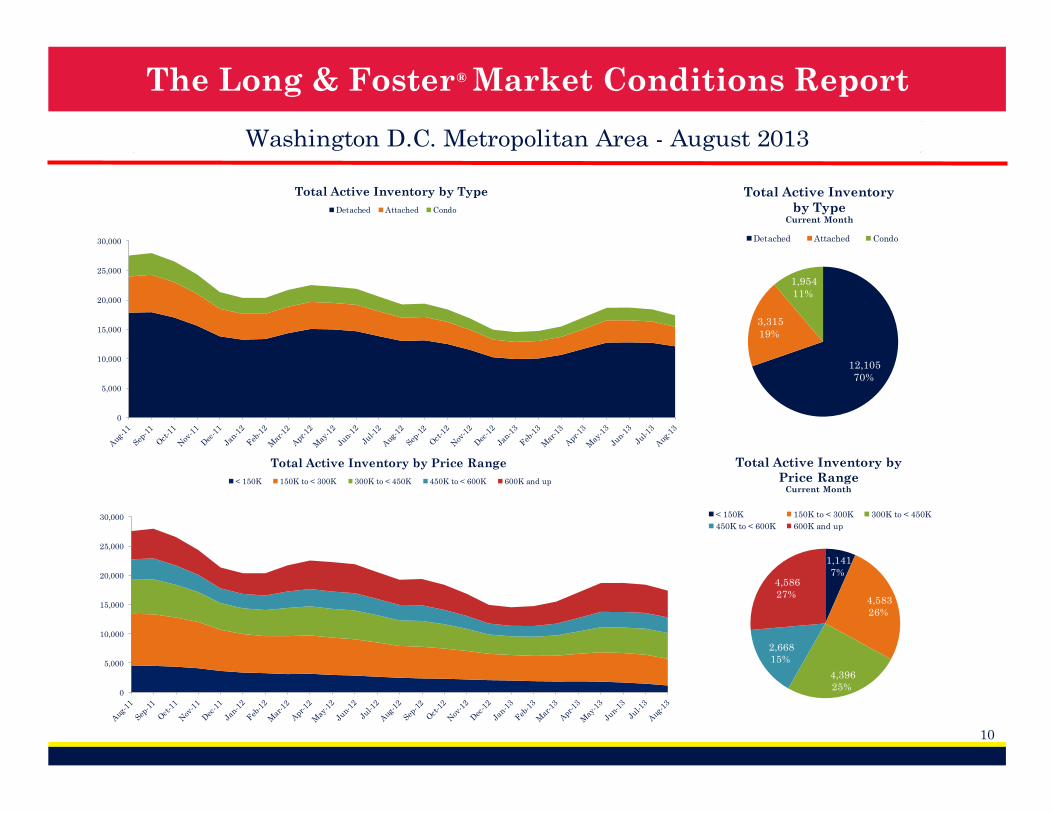
August's total active inventory of
17,374 units was 6% lower than the
previous month's supply of inventory.
Versus last August, the total number
of homes available was lower by 1,862
units or 10%.
® The Long & Foster Market Conditions Report
10
Washington D.C. Metropolitan Area - August 2013
0
5,000
10,000
15,000
20,000
25,000
30,000
Total Active Inventory by Type
Detached Attached Condo
12,105
70%
3,315
19%
1,954
11%
Total Active Inventory
by TypeCurrent Month
Detached Attached Condo
1,141
7%
4,583
26%
4,396
25%
2,668
15%
4,586
27%
Total Active Inventory by
Price RangeCurrent Month
< 150K 150K to < 300K 300K to < 450K
450K to < 600K 600K and up
0
5,000
10,000
15,000
20,000
25,000
30,000
Total Active Inventory by Price Range
< 150K 150K to < 300K 300K to < 450K 450K to < 600K 600K and up
® The Long & Foster Market Conditions Report
11
Washington D.C. Metropolitan Area - August 2013
97
.5%
97
.5%
97
.5%
97
.4%
97
.1%
97
.1%
97
.6%
97
.6%
98
.1%
98
.2%
98
.2%
98
.1%
98
.0%
98
.0%
98
.0%
97
.8% 98
.0%
97
.8%
98
.3%
98
.2%
99
.0%
99
.1% 99
.3%
98
.9%
98
.9%
95.5%
96.0%
96.5%
97.0%
97.5%
98.0%
98.5%
99.0%
99.5%
Average Sale Price as a Percent of List Price
97.9
%
97.4
% 98.6
%
98.2
%
98.7
%
98.7
%
98.7
% 99.7
%
99.4
%
98.9
%
96.0%
97.0%
98.0%
99.0%
100.0%
Fairfax
County
Montgomery
County
District of
Columbia
Prince
George's
County
Prince
William
County
Sale Price as % of List PriceOf Top Five Counties/Cities Based on Total Units
Sold
One Year Ago Current Month
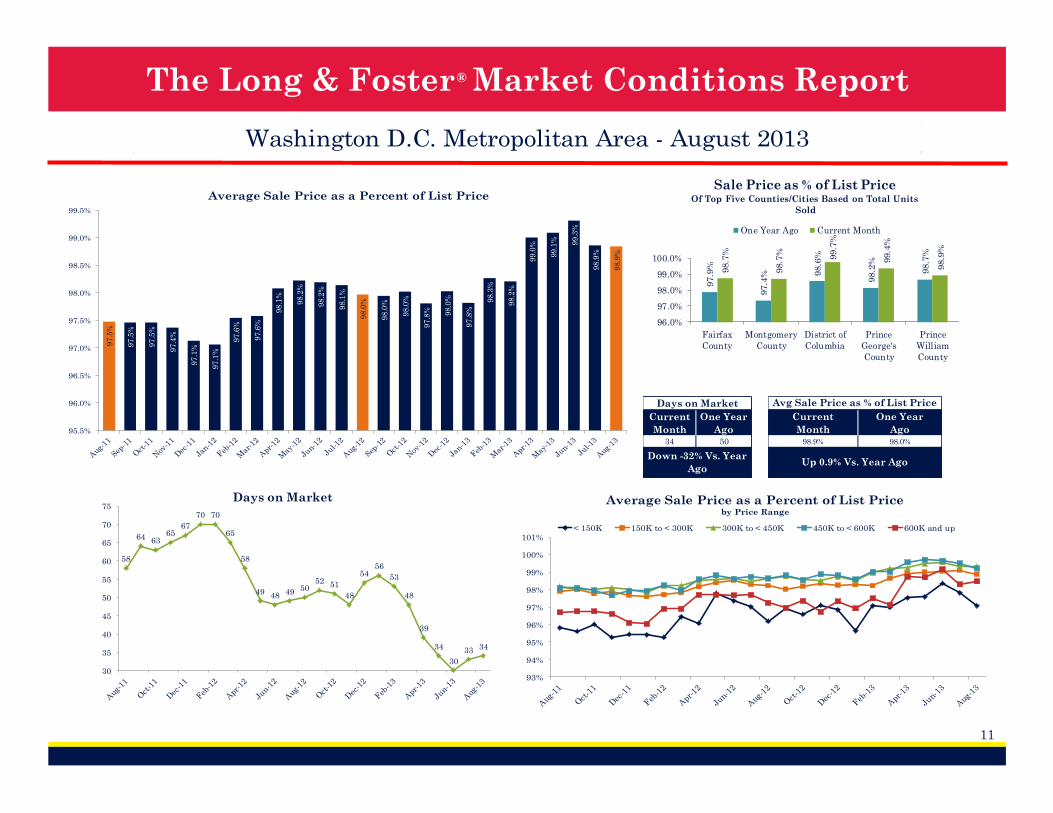
Days on Market
Current
Month
One Year
Ago34 50
Down -32% Vs. Year
Ago
Avg Sale Price as % of List Price
Current
Month
One Year
Ago98.9% 98.0%
Up 0.9% Vs. Year Ago
93%
94%
95%
96%
97%
98%
99%
100%
101%
Average Sale Price as a Percent of List Price by Price Range
< 150K 150K to < 300K 300K to < 450K 450K to < 600K 600K and up
58
64 6365
67
70 70
65
58
49 48 49 5052 51
48
5456
53
48
39
34
30
33 34
30
35
40
45
50
55
60
65
70
75Days on Market
® The Long & Foster Market Conditions Report
12
Washington D.C. Metropolitan Area - August 2013$
2,4
27
,25
5
$1
,90
0,1
69
$1
,63
7,7
62
$1
,71
9,4
30
$1
,85
9,1
61
$1
,36
6,9
05
$1
,46
8,9
03
$2
,01
6,6
43
$2
,31
4,4
33
$2
,90
8,4
85
$3
,11
7,0
97
$2
,78
6,3
62
$2
,71
7,0
39
$2
,11
4,9
64
$2
,04
1,9
36
$2
,38
8,8
31
$2
,23
8,9
30
$1
,58
1,0
28
$1
,66
3,4
47 $
2,3
71
,55
3
$2
,75
7,6
72
$3
,55
5,8
71
$3
,80
3,4
63
$3
,53
8,5
09
$3
,16
6,4
71
$0
$500,000
$1,000,000
$1,500,000
$2,000,000
$2,500,000
$3,000,000
$3,500,000
$4,000,000
Total Dollar Volume SoldIn Thousands
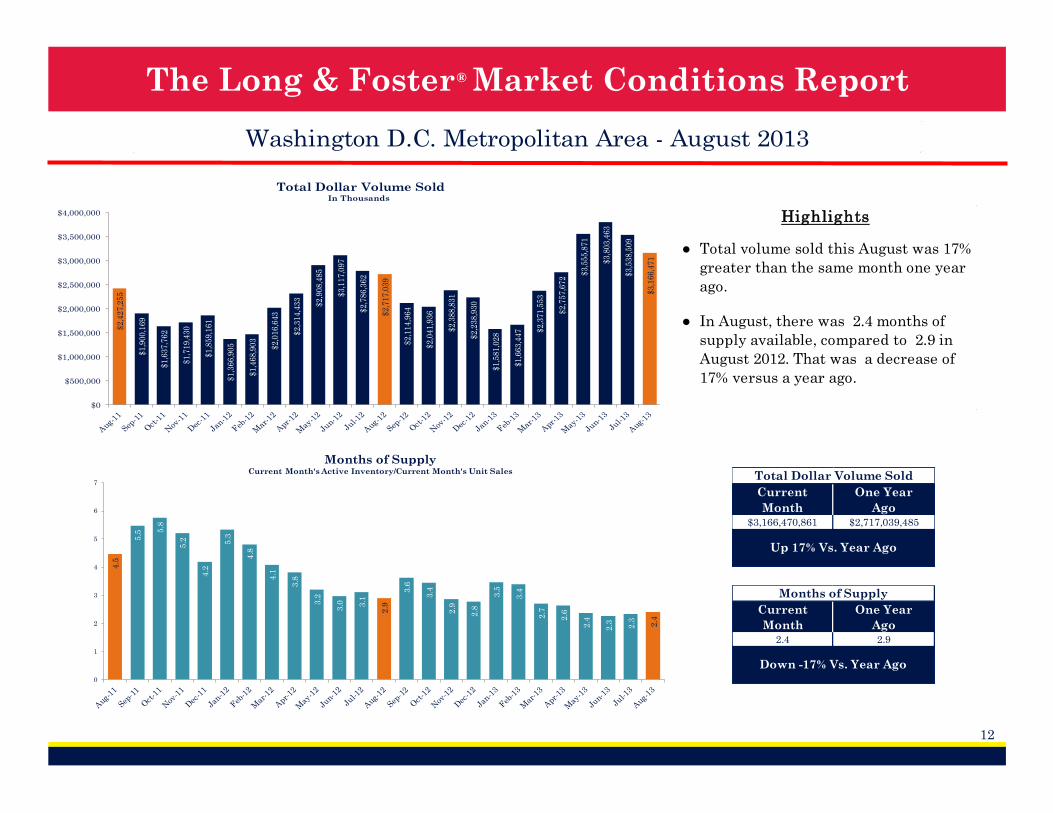
Total Dollar Volume Sold
Current
Month
One Year
Ago$3,166,470,861 $2,717,039,485
Up 17% Vs. Year Ago
Months of Supply
Current
Month
One Year
Ago2.4 2.9
Down -17% Vs. Year Ago
4.5
5.5 5
.8
5.2
4.2
5.3
4.8
4.1
3.8
3.2
3.0 3.1
2.9
3.6
3.4
2.9
2.8
3.5
3.4
2.7
2.6
2.4
2.3 2.3 2.4
0
1
2
3
4
5
6
7
Months of SupplyCurrent Month's Active Inventory/Current Month's Unit Sales
●
● In August, there was 2.4 months of
supply available, compared to 2.9 in
August 2012. That was a decrease of
17% versus a year ago.
Highlights
Total volume sold this August was 17%
greater than the same month one year
ago.
® The Long & Foster Market Conditions Report
13
Washington D.C. Metropolitan Area - August 2013
7,7
56
8,2
32
7,2
83
5,8
71
4,5
11
6,9
59
7,8
45
10
,75
2
9,8
94
9,5
29
8,7
78
7,5
66
7,7
33
7,9
29
7,3
74
5,6
44
4,1
92
6,5
61
7,3
56
9,4
07
11
,40
3
11
,54
7
9,7
99
9,4
81
8,8
58
5,2
08
4,6
22
5,0
76
4,4
81
3,9
83 4,8
81
5,6
46 7
,09
4
7,1
57
7,0
15
6,4
08
5,9
13
5,7
91
5,2
88
5,6
87
4,7
93
4,0
98 5,1
60
5,6
98 7
,13
6 8,2
90
7,9
98
7,5
22
7,2
29
6,9
24
0
2,000
4,000
6,000
8,000
10,000
12,000
14,000
New Listings & New Contracts
New Listings New Contracts (Under Active Contract Status)
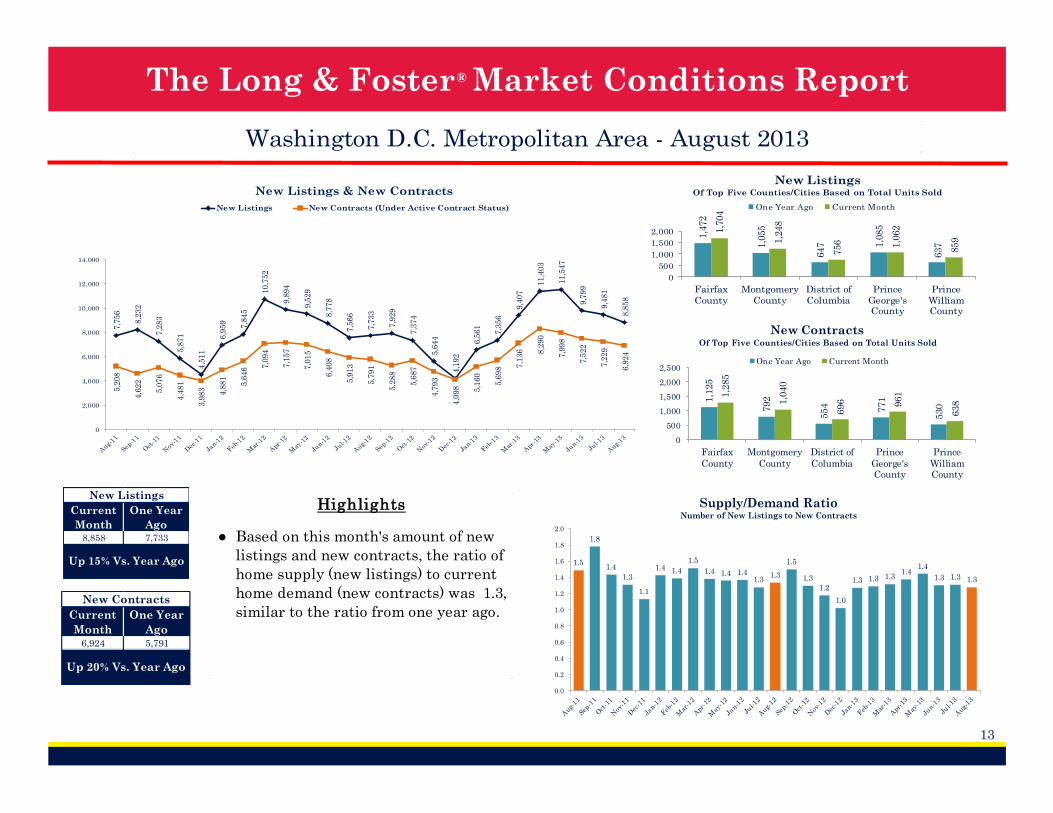
New Listings
Current
Month
One Year
Ago8,858 7,733
Up 15% Vs. Year Ago
New Contracts
Current
Month
One Year
Ago6,924 5,791
Up 20% Vs. Year Ago
1.5
1.8
1.4
1.3
1.1
1.4 1.4
1.5
1.4 1.4 1.41.3
1.3
1.5
1.3
1.2
1.0
1.3 1.3 1.31.4
1.4
1.3 1.3 1.3
0.0
0.2
0.4
0.6
0.8
1.0
1.2
1.4
1.6
1.8
2.0
Supply/Demand RatioNumber of New Listings to New Contracts
1,4
72
1,0
55
647 1
,085
637
1,7
04
1,2
48
756 1,0
62
859
0
500
1,000
1,500
2,000
Fairfax
County
Montgomery
County
District of
Columbia
Prince
George'sCounty
Prince
WilliamCounty
New ListingsOf Top Five Counties/Cities Based on Total Units Sold
One Year Ago Current Month
1,1
25
792
554 771
530
1,2
85
1,0
40
696 961
638
0
500
1,000
1,500
2,000
2,500
Fairfax
County
Montgomery
County
District of
Columbia
Prince
George'sCounty
Prince
WilliamCounty
New ContractsOf Top Five Counties/Cities Based on Total Units Sold
One Year Ago Current Month
● Based on this month's amount of new
listings and new contracts, the ratio of
home supply (new listings) to current
home demand (new contracts) was 1.3,
similar to the ratio from one year ago.
Highlights
® The Long & Foster Market Conditions Report
14
Baltimore Metropolitan Area - August 2013
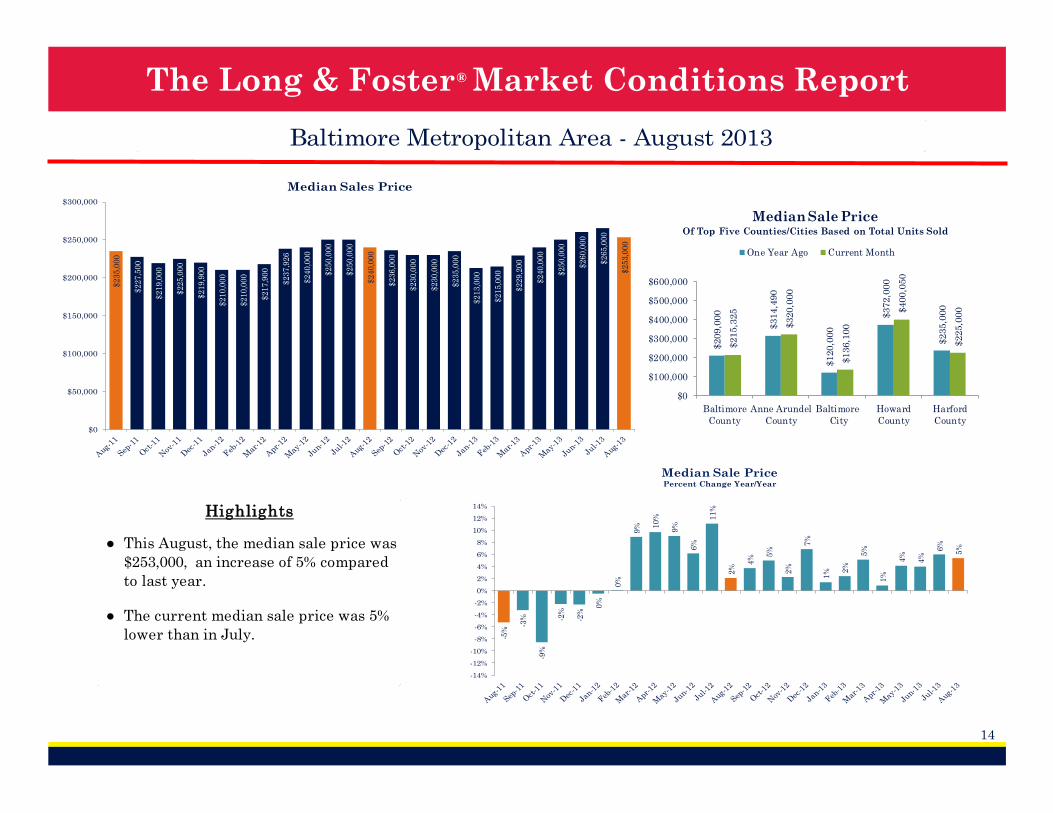
●
● The current median sale price was 5%
lower than in July.
This August, the median sale price was
$253,000, an increase of 5% compared
to last year.
Highlights
$2
35
,00
0
$2
27
,50
0
$2
19
,00
0
$2
25
,00
0
$2
19
,90
0
$2
10
,00
0
$2
10
,00
0
$2
17
,90
0
$2
37
,92
6
$2
40
,00
0
$2
50
,00
0
$2
50
,00
0
$2
40
,00
0
$2
36
,00
0
$2
30
,00
0
$2
30
,00
0
$2
35
,00
0
$2
13
,00
0
$2
15
,00
0
$2
29
,20
0
$2
40
,00
0
$2
50
,00
0
$2
60
,00
0
$2
65
,00
0
$2
53
,00
0
$0
$50,000
$100,000
$150,000
$200,000
$250,000
$300,000
Median Sales Price
$209,0
00
$314,4
90
$120,0
00
$372,0
00
$235,0
00
$215,3
25
$320,0
00
$136,1
00
$400,0
50
$225,0
00
$0
$100,000
$200,000
$300,000
$400,000
$500,000
$600,000
Baltimore
County
Anne Arundel
County
Baltimore
City
Howard
County
Harford
County
Median Sale PriceOf Top Five Counties/Cities Based on Total Units Sold
One Year Ago Current Month
-5%
-3%
-9%
-2%
-2%
0%
0%
9% 1
0%
9%
6%
11
%
2%
4% 5
%
2%
7%
1% 2
%
5%
1%
4%
4%
6%
5%
-14%
-12%
-10%
-8%
-6%
-4%
-2%
0%
2%
4%
6%
8%
10%
12%
14%
Median Sale PricePercent Change Year/Year
® The Long & Foster Market Conditions Report
15
Baltimore Metropolitan Area - August 2013
2,1
83
2,0
05
1,7
12
1,7
69
1,8
56
1,4
26
1,5
61
2,0
28
2,1
34
2,5
16 2,7
18
2,4
65
2,5
51
2,1
95
2,0
71 2,2
37
2,0
66
1,6
42
1,5
65
2,0
88
2,4
41
2,9
26
3,2
64
3,1
52
2,9
06
0
500
1,000
1,500
2,000
2,500
3,000
3,500
Total Units Sold
705
563
501
336
236
776
690
607
320
271
0
400
800
1,200
Baltimore
County
Anne Arundel
County
Baltimore
City
Howard
County
Harford
County
Total Units SoldOf Top Five Counties/Cities Based on Total Units
Sold
One Year Ago Current Month
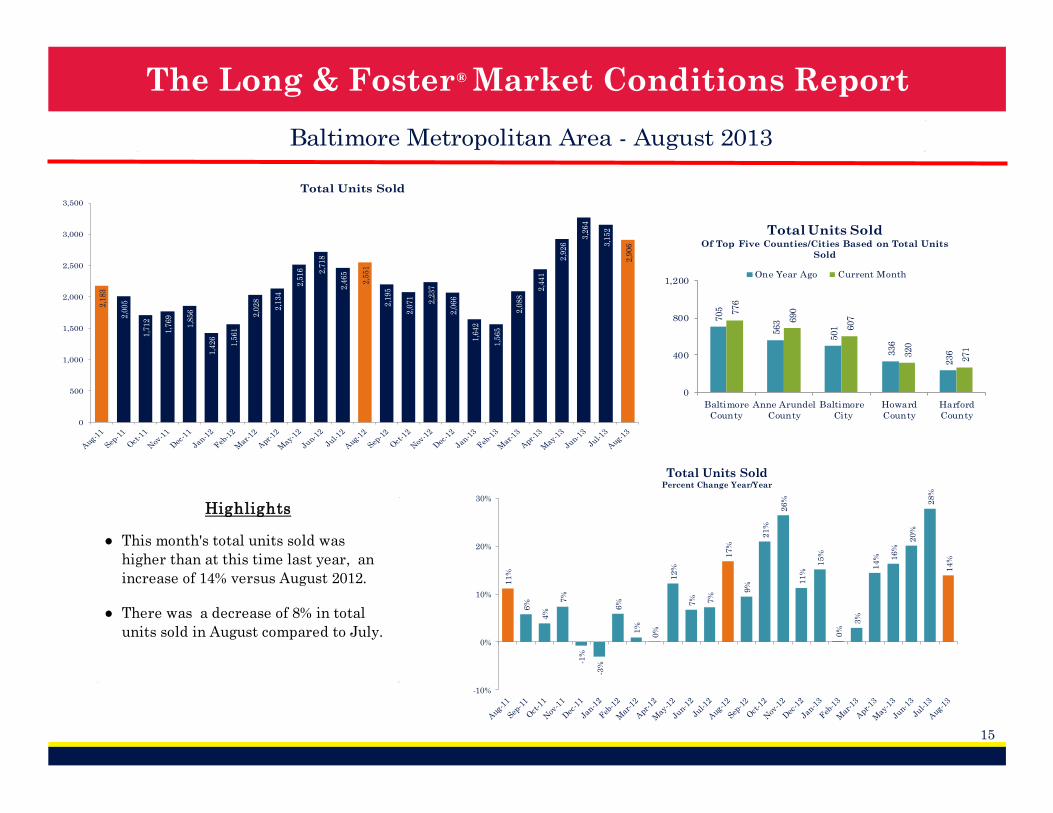
●
● There was a decrease of 8% in total
units sold in August compared to July.
Highlights
This month's total units sold was
higher than at this time last year, an
increase of 14% versus August 2012. 11
%
6%
4%
7%
-1%
-3%
6%
1%
0%
12
%
7% 7%
17
%
9%
21
%
26
%
11
%
15
%
0%
3%
14
% 16
%
20
%
28
%
14
%
-10%
0%
10%
20%
30%
Total Units SoldPercent Change Year/Year
® The Long & Foster Market Conditions Report
16
Baltimore Metropolitan Area - August 2013
0
500
1,000
1,500
2,000
2,500
3,000
3,500
Total Units Sold by Type
Detached Attached Condo
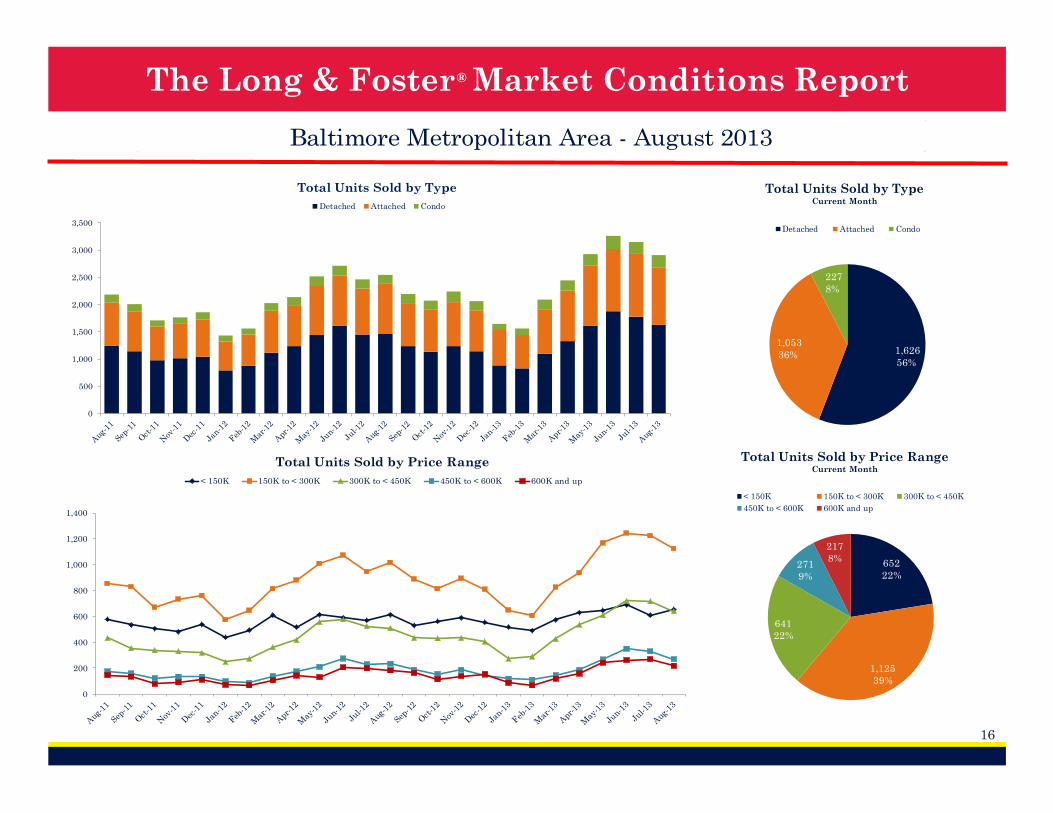
1,626
56%
1,053
36%
227
8%
Total Units Sold by TypeCurrent Month
Detached Attached Condo
652
22%
1,125
39%
641
22%
271
9%
217
8%
Total Units Sold by Price RangeCurrent Month
< 150K 150K to < 300K 300K to < 450K
450K to < 600K 600K and up
0
200
400
600
800
1,000
1,200
1,400
Total Units Sold by Price Range
< 150K 150K to < 300K 300K to < 450K 450K to < 600K 600K and up
® The Long & Foster Market Conditions Report
17
Baltimore Metropolitan Area - August 2013
18
,21
3
17
,94
2
17
,32
0
16
,02
9
14
,41
4
13
,81
4
13
,72
6
14
,20
6
14
,83
0
14
,86
1
14
,69
9
14
,23
0
13
,69
3
13
,53
1
13
,16
7
12
,31
8
11
,29
1
11
,10
0
11
,28
2
11
,70
9
12
,69
5
13
,19
6
13
,26
3
13
,02
3
12
,45
2
0
2,000
4,000
6,000
8,000
10,000
12,000
14,000
16,000
18,000
20,000
Total Active Inventory
3,2
27
2,8
94
3,4
75
1,1
69
1,3
912
,903
2,6
76
3,0
84
1,0
12
1,2
75
0
1,000
2,000
3,000
4,000
5,000
6,000
Baltimore
County
Anne
Arundel
County
Baltimore
City
Howard
County
Harford
County
Total Active InventoryOf Top Five Counties/Cities Based on Total Units Sold
One Year Ago Current Month
-12
%
-14
%
-15
%
-18
%
-23
%
-23
%
-23
%
-22
%
-21
%
-22
%
-23
%
-24
%
-25
%
-25
%
-24
%
-23
%
-22
% -20
% -18
%
-18
% -14
%
-11
%
-10
% -8%
-9%
-35%
-30%
-25%
-20%
-15%
-10%
-5%
0%
Total Active InventoryPercent Change Year/Year
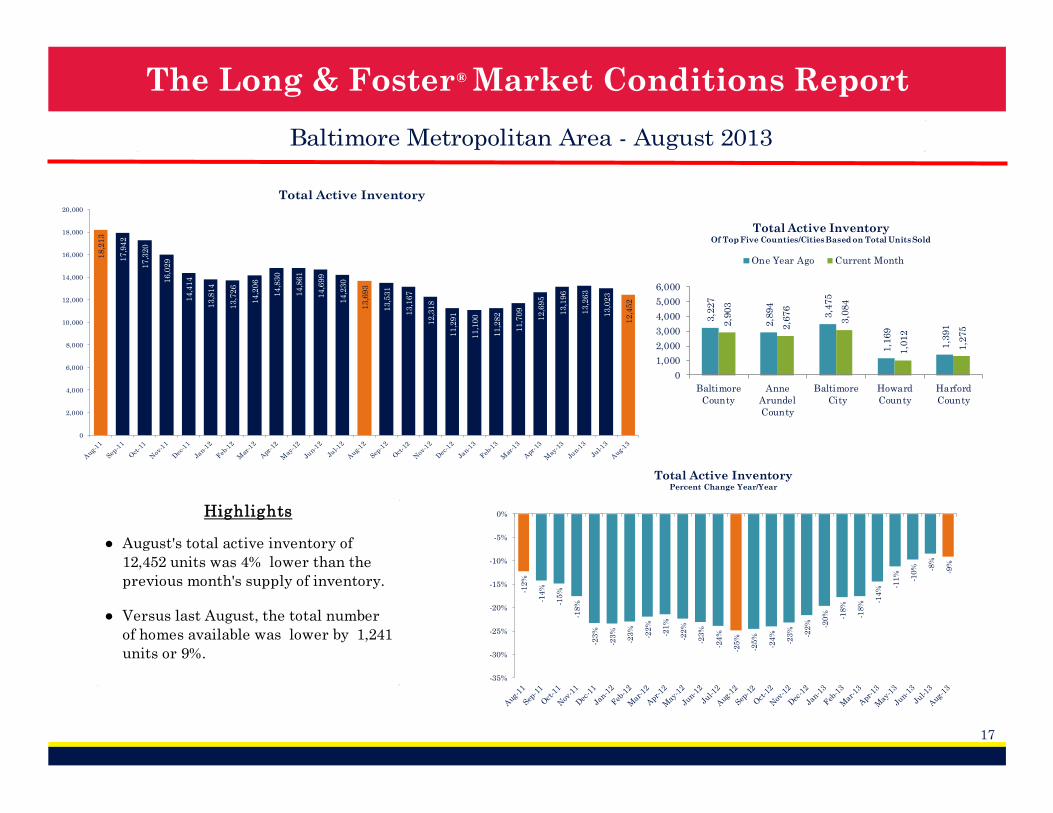
●
● Versus last August, the total number
of homes available was lower by 1,241
units or 9%.
Highlights
August's total active inventory of
12,452 units was 4% lower than the
previous month's supply of inventory.
® The Long & Foster Market Conditions Report
18
Baltimore Metropolitan Area - August 2013
0
2,000
4,000
6,000
8,000
10,000
12,000
14,000
16,000
18,000
20,000
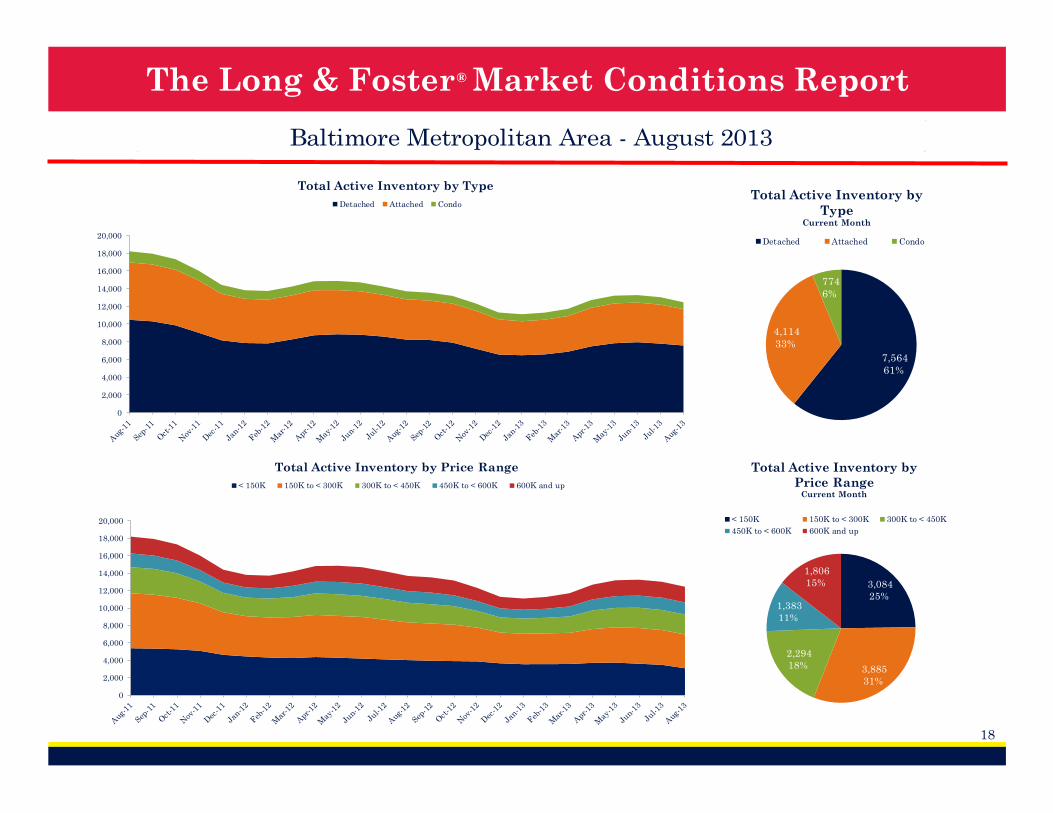
Total Active Inventory by Type
Detached Attached Condo
7,564
61%
4,114
33%
774
6%
Total Active Inventory by
TypeCurrent Month
Detached Attached Condo
3,084
25%
3,885
31%
2,294
18%
1,383
11%
1,806
15%
Total Active Inventory by
Price RangeCurrent Month
< 150K 150K to < 300K 300K to < 450K
450K to < 600K 600K and up
0
2,000
4,000
6,000
8,000
10,000
12,000
14,000
16,000
18,000
20,000
Total Active Inventory by Price Range
< 150K 150K to < 300K 300K to < 450K 450K to < 600K 600K and up
® The Long & Foster Market Conditions Report
19
Baltimore Metropolitan Area - August 2013
95
.8%
95
.6%
95
.6%
95
.6%
95
.3%
95
.5%
95
.1%
95
.8%
95
.5%
96
.4%
96
.4% 9
6.8
%
96
.7%
96
.2%
96
.8%
96
.8%
96
.7%
96
.5% 9
6.9
%
96
.8% 97
.1%
97
.6% 97
.8%
97
.6%
97
.4%
93.5%
94.0%
94.5%
95.0%
95.5%
96.0%
96.5%
97.0%
97.5%
98.0%
98.5%
Average Sale Price as a Percent of List Price
96.4
%
96.6
%
96.0
% 97.9
%
96.8
%
97.2
%
97.3
%
96.8
% 98.8
%
97.2
%
93.0%
94.0%
95.0%
96.0%
97.0%
98.0%
99.0%
100.0%
Baltimore
County
Anne
Arundel
County
Baltimore
City
Howard
County
Harford
County
Sale Price as % of List PriceOf Top Five Counties/Cities Based on Total Units
Sold
One Year Ago Current Month
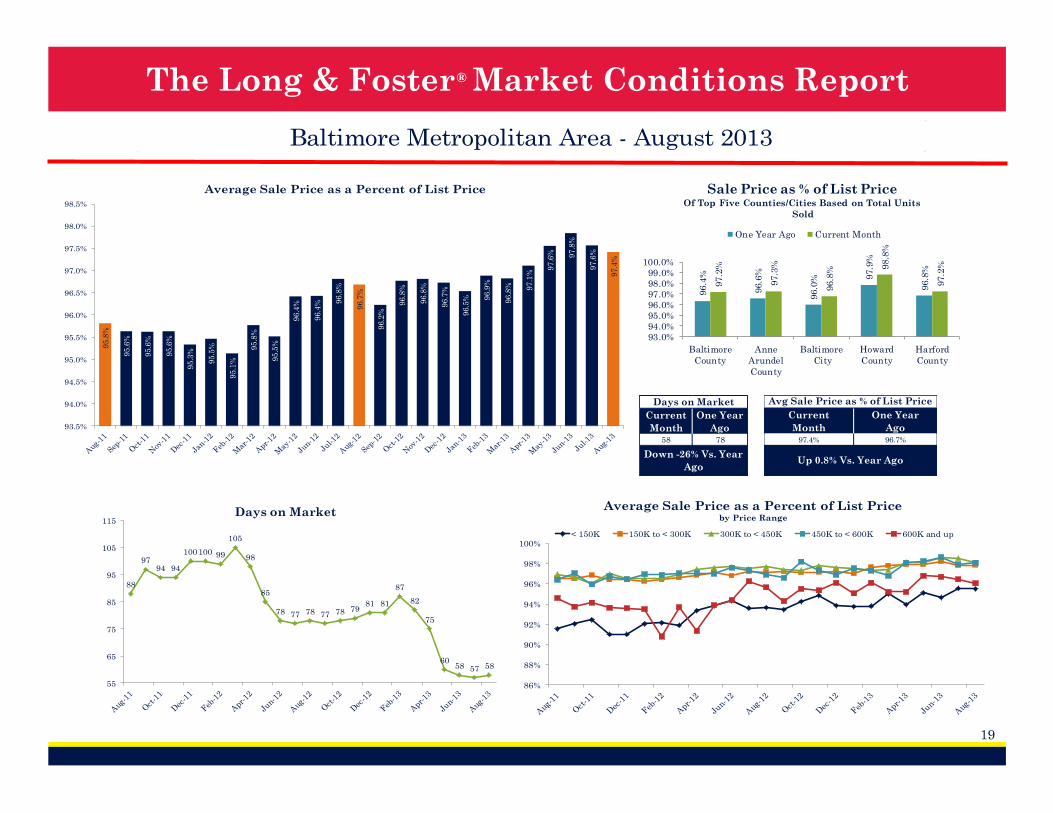
Days on Market
Current
Month
One Year
Ago58 78
Down -26% Vs. Year
Ago
Avg Sale Price as % of List Price
Current
Month
One Year
Ago97.4% 96.7%
Up 0.8% Vs. Year Ago
86%
88%
90%
92%
94%
96%
98%
100%
Average Sale Price as a Percent of List Price by Price Range
< 150K 150K to < 300K 300K to < 450K 450K to < 600K 600K and up
88
9794 94
100100 99
105
98
85
78 77 78 77 78 7981 81
87
82
75
6058 57 58
55
65
75
85
95
105
115Days on Market
® The Long & Foster Market Conditions Report
20
Baltimore Metropolitan Area - August 2013$6
06,4
41
$547
,438
$437
,511
$464
,704
$494
,423
$365
,176
$380
,189 $5
12,8
51
$610
,833
$702
,631 $8
22,4
70
$729
,549
$724
,948
$624
,351
$554
,957
$610
,219
$579
,587
$409
,096
$391
,588 $5
56,7
09 $692
,507
$871
,868
$986
,288
$982
,135
$855
,641
$0
$200,000
$400,000
$600,000
$800,000
$1,000,000
$1,200,000
Total Dollar Volume SoldIn Thousands
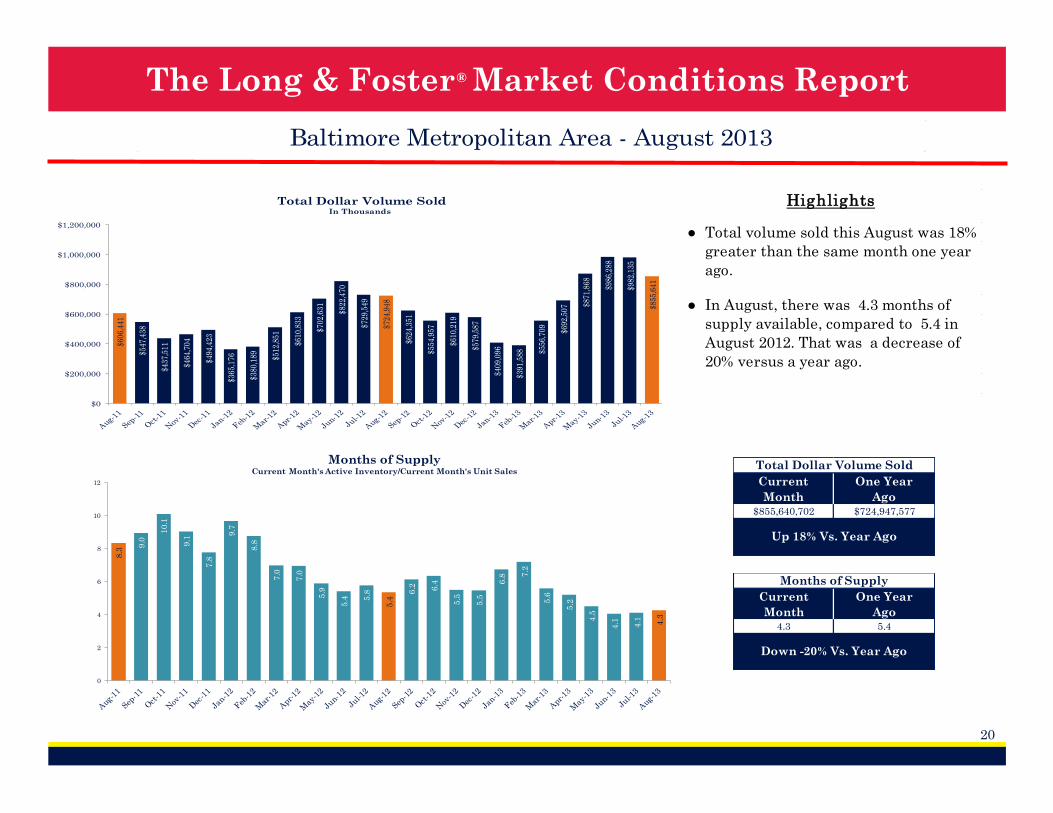
Total Dollar Volume Sold
Current
Month
One Year
Ago$855,640,702 $724,947,577
Up 18% Vs. Year Ago
Months of Supply
Current
Month
One Year
Ago4.3 5.4
Down -20% Vs. Year Ago
8.3
9.0
10
.1
9.1
7.8
9.7
8.8
7.0
7.0
5.9
5.4 5
.8
5.4
6.2 6.4
5.5
5.5
6.8 7
.2
5.6
5.2
4.5
4.1 4.1 4.3
0
2
4
6
8
10
12
Months of SupplyCurrent Month's Active Inventory/Current Month's Unit Sales
●
●
Highlights
Total volume sold this August was 18%
greater than the same month one year
ago.
In August, there was 4.3 months of
supply available, compared to 5.4 in
August 2012. That was a decrease of
20% versus a year ago.
® The Long & Foster Market Conditions Report
21
Baltimore Metropolitan Area - August 20133
,49
9
3,3
51
3,3
55
2,5
62
1,8
89
2,9
50 3,3
61
4,4
25
4,3
23
4,1
29
3,8
92
3,5
94
3,6
10
3,3
35
3,2
89
2,6
27
1,9
05
3,1
36
3,2
89
4,2
91
5,1
23
4,9
58
4,4
23
4,3
48
4,2
00
2,0
06
1,7
23
1,8
95
1,7
54
1,4
34
1,7
77
2,0
90 2
,65
2
2,5
51
2,6
14
2,4
58
2,4
22
2,3
78
2,0
42
2,2
03
1,8
72
1,5
42 2,0
01
2,1
27
2,8
53
3,2
26
3,3
01
2,9
93
2,9
83
2,9
54
0
1,000
2,000
3,000
4,000
5,000
6,000
New Listings & New Contracts
New Listings New Contracts (Under Active Contract Status)
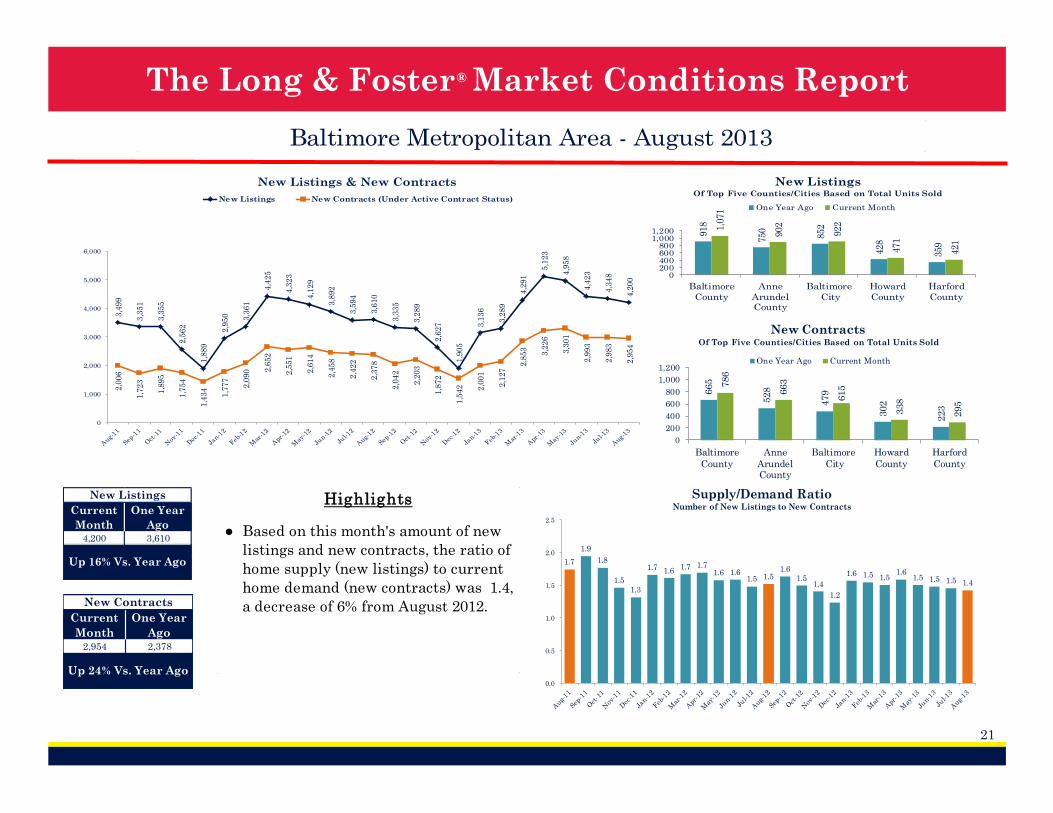
New Listings
Current
Month
One Year
Ago4,200 3,610
Up 16% Vs. Year Ago
New Contracts
Current
Month
One Year
Ago2,954 2,378
Up 24% Vs. Year Ago
1.7
1.9
1.8
1.51.3
1.7 1.61.7 1.7
1.6 1.61.5 1.5
1.61.5
1.4
1.2
1.6 1.5 1.51.6
1.5 1.5 1.5 1.4
0.0
0.5
1.0
1.5
2.0
2.5
Supply/Demand RatioNumber of New Listings to New Contracts
918
750
852
428
359
1,0
71
902
922
471
421
0200400600800
1,0001,200
Baltimore
County
Anne
ArundelCounty
Baltimore
City
Howard
County
Harford
County
New ListingsOf Top Five Counties/Cities Based on Total Units Sold
One Year Ago Current Month
665
528
479
302
223
786
663
615
338
295
0
200
400
600
800
1,000
1,200
Baltimore
County
Anne
ArundelCounty
Baltimore
City
Howard
County
Harford
County
New ContractsOf Top Five Counties/Cities Based on Total Units Sold
One Year Ago Current Month
● Based on this month's amount of new
listings and new contracts, the ratio of
home supply (new listings) to current
home demand (new contracts) was 1.4,
a decrease of 6% from August 2012.
Highlights
® The Long & Foster Market Conditions Report
22
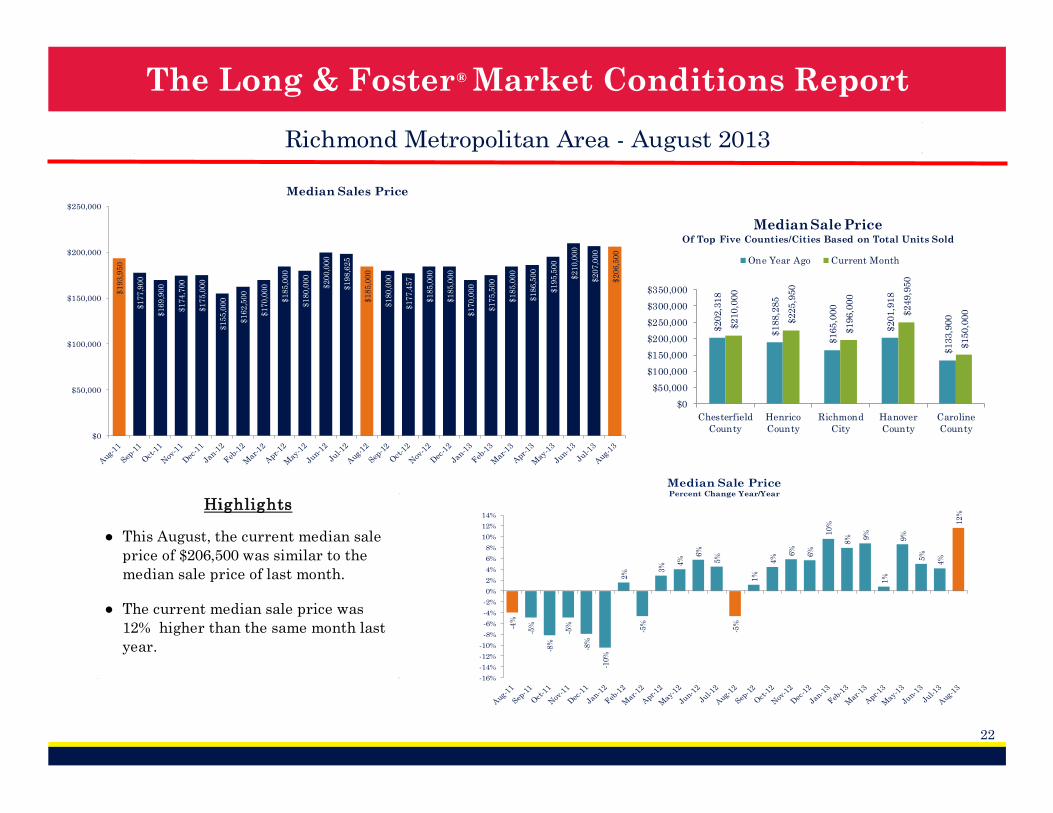
Richmond Metropolitan Area - August 2013
●
● The current median sale price was
12% higher than the same month last
year.
This August, the current median sale
price of $206,500 was similar to the
median sale price of last month.
Highlights
$1
93
,95
0
$1
77
,90
0
$1
69
,90
0
$1
74
,70
0
$1
75
,00
0
$1
55
,00
0
$1
62
,50
0
$1
70
,00
0
$1
85
,00
0
$1
80
,00
0
$2
00
,00
0
$1
98
,62
5
$1
85
,00
0
$1
80
,00
0
$1
77
,45
7
$1
85
,00
0
$1
85
,00
0
$1
70
,00
0
$1
75
,50
0
$1
85
,00
0
$1
86
,50
0
$1
95
,50
0
$2
10
,00
0
$2
07
,00
0
$2
06
,50
0
$0
$50,000
$100,000
$150,000
$200,000
$250,000
Median Sales Price
$202,3
18
$188,2
85
$165,0
00
$201,9
18
$133,9
00
$210,0
00
$225,9
50
$196,0
00
$249,9
50
$150,0
00
$0
$50,000
$100,000
$150,000
$200,000
$250,000
$300,000
$350,000
Chesterfield
County
Henrico
County
Richmond
City
Hanover
County
Caroline
County
Median Sale PriceOf Top Five Counties/Cities Based on Total Units Sold
One Year Ago Current Month
-4%
-5%
-8%
-5%
-8%
-10
%
2%
-5%
3% 4
%
6%
5%
-5%
1%
4% 6
%
6%
10
%
8% 9
%
1%
9%
5%
4%
12
%
-16%
-14%
-12%
-10%
-8%
-6%
-4%
-2%
0%
2%
4%
6%
8%
10%
12%
14%
Median Sale PricePercent Change Year/Year
® The Long & Foster Market Conditions Report
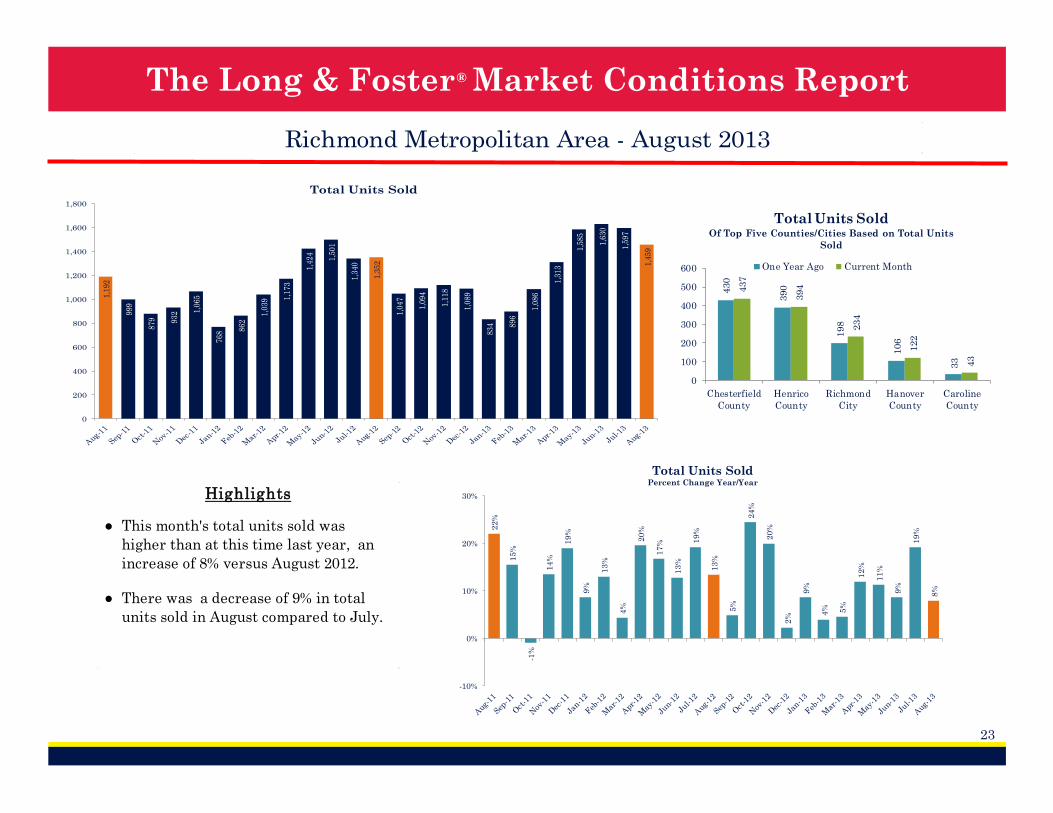
23
Richmond Metropolitan Area - August 2013
1,1
92
99
9
87
9 93
2 1,0
65
76
8 86
2
1,0
39 1
,17
3
1,4
24
1,5
01
1,3
40
1,3
52
1,0
47
1,0
94
1,1
18
1,0
89
83
4 89
6
1,0
86
1,3
13
1,5
85
1,6
30
1,5
97
1,4
59
0
200
400
600
800
1,000
1,200
1,400
1,600
1,800
Total Units Sold
430
390
198
106
33
437
394
234
122
43
0
100
200
300
400
500
600
Chesterfield
County
Henrico
County
Richmond
City
Hanover
County
Caroline
County
Total Units SoldOf Top Five Counties/Cities Based on Total Units
Sold
One Year Ago Current Month
●
● There was a decrease of 9% in total
units sold in August compared to July.
This month's total units sold was
higher than at this time last year, an
increase of 8% versus August 2012.
Highlights2
2%
15
%
-1%
14
%
19
%
9%
13
%
4%
20
%
17
%
13
%
19
%
13
%
5%
24
%
20
%
2%
9%
4% 5%
12
%
11
%
9%
19
%
8%
-10%
0%
10%
20%
30%
Total Units SoldPercent Change Year/Year
® The Long & Foster Market Conditions Report
24
Richmond Metropolitan Area - August 2013
0
200
400
600
800
1,000
1,200
1,400
1,600
1,800
Total Units Sold by Type
Detached Attached Condo
1,246
85%
138
10%
75
5%
Total Units Sold by TypeCurrent Month
Detached Attached Condo
416
28%
663
45%
241
17%
84
6%
55
4%
Total Units Sold by Price RangeCurrent Month
< 150K 150K to < 300K 300K to < 450K
450K to < 600K 600K and up
0
100
200
300
400
500
600
700
800
Total Units Sold by Price Range
< 150K 150K to < 300K 300K to < 450K 450K to < 600K 600K and up
® The Long & Foster Market Conditions Report
25
Richmond Metropolitan Area - August 2013
9,2
81
8,8
43
8,5
58
8,1
53
7,4
71
7,4
75
7,5
43
7,6
75
7,9
42
8,0
04
7,9
48
7,8
09
7,6
40
7,6
63
7,4
08
7,2
33
6,8
06
6,6
46
6,7
94
6,9
11
7,2
75
7,4
84
7,4
32
7,4
22
7,2
20
0
1,000
2,000
3,000
4,000
5,000
6,000
7,000
8,000
9,000
10,000
Total Active Inventory
1,9
63
1,5
85
1,1
30
646
182
1,9
00
1,3
99
1,0
33
604
183
0
500
1,000
1,500
2,000
2,500
Chesterfield
County
Henrico
County
Richmond
City
Hanover
County
Caroline
County
Total Active InventoryOf Top Five Counties/Cities Based on Total Units Sold
One Year Ago Current Month
-18
%
-21
%
-20
%
-21
%
-22
% -21
%
-20
%
-21
%
-20
%
-19
%
-19
%
-18
%
-18
%
-13
%
-13
% -11
%
-9%
-11
%
-10
%
-10
% -8% -6
%
-6% -5
%
-5%
-30%
-25%
-20%
-15%
-10%
-5%
0%
Total Active InventoryPercent Change Year/Year
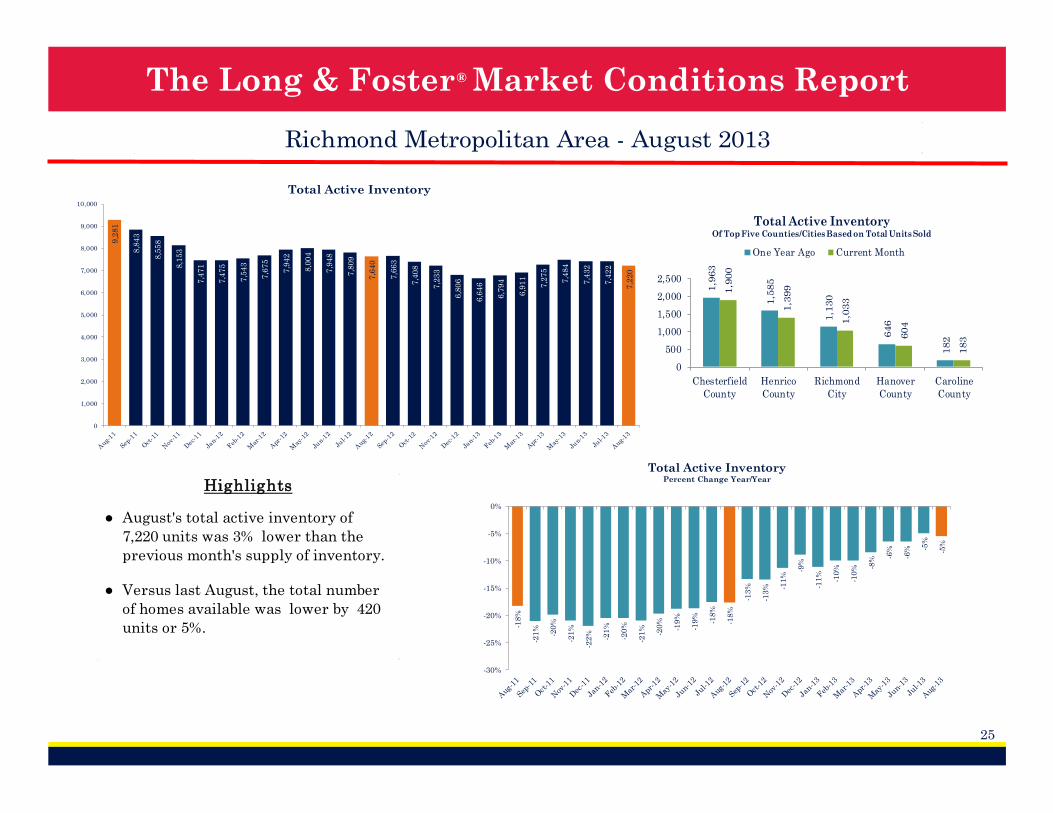
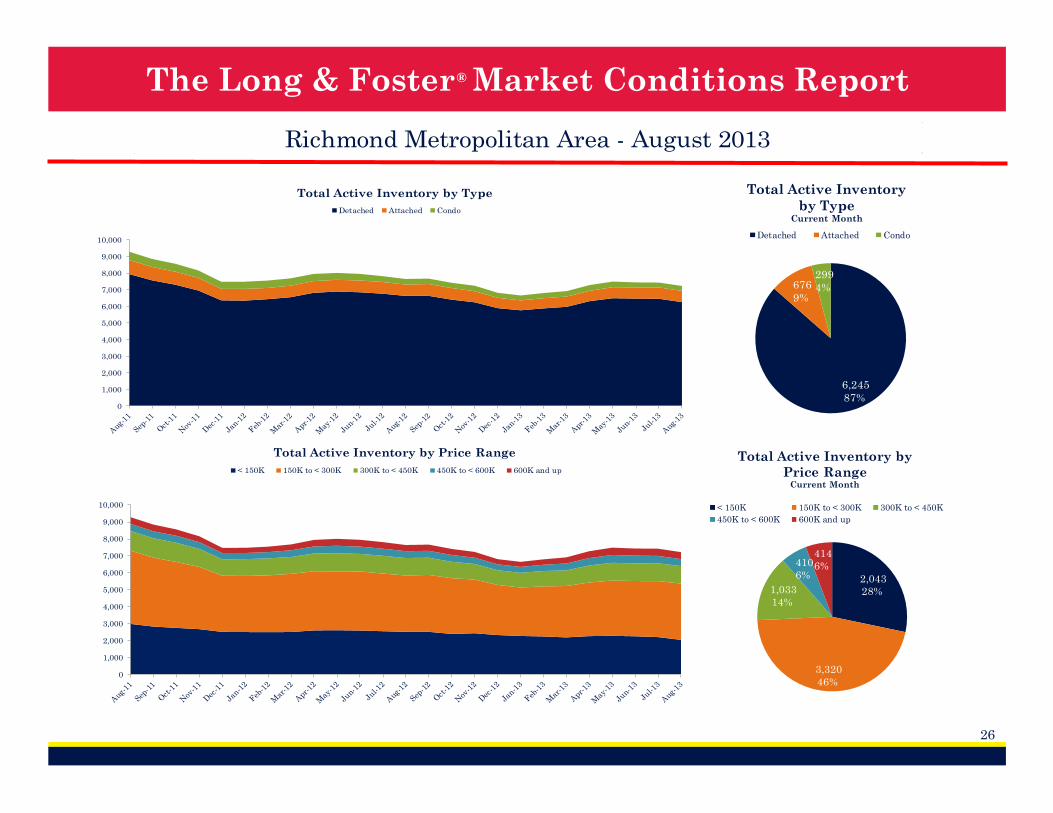
●
● Versus last August, the total number
of homes available was lower by 420
units or 5%.
August's total active inventory of
7,220 units was 3% lower than the
previous month's supply of inventory.
Highlights
® The Long & Foster Market Conditions Report
26
Richmond Metropolitan Area - August 2013
0
1,000
2,000
3,000
4,000
5,000
6,000
7,000
8,000
9,000
10,000
Total Active Inventory by Type
Detached Attached Condo
6,245
87%
676
9%
299
4%
Total Active Inventory
by TypeCurrent Month
Detached Attached Condo
2,043
28%
3,320
46%
1,033
14%
410
6%
414
6%
Total Active Inventory by
Price RangeCurrent Month
< 150K 150K to < 300K 300K to < 450K
450K to < 600K 600K and up
0
1,000
2,000
3,000
4,000
5,000
6,000
7,000
8,000
9,000
10,000
Total Active Inventory by Price Range
< 150K 150K to < 300K 300K to < 450K 450K to < 600K 600K and up
® The Long & Foster Market Conditions Report
27
Richmond Metropolitan Area - August 2013
96
.3% 9
6.6
%
96
.4%
96
.6%
96
.7%
95
.7%
95
.5%
96
.8%
96
.9%
97
.4%
97
.5%
96
.9%
97
.4%
97
.5%
97
.3%
97
.2%
97
.7%
97
.2% 97
.4% 9
7.8
% 98
.0%
97
.8%
98
.2%
98
.0%
98
.0%
94.0%
94.5%
95.0%
95.5%
96.0%
96.5%
97.0%
97.5%
98.0%
98.5%
Average Sale Price as a Percent of List Price
97.2
% 98.4
%
96.3
%
98.1
%
97.2
%98.7
%
98.4
%
97.0
% 98.4
%
97.5
%
94.0%
95.0%
96.0%
97.0%
98.0%
99.0%
100.0%
Chesterfield
County
Henrico
County
Richmond
City
Hanover
County
Caroline
County
Sale Price as % of List PriceOf Top Five Counties/Cities Based on Total Units
Sold
One Year Ago Current Month
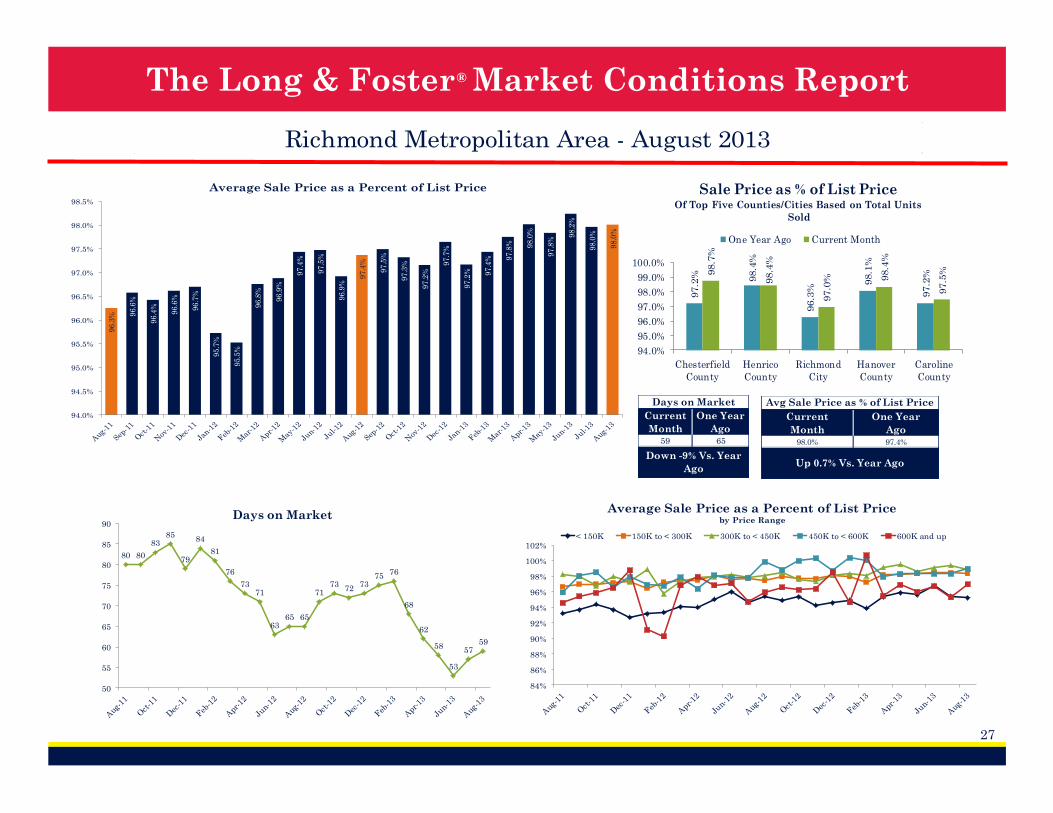
Days on Market
Current
Month
One Year
Ago59 65
Down -9% Vs. Year
Ago
Avg Sale Price as % of List Price
Current
Month
One Year
Ago98.0% 97.4%
Up 0.7% Vs. Year Ago
84%
86%
88%
90%
92%
94%
96%
98%
100%
102%
Average Sale Price as a Percent of List Price by Price Range
< 150K 150K to < 300K 300K to < 450K 450K to < 600K 600K and up
80 80
8385
79
84
81
76
7371
6365 65
7173
7273
7576
68
62
58
53
5759
50
55
60
65
70
75
80
85
90Days on Market
® The Long & Foster Market Conditions Report
28
Richmond Metropolitan Area - August 2013$
26
6,1
20
$2
14
,83
4
$1
74
,27
4
$1
95
,67
8
$2
24
,53
2
$1
41
,90
4
$1
67
,84
7
$2
07
,08
7
$2
46
,39
0 $3
06
,88
1
$3
58
,40
3
$3
21
,40
1
$2
99
,41
4
$2
25
,10
8
$2
41
,66
1
$2
49
,25
7
$2
44
,32
7
$1
76
,82
7
$1
91
,73
5
$2
30
,19
8 $2
91
,61
8
$3
68
,66
4
$3
98
,97
7
$3
92
,26
3
$3
56
,53
1
$0
$50,000
$100,000
$150,000
$200,000
$250,000
$300,000
$350,000
$400,000
$450,000
Total Dollar Volume SoldIn Thousands
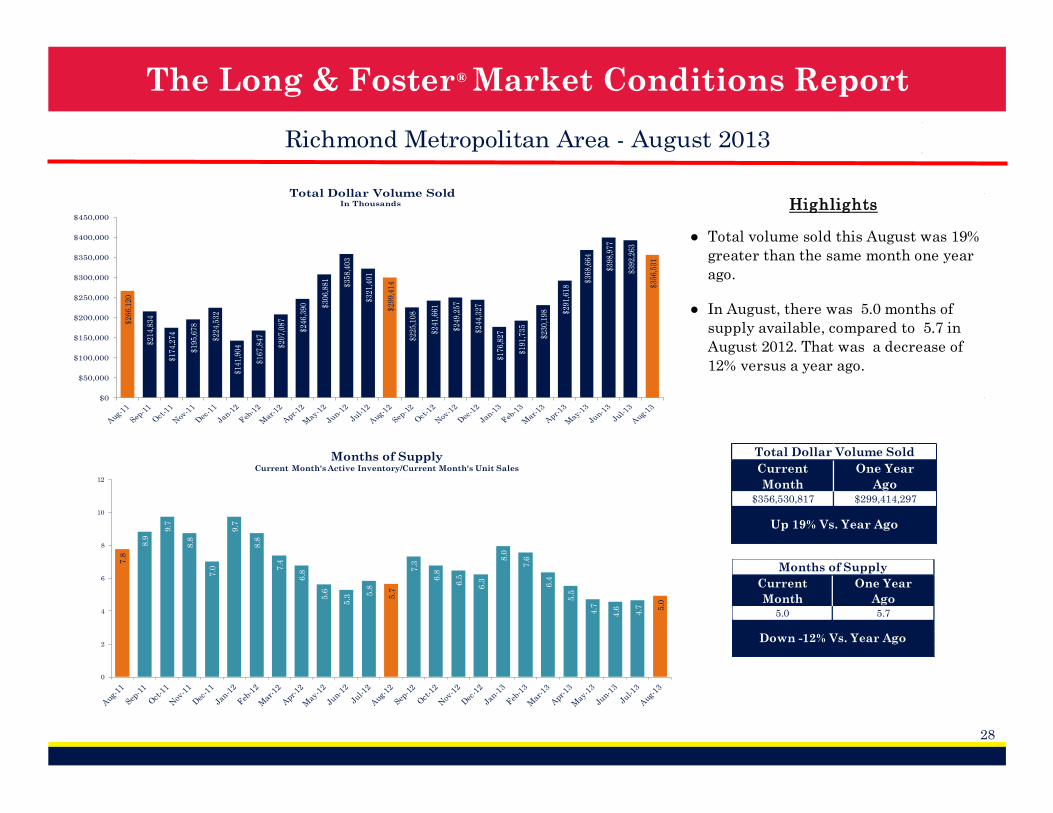
Total Dollar Volume Sold
Current
Month
One Year
Ago$356,530,817 $299,414,297
Up 19% Vs. Year Ago
Months of Supply
Current
Month
One Year
Ago5.0 5.7
Down -12% Vs. Year Ago
7.8
8.9
9.7
8.8
7.0
9.7
8.8
7.4
6.8
5.6
5.3
5.8
5.7
7.3
6.8
6.5
6.3
8.0
7.6
6.4
5.5
4.7
4.6 4.7 5
.0
0
2
4
6
8
10
12
Months of SupplyCurrent Month's Active Inventory/Current Month's Unit Sales
●
●
Total volume sold this August was 19%
greater than the same month one year
ago.
In August, there was 5.0 months of
supply available, compared to 5.7 in
August 2012. That was a decrease of
12% versus a year ago.
Highlights

® The Long & Foster Market Conditions Report
29
Richmond Metropolitan Area - August 20132
,12
2
1,7
89
1,9
09
1,5
48
1,2
70
2,2
17
2,0
03
2,4
22
2,3
13
2,3
16
2,0
96
2,0
66
2,0
20
1,8
46
1,8
07
1,5
32
1,2
39
2,0
17
2,0
09 2
,30
4
2,6
84
2,5
76
2,1
61
2,3
31
2,1
76
1,0
56
93
8
1,0
33
92
5
82
2
1,0
01
1,1
40
1,4
89
1,4
36
1,4
19
1,3
36
1,1
38
1,2
42
1,0
61
1,1
12
92
3
82
4 1,0
87
1,2
40 1,4
85 1,6
80
1,7
36
1,5
06
1,4
21
1,4
59
0
500
1,000
1,500
2,000
2,500
3,000
New Listings & New Contracts
New Listings New Contracts (Under Active Contract Status)
New Listings
Current
Month
One Year
Ago2,176 2,020
Up 8% Vs. Year Ago
New Contracts
Current
Month
One Year
Ago1,459 1,242
Up 17% Vs. Year Ago
2.01.9
1.8
1.71.5
2.2
1.81.6 1.6 1.6
1.6
1.8
1.61.7
1.6 1.7
1.5
1.9
1.61.6 1.6
1.5 1.4
1.6
1.5
0.0
0.5
1.0
1.5
2.0
2.5
Supply/Demand RatioNumber of New Listings to New Contracts
552
520
295
159
45
643
519
347
185
50
0
200
400
600
800
Chesterfield
County
Henrico
County
Richmond
City
Hanover
County
Caroline
County
New ListingsOf Top Five Counties/Cities Based on Total Units Sold
One Year Ago Current Month
386
352
169
93
40
434
425
206
125
38
0
200
400
600
800
Chesterfield
County
Henrico
County
Richmond
City
Hanover
County
Caroline
County
New ContractsOf Top Five Counties/Cities Based on Total Units Sold
One Year Ago Current Month
● Based on this month's amount of new
listings and new contracts, the ratio of
home supply (new listings) to current
home demand (new contracts) was 1.5,
a decrease of 8% from August 2012.
Highlights
® The Long & Foster Market Conditions Report
30
Philadelphia Metropolitan Area - August 2013
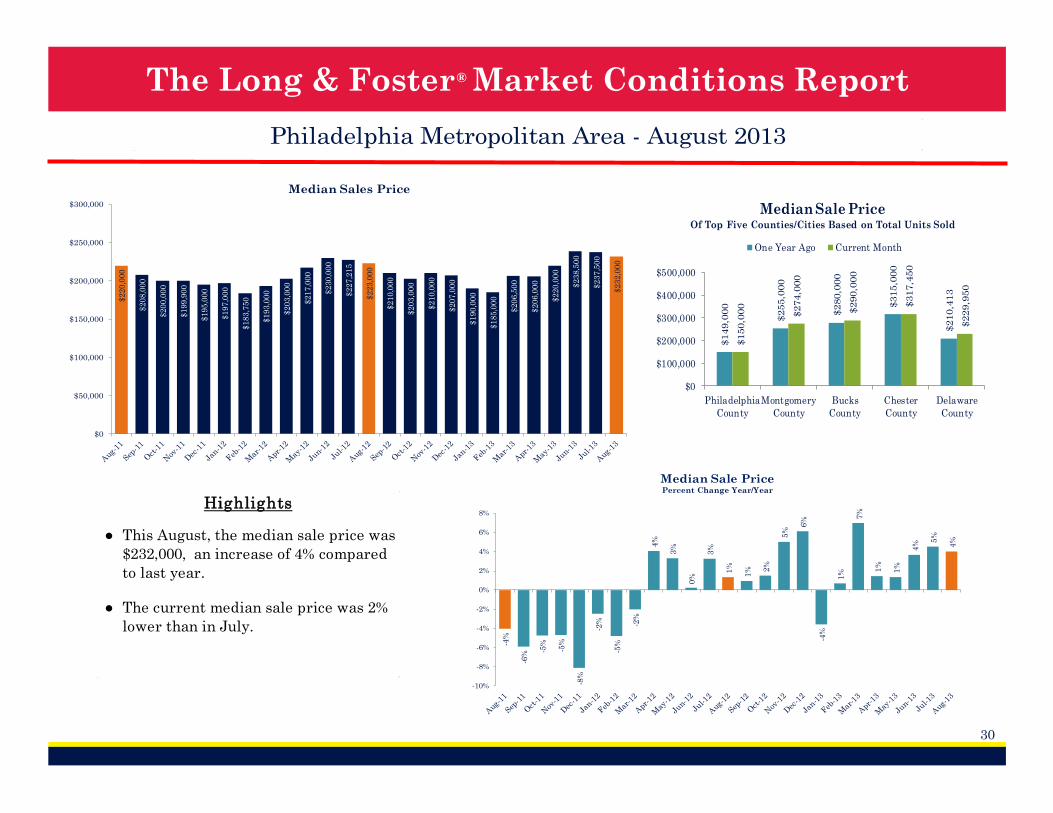
●
● The current median sale price was 2%
lower than in July.
This August, the median sale price was
$232,000, an increase of 4% compared
to last year.
Highlights
$2
20
,00
0
$2
08
,00
0
$2
00
,00
0
$1
99
,90
0
$1
95
,00
0
$1
97
,00
0
$1
83
,75
0
$1
93
,00
0
$2
03
,00
0
$2
17
,00
0
$2
30
,00
0
$2
27
,21
5
$2
23
,00
0
$2
10
,00
0
$2
03
,00
0
$2
10
,00
0
$2
07
,00
0
$1
90
,00
0
$1
85
,00
0
$2
06
,50
0
$2
06
,00
0
$2
20
,00
0
$2
38
,50
0
$2
37
,50
0
$2
32
,00
0
$0
$50,000
$100,000
$150,000
$200,000
$250,000
$300,000
Median Sales Price
$149,0
00
$255,0
00
$280,0
00
$315,0
00
$210,4
13
$150,0
00
$274,0
00
$290,0
00
$317,4
50
$229,9
50
$0
$100,000
$200,000
$300,000
$400,000
$500,000
Philadelphia
County
Montgomery
County
Bucks
County
Chester
County
Delaware
County
Median Sale PriceOf Top Five Counties/Cities Based on Total Units Sold
One Year Ago Current Month
-4%
-6%
-5%
-5%
-8%
-2%
-5%
-2%
4%
3%
0%
3%
1%
1% 2
%
5%
6%
-4%
1%
7%
1%
1%
4% 5
%
4%
-10%
-8%
-6%
-4%
-2%
0%
2%
4%
6%
8%
Median Sale PricePercent Change Year/Year
® The Long & Foster Market Conditions Report
31
Philadelphia Metropolitan Area - August 2013
4,0
12
3,3
09
2,9
83
3,0
26
3,1
88
2,4
98
2,4
41
3,3
65
3,5
90
4,2
46
4,85
7
4,29
4 4,7
03
3,7
04
3,4
89 4
,03
3
3,5
69
2,88
2
2,7
50
3,6
28
4,32
5
5,1
40
5,7
41
5,5
46
5,1
46
0
1,000
2,000
3,000
4,000
5,000
6,000
7,000
Total Units Sold
1,0
41
857
622
557
522
1,0
92
926
705
624
558
0
500
1,000
1,500
Philadelphia
County
Montgomery
County
Bucks
County
Chester
County
Delaware
County
Total Units SoldOf Top Five Counties/Cities Based on Total Units
Sold
One Year Ago Current Month
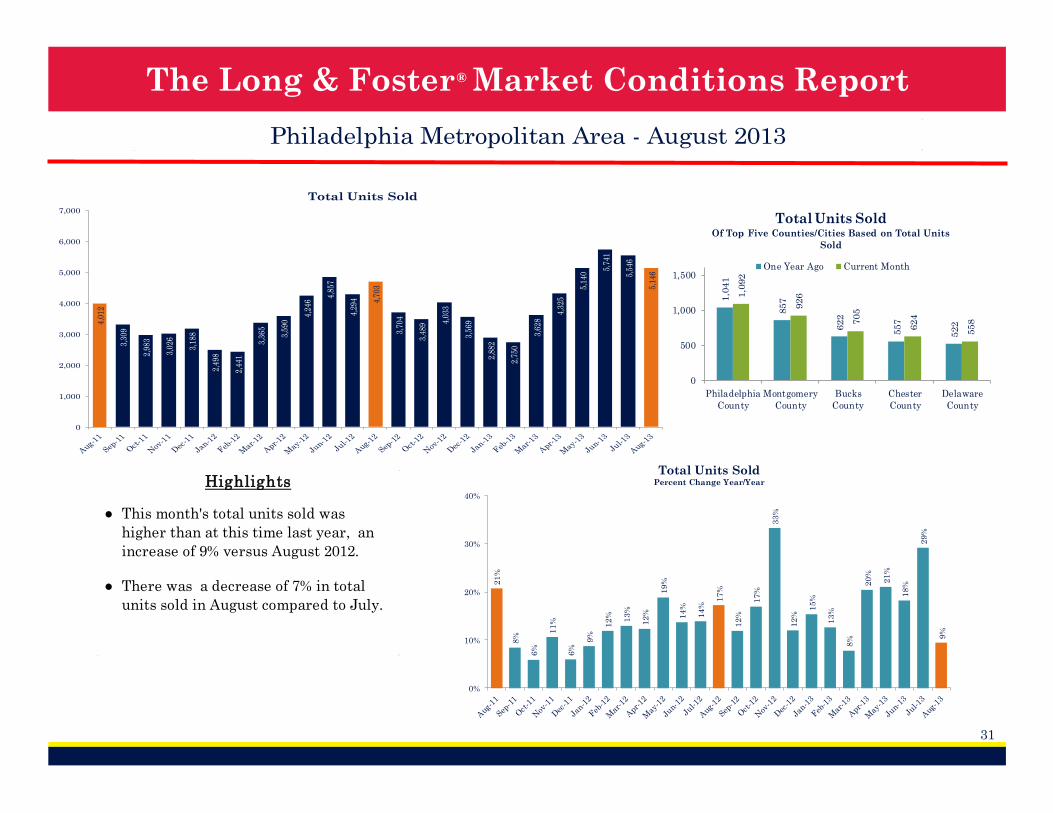
●
● There was a decrease of 7% in total
units sold in August compared to July.
This month's total units sold was
higher than at this time last year, an
increase of 9% versus August 2012.
Highlights2
1%
8%
6%
11
%
6%
9%
12
%
13
%
12
%
19
%
14
%
14
%
17
%
12
%
17
%
33
%
12
%
15
%
13
%
8%
20
%
21
%
18
%
29
%
9%
0%
10%
20%
30%
40%
Total Units SoldPercent Change Year/Year
® The Long & Foster Market Conditions Report
32
Philadelphia Metropolitan Area - August 2013
0
1,000
2,000
3,000
4,000
5,000
6,000
7,000
Total Units Sold by Type
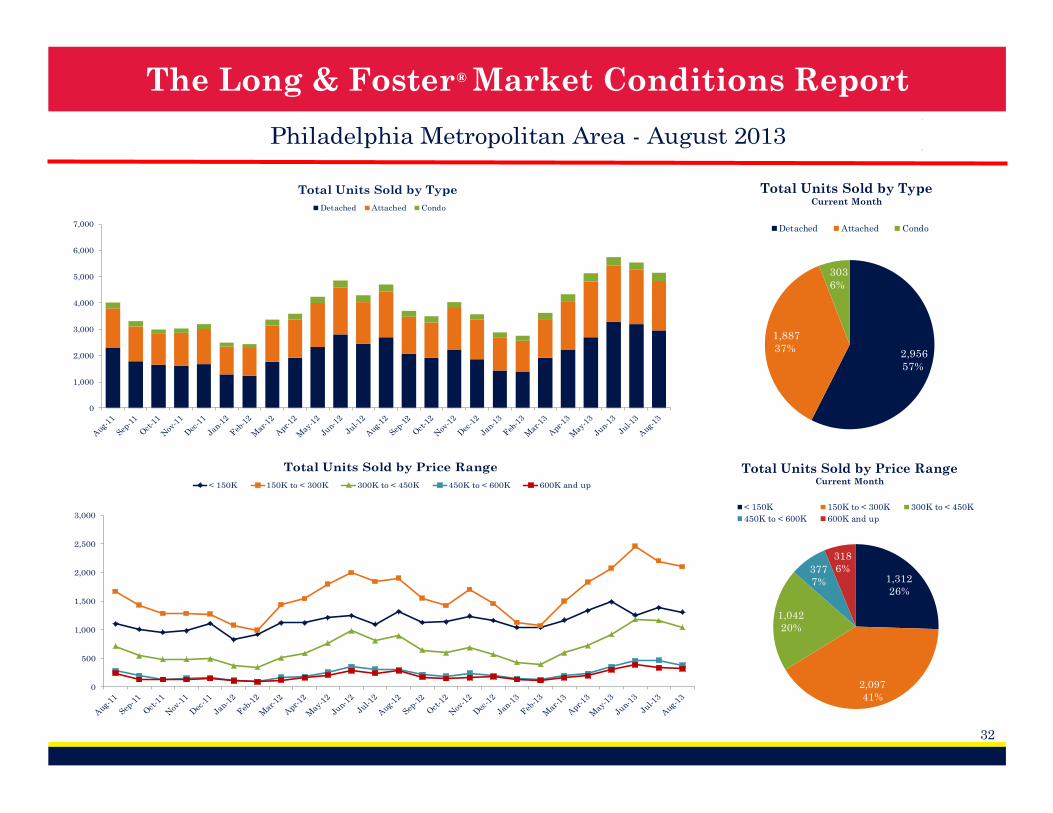
Detached Attached Condo
2,956
57%
1,887
37%
303
6%
Total Units Sold by TypeCurrent Month
Detached Attached Condo
1,312
26%
2,097
41%
1,042
20%
377
7%
318
6%
Total Units Sold by Price RangeCurrent Month
< 150K 150K to < 300K 300K to < 450K
450K to < 600K 600K and up
0
500
1,000
1,500
2,000
2,500
3,000
Total Units Sold by Price Range
< 150K 150K to < 300K 300K to < 450K 450K to < 600K 600K and up
® The Long & Foster Market Conditions Report
33
Philadelphia Metropolitan Area - August 20133
9,6
01
38
,90
2
37
,70
4
35
,91
3
31
,94
4
32
,51
1
33
,36
7
34
,63
1
35
,77
6
36
,27
4
35
,68
9
35
,09
8
34
,36
0
34
,12
7
33
,00
5
31
,37
3
27
,58
0
28
,05
0
28
,60
0
29
,17
3
30
,51
1
31
,17
8
30
,75
6
30
,44
2
29
,87
6
0
5,000
10,000
15,000
20,000
25,000
30,000
35,000
40,000
45,000
Total Active Inventory
8,4
43
4,6
27
3,8
41
3,4
27
3,6
62
7,1
71
4,3
12
3,2
66
2,8
20
3,1
87
0
2,000
4,000
6,000
8,000
10,000
Philadelphia
County
Montgomery
County
Bucks
County
Chester
County
Delaware
County
Total Active InventoryOf Top Five Counties/Cities Based on Total Units Sold
One Year Ago Current Month
-3%
-5%
-6%
-7%
-8%
-7% -6
%
-7%
-9%
-11
%
-13
%
-14
%
-13
%
-12
%
-12
%
-13
%
-14
%
-14
%
-14
%
-16
%
-15
%
-14
%
-14
%
-13
%
-13
%
-25%
-20%
-15%
-10%
-5%
0%
Total Active InventoryPercent Change Year/Year
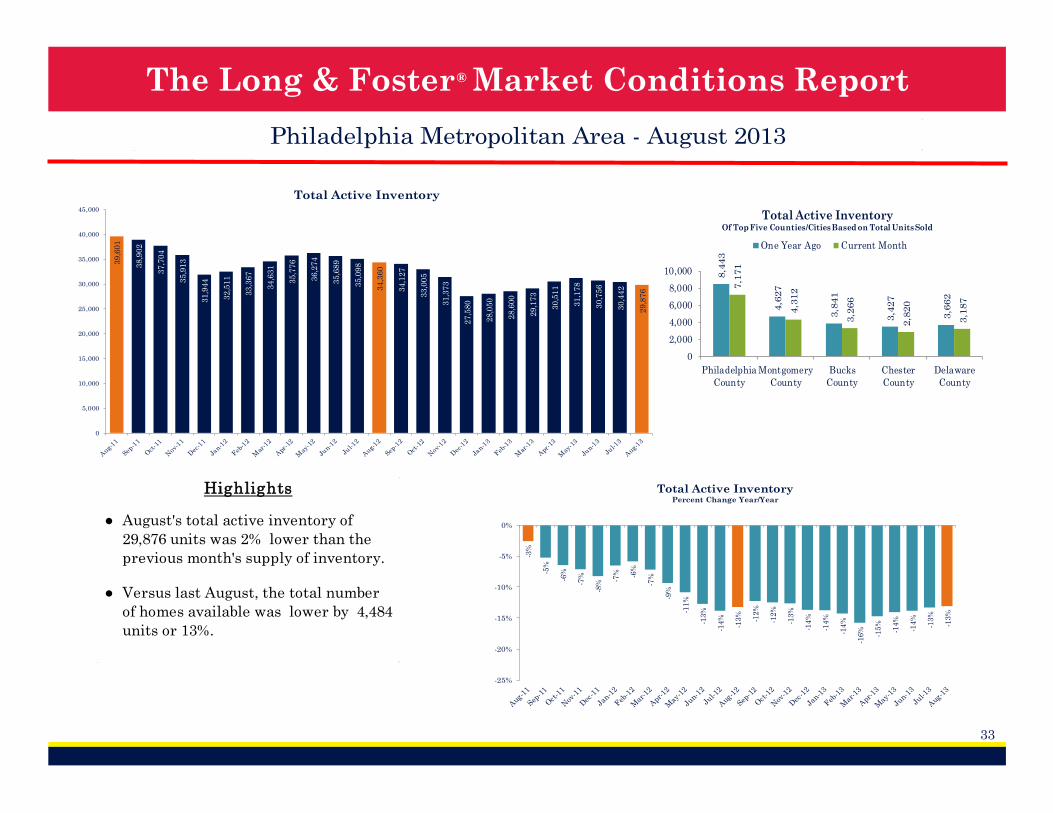
●
● Versus last August, the total number
of homes available was lower by 4,484
units or 13%.
August's total active inventory of
29,876 units was 2% lower than the
previous month's supply of inventory.
Highlights

® The Long & Foster Market Conditions Report
34
Philadelphia Metropolitan Area - August 2013
0
5,000
10,000
15,000
20,000
25,000
30,000
35,000
40,000
45,000
Total Active Inventory by Type
Detached Attached Condo
16,395
55%
11,702
39%
1,779
6%
Total Active Inventory
by TypeCurrent Month
Detached Attached Condo
9,946
33%
11,268
38%
4,053
14%
1,823
6%
2,786
9%
Total Active Inventory by
Price RangeCurrent Month
< 150K 150K to < 300K 300K to < 450K
450K to < 600K 600K and up
0
5,000
10,000
15,000
20,000
25,000
30,000
35,000
40,000
45,000
Total Active Inventory by Price Range
< 150K 150K to < 300K 300K to < 450K 450K to < 600K 600K and up
® The Long & Foster Market Conditions Report
35
Philadelphia Metropolitan Area - August 2013
94
.7%
94
.7%
94
.3%
94
.3% 9
4.7
%
93
.7% 9
4.1
%
95
.1%
95
.3% 9
5.6
%
95
.7%
95
.7%
95
.2% 95
.5%
95
.4%
95
.4%
95
.3%
95
.4%
95
.1%
96
.0%
96
.1% 96
.4%
96
.5% 96
.8%
96
.6%
92.0%
92.5%
93.0%
93.5%
94.0%
94.5%
95.0%
95.5%
96.0%
96.5%
97.0%
97.5%
Average Sale Price as a Percent of List Price
95.0
%
95.3
%
94.7
%
95.5
%
95.2
%
95.9
%
96.9
%
96.6
%
97.2
%
96.7
%
92.0%
94.0%
96.0%
98.0%
100.0%
Philadelphia
County
Montgomery
County
Bucks
County
Chester
County
Delaware
County
Sale Price as % of List PriceOf Top Five Counties/Cities Based on Total Units
Sold
One Year Ago Current Month
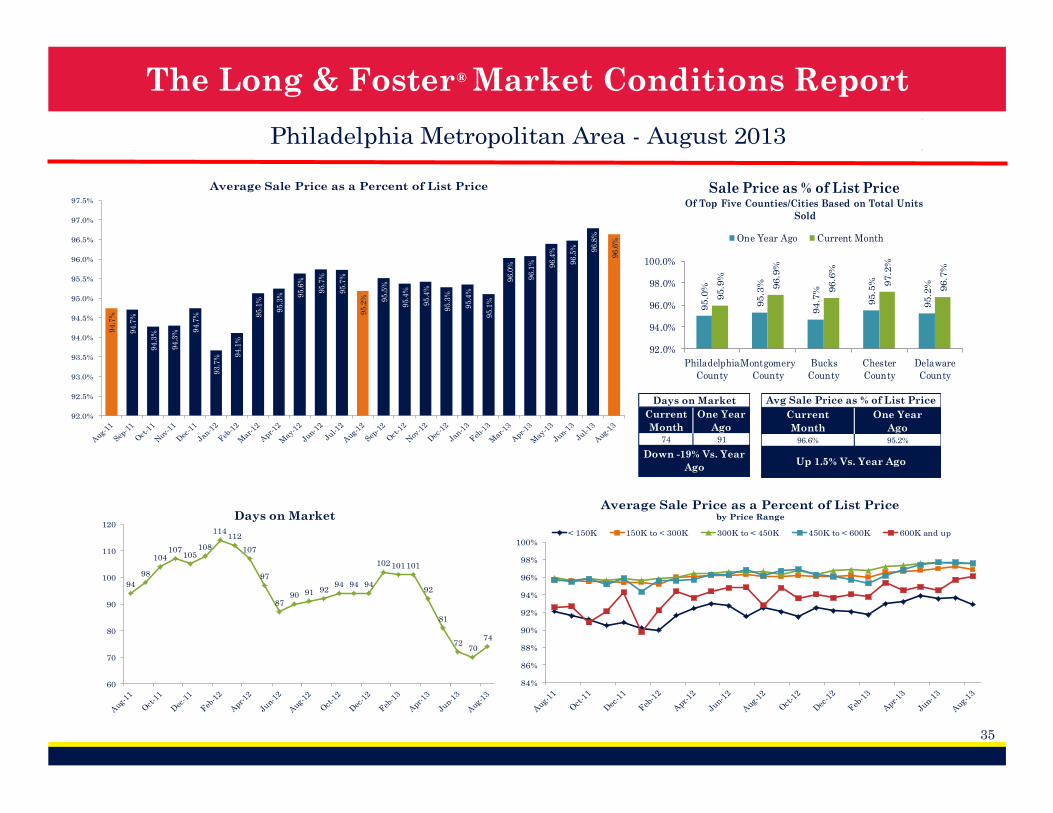
Days on Market
Current
Month
One Year
Ago74 91
Down -19% Vs. Year
Ago
Avg Sale Price as % of List Price
Current
Month
One Year
Ago96.6% 95.2%
Up 1.5% Vs. Year Ago
84%
86%
88%
90%
92%
94%
96%
98%
100%
Average Sale Price as a Percent of List Price by Price Range
< 150K 150K to < 300K 300K to < 450K 450K to < 600K 600K and up
94
98
104107
105108
114112
107
97
8790 91 92
94 94 94
102101101
92
81
7270
74
60
70
80
90
100
110
120Days on Market
® The Long & Foster Market Conditions Report
36
Philadelphia Metropolitan Area - August 2013$1
,083
,445
$808
,601
$717
,149
$729
,329
$758
,149
$603
,589
$544
,945 $7
85,8
07
$885
,309
$1,0
94,5
79 $1,3
32,3
82
$1,1
64,5
62
$1,2
71,9
63
$943
,120
$860
,486
$1,0
01,9
23
$906
,208
$675
,359
$620
,469
$892
,600
$1,0
75,8
80 $1,3
78,6
12 $1,6
68,4
39
$1,5
66,6
41
$1,4
15,8
24
$0
$200,000
$400,000
$600,000
$800,000
$1,000,000
$1,200,000
$1,400,000
$1,600,000
$1,800,000
Total Dollar Volume SoldIn Thousands
Total Dollar Volume Sold
Current
Month
One Year
Ago$1,415,823,753 $1,271,963,118
Up 11% Vs. Year Ago
Months of Supply
Current
Month
One Year
Ago5.8 7.3
Down -21% Vs. Year Ago
9.9
11
.8 12
.6
11
.9
10
.0
13
.0 13
.7
10
.3
10
.0
8.5
7.4
8.2
7.3
9.2 9.5
7.8
7.7
9.7 10
.4
8.0
7.1
6.1
5.4 5.5 5.8
0
2
4
6
8
10
12
14
16
Months of SupplyCurrent Month's Active Inventory/Current Month's Unit Sales
●
●
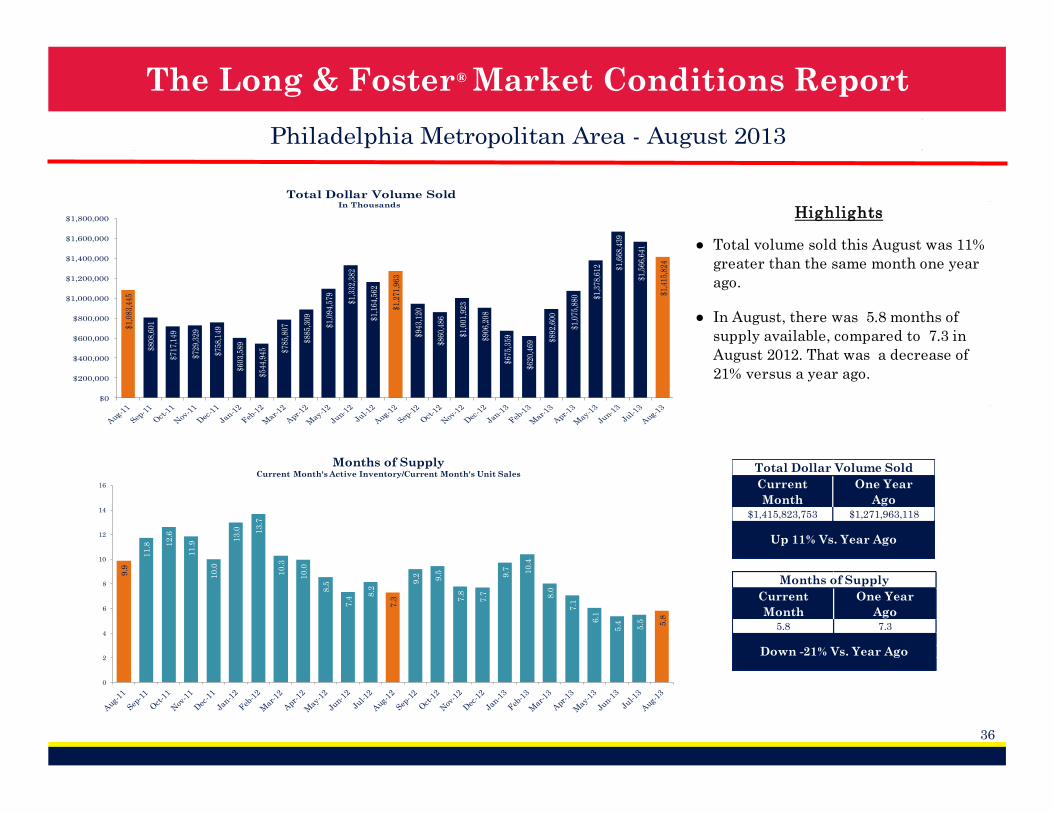
Total volume sold this August was 11%
greater than the same month one year
ago.
In August, there was 5.8 months of
supply available, compared to 7.3 in
August 2012. That was a decrease of
21% versus a year ago.
Highlights
® The Long & Foster Market Conditions Report
37
Philadelphia Metropolitan Area - August 20136
,46
3
6,6
97
6,3
63
5,0
81
3,7
04
6,8
95
7,4
67
9,1
16
8,5
06
8,0
81
7,3
91
6,9
19
6,8
53
6,7
45
6,3
91
4,7
50
3,4
52
7,1
70
6,9
93
8,6
76 9
,83
4
9,1
42
7,7
71
7,6
76
6,9
18
3,3
53
2,9
53
3,2
25
2,8
93
2,4
51
3,0
39 3,8
06 4,5
88
4,4
24
4,4
46
4,1
83
4,0
56
4,0
33
3,5
32
4,0
19
3,0
52
2,7
85 3,7
10
4,0
24 5
,29
9
5,8
20
5,5
09
4,8
64
4,6
58
3,7
50
0
2,000
4,000
6,000
8,000
10,000
12,000
New Listings & New Contracts
New Listings New Contracts (Under Active Contract Status)
New Listings
Current
Month
One Year
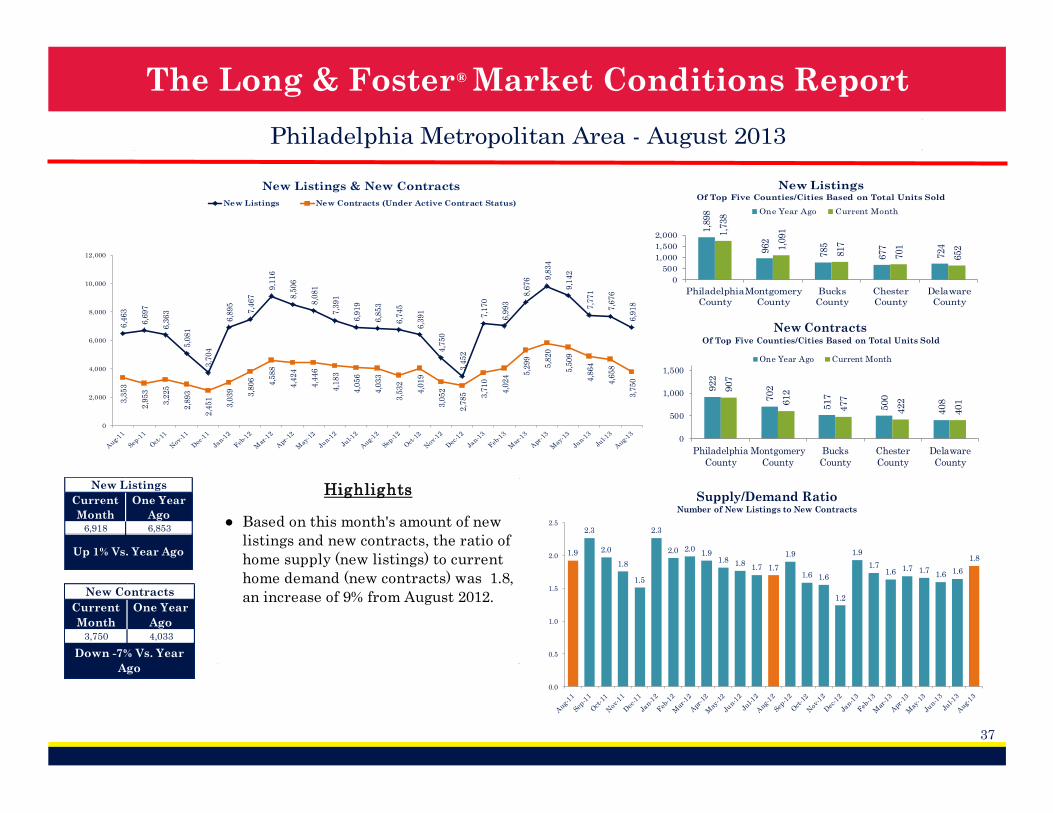
Ago6,918 6,853
Up 1% Vs. Year Ago
New Contracts
Current
Month
One Year
Ago3,750 4,033
Down -7% Vs. Year
Ago
1.9
2.3
2.0
1.8
1.5
2.3
2.0 2.01.9
1.8 1.81.7 1.7
1.9
1.6 1.6
1.2
1.9
1.71.6 1.7 1.7
1.6 1.6
1.8
0.0
0.5
1.0
1.5
2.0
2.5
Supply/Demand RatioNumber of New Listings to New Contracts
1,8
98
962
785
677
724
1,7
38
1,0
91
817
701
652
0
500
1,000
1,500
2,000
Philadelphia
County
Montgomery
County
Bucks
County
Chester
County
Delaware
County
New ListingsOf Top Five Counties/Cities Based on Total Units Sold
One Year Ago Current Month
922
702
517
500
408
907
612
477
422
401
0
500
1,000
1,500
Philadelphia
County
Montgomery
County
Bucks
County
Chester
County
Delaware
County
New ContractsOf Top Five Counties/Cities Based on Total Units Sold
One Year Ago Current Month
● Based on this month's amount of new
listings and new contracts, the ratio of
home supply (new listings) to current
home demand (new contracts) was 1.8,
an increase of 9% from August 2012.
Highlights
® The Long & Foster Market Conditions Report
38
The Triangle, NC Area - August 2013
●
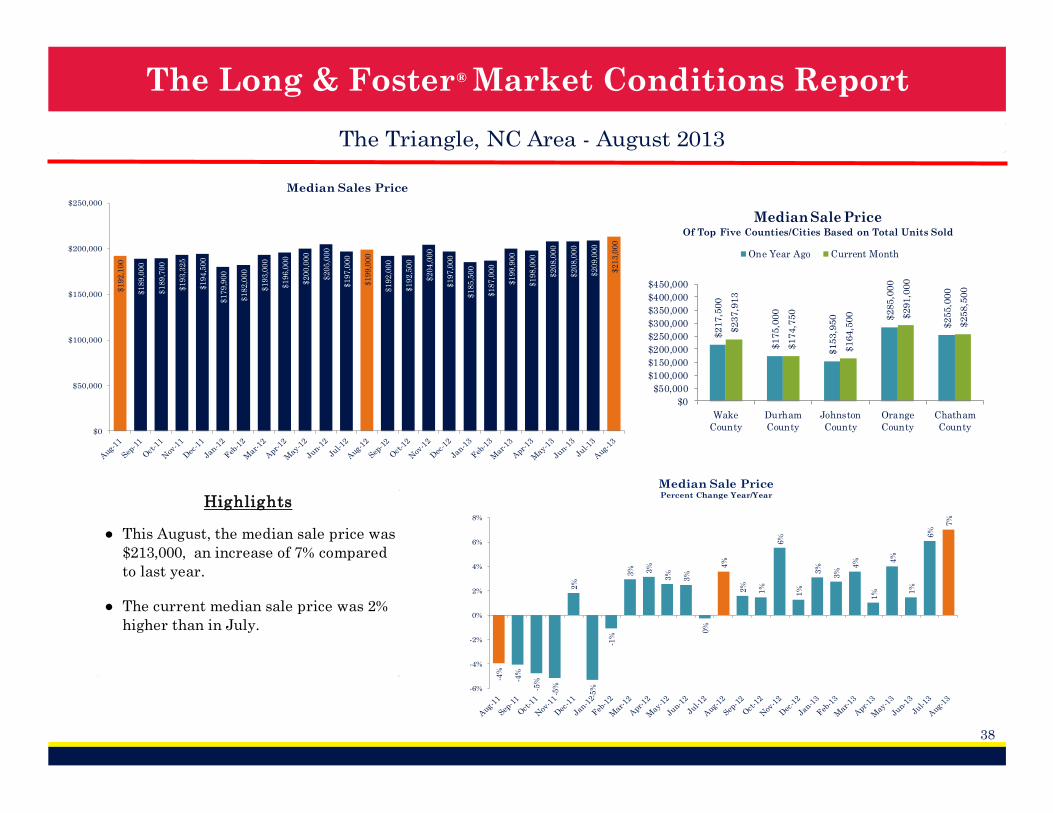
● The current median sale price was 2%
higher than in July.
This August, the median sale price was
$213,000, an increase of 7% compared
to last year.
Highlights
$1
92
,10
0
$1
89
,00
0
$1
89
,70
0
$1
93
,32
5
$1
94
,50
0
$1
79
,90
0
$1
82
,00
0
$1
93
,00
0
$1
96
,00
0
$2
00
,00
0
$2
05
,00
0
$1
97
,00
0
$1
99
,00
0
$1
92
,00
0
$1
92
,50
0
$2
04
,00
0
$1
97
,00
0
$1
85
,50
0
$1
87
,00
0
$1
99
,90
0
$1
98
,00
0
$2
08
,00
0
$2
08
,00
0
$2
09
,00
0
$2
13
,00
0
$0
$50,000
$100,000
$150,000
$200,000
$250,000
Median Sales Price
$217,5
00
$175,0
00
$153,9
50 $285,0
00
$255,0
00
$237,9
13
$174,7
50
$164,5
00 $291,0
00
$258,5
00
$0
$50,000
$100,000
$150,000
$200,000
$250,000
$300,000
$350,000
$400,000
$450,000
Wake
County
Durham
County
Johnston
County
Orange
County
Chatham
County
Median Sale PriceOf Top Five Counties/Cities Based on Total Units Sold
One Year Ago Current Month
-4%
-4%
-5%
-5%
2%
-5%
-1%
3% 3%
3%
3%
0%
4%
2%
1%
6%
1%
3%
3%
4%
1%
4%
1%
6%
7%
-6%
-4%
-2%
0%
2%
4%
6%
8%
Median Sale PricePercent Change Year/Year
® The Long & Foster Market Conditions Report
39
The Triangle, NC Area - August 2013
1,8
06
1,56
8
1,39
8
1,3
30
1,43
1
1,0
67
1,38
0
1,68
2
1,8
05
2,20
4 2,47
7
2,16
0
2,2
71
1,88
0
1,86
0
1,69
9
1,84
2
1,42
8
1,55
3
2,15
2
2,48
9
2,96
3
2,90
5
2,95
3
2,7
08
0
500
1,000
1,500
2,000
2,500
3,000
3,500
Total Units Sold
1,3
55
317
190
121
67
1,6
08
388
221
183
80
0
200
400
600
800
1,000
1,200
1,400
1,600
1,800
Wake
County
Durham
County
Johnston
County
Orange
County
Chatham
County
Total Units SoldOf Top Five Counties/Cities Based on Total Units
Sold
One Year Ago Current Month
●
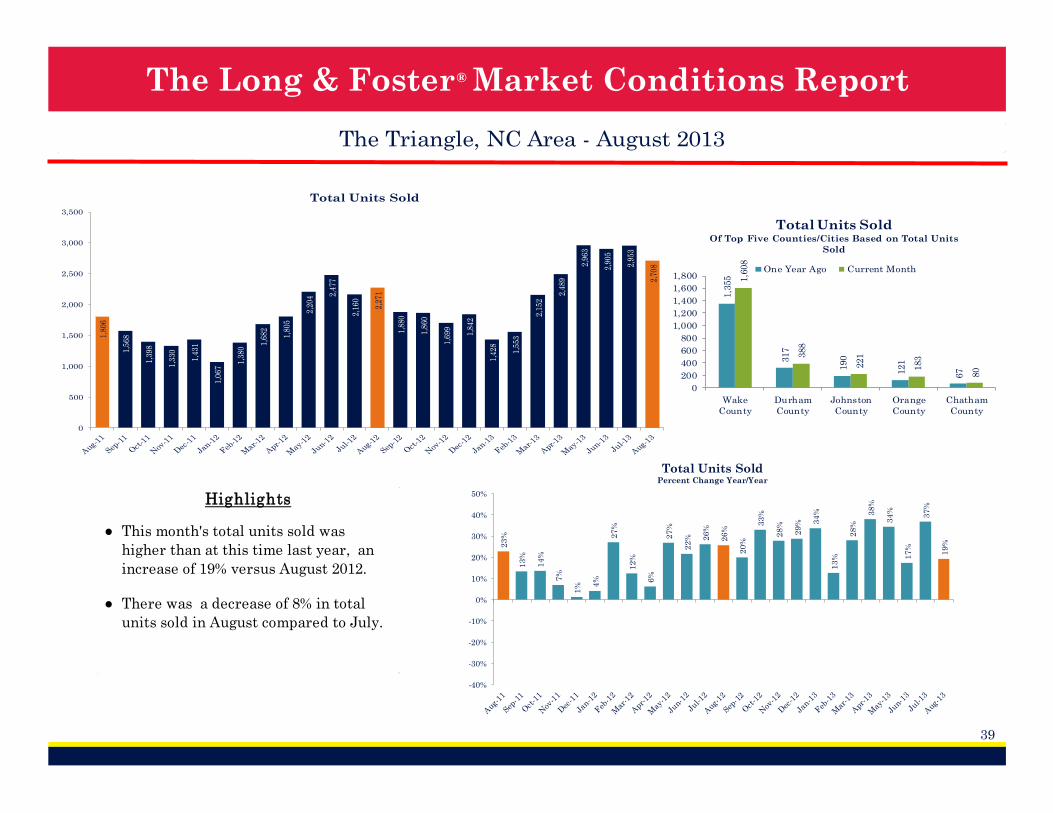
● There was a decrease of 8% in total
units sold in August compared to July.
This month's total units sold was
higher than at this time last year, an
increase of 19% versus August 2012.
Highlights2
3%
13
%
14
%
7%
1% 4
%
27
%
12
%
6%
27
%
22
% 26
%
26
%
20
%
33
%
28
%
29
% 34
%
13
%
28
%
38
%
34
%
17
%
37
%
19
%
-40%
-30%
-20%
-10%
0%
10%
20%
30%
40%
50%
Total Units SoldPercent Change Year/Year
® The Long & Foster Market Conditions Report
40
The Triangle, NC Area - August 2013
0
500
1,000
1,500
2,000
2,500
3,000
3,500
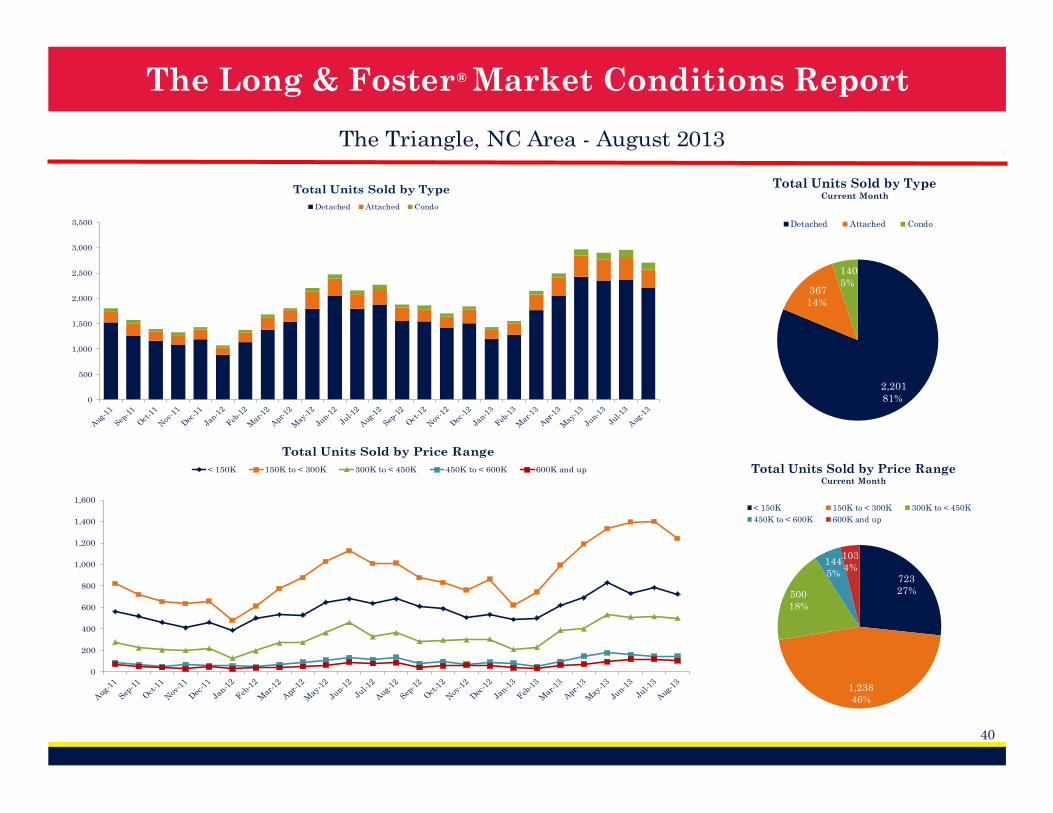
Total Units Sold by Type
Detached Attached Condo
2,201
81%
367
14%
140
5%
Total Units Sold by TypeCurrent Month
Detached Attached Condo
723
27%
1,238
46%
500
18%
144
5%
103
4%
Total Units Sold by Price RangeCurrent Month
< 150K 150K to < 300K 300K to < 450K
450K to < 600K 600K and up
0
200
400
600
800
1,000
1,200
1,400
1,600
Total Units Sold by Price Range
< 150K 150K to < 300K 300K to < 450K 450K to < 600K 600K and up
® The Long & Foster Market Conditions Report
41
The Triangle, NC Area - August 2013
18
,26
3
17
,48
2
16
,81
5
16
,19
8
14
,20
8
14
,29
3
14
,51
6
15
,05
8
15
,30
6
15
,33
7
15
,10
4
14
,85
0
14
,69
6
14
,24
7
13
,87
3
13
,26
1
11
,24
3
11
,08
1
11
,08
1
10
,93
7
10
,71
6
10
,62
6
10
,55
5
10
,24
9
9,9
41
0
2,000
4,000
6,000
8,000
10,000
12,000
14,000
16,000
18,000
20,000
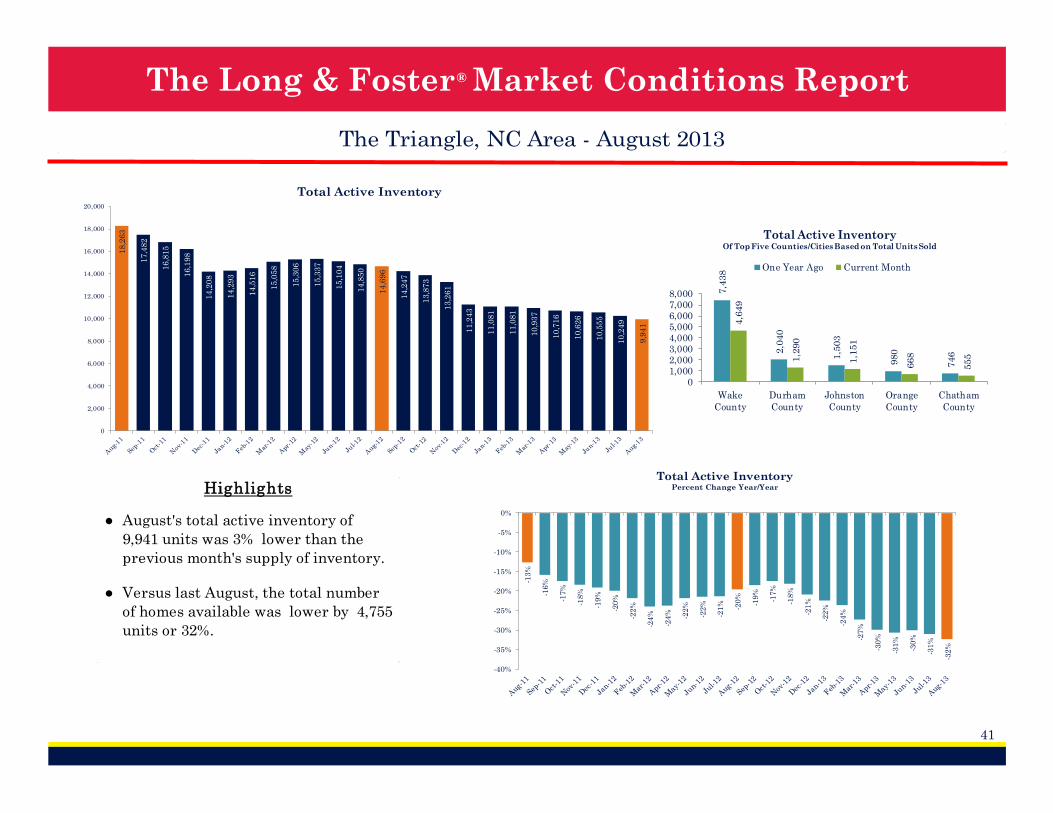
Total Active Inventory
7,4
38
2,0
40
1,5
03
980
746
4,6
49
1,2
90
1,1
51
668
555
01,0002,0003,0004,0005,0006,0007,0008,000
Wake
County
Durham
County
Johnston
County
Orange
County
Chatham
County
Total Active InventoryOf Top Five Counties/Cities Based on Total Units Sold
One Year Ago Current Month
-13
%
-16
%
-17
%
-18
%
-19
%
-20
%
-22
%
-24
%
-24
% -22
%
-22
%
-21
% -20
%
-19
%
-17
%
-18
%
-21
%
-22
%
-24
%
-27
%
-30
%
-31
%
-30
%
-31
%
-32
%
-40%
-35%
-30%
-25%
-20%
-15%
-10%
-5%
0%
Total Active InventoryPercent Change Year/Year
●
● Versus last August, the total number
of homes available was lower by 4,755
units or 32%.
August's total active inventory of
9,941 units was 3% lower than the
previous month's supply of inventory.
Highlights
® The Long & Foster Market Conditions Report
42
The Triangle, NC Area - August 2013
0
2,000
4,000
6,000
8,000
10,000
12,000
14,000
16,000
18,000
20,000
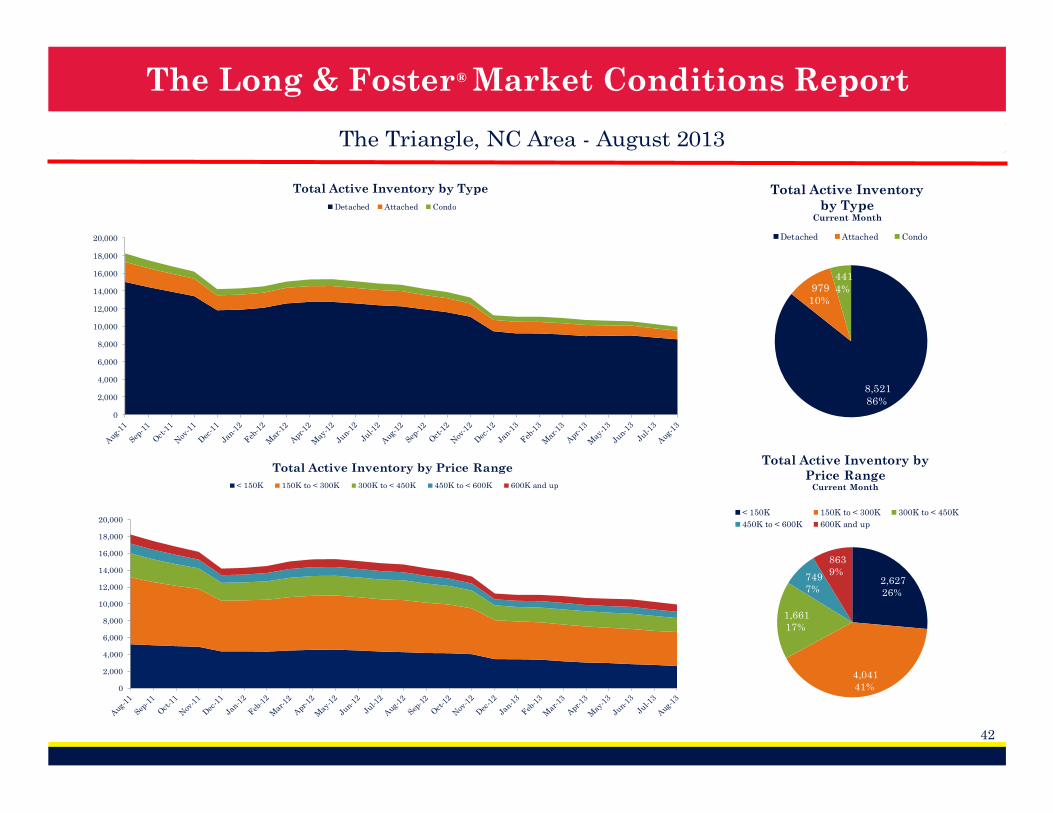
Total Active Inventory by Type
Detached Attached Condo
8,521
86%
979
10%
441
4%
Total Active Inventory
by TypeCurrent Month
Detached Attached Condo
2,627
26%
4,041
41%
1,661
17%
749
7%
863
9%
Total Active Inventory by
Price RangeCurrent Month
< 150K 150K to < 300K 300K to < 450K
450K to < 600K 600K and up
0
2,000
4,000
6,000
8,000
10,000
12,000
14,000
16,000
18,000
20,000
Total Active Inventory by Price Range
< 150K 150K to < 300K 300K to < 450K 450K to < 600K 600K and up
® The Long & Foster Market Conditions Report
43
The Triangle, NC Area - August 2013
96
.1%
95
.9%
96
.3%
96
.2%
96
.2%
96
.3%
96
.1%
96
.7% 96
.9%
97
.0%
97
.0%
97
.2%
97
.0%
96
.8%
97
.3%
97
.2%
97
.1%
96
.8%
97
.3% 97
.6%
97
.6% 97
.9%
97
.8%
97
.8%
97
.9%
94.5%
95.0%
95.5%
96.0%
96.5%
97.0%
97.5%
98.0%
98.5%
Average Sale Price as a Percent of List Price
97.0
%
97.2
%
97.5
%
96.6
%
96.8
%98.3
%
97.6
%
97.8
%
97.3
%
96.6
%
94.0%
95.0%
96.0%
97.0%
98.0%
99.0%
100.0%
Wake
County
Durham
County
Johnston
County
Orange
County
Chatham
County
Sale Price as % of List PriceOf Top Five Counties/Cities Based on Total Units
Sold
One Year Ago Current Month
Days on Market
Current
Month
One Year
Ago93 116
Down -20% Vs. Year
Ago
Avg Sale Price as % of List Price
Current
Month
One Year
Ago97.9% 97.0%
Up 1.0% Vs. Year Ago
90%
91%
92%
93%
94%
95%
96%
97%
98%
99%
100%
Average Sale Price as a Percent of List Price by Price Range
< 150K 150K to < 300K 300K to < 450K 450K to < 600K 600K and up
127
133
126
134
126
132
138136
125
115119120
116117121
117116119
121
112109
100
94 94 93
80
90
100
110
120
130
140
150Days on Market
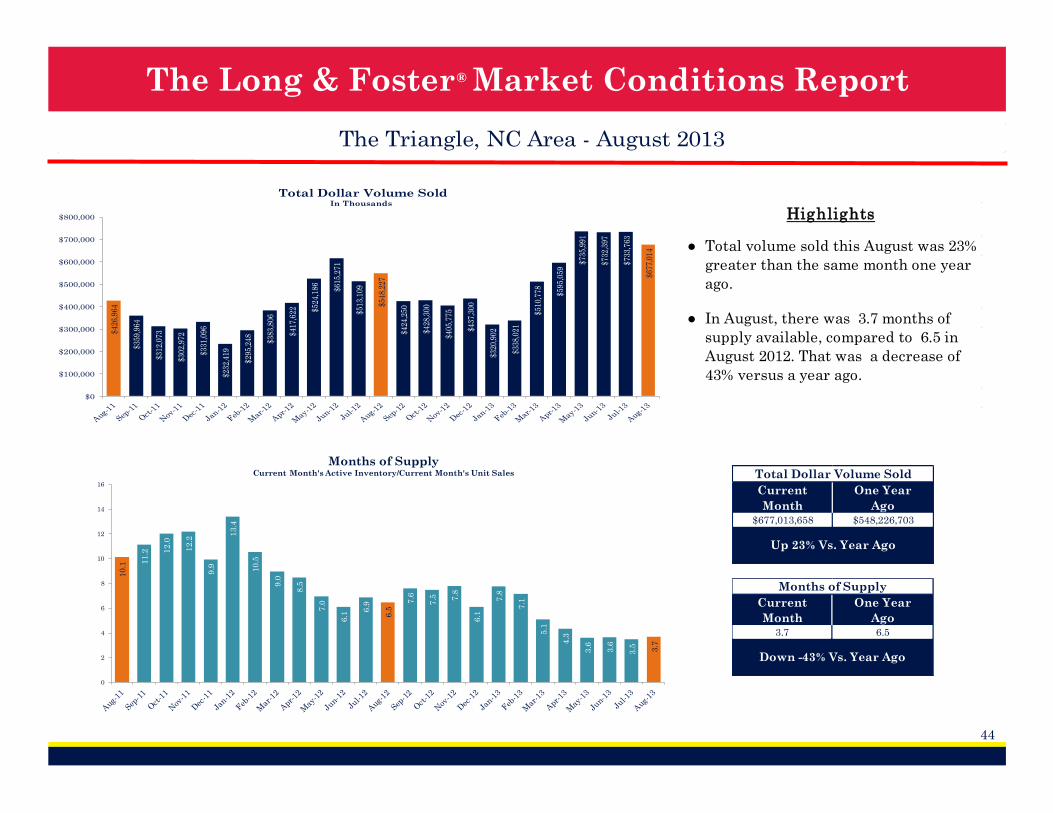
® The Long & Foster Market Conditions Report
44
The Triangle, NC Area - August 2013
$426
,964
$359
,964
$312
,073
$302
,972
$331
,096
$232
,419
$295
,248 $3
83,8
06
$417
,622 $5
24,1
86 $615
,271
$513
,109
$548
,227
$424
,250
$428
,300
$405
,775
$437
,300
$320
,902
$338
,021
$510
,778 $5
95,0
59
$735
,991
$732
,397
$733
,763
$677
,014
$0
$100,000
$200,000
$300,000
$400,000
$500,000
$600,000
$700,000
$800,000
Total Dollar Volume SoldIn Thousands
Total Dollar Volume Sold
Current
Month
One Year
Ago$677,013,658 $548,226,703
Up 23% Vs. Year Ago
Months of Supply
Current
Month
One Year
Ago3.7 6.5
Down -43% Vs. Year Ago
10
.1
11
.2 12
.0
12
.2
9.9
13
.4
10
.5
9.0
8.5
7.0
6.1
6.9
6.5
7.6
7.5 7.8
6.1
7.8
7.1
5.1
4.3
3.6
3.6
3.5 3.7
0
2
4
6
8
10
12
14
16
Months of SupplyCurrent Month's Active Inventory/Current Month's Unit Sales
●
●
Total volume sold this August was 23%
greater than the same month one year
ago.
In August, there was 3.7 months of
supply available, compared to 6.5 in
August 2012. That was a decrease of
43% versus a year ago.
Highlights
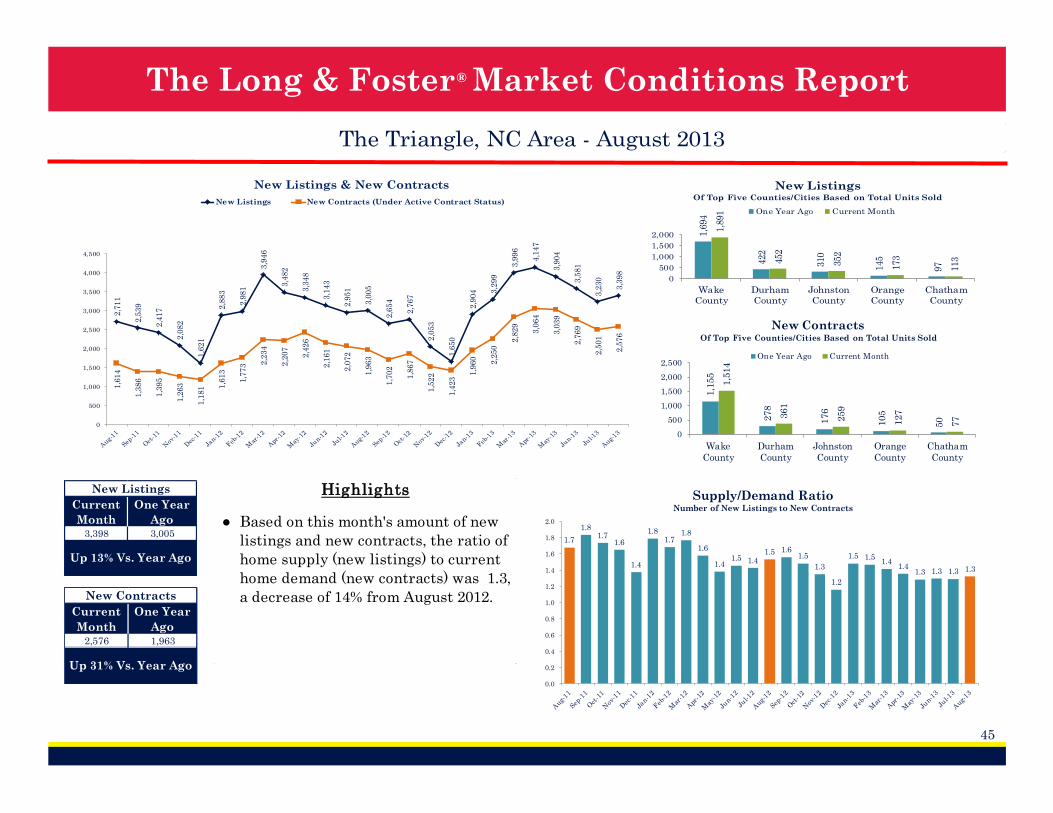
® The Long & Foster Market Conditions Report
45
The Triangle, NC Area - August 2013
2,7
11
2,5
39
2,4
17
2,0
82
1,6
21
2,8
83
2,9
81
3,9
46
3,4
82
3,3
48
3,1
43
2,9
51
3,0
05
2,6
54
2,7
67
2,0
53
1,6
50
2,9
04 3
,29
9
3,9
96
4,1
47
3,9
04
3,5
81
3,2
30
3,3
98
1,6
14
1,3
86
1,3
95
1,2
63
1,1
81 1
,61
3
1,7
73 2
,23
4
2,2
07
2,4
26
2,1
61
2,0
72
1,9
63
1,7
02
1,8
67
1,5
22
1,4
23
1,9
60 2,2
50
2,8
29
3,0
64
3,0
39
2,7
69
2,5
01
2,5
76
0
500
1,000
1,500
2,000
2,500
3,000
3,500
4,000
4,500
New Listings & New Contracts
New Listings New Contracts (Under Active Contract Status)
New Listings
Current
Month
One Year
Ago3,398 3,005
Up 13% Vs. Year Ago
New Contracts
Current
Month
One Year
Ago2,576 1,963
Up 31% Vs. Year Ago
1.7
1.81.7
1.6
1.4
1.81.7
1.8
1.6
1.41.5 1.4
1.5 1.61.5
1.3
1.2
1.5 1.51.4
1.41.3 1.3 1.3 1.3
0.0
0.2
0.4
0.6
0.8
1.0
1.2
1.4
1.6
1.8
2.0
Supply/Demand RatioNumber of New Listings to New Contracts
1,6
94
422
310
145
97
1,8
91
452
352
173
113
0
500
1,000
1,500
2,000
Wake
County
Durham
County
Johnston
County
Orange
County
Chatham
County
New ListingsOf Top Five Counties/Cities Based on Total Units Sold
One Year Ago Current Month
1,1
55
278
176
105
50
1,5
14
361
259
127
77
0
500
1,000
1,500
2,000
2,500
Wake
County
Durham
County
Johnston
County
Orange
County
Chatham
County
New ContractsOf Top Five Counties/Cities Based on Total Units Sold
One Year Ago Current Month
● Based on this month's amount of new
listings and new contracts, the ratio of
home supply (new listings) to current
home demand (new contracts) was 1.3,
a decrease of 14% from August 2012.
Highlights
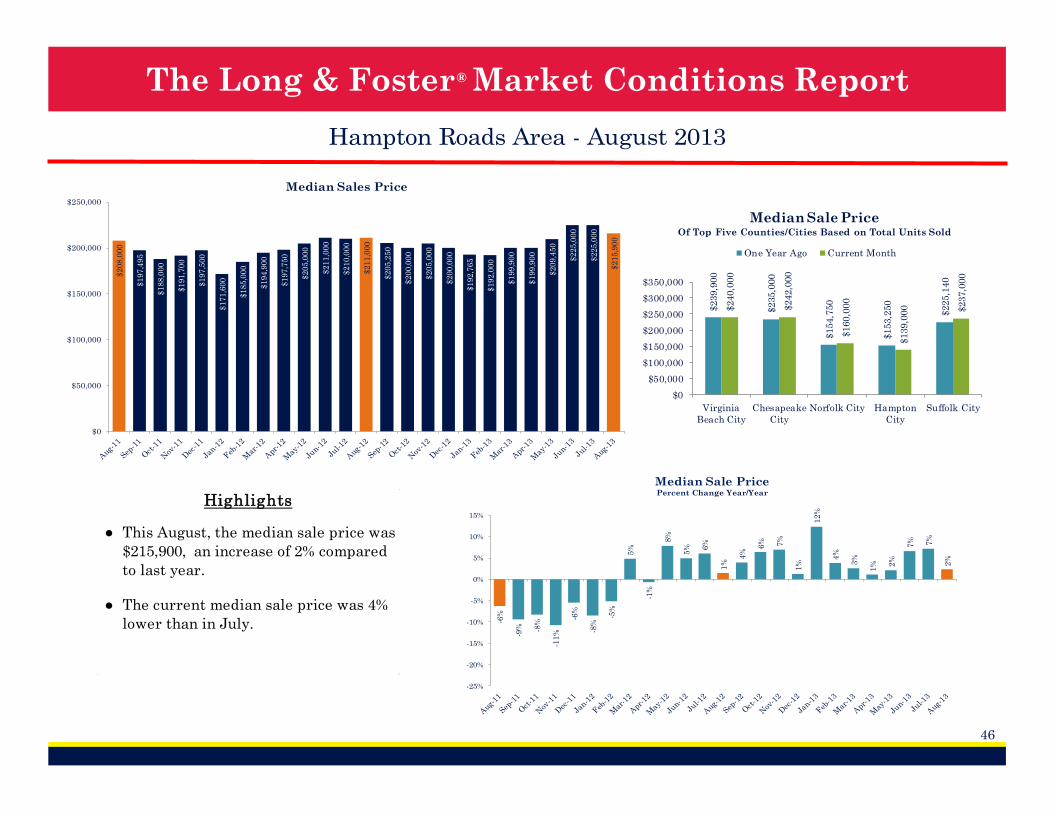
® The Long & Foster Market Conditions Report
46
Hampton Roads Area - August 2013
●
● The current median sale price was 4%
lower than in July.
This August, the median sale price was
$215,900, an increase of 2% compared
to last year.
Highlights
$2
08
,00
0
$1
97
,49
5
$1
88
,00
0
$1
91
,70
0
$1
97
,50
0
$1
71
,60
0
$1
85
,00
0
$1
94
,90
0
$1
97
,75
0
$2
05
,00
0
$2
11
,00
0
$2
10
,00
0
$2
11
,00
0
$2
05
,25
0
$2
00
,00
0
$2
05
,00
0
$2
00
,00
0
$1
92
,76
5
$1
92
,00
0
$1
99
,90
0
$1
99
,90
0
$2
09
,45
0
$2
25
,00
0
$2
25
,00
0
$2
15
,90
0
$0
$50,000
$100,000
$150,000
$200,000
$250,000
Median Sales Price
$239,9
00
$235,0
00
$154,7
50
$153,2
50
$225,1
40
$240,0
00
$242,0
00
$160,0
00
$139,0
00 $237,0
00
$0
$50,000
$100,000
$150,000
$200,000
$250,000
$300,000
$350,000
Virginia
Beach City
Chesapeake
City
Norfolk City Hampton
City
Suffolk City
Median Sale PriceOf Top Five Counties/Cities Based on Total Units Sold
One Year Ago Current Month
-6%
-9% -8
%
-11
%
-6%
-8%
-5%
5%
-1%
8%
5% 6
%
1%
4%
6% 7%
1%
12
%
4%
3%
1% 2
%
7% 7%
2%
-25%
-20%
-15%
-10%
-5%
0%
5%
10%
15%
Median Sale PricePercent Change Year/Year
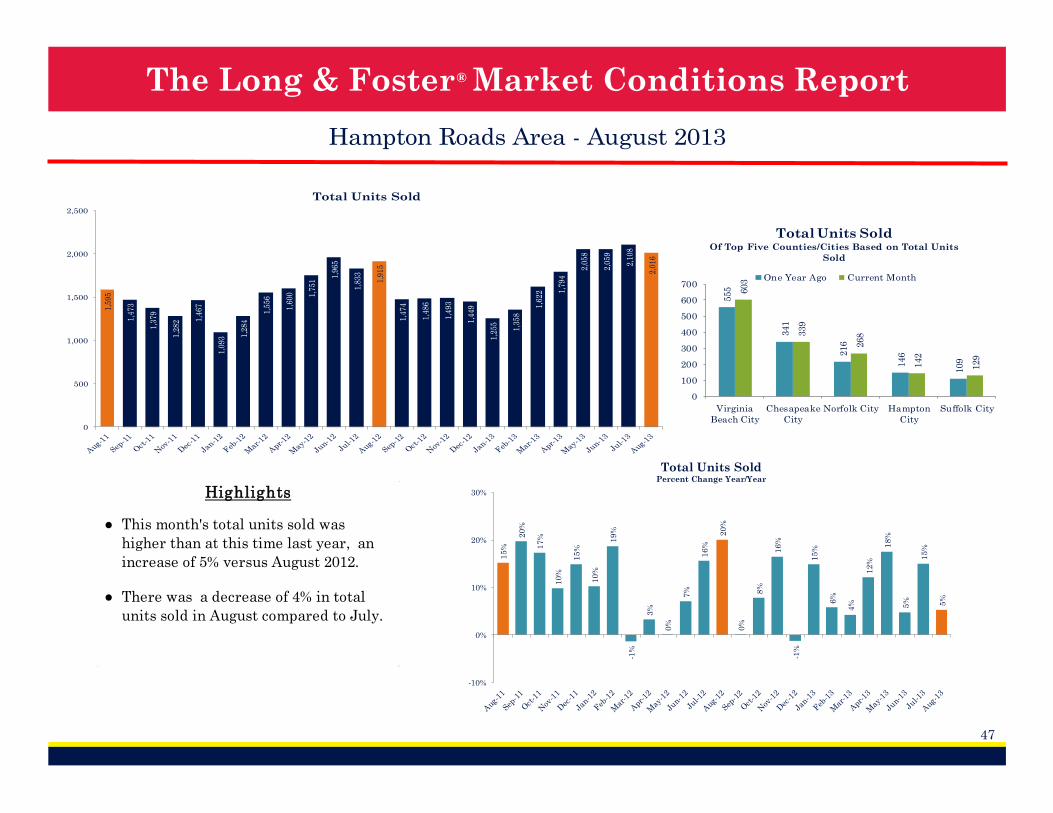
® The Long & Foster Market Conditions Report
47
Hampton Roads Area - August 2013
1,5
95
1,4
73
1,3
79
1,2
82 1
,46
7
1,0
93 1
,28
4
1,5
56
1,6
00 1,7
51
1,9
65
1,8
33
1,9
15
1,4
74
1,4
86
1,4
93
1,4
49
1,2
55
1,3
58
1,6
22 1
,79
4
2,0
58
2,0
59
2,1
08
2,0
16
0
500
1,000
1,500
2,000
2,500
Total Units Sold
555
341
216
146
109
603
339
268
142
129
0
100
200
300
400
500
600
700
Virginia
Beach City
Chesapeake
City
Norfolk City Hampton
City
Suffolk City
Total Units SoldOf Top Five Counties/Cities Based on Total Units
Sold
One Year Ago Current Month
●
● There was a decrease of 4% in total
units sold in August compared to July.
This month's total units sold was
higher than at this time last year, an
increase of 5% versus August 2012.
Highlights1
5%
20
%
17
%
10
%
15
%
10
%
19
%
-1%
3%
0%
7%
16
%
20
%
0%
8%
16
%
-1%
15
%
6%
4%
12
%
18
%
5%
15
%
5%
-10%
0%
10%
20%
30%
Total Units SoldPercent Change Year/Year
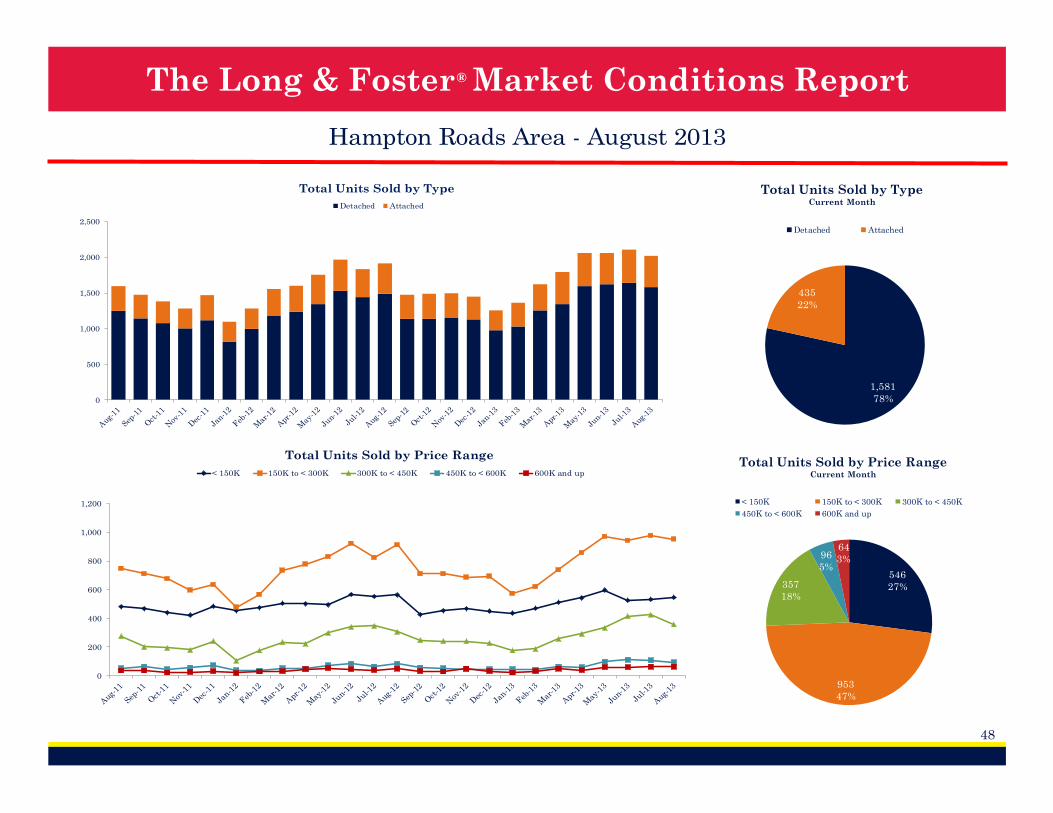
® The Long & Foster Market Conditions Report
48
Hampton Roads Area - August 2013
0
500
1,000
1,500
2,000
2,500
Total Units Sold by Type
Detached Attached
1,581
78%
435
22%
Total Units Sold by TypeCurrent Month
Detached Attached
546
27%
953
47%
357
18%
96
5%
64
3%
Total Units Sold by Price RangeCurrent Month
< 150K 150K to < 300K 300K to < 450K
450K to < 600K 600K and up
0
200
400
600
800
1,000
1,200
Total Units Sold by Price Range
< 150K 150K to < 300K 300K to < 450K 450K to < 600K 600K and up
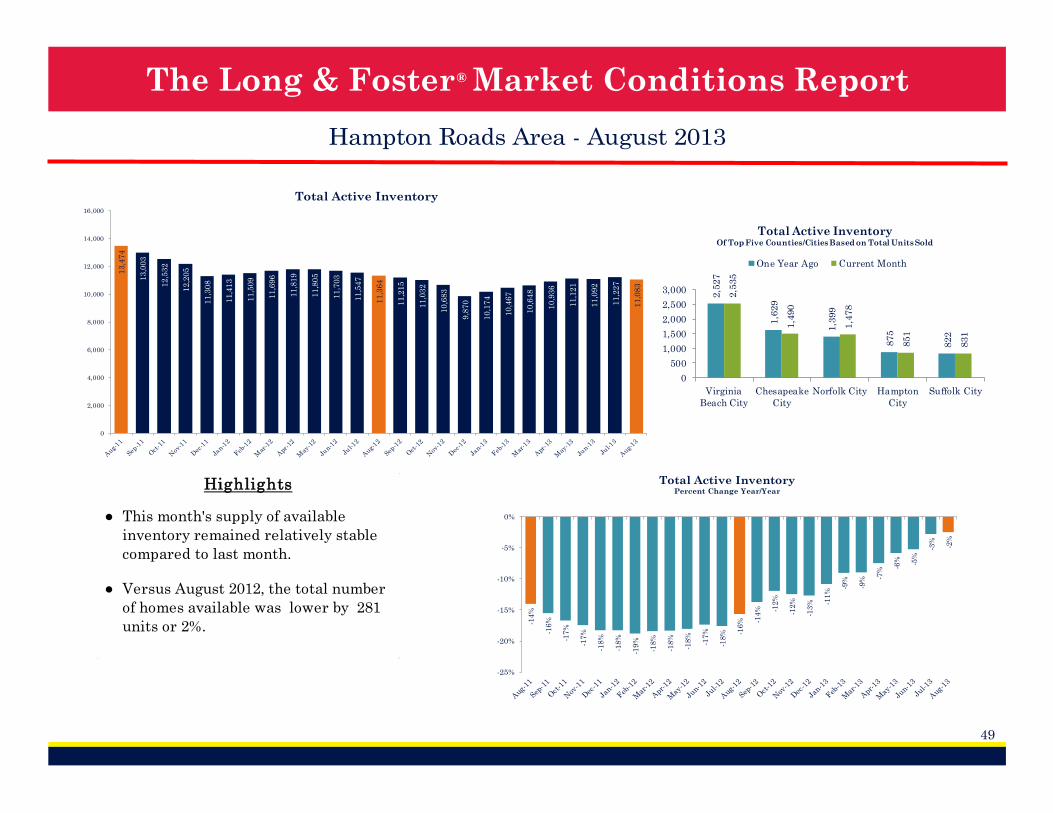
® The Long & Foster Market Conditions Report
49
Hampton Roads Area - August 2013
13
,47
4
13
,00
3
12
,53
2
12
,20
5
11
,30
8
11
,41
3
11
,50
9
11
,69
6
11
,81
9
11
,80
5
11
,70
3
11
,54
7
11
,36
4
11
,21
5
11
,03
2
10
,68
3
9,8
70
10
,17
4
10
,46
7
10
,64
8
10
,93
6
11
,12
1
11
,09
2
11
,22
7
11
,08
3
0
2,000
4,000
6,000
8,000
10,000
12,000
14,000
16,000
Total Active Inventory
2,5
27
1,6
29
1,3
99
875
822
2,5
35
1,4
90
1,4
78
851
831
0
500
1,000
1,500
2,000
2,500
3,000
Virginia
Beach City
Chesapeake
City
Norfolk City Hampton
City
Suffolk City
Total Active InventoryOf Top Five Counties/Cities Based on Total Units Sold
One Year Ago Current Month
-14
%
-16
%
-17
%
-17
%
-18
%
-18
%
-19
%
-18
%
-18
%
-18
%
-17
%
-18
% -16
% -14
% -12
%
-12
%
-13
% -11
%
-9%
-9% -7
%
-6% -5%
-3%
-2%
-25%
-20%
-15%
-10%
-5%
0%
Total Active InventoryPercent Change Year/Year
●
● Versus August 2012, the total number
of homes available was lower by 281
units or 2%.
This month's supply of available
inventory remained relatively stable
compared to last month.
Highlights

® The Long & Foster Market Conditions Report
50
Hampton Roads Area - August 2013
0
2,000
4,000
6,000
8,000
10,000
12,000
14,000
16,000
Total Active Inventory by Type
Detached Attached
8,737
79%
2,346
21%
Total Active Inventory
by TypeCurrent Month
Detached Attached
2,888
26%
4,739
43%
1,893
17%
749
7%
814
7%
Total Active Inventory by
Price RangeCurrent Month
< 150K 150K to < 300K 300K to < 450K
450K to < 600K 600K and up
0
2,000
4,000
6,000
8,000
10,000
12,000
14,000
16,000
Total Active Inventory by Price Range
< 150K 150K to < 300K 300K to < 450K 450K to < 600K 600K and up
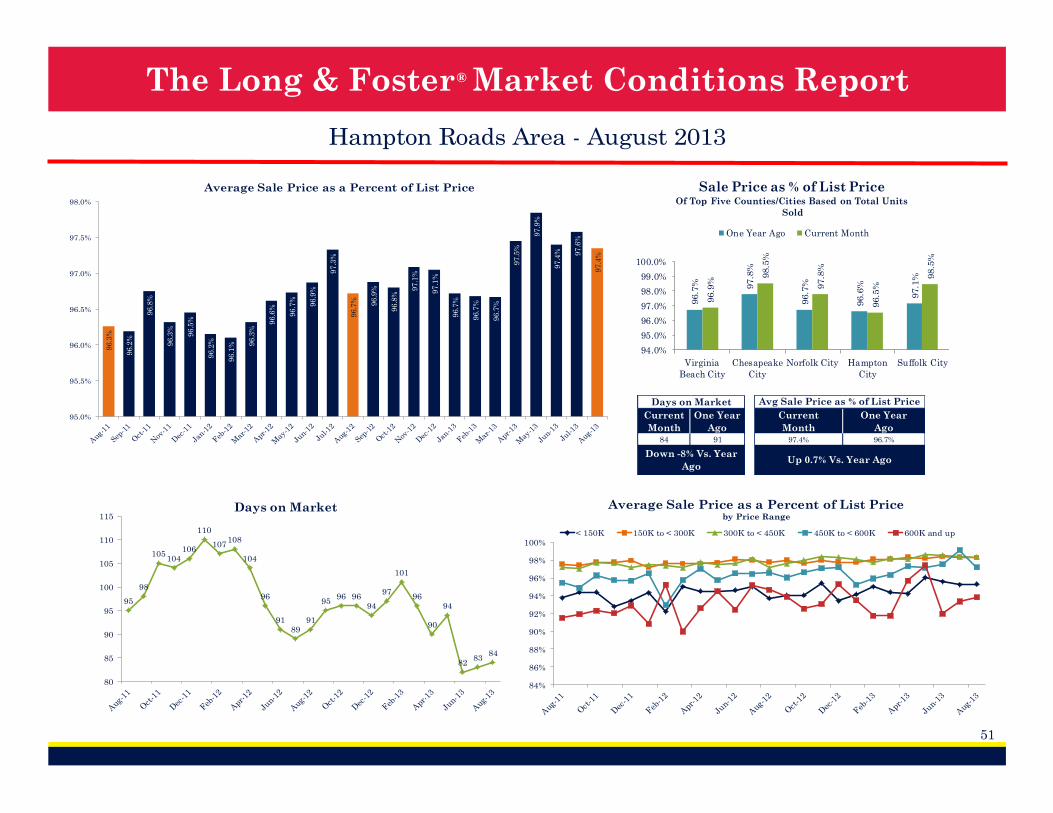
® The Long & Foster Market Conditions Report
51
Hampton Roads Area - August 2013
96
.3%
96
.2%
96
.8%
96
.3%
96
.5%
96
.2%
96
.1% 9
6.3
%
96
.6%
96
.7%
96
.9%
97
.3%
96
.7% 96
.9%
96
.8%
97
.1%
97
.1%
96
.7%
96
.7%
96
.7%
97
.5%
97
.9%
97
.4% 97
.6%
97
.4%
95.0%
95.5%
96.0%
96.5%
97.0%
97.5%
98.0%
Average Sale Price as a Percent of List Price
96.7
% 97.8
%
96.7
%
96.6
%
97.1
%
96.9
%
98.5
%
97.8
%
96.5
%
98.5
%
94.0%
95.0%
96.0%
97.0%
98.0%
99.0%
100.0%
Virginia
Beach City
Chesapeake
City
Norfolk City Hampton
City
Suffolk City
Sale Price as % of List PriceOf Top Five Counties/Cities Based on Total Units
Sold
One Year Ago Current Month
Days on Market
Current
Month
One Year
Ago84 91
Down -8% Vs. Year
Ago
Avg Sale Price as % of List Price
Current
Month
One Year
Ago97.4% 96.7%
Up 0.7% Vs. Year Ago
84%
86%
88%
90%
92%
94%
96%
98%
100%
Average Sale Price as a Percent of List Price by Price Range
< 150K 150K to < 300K 300K to < 450K 450K to < 600K 600K and up
95
98
105104
106
110
107108
104
96
9189
91
9596 96
94
97
101
96
90
94
8283
84
80
85
90
95
100
105
110
115Days on Market
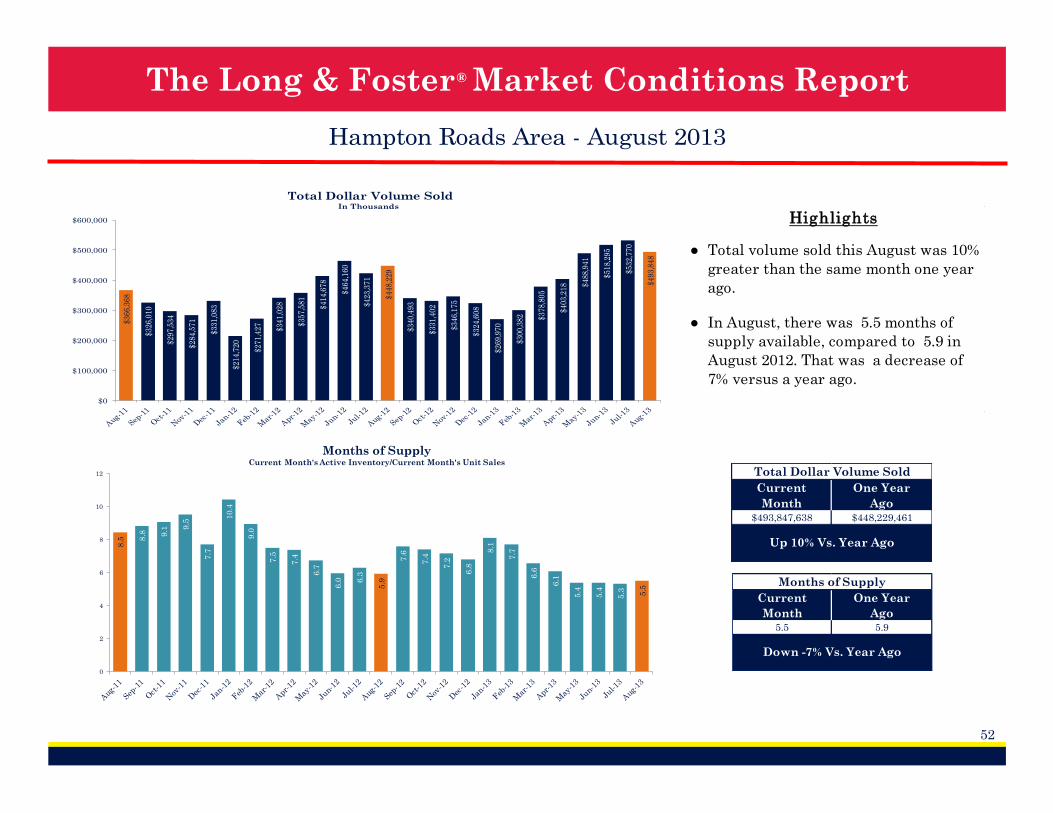
® The Long & Foster Market Conditions Report
52
Hampton Roads Area - August 2013
$3
66
,36
8
$3
26
,01
0
$2
97
,53
4
$2
84
,57
1
$3
31
,08
3
$2
14
,72
0
$2
71
,42
7
$3
41
,02
8
$3
57
,58
1
$4
14
,67
8
$4
64
,16
0
$4
23
,37
1
$4
48
,22
9
$3
40
,49
3
$3
31
,40
2
$3
46
,17
5
$3
24
,60
8
$2
69
,97
0
$3
00
,38
2 $3
78
,80
5
$4
03
,21
8 $4
88
,94
1
$5
18
,29
5
$5
32
,77
0
$4
93
,84
8
$0
$100,000
$200,000
$300,000
$400,000
$500,000
$600,000
Total Dollar Volume SoldIn Thousands
Total Dollar Volume Sold
Current
Month
One Year
Ago$493,847,638 $448,229,461
Up 10% Vs. Year Ago
Months of Supply
Current
Month
One Year
Ago5.5 5.9
Down -7% Vs. Year Ago
8.5 8
.8 9.1 9
.5
7.7
10
.4
9.0
7.5
7.4
6.7
6.0 6
.3
5.9
7.6
7.4
7.2
6.8
8.1
7.7
6.6
6.1
5.4
5.4
5.3 5.5
0
2
4
6
8
10
12
Months of SupplyCurrent Month's Active Inventory/Current Month's Unit Sales
●
●
Total volume sold this August was 10%
greater than the same month one year
ago.
In August, there was 5.5 months of
supply available, compared to 5.9 in
August 2012. That was a decrease of
7% versus a year ago.
Highlights
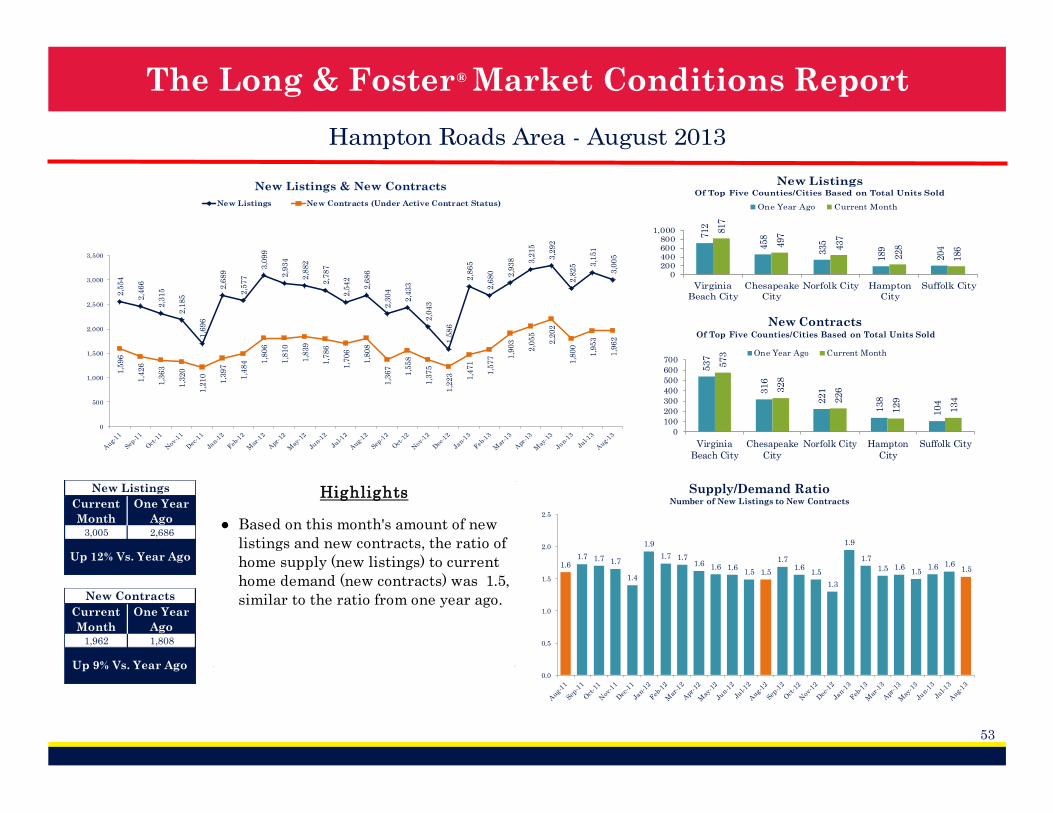
® The Long & Foster Market Conditions Report
53
Hampton Roads Area - August 2013
2,5
54
2,4
66
2,3
15
2,1
85
1,6
96
2,6
89
2,5
77
3,0
99
2,9
34
2,8
82
2,7
87
2,5
42
2,6
86
2,3
04
2,4
33
2,0
43
1,5
86
2,8
65
2,6
80 2,9
38 3,2
15
3,2
92
2,8
25 3
,15
1
3,0
05
1,5
96
1,4
26
1,3
63
1,3
20
1,2
10
1,3
97
1,4
84 1
,80
6
1,8
10
1,8
39
1,7
86
1,7
06
1,8
08
1,3
67
1,5
58
1,3
75
1,2
23 1,4
71
1,5
77 1
,90
3
2,0
55
2,2
02
1,8
00
1,9
53
1,9
62
0
500
1,000
1,500
2,000
2,500
3,000
3,500
New Listings & New Contracts
New Listings New Contracts (Under Active Contract Status)
New Listings
Current
Month
One Year
Ago3,005 2,686
Up 12% Vs. Year Ago
New Contracts
Current
Month
One Year
Ago1,962 1,808
Up 9% Vs. Year Ago
1.61.7 1.7 1.7
1.4
1.9
1.7 1.71.6 1.6 1.6
1.5 1.5
1.71.6
1.5
1.3
1.9
1.7
1.5 1.61.5
1.6 1.61.5
0.0
0.5
1.0
1.5
2.0
2.5
Supply/Demand RatioNumber of New Listings to New Contracts
712
458
335
189
204
817
497
437
228
186
0200400600800
1,000
Virginia
Beach City
Chesapeake
City
Norfolk City Hampton
City
Suffolk City
New ListingsOf Top Five Counties/Cities Based on Total Units Sold
One Year Ago Current Month
537
316
221
138
104
573
328
226
129
134
0
100
200
300
400
500
600
700
Virginia
Beach City
Chesapeake
City
Norfolk City Hampton
City
Suffolk City
New ContractsOf Top Five Counties/Cities Based on Total Units Sold
One Year Ago Current Month
● Based on this month's amount of new
listings and new contracts, the ratio of
home supply (new listings) to current
home demand (new contracts) was 1.5,
similar to the ratio from one year ago.
Highlights
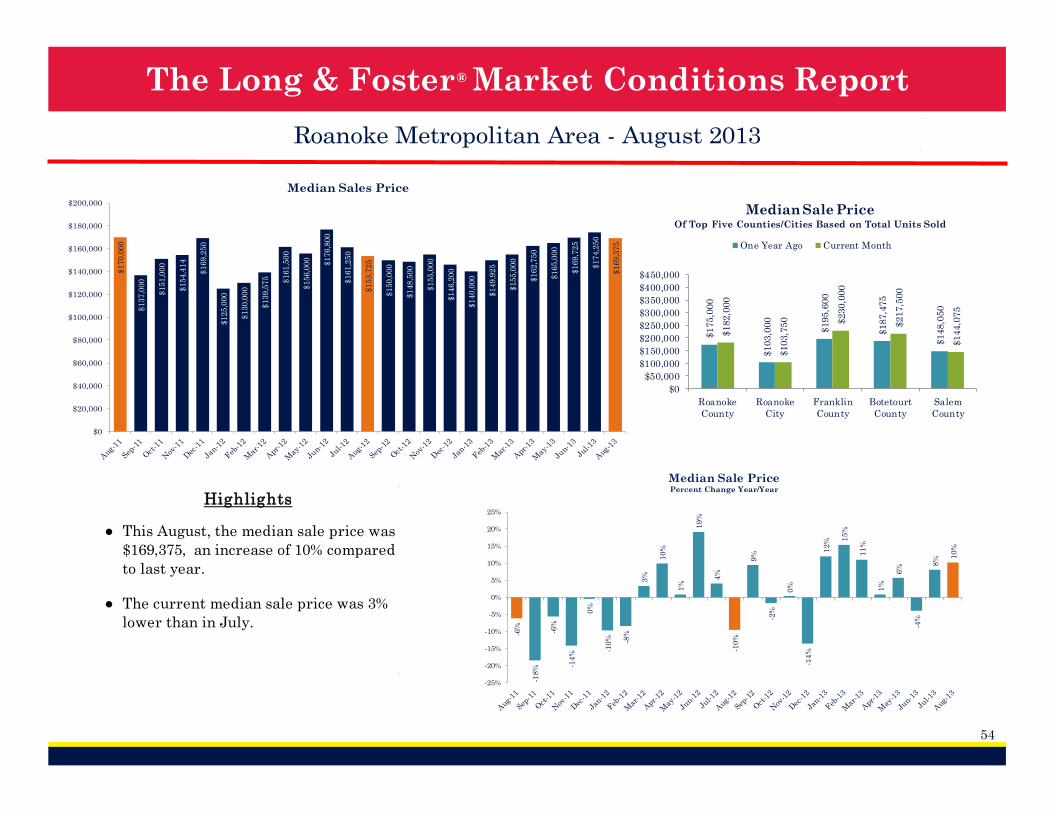
® The Long & Foster Market Conditions Report
54
Roanoke Metropolitan Area - August 2013
●
● The current median sale price was 3%
lower than in July.
This August, the median sale price was
$169,375, an increase of 10% compared
to last year.
Highlights
$1
70
,00
0
$1
37
,00
0
$1
51
,00
0
$1
54
,41
4
$1
69
,25
0
$1
25
,00
0
$1
30
,00
0
$1
39
,57
5 $1
61
,50
0
$1
56
,00
0
$1
76
,80
0
$1
61
,25
0
$1
53
,72
5
$1
50
,00
0
$1
48
,50
0
$1
55
,00
0
$1
46
,20
0
$1
40
,00
0
$1
49
,92
5
$1
55
,00
0
$1
62
,75
0
$1
65
,00
0
$1
69
,72
5
$1
74
,25
0
$1
69
,37
5
$0
$20,000
$40,000
$60,000
$80,000
$100,000
$120,000
$140,000
$160,000
$180,000
$200,000
Median Sales Price
$175,0
00
$103,0
00
$195,6
00
$187,4
75
$148,0
50
$182,0
00
$103,7
50 $230,0
00
$217,5
00
$144,0
75
$0
$50,000
$100,000
$150,000
$200,000
$250,000
$300,000
$350,000
$400,000
$450,000
Roanoke
County
Roanoke
City
Franklin
County
Botetourt
County
Salem
County
Median Sale PriceOf Top Five Counties/Cities Based on Total Units Sold
One Year Ago Current Month
-6%
-18
%
-6%
-14
%
0%
-10
% -8%
3%
10
%
1%
19
%
4%
-10
%
9%
-2%
0%
-14
%
12
% 15
%
11
%
1%
6%
-4%
8% 1
0%
-25%
-20%
-15%
-10%
-5%
0%
5%
10%
15%
20%
25%
Median Sale PricePercent Change Year/Year
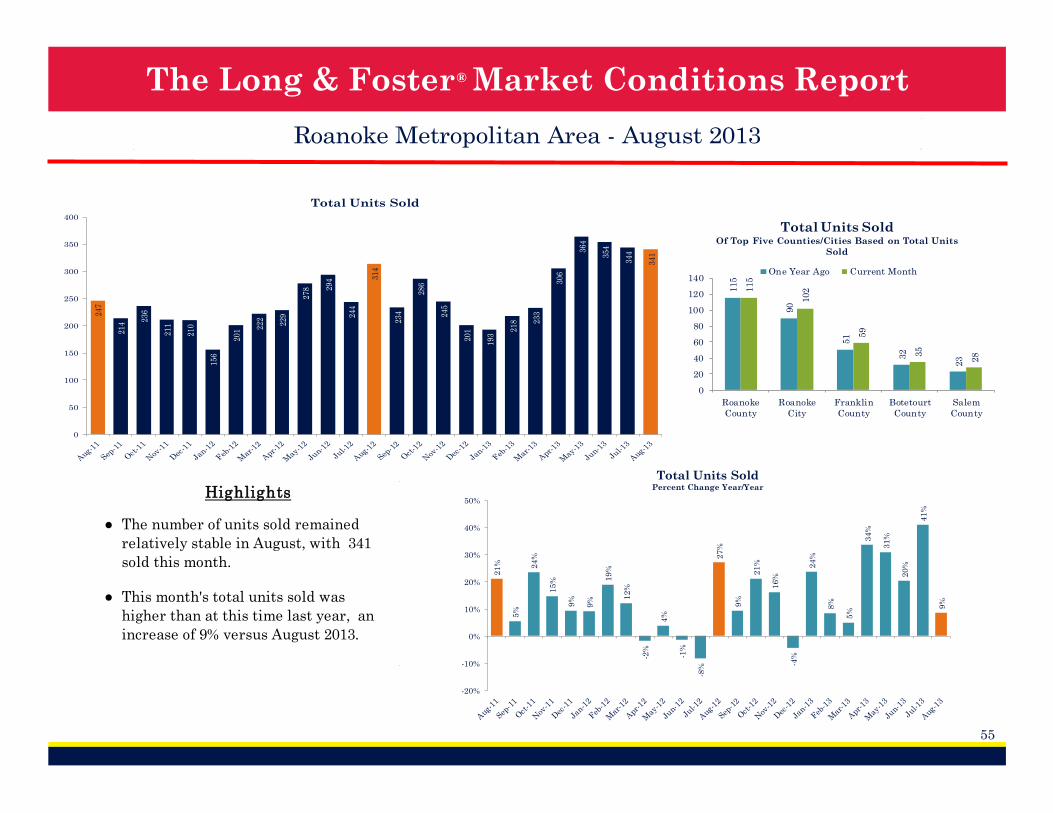
® The Long & Foster Market Conditions Report
55
Roanoke Metropolitan Area - August 2013
24
7
21
4 23
6
21
1
21
0
15
6
20
1 22
2
22
9
27
8 29
4
24
4
31
4
23
4
28
6
24
5
20
1
19
3
21
8 23
3
30
6
36
4
35
4
34
4
34
1
0
50
100
150
200
250
300
350
400
Total Units Sold
115
90
51
32
23
115
102
59
35
28
0
20
40
60
80
100
120
140
Roanoke
County
Roanoke
City
Franklin
County
Botetourt
County
Salem
County
Total Units SoldOf Top Five Counties/Cities Based on Total Units
Sold
One Year Ago Current Month
●
● This month's total units sold was
higher than at this time last year, an
increase of 9% versus August 2013.
The number of units sold remained
relatively stable in August, with 341
sold this month.
Highlights2
1%
5%
24
%
15
%
9%
9%
19
%
12
%
-2%
4%
-1%
-8%
27
%
9%
21
%
16
%
-4%
24
%
8%
5%
34
%
31
%
20
%
41
%
9%
-20%
-10%
0%
10%
20%
30%
40%
50%
Total Units SoldPercent Change Year/Year
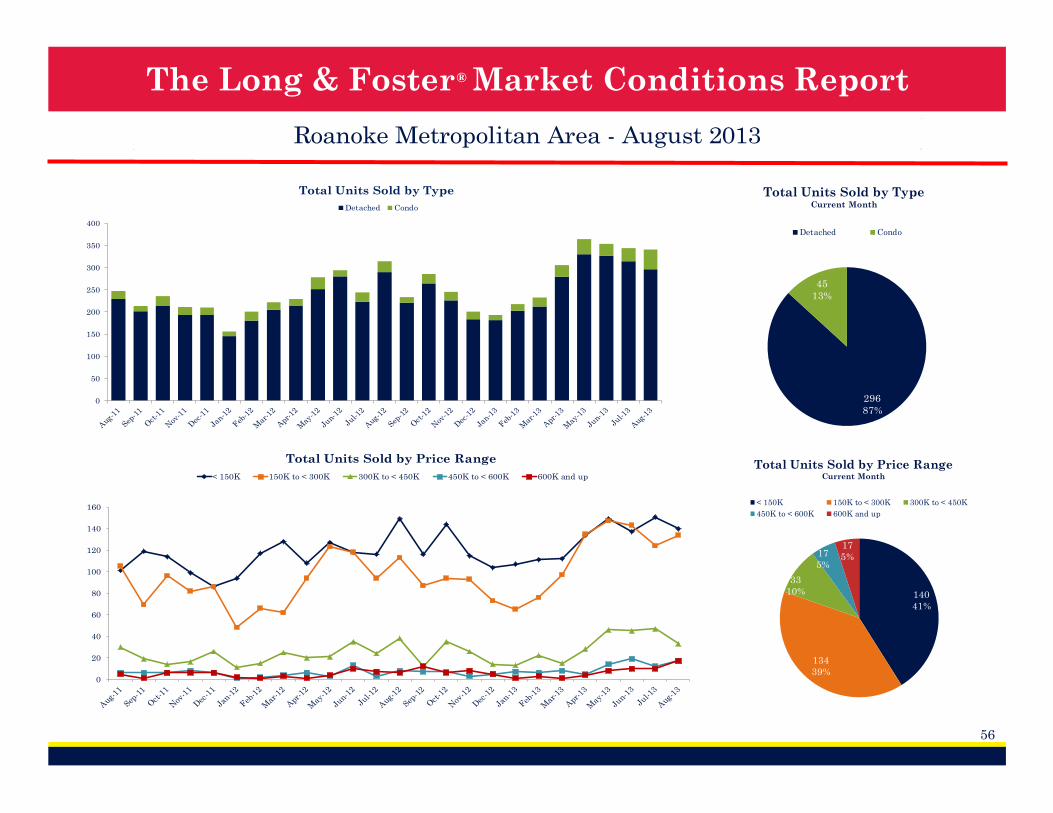
® The Long & Foster Market Conditions Report
56
Roanoke Metropolitan Area - August 2013
0
50
100
150
200
250
300
350
400
Total Units Sold by Type
Detached Condo
296
87%
45
13%
Total Units Sold by TypeCurrent Month
Detached Condo
140
41%
134
39%
33
10%
17
5%
17
5%
Total Units Sold by Price RangeCurrent Month
< 150K 150K to < 300K 300K to < 450K
450K to < 600K 600K and up
0
20
40
60
80
100
120
140
160
Total Units Sold by Price Range
< 150K 150K to < 300K 300K to < 450K 450K to < 600K 600K and up
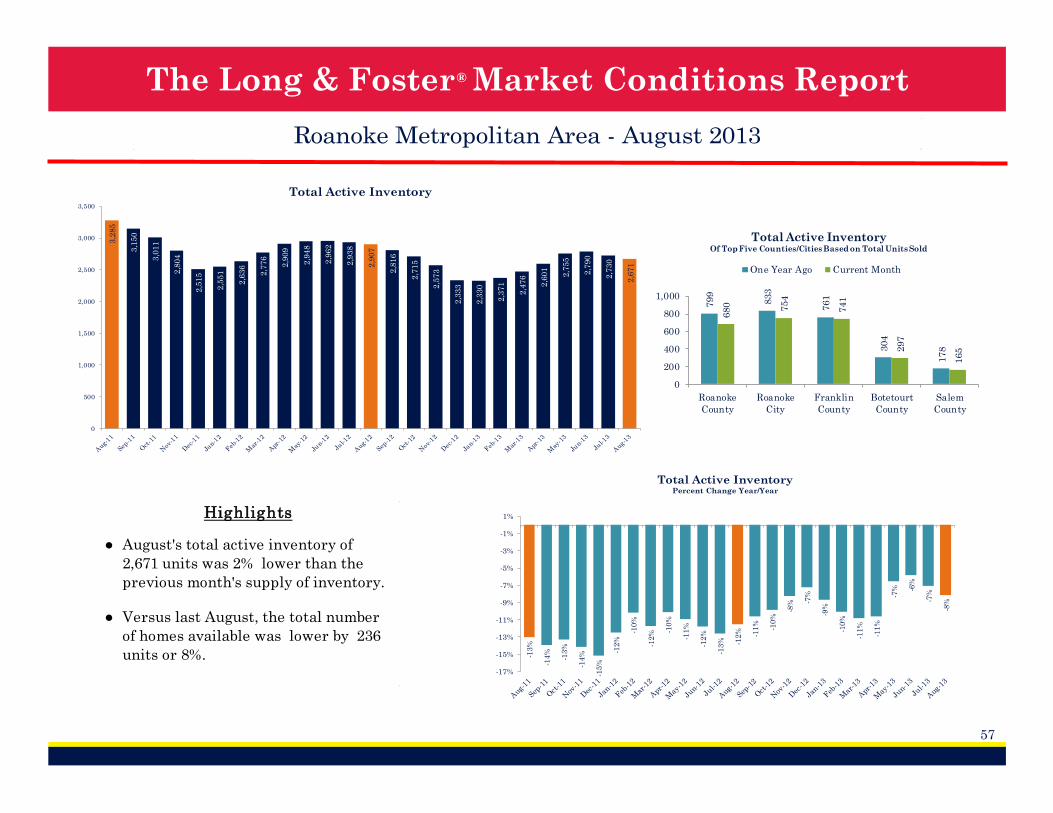
® The Long & Foster Market Conditions Report
57
Roanoke Metropolitan Area - August 2013
3,2
85
3,1
50
3,0
11
2,8
04
2,5
15
2,5
51
2,6
36
2,7
76
2,9
09
2,9
48
2,9
62
2,9
38
2,9
07
2,8
16
2,7
15
2,5
73
2,3
33
2,3
30
2,3
71
2,4
76
2,6
01
2,7
55
2,7
90
2,7
30
2,6
71
0
500
1,000
1,500
2,000
2,500
3,000
3,500
Total Active Inventory
799
833
761
304
178
680 754
741
297
165
0
200
400
600
800
1,000
Roanoke
County
Roanoke
City
Franklin
County
Botetourt
County
Salem
County
Total Active InventoryOf Top Five Counties/Cities Based on Total Units Sold
One Year Ago Current Month
-13
%
-14
%
-13
%
-14
%
-15
%
-12
%
-10
%
-12
% -10
%
-11
%
-12
%
-13
% -12
% -11
%
-10
%
-8% -7
%
-9%
-10
%
-11
%
-11
%
-7% -6
%
-7%
-8%
-17%
-15%
-13%
-11%
-9%
-7%
-5%
-3%
-1%
1%
Total Active InventoryPercent Change Year/Year
●
● Versus last August, the total number
of homes available was lower by 236
units or 8%.
August's total active inventory of
2,671 units was 2% lower than the
previous month's supply of inventory.
Highlights
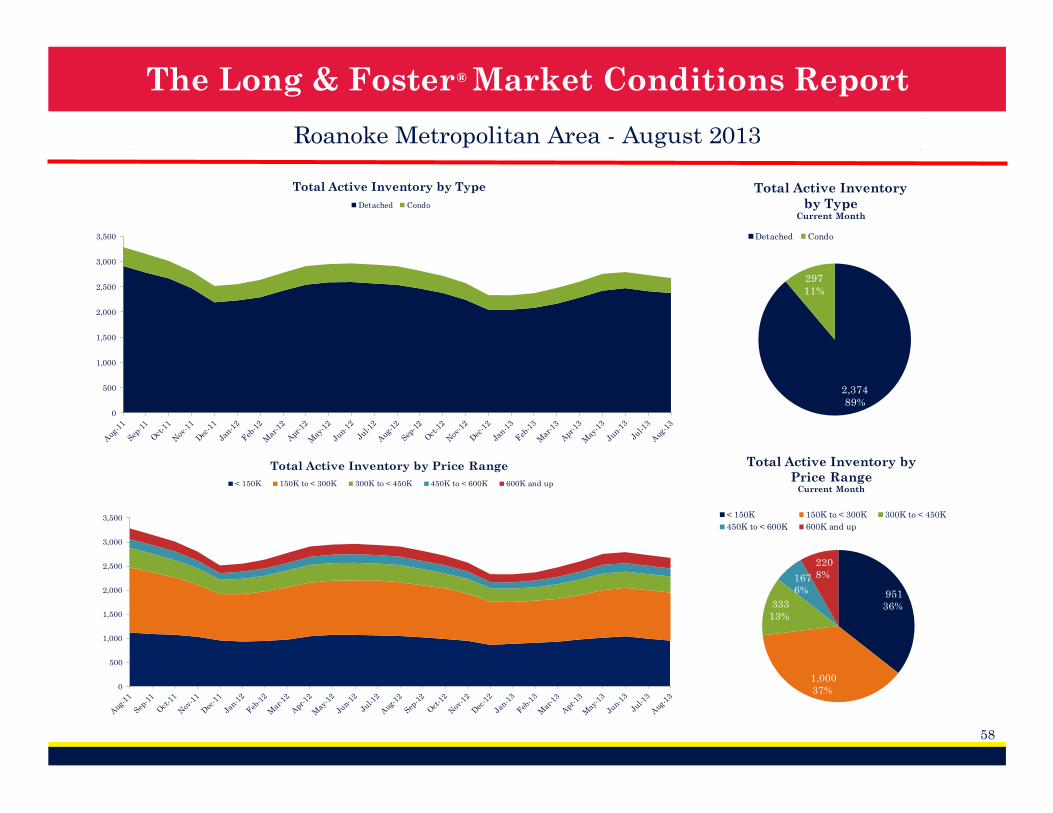
® The Long & Foster Market Conditions Report
58
Roanoke Metropolitan Area - August 2013
0
500
1,000
1,500
2,000
2,500
3,000
3,500
Total Active Inventory by Type
Detached Condo
2,374
89%
297
11%
Total Active Inventory
by TypeCurrent Month
Detached Condo
951
36%
1,000
37%
333
13%
167
6%
220
8%
Total Active Inventory by
Price RangeCurrent Month
< 150K 150K to < 300K 300K to < 450K
450K to < 600K 600K and up
0
500
1,000
1,500
2,000
2,500
3,000
3,500
Total Active Inventory by Price Range
< 150K 150K to < 300K 300K to < 450K 450K to < 600K 600K and up
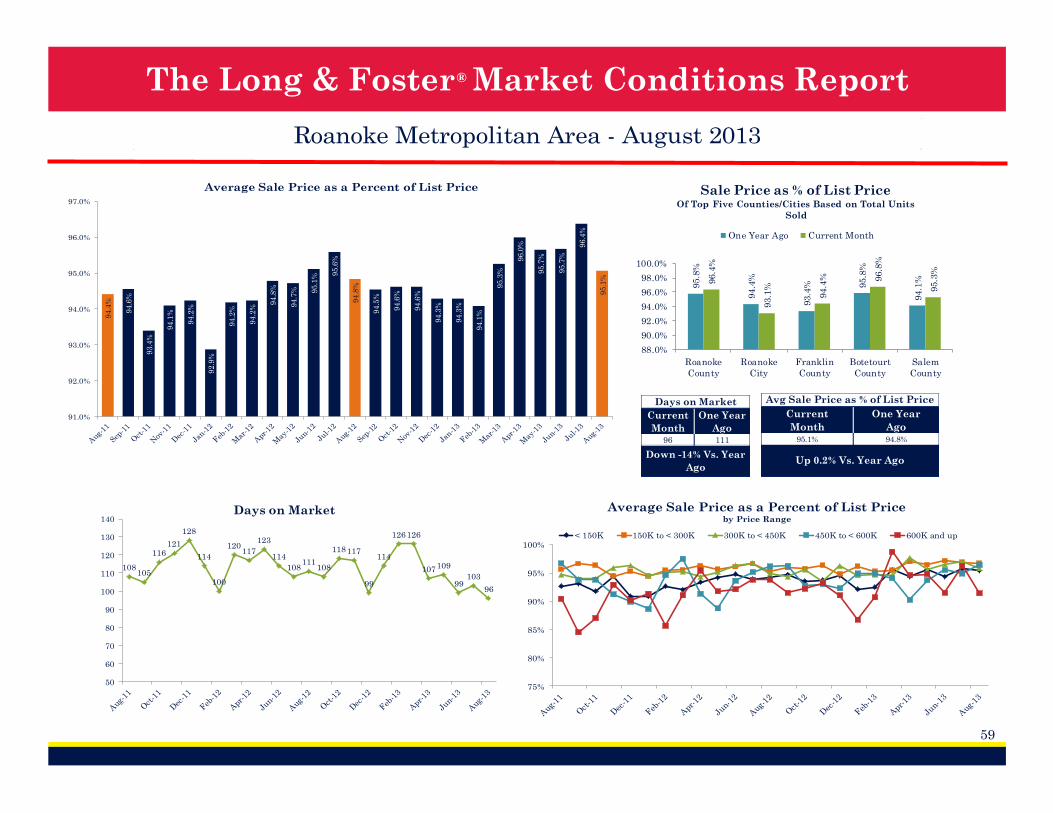
® The Long & Foster Market Conditions Report
59
Roanoke Metropolitan Area - August 2013
94
.4%
94
.6%
93
.4%
94
.1%
94
.2%
92
.9%
94
.2%
94
.2%
94
.8%
94
.7% 95
.1% 9
5.6
%
94
.8%
94
.5%
94
.6%
94
.6%
94
.3%
94
.3%
94
.1%
95
.3%
96
.0%
95
.7%
95
.7%
96
.4%
95
.1%
91.0%
92.0%
93.0%
94.0%
95.0%
96.0%
97.0%
Average Sale Price as a Percent of List Price
95.8
%
94.4
%
93.4
% 95.8
%
94.1
%96.4
%
93.1
%
94.4
% 96.8
%
95.3
%
88.0%
90.0%
92.0%
94.0%
96.0%
98.0%
100.0%
Roanoke
County
Roanoke
City
Franklin
County
Botetourt
County
Salem
County
Sale Price as % of List PriceOf Top Five Counties/Cities Based on Total Units
Sold
One Year Ago Current Month
Days on Market
Current
Month
One Year
Ago96 111
Down -14% Vs. Year
Ago
Avg Sale Price as % of List Price
Current
Month
One Year
Ago95.1% 94.8%
Up 0.2% Vs. Year Ago
75%
80%
85%
90%
95%
100%
Average Sale Price as a Percent of List Price by Price Range
< 150K 150K to < 300K 300K to < 450K 450K to < 600K 600K and up
108105
116121
128
114
100
120117
123
114
108111
108
118117
99
114
126126
107109
99103
96
50
60
70
80
90
100
110
120
130
140Days on Market
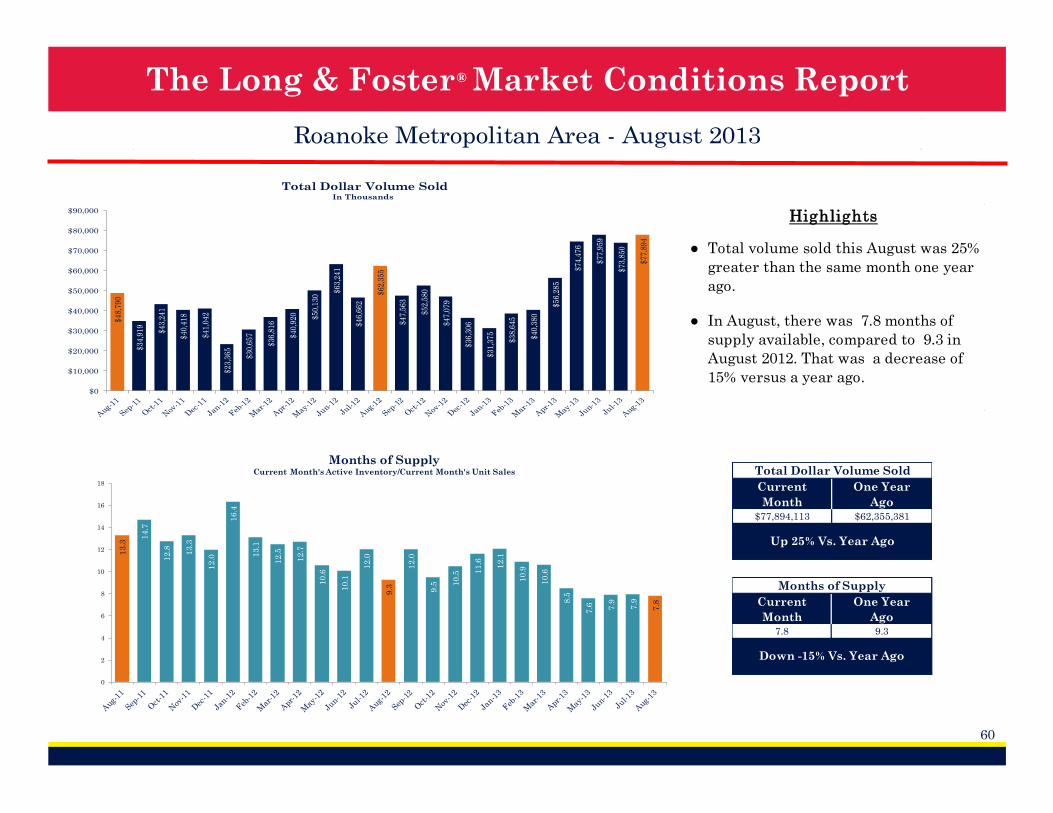
® The Long & Foster Market Conditions Report
60
Roanoke Metropolitan Area - August 2013$
48
,79
0
$3
4,9
19
$4
3,2
41
$4
0,4
18
$4
1,0
42
$2
3,3
65
$3
0,6
57
$3
6,8
16
$4
0,9
20 $5
0,1
30
$6
3,2
41
$4
6,6
62
$6
2,3
55
$4
7,5
63
$5
2,5
80
$4
7,0
79
$3
6,3
06
$3
1,3
75
$3
8,6
45
$4
0,3
80
$5
6,2
85
$7
4,4
76
$7
7,9
59
$7
3,8
50
$7
7,8
94
$0
$10,000
$20,000
$30,000
$40,000
$50,000
$60,000
$70,000
$80,000
$90,000
Total Dollar Volume SoldIn Thousands
Total Dollar Volume Sold
Current
Month
One Year
Ago$77,894,113 $62,355,381
Up 25% Vs. Year Ago
Months of Supply
Current
Month
One Year
Ago7.8 9.3
Down -15% Vs. Year Ago
13
.3
14
.7
12
.8 13
.3
12
.0
16
.4
13
.1
12
.5
12
.7
10
.6
10
.1
12
.0
9.3
12
.0
9.5 1
0.5 1
1.6
12
.1
10
.9
10
.6
8.5
7.6 7.9
7.9
7.8
0
2
4
6
8
10
12
14
16
18
Months of SupplyCurrent Month's Active Inventory/Current Month's Unit Sales
●
●
Total volume sold this August was 25%
greater than the same month one year
ago.
In August, there was 7.8 months of
supply available, compared to 9.3 in
August 2012. That was a decrease of
15% versus a year ago.
Highlights

® The Long & Foster Market Conditions Report
61
Roanoke Metropolitan Area - August 20135
44
51
8
44
8
38
1
33
5
55
1
49
5
66
4
66
2
55
1
53
2
52
0
52
6
47
5
46
4
36
9
29
4
49
4 51
9
69
2 72
3
69
7
53
8 56
8
57
6
25
3
22
9
21
0
20
2
16
8
22
8
20
4
28
0
29
4
29
5
25
3 27
9
28
2
24
9
23
7
20
1
17
2
25
3
25
3
33
7 38
9
34
2
30
0 34
6
32
6
0
100
200
300
400
500
600
700
800
New Listings & New Contracts
New Listings New Contracts (Under Active Contract Status)
New Listings
Current
Month
One Year
Ago576 526
Up 10% Vs. Year Ago
New Contracts
Current
Month
One Year
Ago326 282
Up 16% Vs. Year Ago
2.22.3
2.1
1.92.0
2.4 2.4 2.42.3
1.9
2.1
1.9 1.9 1.9 2.01.8
1.7
2.02.1 2.1
1.9
2.0
1.81.6
1.8
0.0
0.5
1.0
1.5
2.0
2.5
3.0
Supply/Demand RatioNumber of New Listings to New Contracts
160
168
87
62
41
174
159
115
79
44
0
50
100
150
200
Roanoke
County
Roanoke
City
Franklin
County
Botetourt
County
Salem
County
New ListingsOf Top Five Counties/Cities Based on Total Units Sold
One Year Ago Current Month
92
86
47
33
20
112
95
57
33
23
0
50
100
150
Roanoke
County
Roanoke
City
Franklin
County
Botetourt
County
Salem
County
New ContractsOf Top Five Counties/Cities Based on Total Units Sold
One Year Ago Current Month
● Based on this month's amount of new
listings and new contracts, the ratio of
home supply (new listings) to current
home demand (new contracts) was 1.8,
a decrease of 5% from August 2012.
Highlights
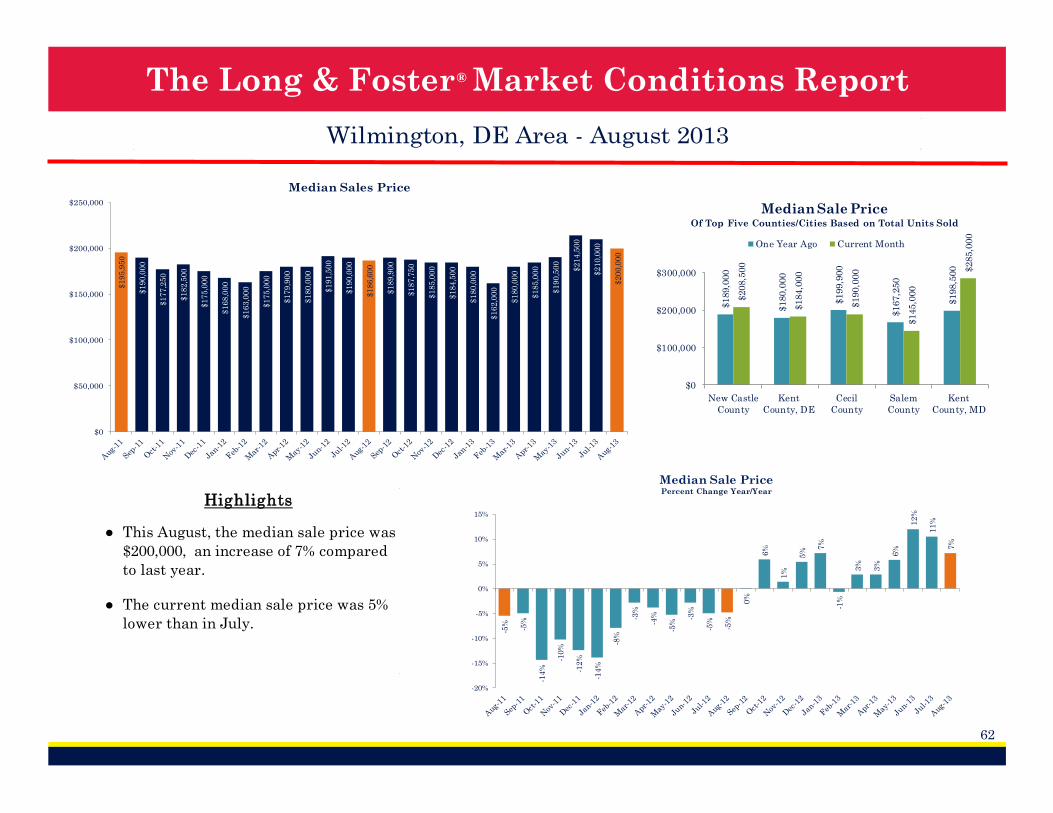
® The Long & Foster Market Conditions Report
62
Wilmington, DE Area - August 2013
$1
95
,95
0
$1
90
,00
0
$1
77
,25
0
$1
82
,50
0
$1
75
,00
0
$1
68
,00
0
$1
63
,00
0
$1
75
,00
0
$1
79
,90
0
$1
80
,00
0
$1
91
,50
0
$1
90
,00
0
$1
86
,60
0
$1
89
,90
0
$1
87
,75
0
$1
85
,00
0
$1
84
,50
0
$1
80
,00
0
$1
62
,00
0
$1
80
,00
0
$1
85
,00
0
$1
90
,50
0
$2
14
,50
0
$2
10
,00
0
$2
00
,00
0
$0
$50,000
$100,000
$150,000
$200,000
$250,000
Median Sales Price
$189,0
00
$180,0
00
$199,9
00
$167,2
50
$198,5
00
$208,5
00
$184,0
00
$190,0
00
$145,0
00
$285,0
00
$0
$100,000
$200,000
$300,000
New Castle
County
Kent
County, DE
Cecil
County
Salem
County
Kent
County, MD
Median Sale PriceOf Top Five Counties/Cities Based on Total Units Sold
One Year Ago Current Month
-5%
-5%
-14
%
-10
%
-12
%
-14
%
-8%
-3%
-4%
-5%
-3%
-5%
-5%
0%
6%
1%
5%
7%
-1%
3%
3%
6%
12
%
11
%
7%
-20%
-15%
-10%
-5%
0%
5%
10%
15%
Median Sale PricePercent Change Year/Year
●
●
Highlights
This August, the median sale price was
$200,000, an increase of 7% compared
to last year.
The current median sale price was 5%
lower than in July.
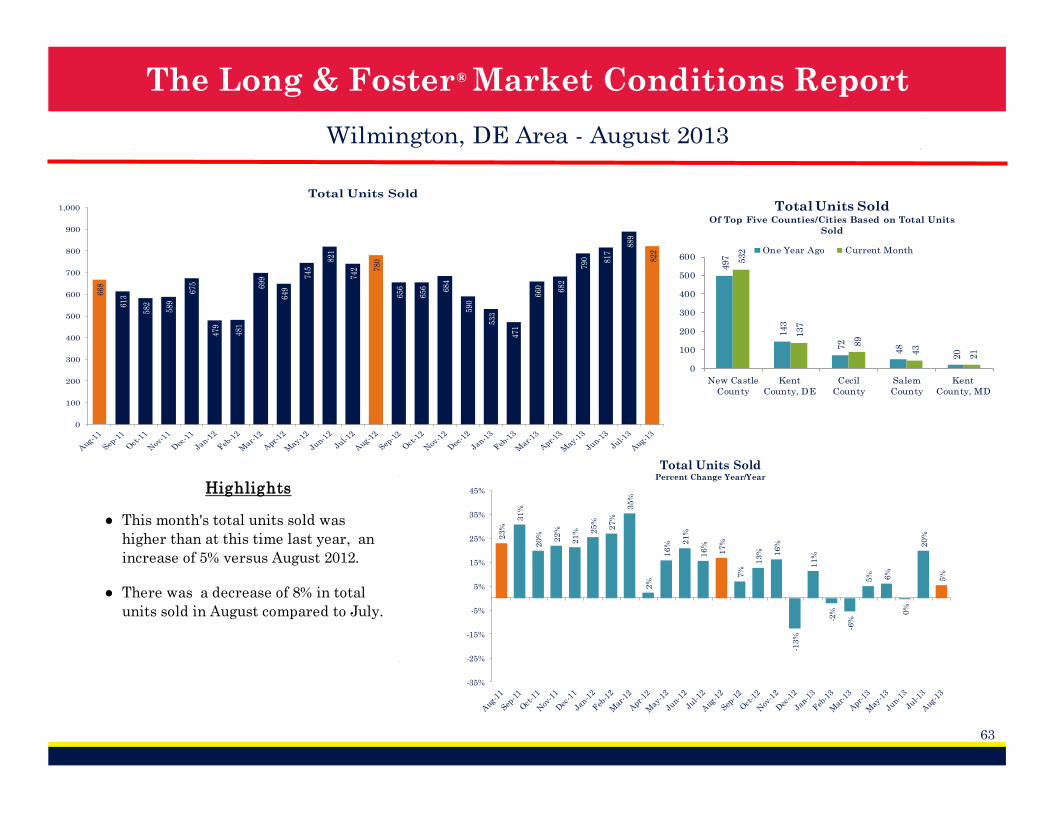
® The Long & Foster Market Conditions Report
63
Wilmington, DE Area - August 2013
668
61
3
582
58
9
67
5
479
481
69
9
649
745
82
1
742 78
0
65
6
65
6 684
590
53
3
471
660 68
2
790 81
7
889
822
0
100
200
300
400
500
600
700
800
900
1,000
Total Units Sold
497
143
72
48
20
532
137
89
43
21
0
100
200
300
400
500
600
New Castle
County
Kent
County, DE
Cecil
County
Salem
County
Kent
County, MD
Total Units SoldOf Top Five Counties/Cities Based on Total Units
Sold
One Year Ago Current Month
23
%
31
%
20
%
22
%
21
% 25
%
27
%
35
%
2%
16
% 21
%
16
%
17
%
7%
13
% 16
%
-13
%
11
%
-2%
-6%
5% 6%
0%
20
%
5%
-35%
-25%
-15%
-5%
5%
15%
25%
35%
45%
Total Units SoldPercent Change Year/Year
●
●
Highlights
This month's total units sold was
higher than at this time last year, an
increase of 5% versus August 2012.
There was a decrease of 8% in total
units sold in August compared to July.
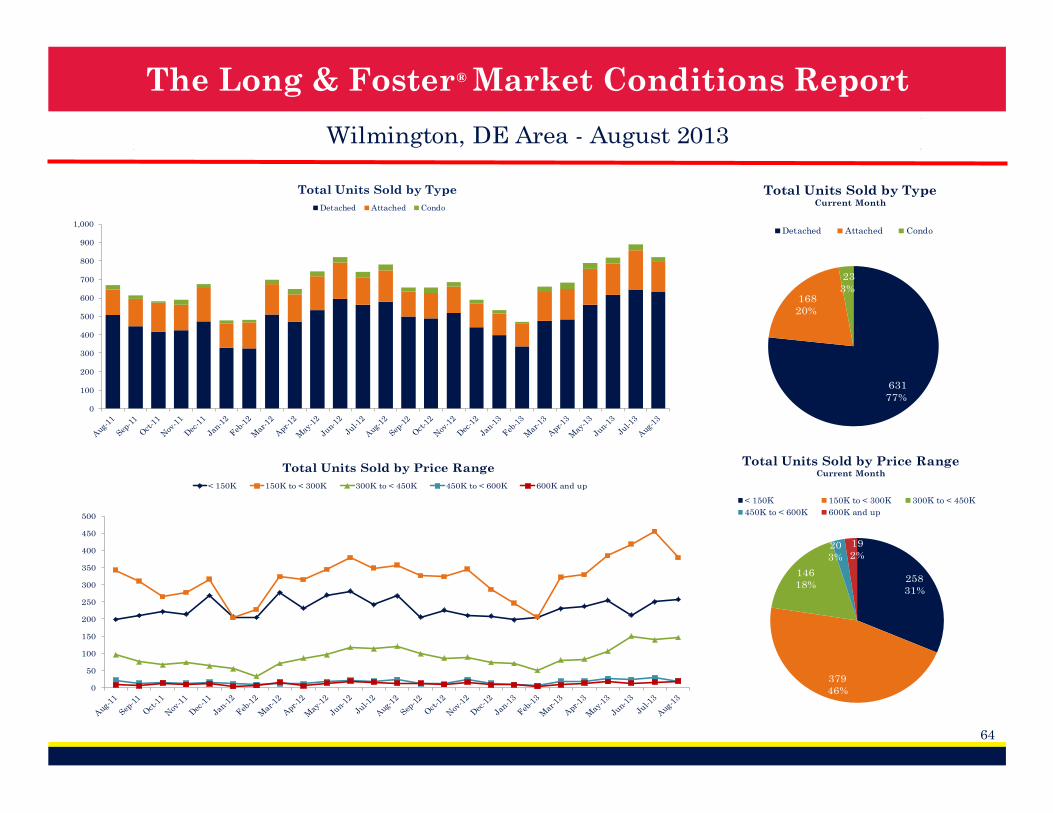
® The Long & Foster Market Conditions Report
64
Wilmington, DE Area - August 2013
0
100
200
300
400
500
600
700
800
900
1,000
Total Units Sold by Type
Detached Attached Condo
631
77%
168
20%
23
3%
Total Units Sold by TypeCurrent Month
Detached Attached Condo
258
31%
379
46%
146
18%
20
3%
19
2%
Total Units Sold by Price RangeCurrent Month
< 150K 150K to < 300K 300K to < 450K
450K to < 600K 600K and up
0
50
100
150
200
250
300
350
400
450
500
Total Units Sold by Price Range
< 150K 150K to < 300K 300K to < 450K 450K to < 600K 600K and up
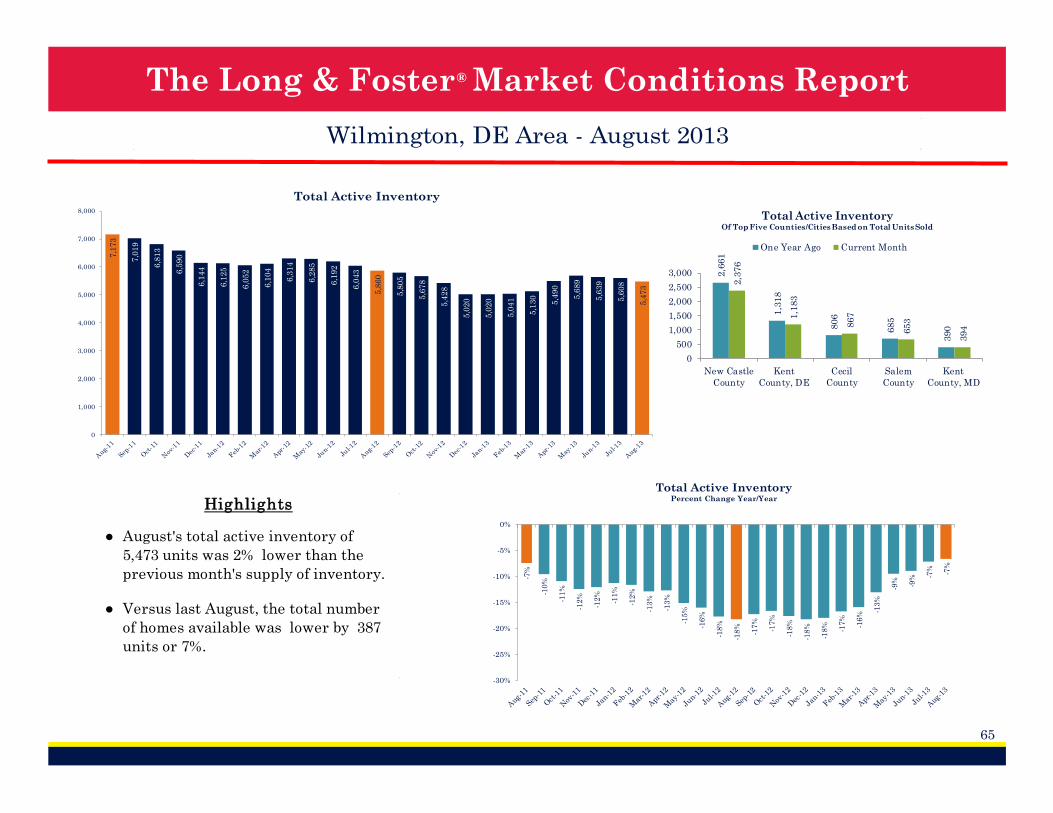
® The Long & Foster Market Conditions Report
65
Wilmington, DE Area - August 2013
7,1
73
7,0
19
6,8
13
6,5
90
6,1
44
6,1
25
6,0
52
6,1
04
6,3
14
6,2
85
6,1
92
6,0
43
5,8
60
5,8
05
5,6
78
5,4
28
5,0
20
5,0
20
5,0
41
5,1
30
5,4
90
5,6
89
5,6
39
5,6
08
5,4
73
0
1,000
2,000
3,000
4,000
5,000
6,000
7,000
8,000
Total Active Inventory
2,6
61
1,3
18
806
685
390
2,3
76
1,1
83
867
653
394
0
500
1,000
1,500
2,000
2,500
3,000
New Castle
County
Kent
County, DE
Cecil
County
Salem
County
Kent
County, MD
Total Active InventoryOf Top Five Counties/Cities Based on Total Units Sold
One Year Ago Current Month
-7%
-10
%
-11
%
-12
%
-12
%
-11
%
-12
%
-13
%
-13
%
-15
%
-16
%
-18
%
-18
%
-17
%
-17
%
-18
%
-18
%
-18
%
-17
%
-16
%
-13
%
-9%
-9% -7
% -7%
-30%
-25%
-20%
-15%
-10%
-5%
0%
Total Active InventoryPercent Change Year/Year
●
●
Highlights
August's total active inventory of
5,473 units was 2% lower than the
previous month's supply of inventory.
Versus last August, the total number
of homes available was lower by 387
units or 7%.
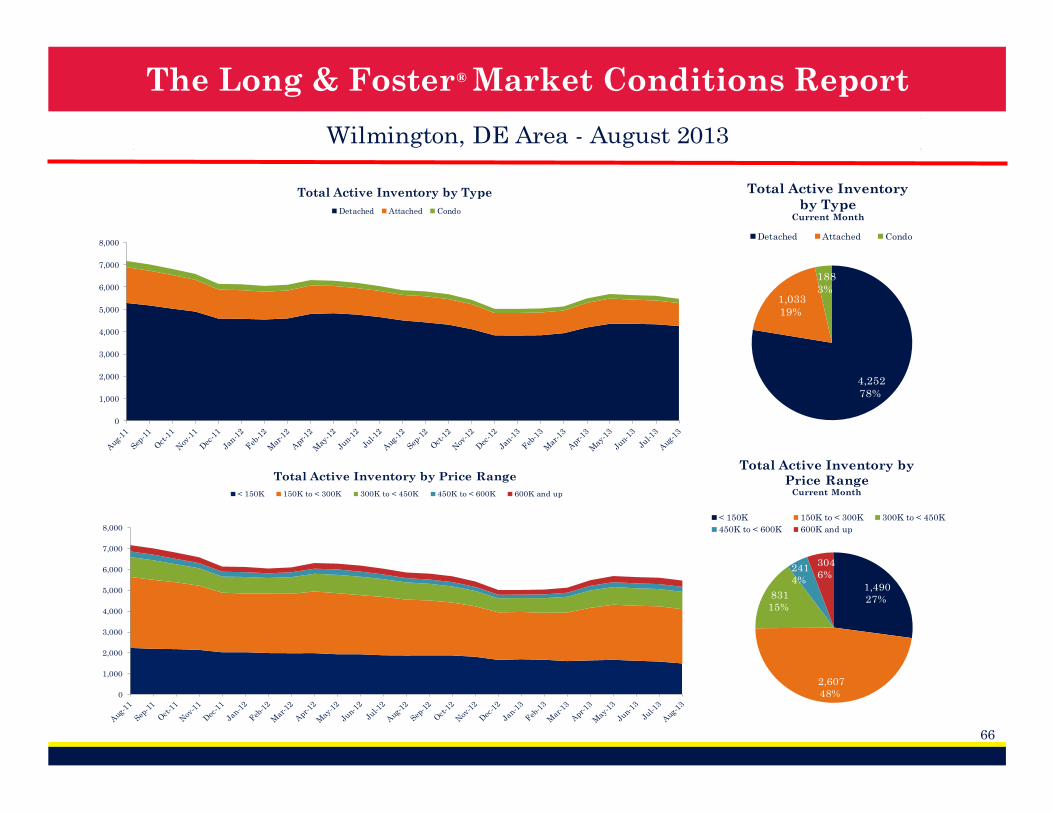
® The Long & Foster Market Conditions Report
66
Wilmington, DE Area - August 2013
0
1,000
2,000
3,000
4,000
5,000
6,000
7,000
8,000
Total Active Inventory by Type
Detached Attached Condo
4,252
78%
1,033
19%
188
3%
Total Active Inventory
by TypeCurrent Month
Detached Attached Condo
1,490
27%
2,607
48%
831
15%
241
4%
304
6%
Total Active Inventory by
Price RangeCurrent Month
< 150K 150K to < 300K 300K to < 450K
450K to < 600K 600K and up
0
1,000
2,000
3,000
4,000
5,000
6,000
7,000
8,000
Total Active Inventory by Price Range
< 150K 150K to < 300K 300K to < 450K 450K to < 600K 600K and up
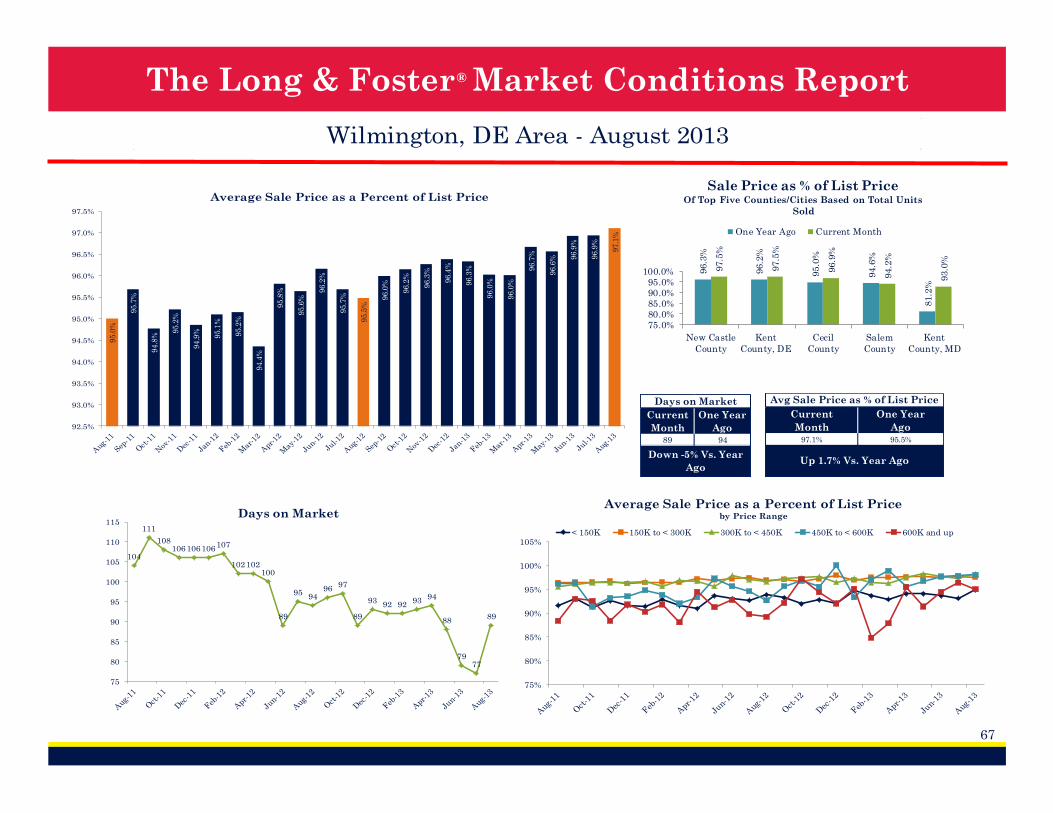
® The Long & Foster Market Conditions Report
67
Wilmington, DE Area - August 2013
95
.0%
95
.7%
94
.8%
95
.2%
94
.9%
95
.1%
95
.2%
94
.4%
95
.8%
95
.6%
96
.2%
95
.7%
95
.5%
96
.0%
96
.2%
96
.3%
96
.4%
96
.3%
96
.0%
96
.0%
96
.7%
96
.6% 9
6.9
%
96
.9%
97
.1%
92.5%
93.0%
93.5%
94.0%
94.5%
95.0%
95.5%
96.0%
96.5%
97.0%
97.5%
Average Sale Price as a Percent of List Price
96.3
%
96.2
%
95.0
%
94.6
%
81.2
%
97.5
%
97.5
%
96.9
%
94.2
%
93.0
%
75.0%80.0%85.0%90.0%95.0%
100.0%
New Castle
County
Kent
County, DE
Cecil
County
Salem
County
Kent
County, MD
Sale Price as % of List PriceOf Top Five Counties/Cities Based on Total Units
Sold
One Year Ago Current Month
Days on Market
Current
Month
One Year
Ago89 94
Down -5% Vs. Year
Ago
Avg Sale Price as % of List Price
Current
Month
One Year
Ago97.1% 95.5%
Up 1.7% Vs. Year Ago
75%
80%
85%
90%
95%
100%
105%
Average Sale Price as a Percent of List Price by Price Range
< 150K 150K to < 300K 300K to < 450K 450K to < 600K 600K and up
104
111
108106106106
107
102102100
89
9594
9697
89
9392 92
9394
88
7977
89
75
80
85
90
95
100
105
110
115Days on Market
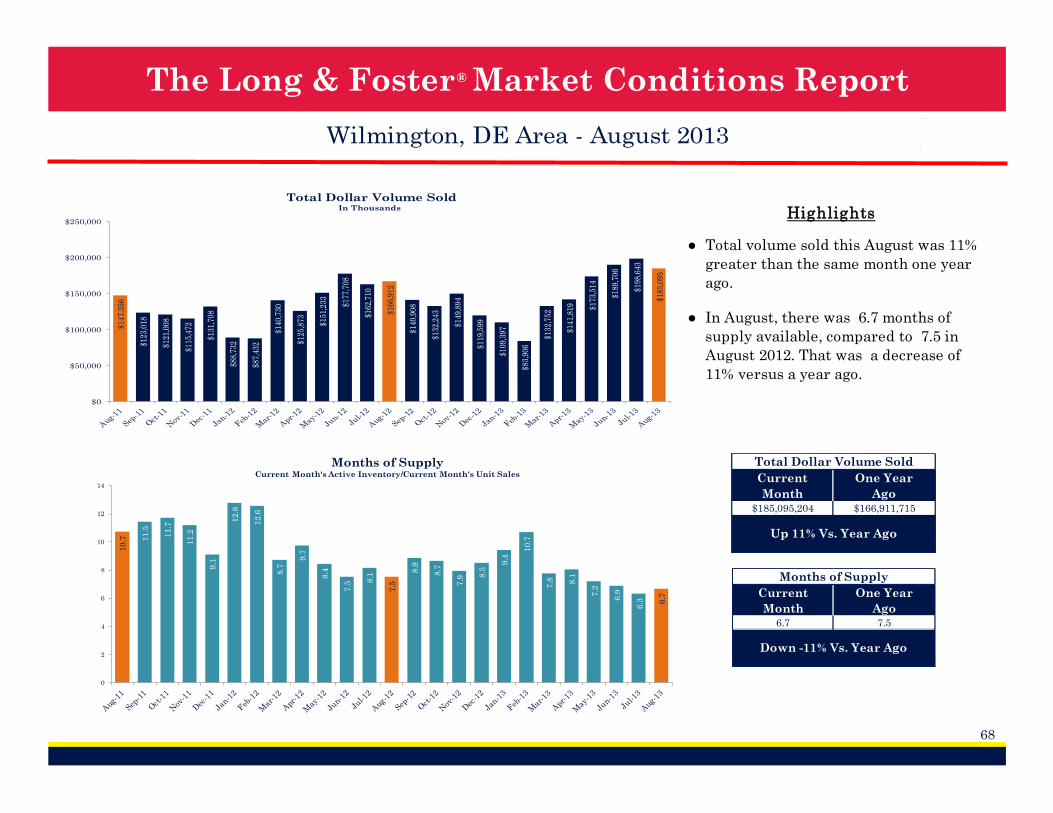
® The Long & Foster Market Conditions Report
68
Wilmington, DE Area - August 2013
$147
,356
$123
,018
$121
,008
$115
,472
$131
,708
$88,
732
$87,
432
$140
,730
$125
,873 $1
51,2
33 $177
,708
$162
,710
$166
,912
$140
,908
$132
,243
$149
,894
$119
,599
$109
,397
$83,
906
$132
,752
$141
,819 $1
73,5
14
$189
,706
$198
,643
$185
,095
$0
$50,000
$100,000
$150,000
$200,000
$250,000
Total Dollar Volume SoldIn Thousands
Total Dollar Volume Sold
Current
Month
One Year
Ago$185,095,204 $166,911,715
Up 11% Vs. Year Ago
Months of Supply
Current
Month
One Year
Ago6.7 7.5
Down -11% Vs. Year Ago
10
.7 11
.5
11
.7
11
.2
9.1
12
.8
12
.6
8.7
9.7
8.4
7.5
8.1
7.5
8.9
8.7
7.9 8
.5
9.4
10
.7
7.8 8.1
7.2
6.9
6.3 6
.7
0
2
4
6
8
10
12
14
Months of SupplyCurrent Month's Active Inventory/Current Month's Unit Sales
●
●
Highlights
Total volume sold this August was 11%
greater than the same month one year
ago.
In August, there was 6.7 months of
supply available, compared to 7.5 in
August 2012. That was a decrease of
11% versus a year ago.

® The Long & Foster Market Conditions Report
69
Wilmington, DE Area - August 2013
1,2
23
1,1
40
1,1
08
1,0
15
81
7
1,2
70
1,0
90
1,3
66
1,3
91
1,2
84
1,2
70
1,0
71
1,1
24
1,1
11
1,0
79
87
9
67
9
1,1
19
1,1
27 1
,30
3
1,6
39
1,4
57
1,2
87
1,3
37
1,2
40
66
9
59
4
60
7
56
1
47
9
62
6
64
6
83
7
77
8
80
6
74
1
69
7
71
9
63
5
63
8
59
3
47
5
62
4
66
3 75
1 85
3
84
4
80
0
79
5
73
7
0
200
400
600
800
1,000
1,200
1,400
1,600
1,800
New Listings & New Contracts
New Listings New Contracts (Under Active Contract Status)
New Listings
Current
Month
One Year
Ago1,240 1,124
Up 10% Vs. Year Ago
New Contracts
Current
Month
One Year
Ago737 719
Up 3% Vs. Year Ago
1.81.9
1.8 1.81.7
2.0
1.7 1.6
1.8
1.61.7
1.5 1.6
1.71.7
1.5 1.4
1.81.7 1.7
1.9
1.71.6
1.7 1.7
0.0
0.5
1.0
1.5
2.0
2.5
Supply/Demand RatioNumber of New Listings to New Contracts
616
214
171
75
48
670
271
160
95
44
0
200
400
600
800
New Castle
County
Kent
County, DE
Cecil
County
Salem
County
Kent
County, MD
New ListingsOf Top Five Counties/Cities Based on Total Units Sold
One Year Ago Current Month
463
113
86
34
23
458
140
87
33
19
0
100
200
300
400
500
New Castle
County
Kent
County, DE
Cecil
County
Salem
County
Kent
County, MD
New ContractsOf Top Five Counties/Cities Based on Total Units Sold
One Year Ago Current Month
●
Highlights
Based on this month's amount of new
listings and new contracts, the ratio of
home supply (new listings) to current
home demand (new contracts) was 1.7,
an increase of 8% from August 2012.
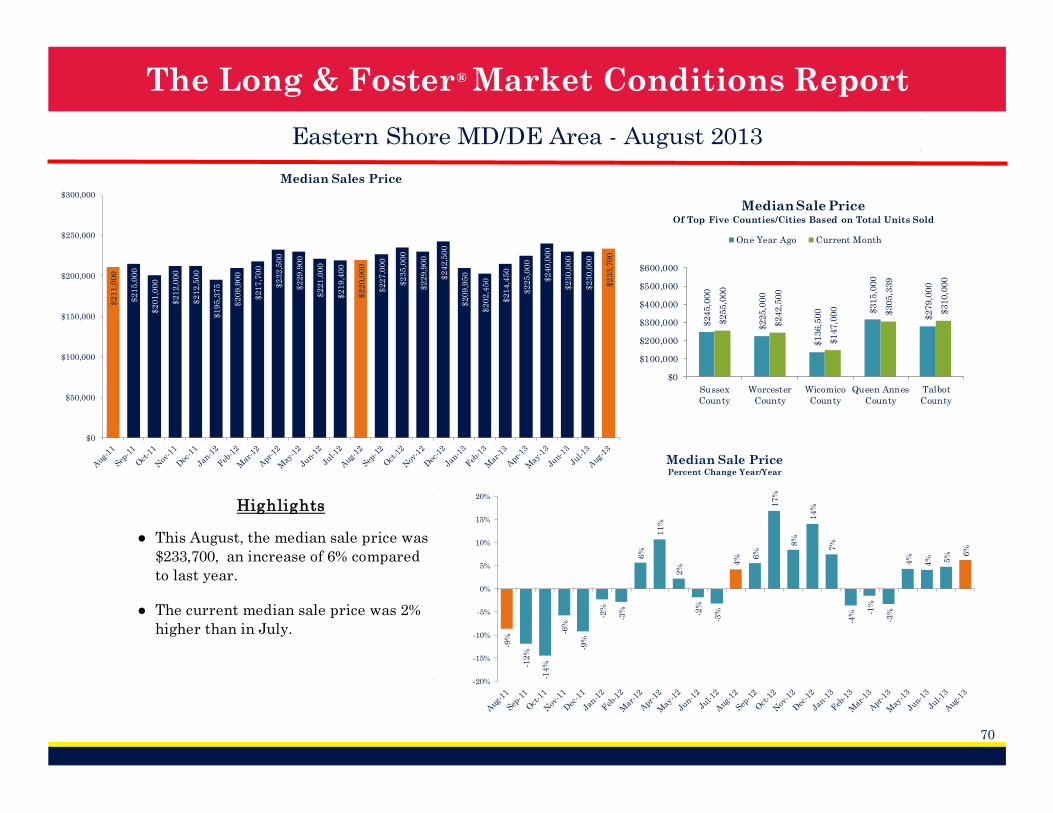
® The Long & Foster Market Conditions Report
70
Eastern Shore MD/DE Area - August 2013
$245,0
00
$225,0
00
$136,5
00 $315,0
00
$279,0
00
$255,0
00
$242,5
00
$147,0
00 $305,3
39
$310,0
00
$0
$100,000
$200,000
$300,000
$400,000
$500,000
$600,000
Sussex
County
Worcester
County
Wicomico
County
Queen Annes
County
Talbot
County
Median Sale PriceOf Top Five Counties/Cities Based on Total Units Sold
One Year Ago Current Month
-9%
-12
%
-14
%
-6%
-9%
-2%
-3%
6%
11
%
2%
-2%
-3%
4% 6
%
17
%
8%
14
%
7%
-4% -1
%
-3%
4%
4% 5% 6
%
-20%
-15%
-10%
-5%
0%
5%
10%
15%
20%
Median Sale PricePercent Change Year/Year
$2
11
,00
0
$2
15
,00
0
$2
01
,00
0
$2
12
,00
0
$2
12
,50
0
$1
95
,37
5
$2
09
,90
0
$2
17
,70
0
$2
32
,50
0
$2
29
,90
0
$2
21
,00
0
$2
19
,40
0
$2
20
,00
0
$2
27
,00
0
$2
35
,00
0
$2
29
,90
0
$2
42
,50
0
$2
09
,95
0
$2
02
,45
0
$2
14
,45
0
$2
25
,00
0
$2
40
,00
0
$2
30
,00
0
$2
30
,00
0
$2
33
,70
0
$0
$50,000
$100,000
$150,000
$200,000
$250,000
$300,000
Median Sales Price
●
●
Highlights
This August, the median sale price was
$233,700, an increase of 6% compared
to last year.
The current median sale price was 2%
higher than in July.
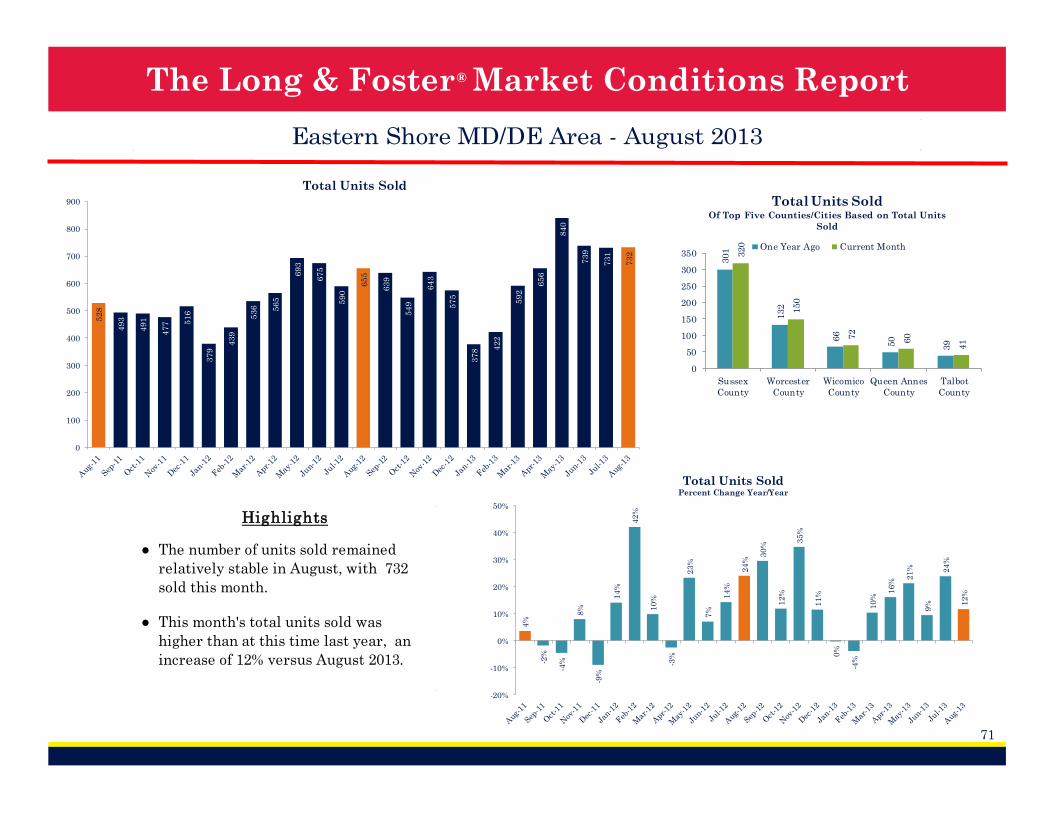
® The Long & Foster Market Conditions Report
71
Eastern Shore MD/DE Area - August 2013
301
132
66
50
39
320
150
72
60
41
0
50
100
150
200
250
300
350
Sussex
County
Worcester
County
Wicomico
County
Queen Annes
County
Talbot
County
Total Units SoldOf Top Five Counties/Cities Based on Total Units
Sold
One Year Ago Current Month
4%
-2%
-4%
8%
-9%
14
%
42
%
10
%
-3%
23
%
7%
14
%
24
%
30
%
12
%
35
%
11
%
0%
-4%
10
%
16
%
21
%
9%
24
%
12
%
-20%
-10%
0%
10%
20%
30%
40%
50%
Total Units SoldPercent Change Year/Year
52
8
49
3
49
1
47
7 51
6
37
9
43
9
53
6 56
5
69
3
67
5
59
0
65
5
63
9
54
9
64
3
57
5
37
8 42
2
59
2
65
6
84
0
73
9
73
1
73
2
0
100
200
300
400
500
600
700
800
900
Total Units Sold
●
●
Highlights
The number of units sold remained
relatively stable in August, with 732
sold this month.
This month's total units sold was
higher than at this time last year, an
increase of 12% versus August 2013.
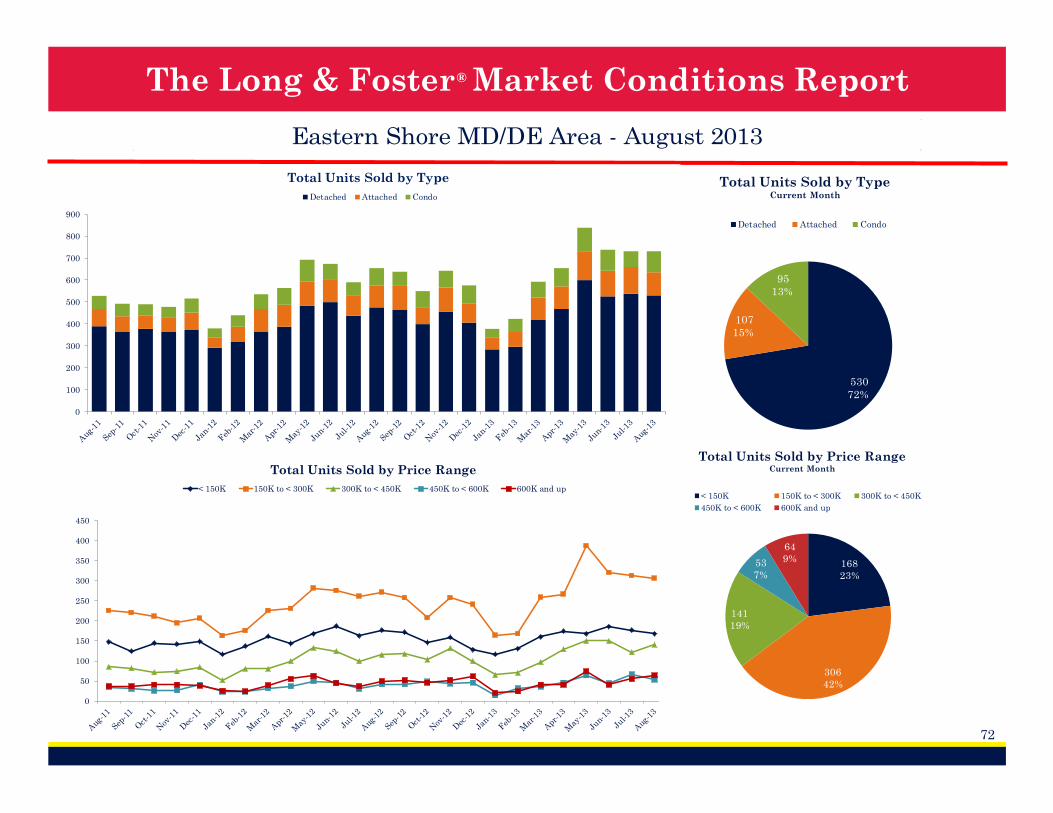
® The Long & Foster Market Conditions Report
72
Eastern Shore MD/DE Area - August 2013
0
50
100
150
200
250
300
350
400
450
Total Units Sold by Price Range
< 150K 150K to < 300K 300K to < 450K 450K to < 600K 600K and up
0
100
200
300
400
500
600
700
800
900
Total Units Sold by Type
Detached Attached Condo
530
72%
107
15%
95
13%
Total Units Sold by TypeCurrent Month
Detached Attached Condo
168
23%
306
42%
141
19%
53
7%
64
9%
Total Units Sold by Price RangeCurrent Month
< 150K 150K to < 300K 300K to < 450K
450K to < 600K 600K and up
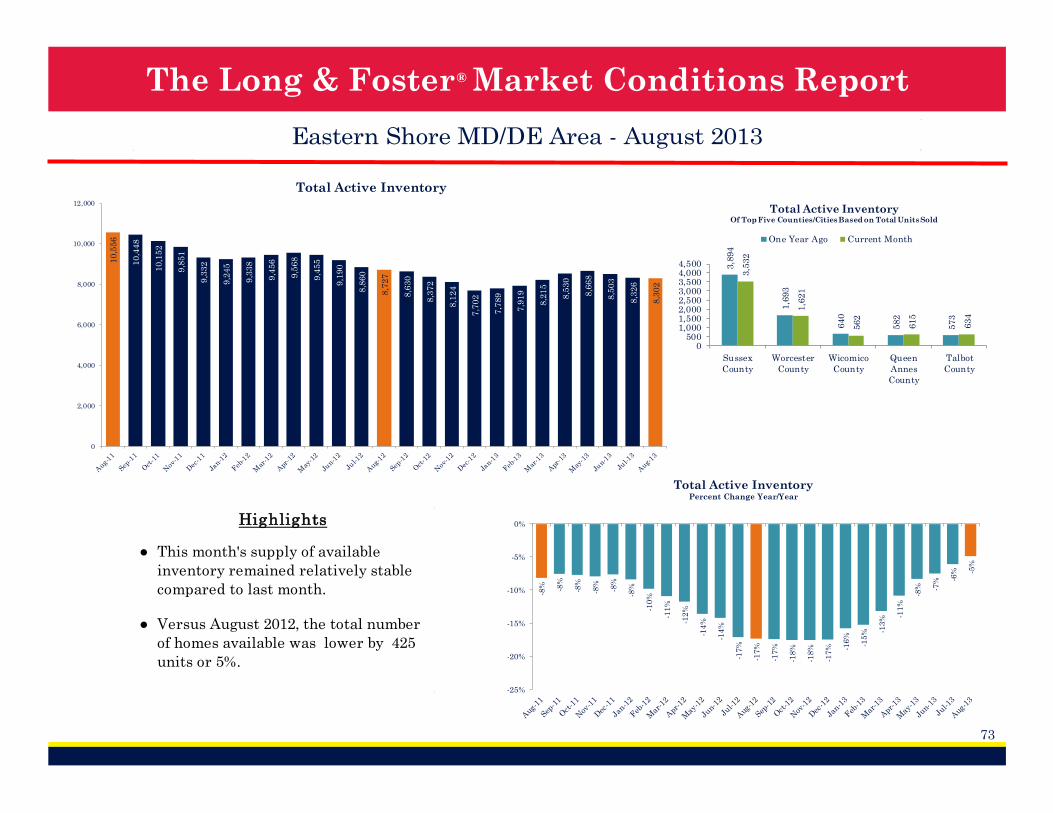
® The Long & Foster Market Conditions Report
73
Eastern Shore MD/DE Area - August 2013
3,8
94
1,6
93
640
582
573
3,5
32
1,6
21
562
615
634
0500
1,0001,5002,0002,5003,0003,5004,0004,500
Sussex
County
Worcester
County
Wicomico
County
Queen
Annes
County
Talbot
County
Total Active InventoryOf Top Five Counties/Cities Based on Total Units Sold
One Year Ago Current Month
-8% -8%
-8%
-8%
-8%
-8%
-10
%
-11
%
-12
%
-14
%
-14
%
-17
%
-17
%
-17
%
-18
%
-18
%
-17
% -16
%
-15
% -13
% -11
%
-8% -7
% -6% -5
%
-25%
-20%
-15%
-10%
-5%
0%
Total Active InventoryPercent Change Year/Year
10
,55
6
10
,44
8
10
,15
2
9,8
51
9,3
32
9,2
45
9,3
38
9,4
56
9,5
68
9,4
55
9,1
90
8,8
60
8,7
27
8,6
30
8,3
72
8,1
24
7,7
02
7,7
89
7,9
19
8,2
15
8,5
30
8,6
68
8,5
03
8,3
26
8,3
02
0
2,000
4,000
6,000
8,000
10,000
12,000
Total Active Inventory
●
●
Highlights
This month's supply of available
inventory remained relatively stable
compared to last month.
Versus August 2012, the total number
of homes available was lower by 425
units or 5%.
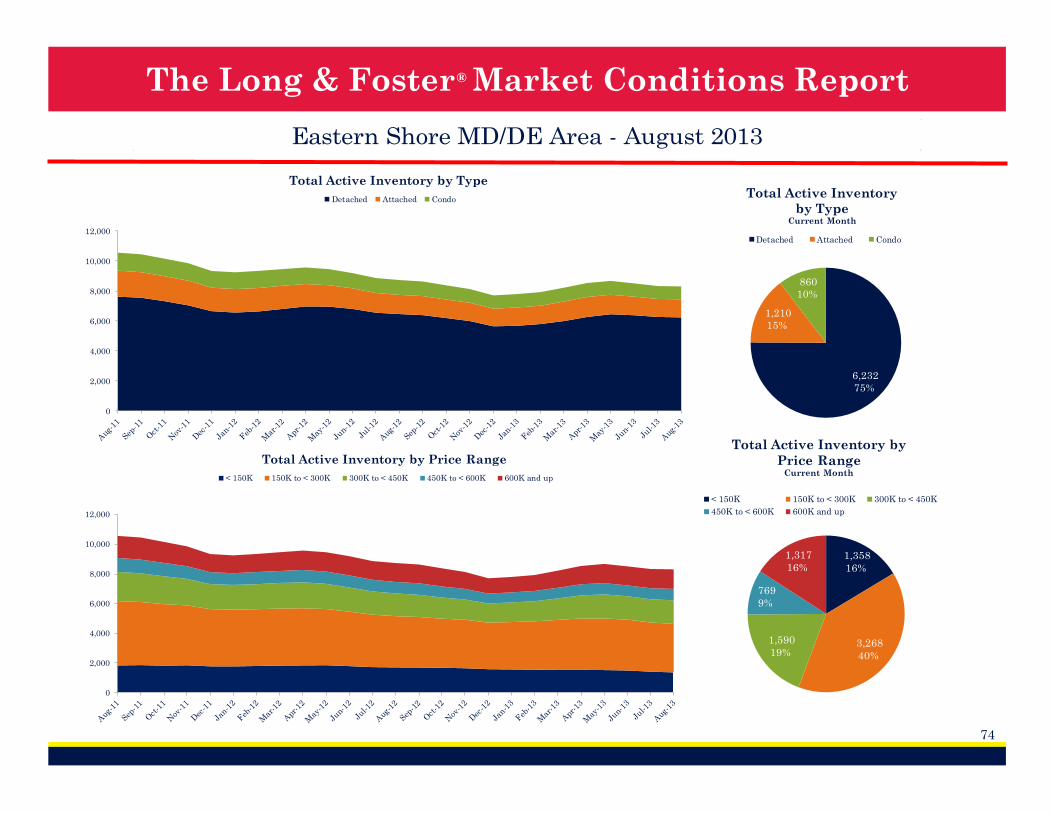
® The Long & Foster Market Conditions Report
74
Eastern Shore MD/DE Area - August 2013
1,358
16%
3,268
40%
1,590
19%
769
9%
1,317
16%
Total Active Inventory by
Price RangeCurrent Month
< 150K 150K to < 300K 300K to < 450K
450K to < 600K 600K and up
6,232
75%
1,210
15%
860
10%
Total Active Inventory
by TypeCurrent Month
Detached Attached Condo
0
2,000
4,000
6,000
8,000
10,000
12,000
Total Active Inventory by Type
Detached Attached Condo
0
2,000
4,000
6,000
8,000
10,000
12,000
Total Active Inventory by Price Range
< 150K 150K to < 300K 300K to < 450K 450K to < 600K 600K and up
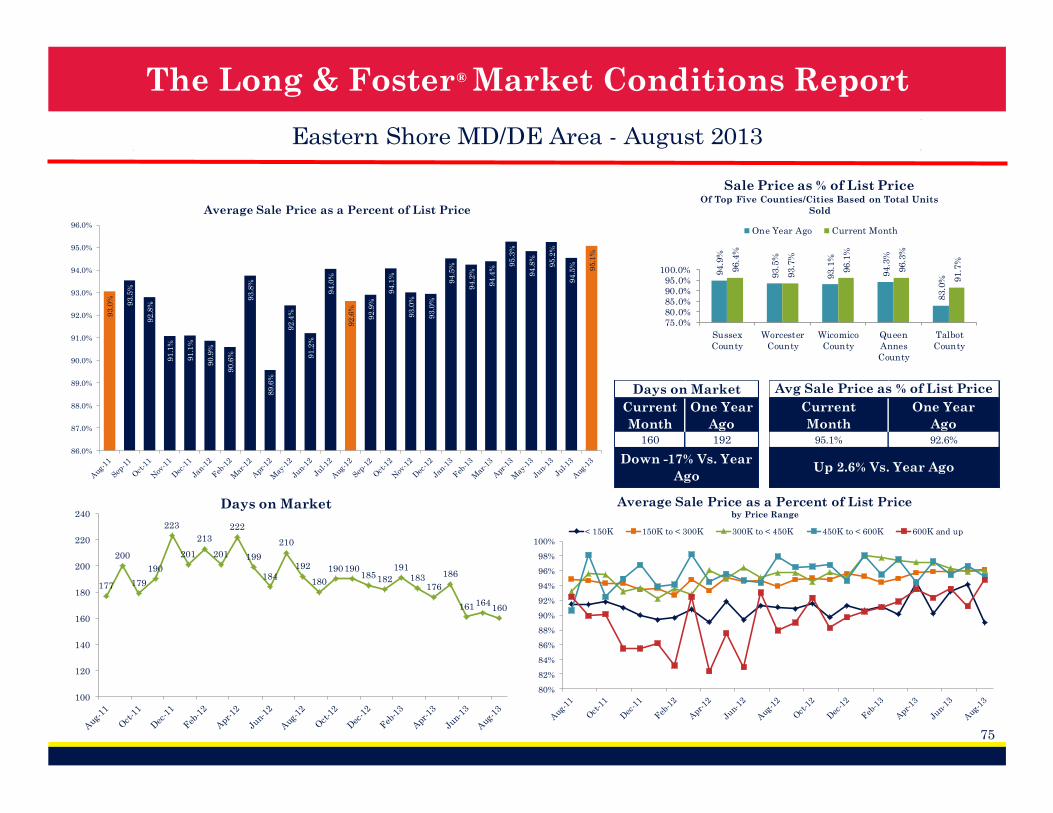
® The Long & Foster Market Conditions Report
75
Eastern Shore MD/DE Area - August 2013
177
200
179
190
223
201
213
201
222
199
184
210
192
180
190190185182
191183
176
186
161164160
100
120
140
160
180
200
220
240Days on Market
80%
82%
84%
86%
88%
90%
92%
94%
96%
98%
100%
Average Sale Price as a Percent of List Price by Price Range
< 150K 150K to < 300K 300K to < 450K 450K to < 600K 600K and up
94.9
%
93.5
%
93.1
%
94.3
%
83.0
%
96.4
%
93.7
%
96.1
%
96.3
%
91.7
%
75.0%80.0%85.0%90.0%95.0%
100.0%
Sussex
County
Worcester
County
Wicomico
County
Queen
Annes
County
Talbot
County
Sale Price as % of List PriceOf Top Five Counties/Cities Based on Total Units
Sold
One Year Ago Current Month
Avg Sale Price as % of List Price
Current
Month
One Year
Ago95.1% 92.6%
Up 2.6% Vs. Year Ago
Days on Market
Current
Month
One Year
Ago160 192
Down -17% Vs. Year
Ago
93
.0%
93
.5%
92
.8%
91
.1%
91
.1%
90
.9%
90
.6%
93
.8%
89
.6%
92
.4%
91
.2%
94
.0%
92
.6%
92
.9%
94
.1%
93
.0%
93
.0%
94
.5%
94
.2%
94
.4%
95
.3%
94
.8%
95
.2%
94
.5% 95
.1%
86.0%
87.0%
88.0%
89.0%
90.0%
91.0%
92.0%
93.0%
94.0%
95.0%
96.0%
Average Sale Price as a Percent of List Price
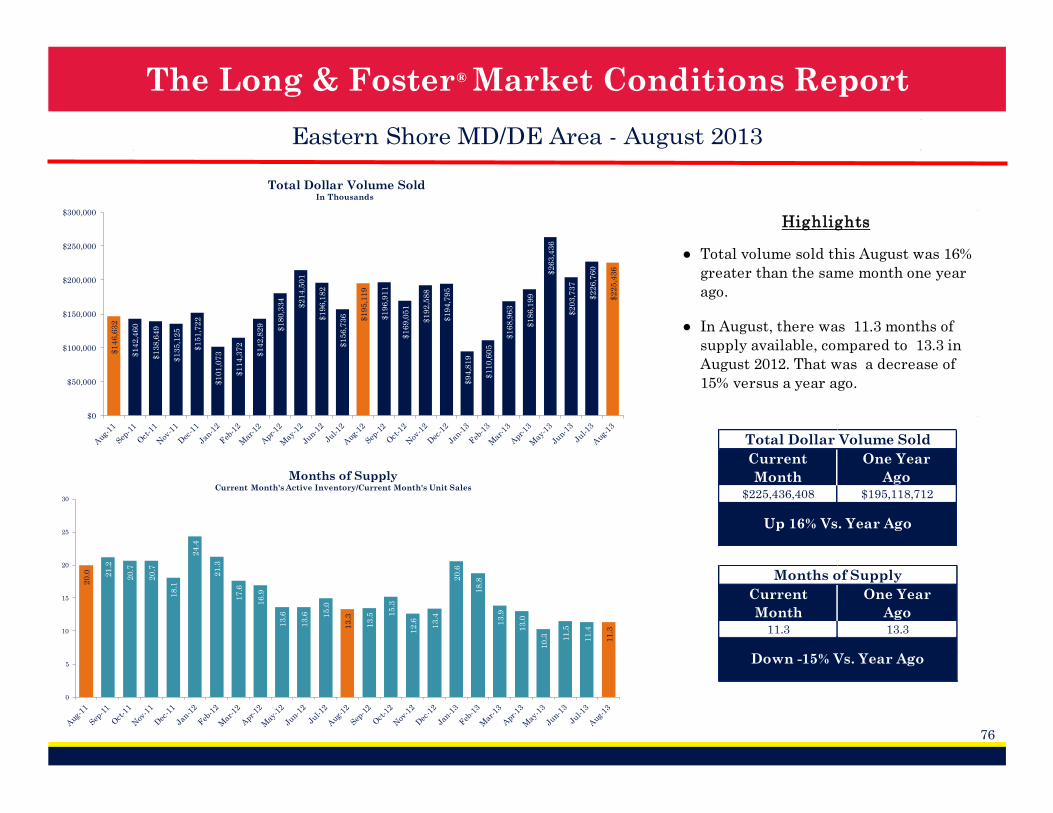
® The Long & Foster Market Conditions Report
76
Eastern Shore MD/DE Area - August 2013
●
●
Highlights
Total volume sold this August was 16%
greater than the same month one year
ago.
In August, there was 11.3 months of
supply available, compared to 13.3 in
August 2012. That was a decrease of
15% versus a year ago.
Months of Supply
Current
Month
One Year
Ago11.3 13.3
Down -15% Vs. Year Ago
Total Dollar Volume Sold
Current
Month
One Year
Ago$225,436,408 $195,118,712
Up 16% Vs. Year Ago
$1
46
,63
2
$1
42
,46
0
$1
38
,64
9
$1
35
,12
5
$1
51
,72
2
$1
01
,07
3
$1
14
,37
2
$1
42
,82
9 $1
80
,33
4
$2
14
,50
1
$1
96
,18
2
$1
56
,73
6 $1
95
,11
9
$1
96
,91
1
$1
69
,05
1
$1
92
,58
8
$1
94
,79
5
$9
4,8
19
$1
10
,60
5
$1
68
,96
3
$1
86
,19
9
$2
63
,43
6
$2
03
,73
7
$2
26
,76
0
$2
25
,43
6
$0
$50,000
$100,000
$150,000
$200,000
$250,000
$300,000
Total Dollar Volume SoldIn Thousands
20
.0 21
.2
20
.7
20
.7
18
.1
24
.4
21
.3
17
.6
16
.9
13
.6
13
.6 15
.0
13
.3
13
.5 15
.3
12
.6
13
.4
20
.6
18
.8
13
.9
13
.0
10
.3 11
.5
11
.4
11
.3
0
5
10
15
20
25
30
Months of SupplyCurrent Month's Active Inventory/Current Month's Unit Sales
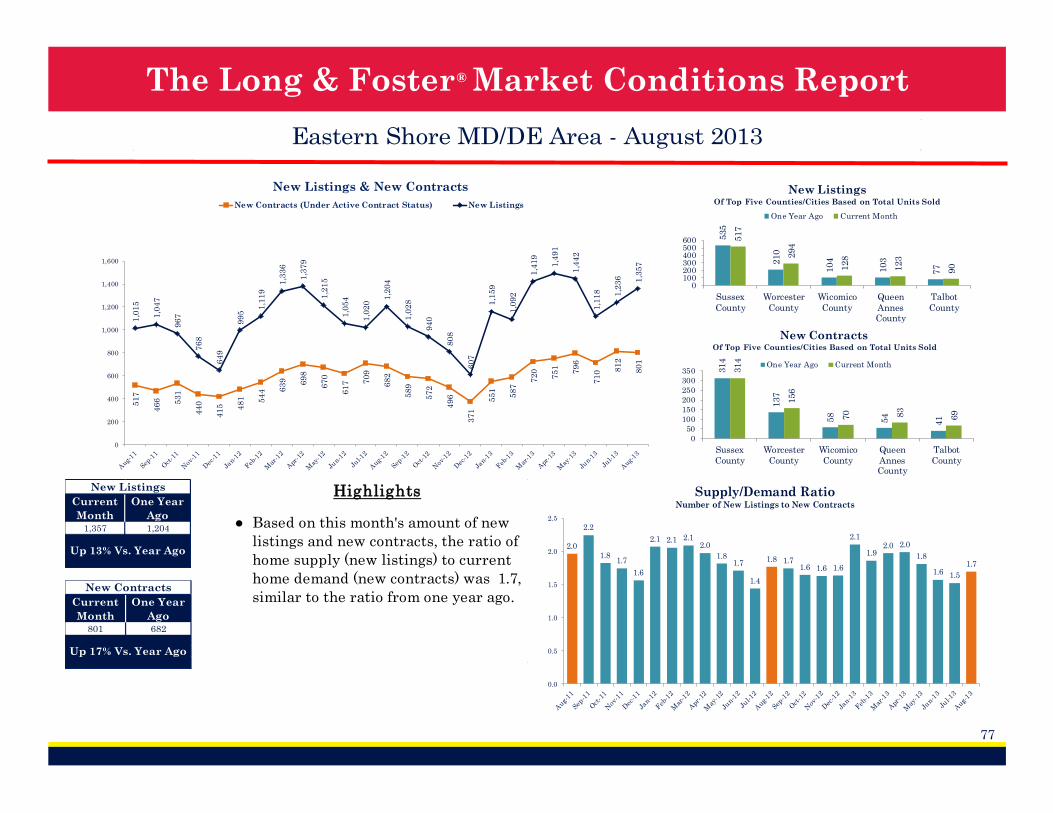
® The Long & Foster Market Conditions Report
77
Eastern Shore MD/DE Area - August 20135
17
46
6 53
1
44
0
41
5 48
1 54
4 63
9 69
8
67
0
61
7 70
9
68
2
58
9
57
2
49
6
37
1
55
1
58
7
72
0
75
1
79
6
71
0 81
2
80
1
1,0
15
1,0
47
96
7
76
8
64
9
99
5
1,1
19
1,3
36
1,3
79
1,2
15
1,0
54
1,0
20
1,2
04
1,0
28
94
0
80
8
60
7
1,1
59
1,0
92
1,4
19
1,4
91
1,4
42
1,1
18 1,2
36 1,3
57
0
200
400
600
800
1,000
1,200
1,400
1,600
New Listings & New Contracts
New Contracts (Under Active Contract Status) New Listings
2.0
2.2
1.81.7
1.6
2.1 2.1 2.12.0
1.81.7
1.4
1.8 1.71.6 1.6 1.6
2.1
1.92.0 2.0
1.8
1.6 1.5
1.7
0.0
0.5
1.0
1.5
2.0
2.5
Supply/Demand RatioNumber of New Listings to New Contracts
535
210
104
103
77
517
294
128
123
90
0100200300400500600
Sussex
County
Worcester
County
Wicomico
County
Queen
AnnesCounty
Talbot
County
New ListingsOf Top Five Counties/Cities Based on Total Units Sold
One Year Ago Current Month
314
137
58
54
41
314
156
70 83
69
0
50
100
150
200
250
300
350
Sussex
County
Worcester
County
Wicomico
County
Queen
AnnesCounty
Talbot
County
New ContractsOf Top Five Counties/Cities Based on Total Units Sold
One Year Ago Current Month
●
Highlights
Based on this month's amount of new
listings and new contracts, the ratio of
home supply (new listings) to current
home demand (new contracts) was 1.7,
similar to the ratio from one year ago.
New Listings
Current
Month
One Year
Ago1,357 1,204
Up 13% Vs. Year Ago
New Contracts
Current
Month
One Year
Ago801 682
Up 17% Vs. Year Ago
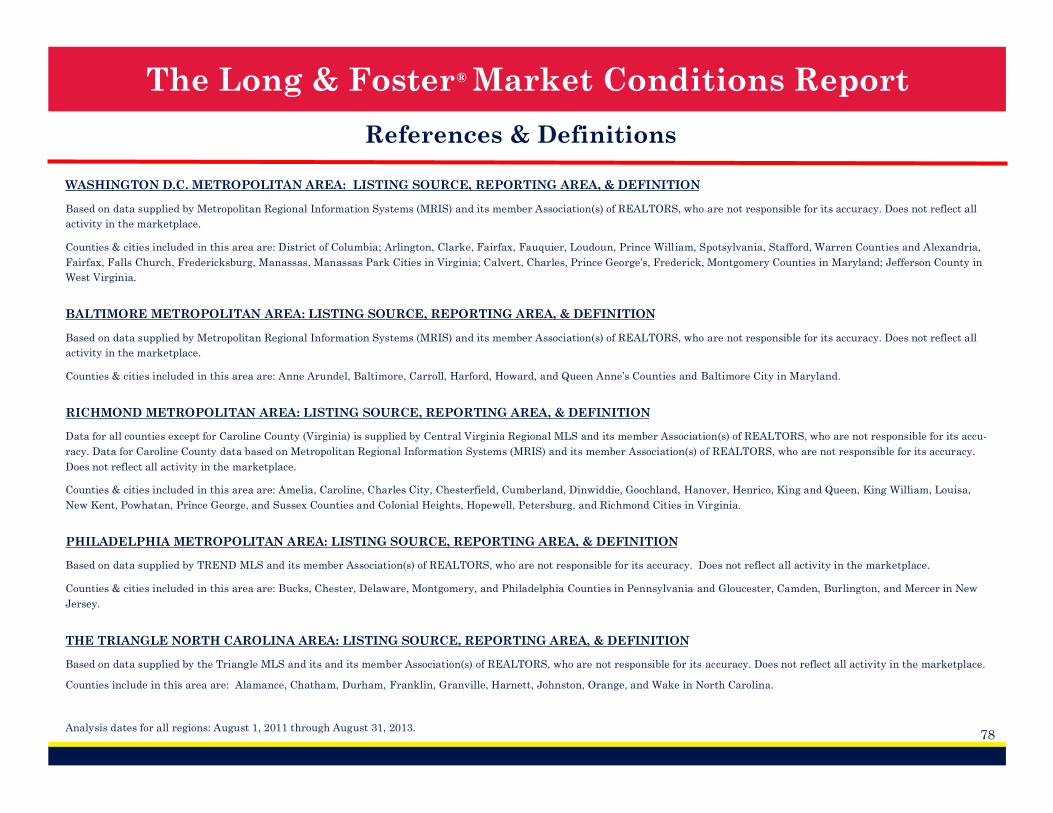
® The Long & Foster Market Conditions Report
78
References & Definitions
WASHINGTON D.C. METROPOLITAN AREA: LISTING SOURCE, REPORTING AREA, & DEFINITION
Based on data supplied by Metropolitan Regional Information Systems (MRIS) and its member Association(s) of REALTORS, who are not responsible for its accuracy. Does not reflect all
activity in the marketplace.
Counties & cities included in this area are: District of Columbia; Arlington, Clarke, Fairfax, Fauquier, Loudoun, Prince William, Spotsylvania, Stafford, Warren Counties and Alexandria,
Fairfax, Falls Church, Fredericksburg, Manassas, Manassas Park Cities in Virginia; Calvert, Charles, Prince George’s, Frederick, Montgomery Counties in Maryland; Jefferson County in
West Virginia.
BALTIMORE METROPOLITAN AREA: LISTING SOURCE, REPORTING AREA, & DEFINITION
Based on data supplied by Metropolitan Regional Information Systems (MRIS) and its member Association(s) of REALTORS, who are not responsible for its accuracy. Does not reflect all
activity in the marketplace.
Counties & cities included in this area are: Anne Arundel, Baltimore, Carroll, Harford, Howard, and Queen Anne’s Counties and Baltimore City in Maryland.
RICHMOND METROPOLITAN AREA: LISTING SOURCE, REPORTING AREA, & DEFINITION
Data for all counties except for Caroline County (Virginia) is supplied by Central Virginia Regional MLS and its member Association(s) of REALTORS, who are not responsible for its accu-
racy. Data for Caroline County data based on Metropolitan Regional Information Systems (MRIS) and its member Association(s) of REALTORS, who are not responsible for its accuracy.
Does not reflect all activity in the marketplace.
Counties & cities included in this area are: Amelia, Caroline, Charles City, Chesterfield, Cumberland, Dinwiddie, Goochland, Hanover, Henrico, King and Queen, King William, Louisa,
New Kent, Powhatan, Prince George, and Sussex Counties and Colonial Heights, Hopewell, Petersburg, and Richmond Cities in Virginia.
PHILADELPHIA METROPOLITAN AREA: LISTING SOURCE, REPORTING AREA, & DEFINITION
Based on data supplied by TREND MLS and its member Association(s) of REALTORS, who are not responsible for its accuracy. Does not reflect all activity in the marketplace.
Counties & cities included in this area are: Bucks, Chester, Delaware, Montgomery, and Philadelphia Counties in Pennsylvania and Gloucester, Camden, Burlington, and Mercer in New
Jersey.
THE TRIANGLE NORTH CAROLINA AREA: LISTING SOURCE, REPORTING AREA, & DEFINITION
Based on data supplied by the Triangle MLS and its and its member Association(s) of REALTORS, who are not responsible for its accuracy. Does not reflect all activity in the marketplace.
Counties include in this area are: Alamance, Chatham, Durham, Franklin, Granville, Harnett, Johnston, Orange, and Wake in North Carolina.
Analysis dates for all regions: August 1, 2011 through August 31, 2013.
® The Long & Foster Market Conditions Report
79
References & Definitions
HAMPTON ROADS AREA: LISTING SOURCE, REPORTING AREA, & DEFINITION
Data for all counties except for Gloucester and Mathews Counties in Virginia is supplied by Real Estate Information Network MLS and its member Association(s) of REALTORS, who are
not responsible for its accuracy. Data for Gloucester and Mathews Counties is supplied by Chesapeake Bay & Rivers MLS and its member Association(s) of REALTORS, who are not re-
sponsible for its accuracy. Does not reflect all activity in the marketplace.
Counties & cities included in this area are: Gloucester, Isle of Wight, James City, Mathews, Surry, and York Counties and Chesapeake, Hampton, Newport News, Norfolk, Poquoson,
Portsmouth, Suffolk, Virginia Beach, and Williamsburg Cites in Virginia; Currituck County in North Carolina.
ROANOKE METROPOLITAN AREA: LISTING SOURCE, REPORTING AREA, & DEFINITION
Based on data supplied by Roanoke Valley Multiple Listing Service and its member Association(s) of REALTORS, who are not responsible for its accuracy. Does not reflect all activity in
the marketplace.
Counties & cities included in this area are: Botetourt, Craig, Franklin, and Roanoke Counties and Roanoke and Salem Cities in Virginia.
WILMINGTON, DE AREA: LISTING SOURCE, REPORTING AREA & DEFINITION
Data for Kent and New Castle Counties in Delaware and Salem County in New Jersey supplied by TREND MLS and its member Association(s) of REALTORS, who are not responsible for
its accuracy. Data for Cecil and Kent Counties in Maryland is supplied by Metropolitan Regional Information Systems (MRIS) and its member Association(s) of REALTORS, who are not
responsible for its accuracy. Does not reflect all activity in the marketplace.
Counties & Cities included in this area are: Kent and New Castle Counties in Delaware, Cecil and Kent Counties in Maryland, and Salem County in New Jersey.
EASTERN SHORE MD/DE AREA: LISTING SOURCE, REPORTING AREA, & DEFINITION
Data for Caroline, Dorchester, Kent, Queen Anne’s, and Talbot, Counties in Maryland is supplied by Metropolitan Regional Information Systems (MRIS) and its member Association(s) of
REALTORS. Data for Sussex County, Delaware is supplied by SCAOR and its member Association(s) of REALTORS. Data for Somerset, Wicomico, and Worcester Counties in Maryland is
supplied by Coastal MLS and its member Association(s) of REALTORS, who are not responsible for its accuracy. Does not reflect all activity in the marketplace.
Counties & cities include in this area are: Caroline, Dorchester, Kent, Queen Anne’s, Somerset, Talbot, Wicomico, and Worcester Counties In Maryland and Sussex County in Delaware.
Units defined as “Condo” in MRIS have been labeled as “Attached” to allow for data from MRIS & Coastal MLS to be combined.
Analysis dates for all regions: August 1, 2011 through August 31, 2013.
® The Long & Foster Market Conditions Report
80
Contacts & Disclaimers
MEDIA CONTACT
Vicki Bendure, Bendure Communications
Email: [email protected]
Phone: (540) 687-3360
CREATED BY
Michael Bystry, Long & Foster Real Estate, Inc. Senior Market Research Analyst
Elizabeth Nourse, Long & Foster Real Estate, Inc. Director of Marketing
DISCLAIMER
Information contained in this report is based on data provided by the local area Multiple Listing Service and its member Association(s) of REAL-
TORS®. No representation, expressed or implied should be taken from information herein. Neither these organizations nor Long & Foster Real Es-
tate, Inc. guarantee or are in any way responsible for the accuracy of these results, which do not reflect all activity in the marketplace. “Detached”,
“Attached”, and “Condo” varies by local area Multiple Listing Service (MLS) definition. For more information regarding your specific market, contact
one of Long & Foster’s knowledgeable and experienced sales associates. Information contained in this report is not limited to transactions done by
Long & Foster Real Estate, Inc. The data reported is solely for residential real estate transactions.
Information contained in this report is deemed reliable but not guaranteed, should be independently verified and does not constitute an opinion of
Long & Foster Real Estate, Inc.
Material appearing in this report may be reproduced or copied without permission.
Please use the following acknowledgement for citation:
Source: Long & Foster Real Estate, Inc. and also cite the appropriate MLS.
Analysis dates for all regions: August 1, 2011 through August 31, 2013.