Embed Size (px)
Citation preview
The London Borough of Hillingdon
Progress Report, 2007
Local Authority Information Local Authority The London Borough of Hillingdon Service Manager Kathy Sparks, Deputy Director, Environment &
Consumer Protection Officer to contact Val Beale Contact address 3W/01 Civic Centre High Street Uxbridge Middlesex UB8 1UW Contact phone number 01895 277454 Contact email address [email protected] [email protected] Council website www.hillingdon.gov.uk Air quality website www.hillingdon-air.info/
Authors This report has been produced for the London Borough of Hillingdon by Mike Holland and Sheri Kinghorn of EMRC, in collaboration with Nicola Brophy of AEA Energy and Environment and Val Beale, London Borough of Hillingdon.

London Borough of Hillingdon Air Quality Action Plan
iii
Executive Summary This report provides an update on the results of air quality monitoring and on progress with the air quality action plan (AQAP) by the London Borough of Hillingdon, covering the period 2006-2007. It has been produced in accordance with guidance laid down by DEFRA. From the monitoring data presented in this report it is concluded that: • During 2006, the annual mean objective for NO2 was exceeded at both
roadside and background sites within the Borough and its neighbouring local authorities. These include sites monitored continuously in the National and London networks as well as those within the Hillingdon diffusion tube survey.
• There is no evidence of progress towards achieving the standard from the 2006 data when taken with other data showing results and trends over several years, going back to the mid 1990s.
• These results support the earlier decision to declare an AQMA (Air Quality Management Area) across the southern half of the Borough, and to adopt the AQAP based on exposure of people in some parts of Hillingdon to these levels of NO2.
• Monitoring results also indicate that objectives for other air quality strategy pollutants were achieved during 2004, and support the decision not to declare an AQMA on the basis of exposure to these other pollutants. The Council will, however, continue to pay attention to them, especially fine particles.
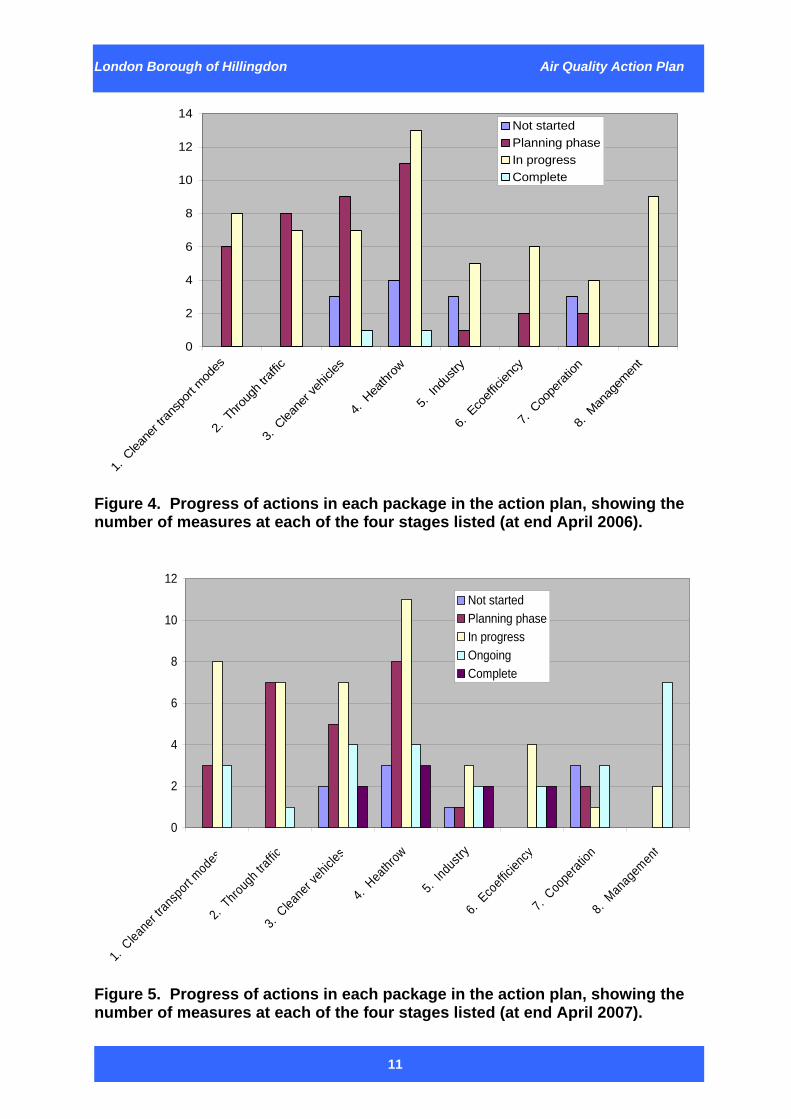
The following figure shows that good progress as been made with the action plan from April 2006 to April 2007. More than two thirds of measures are well underway and a growing number are complete.
14%
37%
47%
2%12%
35%51%
2%
8%
23%
38%
23%
8%
Not startedPlanning phaseIn progressOngoingComplete
% of actions listed in the various packages of the action plan in each
stage of implementation. Inner ring, 2004/5; middle ring, 2005/6; outer ring, 2006/7.
London Borough of Hillingdon Air Quality Action Plan
iv
Highlights of Action Plan implementation in 2006/7 include:
• Initiation of a Staff Travel Plan for the Council’s employees. • The use of the Breath of Fresh Air pack developed in 2005/06 to inform
the development of School Travel Plans within Hillingdon. Copies of the packs (information on which was supplied with last year’s progress report) for each Key Stage have now been provided to each school within the borough.
• Promotion of walking and pedestrian safety via 6 new local safety schemes at key points in the borough, a 20mph zone put in place at Oak Farm Estate and promotion of the Hillingdon Trail walks via the Green Spaces Strategy.
• Improvements to M4 junction 4 have been completed with the objective of reducing queuing on part of the M4 close to housing.
• Progress with the Clean Vehicle Programme for the council fleet. • Commitment to include BAA roads under the London LEZ scheme
should it proceed. • Establishment of a specific website for part B industrial processes. • Follow up actions relating to the audit of 2 industrial areas in 2005/06,
disseminating information on the proposed LEZ, staff travel planning, etc.
• Completion of measures concerning development of supplementary planning guidance for sustainable design and construction and sustainable waste management.
• Continued active engagement with stakeholders. Priorities for the coming year are as follows:
1. Hillingdon must continue to show leadership in air quality improvement. Without this it will be very hard to encourage other stakeholders to participate.
2. Completion of an audit of the action plan, assessing its strengths and weaknesses and identifying possible modifications, partly through reference to the plans published by other local authorities. Particular attention is being paid to measures that are yet to start or are still in the planning phase.
3. Review and appraisal of reports to be published in connection with Heathrow Airport on the Project for the Sustainable Development of Heathrow, the Heathrow Surface Access Strategy and the BAA Heathrow Air Quality Action Plan.
4. Integration of the Council’s air quality action plan with development of a climate action plan.
5. Maintenance of the stakeholder dialogue established during development of the action plan and since.
London Borough of Hillingdon Air Quality Action Plan
v
Contents CHAPTER 1 INTRODUCTION.................................................................................................. 1
1.1 OBJECTIVES OF THIS REPORT...................................................................................... 1 1.2 AIR QUALITY IN HILLINGDON ........................................................................................ 1 1.3 TYPES OF MEASURE IN THE ACTION PLAN .................................................................... 3
CHAPTER 2 MONITORING...................................................................................................... 5 2.1 THE MONITORING NETWORK IN HILLINGDON ................................................................. 5 2.2 RESULTS FOR NO2 ..................................................................................................... 5 2.3 RESULTS FOR OTHER POLLUTANTS .............................................................................. 6 2.4 CONCLUSIONS ON MONITORED DATA............................................................................ 7
CHAPTER 3 POLICIES AND PLANNING APPLICATIONS.................................................... 8 3.1 DEVELOPMENTS IN PROGRESS .................................................................................... 8 3.2 FUTURE DEVELOPMENTS THAT MAY AFFECT AIR QUALITY .............................................. 8
CHAPTER 4 PROGRESS WITH THE ACTION PLAN........................................................... 10 4.1 SITUATION................................................................................................................ 10 4.2 AUDIT OF THE AIR QUALITY ACTION PLAN .................................................................. 13 4.3 OPPORTUNITIES ....................................................................................................... 14 4.4 THREATS.................................................................................................................. 15 4.5 PROGRESS WITH THE ACTION PLAN: SELECTED HIGHLIGHTS........................................ 16
CHAPTER 5 CONCLUSIONS, AND THE WAY AHEAD ....................................................... 20
APPENDIX 1: CHECKLIST .................................................................................................... 21
APPENDIX 2: MONITORED LEVELS OF AIR POLLUTION IN HILLINGDON..................... 22 A2.1 SUMMARY OF MONITORING ACTIVITIES ....................................................................... 22
A2.1.1 Quality Assurance and Quality Control (QA/QC) .......................................... 22 A2.1.2 Data ratification.............................................................................................. 22 A2.2.1 NO2 results .................................................................................................... 29 A2.2.2 Other pollutants ............................................................................................. 30
A2.3 DIFFUSION TUBE MONITORING SITES .......................................................................... 31 A2.3.1 NO2 diffusion tube results.............................................................................. 31 A2.3.2 Benzene diffusion tube results ............................................................................ 32
A2.4 CONCLUSIONS.......................................................................................................... 32 APPENDIX 3: PROGRESS WITH THE ACTION PLAN ........................................................ 38
London Borough of Hillingdon Air Quality Action Plan
vi
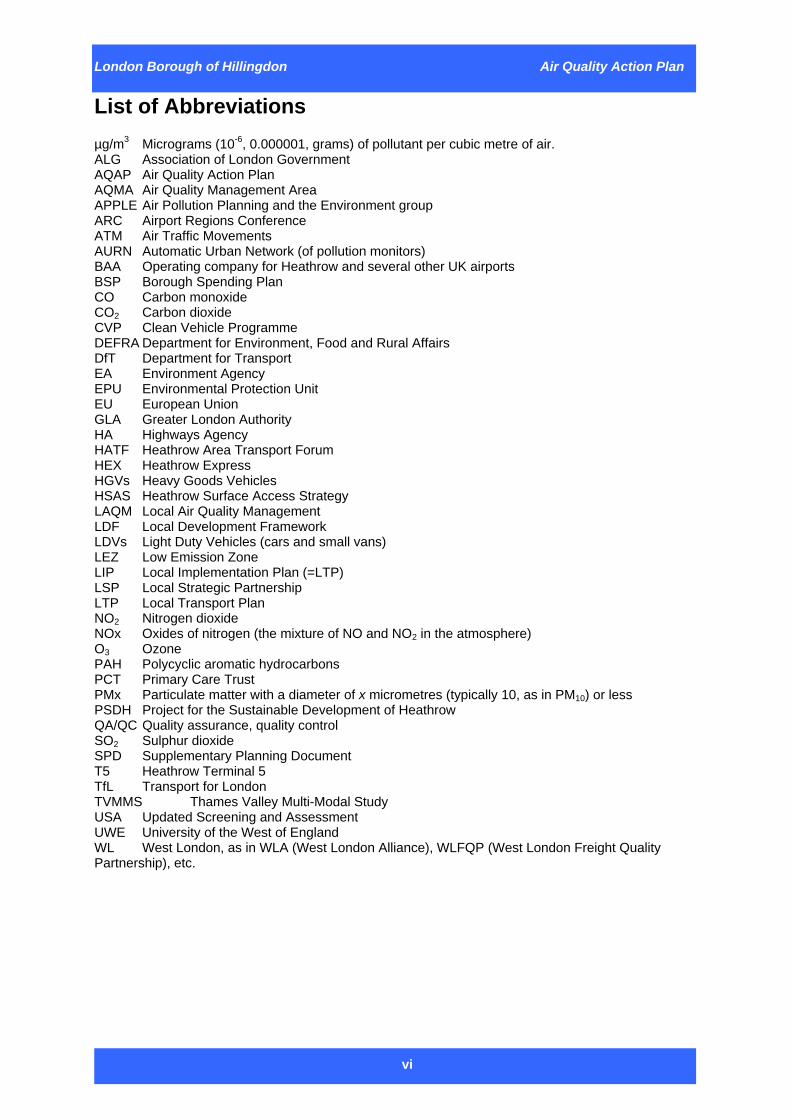
List of Abbreviations µg/m3 Micrograms (10-6, 0.000001, grams) of pollutant per cubic metre of air. ALG Association of London Government AQAP Air Quality Action Plan AQMA Air Quality Management Area APPLE Air Pollution Planning and the Environment group ARC Airport Regions Conference ATM Air Traffic Movements AURN Automatic Urban Network (of pollution monitors) BAA Operating company for Heathrow and several other UK airports BSP Borough Spending Plan CO Carbon monoxide CO2 Carbon dioxide CVP Clean Vehicle Programme DEFRA Department for Environment, Food and Rural Affairs DfT Department for Transport EA Environment Agency EPU Environmental Protection Unit EU European Union GLA Greater London Authority HA Highways Agency HATF Heathrow Area Transport Forum HEX Heathrow Express HGVs Heavy Goods Vehicles HSAS Heathrow Surface Access Strategy LAQM Local Air Quality Management LDF Local Development Framework LDVs Light Duty Vehicles (cars and small vans) LEZ Low Emission Zone LIP Local Implementation Plan (=LTP) LSP Local Strategic Partnership LTP Local Transport Plan NO2 Nitrogen dioxide NOx Oxides of nitrogen (the mixture of NO and NO2 in the atmosphere) O3 Ozone PAH Polycyclic aromatic hydrocarbons PCT Primary Care Trust PMx Particulate matter with a diameter of x micrometres (typically 10, as in PM10) or less PSDH Project for the Sustainable Development of Heathrow QA/QC Quality assurance, quality control SO2 Sulphur dioxide SPD Supplementary Planning Document T5 Heathrow Terminal 5 TfL Transport for London TVMMS Thames Valley Multi-Modal Study USA Updated Screening and Assessment UWE University of the West of England WL West London, as in WLA (West London Alliance), WLFQP (West London Freight Quality Partnership), etc.
London Borough of Hillingdon Air Quality Action Plan
1
Chapter 1 Introduction
1.1 Objectives of this report This progress report is the third to be issued by the London Borough of Hillingdon following finalisation of its Air Quality Action Plan in 2004. It follows the reporting guidelines issued by DEFRA, stipulating that reports should contain the following information:
• Data on monitoring o Summarise monitored air pollution data o Report on performance against air quality objectives o Assess trends in air pollution o Forecast potential for compliance with air quality objectives
• Implementation of Action Plans o Summarise information on Action Plan measures o Review progress with measures
• Planning and air quality o Identify local plans that may influence air quality o Identify planning applications that will affect air quality
• Potential effects of local transport plans on air quality o Identify measures that will have an affect on air quality o Review progress of these measures.
A checklist of the requirements for progress reports and associated commentary of the compliance of this report against it is provided in Appendix 1.
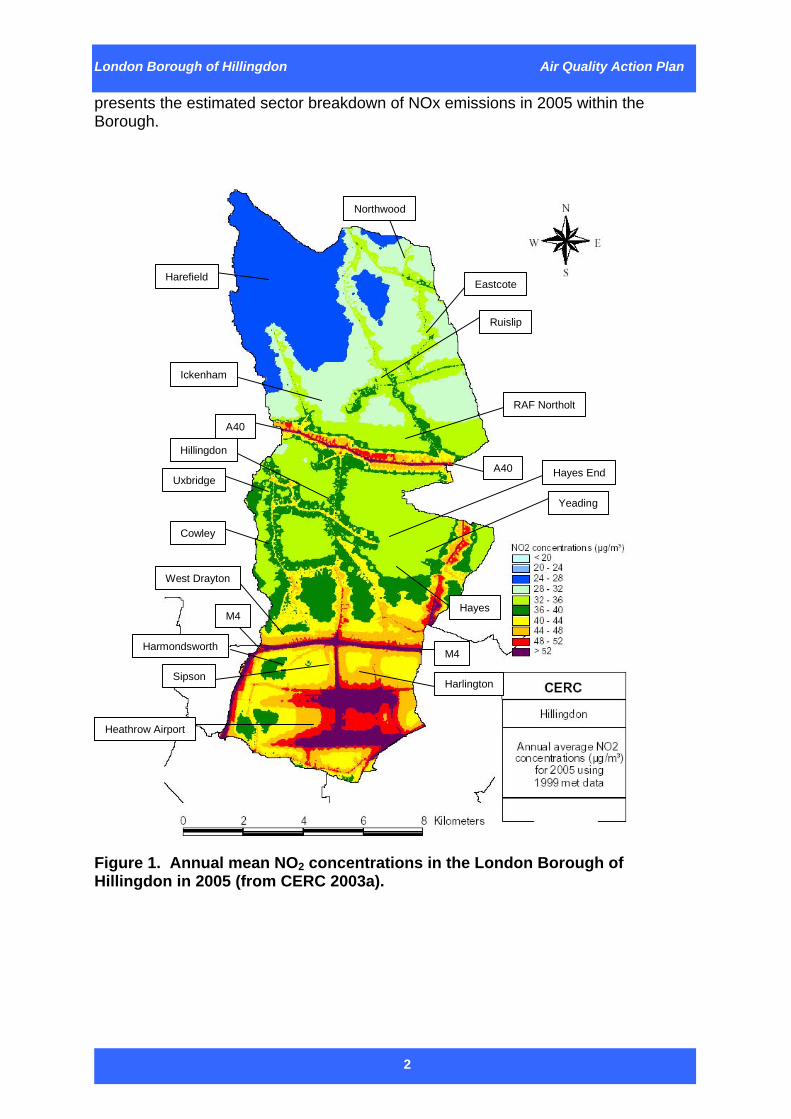
1.2 Air quality in Hillingdon The London Borough of Hillingdon, like all Local Authorities in the UK, is required to assess air quality in the area under its control. In cases where the concentration of one or more pollutants exceeds the objectives laid down in the Air Quality Strategy for England and Wales it is necessary for the Local Authority to declare an Air Quality Management Area (AQMA) and then to develop an Action Plan, defining actions that the Council can take or influence others to take to improve air quality. Hillingdon requires an Air Quality Action Plan because annual average concentrations of nitrogen dioxide (NO2) in several parts of the Borough exceed the national objective of an annual mean concentration of 40 µg.m-3 for 2005 (see Figure 1), a level beyond which experts consider risks to human health to be significant. An AQMA has been declared, in accordance with regulations, covering the southern half of the Borough. Concentrations of other pollutants generally comply with the objectives, though the Borough continues to monitor some others, particularly fine particles (PM10). The Updating and Screening Assessment (USA) carried out by the Borough in 2006 confirmed the earlier assessment with respect to the pollutants of concern and the extent of the AQMA. In order to develop an action plan that is cost-effective and deals with different sources of pollution in a cost-efficient and proportionate manner, it was essential to understand how these sources contribute to concentrations in the AQMA. Table 1
London Borough of Hillingdon Air Quality Action Plan
2
presents the estimated sector breakdown of NOx emissions in 2005 within the Borough.
M4
Hayes
Yeading
Harlington
Hayes End
Harmondsworth
Sipson
M4
A40
A40
Eastcote
RAF Northolt
Ruislip
Northwood
Harefield
Uxbridge
West Drayton
Cowley
Ickenham
Hillingdon
Heathrow Airport
M4
Hayes
Yeading
Harlington
Hayes End
Harmondsworth
Sipson
M4
A40
A40
Eastcote
RAF Northolt
Ruislip
Northwood
Harefield
Uxbridge
West Drayton
Cowley
Ickenham
Hillingdon
Heathrow Airport
Figure 1. Annual mean NO2 concentrations in the London Borough of Hillingdon in 2005 (from CERC 2003a).
London Borough of Hillingdon Air Quality Action Plan
3
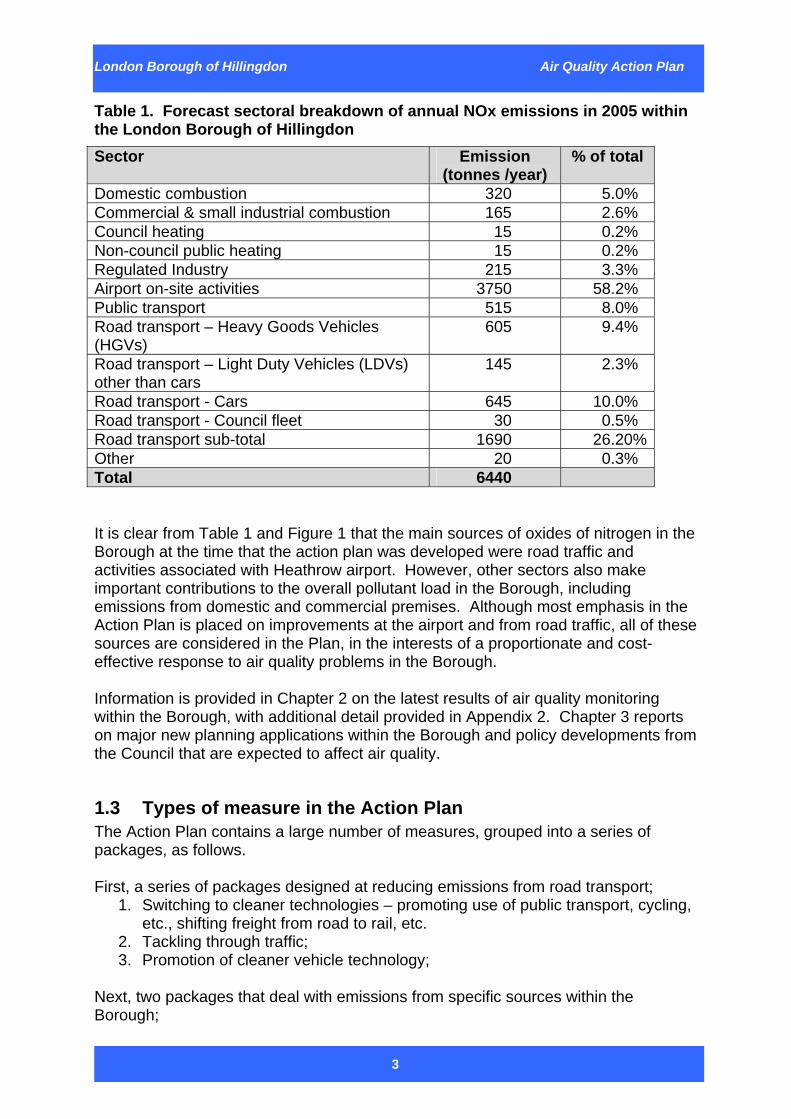
Table 1. Forecast sectoral breakdown of annual NOx emissions in 2005 within the London Borough of Hillingdon Sector Emission
(tonnes /year) % of total
Domestic combustion 320 5.0% Commercial & small industrial combustion 165 2.6% Council heating 15 0.2% Non-council public heating 15 0.2% Regulated Industry 215 3.3% Airport on-site activities 3750 58.2% Public transport 515 8.0% Road transport – Heavy Goods Vehicles (HGVs)
605 9.4%
Road transport – Light Duty Vehicles (LDVs) other than cars
145 2.3%
Road transport - Cars 645 10.0% Road transport - Council fleet 30 0.5% Road transport sub-total 1690 26.20% Other 20 0.3% Total 6440 It is clear from Table 1 and Figure 1 that the main sources of oxides of nitrogen in the Borough at the time that the action plan was developed were road traffic and activities associated with Heathrow airport. However, other sectors also make important contributions to the overall pollutant load in the Borough, including emissions from domestic and commercial premises. Although most emphasis in the Action Plan is placed on improvements at the airport and from road traffic, all of these sources are considered in the Plan, in the interests of a proportionate and cost-effective response to air quality problems in the Borough. Information is provided in Chapter 2 on the latest results of air quality monitoring within the Borough, with additional detail provided in Appendix 2. Chapter 3 reports on major new planning applications within the Borough and policy developments from the Council that are expected to affect air quality.
1.3 Types of measure in the Action Plan The Action Plan contains a large number of measures, grouped into a series of packages, as follows. First, a series of packages designed at reducing emissions from road transport;
1. Switching to cleaner technologies – promoting use of public transport, cycling, etc., shifting freight from road to rail, etc.
2. Tackling through traffic; 3. Promotion of cleaner vehicle technology;
Next, two packages that deal with emissions from specific sources within the Borough;
London Borough of Hillingdon Air Quality Action Plan
4
4. Measures specific to Heathrow Airport; 5. Measures concerning local industries and other businesses
Then a package that deals with actions that need to be undertaken by the Council to promote more effective use of resources in the Borough;
6. Improving eco-efficiency of current and future developments, including properties owned or run by the Council;
The next package covers actions of a more general nature, for example, implementation of the Mayor’s Air Quality Strategy in the Borough;
7. Actions to be taken corporately, regionally and in liaison with the Mayor. The last package, Package 8, contains a series of measures relating to the management of the action plan and to air quality monitoring in the Borough. A number of specific measures are described under each package. For each measure an appraisal has been made of the following, more complete information on which is given in an accompanying database, the Hillingdon Action Plan Tracker, developed by EMRC:
a) Costs; b) Effects on NO2 concentrations; c) Effects of these measures on other issues:
i. Emissions of other pollutants; ii. Noise; iii. Congestion; iv. Attractiveness of public transport; v. Social inclusion; vi. Local economic vitality; vii. Other effects;
d) Which (if any) other plans already include consideration of the measures; e) Who should take responsibility for implementation of each measure.
Progress with the plan is reported in Chapter 4, with detailed information on each measure contained within the plan given in Appendix 3.
London Borough of Hillingdon Air Quality Action Plan
5
Chapter 2 Monitoring This chapter provides an overview of air pollution monitoring in Hillingdon in 2006/7. More complete details are given in Appendix 2 to this report.
2.1 The monitoring network in Hillingdon The London Borough of Hillingdon undertakes monitoring of atmospheric concentrations of the following pollutants:
• NO2 • PM10 • Benzene
None of the other pollutants covered by the National Air Quality Strategy are monitored by the Council as they are not likely to be present at concentrations high enough to exceed objectives. However, CO, O3 and SO2 are monitored in the Borough at sites run under the Automatic Urban and Rural Network (AURN). The management and collection of data from both diffusion tubes and automatic monitors are subject to quality assurance and quality control. The analysis presented here includes some results from locations outside Hillingdon. These are included to provide a more complete picture of conditions in and around the Borough. The use of additional sites also has the advantage of providing a broader database for consideration of possible trends in pollutant concentrations. In total, this report draws on information for 8 automatic sites and 30 diffusion tube sites for NO2, 10 automatic sites for PM10, and 5 diffusion tube sites for benzene.
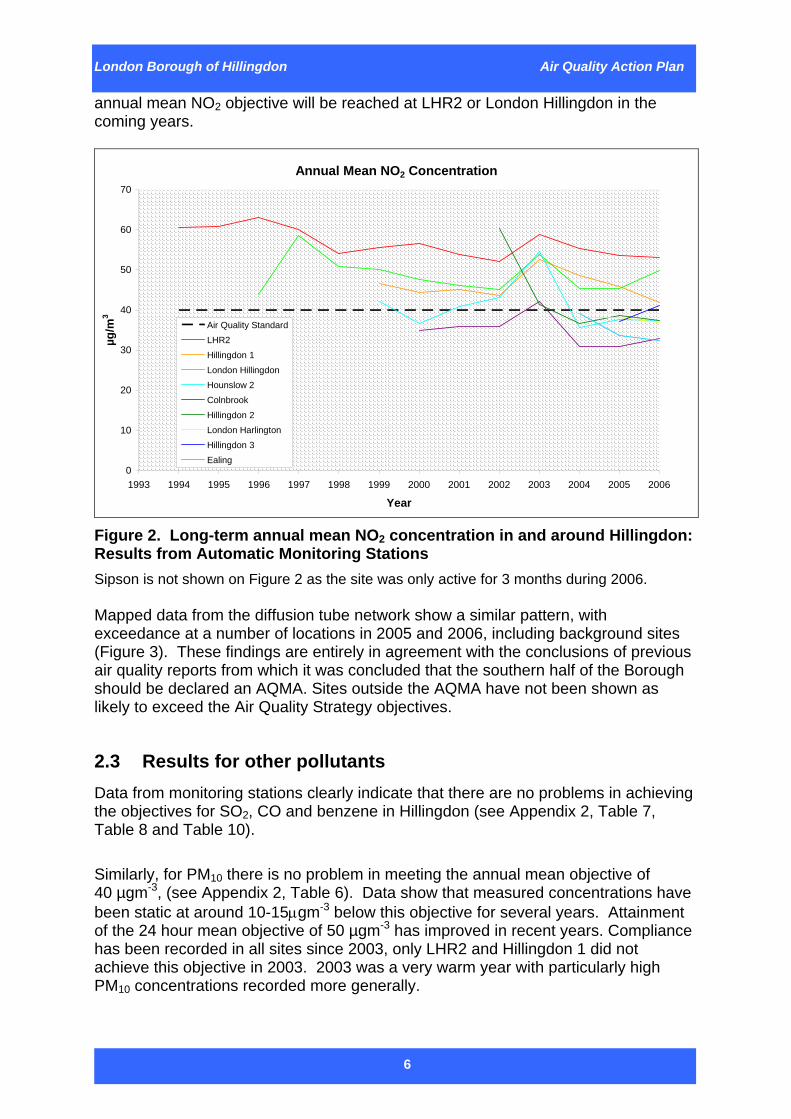
2.2 Results for NO2 Data from the automatic monitoring sites illustrate that achievement of the annual mean NO2 objective of 40μgm-3 in the Borough and surrounding region has been a problem for several years. During 2006 it was not achieved at five monitoring stations: LHR2 (53.2μgm-3), London Hillingdon (49.7μgm-3), Hillingdon 1 (41.8μgm-3), Hillingdon 3 (41.1μgm-3) and Sipson (45.0μgm-3). Hillingdon 1 and 3 are roadside sites and LHR2 is located at the airport where heightened concentrations may be expected. However, London Hillingdon and Sipson are suburban and urban background sites representative of residential areas of the Borough close to the airport and major roads. Figure 2 demonstrates the trends observed in the monitored data. It shows that concentrations have been well above the standard at Hillingdon 1, Hillingdon 2 and LHR2 since monitoring commenced. Hillingdon 3 and Sipson are new sites that are also above the objective. Year to year variations in the weather affect the annual mean concentrations so that interpreting trends can be difficult: the very hot weather in 2003 is responsible for the peak observed in that year, and the poor weather of 2002 for the dip in levels then. Although there is some evidence of reduction in concentrations during the second part of the 1990s, there is no firm evidence of improvement since that time. These trend data suggest that it is unlikely that the
London Borough of Hillingdon Air Quality Action Plan
6
annual mean NO2 objective will be reached at LHR2 or London Hillingdon in the coming years.
Annual Mean NO2 Concentration
0
10
20
30
40
50
60
70
1993 1994 1995 1996 1997 1998 1999 2000 2001 2002 2003 2004 2005 2006
Year
µg/m
3
Air Quality StandardLHR2
Hillingdon 1London HillingdonHounslow 2Colnbrook
Hillingdon 2London HarlingtonHillingdon 3Ealing
Figure 2. Long-term annual mean NO2 concentration in and around Hillingdon: Results from Automatic Monitoring Stations Sipson is not shown on Figure 2 as the site was only active for 3 months during 2006. Mapped data from the diffusion tube network show a similar pattern, with exceedance at a number of locations in 2005 and 2006, including background sites (Figure 3). These findings are entirely in agreement with the conclusions of previous air quality reports from which it was concluded that the southern half of the Borough should be declared an AQMA. Sites outside the AQMA have not been shown as likely to exceed the Air Quality Strategy objectives.
2.3 Results for other pollutants Data from monitoring stations clearly indicate that there are no problems in achieving the objectives for SO2, CO and benzene in Hillingdon (see Appendix 2, Table 7, Table 8 and Table 10). Similarly, for PM10 there is no problem in meeting the annual mean objective of 40 µgm-3, (see Appendix 2, Table 6). Data show that measured concentrations have been static at around 10-15μgm-3 below this objective for several years. Attainment of the 24 hour mean objective of 50 µgm-3 has improved in recent years. Compliance has been recorded in all sites since 2003, only LHR2 and Hillingdon 1 did not achieve this objective in 2003. 2003 was a very warm year with particularly high PM10 concentrations recorded more generally.

London Borough of Hillingdon Air Quality Action Plan
7
Figure 3. Maps of the London Borough of Hillingdon illustrating locations of diffusion tube monitoring sites and the annual mean NO2 concentration (μgm-3) at those locations. The annual mean NO2 objective = 40μgm-3.
2.4 Conclusions on monitored data From the monitoring data presented in this report it has been concluded that: • During 2005 and 2006, the annual mean standard for NO2 was exceeded at both
roadside and background sites within the Borough and its neighbouring local authorities. These include sites monitored continuously in the National and London networks as well as those within the Hillingdon diffusion tube survey.
• There is no progress towards achieving the standard discernible in the 2006 data when taken as a whole with other data showing the results and trends over several years, going back to the mid 1990s.
• These results support the decision to declare and continue with the AQMA and to adopt the AQAP based on exposure of the Hillingdon population to NO2.
• Other monitoring results indicate that the standards for other air quality strategy pollutants were achieved during 2006, supporting the decision not to declare the AQMA on the basis of exposure to these other pollutants, though continued monitoring, especially of fine particles, remains desirable.
London Borough of Hillingdon Air Quality Action Plan
8
Chapter 3 Policies and planning applications
3.1 Developments in progress Construction of Heathrow Terminal 5 started in October 2002. It is due to be open in 2008 and be fully operational by 2016. Air quality is monitored close to the development, with quarterly reports provided to Hillingdon. The site is within the AQMA and in the predicted exceedance area. The Protracted Public Inquiry accepted that there would be local air quality impacts from the development. Within Slough BC, close to the Hillingdon boundary at Colnbrook, a new “energy from waste” incinerator has been granted planning permission. This will be on the site of the current clinical waste incinerator which is a Part A process regulated by the Environment Agency. The new plant is likely to have a larger waste capacity which could result in increased emissions from 2008 when it will be fully operational. Part A permit modelling indicates potential for plume grounding (worse case scenario) in the Harmondsworth area within Hillingdon. The area of plume grounding is within the AQMA although not in an exceedance area. Incinerator operators are supporting the installation of, and running of, an air quality monitoring station in this area.
3.2 Future developments that may affect air quality RAF Northolt: Planning permission has been granted for an increase of 54,000m2 of floor space for accommodation, sports facilities and offices. The site is just within the northern boundary of AQMA although not in an exceedance area. Air quality assessment indicated an increase in annual mean NO2 of 1.63µgm-3 but levels are still predicted to be below the EU limit in 2011 when the site is due to be operational. Mitigation and conditions have been set for an Environmental Management Plan to minimise construction impacts; energy efficiency measures will have to be incorporated into the design; and a Travel Plan is to be established with penalties attached if targets for modal split for vehicles accessing the site are not met. Tesco Store, Master Brewer – Public Inquiry: This site is within the AQMA and in a predicted exceedance area. The proposal is for a mixed redevelopment of a Tesco food store: • 7,673m2 with 497 car parking spaces; • 9 separate retail units comprising 1,244m2 floor space; • 49m2 ground floor unit for the PCT; • 66 affordable flats and 139 private with 211 parking spaces. The application was refused on several counts including a cumulative development argument with a proposed IKEA store in the same area. The application was withdrawn during the Public Inquiry at the request of Tesco due to transport problems.

London Borough of Hillingdon Air Quality Action Plan
9
Tesco Store, Yiewsley – Public Inquiry: This site is within the AQMA although not in a predicted exceedance area. The scheme would involve:
• Demolition of 10,000m2 industrial floor space and replacement with: • A supermarket of approximately 7,390m2 floor space at first floor level with
455 car parking spaces below • 116 residential units, 40 of which are affordable housing.
The application and its revision were refused on grounds including adverse highways impacts, excessive density and noise impacts. A Public Inquiry commenced on 23rd January 2007, and the Inspector’s decision is awaited.
London Borough of Hillingdon Air Quality Action Plan
10
Chapter 4 Progress with the Action Plan
4.1 Situation This is the third progress report on air quality from Hillingdon following the approval of its Air Quality Action Plan (AQAP). As noted already, the plan contains a large number of measures, arranged into a series of packages, as follows: Package 1: Switching to cleaner transport options, for example, shifting freight from
road to rail and promoting cycling and walking Package 2: Tackling through traffic Package 3: Promotion of cleaner vehicle technology Package 4: Measures specific to Heathrow Airport Package 5: Measures concerning local industries and other businesses Package 6: Improving the eco-efficiency of current and future developments,
including those owned or operated by the Council Package 7: Actions to be taken corporately, regionally, and in liaison with the Mayor Package 8: Plan management Summary information on all measures in the action plan is provided in Appendix 3. Progress within each package is summarised in the figures below. These show the number of measures in package at each of the following stages of development:
• Not started • In the planning phase • In progress • Ongoing • Completed
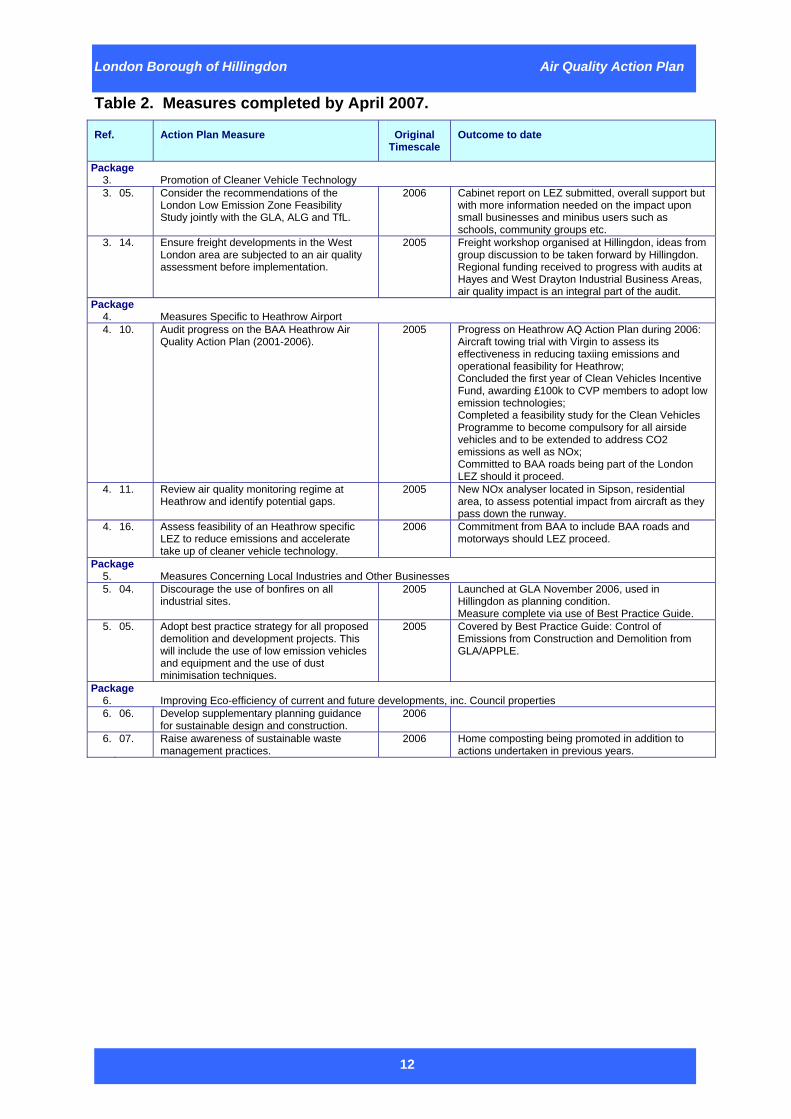
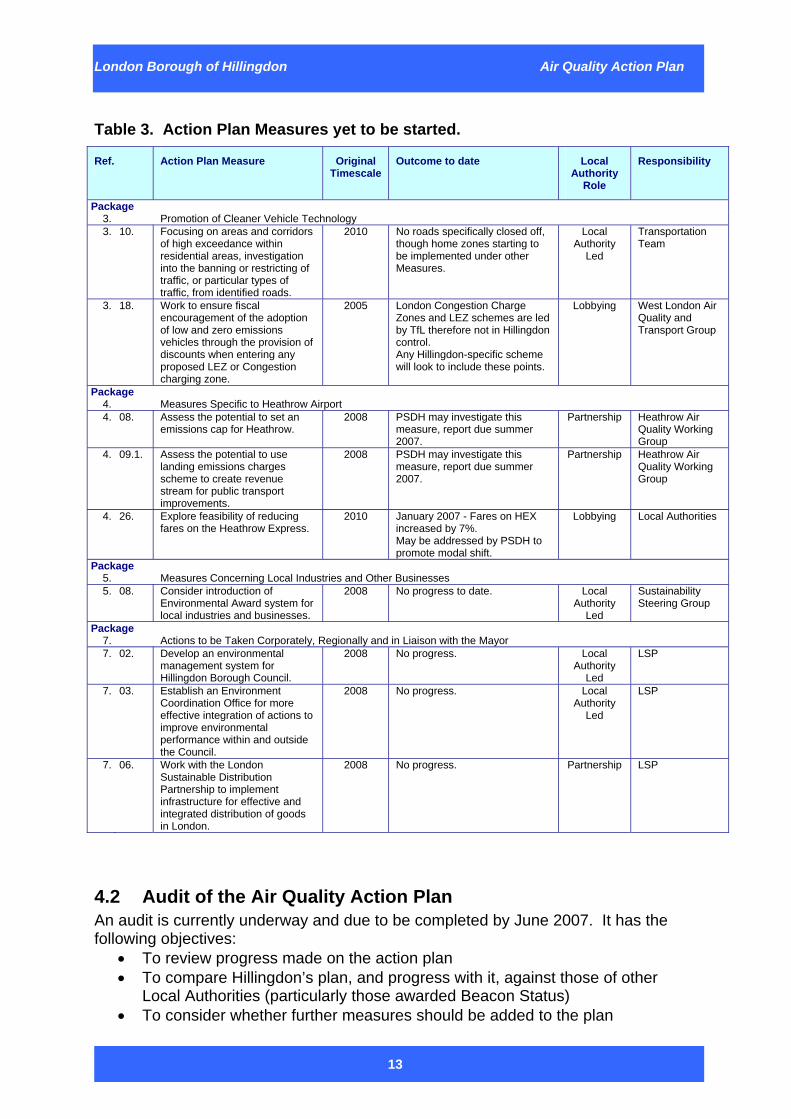
The category ‘Ongoing’ is new to this year’s report. With most measures now underway it was felt desirable to split the ‘in progress’ category, particularly to recognise that some measures that are ‘in progress’ will never be ‘complete’. A good example concerns Measure 8.06 (annual reporting on air quality in the Borough) which is already being done, and for which necessary systems and finance are agreed and in place. In contrast, work on Measure 1.01 (establishment of a Green Travel Plan for Hillingdon) is underway, but it is yet to become fully operational. Division of the ‘in progress’ category therefore gives a clearer impression of the current state of implementation of the action plan. Progress within each package of measures at the end of the previous reporting period (April 2006) is shown in Figure 4, and for the end of the current reporting period (April 2007) in Figure 5. Comparison of the two figures provides evidence of progress in all of the 8 packages of the plan. 69% of measures are now in the categories ‘in progress’, ‘ongoing’ or ‘complete’. 23% of measures are still in the ‘planning phase’ and 8% of measures are ‘not started’. Completed measures are listed in Table 2. Measures yet to be started are listed in Table 3. The latter are being considered in an audit of Hillingdon’s AQAP to be completed by June 2007 (see Section 4.2).
London Borough of Hillingdon Air Quality Action Plan
11
0
2
4
6
8
10
12
14
1. C
leane
r tran
sport
mod
es
2. Th
rough
traffic
3. C
leane
r veh
icles
4. H
eathr
ow
5. In
dustr
y
6. E
coeff
icien
cy
7. C
oope
ration
8. M
anag
emen
t
Not startedPlanning phaseIn progressComplete
Figure 4. Progress of actions in each package in the action plan, showing the number of measures at each of the four stages listed (at end April 2006).
0
2
4
6
8
10
12
1. Clean
er tra
nspo
rt mod
es
2. Thro
ugh tra
ffic
3. Clean
er ve
hicles
4. Hea
throw
5. In
dustr
y
6. Eco
efficie
ncy
7. Coo
perat
ion
8. M
anage
ment
Not startedPlanning phaseIn progressOngoingComplete
Figure 5. Progress of actions in each package in the action plan, showing the number of measures at each of the four stages listed (at end April 2007).
London Borough of Hillingdon Air Quality Action Plan
12
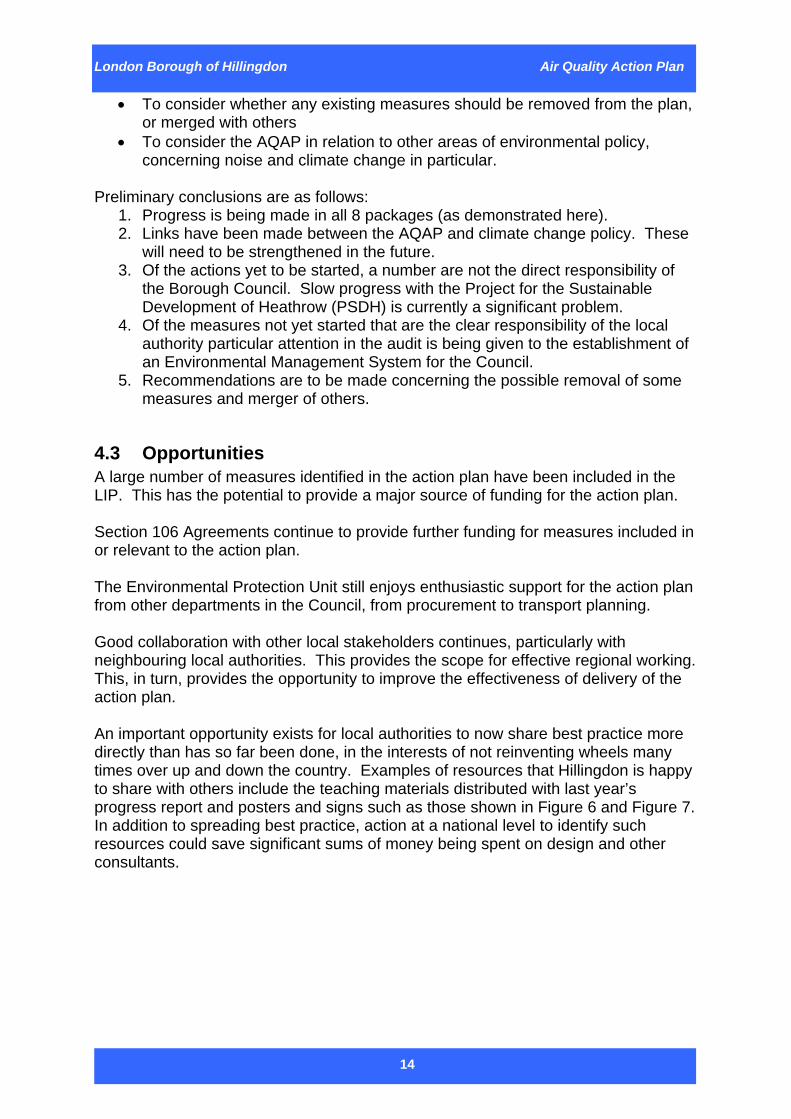
Table 2. Measures completed by April 2007.
Ref. Action Plan Measure Original Timescale
Outcome to date
Package 3. Promotion of Cleaner Vehicle Technology 3. 05. Consider the recommendations of the
London Low Emission Zone Feasibility Study jointly with the GLA, ALG and TfL.
2006 Cabinet report on LEZ submitted, overall support but with more information needed on the impact upon small businesses and minibus users such as schools, community groups etc.
3. 14. Ensure freight developments in the West London area are subjected to an air quality assessment before implementation.
2005 Freight workshop organised at Hillingdon, ideas from group discussion to be taken forward by Hillingdon. Regional funding received to progress with audits at Hayes and West Drayton Industrial Business Areas, air quality impact is an integral part of the audit.
Package 4. Measures Specific to Heathrow Airport 4. 10. Audit progress on the BAA Heathrow Air
Quality Action Plan (2001-2006). 2005 Progress on Heathrow AQ Action Plan during 2006:
Aircraft towing trial with Virgin to assess its effectiveness in reducing taxiing emissions and operational feasibility for Heathrow; Concluded the first year of Clean Vehicles Incentive Fund, awarding £100k to CVP members to adopt low emission technologies; Completed a feasibility study for the Clean Vehicles Programme to become compulsory for all airside vehicles and to be extended to address CO2 emissions as well as NOx; Committed to BAA roads being part of the London LEZ should it proceed.
4. 11. Review air quality monitoring regime at Heathrow and identify potential gaps.
2005 New NOx analyser located in Sipson, residential area, to assess potential impact from aircraft as they pass down the runway.
4. 16. Assess feasibility of an Heathrow specific LEZ to reduce emissions and accelerate take up of cleaner vehicle technology.
2006 Commitment from BAA to include BAA roads and motorways should LEZ proceed.
Package 5. Measures Concerning Local Industries and Other Businesses 5. 04. Discourage the use of bonfires on all
industrial sites. 2005 Launched at GLA November 2006, used in
Hillingdon as planning condition. Measure complete via use of Best Practice Guide.
5. 05. Adopt best practice strategy for all proposed demolition and development projects. This will include the use of low emission vehicles and equipment and the use of dust minimisation techniques.
2005 Covered by Best Practice Guide: Control of Emissions from Construction and Demolition from GLA/APPLE.
Package 6. Improving Eco-efficiency of current and future developments, inc. Council properties 6. 06. Develop supplementary planning guidance
for sustainable design and construction. 2006
6. 07. Raise awareness of sustainable waste management practices.
2006 Home composting being promoted in addition to actions undertaken in previous years.
London Borough of Hillingdon Air Quality Action Plan
13
Table 3. Action Plan Measures yet to be started.
Ref. Action Plan Measure Original Timescale
Outcome to date Local Authority
Role
Responsibility
Package 3. Promotion of Cleaner Vehicle Technology 3. 10. Focusing on areas and corridors
of high exceedance within residential areas, investigation into the banning or restricting of traffic, or particular types of traffic, from identified roads.
2010 No roads specifically closed off, though home zones starting to be implemented under other Measures.
Local Authority
Led
Transportation Team
3. 18. Work to ensure fiscal encouragement of the adoption of low and zero emissions vehicles through the provision of discounts when entering any proposed LEZ or Congestion charging zone.
2005 London Congestion Charge Zones and LEZ schemes are led by TfL therefore not in Hillingdon control. Any Hillingdon-specific scheme will look to include these points.
Lobbying West London Air Quality and Transport Group
Package 4. Measures Specific to Heathrow Airport 4. 08. Assess the potential to set an
emissions cap for Heathrow. 2008 PSDH may investigate this
measure, report due summer 2007.
Partnership Heathrow Air Quality Working Group
4. 09.1. Assess the potential to use landing emissions charges scheme to create revenue stream for public transport improvements.
2008 PSDH may investigate this measure, report due summer 2007.
Partnership Heathrow Air Quality Working Group
4. 26. Explore feasibility of reducing fares on the Heathrow Express.
2010 January 2007 - Fares on HEX increased by 7%. May be addressed by PSDH to promote modal shift.
Lobbying Local Authorities
Package 5. Measures Concerning Local Industries and Other Businesses 5. 08. Consider introduction of
Environmental Award system for local industries and businesses.
2008 No progress to date. Local Authority
Led
Sustainability Steering Group
Package 7. Actions to be Taken Corporately, Regionally and in Liaison with the Mayor 7. 02. Develop an environmental
management system for Hillingdon Borough Council.
2008 No progress. Local Authority
Led
LSP
7. 03. Establish an Environment Coordination Office for more effective integration of actions to improve environmental performance within and outside the Council.
2008 No progress. Local Authority
Led
LSP
7. 06. Work with the London Sustainable Distribution Partnership to implement infrastructure for effective and integrated distribution of goods in London.
2008 No progress. Partnership LSP
4.2 Audit of the Air Quality Action Plan An audit is currently underway and due to be completed by June 2007. It has the following objectives:
• To review progress made on the action plan • To compare Hillingdon’s plan, and progress with it, against those of other
Local Authorities (particularly those awarded Beacon Status) • To consider whether further measures should be added to the plan
London Borough of Hillingdon Air Quality Action Plan
14
• To consider whether any existing measures should be removed from the plan, or merged with others
• To consider the AQAP in relation to other areas of environmental policy, concerning noise and climate change in particular.
Preliminary conclusions are as follows:
1. Progress is being made in all 8 packages (as demonstrated here). 2. Links have been made between the AQAP and climate change policy. These
will need to be strengthened in the future. 3. Of the actions yet to be started, a number are not the direct responsibility of
the Borough Council. Slow progress with the Project for the Sustainable Development of Heathrow (PSDH) is currently a significant problem.
4. Of the measures not yet started that are the clear responsibility of the local authority particular attention in the audit is being given to the establishment of an Environmental Management System for the Council.
5. Recommendations are to be made concerning the possible removal of some measures and merger of others.
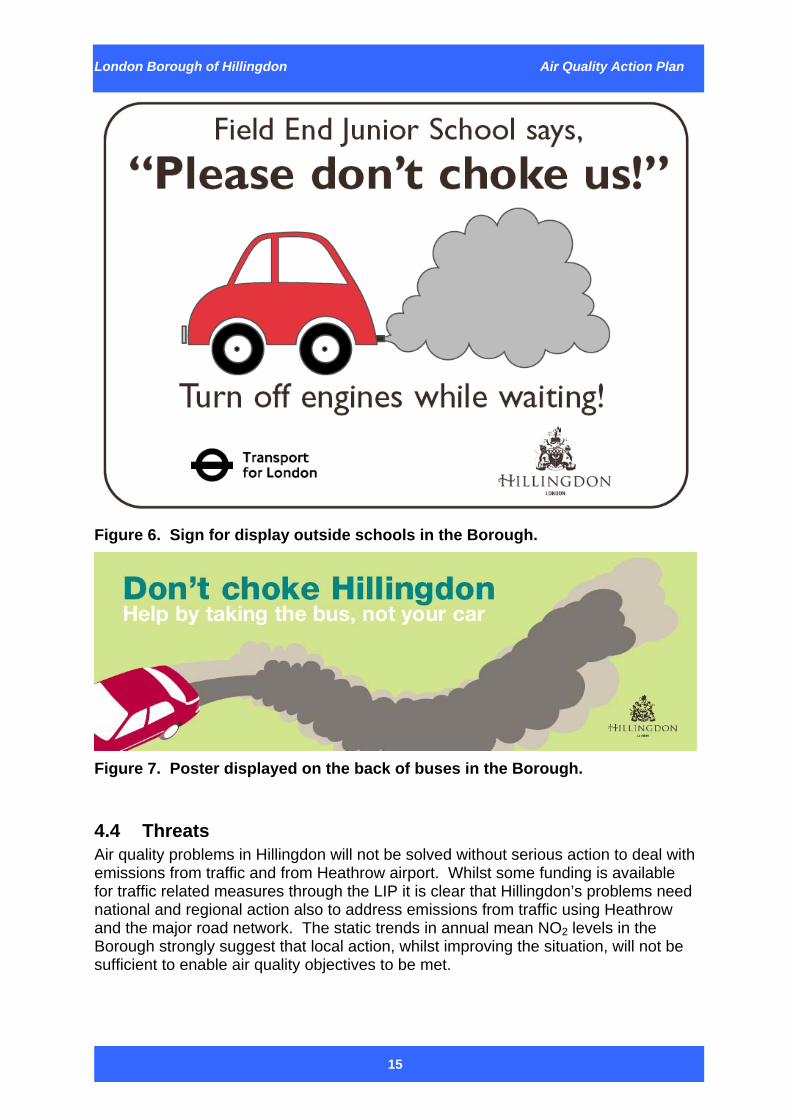
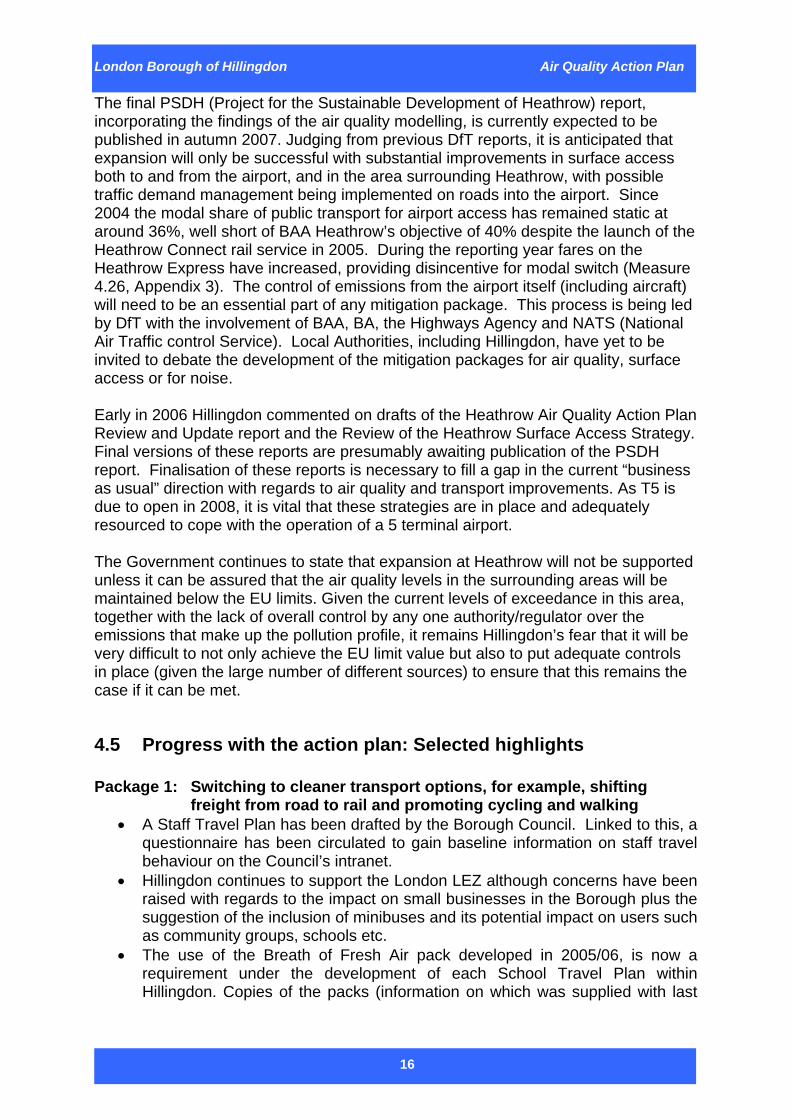
4.3 Opportunities A large number of measures identified in the action plan have been included in the LIP. This has the potential to provide a major source of funding for the action plan. Section 106 Agreements continue to provide further funding for measures included in or relevant to the action plan. The Environmental Protection Unit still enjoys enthusiastic support for the action plan from other departments in the Council, from procurement to transport planning. Good collaboration with other local stakeholders continues, particularly with neighbouring local authorities. This provides the scope for effective regional working. This, in turn, provides the opportunity to improve the effectiveness of delivery of the action plan. An important opportunity exists for local authorities to now share best practice more directly than has so far been done, in the interests of not reinventing wheels many times over up and down the country. Examples of resources that Hillingdon is happy to share with others include the teaching materials distributed with last year’s progress report and posters and signs such as those shown in Figure 6 and Figure 7. In addition to spreading best practice, action at a national level to identify such resources could save significant sums of money being spent on design and other consultants.
London Borough of Hillingdon Air Quality Action Plan
15
Figure 6. Sign for display outside schools in the Borough.
Figure 7. Poster displayed on the back of buses in the Borough.
4.4 Threats Air quality problems in Hillingdon will not be solved without serious action to deal with emissions from traffic and from Heathrow airport. Whilst some funding is available for traffic related measures through the LIP it is clear that Hillingdon’s problems need national and regional action also to address emissions from traffic using Heathrow and the major road network. The static trends in annual mean NO2 levels in the Borough strongly suggest that local action, whilst improving the situation, will not be sufficient to enable air quality objectives to be met.
London Borough of Hillingdon Air Quality Action Plan
16
The final PSDH (Project for the Sustainable Development of Heathrow) report, incorporating the findings of the air quality modelling, is currently expected to be published in autumn 2007. Judging from previous DfT reports, it is anticipated that expansion will only be successful with substantial improvements in surface access both to and from the airport, and in the area surrounding Heathrow, with possible traffic demand management being implemented on roads into the airport. Since 2004 the modal share of public transport for airport access has remained static at around 36%, well short of BAA Heathrow’s objective of 40% despite the launch of the Heathrow Connect rail service in 2005. During the reporting year fares on the Heathrow Express have increased, providing disincentive for modal switch (Measure 4.26, Appendix 3). The control of emissions from the airport itself (including aircraft) will need to be an essential part of any mitigation package. This process is being led by DfT with the involvement of BAA, BA, the Highways Agency and NATS (National Air Traffic control Service). Local Authorities, including Hillingdon, have yet to be invited to debate the development of the mitigation packages for air quality, surface access or for noise. Early in 2006 Hillingdon commented on drafts of the Heathrow Air Quality Action Plan Review and Update report and the Review of the Heathrow Surface Access Strategy. Final versions of these reports are presumably awaiting publication of the PSDH report. Finalisation of these reports is necessary to fill a gap in the current “business as usual” direction with regards to air quality and transport improvements. As T5 is due to open in 2008, it is vital that these strategies are in place and adequately resourced to cope with the operation of a 5 terminal airport. The Government continues to state that expansion at Heathrow will not be supported unless it can be assured that the air quality levels in the surrounding areas will be maintained below the EU limits. Given the current levels of exceedance in this area, together with the lack of overall control by any one authority/regulator over the emissions that make up the pollution profile, it remains Hillingdon’s fear that it will be very difficult to not only achieve the EU limit value but also to put adequate controls in place (given the large number of different sources) to ensure that this remains the case if it can be met.
4.5 Progress with the action plan: Selected highlights Package 1: Switching to cleaner transport options, for example, shifting
freight from road to rail and promoting cycling and walking • A Staff Travel Plan has been drafted by the Borough Council. Linked to this, a
questionnaire has been circulated to gain baseline information on staff travel behaviour on the Council’s intranet.
• Hillingdon continues to support the London LEZ although concerns have been raised with regards to the impact on small businesses in the Borough plus the suggestion of the inclusion of minibuses and its potential impact on users such as community groups, schools etc.
• The use of the Breath of Fresh Air pack developed in 2005/06, is now a requirement under the development of each School Travel Plan within Hillingdon. Copies of the packs (information on which was supplied with last
London Borough of Hillingdon Air Quality Action Plan
17
year’s progress report) for each Key Stage have now been provided to every school within the borough.
• BSP funding for 2006/07 has made good progress on packages 1, 2, 3 and 5 with regards to improving access to public transport via bus stop accessibility schemes, bus priority measures and station access schemes.
• Promotion of cycling has continued strongly with 4 new routes implemented and funding received for other improvements via section 106 agreements.
• A”Back of the bus” advert emphasising the health effects of air pollution ran for 4 weeks on buses specifically serving Hillingdon, encouraging people to use public transport (Figure 7).
Package 2: Tackling through traffic
• Walking and pedestrian safety have been promoted via 6 new local safety schemes at key points in the borough, a 20mph zone put in place at Oak Farm Estate and promotion of the Hillingdon Trail walks via the Green Spaces Strategy.
• Improvements to M4 junction 4 have been completed with the objective of reducing queue lengths especially on part of the M4 close to houses.
• The Highways Agency has released a report on “Planning and the Strategic Road Network””, available via the DfT website. This makes a general presumption that there will be no capacity enhancements on routes of strategic national importance purely to accommodate new developments. Any exceptions would be subject to stringent environmental assessment.
Package 3: Promotion of cleaner vehicle technology
• The Clean Vehicle Programme for the council fleet has progressed with a fleet emission inventory being commissioned. Hillingdon hope to proceed to a Gold award once this is complete.
• An electric SMART car and Modec electric van have been demonstrated for potential use in the council fleet.
• A follow up to the Breath of Fresh Air campaign in 2006/07 has been the offer of free signs to local schools raising awareness of the air quality impacts associated with idling vehicles (Figure 6). Overall, 39 schools ordered a total of 88 bespoke Don’t Choke Hillingdon School signs.
Package 4: Measures specific to Heathrow Airport
• Virgin has carried out an aircraft towing trial to assess its potential in reducing taxiing emissions and for operational feasibility at Heathrow.
• A new incentive fund of £100,000 has been set aside for Clean Vehicle Programme members with regard to adoption of low emission technologies.
• A commitment has been made to include BAA roads under the London LEZ scheme should it proceed.
Package 5: Measures concerning local industries and other businesses
• The establishment of a specific website for part B processes www.emissions.hillingdon.gov.uk enables public access to data on part Bs including on-line permit application forms.
• Following the audit of 2 industrial areas in 2005/06, results were disseminated via leaflets to raise awareness of local air quality issues, introduce the concept
London Borough of Hillingdon Air Quality Action Plan
18
of staff travel plans, ensure the criteria for the proposed London LEZ are communicated and to provide contact details for the West London Freight Quality Partnership.
• Hillingdon has developed bespoke public transport information brochures for the 2 industrial estates to distribute to their staff.
Package 6: Improving the eco-efficiency of current and future developments,
including those owned or operated by the Council • Measures concerning the development of supplementary planning guidance
for sustainable design and construction and sustainable waste management have been completed.
Package 7: Actions to be taken corporately, regionally, and in liaison with the
Mayor • A website for the West London Air Quality Cluster Group has been established
(http://www.westlondonairquality.org.uk/default.asp).
• The West London Air Quality Strategy has been revised and now includes links with climate change and a communications strategy for the dissemination of air quality information across West London.
• Funding opportunities have been explored with the West London Transport Strategy Group.
London Borough of Hillingdon Air Quality Action Plan
19
• Hillingdon has actively participated in APPLE (Air Pollution Planning and the Local Environment) group. APPLE has published 2 key documents this year – a Best Practice Guide for Construction sites (November 2006) and the Revision of London Councils’ Air Quality Planning Guidance (January 2007). Hillingdon uses both documents in the assessment of relevant planning applications.
Package 8: Plan management
• All measures in this package are at an advanced state of development. Stakeholder engagement
• Regular articles have been published in the borough magazine, Hillingdon People, on air quality issues, promotion of car share and introduction of Air Text to borough residents.
• Briefing notes on air quality and progress on matters concerning Heathrow have been distributed to residents groups in the Borough including presentations to specific resident’s forums such as Ickenham Residents Association and the Five Villages Forum.
• Participation in World Environment Day included promotion of the use of solar panels both in residential housing and industrial uses, a demonstration of a small wind turbine and home energy efficiency measures.
• The film “An Inconvenient Truth” has been shown to councillors. • Regular attendance of West London Air Quality Cluster group member at
West London Freight Quality Partnership meetings to explore opportunities for joint working.
London Borough of Hillingdon Air Quality Action Plan
20
Chapter 5 Conclusions, and the way ahead One of the major conclusions of this report, echoing the findings of previous years, is that NO2 levels in Hillingdon show little or no sign of improvement, despite the growing number of vehicles with much reduced NOx emissions in the car fleet and continued progress with the action plan. There are several reasons for this. The first is that the reduction in emissions per vehicle is countered to some extent by increased traffic on the roads. The second is that concentrations of NO2 are influenced not solely by local emissions of NOx, but also by regional emissions and a complex atmospheric chemistry, involving ozone. Both problems were recognised in the development of the action plan, and explain why it was concluded that such an extensive plan was needed if we are to move significantly towards non-exceedance of the annual mean NO2 objective in Hillingdon. There is, however, also good news from the monitoring networks, that concentrations of all other pollutants monitored in the Borough in 2006 did not exceed the objectives set by government. That said, there is a continuing need to monitor concentrations of fine particles because of continued concern about their health impacts. The major source of NOx emissions in the Borough will remain the airport for the foreseeable future, followed by traffic, particularly on the major roads that go through the Borough. The Council does not have direct control of either source. It is essential therefore that it continues to encourage the relevant government departments and agencies and the airport operator to improve performance. The Council will of course need to pay careful attention to the report from PSDH (Project for the Sustainable Development of Heathrow) when it is published in autumn 2007. This progress report demonstrates that most of the measures contained in the action plan are underway, a few are completed, whilst a significant number are now part of rolling programmes that will continue for some time to come. The measures that have yet to start and those that are still at the planning stage need to be reviewed. This is being done as part of an audit of progress with the plan which will report shortly. This will also consider whether there is a need to restructure the plan, include additional measures (for example, any found particularly useful by other councils) or eliminate some of those listed in the original plan.
London Borough of Hillingdon Air Quality Action Plan
21
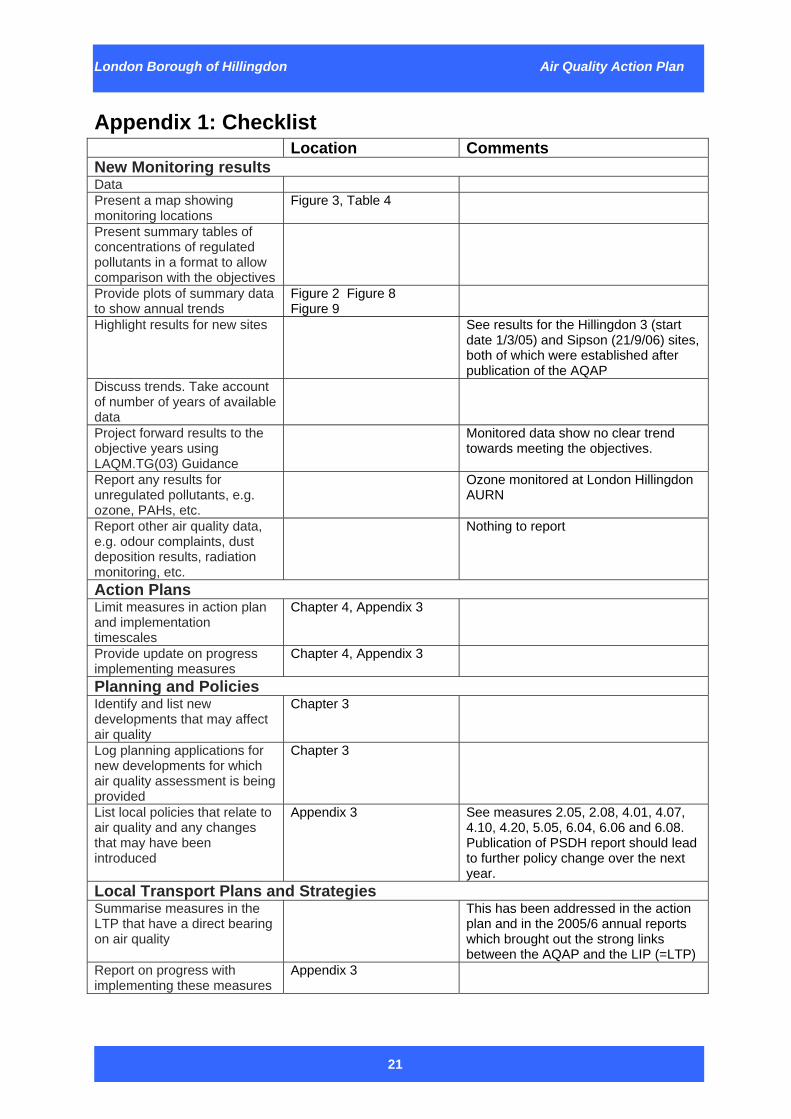
Appendix 1: Checklist Location Comments New Monitoring results Data Appendix 2 Present a map showing monitoring locations
Figure 3, Table 4
Present summary tables of concentrations of regulated pollutants in a format to allow comparison with the objectives
Appendix 2
Provide plots of summary data to show annual trends
Figure 2, Figure 8 and Figure 9
Highlight results for new sites Chapter 2 and Appendix 2 See results for the Hillingdon 3 (start date 1/3/05) and Sipson (21/9/06) sites, both of which were established after publication of the AQAP
Discuss trends. Take account of number of years of available data
Sections 2.2, 2.3 and Appendix 2
Project forward results to the objective years using LAQM.TG(03) Guidance
Chapter 2, Appendix 2 Monitored data show no clear trend towards meeting the objectives.
Report any results for unregulated pollutants, e.g. ozone, PAHs, etc.
Ozone monitored at London Hillingdon AURN
Report other air quality data, e.g. odour complaints, dust deposition results, radiation monitoring, etc.
Nothing to report
Action Plans Limit measures in action plan and implementation timescales
Chapter 4, Appendix 3
Provide update on progress implementing measures
Chapter 4, Appendix 3
Planning and Policies Identify and list new developments that may affect air quality
Chapter 3
Log planning applications for new developments for which air quality assessment is being provided
Chapter 3
List local policies that relate to air quality and any changes that may have been introduced
Appendix 3 See measures 2.05, 2.08, 4.01, 4.07, 4.10, 4.20, 5.05, 6.04, 6.06 and 6.08. Publication of PSDH report should lead to further policy change over the next year.
Local Transport Plans and Strategies Summarise measures in the LTP that have a direct bearing on air quality
This has been addressed in the action plan and in the 2005/6 annual reports which brought out the strong links between the AQAP and the LIP (=LTP)
Report on progress with implementing these measures
Appendix 3
London Borough of Hillingdon Air Quality Action Plan
22
Appendix 2: Monitored Levels of Air Pollution in Hillingdon
A2.1 Summary of monitoring activities The London Borough of Hillingdon undertakes monitoring of atmospheric concentrations of the following pollutants:
• NO2 (by automatic monitoring and diffusion tubes) • PM10 (by automatic monitoring) • Benzene (by diffusion tubes)
None of the other pollutants covered by the National Air Quality Strategy are monitored by the Council as they are not likely to be present at concentrations high enough to exceed objectives. However, CO, O3 and SO2 are monitored in the Borough at sites run within the Automatic Urban and Rural Network (AURN).
A2.1.1 Quality Assurance and Quality Control (QA/QC) To ensure that monitoring equipment is reading correctly it is subject to a programme of quality assurance and quality control, as follows: Diffusion Tubes:
The NO2 diffusion tubes are prepared and analysed by Gradko. This laboratory takes part in the NO2 Network QA/QC Field Inter-comparison.
Automatic monitoring site: The automatic monitoring sites are calibrated fortnightly and serviced 6-monthly.
A2.1.2 Data ratification The automatic monitoring data presented in this report are ratified by AEA Energy & Environment and the Environmental Research Group. Data less than 12 months old will be subject to further ratification and may change in the future.
A2.2 Automatic monitoring sites Continuous monitors within Hillingdon and selected ones in the surrounding local authorities are listed in Table 4 below. Reference to monitors sited outside of the Borough allows a more comprehensive assessment of air quality in the Hillingdon area. It can also provide additional information that is useful in assessing the robustness of any trends that may be observed within the Borough.
London Borough of Hillingdon Air Quality Action Plan
23
Table 4. Details of automatic monitoring sites in and around Hillingdon
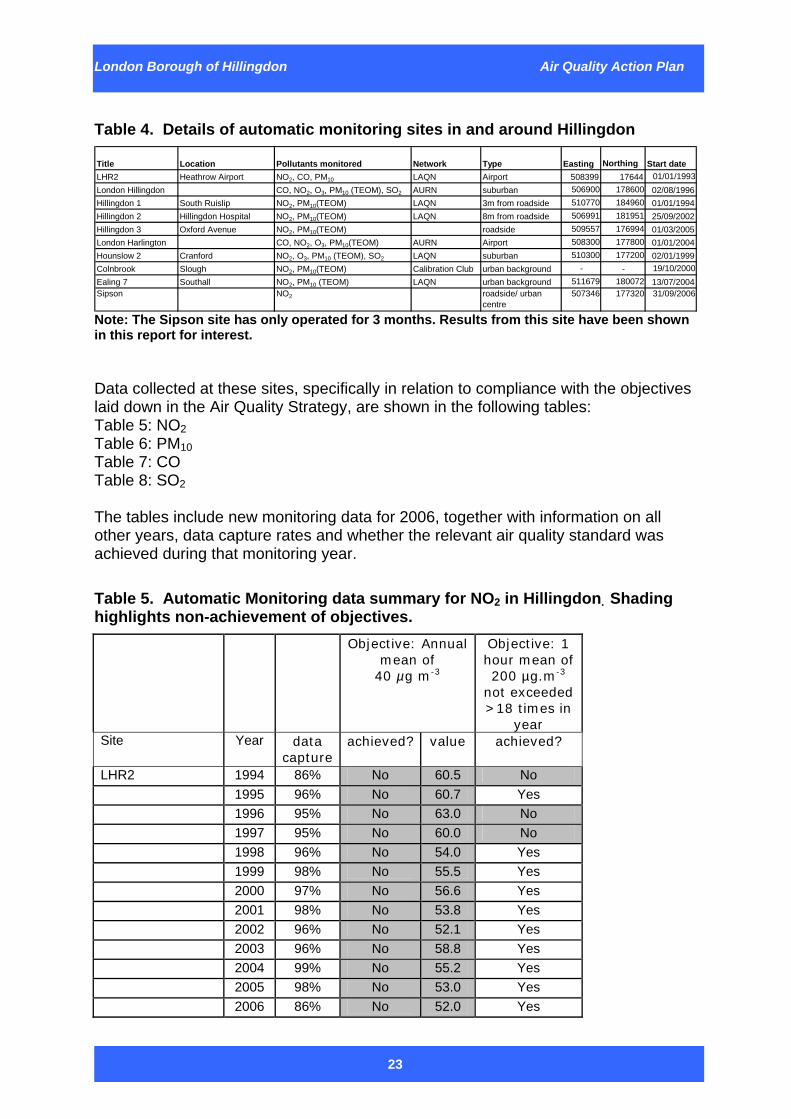
Title Location Pollutants monitored Network Type Easting Northing Start dateLHR2 Heathrow Airport NO2, CO, PM10 LAQN Airport 508399 17644 01/01/1993London Hillingdon CO, NO2, O3, PM10 (TEOM), SO2 AURN suburban 506900 178600 02/08/1996Hillingdon 1 South Ruislip NO2, PM10(TEOM) LAQN 3m from roadside 510770 184960 01/01/1994Hillingdon 2 Hillingdon Hospital NO2, PM10(TEOM) LAQN 8m from roadside 506991 181951 25/09/2002Hillingdon 3 Oxford Avenue NO2, PM10(TEOM) roadside 509557 176994 01/03/2005London Harlington CO, NO2, O3, PM10(TEOM) AURN Airport 508300 177800 01/01/2004Hounslow 2 Cranford NO2, O3, PM10 (TEOM), SO2 LAQN suburban 510300 177200 02/01/1999Colnbrook Slough NO2, PM10(TEOM) Calibration Club urban background - - 19/10/2000Ealing 7 Southall NO2, PM10 (TEOM) LAQN urban background 511679 180072 13/07/2004Sipson NO2 roadside/ urban
centre507346 177320 31/09/2006
Note: The Sipson site has only operated for 3 months. Results from this site have been shown in this report for interest. Data collected at these sites, specifically in relation to compliance with the objectives laid down in the Air Quality Strategy, are shown in the following tables: Table 5: NO2 Table 6: PM10 Table 7: CO Table 8: SO2 The tables include new monitoring data for 2006, together with information on all other years, data capture rates and whether the relevant air quality standard was achieved during that monitoring year. Table 5. Automatic Monitoring data summary for NO2 in Hillingdon. Shading highlights non-achievement of objectives. Objective: Annual
mean of 40 µg m-3
Objective: 1 hour mean of 200 µg.m-3
not exceeded >18 times in
year Site Year data
capture achieved? value achieved?
LHR2 1994 86% No 60.5 No 1995 96% No 60.7 Yes 1996 95% No 63.0 No 1997 95% No 60.0 No 1998 96% No 54.0 Yes 1999 98% No 55.5 Yes 2000 97% No 56.6 Yes 2001 98% No 53.8 Yes 2002 96% No 52.1 Yes 2003 96% No 58.8 Yes 2004 99% No 55.2 Yes 2005 98% No 53.0 Yes 2006 86% No 52.0 Yes
London Borough of Hillingdon Air Quality Action Plan
24
Objective: Annual mean of
40 µg m-3
Objective: 1 hour mean of 200 µg.m-3
not exceeded >18 times in
year Site Year data
capture achieved? value achieved?
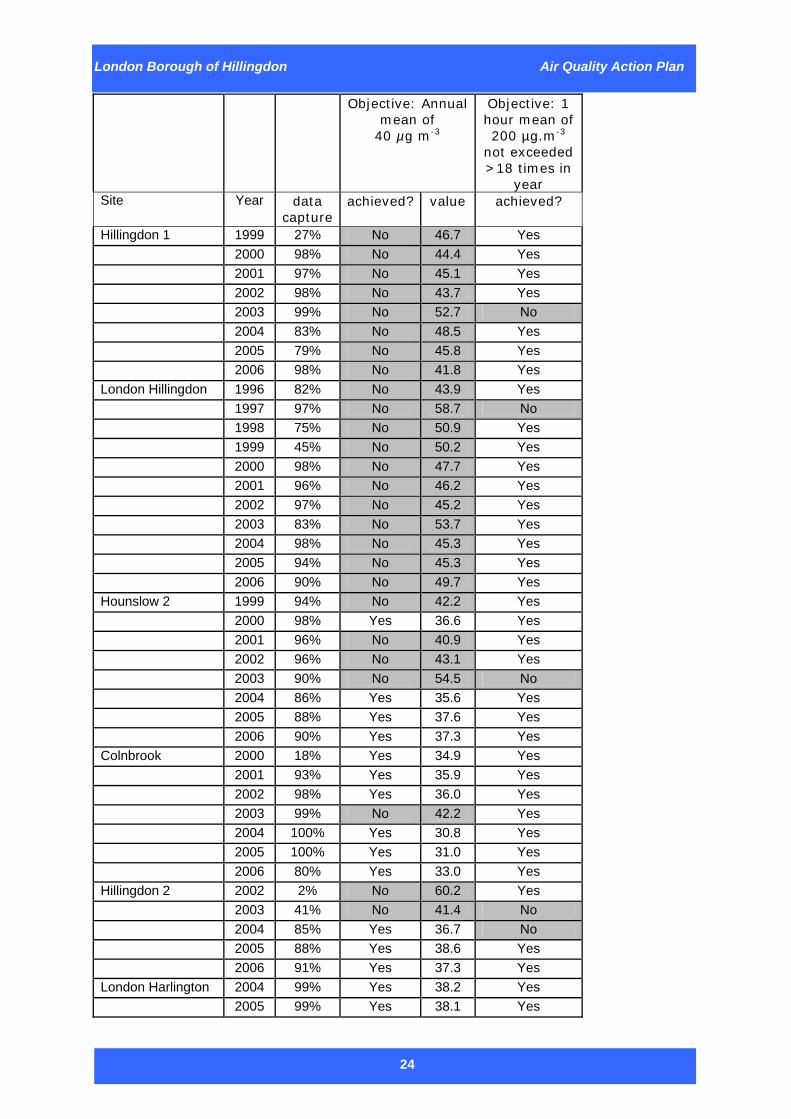
Hillingdon 1 1999 27% No 46.7 Yes 2000 98% No 44.4 Yes 2001 97% No 45.1 Yes 2002 98% No 43.7 Yes 2003 99% No 52.7 No 2004 83% No 48.5 Yes 2005 79% No 45.8 Yes 2006 98% No 41.8 Yes London Hillingdon 1996 82% No 43.9 Yes 1997 97% No 58.7 No 1998 75% No 50.9 Yes 1999 45% No 50.2 Yes 2000 98% No 47.7 Yes 2001 96% No 46.2 Yes 2002 97% No 45.2 Yes 2003 83% No 53.7 Yes 2004 98% No 45.3 Yes 2005 94% No 45.3 Yes 2006 90% No 49.7 Yes Hounslow 2 1999 94% No 42.2 Yes 2000 98% Yes 36.6 Yes 2001 96% No 40.9 Yes 2002 96% No 43.1 Yes 2003 90% No 54.5 No 2004 86% Yes 35.6 Yes 2005 88% Yes 37.6 Yes 2006 90% Yes 37.3 Yes Colnbrook 2000 18% Yes 34.9 Yes 2001 93% Yes 35.9 Yes 2002 98% Yes 36.0 Yes 2003 99% No 42.2 Yes 2004 100% Yes 30.8 Yes 2005 100% Yes 31.0 Yes 2006 80% Yes 33.0 Yes Hillingdon 2 2002 2% No 60.2 Yes 2003 41% No 41.4 No 2004 85% Yes 36.7 No 2005 88% Yes 38.6 Yes 2006 91% Yes 37.3 Yes London Harlington 2004 99% Yes 38.2 Yes 2005 99% Yes 38.1 Yes
London Borough of Hillingdon Air Quality Action Plan
25
Objective: Annual mean of
40 µg m-3
Objective: 1 hour mean of 200 µg.m-3
not exceeded >18 times in
year Site Year data
capture achieved? value achieved?
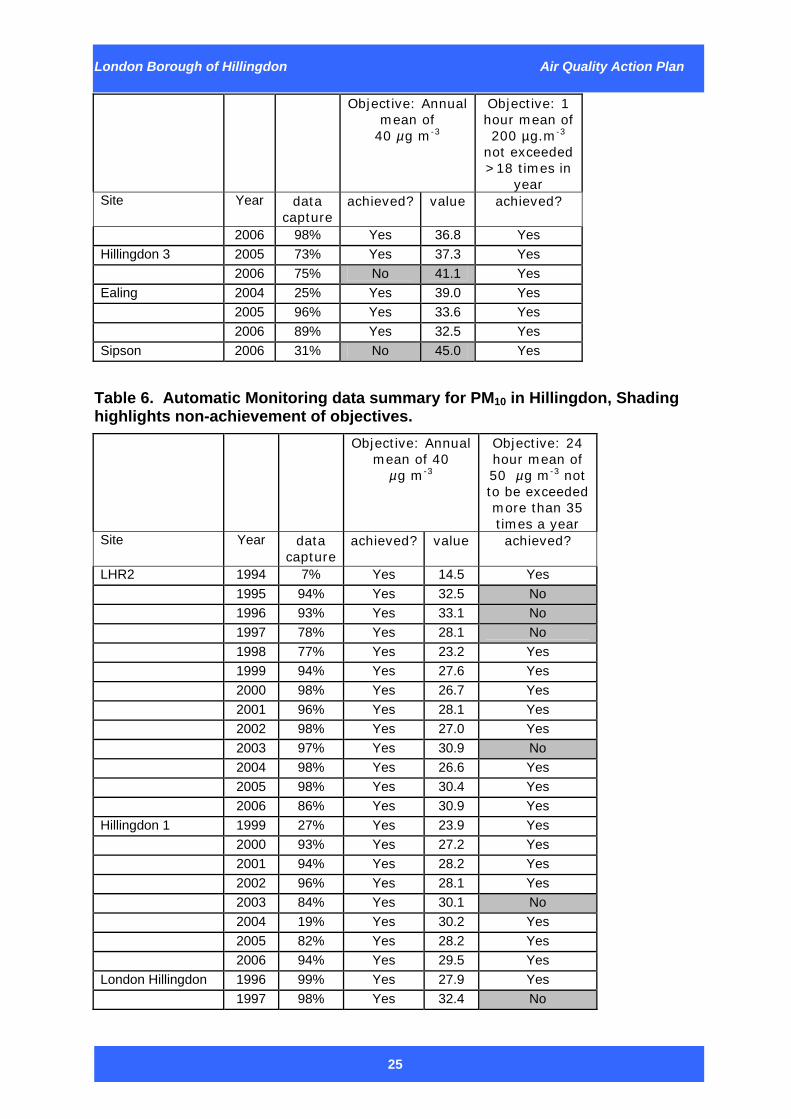
2006 98% Yes 36.8 Yes Hillingdon 3 2005 73% Yes 37.3 Yes 2006 75% No 41.1 Yes Ealing 2004 25% Yes 39.0 Yes 2005 96% Yes 33.6 Yes 2006 89% Yes 32.5 Yes Sipson 2006 31% No 45.0 Yes
Table 6. Automatic Monitoring data summary for PM10 in Hillingdon, Shading highlights non-achievement of objectives. Objective: Annual
mean of 40 µg m-3
Objective: 24 hour mean of 50 µg m-3 not to be exceeded more than 35 times a year
Site Year data capture
achieved? value achieved?
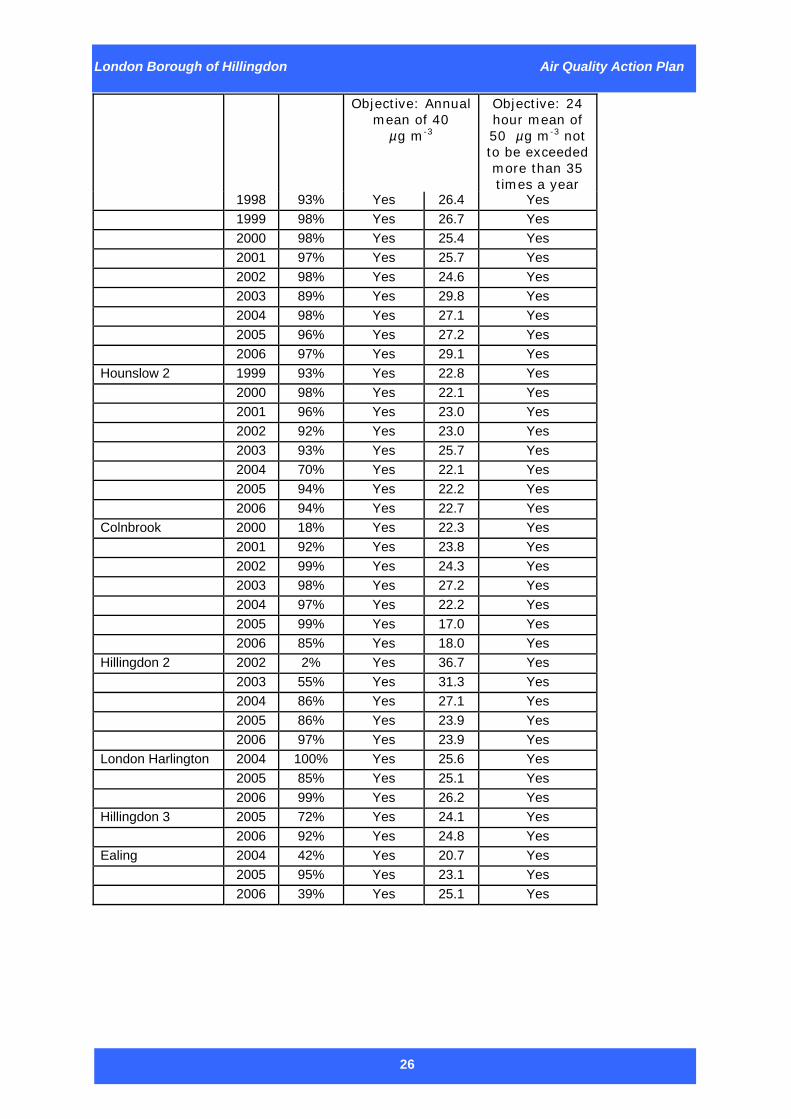
LHR2 1994 7% Yes 14.5 Yes 1995 94% Yes 32.5 No 1996 93% Yes 33.1 No 1997 78% Yes 28.1 No 1998 77% Yes 23.2 Yes 1999 94% Yes 27.6 Yes 2000 98% Yes 26.7 Yes 2001 96% Yes 28.1 Yes 2002 98% Yes 27.0 Yes 2003 97% Yes 30.9 No 2004 98% Yes 26.6 Yes 2005 98% Yes 30.4 Yes 2006 86% Yes 30.9 Yes Hillingdon 1 1999 27% Yes 23.9 Yes 2000 93% Yes 27.2 Yes 2001 94% Yes 28.2 Yes 2002 96% Yes 28.1 Yes 2003 84% Yes 30.1 No 2004 19% Yes 30.2 Yes 2005 82% Yes 28.2 Yes 2006 94% Yes 29.5 Yes London Hillingdon 1996 99% Yes 27.9 Yes 1997 98% Yes 32.4 No
London Borough of Hillingdon Air Quality Action Plan
26
Objective: Annual mean of 40
µg m-3
Objective: 24 hour mean of 50 µg m-3 not to be exceeded more than 35 times a year
1998 93% Yes 26.4 Yes 1999 98% Yes 26.7 Yes 2000 98% Yes 25.4 Yes 2001 97% Yes 25.7 Yes 2002 98% Yes 24.6 Yes 2003 89% Yes 29.8 Yes 2004 98% Yes 27.1 Yes 2005 96% Yes 27.2 Yes 2006 97% Yes 29.1 Yes Hounslow 2 1999 93% Yes 22.8 Yes 2000 98% Yes 22.1 Yes 2001 96% Yes 23.0 Yes 2002 92% Yes 23.0 Yes 2003 93% Yes 25.7 Yes 2004 70% Yes 22.1 Yes 2005 94% Yes 22.2 Yes 2006 94% Yes 22.7 Yes Colnbrook 2000 18% Yes 22.3 Yes 2001 92% Yes 23.8 Yes 2002 99% Yes 24.3 Yes 2003 98% Yes 27.2 Yes 2004 97% Yes 22.2 Yes 2005 99% Yes 17.0 Yes 2006 85% Yes 18.0 Yes Hillingdon 2 2002 2% Yes 36.7 Yes 2003 55% Yes 31.3 Yes 2004 86% Yes 27.1 Yes 2005 86% Yes 23.9 Yes 2006 97% Yes 23.9 Yes London Harlington 2004 100% Yes 25.6 Yes 2005 85% Yes 25.1 Yes 2006 99% Yes 26.2 Yes Hillingdon 3 2005 72% Yes 24.1 Yes 2006 92% Yes 24.8 Yes Ealing 2004 42% Yes 20.7 Yes 2005 95% Yes 23.1 Yes 2006 39% Yes 25.1 Yes
London Borough of Hillingdon Air Quality Action Plan
27
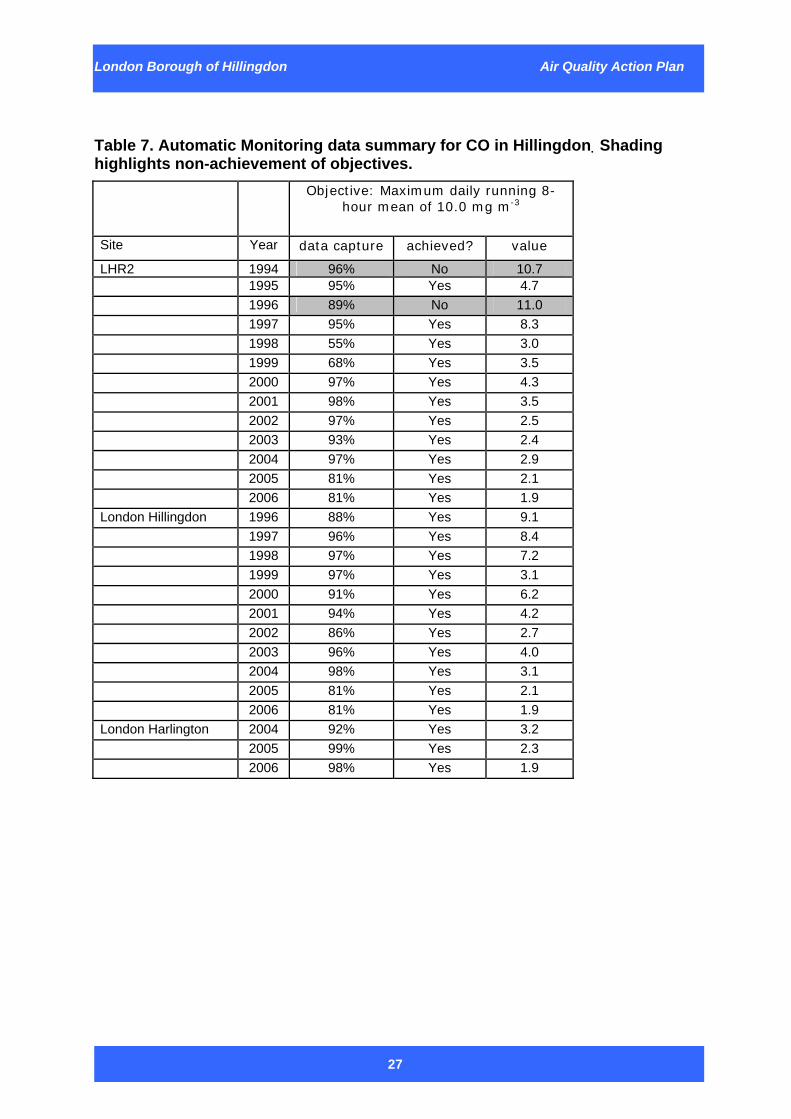
Table 7. Automatic Monitoring data summary for CO in Hillingdon. Shading highlights non-achievement of objectives. Objective: Maximum daily running 8-
hour mean of 10.0 mg m-3
Site Year data capture achieved? value
LHR2 1994 96% No 10.7 1995 95% Yes 4.7 1996 89% No 11.0 1997 95% Yes 8.3 1998 55% Yes 3.0 1999 68% Yes 3.5 2000 97% Yes 4.3 2001 98% Yes 3.5 2002 97% Yes 2.5 2003 93% Yes 2.4 2004 97% Yes 2.9 2005 81% Yes 2.1 2006 81% Yes 1.9 London Hillingdon 1996 88% Yes 9.1 1997 96% Yes 8.4 1998 97% Yes 7.2 1999 97% Yes 3.1 2000 91% Yes 6.2 2001 94% Yes 4.2 2002 86% Yes 2.7 2003 96% Yes 4.0 2004 98% Yes 3.1 2005 81% Yes 2.1 2006 81% Yes 1.9 London Harlington 2004 92% Yes 3.2 2005 99% Yes 2.3 2006 98% Yes 1.9
London Borough of Hillingdon Air Quality Action Plan
28
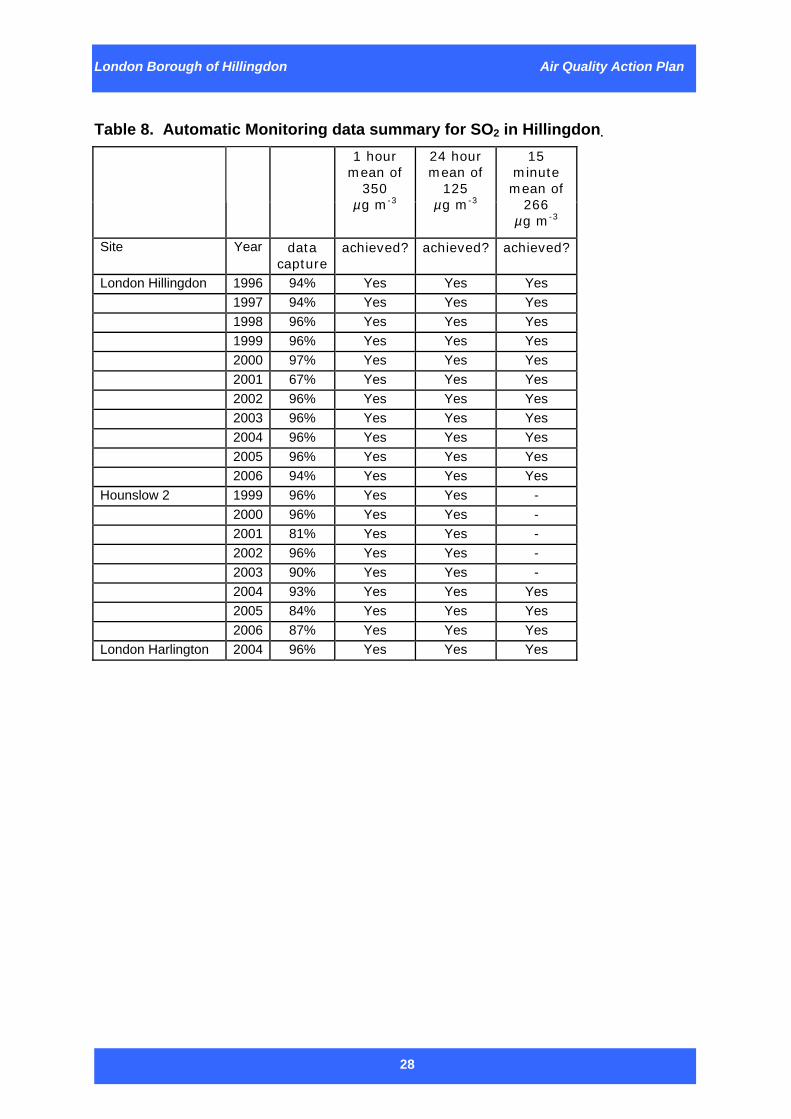
Table 8. Automatic Monitoring data summary for SO2 in Hillingdon. 1 hour
mean of 350
µg m-3
24 hour mean of
125 µg m-3
15 minute mean of
266 µg m-3
Site Year data capture
achieved? achieved? achieved?
London Hillingdon 1996 94% Yes Yes Yes 1997 94% Yes Yes Yes 1998 96% Yes Yes Yes 1999 96% Yes Yes Yes 2000 97% Yes Yes Yes 2001 67% Yes Yes Yes 2002 96% Yes Yes Yes 2003 96% Yes Yes Yes 2004 96% Yes Yes Yes 2005 96% Yes Yes Yes 2006 94% Yes Yes Yes Hounslow 2 1999 96% Yes Yes - 2000 96% Yes Yes - 2001 81% Yes Yes - 2002 96% Yes Yes - 2003 90% Yes Yes - 2004 93% Yes Yes Yes 2005 84% Yes Yes Yes 2006 87% Yes Yes Yes London Harlington 2004 96% Yes Yes Yes
London Borough of Hillingdon Air Quality Action Plan
29
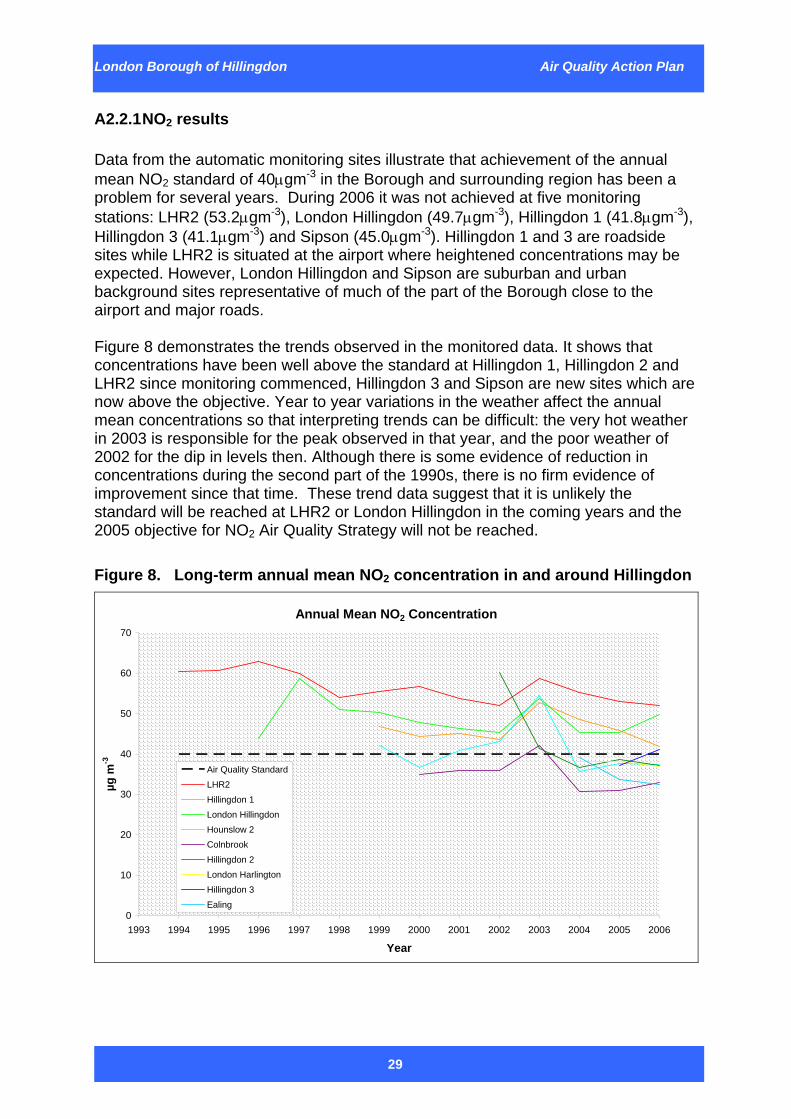
A2.2.1 NO2 results Data from the automatic monitoring sites illustrate that achievement of the annual mean NO2 standard of 40μgm-3 in the Borough and surrounding region has been a problem for several years. During 2006 it was not achieved at five monitoring stations: LHR2 (53.2μgm-3), London Hillingdon (49.7μgm-3), Hillingdon 1 (41.8μgm-3), Hillingdon 3 (41.1μgm-3) and Sipson (45.0μgm-3). Hillingdon 1 and 3 are roadside sites while LHR2 is situated at the airport where heightened concentrations may be expected. However, London Hillingdon and Sipson are suburban and urban background sites representative of much of the part of the Borough close to the airport and major roads. Figure 8 demonstrates the trends observed in the monitored data. It shows that concentrations have been well above the standard at Hillingdon 1, Hillingdon 2 and LHR2 since monitoring commenced, Hillingdon 3 and Sipson are new sites which are now above the objective. Year to year variations in the weather affect the annual mean concentrations so that interpreting trends can be difficult: the very hot weather in 2003 is responsible for the peak observed in that year, and the poor weather of 2002 for the dip in levels then. Although there is some evidence of reduction in concentrations during the second part of the 1990s, there is no firm evidence of improvement since that time. These trend data suggest that it is unlikely the standard will be reached at LHR2 or London Hillingdon in the coming years and the 2005 objective for NO2 Air Quality Strategy will not be reached. Figure 8. Long-term annual mean NO2 concentration in and around Hillingdon
Annual Mean NO2 Concentration
0
10
20
30
40
50
60
70
1993 1994 1995 1996 1997 1998 1999 2000 2001 2002 2003 2004 2005 2006
Year
µg m
-3
Air Quality StandardLHR2Hillingdon 1London HillingdonHounslow 2ColnbrookHillingdon 2London HarlingtonHillingdon 3Ealing
London Borough of Hillingdon Air Quality Action Plan
30
These findings are entirely in agreement with the conclusions of previous air quality reports from which it was concluded that the southern half of the Borough should be declared an AQMA.
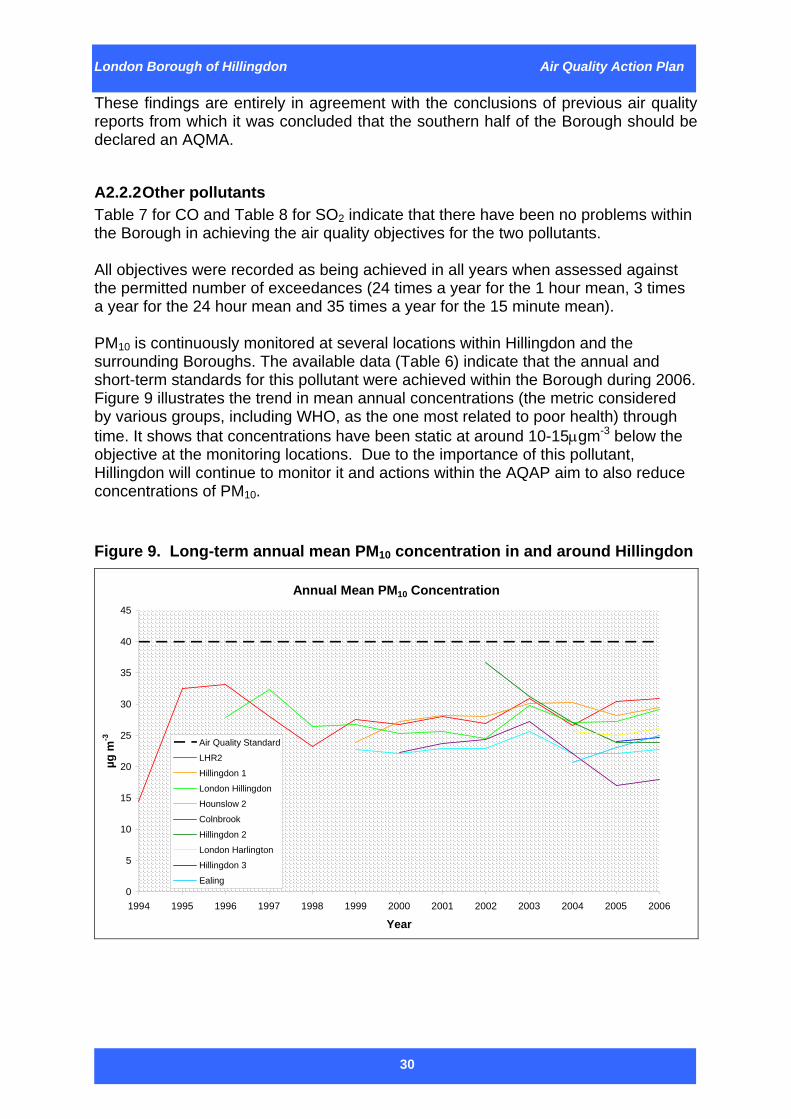
A2.2.2 Other pollutants Table 7 for CO and Table 8 for SO2 indicate that there have been no problems within the Borough in achieving the air quality objectives for the two pollutants. All objectives were recorded as being achieved in all years when assessed against the permitted number of exceedances (24 times a year for the 1 hour mean, 3 times a year for the 24 hour mean and 35 times a year for the 15 minute mean). PM10 is continuously monitored at several locations within Hillingdon and the surrounding Boroughs. The available data (Table 6) indicate that the annual and short-term standards for this pollutant were achieved within the Borough during 2006. Figure 9 illustrates the trend in mean annual concentrations (the metric considered by various groups, including WHO, as the one most related to poor health) through time. It shows that concentrations have been static at around 10-15μgm-3 below the objective at the monitoring locations. Due to the importance of this pollutant, Hillingdon will continue to monitor it and actions within the AQAP aim to also reduce concentrations of PM10.
Figure 9. Long-term annual mean PM10 concentration in and around Hillingdon
Annual Mean PM10 Concentration
0
5
10
15
20
25
30
35
40
45
1994 1995 1996 1997 1998 1999 2000 2001 2002 2003 2004 2005 2006
Year
µg m
-3 Air Quality Standard
LHR2
Hillingdon 1
London Hillingdon
Hounslow 2
Colnbrook
Hillingdon 2
London Harlington
Hillingdon 3
Ealing
London Borough of Hillingdon Air Quality Action Plan
31
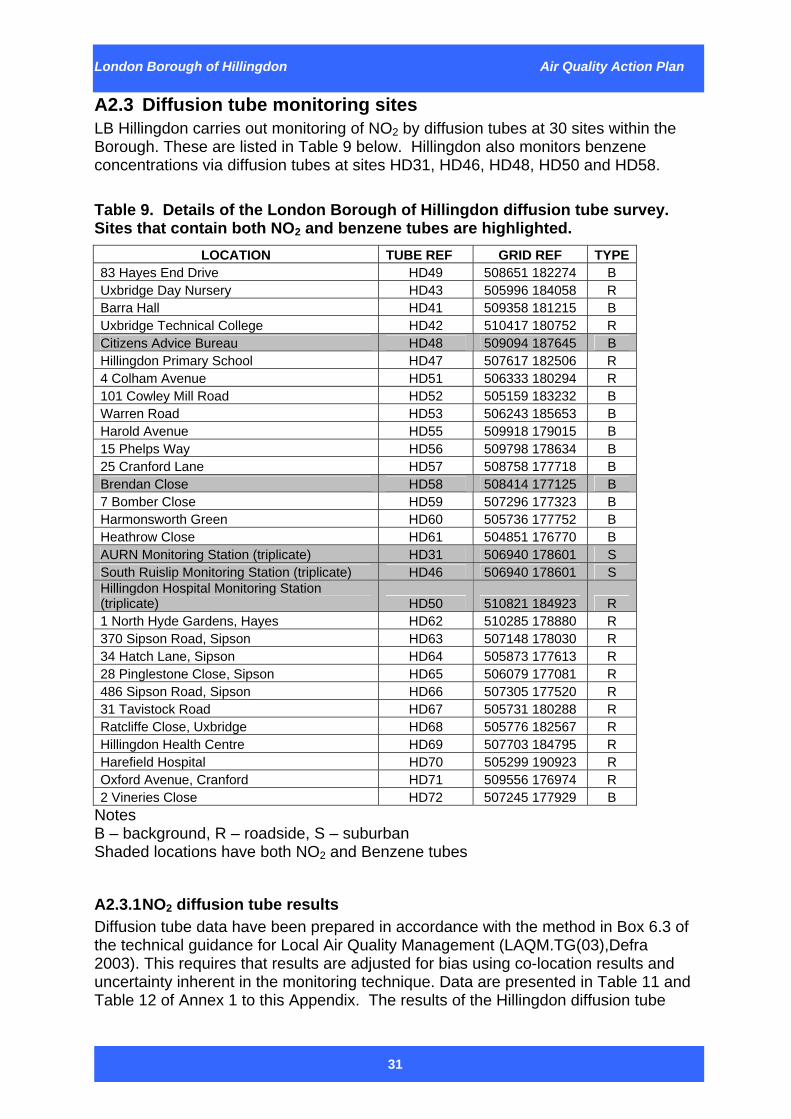
A2.3 Diffusion tube monitoring sites LB Hillingdon carries out monitoring of NO2 by diffusion tubes at 30 sites within the Borough. These are listed in Table 9 below. Hillingdon also monitors benzene concentrations via diffusion tubes at sites HD31, HD46, HD48, HD50 and HD58. Table 9. Details of the London Borough of Hillingdon diffusion tube survey. Sites that contain both NO2 and benzene tubes are highlighted.
LOCATION TUBE REF GRID REF TYPE 83 Hayes End Drive HD49 508651 182274 B Uxbridge Day Nursery HD43 505996 184058 R Barra Hall HD41 509358 181215 B Uxbridge Technical College HD42 510417 180752 R Citizens Advice Bureau HD48 509094 187645 B Hillingdon Primary School HD47 507617 182506 R 4 Colham Avenue HD51 506333 180294 R 101 Cowley Mill Road HD52 505159 183232 B Warren Road HD53 506243 185653 B Harold Avenue HD55 509918 179015 B 15 Phelps Way HD56 509798 178634 B 25 Cranford Lane HD57 508758 177718 B Brendan Close HD58 508414 177125 B 7 Bomber Close HD59 507296 177323 B Harmonsworth Green HD60 505736 177752 B Heathrow Close HD61 504851 176770 B AURN Monitoring Station (triplicate) HD31 506940 178601 S South Ruislip Monitoring Station (triplicate) HD46 506940 178601 S Hillingdon Hospital Monitoring Station (triplicate) HD50 510821 184923 R 1 North Hyde Gardens, Hayes HD62 510285 178880 R 370 Sipson Road, Sipson HD63 507148 178030 R 34 Hatch Lane, Sipson HD64 505873 177613 R 28 Pinglestone Close, Sipson HD65 506079 177081 R 486 Sipson Road, Sipson HD66 507305 177520 R 31 Tavistock Road HD67 505731 180288 R Ratcliffe Close, Uxbridge HD68 505776 182567 R Hillingdon Health Centre HD69 507703 184795 R Harefield Hospital HD70 505299 190923 R Oxford Avenue, Cranford HD71 509556 176974 R 2 Vineries Close HD72 507245 177929 B
Notes B – background, R – roadside, S – suburban Shaded locations have both NO2 and Benzene tubes
A2.3.1 NO2 diffusion tube results Diffusion tube data have been prepared in accordance with the method in Box 6.3 of the technical guidance for Local Air Quality Management (LAQM.TG(03),Defra 2003). This requires that results are adjusted for bias using co-location results and uncertainty inherent in the monitoring technique. Data are presented in Table 11 and Table 12 of Annex 1 to this Appendix. The results of the Hillingdon diffusion tube
London Borough of Hillingdon Air Quality Action Plan
32
survey are mapped in Figure 3 in the main text of this report. These maps demonstrate that the annual mean standard for NO2 has been widely exceeded since 2000 at both background sites representative of large parts of the Borough and roadside sites. Results for 2006 are overall better than those for 2005 but as with the continuous monitoring it is difficult to make firm interpretation of the overall trends in these data. These data continue to support the declaration of the Hillingdon AQMA and the need for the Hillingdon AQAP.
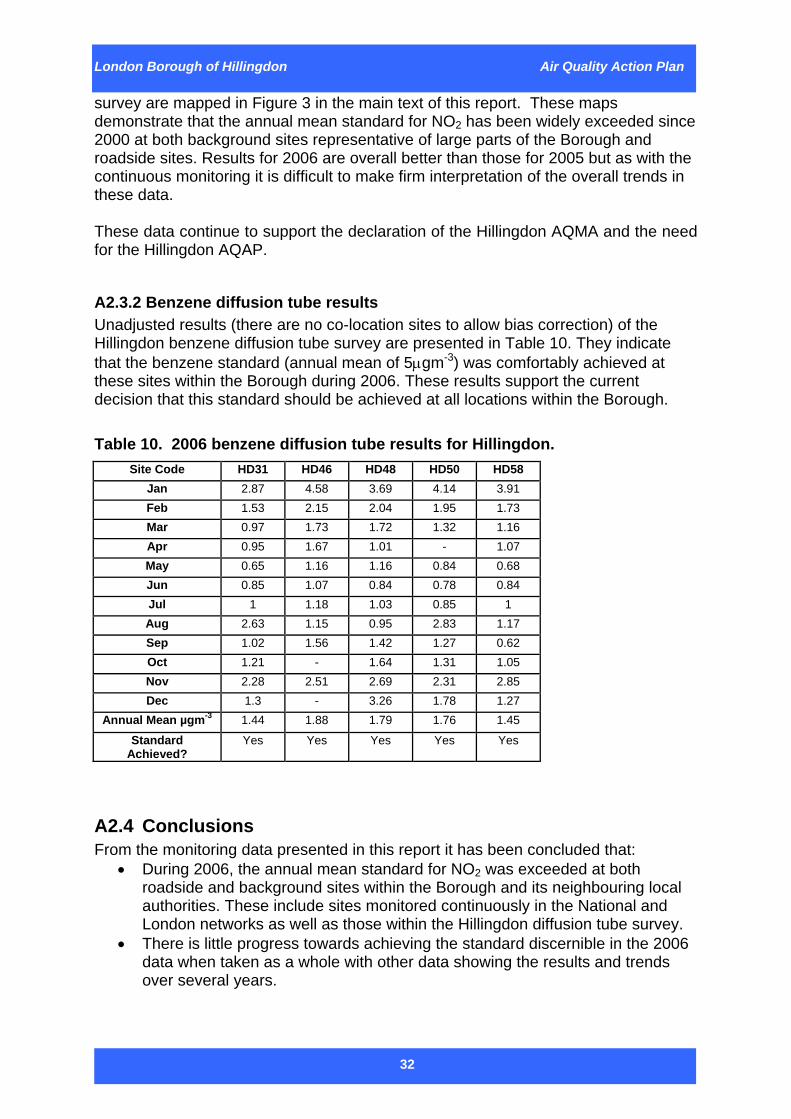
A2.3.2 Benzene diffusion tube results Unadjusted results (there are no co-location sites to allow bias correction) of the Hillingdon benzene diffusion tube survey are presented in Table 10. They indicate that the benzene standard (annual mean of 5μgm-3) was comfortably achieved at these sites within the Borough during 2006. These results support the current decision that this standard should be achieved at all locations within the Borough. Table 10. 2006 benzene diffusion tube results for Hillingdon.
Site Code HD31 HD46 HD48 HD50 HD58 Jan 2.87 4.58 3.69 4.14 3.91 Feb 1.53 2.15 2.04 1.95 1.73 Mar 0.97 1.73 1.72 1.32 1.16 Apr 0.95 1.67 1.01 - 1.07 May 0.65 1.16 1.16 0.84 0.68 Jun 0.85 1.07 0.84 0.78 0.84 Jul 1 1.18 1.03 0.85 1 Aug 2.63 1.15 0.95 2.83 1.17 Sep 1.02 1.56 1.42 1.27 0.62 Oct 1.21 - 1.64 1.31 1.05 Nov 2.28 2.51 2.69 2.31 2.85 Dec 1.3 - 3.26 1.78 1.27
Annual Mean µgm-3 1.44 1.88 1.79 1.76 1.45
Standard Achieved?
Yes Yes Yes Yes Yes
A2.4 Conclusions From the monitoring data presented in this report it has been concluded that:
• During 2006, the annual mean standard for NO2 was exceeded at both roadside and background sites within the Borough and its neighbouring local authorities. These include sites monitored continuously in the National and London networks as well as those within the Hillingdon diffusion tube survey.
• There is little progress towards achieving the standard discernible in the 2006 data when taken as a whole with other data showing the results and trends over several years.

London Borough of Hillingdon Air Quality Action Plan
33
• These results support the decision to declare the AQMA and to adopt the AQAP based on the exposure of parts of the Hillingdon population to these levels of NO2.
• Other monitoring results indicate that the standards for other air quality strategy pollutants were achieved during 2006.
• These results support the decision not to declare the AQMA on the basis of exposure to these other pollutants.
London Borough of Hillingdon Air Quality Action Plan
34
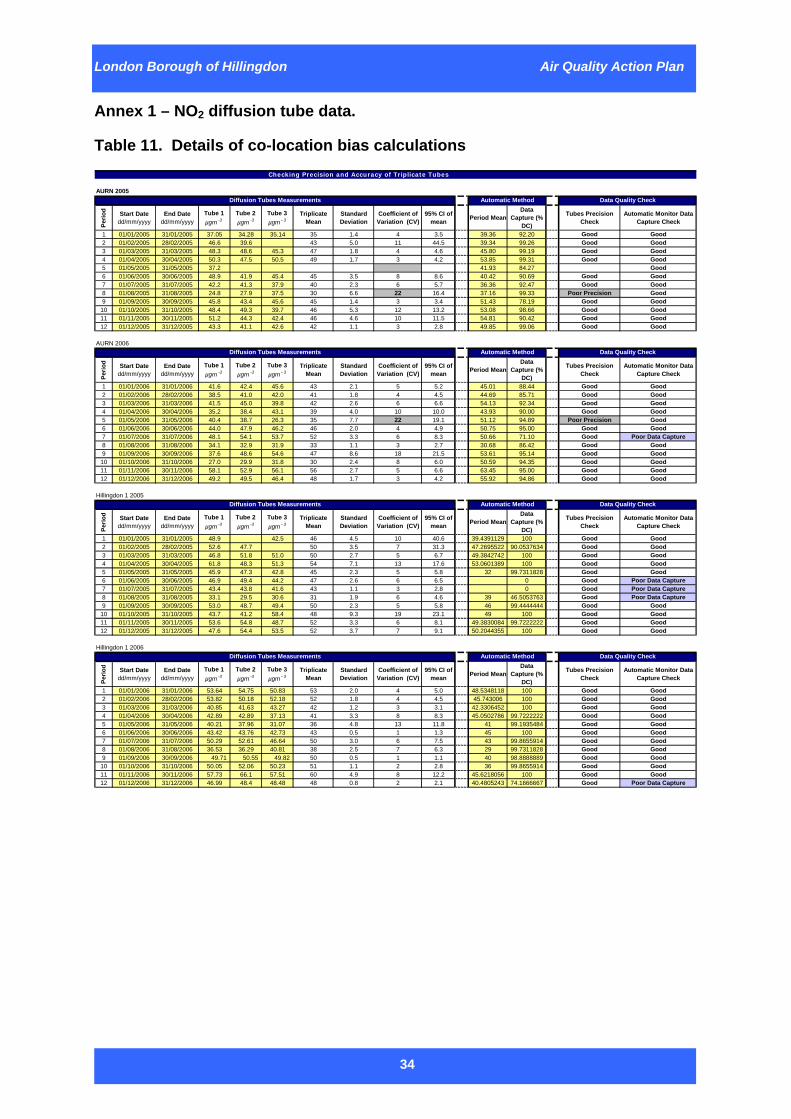
Annex 1 – NO2 diffusion tube data.
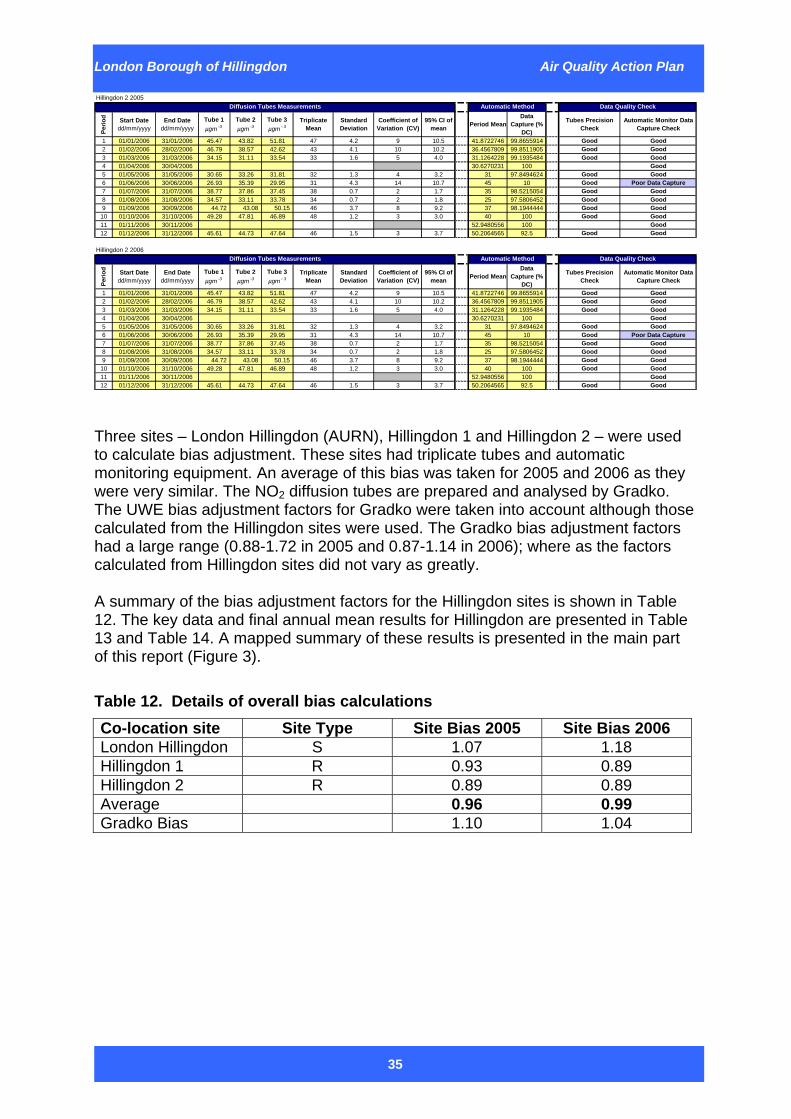
Table 11. Details of co-location bias calculations
AURN 2005
Perio
d Start Date dd/mm/yyyy
End Date dd/mm/yyyy
Tube 1 µgm -3
Tube 2 µgm -3
Tube 3 µgm - 3
Triplicate Mean
Standard Deviation
Coefficient of Variation (CV)
95% CI of mean Period Mean
Data Capture (%
DC)
Tubes Precision Check
Automatic Monitor Data Capture Check
1 01/01/2005 31/01/2005 37.05 34.28 35.14 35 1.4 4 3.5 39.36 92.20 Good Good2 01/02/2005 28/02/2005 46.6 39.6 43 5.0 11 44.5 39.34 99.26 Good Good3 01/03/2005 31/03/2005 48.3 48.6 45.3 47 1.8 4 4.6 45.80 99.19 Good Good4 01/04/2005 30/04/2005 50.3 47.5 50.5 49 1.7 3 4.2 53.85 99.31 Good Good5 01/05/2005 31/05/2005 37.2 41.93 84.27 Good6 01/06/2005 30/06/2005 48.9 41.9 45.4 45 3.5 8 8.6 40.42 90.69 Good Good7 01/07/2005 31/07/2005 42.2 41.3 37.9 40 2.3 6 5.7 36.36 92.47 Good Good8 01/08/2005 31/08/2005 24.8 27.9 37.5 30 6.6 22 16.4 37.16 99.33 Poor Precision Good9 01/09/2005 30/09/2005 45.8 43.4 45.6 45 1.4 3 3.4 51.43 78.19 Good Good
10 01/10/2005 31/10/2005 48.4 49.3 39.7 46 5.3 12 13.2 53.08 98.66 Good Good11 01/11/2005 30/11/2005 51.2 44.3 42.4 46 4.6 10 11.5 54.81 90.42 Good Good12 01/12/2005 31/12/2005 43.3 41.1 42.6 42 1.1 3 2.8 49.85 99.06 Good Good
AURN 2006
Perio
d Start Date dd/mm/yyyy
End Date dd/mm/yyyy
Tube 1 µgm -3
Tube 2 µgm -3
Tube 3 µgm - 3
Triplicate Mean
Standard Deviation
Coefficient of Variation (CV)
95% CI of mean Period Mean
Data Capture (%
DC)
Tubes Precision Check
Automatic Monitor Data Capture Check
1 01/01/2006 31/01/2006 41.6 42.4 45.6 43 2.1 5 5.2 45.01 88.44 Good Good2 01/02/2006 28/02/2006 38.5 41.0 42.0 41 1.8 4 4.5 44.69 85.71 Good Good3 01/03/2006 31/03/2006 41.5 45.0 39.8 42 2.6 6 6.6 54.13 92.34 Good Good4 01/04/2006 30/04/2006 35.2 38.4 43.1 39 4.0 10 10.0 43.93 90.00 Good Good5 01/05/2006 31/05/2006 40.4 38.7 26.3 35 7.7 22 19.1 51.12 94.89 Poor Precision Good6 01/06/2006 30/06/2006 44.0 47.9 46.2 46 2.0 4 4.9 50.75 95.00 Good Good7 01/07/2006 31/07/2006 48.1 54.1 53.7 52 3.3 6 8.3 50.66 71.10 Good Poor Data Capture8 01/08/2006 31/08/2006 34.1 32.9 31.9 33 1.1 3 2.7 30.68 86.42 Good Good9 01/09/2006 30/09/2006 37.6 48.6 54.6 47 8.6 18 21.5 53.61 95.14 Good Good
10 01/10/2006 31/10/2006 27.0 29.9 31.8 30 2.4 8 6.0 50.59 94.35 Good Good11 01/11/2006 30/11/2006 58.1 52.9 56.1 56 2.7 5 6.6 63.45 95.00 Good Good12 01/12/2006 31/12/2006 49.2 49.5 46.4 48 1.7 3 4.2 55.92 94.86 Good Good
Hillingdon 1 2005
Perio
d Start Date dd/mm/yyyy
End Date dd/mm/yyyy
Tube 1 µgm -3
Tube 2 µgm -3
Tube 3 µgm - 3
Triplicate Mean
Standard Deviation
Coefficient of Variation (CV)
95% CI of mean Period Mean
Data Capture (%
DC)
Tubes Precision Check
Automatic Monitor Data Capture Check
1 01/01/2005 31/01/2005 48.9 42.5 46 4.5 10 40.6 39.4391129 100 Good Good2 01/02/2005 28/02/2005 52.6 47.7 50 3.5 7 31.3 47.2695522 90.0537634 Good Good3 01/03/2005 31/03/2005 46.8 51.8 51.0 50 2.7 5 6.7 49.3842742 100 Good Good4 01/04/2005 30/04/2005 61.8 48.3 51.3 54 7.1 13 17.6 53.0601389 100 Good Good5 01/05/2005 31/05/2005 45.9 47.3 42.8 45 2.3 5 5.8 32 99.7311828 Good Good6 01/06/2005 30/06/2005 46.9 49.4 44.2 47 2.6 6 6.5 0 Good Poor Data Capture7 01/07/2005 31/07/2005 43.4 43.8 41.6 43 1.1 3 2.8 0 Good Poor Data Capture8 01/08/2005 31/08/2005 33.1 29.5 30.6 31 1.9 6 4.6 39 46.5053763 Good Poor Data Capture9 01/09/2005 30/09/2005 53.0 48.7 49.4 50 2.3 5 5.8 46 99.4444444 Good Good
10 01/10/2005 31/10/2005 43.7 41.2 58.4 48 9.3 19 23.1 49 100 Good Good11 01/11/2005 30/11/2005 53.6 54.8 48.7 52 3.3 6 8.1 49.3830084 99.7222222 Good Good12 01/12/2005 31/12/2005 47.6 54.4 53.5 52 3.7 7 9.1 50.2044355 100 Good Good
Hillingdon 1 2006
Perio
d Start Date dd/mm/yyyy
End Date dd/mm/yyyy
Tube 1 µgm -3
Tube 2 µgm -3
Tube 3 µgm - 3
Triplicate Mean
Standard Deviation
Coefficient of Variation (CV)
95% CI of mean Period Mean
Data Capture (%
DC)
Tubes Precision Check
Automatic Monitor Data Capture Check
1 01/01/2006 31/01/2006 53.64 54.75 50.83 53 2.0 4 5.0 48.5348118 100 Good Good2 01/02/2006 28/02/2006 53.82 50.18 52.18 52 1.8 4 4.5 45.743006 100 Good Good3 01/03/2006 31/03/2006 40.85 41.63 43.27 42 1.2 3 3.1 42.3306452 100 Good Good4 01/04/2006 30/04/2006 42.89 42.89 37.13 41 3.3 8 8.3 45.0502786 99.7222222 Good Good5 01/05/2006 31/05/2006 40.21 37.96 31.07 36 4.8 13 11.8 41 99.1935484 Good Good6 01/06/2006 30/06/2006 43.42 43.76 42.73 43 0.5 1 1.3 45 100 Good Good7 01/07/2006 31/07/2006 50.29 52.61 46.64 50 3.0 6 7.5 43 99.8655914 Good Good8 01/08/2006 31/08/2006 36.53 36.29 40.81 38 2.5 7 6.3 29 99.7311828 Good Good9 01/09/2006 30/09/2006 49.71 50.55 49.82 50 0.5 1 1.1 40 98.8888889 Good Good
10 01/10/2006 31/10/2006 50.05 52.06 50.23 51 1.1 2 2.8 36 99.8655914 Good Good11 01/11/2006 30/11/2006 57.73 66.1 57.51 60 4.9 8 12.2 45.6218056 100 Good Good12 01/12/2006 31/12/2006 46.99 48.4 48.48 48 0.8 2 2.1 40.4805243 74.1666667 Good Poor Data Capture
Checking Precision and Accuracy of Triplicate Tubes
Diffusion Tubes Measurements Automatic Method Data Quality Check
Diffusion Tubes Measurements Automatic Method Data Quality Check
Diffusion Tubes Measurements Automatic Method Data Quality Check
Diffusion Tubes Measurements Automatic Method Data Quality Check
London Borough of Hillingdon Air Quality Action Plan
35
Hillingdon 2 2005Pe
riod Start Date
dd/mm/yyyyEnd Date
dd/mm/yyyyTube 1 µgm -3
Tube 2 µgm -3
Tube 3 µgm - 3
Triplicate Mean
Standard Deviation
Coefficient of Variation (CV)
95% CI of mean Period Mean
Data Capture (%
DC)
Tubes Precision Check
Automatic Monitor Data Capture Check
1 01/01/2006 31/01/2006 45.47 43.82 51.81 47 4.2 9 10.5 41.8722746 99.8655914 Good Good2 01/02/2006 28/02/2006 46.79 38.57 42.62 43 4.1 10 10.2 36.4567809 99.8511905 Good Good3 01/03/2006 31/03/2006 34.15 31.11 33.54 33 1.6 5 4.0 31.1264228 99.1935484 Good Good4 01/04/2006 30/04/2006 30.6270231 100 Good5 01/05/2006 31/05/2006 30.65 33.26 31.81 32 1.3 4 3.2 31 97.8494624 Good Good6 01/06/2006 30/06/2006 26.93 35.39 29.95 31 4.3 14 10.7 45 10 Good Poor Data Capture7 01/07/2006 31/07/2006 38.77 37.86 37.45 38 0.7 2 1.7 35 98.5215054 Good Good8 01/08/2006 31/08/2006 34.57 33.11 33.78 34 0.7 2 1.8 25 97.5806452 Good Good9 01/09/2006 30/09/2006 44.72 43.08 50.15 46 3.7 8 9.2 37 98.1944444 Good Good
10 01/10/2006 31/10/2006 49.28 47.81 46.89 48 1.2 3 3.0 40 100 Good Good11 01/11/2006 30/11/2006 52.9480556 100 Good12 01/12/2006 31/12/2006 45.61 44.73 47.64 46 1.5 3 3.7 50.2064565 92.5 Good Good
Hillingdon 2 2006
Perio
d Start Date dd/mm/yyyy
End Date dd/mm/yyyy
Tube 1 µgm -3
Tube 2 µgm -3
Tube 3 µgm - 3
Triplicate Mean
Standard Deviation
Coefficient of Variation (CV)
95% CI of mean Period Mean
Data Capture (%
DC)
Tubes Precision Check
Automatic Monitor Data Capture Check
1 01/01/2006 31/01/2006 45.47 43.82 51.81 47 4.2 9 10.5 41.8722746 99.8655914 Good Good2 01/02/2006 28/02/2006 46.79 38.57 42.62 43 4.1 10 10.2 36.4567809 99.8511905 Good Good3 01/03/2006 31/03/2006 34.15 31.11 33.54 33 1.6 5 4.0 31.1264228 99.1935484 Good Good4 01/04/2006 30/04/2006 30.6270231 100 Good5 01/05/2006 31/05/2006 30.65 33.26 31.81 32 1.3 4 3.2 31 97.8494624 Good Good6 01/06/2006 30/06/2006 26.93 35.39 29.95 31 4.3 14 10.7 45 10 Good Poor Data Capture7 01/07/2006 31/07/2006 38.77 37.86 37.45 38 0.7 2 1.7 35 98.5215054 Good Good8 01/08/2006 31/08/2006 34.57 33.11 33.78 34 0.7 2 1.8 25 97.5806452 Good Good9 01/09/2006 30/09/2006 44.72 43.08 50.15 46 3.7 8 9.2 37 98.1944444 Good Good
10 01/10/2006 31/10/2006 49.28 47.81 46.89 48 1.2 3 3.0 40 100 Good Good11 01/11/2006 30/11/2006 52.9480556 100 Good12 01/12/2006 31/12/2006 45.61 44.73 47.64 46 1.5 3 3.7 50.2064565 92.5 Good Good
Diffusion Tubes Measurements Automatic Method Data Quality Check
Diffusion Tubes Measurements Automatic Method Data Quality Check
Three sites – London Hillingdon (AURN), Hillingdon 1 and Hillingdon 2 – were used to calculate bias adjustment. These sites had triplicate tubes and automatic monitoring equipment. An average of this bias was taken for 2005 and 2006 as they were very similar. The NO2 diffusion tubes are prepared and analysed by Gradko. The UWE bias adjustment factors for Gradko were taken into account although those calculated from the Hillingdon sites were used. The Gradko bias adjustment factors had a large range (0.88-1.72 in 2005 and 0.87-1.14 in 2006); where as the factors calculated from Hillingdon sites did not vary as greatly. A summary of the bias adjustment factors for the Hillingdon sites is shown in Table 12. The key data and final annual mean results for Hillingdon are presented in Table 13 and Table 14. A mapped summary of these results is presented in the main part of this report (Figure 3). Table 12. Details of overall bias calculations Co-location site Site Type Site Bias 2005 Site Bias 2006 London Hillingdon S 1.07 1.18 Hillingdon 1 R 0.93 0.89 Hillingdon 2 R 0.89 0.89 Average 0.96 0.99 Gradko Bias 1.10 1.04
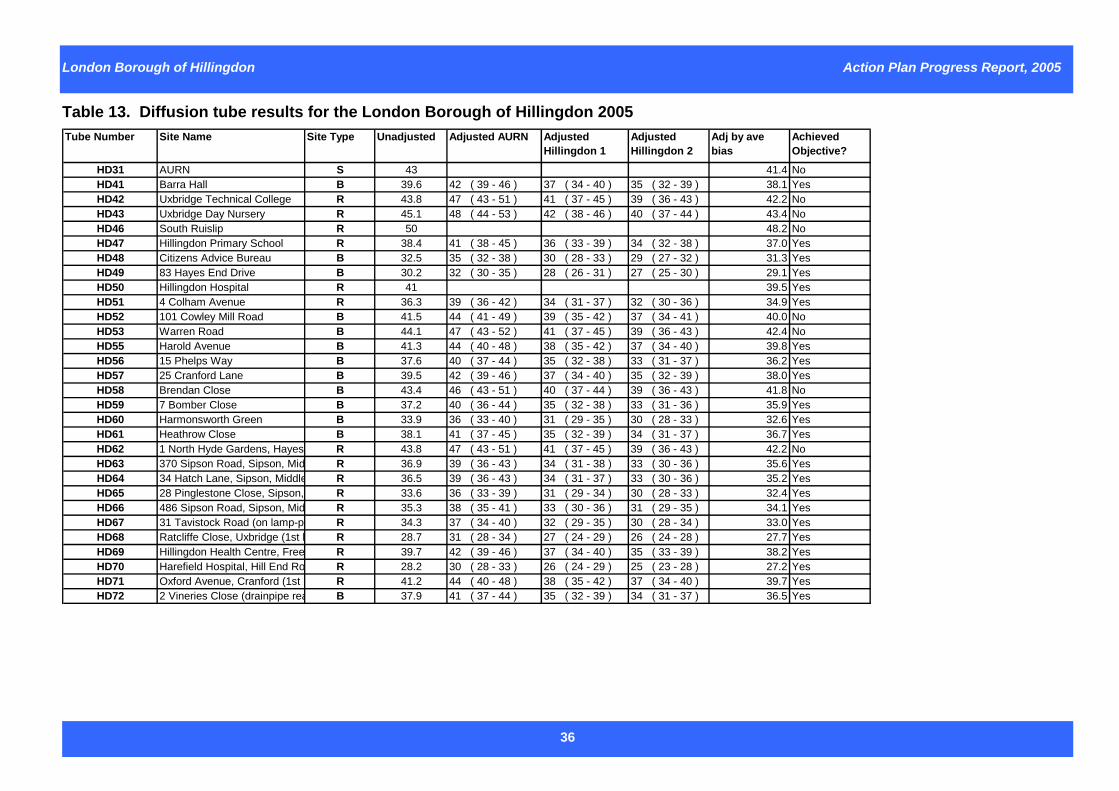
London Borough of Hillingdon Action Plan Progress Report, 2005
36
Table 13. Diffusion tube results for the London Borough of Hillingdon 2005 Tube Number Site Name Site Type Unadjusted Adjusted AURN Adjusted
Hillingdon 1Adjusted Hillingdon 2
Adj by ave bias
Achieved Objective?
HD31 AURN S 43 41.4 NoHD41 Barra Hall B 39.6 42 ( 39 - 46 ) 37 ( 34 - 40 ) 35 ( 32 - 39 ) 38.1 YesHD42 Uxbridge Technical College R 43.8 47 ( 43 - 51 ) 41 ( 37 - 45 ) 39 ( 36 - 43 ) 42.2 NoHD43 Uxbridge Day Nursery R 45.1 48 ( 44 - 53 ) 42 ( 38 - 46 ) 40 ( 37 - 44 ) 43.4 NoHD46 South Ruislip R 50 48.2 NoHD47 Hillingdon Primary School R 38.4 41 ( 38 - 45 ) 36 ( 33 - 39 ) 34 ( 32 - 38 ) 37.0 YesHD48 Citizens Advice Bureau B 32.5 35 ( 32 - 38 ) 30 ( 28 - 33 ) 29 ( 27 - 32 ) 31.3 YesHD49 83 Hayes End Drive B 30.2 32 ( 30 - 35 ) 28 ( 26 - 31 ) 27 ( 25 - 30 ) 29.1 YesHD50 Hillingdon Hospital R 41 39.5 YesHD51 4 Colham Avenue R 36.3 39 ( 36 - 42 ) 34 ( 31 - 37 ) 32 ( 30 - 36 ) 34.9 YesHD52 101 Cowley Mill Road B 41.5 44 ( 41 - 49 ) 39 ( 35 - 42 ) 37 ( 34 - 41 ) 40.0 NoHD53 Warren Road B 44.1 47 ( 43 - 52 ) 41 ( 37 - 45 ) 39 ( 36 - 43 ) 42.4 NoHD55 Harold Avenue B 41.3 44 ( 40 - 48 ) 38 ( 35 - 42 ) 37 ( 34 - 40 ) 39.8 YesHD56 15 Phelps Way B 37.6 40 ( 37 - 44 ) 35 ( 32 - 38 ) 33 ( 31 - 37 ) 36.2 YesHD57 25 Cranford Lane B 39.5 42 ( 39 - 46 ) 37 ( 34 - 40 ) 35 ( 32 - 39 ) 38.0 YesHD58 Brendan Close B 43.4 46 ( 43 - 51 ) 40 ( 37 - 44 ) 39 ( 36 - 43 ) 41.8 NoHD59 7 Bomber Close B 37.2 40 ( 36 - 44 ) 35 ( 32 - 38 ) 33 ( 31 - 36 ) 35.9 YesHD60 Harmonsworth Green B 33.9 36 ( 33 - 40 ) 31 ( 29 - 35 ) 30 ( 28 - 33 ) 32.6 YesHD61 Heathrow Close B 38.1 41 ( 37 - 45 ) 35 ( 32 - 39 ) 34 ( 31 - 37 ) 36.7 YesHD62 1 North Hyde Gardens, Hayes R 43.8 47 ( 43 - 51 ) 41 ( 37 - 45 ) 39 ( 36 - 43 ) 42.2 NoHD63 370 Sipson Road, Sipson, Mid R 36.9 39 ( 36 - 43 ) 34 ( 31 - 38 ) 33 ( 30 - 36 ) 35.6 YesHD64 34 Hatch Lane, Sipson, Middle R 36.5 39 ( 36 - 43 ) 34 ( 31 - 37 ) 33 ( 30 - 36 ) 35.2 YesHD65 28 Pinglestone Close, Sipson, R 33.6 36 ( 33 - 39 ) 31 ( 29 - 34 ) 30 ( 28 - 33 ) 32.4 YesHD66 486 Sipson Road, Sipson, Mid R 35.3 38 ( 35 - 41 ) 33 ( 30 - 36 ) 31 ( 29 - 35 ) 34.1 YesHD67 31 Tavistock Road (on lamp-p R 34.3 37 ( 34 - 40 ) 32 ( 29 - 35 ) 30 ( 28 - 34 ) 33.0 YesHD68 Ratcliffe Close, Uxbridge (1st l R 28.7 31 ( 28 - 34 ) 27 ( 24 - 29 ) 26 ( 24 - 28 ) 27.7 YesHD69 Hillingdon Health Centre, Free R 39.7 42 ( 39 - 46 ) 37 ( 34 - 40 ) 35 ( 33 - 39 ) 38.2 YesHD70 Harefield Hospital, Hill End Ro R 28.2 30 ( 28 - 33 ) 26 ( 24 - 29 ) 25 ( 23 - 28 ) 27.2 YesHD71 Oxford Avenue, Cranford (1st R 41.2 44 ( 40 - 48 ) 38 ( 35 - 42 ) 37 ( 34 - 40 ) 39.7 YesHD72 2 Vineries Close (drainpipe rea B 37.9 41 ( 37 - 44 ) 35 ( 32 - 39 ) 34 ( 31 - 37 ) 36.5 Yes

London Borough of Hillingdon Air Quality Action Plan
37
Table 14. Diffusion tube results for the London Borough of Hillingdon 2006. Tube Number
Site Name Site Type Unadjusted Adjusted AURN Adjusted Hillingdon 1
Adjusted Hillingdon 2
Adj by ave bias
Achieved Objective?
HD31 AURN S 42 41.4 NoHD41 Barra Hall B 32.0 38 ( 34 - 42 ) 29 ( 26 - 32 ) 29 ( 26 - 31 ) 31.6 YesHD42 Uxbridge Technical College R 38.6 45 ( 41 - 51 ) 34 ( 31 - 39 ) 34 ( 32 - 38 ) 38.0 YesHD43 Uxbridge Day Nursery R 43.0 51 ( 46 - 57 ) 38 ( 35 - 43 ) 38 ( 35 - 42 ) 42.5 NoHD46 South Ruislip R 47 46.4 NoHD47 Hillingdon Primary School R 32.2 38 ( 34 - 42 ) 29 ( 26 - 32 ) 29 ( 26 - 32 ) 31.8 YesHD48 Citizens Advice Bureau B 30.9 36 ( 33 - 41 ) 28 ( 25 - 31 ) 28 ( 25 - 30 ) 30.5 YesHD49 83 Hayes End Drive B 26.3 31 ( 28 - 35 ) 23 ( 21 - 26 ) 23 ( 22 - 26 ) 26.0 YesHD50 Hillingdon Hospital R 41 40.5 NoHD51 4 Colham Avenue R 36.9 44 ( 39 - 49 ) 33 ( 30 - 37 ) 33 ( 30 - 36 ) 36.4 YesHD52 101 Cowley Mill Road B 39.2 46 ( 42 - 52 ) 35 ( 32 - 39 ) 35 ( 32 - 38 ) 38.7 YesHD53 Warren Road B 41.8 49 ( 45 - 55 ) 37 ( 34 - 42 ) 37 ( 34 - 41 ) 41.2 NoHD55 Harold Avenue B 39.5 47 ( 42 - 52 ) 35 ( 32 - 40 ) 35 ( 32 - 39 ) 39.0 YesHD56 15 Phelps Way B 37.9 45 ( 41 - 50 ) 34 ( 31 - 38 ) 34 ( 31 - 37 ) 37.4 YesHD57 25 Cranford Lane B 36.8 43 ( 39 - 49 ) 33 ( 30 - 37 ) 33 ( 30 - 36 ) 36.3 YesHD58 Brendan Close B 40.6 48 ( 43 - 54 ) 36 ( 33 - 41 ) 36 ( 33 - 40 ) 40.1 NoHD59 7 Bomber Close B 36.8 43 ( 39 - 49 ) 33 ( 30 - 37 ) 33 ( 30 - 36 ) 36.3 YesHD60 Harmonsworth Green B 33.2 39 ( 36 - 44 ) 30 ( 27 - 33 ) 30 ( 27 - 33 ) 32.8 YesHD61 Heathrow Close B 34.7 41 ( 37 - 46 ) 31 ( 28 - 35 ) 31 ( 28 - 34 ) 34.3 YesHD62 1 North Hyde Gardens, Hayes R 41.2 49 ( 44 - 54 ) 37 ( 33 - 41 ) 37 ( 34 - 40 ) 40.6 NoHD63 370 Sipson Road, Sipson, Mid R 34.2 40 ( 37 - 45 ) 30 ( 28 - 34 ) 30 ( 28 - 34 ) 33.7 YesHD64 34 Hatch Lane, Sipson, Middle R 33.0 39 ( 35 - 44 ) 29 ( 27 - 33 ) 29 ( 27 - 32 ) 32.5 YesHD65 28 Pinglestone Close, Sipson, R 31.5 37 ( 34 - 42 ) 28 ( 25 - 31 ) 28 ( 26 - 31 ) 31.1 YesHD66 486 Sipson Road, Sipson, Mid R 31.9 38 ( 34 - 42 ) 28 ( 26 - 32 ) 28 ( 26 - 31 ) 31.5 YesHD67 31 Tavistock Road (on lamp-p R 34.4 41 ( 37 - 45 ) 31 ( 28 - 34 ) 31 ( 28 - 34 ) 33.9 YesHD68 Ratcliffe Close, Uxbridge (1st l R 28.1 33 ( 30 - 37 ) 25 ( 23 - 28 ) 25 ( 23 - 27 ) 27.7 YesHD69 Hillingdon Health Centre, Free R 31.6 37 ( 34 - 42 ) 28 ( 26 - 32 ) 28 ( 26 - 31 ) 31.2 YesHD70 Harefield Hospital, Hill End Ro R 24.7 29 ( 26 - 33 ) 22 ( 20 - 25 ) 22 ( 20 - 24 ) 24.4 YesHD71 Oxford Avenue, Cranford (1st R 40.1 47 ( 43 - 53 ) 36 ( 32 - 40 ) 36 ( 33 - 39 ) 39.5 YesHD72 2 Vineries Close (drainpipe rea B 31.4 37 ( 34 - 41 ) 28 ( 25 - 31 ) 28 ( 26 - 31 ) 30.9 Yes
London Borough of Hillingdon Air Quality Action Plan
38
Appendix 3: Progress with the Action Plan The following tables were produced using EMRC’s Action Plan Tracker database, showing progress against each measure. Overall progress with the plan was reviewed above in Chapter 4. Package 1: Switching to cleaner transport options, for example,
shifting freight from road to rail and promoting cycling and walking ............................................................ 39
Package 2: Tackling through traffic ....................................................... 43 Package 3: Promotion of cleaner vehicle technology............................ 46 Package 4: Measures specific to Heathrow Airport ............................... 50 Package 5: Measures concerning local industries and other
businesses ......................................................................... 56 Package 6: Improving the eco-efficiency of current and future
developments, including those owned or operated by the Council ......................................................................... 58
Package 7: Actions to be taken corporately, regionally, and in liaison with the Mayor......................................................... 60
Package 8: Plan management .............................................................. 62
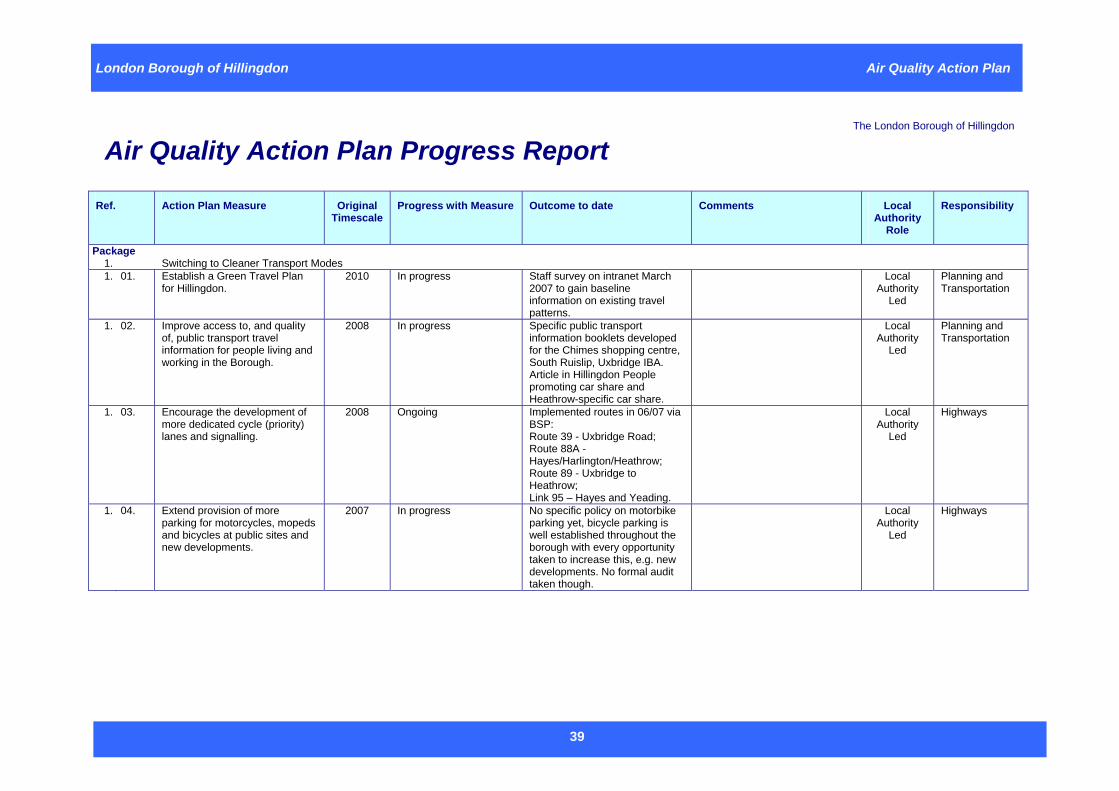
London Borough of Hillingdon Air Quality Action Plan
39
The London Borough of Hillingdon
Air Quality Action Plan Progress Report
Ref. Action Plan Measure Original Timescale
Progress with Measure Outcome to date Comments Local Authority
Role
Responsibility
Package 1. Switching to Cleaner Transport Modes 1. 01. Establish a Green Travel Plan
for Hillingdon. 2010 In progress Staff survey on intranet March
2007 to gain baseline information on existing travel patterns.
Local Authority
Led
Planning and Transportation
1. 02. Improve access to, and quality of, public transport travel information for people living and working in the Borough.
2008 In progress Specific public transport information booklets developed for the Chimes shopping centre, South Ruislip, Uxbridge IBA. Article in Hillingdon People promoting car share and Heathrow-specific car share.
Local Authority
Led
Planning and Transportation
1. 03. Encourage the development of more dedicated cycle (priority) lanes and signalling.
2008 Ongoing Implemented routes in 06/07 via BSP: Route 39 - Uxbridge Road; Route 88A - Hayes/Harlington/Heathrow; Route 89 - Uxbridge to Heathrow; Link 95 – Hayes and Yeading.
Local Authority
Led
Highways
1. 04. Extend provision of more parking for motorcycles, mopeds and bicycles at public sites and new developments.
2007 In progress No specific policy on motorbike parking yet, bicycle parking is well established throughout the borough with every opportunity taken to increase this, e.g. new developments. No formal audit taken though.
Local Authority
Led
Highways
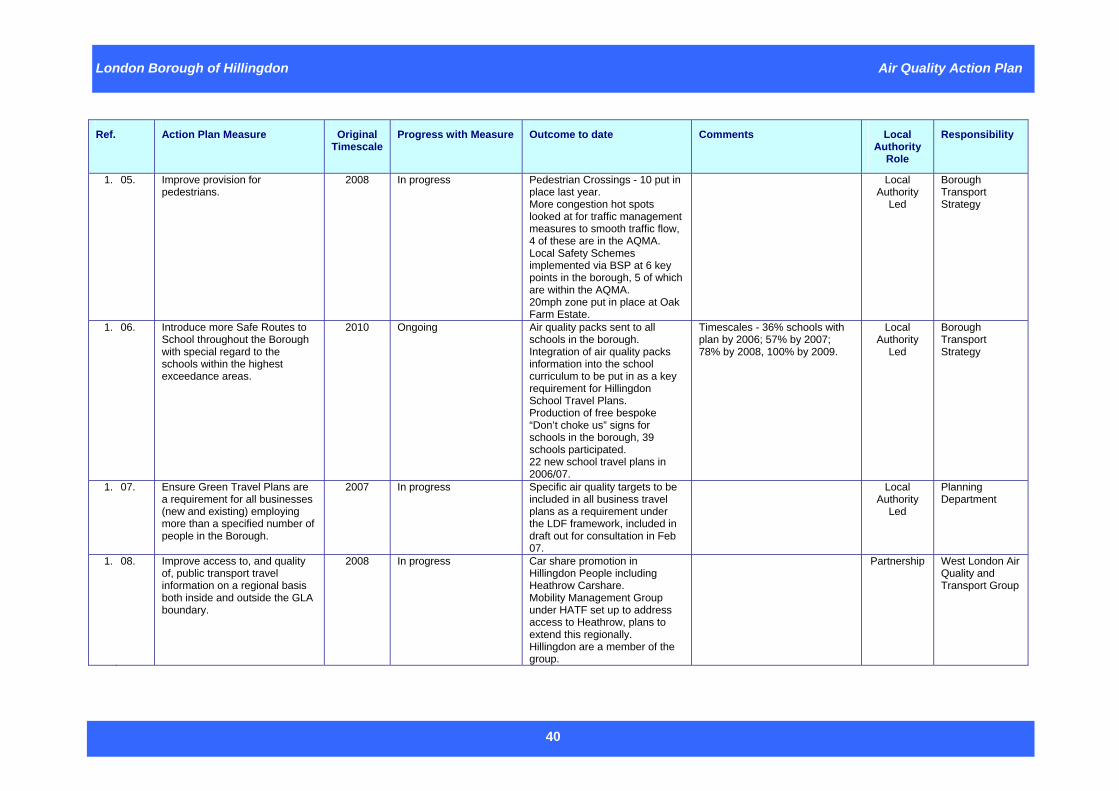
London Borough of Hillingdon Air Quality Action Plan
40
Ref. Action Plan Measure Original Timescale
Progress with Measure Outcome to date Comments Local Authority
Role
Responsibility
1. 05. Improve provision for pedestrians.
2008 In progress Pedestrian Crossings - 10 put in place last year. More congestion hot spots looked at for traffic management measures to smooth traffic flow, 4 of these are in the AQMA. Local Safety Schemes implemented via BSP at 6 key points in the borough, 5 of which are within the AQMA. 20mph zone put in place at Oak Farm Estate.
Local Authority
Led
Borough Transport Strategy
1. 06. Introduce more Safe Routes to School throughout the Borough with special regard to the schools within the highest exceedance areas.
2010 Ongoing Air quality packs sent to all schools in the borough. Integration of air quality packs information into the school curriculum to be put in as a key requirement for Hillingdon School Travel Plans. Production of free bespoke “Don’t choke us” signs for schools in the borough, 39 schools participated. 22 new school travel plans in 2006/07.
Timescales - 36% schools with plan by 2006; 57% by 2007; 78% by 2008, 100% by 2009.
Local Authority
Led
Borough Transport Strategy
1. 07. Ensure Green Travel Plans are a requirement for all businesses (new and existing) employing more than a specified number of people in the Borough.
2007 In progress Specific air quality targets to be included in all business travel plans as a requirement under the LDF framework, included in draft out for consultation in Feb 07.
Local Authority
Led
Planning Department
1. 08. Improve access to, and quality of, public transport travel information on a regional basis both inside and outside the GLA boundary.
2008 In progress Car share promotion in Hillingdon People including Heathrow Carshare. Mobility Management Group under HATF set up to address access to Heathrow, plans to extend this regionally. Hillingdon are a member of the group.
Partnership West London Air Quality and Transport Group
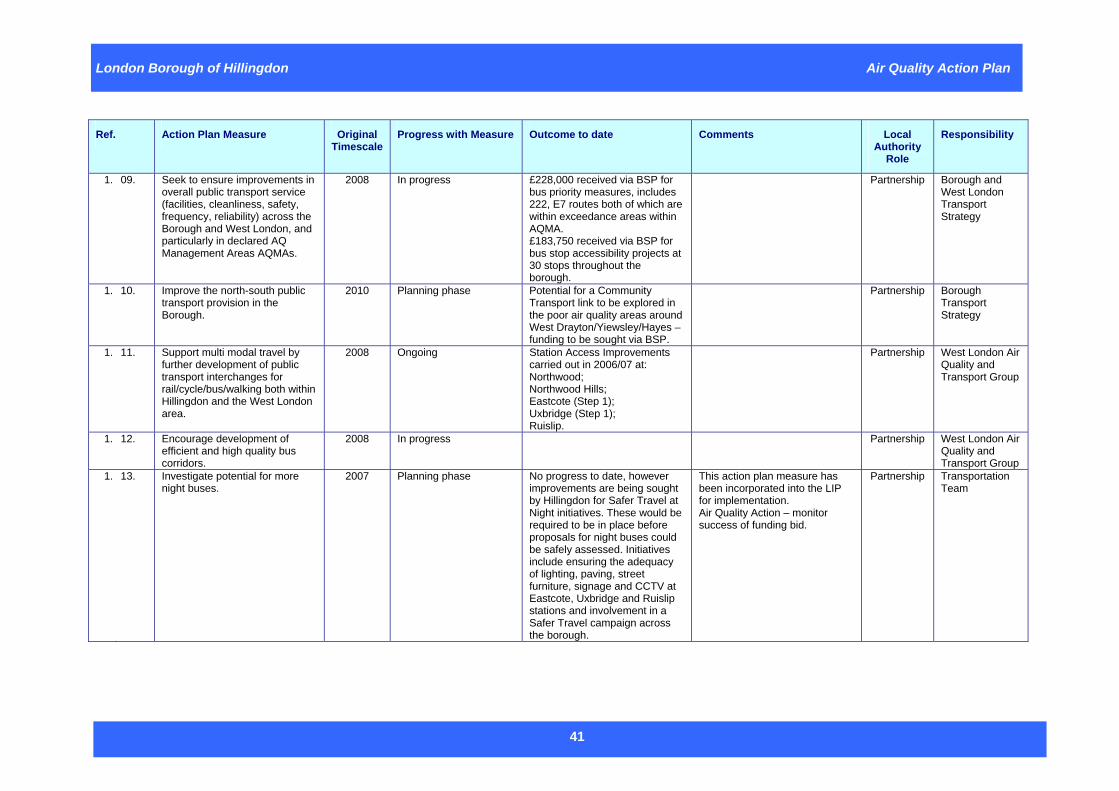
London Borough of Hillingdon Air Quality Action Plan
41
Ref. Action Plan Measure Original Timescale
Progress with Measure Outcome to date Comments Local Authority
Role
Responsibility
1. 09. Seek to ensure improvements in overall public transport service (facilities, cleanliness, safety, frequency, reliability) across the Borough and West London, and particularly in declared AQ Management Areas AQMAs.
2008 In progress £228,000 received via BSP for bus priority measures, includes 222, E7 routes both of which are within exceedance areas within AQMA. £183,750 received via BSP for bus stop accessibility projects at 30 stops throughout the borough.
Partnership Borough and West London Transport Strategy
1. 10. Improve the north-south public transport provision in the Borough.
2010 Planning phase Potential for a Community Transport link to be explored in the poor air quality areas around West Drayton/Yiewsley/Hayes – funding to be sought via BSP.
Partnership Borough Transport Strategy
1. 11. Support multi modal travel by further development of public transport interchanges for rail/cycle/bus/walking both within Hillingdon and the West London area.
2008 Ongoing Station Access Improvements carried out in 2006/07 at: Northwood; Northwood Hills; Eastcote (Step 1); Uxbridge (Step 1); Ruislip.
Partnership West London Air Quality and Transport Group
1. 12. Encourage development of efficient and high quality bus corridors.
2008 In progress Partnership West London Air Quality and Transport Group
1. 13. Investigate potential for more night buses.
2007 Planning phase No progress to date, however improvements are being sought by Hillingdon for Safer Travel at Night initiatives. These would be required to be in place before proposals for night buses could be safely assessed. Initiatives include ensuring the adequacy of lighting, paving, street furniture, signage and CCTV at Eastcote, Uxbridge and Ruislip stations and involvement in a Safer Travel campaign across the borough.
This action plan measure has been incorporated into the LIP for implementation. Air Quality Action – monitor success of funding bid.
Partnership Transportation Team
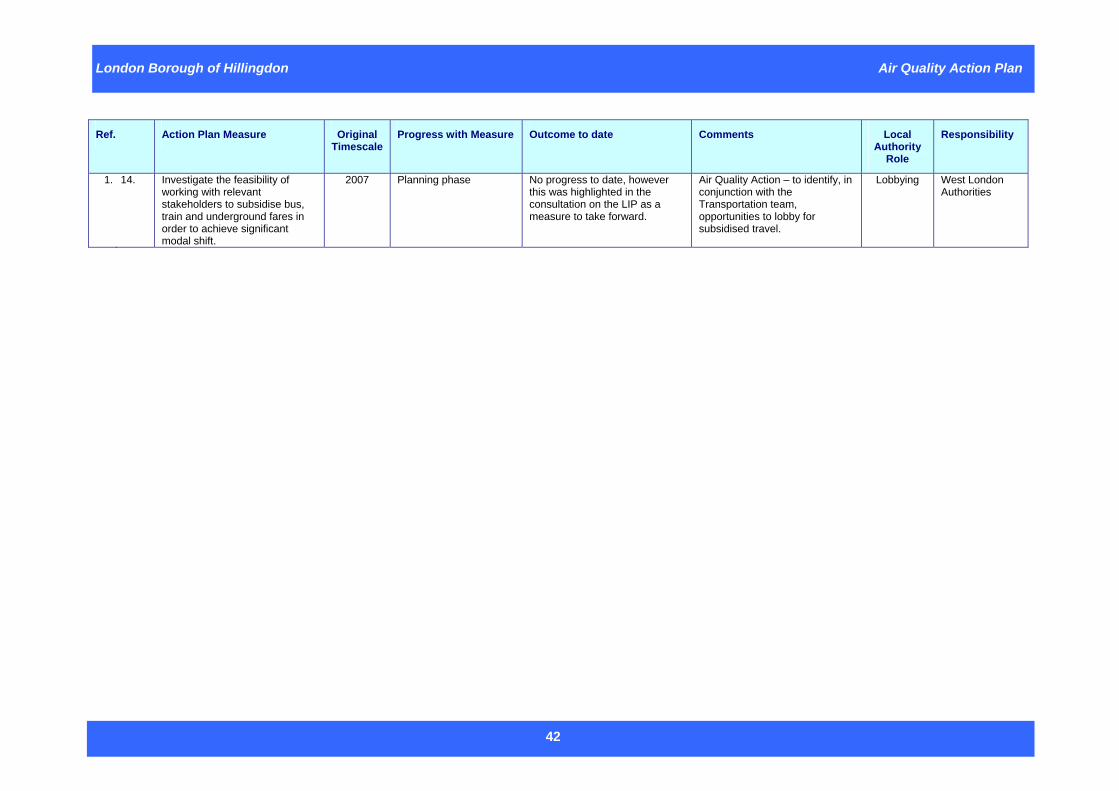
London Borough of Hillingdon Air Quality Action Plan
42
Ref. Action Plan Measure Original Timescale
Progress with Measure Outcome to date Comments Local Authority
Role
Responsibility
1. 14. Investigate the feasibility of working with relevant stakeholders to subsidise bus, train and underground fares in order to achieve significant modal shift.
2007 Planning phase No progress to date, however this was highlighted in the consultation on the LIP as a measure to take forward.
Air Quality Action – to identify, in conjunction with the Transportation team, opportunities to lobby for subsidised travel.
Lobbying West London Authorities
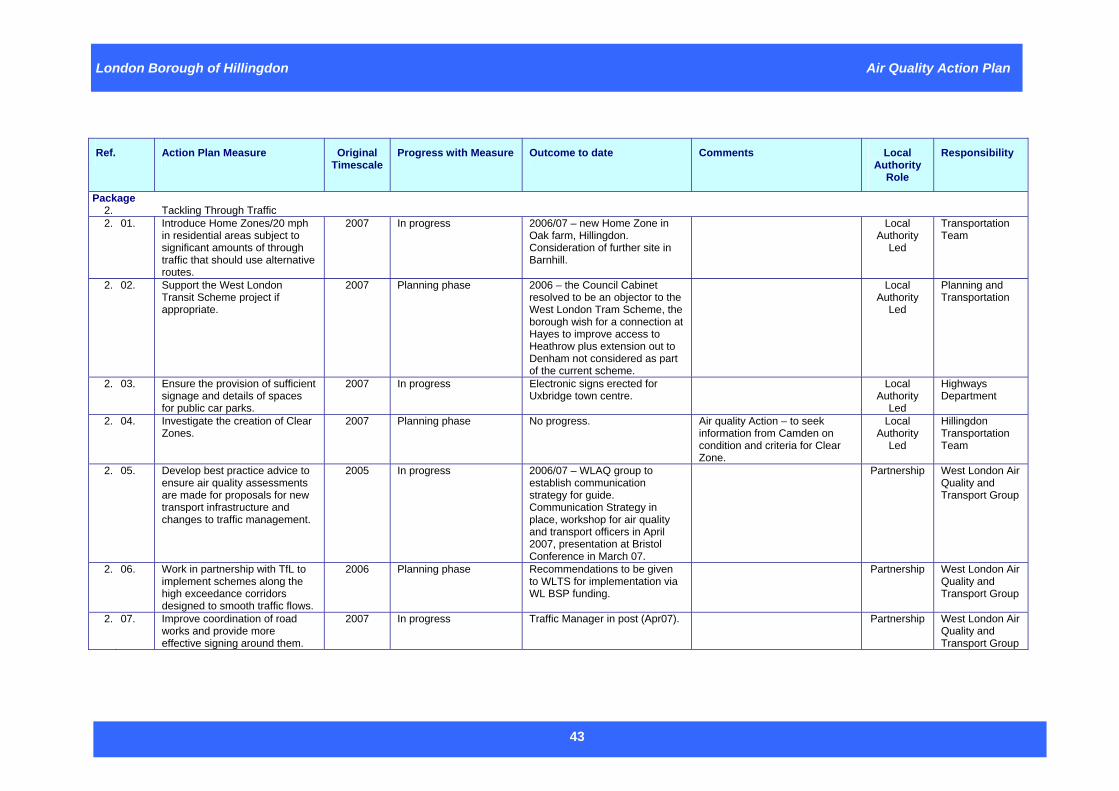
London Borough of Hillingdon Air Quality Action Plan
43
Ref. Action Plan Measure Original
Timescale Progress with Measure Outcome to date Comments Local
Authority Role
Responsibility
Package 2. Tackling Through Traffic 2. 01. Introduce Home Zones/20 mph
in residential areas subject to significant amounts of through traffic that should use alternative routes.
2007 In progress 2006/07 – new Home Zone in Oak farm, Hillingdon. Consideration of further site in Barnhill.
Local Authority
Led
Transportation Team
2. 02. Support the West London Transit Scheme project if appropriate.
2007 Planning phase 2006 – the Council Cabinet resolved to be an objector to the West London Tram Scheme, the borough wish for a connection at Hayes to improve access to Heathrow plus extension out to Denham not considered as part of the current scheme.
Local Authority
Led
Planning and Transportation
2. 03. Ensure the provision of sufficient signage and details of spaces for public car parks.
2007 In progress Electronic signs erected for Uxbridge town centre.
Local Authority
Led
Highways Department
2. 04. Investigate the creation of Clear Zones.
2007 Planning phase No progress. Air quality Action – to seek information from Camden on condition and criteria for Clear Zone.
Local Authority
Led
Hillingdon Transportation Team
2. 05. Develop best practice advice to ensure air quality assessments are made for proposals for new transport infrastructure and changes to traffic management.
2005 In progress 2006/07 – WLAQ group to establish communication strategy for guide. Communication Strategy in place, workshop for air quality and transport officers in April 2007, presentation at Bristol Conference in March 07.
Partnership West London Air Quality and Transport Group
2. 06. Work in partnership with TfL to implement schemes along the high exceedance corridors designed to smooth traffic flows.
2006 Planning phase Recommendations to be given to WLTS for implementation via WL BSP funding.
Partnership West London Air Quality and Transport Group
2. 07. Improve coordination of road works and provide more effective signing around them.
2007 In progress Traffic Manager in post (Apr07). Partnership West London Air Quality and Transport Group
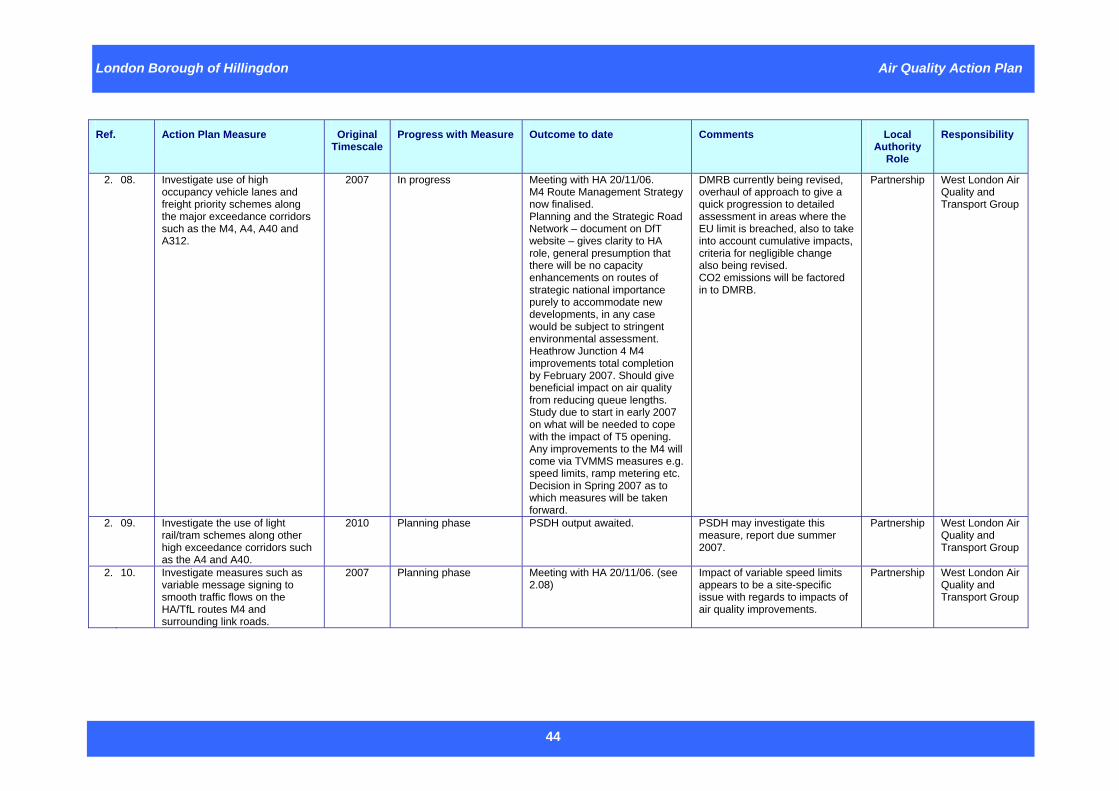
London Borough of Hillingdon Air Quality Action Plan
44
Ref. Action Plan Measure Original Timescale
Progress with Measure Outcome to date Comments Local Authority
Role
Responsibility
2. 08. Investigate use of high occupancy vehicle lanes and freight priority schemes along the major exceedance corridors such as the M4, A4, A40 and A312.
2007 In progress Meeting with HA 20/11/06. M4 Route Management Strategy now finalised. Planning and the Strategic Road Network – document on DfT website – gives clarity to HA role, general presumption that there will be no capacity enhancements on routes of strategic national importance purely to accommodate new developments, in any case would be subject to stringent environmental assessment. Heathrow Junction 4 M4 improvements total completion by February 2007. Should give beneficial impact on air quality from reducing queue lengths. Study due to start in early 2007 on what will be needed to cope with the impact of T5 opening. Any improvements to the M4 will come via TVMMS measures e.g. speed limits, ramp metering etc. Decision in Spring 2007 as to which measures will be taken forward.
DMRB currently being revised, overhaul of approach to give a quick progression to detailed assessment in areas where the EU limit is breached, also to take into account cumulative impacts, criteria for negligible change also being revised. CO2 emissions will be factored in to DMRB.
Partnership West London Air Quality and Transport Group
2. 09. Investigate the use of light rail/tram schemes along other high exceedance corridors such as the A4 and A40.
2010 Planning phase PSDH output awaited. PSDH may investigate this measure, report due summer 2007.
Partnership West London Air Quality and Transport Group
2. 10. Investigate measures such as variable message signing to smooth traffic flows on the HA/TfL routes M4 and surrounding link roads.
2007 Planning phase Meeting with HA 20/11/06. (see 2.08)
Impact of variable speed limits appears to be a site-specific issue with regards to impacts of air quality improvements.
Partnership West London Air Quality and Transport Group
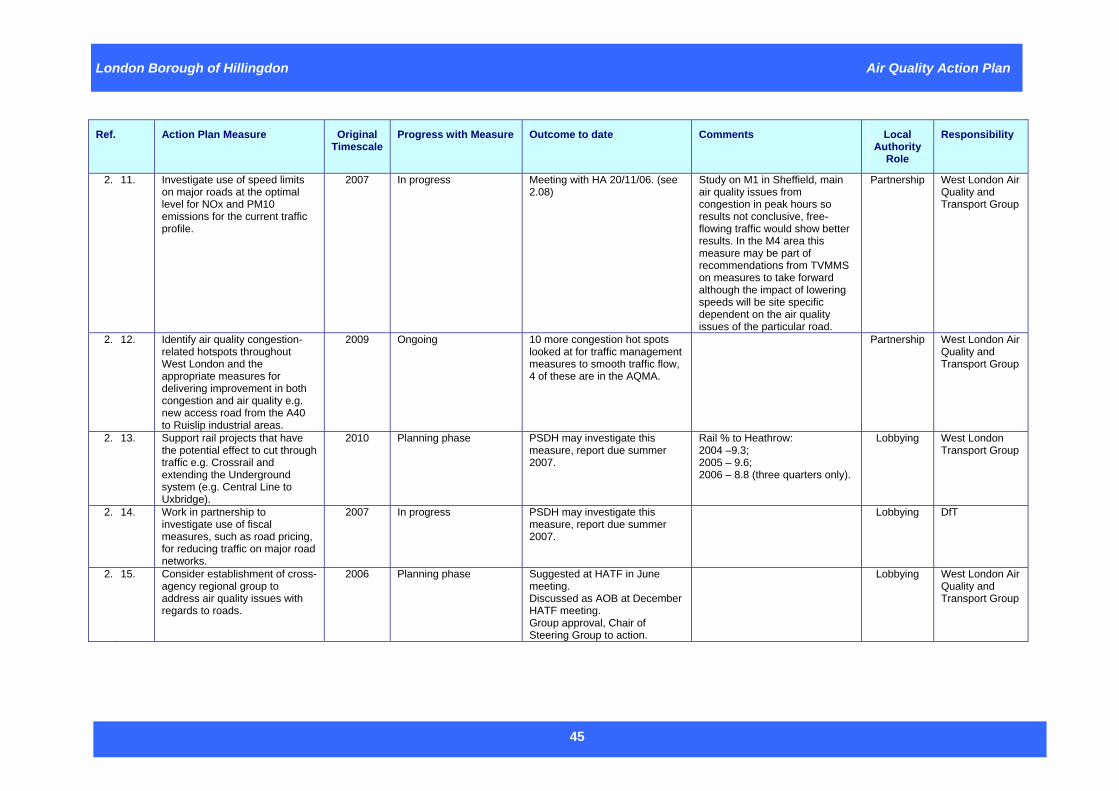
London Borough of Hillingdon Air Quality Action Plan
45
Ref. Action Plan Measure Original Timescale
Progress with Measure Outcome to date Comments Local Authority
Role
Responsibility
2. 11. Investigate use of speed limits on major roads at the optimal level for NOx and PM10 emissions for the current traffic profile.
2007 In progress Meeting with HA 20/11/06. (see 2.08)
Study on M1 in Sheffield, main air quality issues from congestion in peak hours so results not conclusive, free-flowing traffic would show better results. In the M4 area this measure may be part of recommendations from TVMMS on measures to take forward although the impact of lowering speeds will be site specific dependent on the air quality issues of the particular road.
Partnership West London Air Quality and Transport Group
2. 12. Identify air quality congestion-related hotspots throughout West London and the appropriate measures for delivering improvement in both congestion and air quality e.g. new access road from the A40 to Ruislip industrial areas.
2009 Ongoing 10 more congestion hot spots looked at for traffic management measures to smooth traffic flow, 4 of these are in the AQMA.
Partnership West London Air Quality and Transport Group
2. 13. Support rail projects that have the potential effect to cut through traffic e.g. Crossrail and extending the Underground system (e.g. Central Line to Uxbridge).
2010 Planning phase PSDH may investigate this measure, report due summer 2007.
Rail % to Heathrow: 2004 –9.3; 2005 – 9.6; 2006 – 8.8 (three quarters only).
Lobbying West London Transport Group
2. 14. Work in partnership to investigate use of fiscal measures, such as road pricing, for reducing traffic on major road networks.
2007 In progress PSDH may investigate this measure, report due summer 2007.
Lobbying DfT
2. 15. Consider establishment of cross-agency regional group to address air quality issues with regards to roads.
2006 Planning phase Suggested at HATF in June meeting. Discussed as AOB at December HATF meeting. Group approval, Chair of Steering Group to action.
Lobbying West London Air Quality and Transport Group
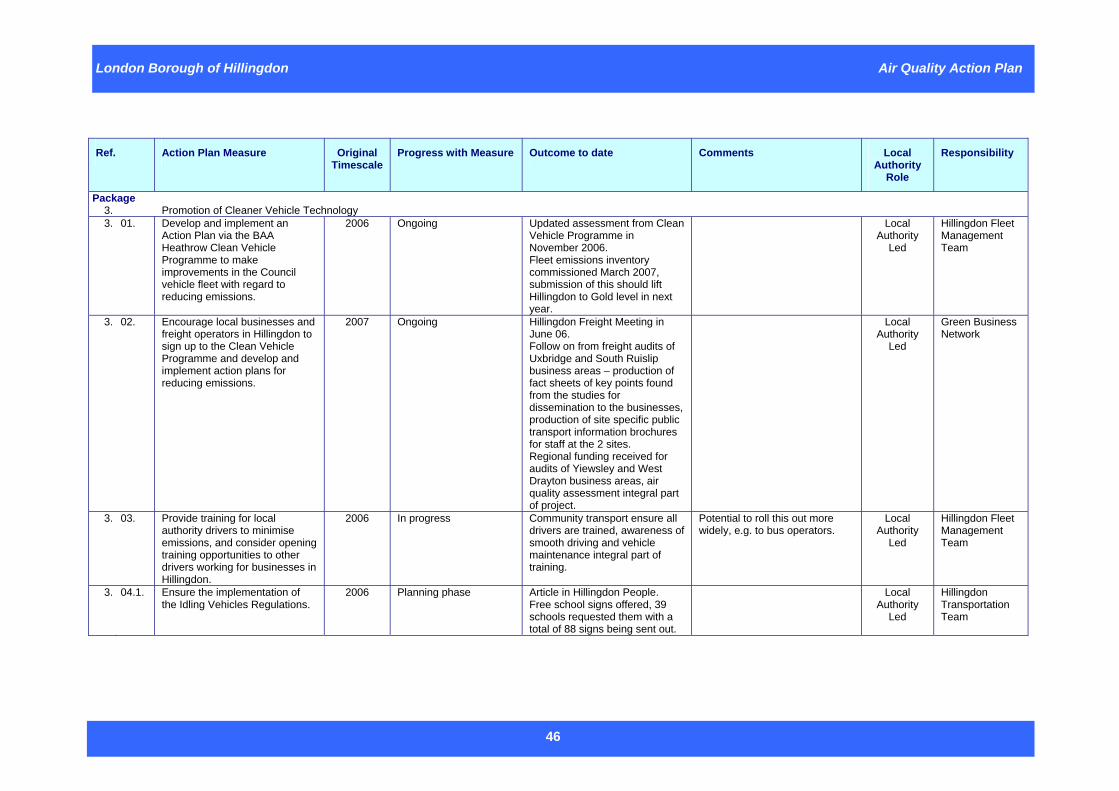
London Borough of Hillingdon Air Quality Action Plan
46
Ref. Action Plan Measure Original
Timescale Progress with Measure Outcome to date Comments Local
Authority Role
Responsibility
Package 3. Promotion of Cleaner Vehicle Technology 3. 01. Develop and implement an
Action Plan via the BAA Heathrow Clean Vehicle Programme to make improvements in the Council vehicle fleet with regard to reducing emissions.
2006 Ongoing Updated assessment from Clean Vehicle Programme in November 2006. Fleet emissions inventory commissioned March 2007, submission of this should lift Hillingdon to Gold level in next year.
Local Authority
Led
Hillingdon Fleet Management Team
3. 02. Encourage local businesses and freight operators in Hillingdon to sign up to the Clean Vehicle Programme and develop and implement action plans for reducing emissions.
2007 Ongoing Hillingdon Freight Meeting in June 06. Follow on from freight audits of Uxbridge and South Ruislip business areas – production of fact sheets of key points found from the studies for dissemination to the businesses, production of site specific public transport information brochures for staff at the 2 sites. Regional funding received for audits of Yiewsley and West Drayton business areas, air quality assessment integral part of project.
Local Authority
Led
Green Business Network
3. 03. Provide training for local authority drivers to minimise emissions, and consider opening training opportunities to other drivers working for businesses in Hillingdon.
2006 In progress Community transport ensure all drivers are trained, awareness of smooth driving and vehicle maintenance integral part of training.
Potential to roll this out more widely, e.g. to bus operators.
Local Authority
Led
Hillingdon Fleet Management Team
3. 04.1. Ensure the implementation of the Idling Vehicles Regulations.
2006 Planning phase Article in Hillingdon People. Free school signs offered, 39 schools requested them with a total of 88 signs being sent out.
Local Authority
Led
Hillingdon Transportation Team
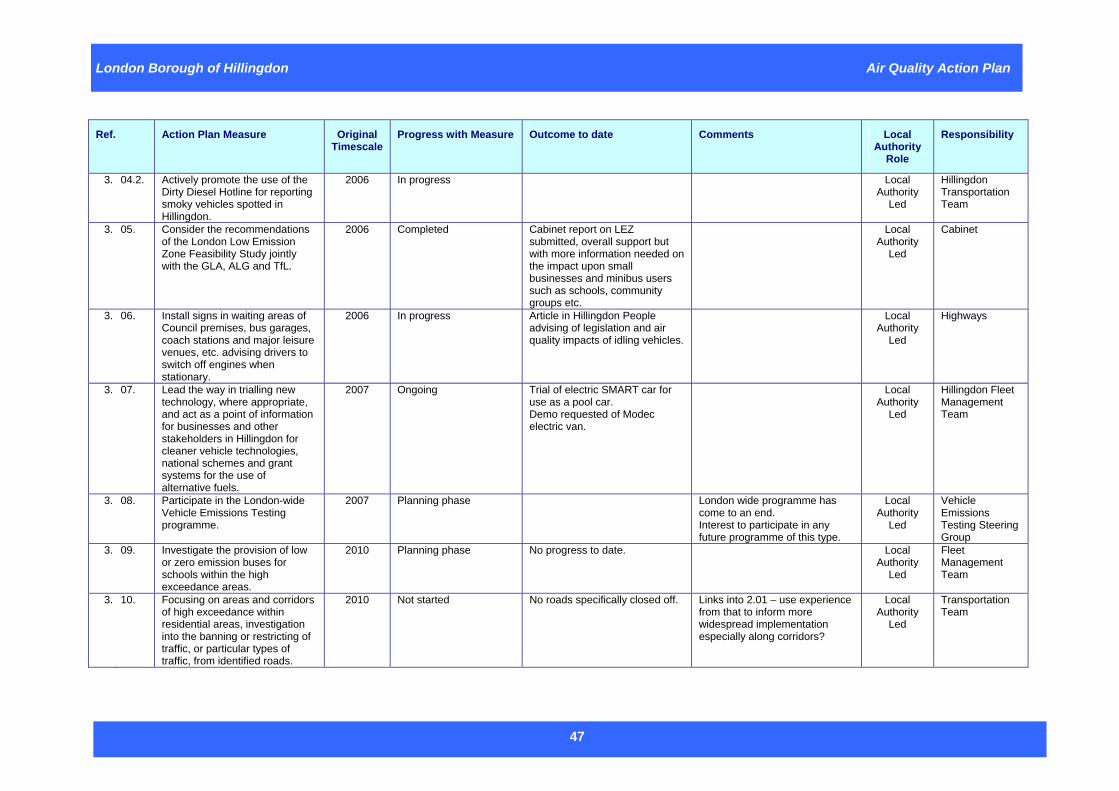
London Borough of Hillingdon Air Quality Action Plan
47
Ref. Action Plan Measure Original Timescale
Progress with Measure Outcome to date Comments Local Authority
Role
Responsibility
3. 04.2. Actively promote the use of the Dirty Diesel Hotline for reporting smoky vehicles spotted in Hillingdon.
2006 In progress Local Authority
Led
Hillingdon Transportation Team
3. 05. Consider the recommendations of the London Low Emission Zone Feasibility Study jointly with the GLA, ALG and TfL.
2006 Completed Cabinet report on LEZ submitted, overall support but with more information needed on the impact upon small businesses and minibus users such as schools, community groups etc.
Local Authority
Led
Cabinet
3. 06. Install signs in waiting areas of Council premises, bus garages, coach stations and major leisure venues, etc. advising drivers to switch off engines when stationary.
2006 In progress Article in Hillingdon People advising of legislation and air quality impacts of idling vehicles.
Local Authority
Led
Highways
3. 07. Lead the way in trialling new technology, where appropriate, and act as a point of information for businesses and other stakeholders in Hillingdon for cleaner vehicle technologies, national schemes and grant systems for the use of alternative fuels.
2007 Ongoing Trial of electric SMART car for use as a pool car. Demo requested of Modec electric van.
Local Authority
Led
Hillingdon Fleet Management Team
3. 08. Participate in the London-wide Vehicle Emissions Testing programme.
2007 Planning phase London wide programme has come to an end. Interest to participate in any future programme of this type.
Local Authority
Led
Vehicle Emissions Testing Steering Group
3. 09. Investigate the provision of low or zero emission buses for schools within the high exceedance areas.
2010 Planning phase No progress to date. Local Authority
Led
Fleet Management Team
3. 10. Focusing on areas and corridors of high exceedance within residential areas, investigation into the banning or restricting of traffic, or particular types of traffic, from identified roads.
2010 Not started No roads specifically closed off. Links into 2.01 – use experience from that to inform more widespread implementation especially along corridors?
Local Authority
Led
Transportation Team
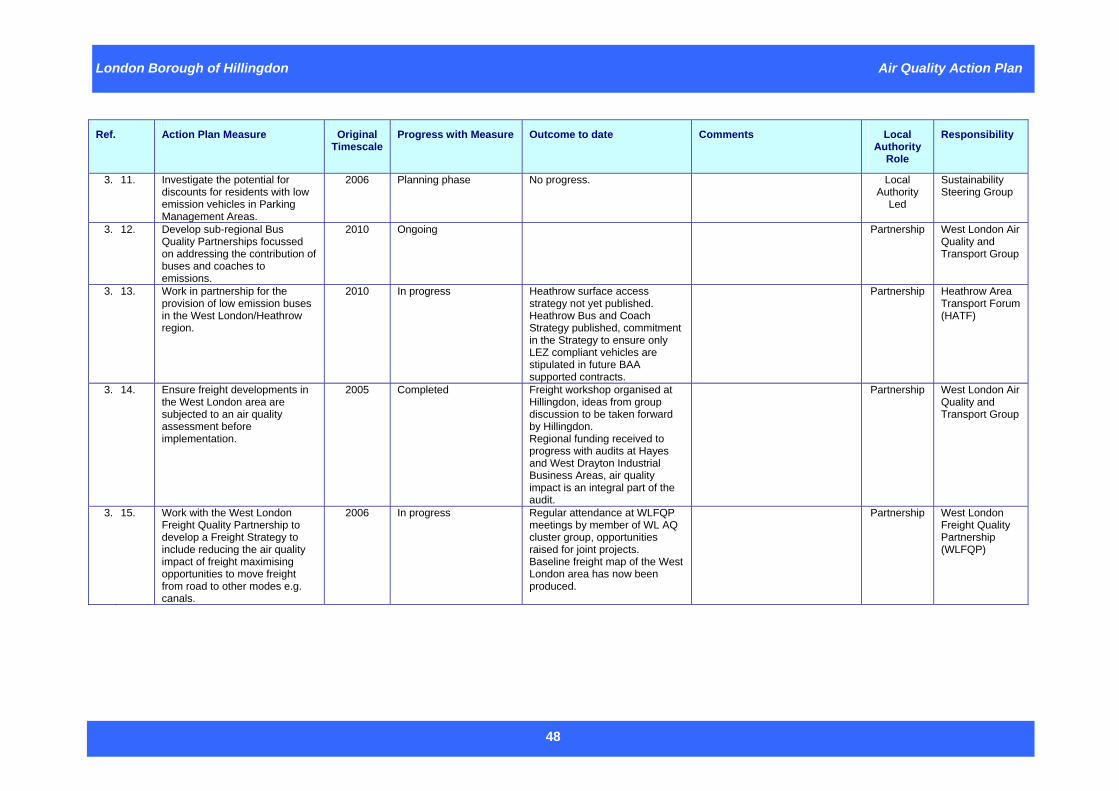
London Borough of Hillingdon Air Quality Action Plan
48
Ref. Action Plan Measure Original Timescale
Progress with Measure Outcome to date Comments Local Authority
Role
Responsibility
3. 11. Investigate the potential for discounts for residents with low emission vehicles in Parking Management Areas.
2006 Planning phase No progress. Local Authority
Led
Sustainability Steering Group
3. 12. Develop sub-regional Bus Quality Partnerships focussed on addressing the contribution of buses and coaches to emissions.
2010 Ongoing Partnership West London Air Quality and Transport Group
3. 13. Work in partnership for the provision of low emission buses in the West London/Heathrow region.
2010 In progress Heathrow surface access strategy not yet published. Heathrow Bus and Coach Strategy published, commitment in the Strategy to ensure only LEZ compliant vehicles are stipulated in future BAA supported contracts.
Partnership Heathrow Area Transport Forum (HATF)
3. 14. Ensure freight developments in the West London area are subjected to an air quality assessment before implementation.
2005 Completed Freight workshop organised at Hillingdon, ideas from group discussion to be taken forward by Hillingdon. Regional funding received to progress with audits at Hayes and West Drayton Industrial Business Areas, air quality impact is an integral part of the audit.
Partnership West London Air Quality and Transport Group
3. 15. Work with the West London Freight Quality Partnership to develop a Freight Strategy to include reducing the air quality impact of freight maximising opportunities to move freight from road to other modes e.g. canals.
2006 In progress Regular attendance at WLFQP meetings by member of WL AQ cluster group, opportunities raised for joint projects. Baseline freight map of the West London area has now been produced.
Partnership West London Freight Quality Partnership (WLFQP)
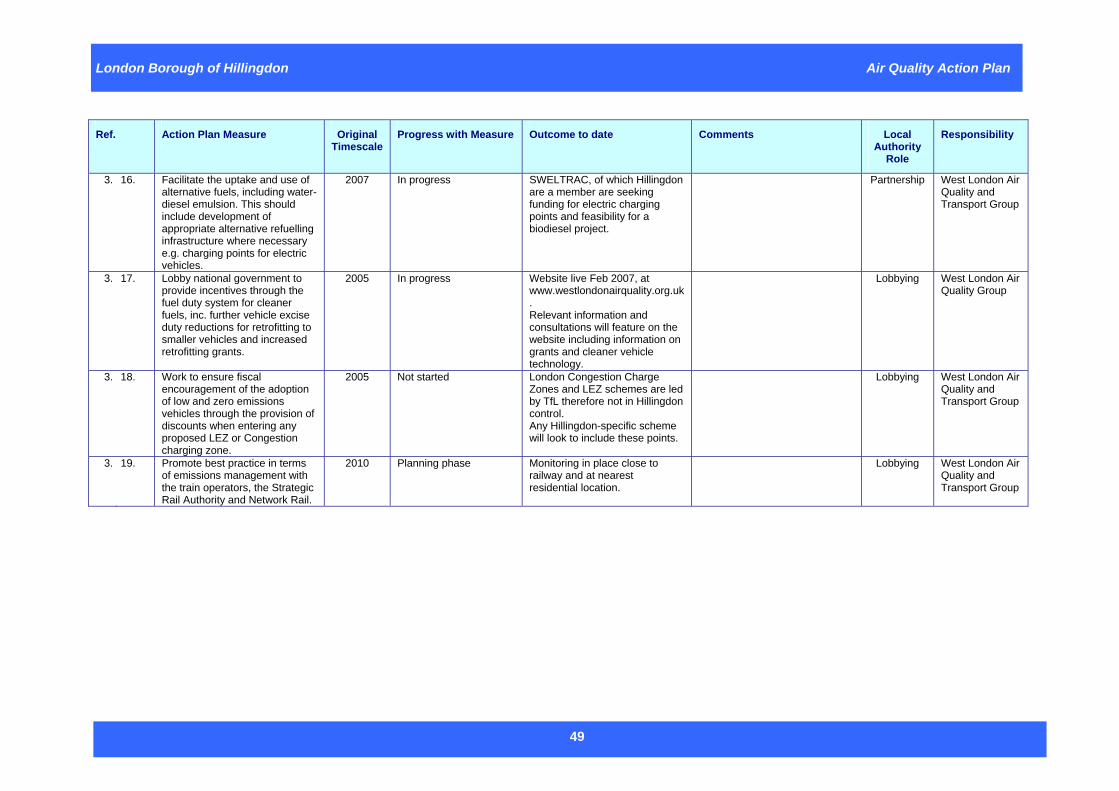
London Borough of Hillingdon Air Quality Action Plan
49
Ref. Action Plan Measure Original Timescale
Progress with Measure Outcome to date Comments Local Authority
Role
Responsibility
3. 16. Facilitate the uptake and use of alternative fuels, including water-diesel emulsion. This should include development of appropriate alternative refuelling infrastructure where necessary e.g. charging points for electric vehicles.
2007 In progress SWELTRAC, of which Hillingdon are a member are seeking funding for electric charging points and feasibility for a biodiesel project.
Partnership West London Air Quality and Transport Group
3. 17. Lobby national government to provide incentives through the fuel duty system for cleaner fuels, inc. further vehicle excise duty reductions for retrofitting to smaller vehicles and increased retrofitting grants.
2005 In progress Website live Feb 2007, at www.westlondonairquality.org.uk. Relevant information and consultations will feature on the website including information on grants and cleaner vehicle technology.
Lobbying West London Air Quality Group
3. 18. Work to ensure fiscal encouragement of the adoption of low and zero emissions vehicles through the provision of discounts when entering any proposed LEZ or Congestion charging zone.
2005 Not started London Congestion Charge Zones and LEZ schemes are led by TfL therefore not in Hillingdon control. Any Hillingdon-specific scheme will look to include these points.
Lobbying West London Air Quality and Transport Group
3. 19. Promote best practice in terms of emissions management with the train operators, the Strategic Rail Authority and Network Rail.
2010 Planning phase Monitoring in place close to railway and at nearest residential location.
Lobbying West London Air Quality and Transport Group
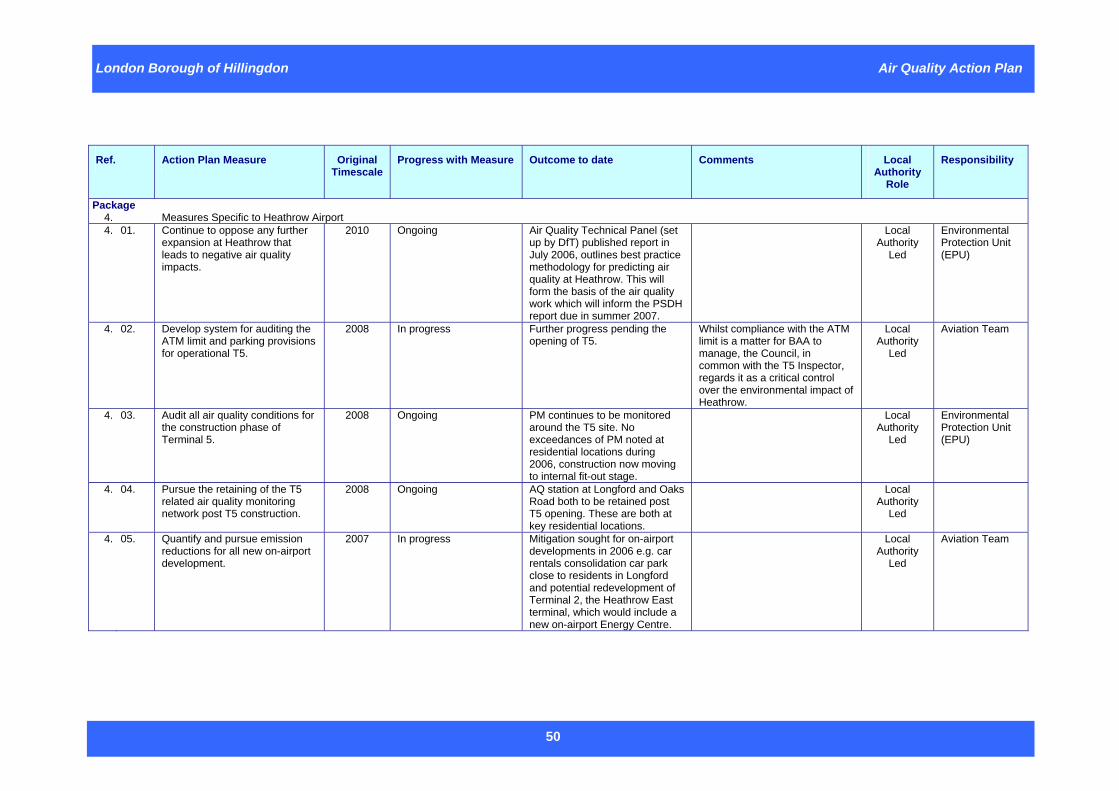
London Borough of Hillingdon Air Quality Action Plan
50
Ref. Action Plan Measure Original Timescale
Progress with Measure Outcome to date Comments Local Authority
Role
Responsibility
Package 4. Measures Specific to Heathrow Airport 4. 01. Continue to oppose any further
expansion at Heathrow that leads to negative air quality impacts.
2010 Ongoing Air Quality Technical Panel (set up by DfT) published report in July 2006, outlines best practice methodology for predicting air quality at Heathrow. This will form the basis of the air quality work which will inform the PSDH report due in summer 2007.
Local Authority
Led
Environmental Protection Unit (EPU)
4. 02. Develop system for auditing the ATM limit and parking provisions for operational T5.
2008 In progress Further progress pending the opening of T5.
Whilst compliance with the ATM limit is a matter for BAA to manage, the Council, in common with the T5 Inspector, regards it as a critical control over the environmental impact of Heathrow.
Local Authority
Led
Aviation Team
4. 03. Audit all air quality conditions for the construction phase of Terminal 5.
2008 Ongoing PM continues to be monitored around the T5 site. No exceedances of PM noted at residential locations during 2006, construction now moving to internal fit-out stage.
Local Authority
Led
Environmental Protection Unit (EPU)
4. 04. Pursue the retaining of the T5 related air quality monitoring network post T5 construction.
2008 Ongoing AQ station at Longford and Oaks Road both to be retained post T5 opening. These are both at key residential locations.
Local Authority
Led
4. 05. Quantify and pursue emission reductions for all new on-airport development.
2007 In progress Mitigation sought for on-airport developments in 2006 e.g. car rentals consolidation car park close to residents in Longford and potential redevelopment of Terminal 2, the Heathrow East terminal, which would include a new on-airport Energy Centre.
Local Authority
Led
Aviation Team
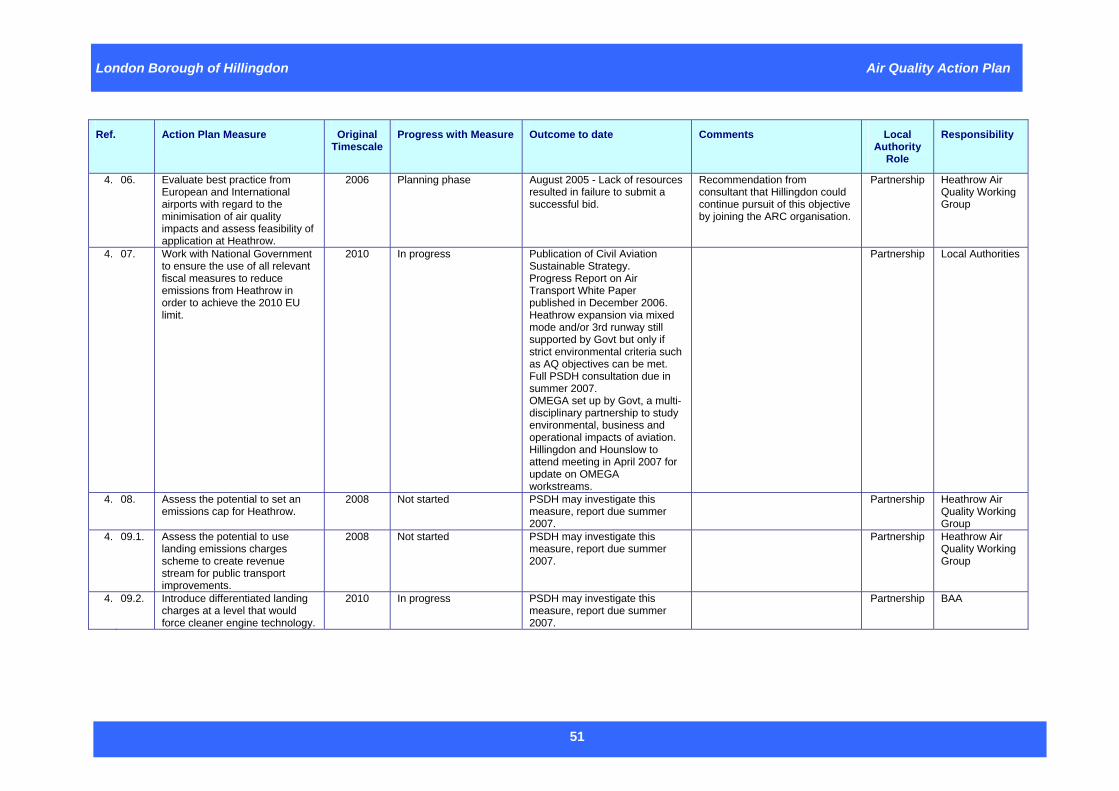
London Borough of Hillingdon Air Quality Action Plan
51
Ref. Action Plan Measure Original Timescale
Progress with Measure Outcome to date Comments Local Authority
Role
Responsibility
4. 06. Evaluate best practice from European and International airports with regard to the minimisation of air quality impacts and assess feasibility of application at Heathrow.
2006 Planning phase August 2005 - Lack of resources resulted in failure to submit a successful bid.
Recommendation from consultant that Hillingdon could continue pursuit of this objective by joining the ARC organisation.
Partnership Heathrow Air Quality Working Group
4. 07. Work with National Government to ensure the use of all relevant fiscal measures to reduce emissions from Heathrow in order to achieve the 2010 EU limit.
2010 In progress Publication of Civil Aviation Sustainable Strategy. Progress Report on Air Transport White Paper published in December 2006. Heathrow expansion via mixed mode and/or 3rd runway still supported by Govt but only if strict environmental criteria such as AQ objectives can be met. Full PSDH consultation due in summer 2007. OMEGA set up by Govt, a multi-disciplinary partnership to study environmental, business and operational impacts of aviation. Hillingdon and Hounslow to attend meeting in April 2007 for update on OMEGA workstreams.
Partnership Local Authorities
4. 08. Assess the potential to set an emissions cap for Heathrow.
2008 Not started PSDH may investigate this measure, report due summer 2007.
Partnership Heathrow Air Quality Working Group
4. 09.1. Assess the potential to use landing emissions charges scheme to create revenue stream for public transport improvements.
2008 Not started PSDH may investigate this measure, report due summer 2007.
Partnership Heathrow Air Quality Working Group
4. 09.2. Introduce differentiated landing charges at a level that would force cleaner engine technology.
2010 In progress PSDH may investigate this measure, report due summer 2007.
Partnership BAA
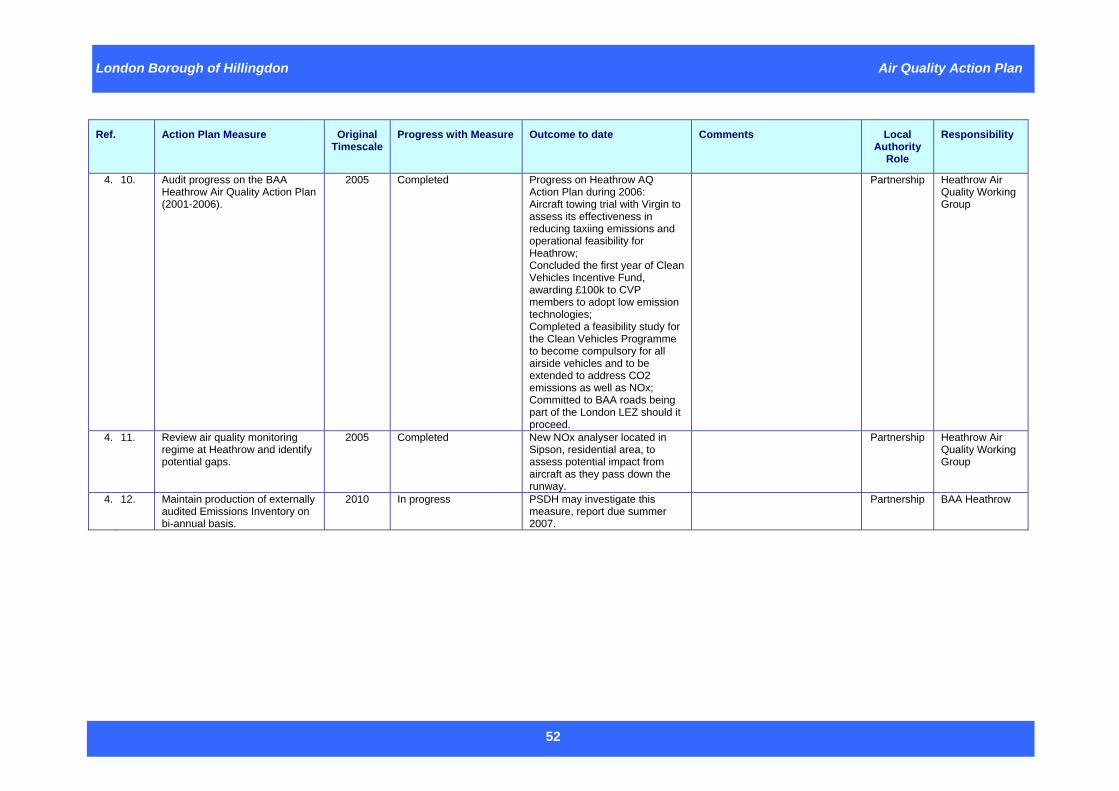
London Borough of Hillingdon Air Quality Action Plan
52
Ref. Action Plan Measure Original Timescale
Progress with Measure Outcome to date Comments Local Authority
Role
Responsibility
4. 10. Audit progress on the BAA Heathrow Air Quality Action Plan (2001-2006).
2005 Completed Progress on Heathrow AQ Action Plan during 2006: Aircraft towing trial with Virgin to assess its effectiveness in reducing taxiing emissions and operational feasibility for Heathrow; Concluded the first year of Clean Vehicles Incentive Fund, awarding £100k to CVP members to adopt low emission technologies; Completed a feasibility study for the Clean Vehicles Programme to become compulsory for all airside vehicles and to be extended to address CO2 emissions as well as NOx; Committed to BAA roads being part of the London LEZ should it proceed.
Partnership Heathrow Air Quality Working Group
4. 11. Review air quality monitoring regime at Heathrow and identify potential gaps.
2005 Completed New NOx analyser located in Sipson, residential area, to assess potential impact from aircraft as they pass down the runway.
Partnership Heathrow Air Quality Working Group
4. 12. Maintain production of externally audited Emissions Inventory on bi-annual basis.
2010 In progress PSDH may investigate this measure, report due summer 2007.
Partnership BAA Heathrow
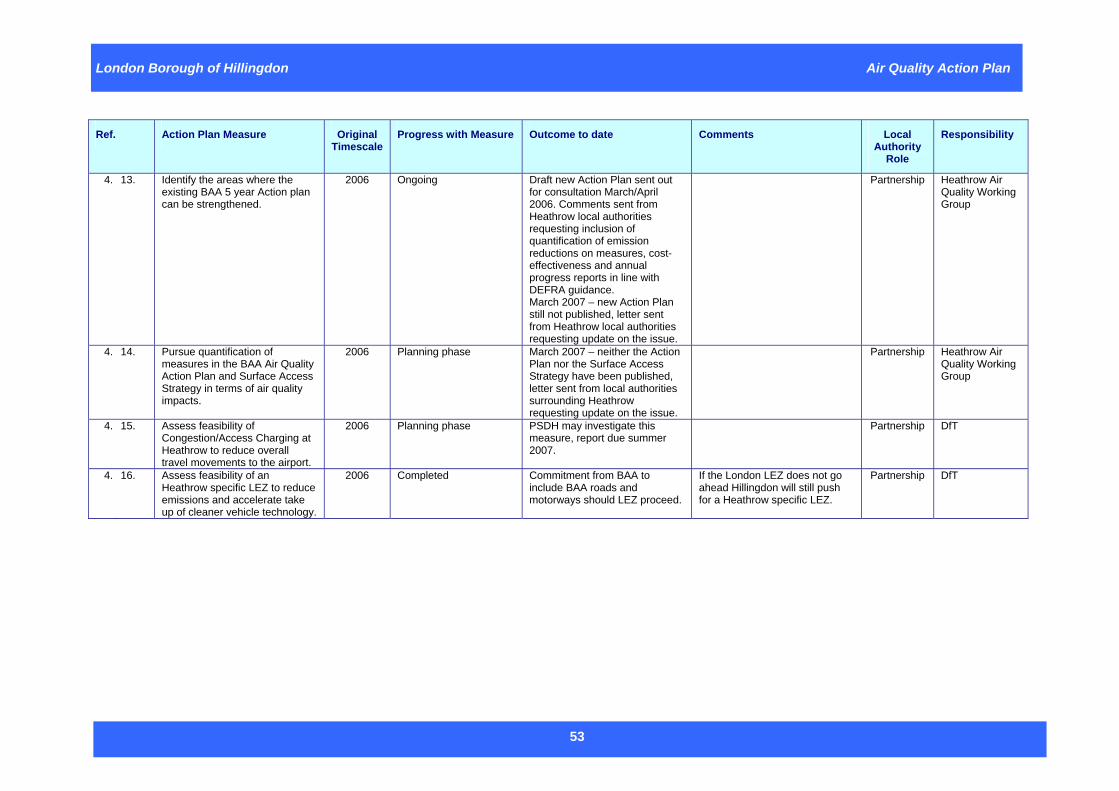
London Borough of Hillingdon Air Quality Action Plan
53
Ref. Action Plan Measure Original Timescale
Progress with Measure Outcome to date Comments Local Authority
Role
Responsibility
4. 13. Identify the areas where the existing BAA 5 year Action plan can be strengthened.
2006 Ongoing Draft new Action Plan sent out for consultation March/April 2006. Comments sent from Heathrow local authorities requesting inclusion of quantification of emission reductions on measures, cost-effectiveness and annual progress reports in line with DEFRA guidance. March 2007 – new Action Plan still not published, letter sent from Heathrow local authorities requesting update on the issue.
Partnership Heathrow Air Quality Working Group
4. 14. Pursue quantification of measures in the BAA Air Quality Action Plan and Surface Access Strategy in terms of air quality impacts.
2006 Planning phase March 2007 – neither the Action Plan nor the Surface Access Strategy have been published, letter sent from local authorities surrounding Heathrow requesting update on the issue.
Partnership Heathrow Air Quality Working Group
4. 15. Assess feasibility of Congestion/Access Charging at Heathrow to reduce overall travel movements to the airport.
2006 Planning phase PSDH may investigate this measure, report due summer 2007.
Partnership DfT
4. 16. Assess feasibility of an Heathrow specific LEZ to reduce emissions and accelerate take up of cleaner vehicle technology.
2006 Completed Commitment from BAA to include BAA roads and motorways should LEZ proceed.
If the London LEZ does not go ahead Hillingdon will still push for a Heathrow specific LEZ.
Partnership DfT
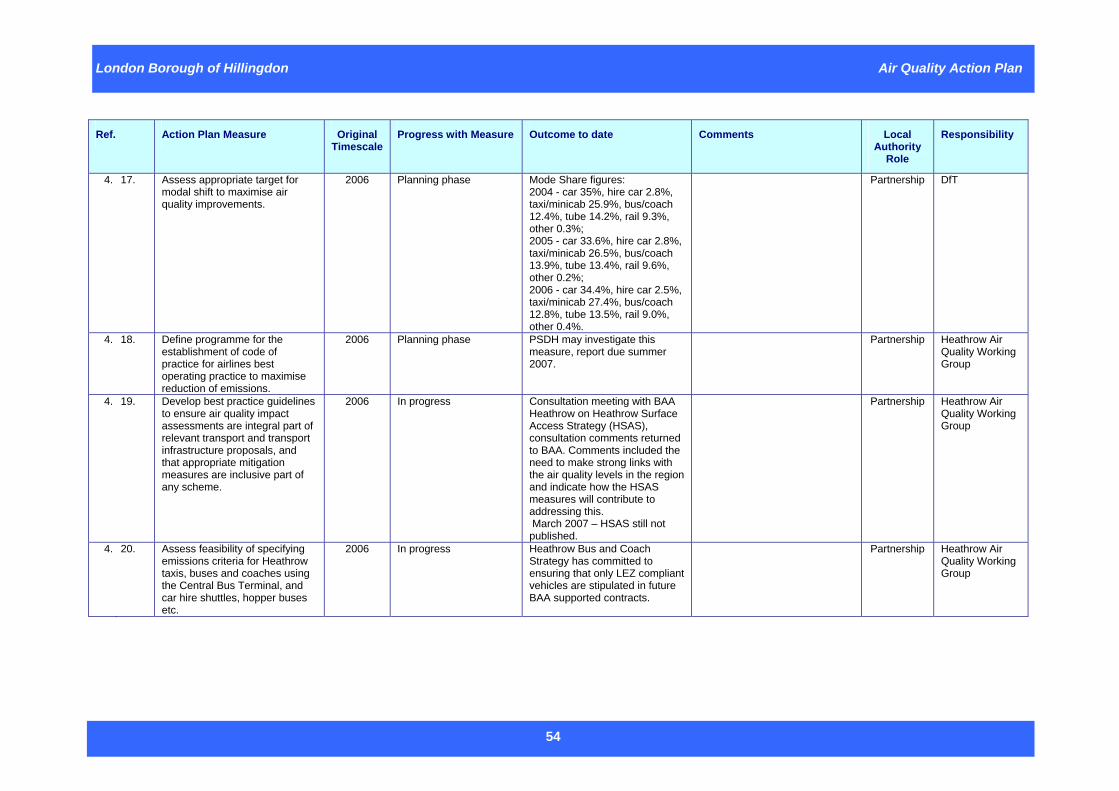
London Borough of Hillingdon Air Quality Action Plan
54
Ref. Action Plan Measure Original Timescale
Progress with Measure Outcome to date Comments Local Authority
Role
Responsibility
4. 17. Assess appropriate target for modal shift to maximise air quality improvements.
2006 Planning phase Mode Share figures: 2004 - car 35%, hire car 2.8%, taxi/minicab 25.9%, bus/coach 12.4%, tube 14.2%, rail 9.3%, other 0.3%; 2005 - car 33.6%, hire car 2.8%, taxi/minicab 26.5%, bus/coach 13.9%, tube 13.4%, rail 9.6%, other 0.2%; 2006 - car 34.4%, hire car 2.5%, taxi/minicab 27.4%, bus/coach 12.8%, tube 13.5%, rail 9.0%, other 0.4%.
Partnership DfT
4. 18. Define programme for the establishment of code of practice for airlines best operating practice to maximise reduction of emissions.
2006 Planning phase PSDH may investigate this measure, report due summer 2007.
Partnership Heathrow Air Quality Working Group
4. 19. Develop best practice guidelines to ensure air quality impact assessments are integral part of relevant transport and transport infrastructure proposals, and that appropriate mitigation measures are inclusive part of any scheme.
2006 In progress Consultation meeting with BAA Heathrow on Heathrow Surface Access Strategy (HSAS), consultation comments returned to BAA. Comments included the need to make strong links with the air quality levels in the region and indicate how the HSAS measures will contribute to addressing this. March 2007 – HSAS still not published.
Partnership Heathrow Air Quality Working Group
4. 20. Assess feasibility of specifying emissions criteria for Heathrow taxis, buses and coaches using the Central Bus Terminal, and car hire shuttles, hopper buses etc.
2006 In progress Heathrow Bus and Coach Strategy has committed to ensuring that only LEZ compliant vehicles are stipulated in future BAA supported contracts.
Partnership Heathrow Air Quality Working Group
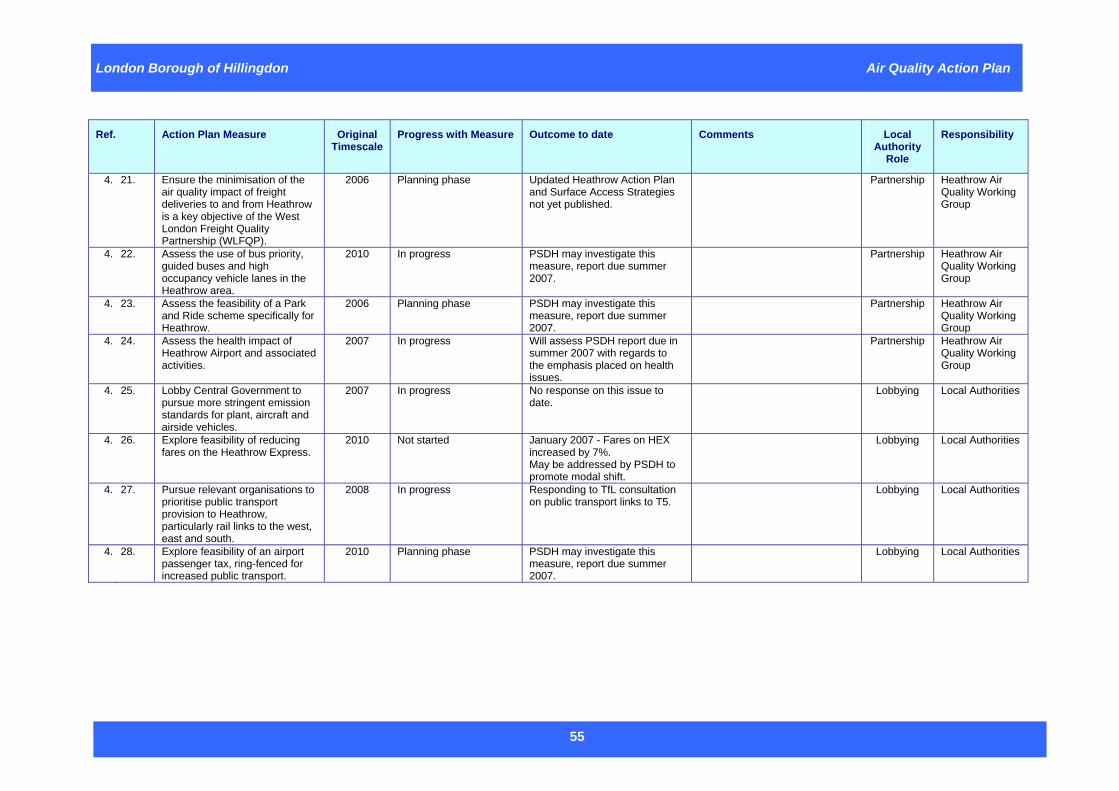
London Borough of Hillingdon Air Quality Action Plan
55
Ref. Action Plan Measure Original Timescale
Progress with Measure Outcome to date Comments Local Authority
Role
Responsibility
4. 21. Ensure the minimisation of the air quality impact of freight deliveries to and from Heathrow is a key objective of the West London Freight Quality Partnership (WLFQP).
2006 Planning phase Updated Heathrow Action Plan and Surface Access Strategies not yet published.
Partnership Heathrow Air Quality Working Group
4. 22. Assess the use of bus priority, guided buses and high occupancy vehicle lanes in the Heathrow area.
2010 In progress PSDH may investigate this measure, report due summer 2007.
Partnership Heathrow Air Quality Working Group
4. 23. Assess the feasibility of a Park and Ride scheme specifically for Heathrow.
2006 Planning phase PSDH may investigate this measure, report due summer 2007.
Partnership Heathrow Air Quality Working Group
4. 24. Assess the health impact of Heathrow Airport and associated activities.
2007 In progress Will assess PSDH report due in summer 2007 with regards to the emphasis placed on health issues.
Partnership Heathrow Air Quality Working Group
4. 25. Lobby Central Government to pursue more stringent emission standards for plant, aircraft and airside vehicles.
2007 In progress No response on this issue to date.
Lobbying Local Authorities
4. 26. Explore feasibility of reducing fares on the Heathrow Express.
2010 Not started January 2007 - Fares on HEX increased by 7%. May be addressed by PSDH to promote modal shift.
Lobbying Local Authorities
4. 27. Pursue relevant organisations to prioritise public transport provision to Heathrow, particularly rail links to the west, east and south.
2008 In progress Responding to TfL consultation on public transport links to T5.
Lobbying Local Authorities
4. 28. Explore feasibility of an airport passenger tax, ring-fenced for increased public transport.
2010 Planning phase PSDH may investigate this measure, report due summer 2007.
Lobbying Local Authorities
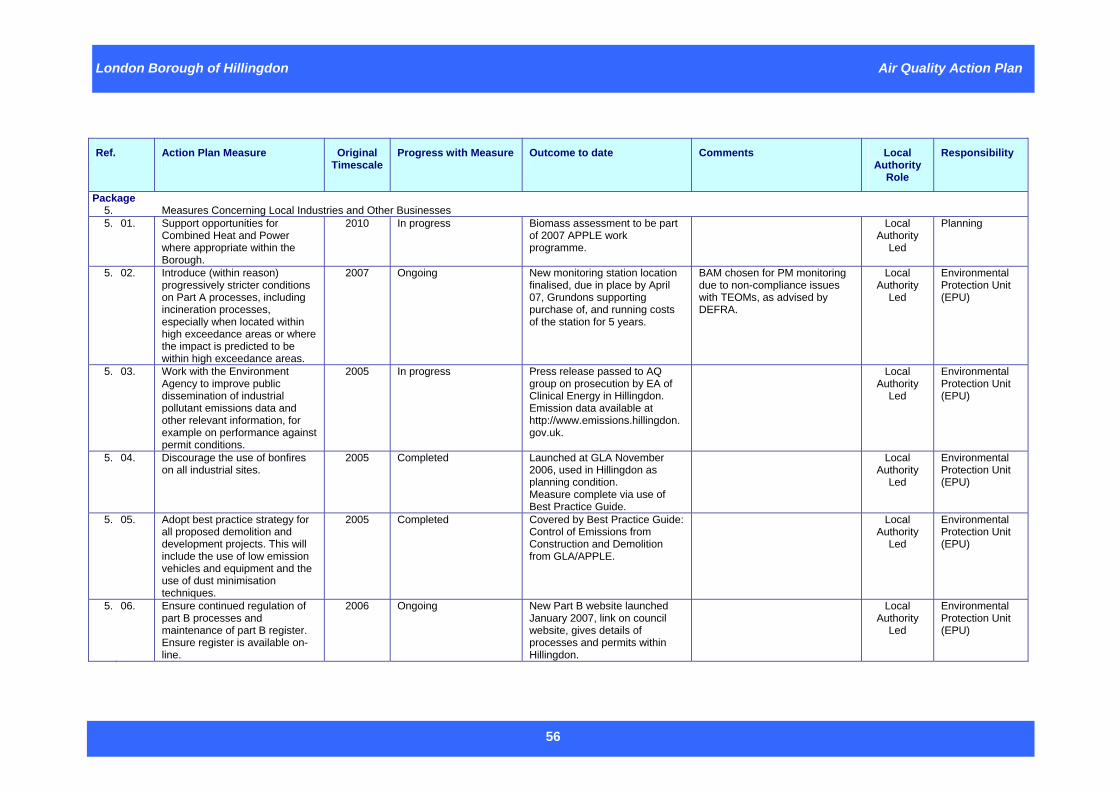
London Borough of Hillingdon Air Quality Action Plan
56
Ref. Action Plan Measure Original
Timescale Progress with Measure Outcome to date Comments Local
Authority Role
Responsibility
Package 5. Measures Concerning Local Industries and Other Businesses 5. 01. Support opportunities for
Combined Heat and Power where appropriate within the Borough.
2010 In progress Biomass assessment to be part of 2007 APPLE work programme.
Local Authority
Led
Planning
5. 02. Introduce (within reason) progressively stricter conditions on Part A processes, including incineration processes, especially when located within high exceedance areas or where the impact is predicted to be within high exceedance areas.
2007 Ongoing New monitoring station location finalised, due in place by April 07, Grundons supporting purchase of, and running costs of the station for 5 years.
BAM chosen for PM monitoring due to non-compliance issues with TEOMs, as advised by DEFRA.
Local Authority
Led
Environmental Protection Unit (EPU)
5. 03. Work with the Environment Agency to improve public dissemination of industrial pollutant emissions data and other relevant information, for example on performance against permit conditions.
2005 In progress Press release passed to AQ group on prosecution by EA of Clinical Energy in Hillingdon. Emission data available at http://www.emissions.hillingdon.gov.uk.
Local Authority
Led
Environmental Protection Unit (EPU)
5. 04. Discourage the use of bonfires on all industrial sites.
2005 Completed Launched at GLA November 2006, used in Hillingdon as planning condition. Measure complete via use of Best Practice Guide.
Local Authority
Led
Environmental Protection Unit (EPU)
5. 05. Adopt best practice strategy for all proposed demolition and development projects. This will include the use of low emission vehicles and equipment and the use of dust minimisation techniques.
2005 Completed Covered by Best Practice Guide: Control of Emissions from Construction and Demolition from GLA/APPLE.
Local Authority
Led
Environmental Protection Unit (EPU)
5. 06. Ensure continued regulation of part B processes and maintenance of part B register. Ensure register is available on-line.
2006 Ongoing New Part B website launched January 2007, link on council website, gives details of processes and permits within Hillingdon.
Local Authority
Led
Environmental Protection Unit (EPU)
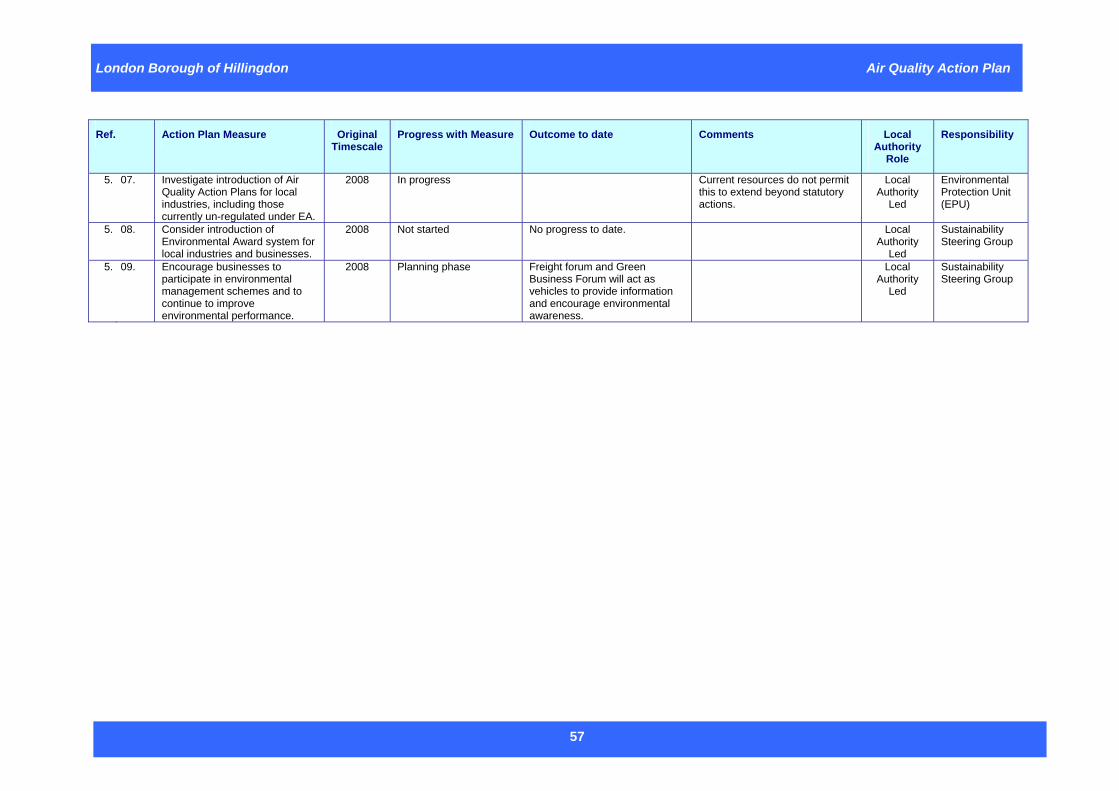
London Borough of Hillingdon Air Quality Action Plan
57
Ref. Action Plan Measure Original Timescale
Progress with Measure Outcome to date Comments Local Authority
Role
Responsibility
5. 07. Investigate introduction of Air Quality Action Plans for local industries, including those currently un-regulated under EA.
2008 In progress Current resources do not permit this to extend beyond statutory actions.
Local Authority
Led
Environmental Protection Unit (EPU)
5. 08. Consider introduction of Environmental Award system for local industries and businesses.
2008 Not started No progress to date. Local Authority
Led
Sustainability Steering Group
5. 09. Encourage businesses to participate in environmental management schemes and to continue to improve environmental performance.
2008 Planning phase Freight forum and Green Business Forum will act as vehicles to provide information and encourage environmental awareness.
Local Authority
Led
Sustainability Steering Group
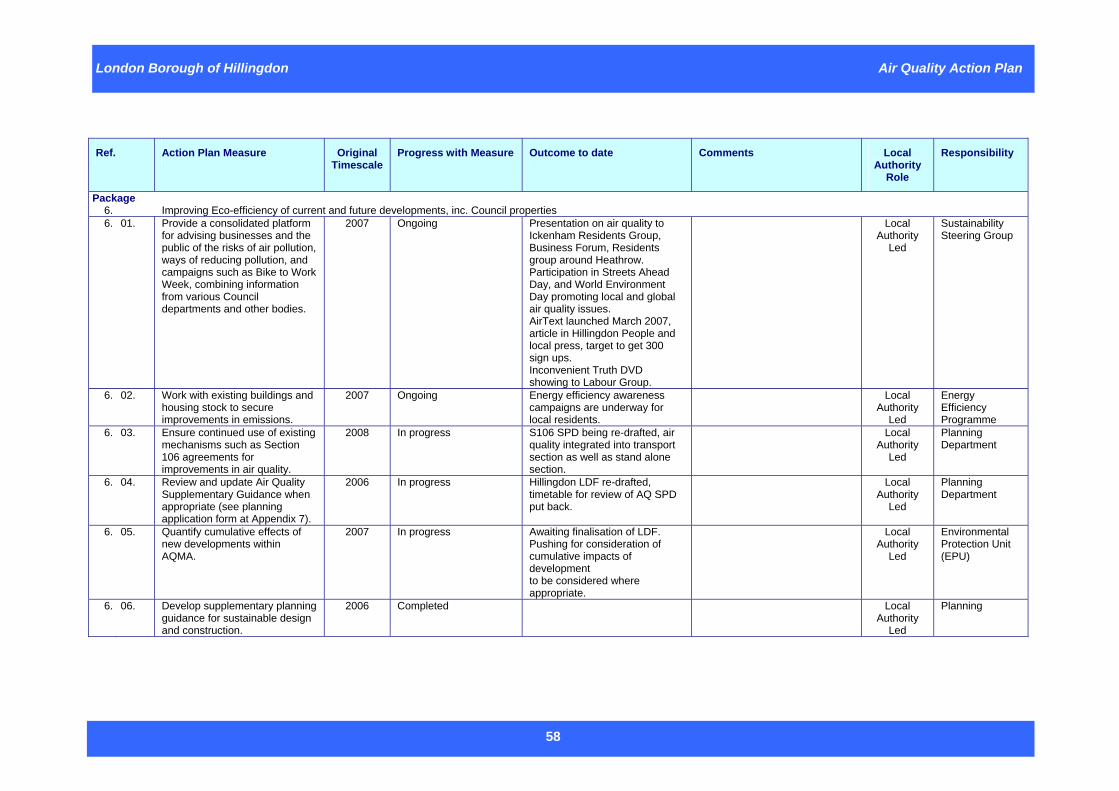
London Borough of Hillingdon Air Quality Action Plan
58
Ref. Action Plan Measure Original
Timescale Progress with Measure Outcome to date Comments Local
Authority Role
Responsibility
Package 6. Improving Eco-efficiency of current and future developments, inc. Council properties 6. 01. Provide a consolidated platform
for advising businesses and the public of the risks of air pollution, ways of reducing pollution, and campaigns such as Bike to Work Week, combining information from various Council departments and other bodies.
2007 Ongoing Presentation on air quality to Ickenham Residents Group, Business Forum, Residents group around Heathrow. Participation in Streets Ahead Day, and World Environment Day promoting local and global air quality issues. AirText launched March 2007, article in Hillingdon People and local press, target to get 300 sign ups. Inconvenient Truth DVD showing to Labour Group.
Local Authority
Led
Sustainability Steering Group
6. 02. Work with existing buildings and housing stock to secure improvements in emissions.
2007 Ongoing Energy efficiency awareness campaigns are underway for local residents.
Local Authority
Led
Energy Efficiency Programme
6. 03. Ensure continued use of existing mechanisms such as Section 106 agreements for improvements in air quality.
2008 In progress S106 SPD being re-drafted, air quality integrated into transport section as well as stand alone section.
Local Authority
Led
Planning Department
6. 04. Review and update Air Quality Supplementary Guidance when appropriate (see planning application form at Appendix 7).
2006 In progress Hillingdon LDF re-drafted, timetable for review of AQ SPD put back.
Local Authority
Led
Planning Department
6. 05. Quantify cumulative effects of new developments within AQMA.
2007 In progress Awaiting finalisation of LDF. Pushing for consideration of cumulative impacts of development to be considered where appropriate.
Local Authority
Led
Environmental Protection Unit (EPU)
6. 06. Develop supplementary planning guidance for sustainable design and construction.
2006 Completed Local Authority
Led
Planning
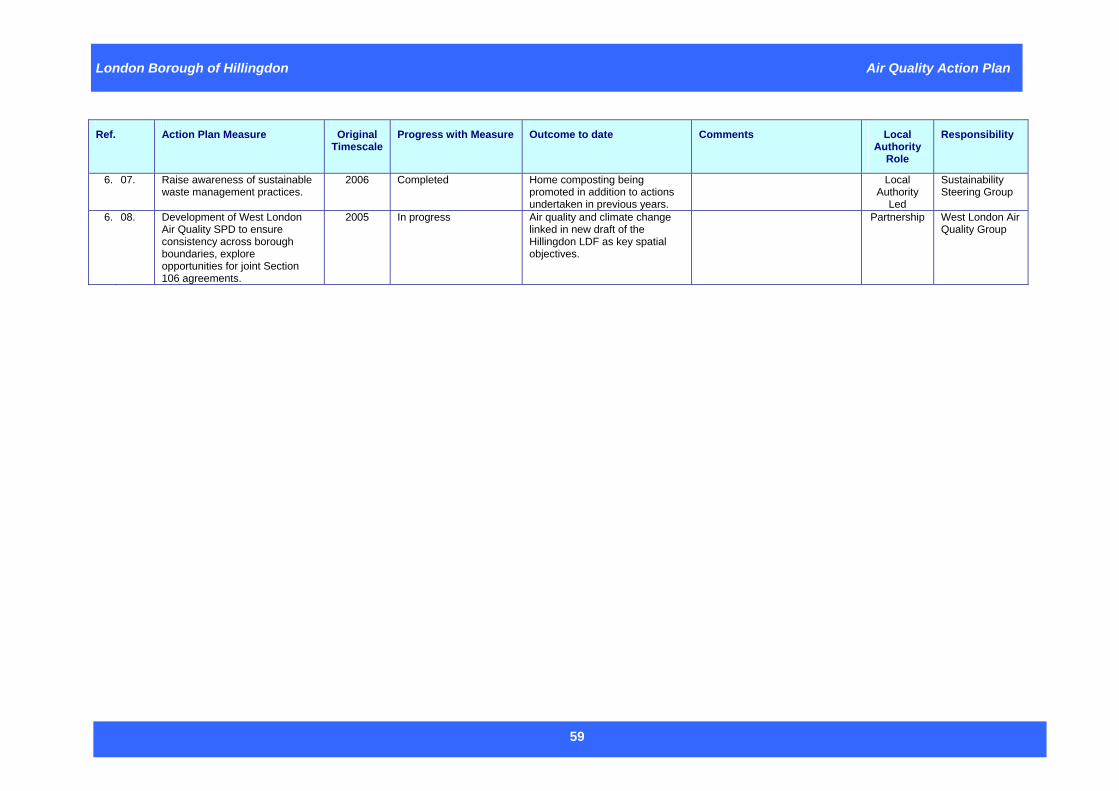
London Borough of Hillingdon Air Quality Action Plan
59
Ref. Action Plan Measure Original Timescale
Progress with Measure Outcome to date Comments Local Authority
Role
Responsibility
6. 07. Raise awareness of sustainable waste management practices.
2006 Completed Home composting being promoted in addition to actions undertaken in previous years.
Local Authority
Led
Sustainability Steering Group
6. 08. Development of West London Air Quality SPD to ensure consistency across borough boundaries, explore opportunities for joint Section 106 agreements.
2005 In progress Air quality and climate change linked in new draft of the Hillingdon LDF as key spatial objectives.
Partnership West London Air Quality Group
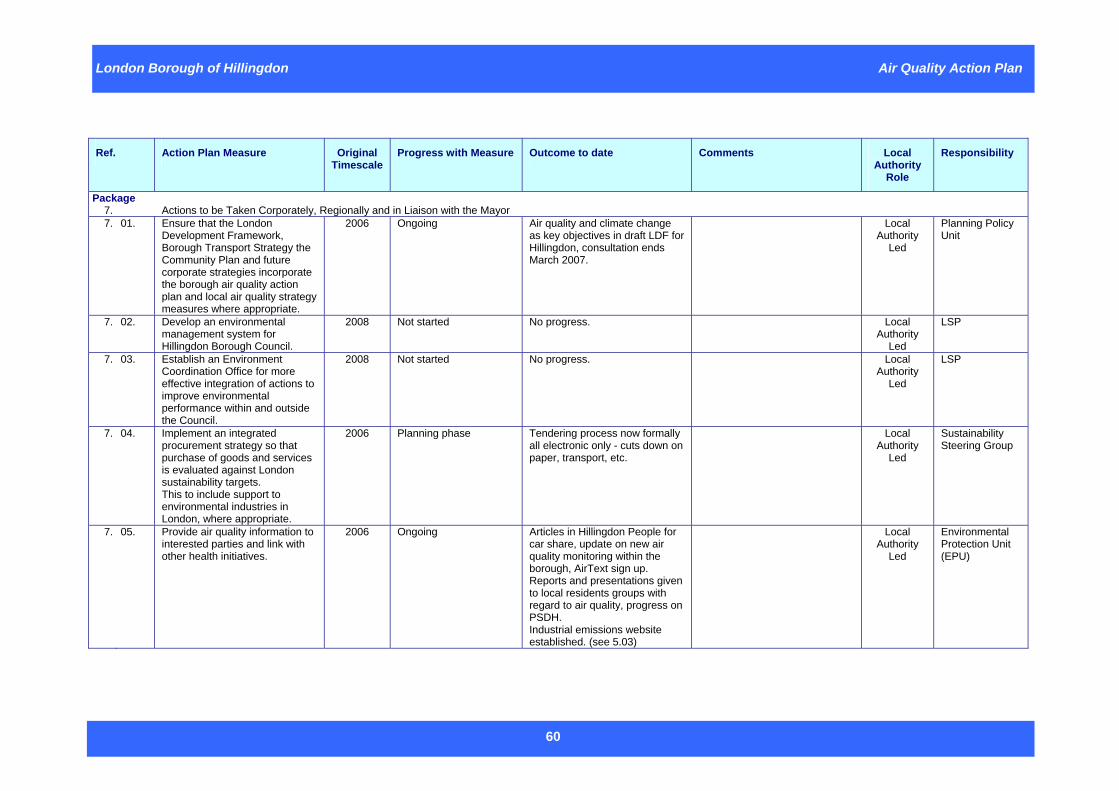
London Borough of Hillingdon Air Quality Action Plan
60
Ref. Action Plan Measure Original
Timescale Progress with Measure Outcome to date Comments Local
Authority Role
Responsibility
Package 7. Actions to be Taken Corporately, Regionally and in Liaison with the Mayor 7. 01. Ensure that the London
Development Framework, Borough Transport Strategy the Community Plan and future corporate strategies incorporate the borough air quality action plan and local air quality strategy measures where appropriate.
2006 Ongoing Air quality and climate change as key objectives in draft LDF for Hillingdon, consultation ends March 2007.
Local Authority
Led
Planning Policy Unit
7. 02. Develop an environmental management system for Hillingdon Borough Council.
2008 Not started No progress. Local Authority
Led
LSP
7. 03. Establish an Environment Coordination Office for more effective integration of actions to improve environmental performance within and outside the Council.
2008 Not started No progress. Local Authority
Led
LSP
7. 04. Implement an integrated procurement strategy so that purchase of goods and services is evaluated against London sustainability targets. This to include support to environmental industries in London, where appropriate.
2006 Planning phase Tendering process now formally all electronic only - cuts down on paper, transport, etc.
Local Authority
Led
Sustainability Steering Group
7. 05. Provide air quality information to interested parties and link with other health initiatives.
2006 Ongoing Articles in Hillingdon People for car share, update on new air quality monitoring within the borough, AirText sign up. Reports and presentations given to local residents groups with regard to air quality, progress on PSDH. Industrial emissions website established. (see 5.03)
Local Authority
Led
Environmental Protection Unit (EPU)
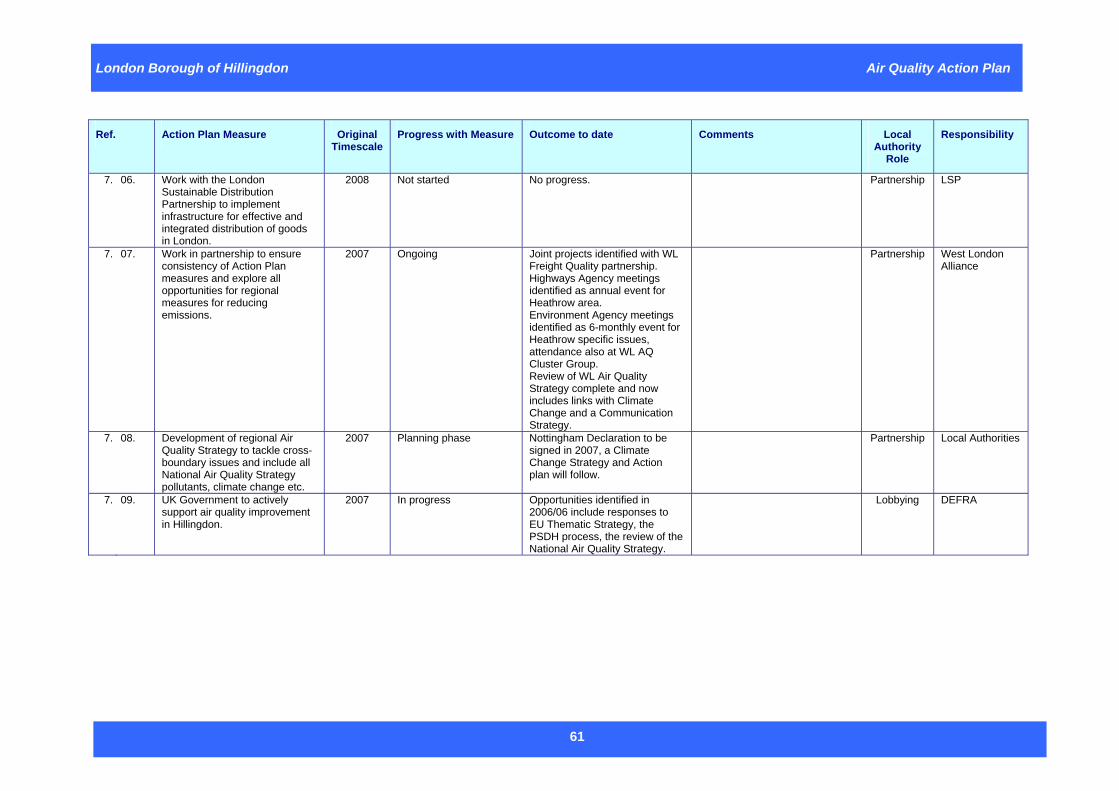
London Borough of Hillingdon Air Quality Action Plan
61
Ref. Action Plan Measure Original Timescale
Progress with Measure Outcome to date Comments Local Authority
Role
Responsibility
7. 06. Work with the London Sustainable Distribution Partnership to implement infrastructure for effective and integrated distribution of goods in London.
2008 Not started No progress. Partnership LSP
7. 07. Work in partnership to ensure consistency of Action Plan measures and explore all opportunities for regional measures for reducing emissions.
2007 Ongoing Joint projects identified with WL Freight Quality partnership. Highways Agency meetings identified as annual event for Heathrow area. Environment Agency meetings identified as 6-monthly event for Heathrow specific issues, attendance also at WL AQ Cluster Group. Review of WL Air Quality Strategy complete and now includes links with Climate Change and a Communication Strategy.
Partnership West London Alliance
7. 08. Development of regional Air Quality Strategy to tackle cross-boundary issues and include all National Air Quality Strategy pollutants, climate change etc.
2007 Planning phase Nottingham Declaration to be signed in 2007, a Climate Change Strategy and Action plan will follow.
Partnership Local Authorities
7. 09. UK Government to actively support air quality improvement in Hillingdon.
2007 In progress Opportunities identified in 2006/06 include responses to EU Thematic Strategy, the PSDH process, the review of the National Air Quality Strategy.
Lobbying DEFRA
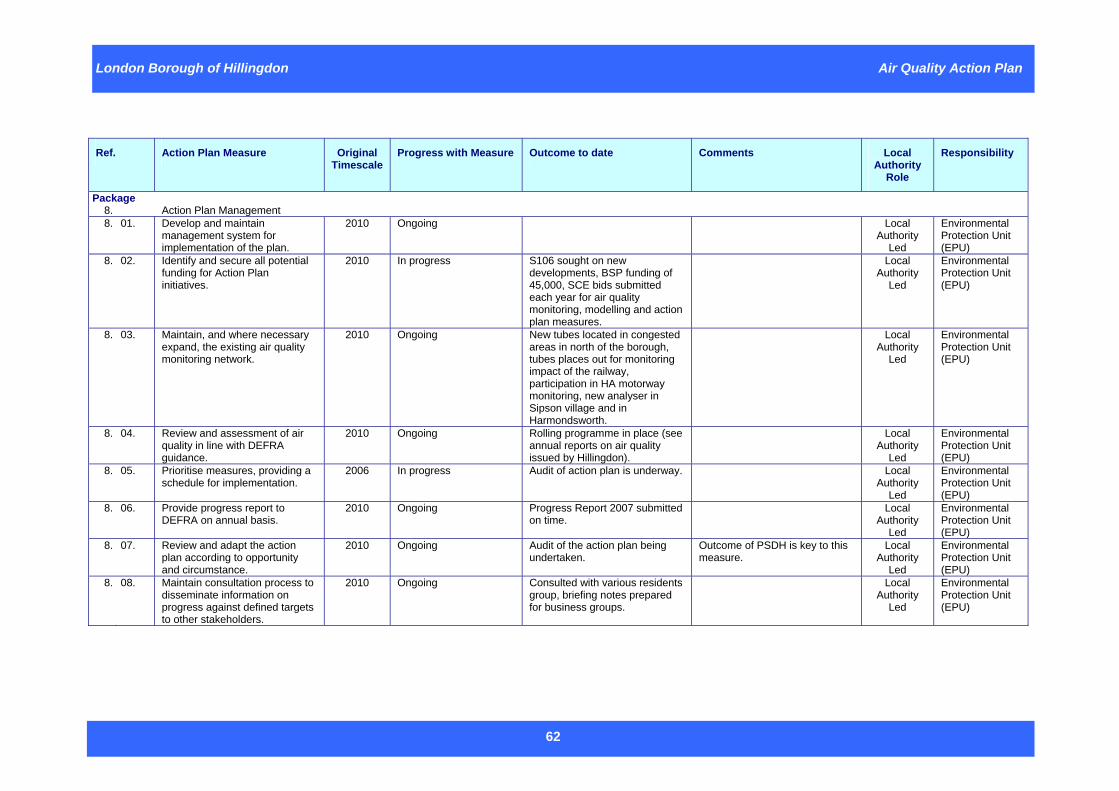
London Borough of Hillingdon Air Quality Action Plan
62
Ref. Action Plan Measure Original
Timescale Progress with Measure Outcome to date Comments Local
Authority Role
Responsibility
Package 8. Action Plan Management 8. 01. Develop and maintain
management system for implementation of the plan.
2010 Ongoing Local Authority
Led
Environmental Protection Unit (EPU)
8. 02. Identify and secure all potential funding for Action Plan initiatives.
2010 In progress S106 sought on new developments, BSP funding of 45,000, SCE bids submitted each year for air quality monitoring, modelling and action plan measures.
Local Authority
Led
Environmental Protection Unit (EPU)
8. 03. Maintain, and where necessary expand, the existing air quality monitoring network.
2010 Ongoing New tubes located in congested areas in north of the borough, tubes places out for monitoring impact of the railway, participation in HA motorway monitoring, new analyser in Sipson village and in Harmondsworth.
Local Authority
Led
Environmental Protection Unit (EPU)
8. 04. Review and assessment of air quality in line with DEFRA guidance.
2010 Ongoing Rolling programme in place (see annual reports on air quality issued by Hillingdon).
Local Authority
Led
Environmental Protection Unit (EPU)
8. 05. Prioritise measures, providing a schedule for implementation.
2006 In progress Audit of action plan is underway. Local Authority
Led
Environmental Protection Unit (EPU)
8. 06. Provide progress report to DEFRA on annual basis.
2010 Ongoing Progress Report 2007 submitted on time.
Local Authority
Led
Environmental Protection Unit (EPU)
8. 07. Review and adapt the action plan according to opportunity and circumstance.
2010 Ongoing Audit of the action plan being undertaken.
Outcome of PSDH is key to this measure.
Local Authority
Led
Environmental Protection Unit (EPU)
8. 08. Maintain consultation process to disseminate information on progress against defined targets to other stakeholders.
2010 Ongoing Consulted with various residents group, briefing notes prepared for business groups.
Local Authority
Led
Environmental Protection Unit (EPU)
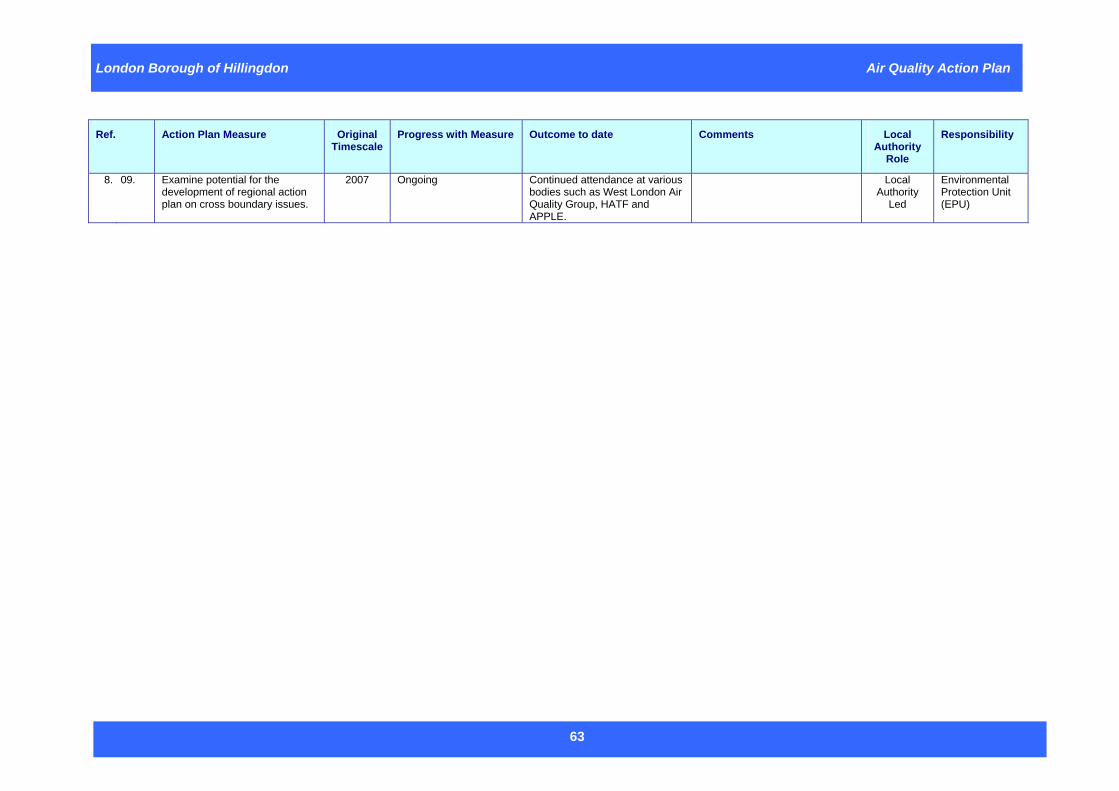
London Borough of Hillingdon Air Quality Action Plan
63
Ref. Action Plan Measure Original Timescale
Progress with Measure Outcome to date Comments Local Authority
Role
Responsibility
8. 09. Examine potential for the development of regional action plan on cross boundary issues.
2007 Ongoing Continued attendance at various bodies such as West London Air Quality Group, HATF and APPLE.
Local Authority
Led
Environmental Protection Unit (EPU)

London Borough of Hillingdon Air Quality Action Plan
64