Embed Size (px)
Citation preview

Genet. Res., Comb. (1966), 8, pp. 361-375With 7 text-figuresPrinted in Great Britain
The limits to artificial selection for body weight in the mouse
II. THE GENETIC NATURE OF THE LIMITS
B Y R. C. ROBERTS
A.R.G. Unit of Animal Genetics,Institute of Animal Genetics, Edinburgh, 9
(Received 10 August 1966)
1. INTRODUCTION
The first paper of this series (Roberts, 1966) examined the results of some earlierselection experiments for body weight in the mouse, conducted in this laboratory.The object was to determine the limits to selection that had been attained for thistrait. Theoretical considerations of the experimental results led to the conclusionthat the limits observed were compatible with a model based on the exhaustion ofthe additive genetic variance by fixation of loci contributing to the variation inweight. It was emphasized, however, that while no other explanation was necessary,other explanations were not specifically excluded by the analysis applied. This paperreports an experimental investigation of the genetic nature of the limits found intwo of the selected lines included in the earlier study. The investigation establishesthat in at least one of the two lines, total fixation was not an adequate explanationof the limit reached.
2. MATERIALS AND METHODS
It would obviously have been desirable to extend the experimental analysis ofthe limits to all seven lines described in the first paper. Unfortunately, the availablecage space permitted only two of the lines to be studied in the way described here.
The two lines chosen for further study were the CRL and CFS lines, representingthe large and small mice, respectively. These lines were first described by Falconer(1960), and their further progress under Dr Falconer's care was summarized in thefirst paper of this series. Both lines had been selected on growth between 3 and 6weeks for thirty-one generations when I acquired them, and I am indebted toDr Falconer for making these lines available to me.
The choice of these particular lines in preference to the others was governed bythe following considerations. The CRL line was the largest of the four large linesthat were available, and as it was to serve as a standard against which to assessmethods of transcending the limit, it seemed a logical choice for a more detailedgenetic study. The small CFS line did not meet this criterion so well, as it was the

362 R. C. ROBERTS
largest of the three available small lines. However, the reproductive performanceof the two smaller lines was by that time so poor that further work on them, whichwould require expansion of the stocks, presented serious practical difficulties.So the CFS line was preferred for continuation, as it had a better reproductiveperformance and also the added advantage of stemming from the same basepopulation as CRL, the large line chosen. This would render any comparisonbetween the large and small lines more meaningful.
Selection was continued in both of these lines, but from generation 32 onwards,the character selected was changed from growth between 3 and 6 weeks to 6-weekweight itself. This was done for the sake of convenience, as Falconer (1955) hadshown that the ranking of mice on the two measurements was virtually indis-tinguishable. But with the change in the selection procedure, the designations ofthe two lines were changed: CRL now became known in the laboratory as the CLline, while CFS became CS. This avoids confusion with Falconer's earlier (1960)study of these lines, while it also simplifies the designation of sublines drawn fromthe lines, as explained below. Frequent reference will be made to the GL and CSlines throughout the remainder of this series of papers. The selection was continuedon a within family basis for a further twenty generations and more in each case;the sequential numbering of the generations was not broken.
Two offshoots were taken from each of the CL and CS lines. In one case, allselection was suspended, and the sublines became known as CLR and CSR, wherethe R stands for 'relaxed' selection. In the second pair of offshoots, the direction ofthe selection was reversed, and the sublines were called CLB and CSB, where the Bstands for 'back' selection. In other words, CLB was the large line now selectedfor low body weight, while CSB was the small line selected for high body weight.
CLR was drawn at random from the 38th generation of CL. The remainder of themice in that generation were selected as appropriate either to continue the CLline or to form the 1st generation of CLB, respectively. Similarly, CSB wasderived from the 35th generation of the CS line while CSR was drawn at randomfrom the 37th generation of CS. All of the lines were run on fifteen pair matings pergeneration.
3. RESULTS
(i) Continued selection for body weight
Though the character to which selection was applied was changed formally frompost-weaning growth to weight at 6 weeks, there is no reason to suppose that theCL and CS lines had not attained the limit for 6-week weight by the time that Iacquired them. This is amply confirmed in Fig. 1 which shows the progress of thetwo lines under selection from the time that they were formed. The dotted parts ofthe graphs summarize the weights up to generation 31, as discussed in the earlierpaper. The solid lines represent the weights during the present study; these partswill be reproduced on a different scale in further figures, for the purposes of com-parison with other studies, throughout the remainder of this series of publications.

The limits to artificial selection for body-weight in the mouse—II 363
Let us consider first the CL line. Under continued selection for 6-week weight,this line remained at much the same level as before (about 32 g.) for a furthertwelve generations. However, between generations 43 and 44, there was a markedincrease in the mean body weight to 35 g., and the line has remained at this higherlevel for a further ten generations. Except for one sporadically high point at the21st generation, the CL line is now running at a level that is clearly different fromwhat it was before, after it had reached an apparent limit. The CS line, on the other
10 15 20 25Generations of selection
45 50
Fig. 1. Long-term responses to selection of CL and CS lines. Solid parts—weightsduring present study. Dotted parts—earlier responses, for comparison.
hand, does not arouse much suspicion of any major shift of a permanent nature inmean weight. Though its weights fluctuate over a range of about 5 g., there is noreason to revise the figure of 14 g. that was derived as the limit for this by genera-tion 31 (see earlier paper).
It is important to decide whether the higher mean weights of the CL line fromgeneration 44 onwards was of environmental or of genetic origin. Two factorsmight suggest an environmental cause. One is that the small (CS) line also showedan increase in weight at nearly the same time, i.e. at generation 42 of CS, which wascontemporaneous with generation 43 of CL. The other reason is that the composi-tion of the diet was modified at about that time, the modified diet being introduced

364 E. C. ROBERTS
as CL mice of generation 43 and CS mice of generation 42 were approaching 6 weeksof age. There are, on the other hand, several reasons which cumulatively render itextremely unlikely that the change of diet was the cause of the increase in the CLline. Firstly, the modification of the diet was only slight, the main item being thereplacement of miller's offal by ground wheat; the intention was to acquire agreater constancy of diet rather than to alter its nutritive value. Secondly, theincrease in the CS line was not great compared to previous fluctuations in this line,and the increase occurred the generation before the large increase in CL wasobserved. Thirdly, no parallel increase in weight was shown by four other lines allderived from the CL line a few generations earlier (two of these lines are shown inFig. 4). A dietary effect on weight would therefore have to be highly specific to theCL line, and from a recent review of the literature (Roberts, 1965) it would seemvery improbable that genotype-environment interactions of this magnitudeshould appear in strains separated by only a few generations. For these reasons, itseems much more likely that the increase in weight of the CL line was of geneticorigin, and this interpretation will be adopted in the evaluation of the data discussedin the remainder of this series of papers. It should be noted that the change occurredwell after various offshoots of the CL line were propagated for other studies.
The genetic nature of the change in weight is open to several interpretations.The fact that it occurred, over three generations, after a depression of the meanweight to its lowest level for over thirty generations accords well with the modelof selective peaks, separated by 'saddles', often expounded by Wright, andrecently (1965) reviewed by him. This model is a fairly complex one whose mainfeature is genie interactions. At a simpler level, we could postulate a new mutationfavourable to the direction of selection. Perhaps the most likely model wouldinvoke a rare recombinational event as suggested by Thoday & Boam (1961), andconfirmed by Thoday, Gibson & Spickett (1964), to explain similar shifts in themean bristle counts of selected lines of Drosophila. With an organism like themouse, there is at present little hope of being able to distinguish between thesevarious models experimentally. The main point is that we do not lack plausiblegenetic explanations of the increase in weight of the CL line that are still consistentwith a temporary limit to selection resulting from the exhaustion of the originaladditive genetic variance.
To summarize, two conclusions emerge from this section. Firstly, there is noevidence that a formal change in the character selected in any way affected theconclusions drawn earlier (Roberts, 1966) with respect to the limits of artificialselection for body weight in these two lines. Secondly, we have now a third instance(out of four possible cases) of a large line proving to be unstable with respect to bodyweight after it had apparently reached a limit. But whereas the two cases reportedin the earlier study both showed a shift contrary to the direction of selection, andremain completely unexplained, the one reported here was in the direction ofselection and is much more open to an acceptable genetic interpretation. One mayask, however, whether the shifts in all three lines may not have been different facetsof a common phenomenon. In terms of Wright's model, is it possible that the two

The limits to artificial selection for body-weight in the mouse—II 365
cases which showed a decline in weight accidentally drifted to a lower peak? Anopportunity for this to happen would stem from a lowering of selection pressures,which might result from the reduced fertility that frequently characterizes highlyselected lines.
(ii) Test for additive genetic variance in lines at the limit
If all the loci affecting body weight in a line have been fixed by selection, then ofcourse there will be no genetic variance of any description left in that line. This,however, is not very easy to test without special experimental programmes. Butexisting data can be utilized to see whether there is any heritable (or additive)variance available. If additive genetic variance is present, then this ought to bereflected in correlations between relatives which would lead to positive estimates ofthe heritability.
Maternal effects on body weight in the mouse are well known, and since thesegrossly affect estimates of genetic parameters (Falconer, 1964), relationships such asfull sibs that involve a common dam are not of much use for present purposes.Regressions on sire, however, do not incur these complications, and although thenumber of sires used in any one generation was at the most fifteen, different genera-tions can be pooled to obtain reasonably accurate estimates of the regression ofoffspring on sire. Data from generations 32 onwards have been employed to obtainestimates of the heritability of body weight in the CL and CS lines after they hadreached their limits, with the following results:
CL line: Heritability = 0-194 ±0-120Online: Heritability = 0-180 + 0-092
The estimates of the heritability in the two lines are very similar in absolute terms.The estimate for the large line is not significantly different from zero, but that forthe small line is on the borderline of formal statistical significance at the 5% level.This suggests that, in the small line at least, a substantial proportion of the variancein weight may be additive genetic. If this is so, it follows that the limit in the CSline is not fixed by the exhaustion of the genetic variance. This point will be ampli-fied in section (iv) below.
(iii) Relaxed and reversed selection in the large line
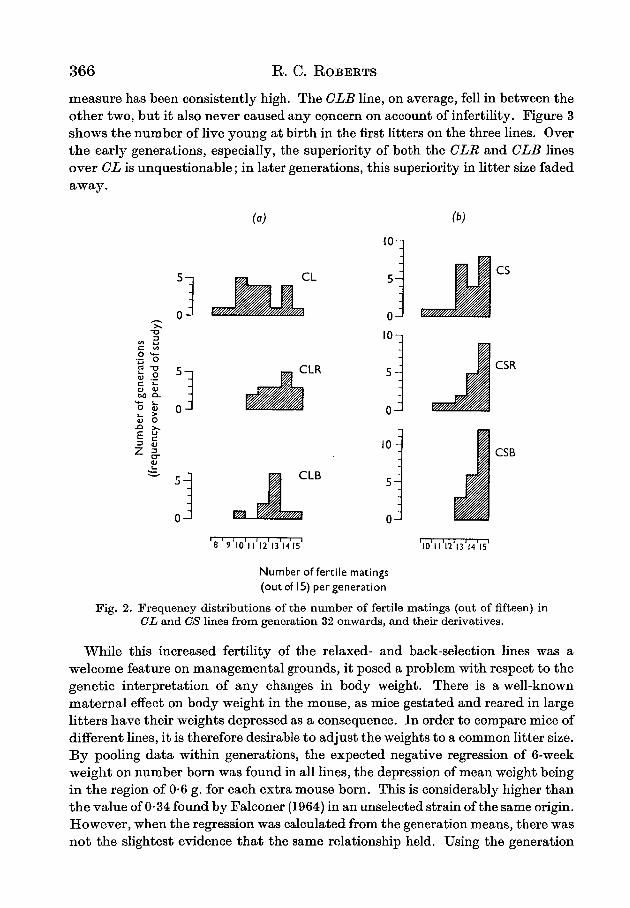
The first effect of the cessation of selection for large size was a practical one thatbecame immediately apparent, namely, that on account of their increased fertility,both the CLR and CLB lines became much easier to maintain than the parent CLline, in which selection for high 6-week weight was continued. Two aspects of thisincrease in fertility are summarized graphically in Figs. 2a and 3. Figure la givesthe frequency distribution of the number of fertile matings, out of the fifteen thatwere set up in each generation in each line over the period of study. With twotrivial exceptions, the CLR line regularly equalled or excelled the CL line over thesixteen generations that have elapsed since its formation. Its fertility on this
2c
366 R. C. ROBERTS
measure has been consistently high. The CLB line, on average, fell in between theother two, but it also never caused any concern on account of infertility. Figure 3shows the number of live young at birth in the first litters on the three lines. Overthe early generations, especially, the superiority of both the CLR and CLB linesover CL is unquestionable; in later generations, this superiority in litter size fadedaway.
(a)
5-1
c00 <X
E
z
O-1
5 -
O-1
CLR
10-
0-
10
5 —
0 -
CS
CSR
CLB
8 9 10 II 12 13 14 15
0 -
CSB
10 II 12 13 14 15
Number of fertile matings(out of 15) per generation
Fig. 2. Frequency distributions of the number of fertile matings (out of fifteen) inCL and CS lines from generation 32 onwards, and their derivatives.
While this increased fertility of the relaxed- and back-selection lines was awelcome feature on managemental grounds, it posed a problem with respect to thegenetic interpretation of any changes in body weight. There is a well-knownmaternal effect on body weight in the mouse, as mice gestated and reared in largelitters have their weights depressed as a consequence. In order to compare mice ofdifferent lines, it is therefore desirable to adjust the weights to a common litter size.By pooling data within generations, the expected negative regression of 6-weekweight on number born was found in all lines, the depression of mean weight beingin the region of 0-6 g. for each extra mouse born. This is considerably higher thanthe value of 0-34 found by Falconer (1964) in an unselected strain of the same origin.However, when the regression was calculated from the generation means, there wasnot the slightest evidence that the same relationship held. Using the generation

The limits to artificial selection for body-weight in the mouse—II 367
means to regress body weight on litter size is not very accurate, as the degrees offreedom are limited, but cumulatively, the lines reported here and some othersshowed no hint of any consistency in the sign of the regression coefficients which,of course, individually never even approached statistical significance. I t Wastherefore decided that the weights should not be corrected for litter size. Thisdecision was helped by the fact that the within-generation regressions, when thesewere applied to generation means as a trial, generated such small corrections thatno conclusion could possibly be affected.
The mean 6-week weights, plotted against generation number, are shown inFig. 4. Disregarding the change in weight of the GL line, discussed earlier, neither
9-
(CL) 32 34 36 38 40 42 44 46 48 50 52 54
(CLR, CLB) 0 2 4 6 8 10 12 14 16
Number of generations of selection
Fig. 3. Effects of relaxed and reversed selection in large line on number of live youngat birth in first litters.
relaxed nor even reversed selection had any effect on body weight, and bothsublines continued at precisely the old level of the GL line. The CLB line, the oneselected for a reduction of body weight, accumulated a total selection differentialof 15 g. over its eleven generations. When, in its 11th generation, it showed itshighest-ever weight, and it had quite obviously failed to show any response todownward selection, it was discontinued. The CLR line was continued for otherreasons; over its sixteen generations, it has accumulated a negligible positive selec-tion differential of less than 2 g., pointing to the successful randomization of animalschosen as parents.
The heritabilities in the CLR and CLB lines were calculated from the regression ofoffspring on sires, pooled within generations, with the following results:
CLR line: Heritability = - 0-016 ± 0-098CLB line: Heritability = + 0-084 ±0-158

368 R. C. ROBERTS
These estimates obviously do not differ from zero, and confirm the conclusion fromthe back selection that no additive genetic variance remained in the CL line.
The conclusion from this section is clear: there was no additive genetic varianceof body weight remaining in the CL line at the selection limit. The absence ofadditive variance, however, is not quite synonymous with the fixation of all lociaffecting body weight. Overdominance could, hi principle, lead to a situationwhere some loci segregated without showing any additive variance, if heterozygoteswere selected on the basis of weight alone. Gene frequencies would then equilibrateat some intermediate level, and only after an accidental deviation from equilibrium
(CL) 32(CLB.CLR)
34 36 380
402
424
446
468
4810
5012
5214
5416
Number of generations of selection
Fig. 4. Effects of relaxed and reversed selection in large line on mean 6-week weight.
could a response be obtained to reversed selection. Overdominance of this kindcould be simulated by close linkage between pairs of genes; recombination betweenthe members of such a pah* was invoked earlier as a likely explanation of the increasein weight of the CL line. Overdominance of another kind was specifically excludedby the experimental results. This situation demands that natural selection shouldoppose the artificial selection; one homozygote would be rejected because of itseffect on weight, while the other homozygote would tend to be either infertile orinviable, in which case the heterozygote might be fitter than either homozygote,under the conditions of the experiment. But under these conditions, while therewould be no additive variance of overall fitness, there would be additive geneticvariance of body weight. The fact that weight did not change when selection was

The limits to artificial selection for body-weight in the mouse—II 369
relaxed or reversed proves that if there were any overdominant genes, or linkedpairs, still segregating, they caused a negligible amount of variance.
From the fact that all relevant loci were fixed, we can deduce something about thecause of increased fertility which, as mentioned earlier, followed the cessation ofselection for large size. Since no genetic variance in body weight remained, thismust mean that there was a negative environmental correlation between large sizeand fertility. The productivity of large mice will be examined in more detail, andin a more appropriate context, in a future paper.
(iv) Relaxed and reversed selection in the small line
When selection for low body weight was stopped, the effects on the fertility ofmice of the CS line were again beneficial. The number of sterile matings fell, asshown in Fig. 26, the reduction being more noticeable in the back selected (CSB)
N
i_<U4-»_ l
c
E
8-
7-
6-
5-
4-
3-
/y
'/
CS 1CSR
CSBI
N
:aned)
born)
r
V
V
N.-.. • • * .
fi
r1
y- v
V
/t
/ - • • •
\
" \ /
\ •
::••
J ^
\\\/\ r\
>• v *
A
N/ \/ N
j1
11
(CS) 32 34 36 38 40 42 44 46 48 50 52 54 56(CSB) 0 2 4 6 8 10 12 14 16 18 20(CSR) 0 1 3 5 7 9 II 13 15 17 19
Number of generations of selection
Fig. 5. Effects of relaxed and reversed selection in small line on number of live young atbirth in first litters. Number weaned in OS line also shown.
line than in the relaxed (CSR) line. This is slightly different from the large lines,where the ranking of the relaxed and back-selected lines was reversed. As a generalpoint, we may note also that sterility is commoner in large mice than in the corre-sponding small ones. The other criterion of fertility that was examined, namely themean litter size at birth, also showed an improvement in both lines, and again theincrease was more conspicuous in the CSB line than in the CSR Mae, as shown inFig. 5. But for reasons given previously, these litter size differences were notemployed to attach adjustments to body weights.
The effects of the relaxed and reversed selections on body weight are summarizedin Fig. 6. Some violent changes in weight occur in all three lines from time to time;as usual in similar situations, some of the weight changes in different lines are

370 R. C. ROBERTS
synchronous, while others are not. However, despite the fluctuations, a fairly clearpicture emerges. The relaxed line (GSM) gives a hint that it may have increased inweight slightly but there is no indication that the difference between it and itsparental line (CS) has increased at all with time. The average difference betweenthe two lines has been of the order of 1 g. or so for the last ten generations. The linein which the direction of the selection was reversed (CSB) shows quite a clear-cutresult. Progress was made regularly over about thirteen generations of reversedselection, and the mice, weighing by now about 17 to 18 g., are no longer particularlysmall. But for the last eight generations, no further progress has been made,suggesting that probably a limit has now been reached for the reversed selection.
ic
0)0)
1
•IS
ns(U
18-
17-
16-
15-
14-
13-
12-
I I -
10-
CSRCSB
\
\ '*
\ A /"\ \ ! V••••••• t\ /\i \ v ' ••v v-̂V
' ^ «j
i V
II[j
f//
\ 'A / ' • . " • • . .
f\ \ -. / \ /
(CS) 32 34 36 38 40 42 44 46 48 50 52 54 56(CSB)(CSR)
12 14 160 2 4 6 8 100 1 3 5 7 9 I I 13 15 17
Number of generations of selection
18 2019
Fig. 6. Effects of relaxed and reversed selection in small line on mean 6-week weight.
Whether a limit has been reached or not, there is no doubt about the reality of theresponse to reversed selection. This accords with the heritability estimate givenearlier, and proves that, unlike the corresponding large line the additive geneticvariance in the small (GS) line had not been exhausted by thirty-six generations ofselection for small size. For the previous twenty generations or so, the CS line hadreached an apparent limit to downward selection, which indicates that some processhad prevented at least some of the alleles affecting body weight from going tofixation.
The heritability estimated from the offspring-sire regression in the CS line wasgiven earlier as 0-180 + 0-092. Estimates derived in similar fashion from the CSBand GSB lines were the following:
CSR line: Heritability = 0-080±0-078CSB line: Heritability = 0-156 ±0-088
The limits to artificial selection for body-weight in the mouse—II 371
Though the estimate from CSR, on its own, is insignificant, the estimate from CSBagrees well with the one originally obtained from CS, while all three are consistentwithin the limits of their sampling errors.
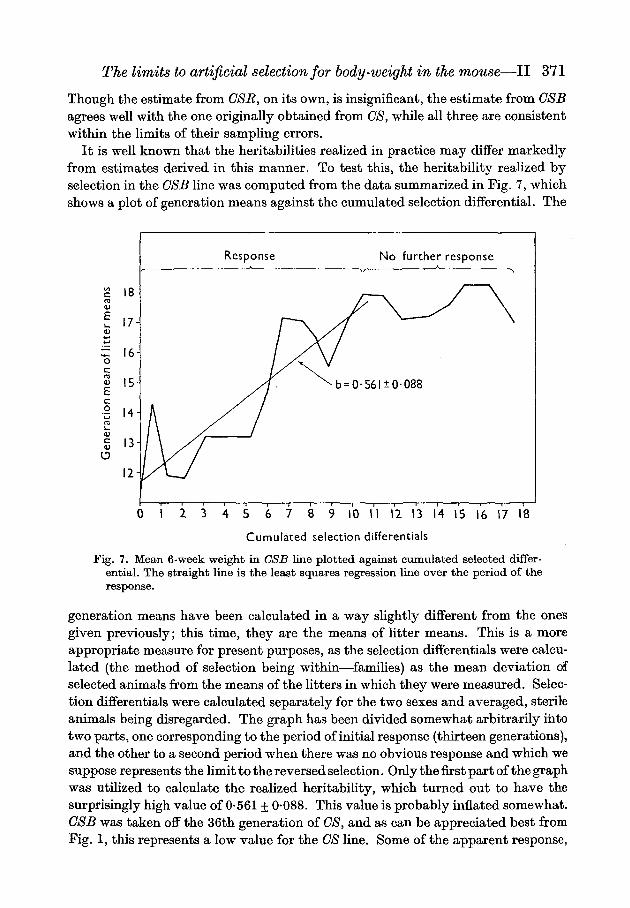
It is well known that the heritabilities realized in practice may differ markedlyfrom estimates derived in this manner. To test this, the heritability realized byselection in the CSB line was computed from the data summarized in Fig. 7, whichshows a plot of generation means against the cumulated selection differential. The
Response No further response
= 0-56l±0088
0 1 2 3 4 5 6 7 8 9 10 II 12 13 14 15 16 17 18
Cumulated selection differentials
Fig. 7. Mean 6-week weight in CSB line plotted against cumulated selected differ-ential. The straight line is the least squares regression line over the period of theresponse.
generation means have been calculated in a way slightly different from the onesgiven previously; this time, they are the means of litter means. This is a moreappropriate measure for present purposes, as the selection differentials were calcu-lated (the method of selection being within—families) as the mean deviation ofselected animals from the means of the litters in which they were measured. Selec-tion differentials were calculated separately for the two sexes and averaged, sterileanimals being disregarded. The graph has been divided somewhat arbitrarily intotwo parts, one corresponding to the period of initial response (thirteen generations),and the other to a second period when there was no obvious response and which wesuppose represents the limit to the reversed selection. Only the first part of the graphwas utilized to calculate the realized heritability, which turned out to have thesurprisingly high value of 0-561 + 0-088. This value is probably inflated somewhat.CSB was taken off the 36th generation of CS, and as can be appreciated best fromFig. 1, this represents a low value for the CS line. Some of the apparent response,

372 R. C. ROBERTS
in absolute terms, of the CSB line may therefore have been due to environmentalincreases that occurred later. These difficulties could have been circumvented, inprinciple, by recording the response of the GSB line as a deviation from OS. Un-fortunately, there was not sufficient contemporaneity between generations in thetwo lines to render this a satisfactory procedure. But if, instead, we take the finalsuperiority of the CSB line over CS to be 3-5 g. (from Fig. 6), and that this had beenachieved by the time the cumulated selection differential was 10-5 g. (from Fig. 7),it now gives us a realized heritability of 33%. Though well within the upperconfidence limit of the original estimate obtained from CS line, it is still high whenwe consider that the additive genetic variance in the CS line, though obviously notexhausted, must surely have been severely depleted.
To what, then, must we ascribe the preservation of so much additive geneticvariance in the CS line ? An obvious factor to test is natural selection, but it becomesvery difficult indeed to test this factor adequately. There are some indications thatnatural selection may oppose the artificial selection; the slight increase in weightnoted when selection was relaxed could be interpreted in this way. It was also notedthat fertility and litter size increased on relaxation, but there is no evidence that thesterility in the CS line has had any adverse effect on the selection process. This can bedetermined from a comparison of the expected and realized selection differentials.The expected selection differential is the mean superiority of selected individuals.The realized selection differential, for a within-family method of selection, is thesuperiority of animals that proved themselves fertile, and therefore had a littermeasured in the next generation. The expected selection differential cumulatedover the last twenty generations of the CS line was only 0-28 g. greater than therealized, or 0-014 g. per generation. This proves conclusively that natural selectiondid not operate through any differential fertility between the smallest mice andthose not quite so small. This, however, takes no account of any natural selectionthat may have operated on viability between conception and the time when theanimals were measured at 6 weeks of age. It is not possible, from the data available,to estimate the selection differential that may have been lost on account of mortality.It is, however, common laboratory experience that the losses are heaviest among thesmallest mice within any one stock; indeed, the phenomenon is by no meansconfined to the mouse alone. Some indication of the extent of the mortality is shownin Fig. 5, which shows both the number born alive and the number weaned in the CSline. The loss between birth and weaning is frequently 20%, and sometimes 40%.This, of course, represents only a part of the total mortality. Much earlier in itshistory (generations 16 to 19), the reproductive performance of the CS line wasexamined by Fowler & Edwards (1960), who reported losses of 28% between ovula-tion and the recording of live births. The performance of the line would certainlynot be expected to have improved since that time. It is therefore probable that fullyhalf of the number conceived die before weaning time. Further losses occur beforeselection at 6 weeks of age. Over its last twenty generations, the CS line showed amortality rate of 11 % between 3 and 6 weeks of age, though the mean weaningweight of the animals that died was only about a tenth of a gramme less than the

The limits to artificial selection for body-weight in the mouse—II 373
weaning weight of the survivors. This apparently slight reduction, however, may mean a much greater reduction of selection differential in 6-week weight; there are complex relationships between the variance components of weights at successive ages, as discussed by Monteiro & Falconer (1966). As the total selection differential obtained was only about 0-6 g. per generation, any tendency for the smaller mice to die in the post-weaning phase may contribute a substantial proportionate effect on the selection differential.
If the failure to respond to artificial selection is to be attributed to the opposing effect of natural selection, acting through differential viability, then the mice selected among the eventual survivors must have a mean weight equal to what the mean weight would have been had all zygotes survived. In other words, the positive deviation of those rejected by artificial selection must have been counterbalanced by the negative deviation of those that failed to survive to 6 weeks. In view of the heavy mortality, and the fact that about a third to a half of the survivors were selected, this seems to be a reasonable postulate.
Though the evidence is only indirect, it seems justifiable to conclude that the limit to selection for small size in the CS line is due to natural selection opposing the artificial selection, and that further the natural selection operates through its effect on viability and not on the fertility of the survivors. The one slight difficulty is that, if the hypothesis of reduced viability is correct, the weights should increase so little when the artificial selection was relaxed. It appears as if the natural selection may not exist at all until body weight is reduced to some particular level. Some support for this idea may be derived from Fig. 1. The initial response to selection in the CS line was rapid and, if not linear, accelerating. But at generation 17 or so, it came to an abrupt halt, and failed to show any further response over the next thirty-five generations. This suggests strongly that the barriers to further progress were encountered at a particular weight, but that none of their effects were felt until that weight was reached. This is strongly reminiscent of F. W. Robertson's (1963) finding in Drosophila, that there is a critical larval weight below which pupation fails to occur. It is not wildly speculative to suppose that some analogous phenomenon may exist during the development and growth of the mouse, and that in the CS line, this critical low weight may have been reached.
4. DISCUSSION
It was seen in the preceding sections that the limit to artificial selection had been reached for very different reasons in the large and small lines. In the large line the additive genetic variance had been effectively exhausted. In the small line, however, a substantial proportion of the remaining variance was additive genetic, and a response to reversed selection was readily obtained.
It was explained earlier that only two of the seven selected lines available for study were subjected to further experimental investigation of the nature of the limits. However, Falconer (1955) reports some short-term studies of a similar kind

374 R . C. ROBERTS
on two of the other five lines. Reversed selection was carried out from the small (NS) line on two separate occasions. The first (from generation 12) was at a time when the line was still responding, but by the second time (from generation 20) the line was approaching its ultimate limit. Over four generations, the response to the reversed selection was unmistakable. The other study described by Falconer was the relaxation of selection from the 24th generation of the large (NF) line, after the line had reached its limit. Over six generations, there was no indication that the relaxation of selection resulted in any separation from the line under continued selection.
Though the evidence just quoted is fragmentary, it does encourage some thought of the possible generality of the phenomena described in this paper, with respect to selection for body weight in the mouse, namely that selection for large size may lead to the exhaustion of the additive genetic variance whereas selection for small size may reach a limit despite the detectable presence of additive variance. If this is so, then the genetic nature of the limits were reversed from the ones that appear to obtain in Drosophila; in this organism, it is selection for small size that seems to lead to fixation. Reeve & F. W. Robertson (1953) described a strain, selected for fifty generations for long wings, in which the additive genetic variance was much greater than in the base population and from which relaxed and reversed selection yielded ready responses. F. W. Robertson (1955) reported a parallel but extended study, using thorax length as his criterion of size. After twenty generations of selection, the small flies failed to yield any response to further selection in either direction. The large flies, on the other hand, reached the limit to further selection after twelve to fifteen generations but quickly returned to the level of the base population on the reversal of selection. Detailed analyses in both of these Drosophila studies indicated to the authors that genetic mechanisms of some complexity operated to preserve heterozygosity in the lines selected for large size.
Another Drosophila study on the long-term effects of selection, this time for a bristle score, was reported by Clayton & A. Robertson (1957). Despite the highly additive genetic basis of the character selected, a limit to the response in either direction was still compatible with a considerable amount of residual genetic variance. In their high lines, the variability was attributable to the continued selection for lethal heterozygotes. In the low lines, the situation appeared to be particularly complex, lethal genes, infertility of extreme females and inversion heterozygotes all being invoked to explain some of the residual genetic variance.
The results so far available on selection limits suggest that models based on the exhaustion of the additive variance may not be sufficiently comprehensive to describe fully many of the situations derived in practice. They therefore underscore the need for more detailed investigations of specific cases, if we are to gain a deeper appreciation of the genetic nature of the limits to artificial selection. This objective may be less remote if organisms showing some diversity of biological organization could be included in such studies, which furthermore ought to include characters cast in different evolutionary moulds, if any generalities are to emerge.

The limits to artificial selection for body-weight in the mouse—II 375
SUMMARY1. The effects of long-continued selection for body weight in two lines of mice, one
large and one small, are described.2. The large line showed a sharp increase in weight after remaining at an apparent
limit for twenty generations. A rare combinational event is suggested as the mostlikely explanation.
3. Reversed and relaxed selection from the large line at the limit failed to yieldany response. This indicates that effectively, the additive genetic variance in thisline had been exhausted.
4. In contrast, the small line at the limit regressed slightly towards the basepopulation when selection was relaxed. Reversed selection yielded a ready responseuntil a new limit was apparently reached. Loci affecting body weight in this linehad therefore not been fixed by selection.
5. Natural selection, operating on viability between conception and the timewhen the selection was made, appears to explain best the lack of fixation in thesmall line.
6. Attention is drawn to the necessity of more experimental work to elucidate thegenetic nature of the limits to artificial selection.
I am much indebted to Dr B. Woolf for the emergency provision of a computer programme tocope with some of the statistical analyses on which this paper is based.
Dr D. S. Falconer kindly suggested many improvements in the presentation of the material.
REFERENCESCLAYTON, G. A. & ROBERTSON, A. (1957). An experimental check on quantitative genetical
theory. II. The long-term effects of selection. J. Genet. 55, 152-170.FALCONER, D. S. (1955). Patterns of response in selection experiments with mice. Cold Spring
Harb. Symp. quant. Biol. 20, 178-196.FALCONER, D. S. (1960). Selection of mice for growth on high and low planes of nutrition.
Genet. Res. 1, 91-113.FALCONER, D. S. (1964). Maternal effects and selection response. In Genetics today. Proc.
Xlthint. Congr. Genet. (The Hague) 1963, Vol. I l l , 763-774.FOWLER, R. E, & EDWARDS, R. G. (1960). The fertility of mice selected for large or small
body size. Genet. Res. 1, 393-407.MONTEIRO, L. S. & FALCONER, D. S. (1966). Compensatory growth and sexual maturity in
mice. Anim. Prod. 8, 179-192.REEVE, E. C. R. & ROBERTSON, F. W. (1953). Studies in quantitative inheritance. II. Analysis
of a strain of Drosophila melanogaster selected for long wings. J. Genet. 51, 276—316.ROBERTS, R. C. (1965). Some contributions of the laboratory mouse to animal breeding
research. Part I. Anim. Breed. Abstr. 33, 339-353.ROBERTS, R. C. (1966). The limits to artificial selection for body weight in the mouse. I. The
limits attained in earlier experiments. Genet. Res. 8, 347-360.ROBERTSON, F. W. (1955). Selection response and properties of genetic variation. Gold Spring
Harb. Symp. quant. Biol. 20, 166-177.ROBERTSON, F. W. (1963). The ecological genetics of growth in Drosophila. 6. The genetic
correlation between the duration of the larval period and body size in relation to larval diet.Genet. Res. 4, 74-92.
THODAY, J. M. & BOAM, T. B. (1961). Regular responses to selection. I. Description ofresponses. Genet. Res. 2, 161-176.
THODAY, J. M., GIBSON, J. B. & SFICKETT, S. G. (1964). Regular responses to selection.II. Recombination and accelerated response. Genet. Res. 5,1—19.
WRIGHT, S. (1965). Factor interaction and linkage in evolution. Proc. R. Soc. B, 162, 80-104.