Embed Size (px)
Citation preview

1
The JEM-EUSO Mission
Proposal for an Italian participation submitted to INFN
September 2010
2
Proposal to INFN for the participation of Italian groups to the
JEM-EUSO Mission on the International Space Station
Participating Istitutions and members and of the JEM-EUSO/ITALY Collaboration University and INFN, Bari R. Bellotti, A. Bruno, F. Cafagna University and INFN, Catania A. Anzalone*, R. Caruso, O. Catalano*, A. Insolia, G. La Rosa*, M.C. Maccarone*, S. Riggi, B. Sacco*, M. Scuderi, A. Segreto*, E. Strazzeri* (*main affiliation INAF/IASF-PA) CNR-INO and INFN, Firenze A. Zuccaro Marchi CNR-IFAC, Firenze G. Castellini INFN, Laboratori Nazionali di Frascati A. Franceschi, A. Marini, G. Modestino, T. Napolitano, M. Ricci, F. Ronga University and INFN, Napoli M. Ambrosio, C. Aramo, D. Campana, R. Carbone, L. Consiglio, D. D’Urso, F. Guarino, F. Isgrò, G. Osteria, M. Paolillo, L. Valore University and INFN, Roma Tor Vergata M. Casolino, M.P. De Pascale, F. Iacoangeli, L. Marcelli, G. Masciantonio, L. Narici, P. Picozza, V. Zaconte University and INFN, Torino M. Bertaina, C. Cassardo, A. Cellino*, S. Coli, A. Dell’Oro*, M. Di Martino*, S.Ferrarese, P. Galeotti, G. Giraudo, A. Rivetti, L. Toscano, P. Vallania**, C. Vigorito (*main affiliation INAF-OATO, ** main affiliation INAF-IFSI )
3
Table of Contents Executive summary…………………………………………………………………………………..4 Chapter 1 Project Description ............................................................................................................... 7
1.1 Introduction.................................................................................................................................. 7 1.2 The JEM-EUSO Science Case.................................................................................................... 7
1.2.1 Towards Particle Astronomy: the identification and understanding of the UHE sources........................................................................................................................... 8 1.2.2 Search for Neutrinos and Gammas: exploring unknown and fundamental physics ......12 1.2.3 Observing the atmosphere .................................................................................................17
1.3 Improvements over ESA-EUSO...............................................................................................22 1.4 Summary of the scientific objectives and related scientific requirements.............................23
Chapter 2 Expected performances ......................................................................................................26 2.1 Acceptance and cumulative exposure ......................................................................................26
2.2 Energy resolution ..................................................................................................................30 2.3 Angular Resolution ...............................................................................................................31 2.4 Xmax Resolution...................................................................................................................31
Chapter 3 Observational Technique ...................................................................................................33 Chapter 4 The JEM-EUSO instrument ...............................................................................................35 Chapter 5 The Mission …………………………………………………………………………..40 Chapter 6 The mechanical structure of the Focal Surface.................................................................44 Chapter 7 Optics...................................................................................................................................50 Chapter 8 Trigger .................................................................................................................................74 Chapter 9 Electronics...........................................................................................................................83
9.1 Data acquisition and handling...................................................................................................83 9.2 Detector ......................................................................................................................................87 9.3 Data budget ................................................................................................................................87 9.4 Communication protocol...........................................................................................................88 9.5 Downlink/Download .................................................................................................................90 9.6 CPU System ...............................................................................................................................91 9.7 Memory board............................................................................................................................94 9.8 Cluster Control Board .............................................................................................................100 9.9 EGSE/Simulator ......................................................................................................................103
Chapter 10 Simulations .....................................................................................................................104 Chapter 11 Mission timeline…………………………………………………………………….105 References ………………………………………………………………………………………...106 Attachments………………………………………………………………………………………..108
4
Executive Summary
JEM-EUSO is an international space mission designed to identify the astrophysical origin and physics nature of ultra high-energy cosmic particles with energies E > 5x10¹⁹ eV. It uses a near-UV 2.5-m diameter telescope with a field of view of 60-degrees to detect the fluorescence and Cherenkov light emitted along the linear track generated by a cosmic particle traversing the Earth’s atmosphere.
Assuming the current (Auger) flux, JEM-EUSO is designed to detect several hundred events above 7x10¹⁹ eV. The energy and arrival direction of each particle will be accurately measured while all-sky is covered and monitored. The high statistics of JEM-EUSO will be used to identify the sources of the highest energy particles, to clarify their origin, to study the differential spectrum of each source, to search for new physics. Furthermore, the large atmospheric target volume (~1012 ton) continuously monitored by JEM-EUSO allows the possibility of neutrino observation as an exploratory objective.
JEM-EUSO could provide a real breakthrough toward the understanding of the astrophysical and physical aspects of the Universe at extreme energies. To fully explore this new view of the Universe, next-generation observatories need to be built that observe the full sky and can reach an order of magnitude increase in exposure. To reach the largest exposures, space observatories are likely to be essential. JEM-EUSO is the first step in space: a pioneer and a pathfinder in the field.
The Japanese Experiment Module (JEM) on the International Space Station (ISS) will host JEM-EUSO. JEM-EUSO is the continuation of studies already started in 1999 with the Extreme Universe Space observatory (EUSO). ESA completed the Phase-A study of the mission concept in 2004 concluding that EUSO was technically ready for Phase-B. However, because of financial problems in ESA and of the Shuttle Columbia’s tragic accident in February 2003 - and the consequent changes in the NASA space program - the start of the Phase-B was postponed for a long time. It was then that Japan, the United States and some involved European teams set-up the "JEM-EUSO Working Group”, for a continuation of the project under the auspices of JAXA, the Japanese Space Agency. The work done on EUSO has been directly imported in JEM-EUSO and since then, extensive simulations, design, and prototype hardware developments have significantly improved the mission’s profile. JEM-EUSO is now continuing the JAXA Phase A/B study in view of launch in 2015.
The JEM-EUSO consortium, led by Japan, brings together scientists from Japan, Europe, US, Russia, Mexico, and Korea. Participating countries in Europe are Germany, France, Italy, Spain, Switzerland, Poland, and Slovakia. Europe is involved in many aspects of the mission, from science and simulations, to hardware developments and calibrations and testing.
In 2010, ESA has evaluated the JEM-EUSO mission giving very positive recommendations through the Fundamental Physics Roadmap Advisory Team (FPR-AT) and the Astronomical Working Group (AWG) (see attachments 1 and 2). As an indirect consequence, JEM-EUSO is now selected for inclusion in the ELIPS (European programme for Life and Physical sciences and applications) research pool approved by the ESA Programme Board for Human Spaceflight, Microgravity and Exploration (see attachment 3). Moreover, in June 2010, the Space Science Unit of the ESF, the European Science Foundation, released a Panel Report giving high ranks to the JEM-EUSO mission (see attachment 4).
Since the first proposals and activities for the ESA-EUSO mission, Italy has played an important role within the international collaboration taking responsibilities in several major items and tasks of the instrument studies, simulations and prototyping.
Presently, the Italian groups are formed by researchers coming from different Universities, INFN sections, CNR and INAF institutes of Bari, Catania, Firenze, Frascati, Napoli, Palermo, Roma Tor Vergata and Torino.

5
Expertise in the field of cosmic rays has been gained by the participation of most of the proposers in experiments and space missions like the Pierre Auger Observatory, KASCADE-Grande and PAMELA. Structures, laboratories and facilities (like test beam dedicated lines in INFN Catania LNS and Frascati LNF) are available, and have been used in the past for testing and calibration of detectors and instruments. Extensive experience of prototype testing at European accelerator beams (CERN, PSI Zurich, KTL Uppsala) has been acquired in the past years as well. A pluriennal activity of contacts and committements to national aerospace industries (like Thales-Alenia, Gavazzi Aerospace, Kaiser etc.) has been carried out for the realization of complex structures, electronic components and data acquisition systems and for their certification and space qualification.
Moreover, INFN experiments in space (like PAMELA, AGILE, FERMI-GLAST, AMS) have always profited of the trans-institutional agreements with ASI, the Italian Space Agency, dealing with the organization and mangement, cost-sharing, contracts with industries and outreach.
The major tasks and responsibilities taken by the italian groups of the JEM-EUSO Collaboration are summarized as follows:
- Optics: design of the basic system of the Fresnel lens. - Electronics: CPU, Data handling, Storage system, Clock, High-speed serial line. - Trigger System: Definition of track recognition algorithms. - Mechanics: Support structure of the Focal Surface; Mechanical Ground Support
Equipment. - Simulations: study and optimization of the detection efficiency and of the resolution
(energy, nuclear, incident angle) of the experiment; event reconstruction. - Tests of radiation hardness and qualification of components. - Beam tests of detector elements and components. - Calibrations with ground equipment (LIDAR, fluorescence systems, UV sources). - Atmosphere monitoring: development of software and algorithms for the calibration of
on-board systems (LIDAR and Infrared Camera) and for the determination of cloud coverage and height from satellite images.
Details of these tasks are described in the following sections of the Proposal.

6
7
Chapter 1 Project Description
1.1 Introduction
The Extreme Universe Space Observatory on the Japanese Experiment Module (JEM-EUSO)
of the International Space Station (ISS) is the first space-based mission to explore the Universe through the study of ultra high-energy cosmic particles. JEM-EUSO will pioneer from space the observation of the extensive air showers (EAS) produced by ultra-high-energy cosmic rays (UHECR) which traverse the Earth's atmosphere. For each event JEM-EUSO will make accurate measurements of the energy, arrival direction and nature of the primary particle using a target volume far greater than what is possible from ground. The corresponding quantitative jump in statistics will clarify the origin (sources) of the ultra-high-energy cosmic rays, the environments traversed during production and propagation, and, possibly, will bring new light onto particle physics mechanisms operating at energies well beyond those achievable by man-made accelerators.
The spectrum of scientific goals of the JEM-EUSO mission includes as exploratory objectives the detection of high-energy gamma rays and neutrinos, the study of cosmic magnetic fields, and tests of relativity and quantum gravity effects at extreme energies. In parallel, all along the mission, JEM-EUSO will systematically survey atmospheric phenomena over the Earth surface.
Firstly proposed in 1999 as a free flyer, in 2001 the EUSO mission concept was selected by ESA as a payload attached to the Columbus module of the ISS. The Phase A study of the mission was successfully completed in 2004. Although EUSO was found technically ready, ESA did not continue the mission mainly due to financial problems and programmatic uncertainties related to the ISS (also due to the Shuttle Columbia’s tragic accident in February 2003).
EUSO was then re-oriented to JEM-EUSO as mission attached to the Japanese Experiment Module/ Exposed Facility (JEM/EF) of ISS. In May 2007, JAXA selected JEM-EUSO as one of the mission candidates of the second phase utilization of JEM/EF to be launched in 2010s. Following the heritage of the ESA EUSO mission studies [1] and the NASA Explorer program studies [2], JEM-EUSO is now completing the Phase-A/B of JAXA’s mission studies [3].
1.2 The JEM-EUSO Science Case
The ultra high energy (UHE) Universe, at energies E greater than 1020 eV, is essentially unexplored. Still, ultra high-energy cosmic rays do exist, with energies that dwarf those achieved in particle accelerators by about eight orders of magnitude in the detector frame (fixed target experiments) and a factor of 30 in the centre of mass frame (collider experiments). After the pioneering detection, back in the 1960s, of the first event above 1020 eV with the Volcano Ranch Array by J. Linsley, UHE particles have been detected by several independent ground-based experiments, including Haverah Park, Yakutsk, AGASA, Fly's Eye, HiRes and recently by the Pierre Auger Observatory, with a maximum energy of ~3.2x10²⁰ eV reported in the literature to date [4].
8
1.2.1 Towards Particle Astronomy: the identification and understanding of the UHE sources
UHE cosmic particles are thought to be coming from extragalactic distances. Propagation in
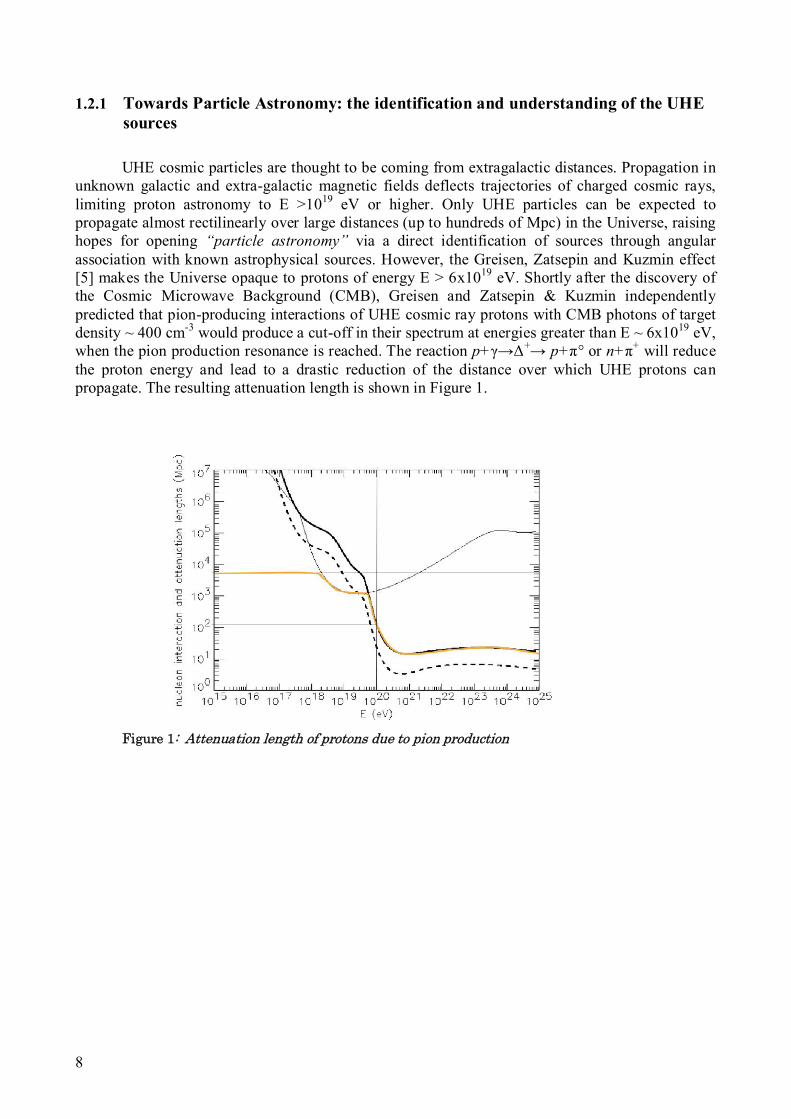
unknown galactic and extra-galactic magnetic fields deflects trajectories of charged cosmic rays, limiting proton astronomy to E >1019 eV or higher. Only UHE particles can be expected to propagate almost rectilinearly over large distances (up to hundreds of Mpc) in the Universe, raising hopes for opening “particle astronomy” via a direct identification of sources through angular association with known astrophysical sources. However, the Greisen, Zatsepin and Kuzmin effect [5] makes the Universe opaque to protons of energy E > 6x10¹⁹ eV. Shortly after the discovery of the Cosmic Microwave Background (CMB), Greisen and Zatsepin & Kuzmin independently predicted that pion-producing interactions of UHE cosmic ray protons with CMB photons of target density ~ 400 cm-3 would produce a cut-off in their spectrum at energies greater than E ~ 6x10¹⁹ eV, when the pion production resonance is reached. The reaction p+γ→Δ+→ p+π° or n+π+ will reduce the proton energy and lead to a drastic reduction of the distance over which UHE protons can propagate. The resulting attenuation length is shown in Figure 1.
Figure 1: Attenuation length of protons due to pion production
9
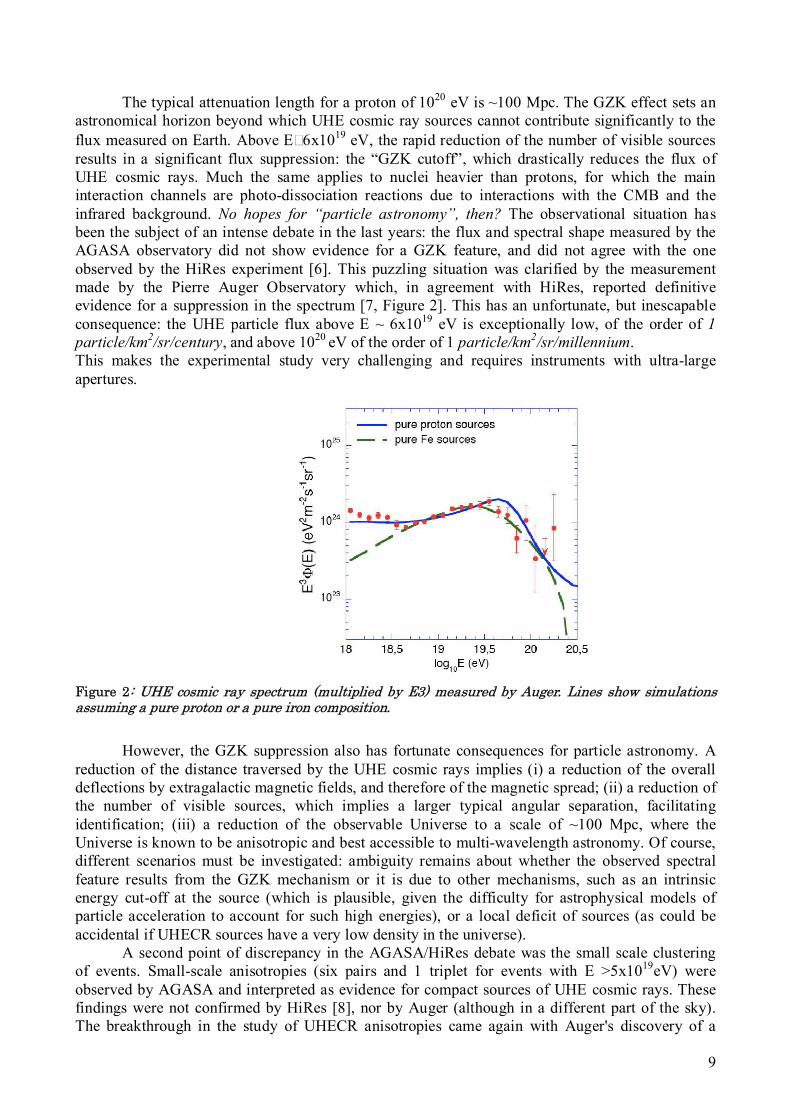
The typical attenuation length for a proton of 1020 eV is ~100 Mpc. The GZK effect sets an astronomical horizon beyond which UHE cosmic ray sources cannot contribute significantly to the flux measured on Earth. Above E 6x10¹⁹ eV, the rapid reduction of the number of visible sources results in a significant flux suppression: the “GZK cutoff”, which drastically reduces the flux of UHE cosmic rays. Much the same applies to nuclei heavier than protons, for which the main interaction channels are photo-dissociation reactions due to interactions with the CMB and the infrared background. No hopes for “particle astronomy”, then? The observational situation has been the subject of an intense debate in the last years: the flux and spectral shape measured by the AGASA observatory did not show evidence for a GZK feature, and did not agree with the one observed by the HiRes experiment [6]. This puzzling situation was clarified by the measurement made by the Pierre Auger Observatory which, in agreement with HiRes, reported definitive evidence for a suppression in the spectrum [7, Figure 2]. This has an unfortunate, but inescapable consequence: the UHE particle flux above E ~ 6x10¹⁹ eV is exceptionally low, of the order of 1 particle/km2/sr/century, and above 1020 eV of the order of 1 particle/km2/sr/millennium. This makes the experimental study very challenging and requires instruments with ultra-large apertures.
Figure 2: UHE cosmic ray spectrum (multiplied by E3) measured by Auger. Lines show simulations assuming a pure proton or a pure iron composition.
However, the GZK suppression also has fortunate consequences for particle astronomy. A
reduction of the distance traversed by the UHE cosmic rays implies (i) a reduction of the overall deflections by extragalactic magnetic fields, and therefore of the magnetic spread; (ii) a reduction of the number of visible sources, which implies a larger typical angular separation, facilitating identification; (iii) a reduction of the observable Universe to a scale of ~100 Mpc, where the Universe is known to be anisotropic and best accessible to multi-wavelength astronomy. Of course, different scenarios must be investigated: ambiguity remains about whether the observed spectral feature results from the GZK mechanism or it is due to other mechanisms, such as an intrinsic energy cut-off at the source (which is plausible, given the difficulty for astrophysical models of particle acceleration to account for such high energies), or a local deficit of sources (as could be accidental if UHECR sources have a very low density in the universe).
A second point of discrepancy in the AGASA/HiRes debate was the small scale clustering of events. Small-scale anisotropies (six pairs and 1 triplet for events with E >5x10¹⁹eV) were observed by AGASA and interpreted as evidence for compact sources of UHE cosmic rays. These findings were not confirmed by HiRes [8], nor by Auger (although in a different part of the sky). The breakthrough in the study of UHECR anisotropies came again with Auger's discovery of a
10
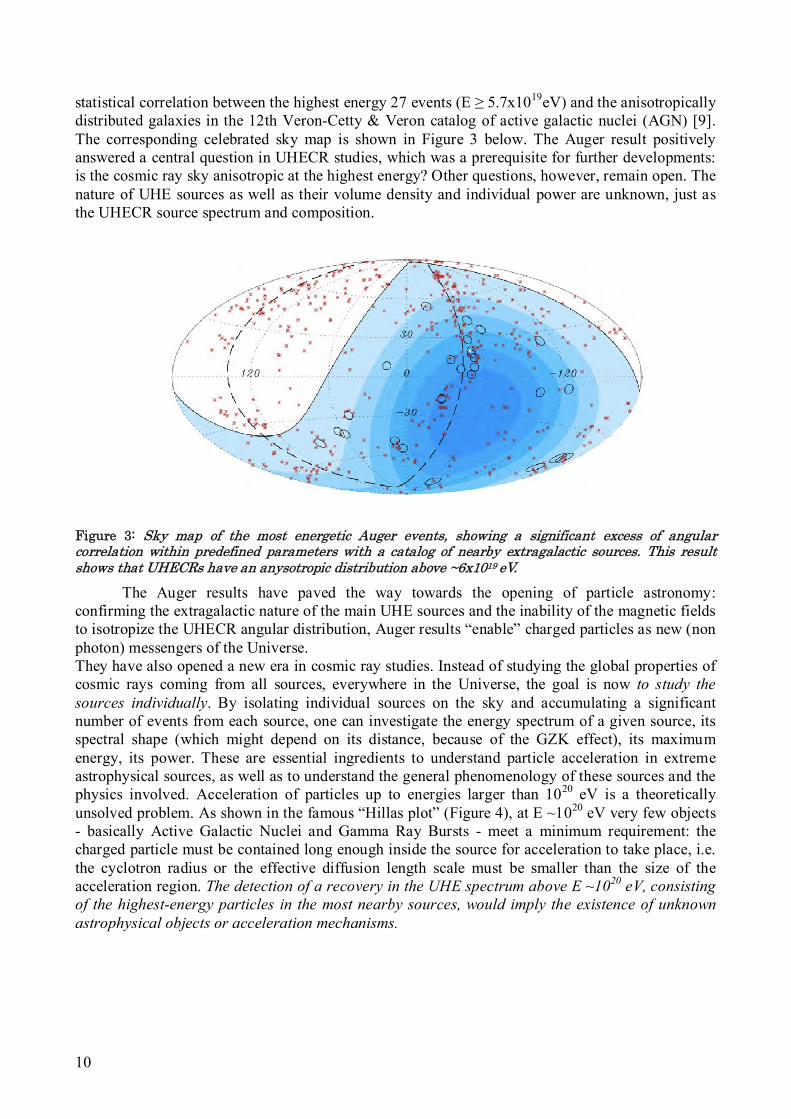
statistical correlation between the highest energy 27 events (E ≥ 5.7x10¹⁹eV) and the anisotropically distributed galaxies in the 12th Veron-Cetty & Veron catalog of active galactic nuclei (AGN) [9]. The corresponding celebrated sky map is shown in Figure 3 below. The Auger result positively answered a central question in UHECR studies, which was a prerequisite for further developments: is the cosmic ray sky anisotropic at the highest energy? Other questions, however, remain open. The nature of UHE sources as well as their volume density and individual power are unknown, just as the UHECR source spectrum and composition.
Figure 3: Sky map of the most energetic Auger events, showing a significant excess of angular correlation within predefined parameters with a catalog of nearby extragalactic sources. This result shows that UHECRs have an anysotropic distribution above ~6x10¹⁹ eV.
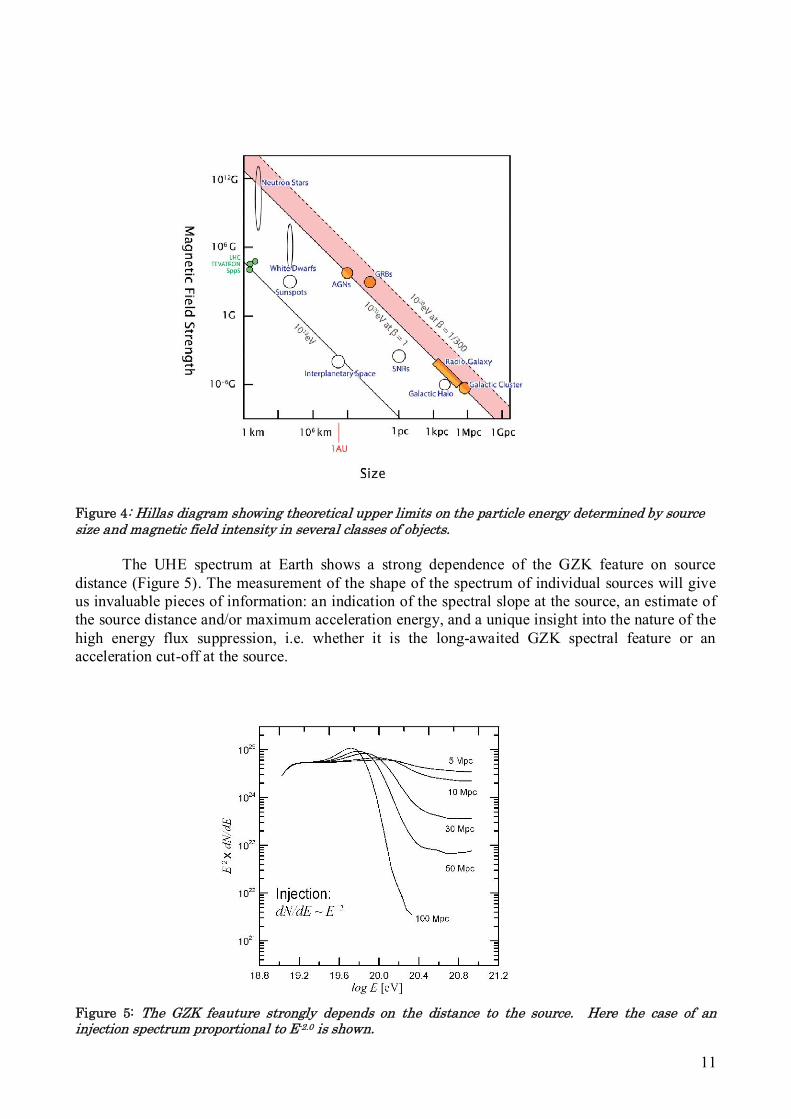
The Auger results have paved the way towards the opening of particle astronomy: confirming the extragalactic nature of the main UHE sources and the inability of the magnetic fields to isotropize the UHECR angular distribution, Auger results “enable” charged particles as new (non photon) messengers of the Universe. They have also opened a new era in cosmic ray studies. Instead of studying the global properties of cosmic rays coming from all sources, everywhere in the Universe, the goal is now to study the sources individually. By isolating individual sources on the sky and accumulating a significant number of events from each source, one can investigate the energy spectrum of a given source, its spectral shape (which might depend on its distance, because of the GZK effect), its maximum energy, its power. These are essential ingredients to understand particle acceleration in extreme astrophysical sources, as well as to understand the general phenomenology of these sources and the physics involved. Acceleration of particles up to energies larger than 1020 eV is a theoretically unsolved problem. As shown in the famous “Hillas plot” (Figure 4), at E ~1020 eV very few objects - basically Active Galactic Nuclei and Gamma Ray Bursts - meet a minimum requirement: the charged particle must be contained long enough inside the source for acceleration to take place, i.e. the cyclotron radius or the effective diffusion length scale must be smaller than the size of the acceleration region. The detection of a recovery in the UHE spectrum above E ~1020 eV, consisting of the highest-energy particles in the most nearby sources, would imply the existence of unknown astrophysical objects or acceleration mechanisms.
11
Figure 4: Hillas diagram showing theoretical upper limits on the particle energy determined by source size and magnetic field intensity in several classes of objects.
The UHE spectrum at Earth shows a strong dependence of the GZK feature on source distance (Figure 5). The measurement of the shape of the spectrum of individual sources will give us invaluable pieces of information: an indication of the spectral slope at the source, an estimate of the source distance and/or maximum acceleration energy, and a unique insight into the nature of the high energy flux suppression, i.e. whether it is the long-awaited GZK spectral feature or an acceleration cut-off at the source.
Figure 5: The GZK feauture strongly depends on the distance to the source. Here the case of an injection spectrum proportional to E-2.0 is shown.
12
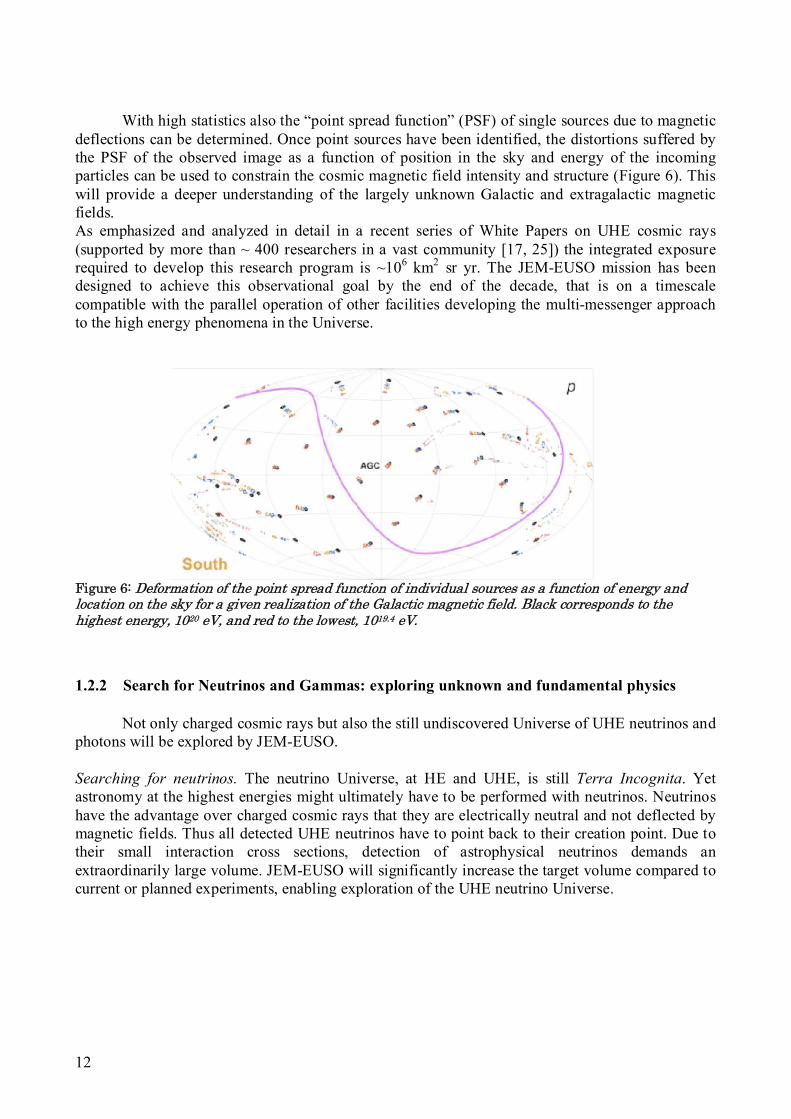
With high statistics also the “point spread function” (PSF) of single sources due to magnetic
deflections can be determined. Once point sources have been identified, the distortions suffered by the PSF of the observed image as a function of position in the sky and energy of the incoming particles can be used to constrain the cosmic magnetic field intensity and structure (Figure 6). This will provide a deeper understanding of the largely unknown Galactic and extragalactic magnetic fields. As emphasized and analyzed in detail in a recent series of White Papers on UHE cosmic rays (supported by more than ~ 400 researchers in a vast community [17, 25]) the integrated exposure required to develop this research program is ~106 km2 sr yr. The JEM-EUSO mission has been designed to achieve this observational goal by the end of the decade, that is on a timescale compatible with the parallel operation of other facilities developing the multi-messenger approach to the high energy phenomena in the Universe.
Figure 6: Deformation of the point spread function of individual sources as a function of energy and location on the sky for a given realization of the Galactic magnetic field. Black corresponds to the highest energy, 1020 eV, and red to the lowest, 1019.4 eV.
1.2.2 Search for Neutrinos and Gammas: exploring unknown and fundamental physics
Not only charged cosmic rays but also the still undiscovered Universe of UHE neutrinos and photons will be explored by JEM-EUSO. Searching for neutrinos. The neutrino Universe, at HE and UHE, is still Terra Incognita. Yet astronomy at the highest energies might ultimately have to be performed with neutrinos. Neutrinos have the advantage over charged cosmic rays that they are electrically neutral and not deflected by magnetic fields. Thus all detected UHE neutrinos have to point back to their creation point. Due to their small interaction cross sections, detection of astrophysical neutrinos demands an extraordinarily large volume. JEM-EUSO will significantly increase the target volume compared to current or planned experiments, enabling exploration of the UHE neutrino Universe.
13
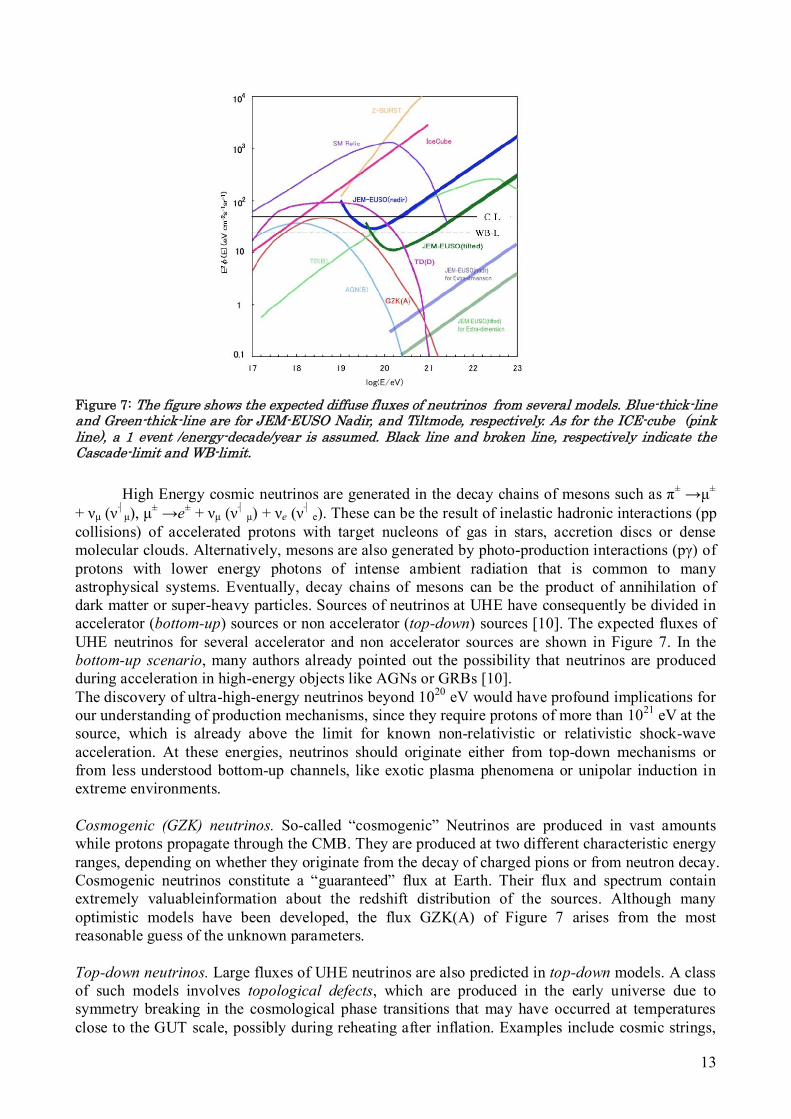
Figure 7: The figure shows the expected diffuse fluxes of neutrinos from several models. Blue-thick-line and Green-thick-line are for JEM-EUSO Nadir, and Tiltmode, respectively. As for the ICE-cube (pink line), a 1 event /energy-decade/year is assumed. Black line and broken line, respectively indicate the Cascade-limit and WB-limit.
High Energy cosmic neutrinos are generated in the decay chains of mesons such as π± →μ± + νμ (ν�μ), μ± →e± + νμ (ν� μ) + νe (ν
� e). These can be the result of inelastic hadronic interactions (pp
collisions) of accelerated protons with target nucleons of gas in stars, accretion discs or dense molecular clouds. Alternatively, mesons are also generated by photo-production interactions (pγ) of protons with lower energy photons of intense ambient radiation that is common to many astrophysical systems. Eventually, decay chains of mesons can be the product of annihilation of dark matter or super-heavy particles. Sources of neutrinos at UHE have consequently be divided in accelerator (bottom-up) sources or non accelerator (top-down) sources [10]. The expected fluxes of UHE neutrinos for several accelerator and non accelerator sources are shown in Figure 7. In the bottom-up scenario, many authors already pointed out the possibility that neutrinos are produced during acceleration in high-energy objects like AGNs or GRBs [10]. The discovery of ultra-high-energy neutrinos beyond 1020 eV would have profound implications for our understanding of production mechanisms, since they require protons of more than 1021 eV at the source, which is already above the limit for known non-relativistic or relativistic shock-wave acceleration. At these energies, neutrinos should originate either from top-down mechanisms or from less understood bottom-up channels, like exotic plasma phenomena or unipolar induction in extreme environments. Cosmogenic (GZK) neutrinos. So-called “cosmogenic” Neutrinos are produced in vast amounts while protons propagate through the CMB. They are produced at two different characteristic energy ranges, depending on whether they originate from the decay of charged pions or from neutron decay. Cosmogenic neutrinos constitute a “guaranteed” flux at Earth. Their flux and spectrum contain extremely valuableinformation about the redshift distribution of the sources. Although many optimistic models have been developed, the flux GZK(A) of Figure 7 arises from the most reasonable guess of the unknown parameters. Top-down neutrinos. Large fluxes of UHE neutrinos are also predicted in top-down models. A class of such models involves topological defects, which are produced in the early universe due to symmetry breaking in the cosmological phase transitions that may have occurred at temperatures close to the GUT scale, possibly during reheating after inflation. Examples include cosmic strings,
14
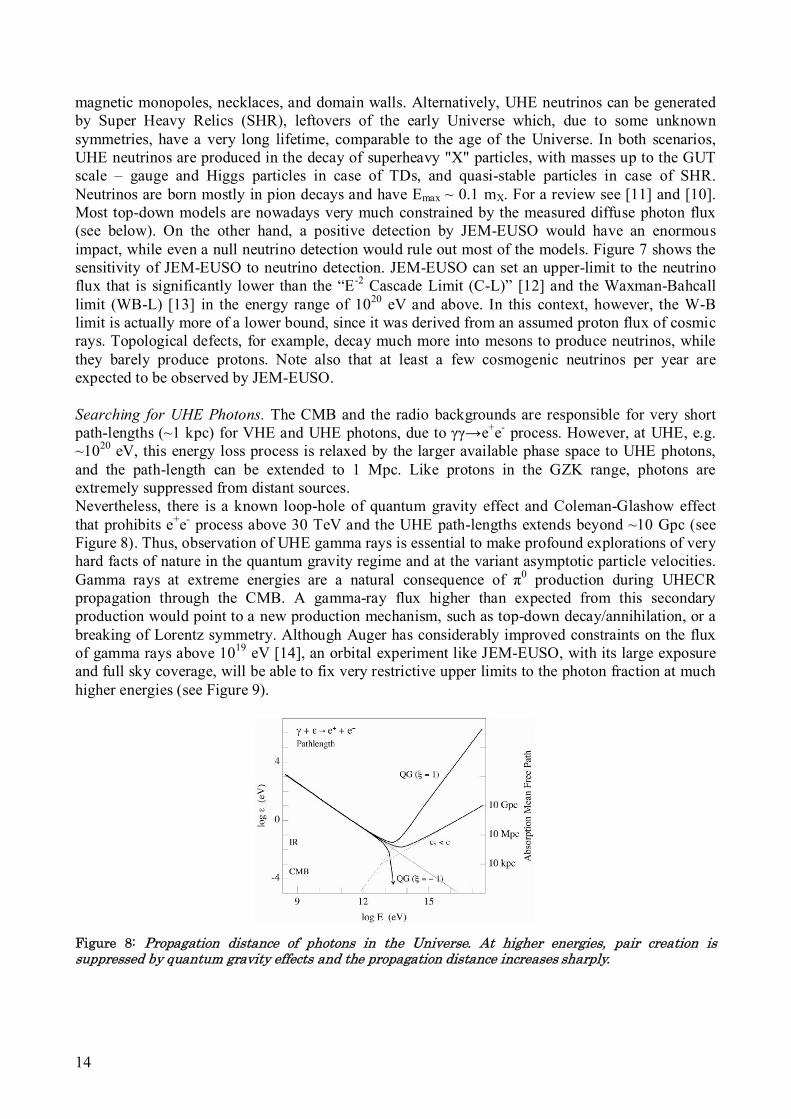
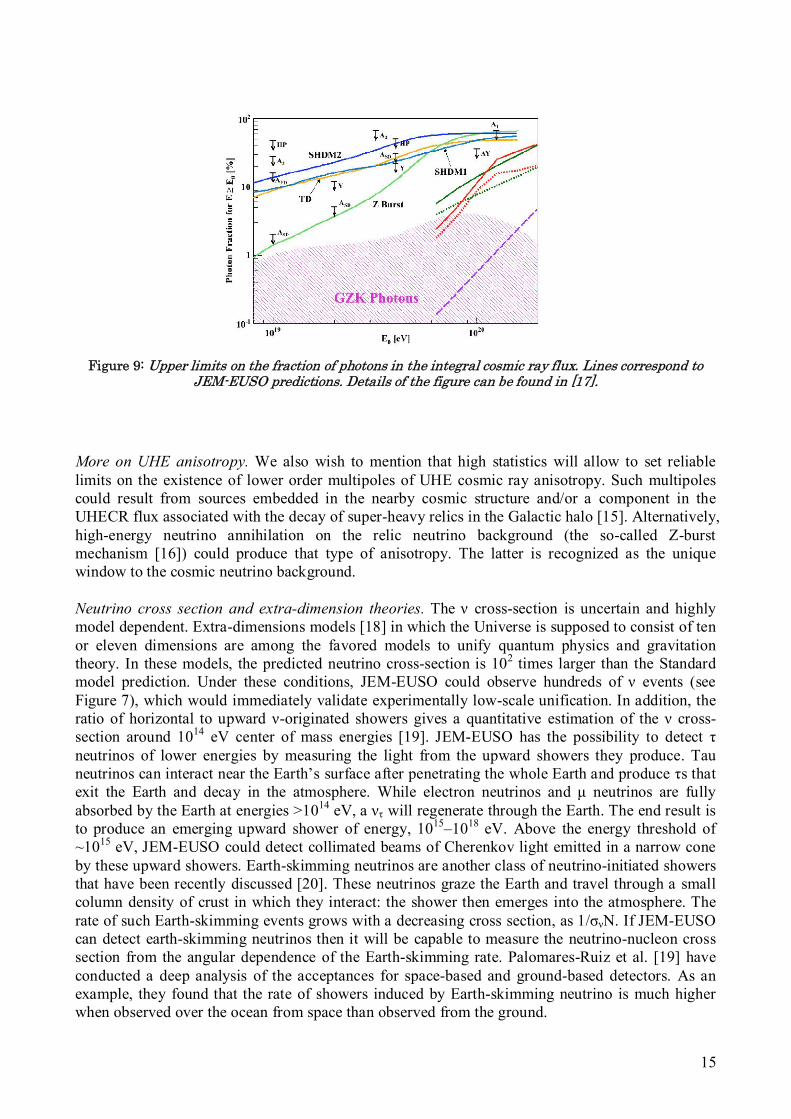
magnetic monopoles, necklaces, and domain walls. Alternatively, UHE neutrinos can be generated by Super Heavy Relics (SHR), leftovers of the early Universe which, due to some unknown symmetries, have a very long lifetime, comparable to the age of the Universe. In both scenarios, UHE neutrinos are produced in the decay of superheavy "X" particles, with masses up to the GUT scale – gauge and Higgs particles in case of TDs, and quasi-stable particles in case of SHR. Neutrinos are born mostly in pion decays and have Emax ~ 0.1 mX. For a review see [11] and [10]. Most top-down models are nowadays very much constrained by the measured diffuse photon flux (see below). On the other hand, a positive detection by JEM-EUSO would have an enormous impact, while even a null neutrino detection would rule out most of the models. Figure 7 shows the sensitivity of JEM-EUSO to neutrino detection. JEM-EUSO can set an upper-limit to the neutrino flux that is significantly lower than the “E-2 Cascade Limit (C-L)” [12] and the Waxman-Bahcall limit (WB-L) [13] in the energy range of 1020 eV and above. In this context, however, the W-B limit is actually more of a lower bound, since it was derived from an assumed proton flux of cosmic rays. Topological defects, for example, decay much more into mesons to produce neutrinos, while they barely produce protons. Note also that at least a few cosmogenic neutrinos per year are expected to be observed by JEM-EUSO. Searching for UHE Photons. The CMB and the radio backgrounds are responsible for very short path-lengths (~1 kpc) for VHE and UHE photons, due to γγ→e+e- process. However, at UHE, e.g. ~1020 eV, this energy loss process is relaxed by the larger available phase space to UHE photons, and the path-length can be extended to 1 Mpc. Like protons in the GZK range, photons are extremely suppressed from distant sources. Nevertheless, there is a known loop-hole of quantum gravity effect and Coleman-Glashow effect that prohibits e+e- process above 30 TeV and the UHE path-lengths extends beyond ~10 Gpc (see Figure 8). Thus, observation of UHE gamma rays is essential to make profound explorations of very hard facts of nature in the quantum gravity regime and at the variant asymptotic particle velocities. Gamma rays at extreme energies are a natural consequence of π0 production during UHECR propagation through the CMB. A gamma-ray flux higher than expected from this secondary production would point to a new production mechanism, such as top-down decay/annihilation, or a breaking of Lorentz symmetry. Although Auger has considerably improved constraints on the flux of gamma rays above 1019 eV [14], an orbital experiment like JEM-EUSO, with its large exposure and full sky coverage, will be able to fix very restrictive upper limits to the photon fraction at much higher energies (see Figure 9).
Figure 8: Propagation distance of photons in the Universe. At higher energies, pair creation is suppressed by quantum gravity effects and the propagation distance increases sharply.
15
Figure 9: Upper limits on the fraction of photons in the integral cosmic ray flux. Lines correspond to JEM-EUSO predictions. Details of the figure can be found in [17].
More on UHE anisotropy. We also wish to mention that high statistics will allow to set reliable limits on the existence of lower order multipoles of UHE cosmic ray anisotropy. Such multipoles could result from sources embedded in the nearby cosmic structure and/or a component in the UHECR flux associated with the decay of super-heavy relics in the Galactic halo [15]. Alternatively, high-energy neutrino annihilation on the relic neutrino background (the so-called Z-burst mechanism [16]) could produce that type of anisotropy. The latter is recognized as the unique window to the cosmic neutrino background. Neutrino cross section and extra-dimension theories. The ν cross-section is uncertain and highly model dependent. Extra-dimensions models [18] in which the Universe is supposed to consist of ten or eleven dimensions are among the favored models to unify quantum physics and gravitation theory. In these models, the predicted neutrino cross-section is 102 times larger than the Standard model prediction. Under these conditions, JEM-EUSO could observe hundreds of ν events (see Figure 7), which would immediately validate experimentally low-scale unification. In addition, the ratio of horizontal to upward ν-originated showers gives a quantitative estimation of the ν cross-section around 1014 eV center of mass energies [19]. JEM-EUSO has the possibility to detect τ neutrinos of lower energies by measuring the light from the upward showers they produce. Tau neutrinos can interact near the Earth’s surface after penetrating the whole Earth and produce τs that exit the Earth and decay in the atmosphere. While electron neutrinos and μ neutrinos are fully absorbed by the Earth at energies >1014 eV, a ντ will regenerate through the Earth. The end result is to produce an emerging upward shower of energy, 1015–1018 eV. Above the energy threshold of ~1015 eV, JEM-EUSO could detect collimated beams of Cherenkov light emitted in a narrow cone by these upward showers. Earth-skimming neutrinos are another class of neutrino-initiated showers that have been recently discussed [20]. These neutrinos graze the Earth and travel through a small column density of crust in which they interact: the shower then emerges into the atmosphere. The rate of such Earth-skimming events grows with a decreasing cross section, as 1/σνN. If JEM-EUSO can detect earth-skimming neutrinos then it will be capable to measure the neutrino-nucleon cross section from the angular dependence of the Earth-skimming rate. Palomares-Ruiz et al. [19] have conducted a deep analysis of the acceptances for space-based and ground-based detectors. As an example, they found that the rate of showers induced by Earth-skimming neutrino is much higher when observed over the ocean from space than observed from the ground.

16
Lorentz invariance violation. Arguably, there is an underlying fundamental theory that unifies gravity and particle physics at the Planck scale. The Standard Model, coupled to general relativity, is possibly its effective low-energy limit. This underlying theory may include Lorentz violation [21]. If one takes the Standard Model and includes appropriate terms that involve operators for Lorentz invariance violation [22], the result is the Standard-Model Extension (SME). The SME provides the most general observer independent field theoretical framework for investigations of Lorentz violation. The SME Lagrangian, by definition, contains all Lorentz-violating interaction terms that can be written as observer scalars and that involve particle fields in the Standard Model and gravitational fields in a generalized theory of gravity [23]. Spacebased experiments improve existing upper limits by up to six orders of magnitude. In particular, a stringent test of relativity could be made from high multiplicity sources at known distances, for which the UHECR energy spectrum could be measured due to the large exposure of a space detector. If the GZK steepening functions consistently deviate at some directions in the sky, external fields, like vector fields, might be emerging which are not unidirectionally Lorentz Invariant. On the other hand, the proof of non-vector fields would verify Lorentz Invariance at extreme high energy [24].
17
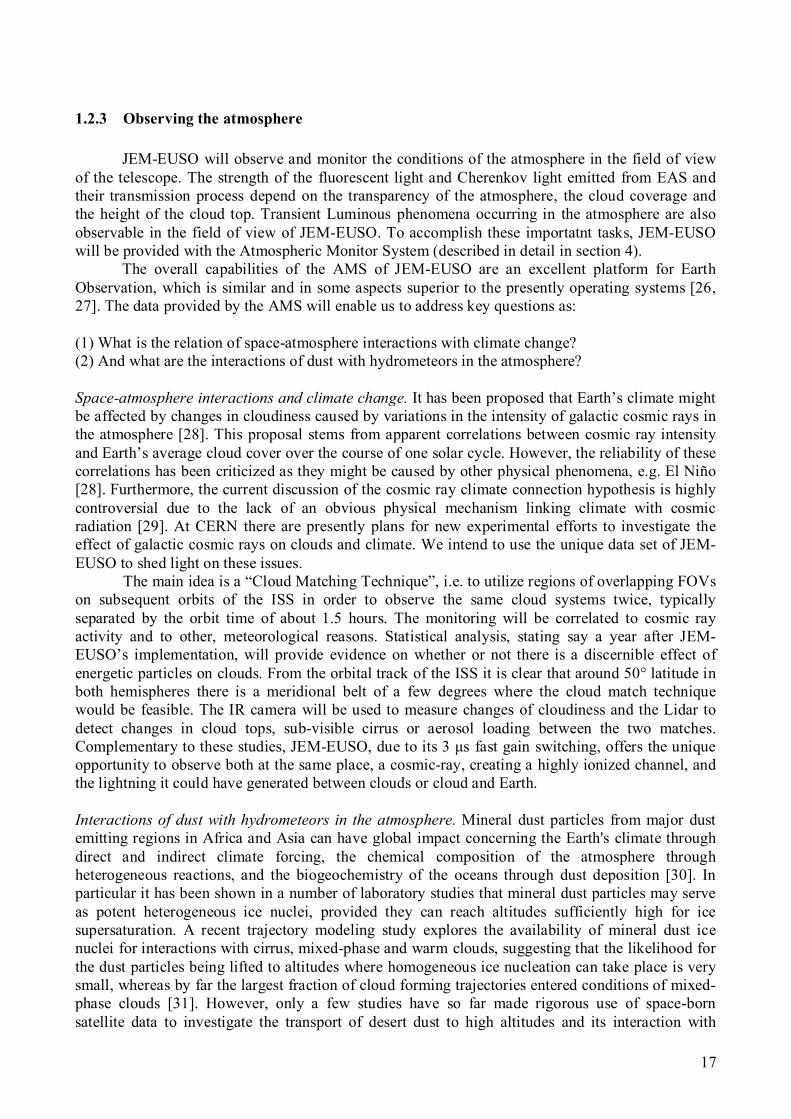
1.2.3 Observing the atmosphere
JEM-EUSO will observe and monitor the conditions of the atmosphere in the field of view
of the telescope. The strength of the fluorescent light and Cherenkov light emitted from EAS and their transmission process depend on the transparency of the atmosphere, the cloud coverage and the height of the cloud top. Transient Luminous phenomena occurring in the atmosphere are also observable in the field of view of JEM-EUSO. To accomplish these importatnt tasks, JEM-EUSO will be provided with the Atmospheric Monitor System (described in detail in section 4).
The overall capabilities of the AMS of JEM-EUSO are an excellent platform for Earth Observation, which is similar and in some aspects superior to the presently operating systems [26, 27]. The data provided by the AMS will enable us to address key questions as: (1) What is the relation of space-atmosphere interactions with climate change? (2) And what are the interactions of dust with hydrometeors in the atmosphere? Space-atmosphere interactions and climate change. It has been proposed that Earth’s climate might be affected by changes in cloudiness caused by variations in the intensity of galactic cosmic rays in the atmosphere [28]. This proposal stems from apparent correlations between cosmic ray intensity and Earth’s average cloud cover over the course of one solar cycle. However, the reliability of these correlations has been criticized as they might be caused by other physical phenomena, e.g. El Niño [28]. Furthermore, the current discussion of the cosmic ray climate connection hypothesis is highly controversial due to the lack of an obvious physical mechanism linking climate with cosmic radiation [29]. At CERN there are presently plans for new experimental efforts to investigate the effect of galactic cosmic rays on clouds and climate. We intend to use the unique data set of JEM-EUSO to shed light on these issues.
The main idea is a “Cloud Matching Technique”, i.e. to utilize regions of overlapping FOVs on subsequent orbits of the ISS in order to observe the same cloud systems twice, typically separated by the orbit time of about 1.5 hours. The monitoring will be correlated to cosmic ray activity and to other, meteorological reasons. Statistical analysis, stating say a year after JEM-EUSO’s implementation, will provide evidence on whether or not there is a discernible effect of energetic particles on clouds. From the orbital track of the ISS it is clear that around 50° latitude in both hemispheres there is a meridional belt of a few degrees where the cloud match technique would be feasible. The IR camera will be used to measure changes of cloudiness and the Lidar to detect changes in cloud tops, sub-visible cirrus or aerosol loading between the two matches. Complementary to these studies, JEM-EUSO, due to its 3 μs fast gain switching, offers the unique opportunity to observe both at the same place, a cosmic-ray, creating a highly ionized channel, and the lightning it could have generated between clouds or cloud and Earth. Interactions of dust with hydrometeors in the atmosphere. Mineral dust particles from major dust emitting regions in Africa and Asia can have global impact concerning the Earth's climate through direct and indirect climate forcing, the chemical composition of the atmosphere through heterogeneous reactions, and the biogeochemistry of the oceans through dust deposition [30]. In particular it has been shown in a number of laboratory studies that mineral dust particles may serve as potent heterogeneous ice nuclei, provided they can reach altitudes sufficiently high for ice supersaturation. A recent trajectory modeling study explores the availability of mineral dust ice nuclei for interactions with cirrus, mixed-phase and warm clouds, suggesting that the likelihood for the dust particles being lifted to altitudes where homogeneous ice nucleation can take place is very small, whereas by far the largest fraction of cloud forming trajectories entered conditions of mixed-phase clouds [31]. However, only a few studies have so far made rigorous use of space-born satellite data to investigate the transport of desert dust to high altitudes and its interaction with
18
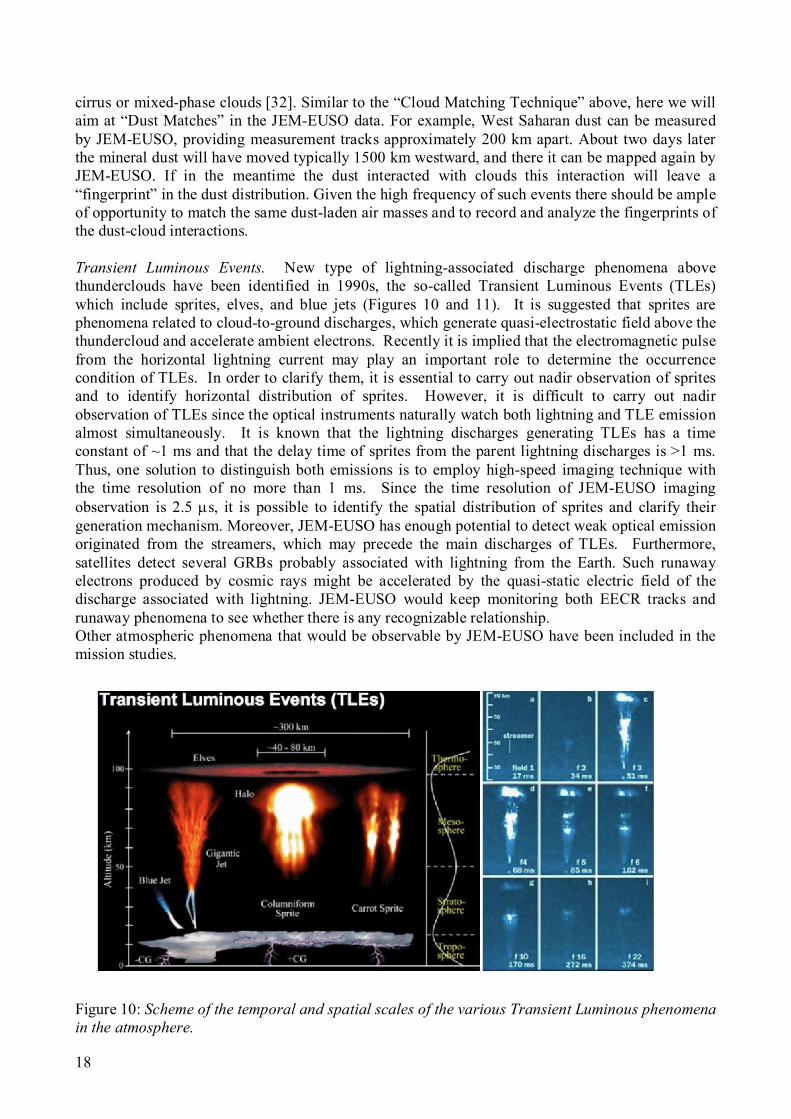
cirrus or mixed-phase clouds [32]. Similar to the “Cloud Matching Technique” above, here we will aim at “Dust Matches” in the JEM-EUSO data. For example, West Saharan dust can be measured by JEM-EUSO, providing measurement tracks approximately 200 km apart. About two days later the mineral dust will have moved typically 1500 km westward, and there it can be mapped again by JEM-EUSO. If in the meantime the dust interacted with clouds this interaction will leave a “fingerprint” in the dust distribution. Given the high frequency of such events there should be ample of opportunity to match the same dust-laden air masses and to record and analyze the fingerprints of the dust-cloud interactions. Transient Luminous Events. New type of lightning-associated discharge phenomena above thunderclouds have been identified in 1990s, the so-called Transient Luminous Events (TLEs) which include sprites, elves, and blue jets (Figures 10 and 11). It is suggested that sprites are phenomena related to cloud-to-ground discharges, which generate quasi-electrostatic field above the thundercloud and accelerate ambient electrons. Recently it is implied that the electromagnetic pulse from the horizontal lightning current may play an important role to determine the occurrence condition of TLEs. In order to clarify them, it is essential to carry out nadir observation of sprites and to identify horizontal distribution of sprites. However, it is difficult to carry out nadir observation of TLEs since the optical instruments naturally watch both lightning and TLE emission almost simultaneously. It is known that the lightning discharges generating TLEs has a time constant of ~1 ms and that the delay time of sprites from the parent lightning discharges is >1 ms. Thus, one solution to distinguish both emissions is to employ high-speed imaging technique with the time resolution of no more than 1 ms. Since the time resolution of JEM-EUSO imaging observation is 2.5 s, it is possible to identify the spatial distribution of sprites and clarify their generation mechanism. Moreover, JEM-EUSO has enough potential to detect weak optical emission originated from the streamers, which may precede the main discharges of TLEs. Furthermore, satellites detect several GRBs probably associated with lightning from the Earth. Such runaway electrons produced by cosmic rays might be accelerated by the quasi-static electric field of the discharge associated with lightning. JEM-EUSO would keep monitoring both EECR tracks and runaway phenomena to see whether there is any recognizable relationship. Other atmospheric phenomena that would be observable by JEM-EUSO have been included in the mission studies.
Figure 10: Scheme of the temporal and spatial scales of the various Transient Luminous phenomena in the atmosphere.
19
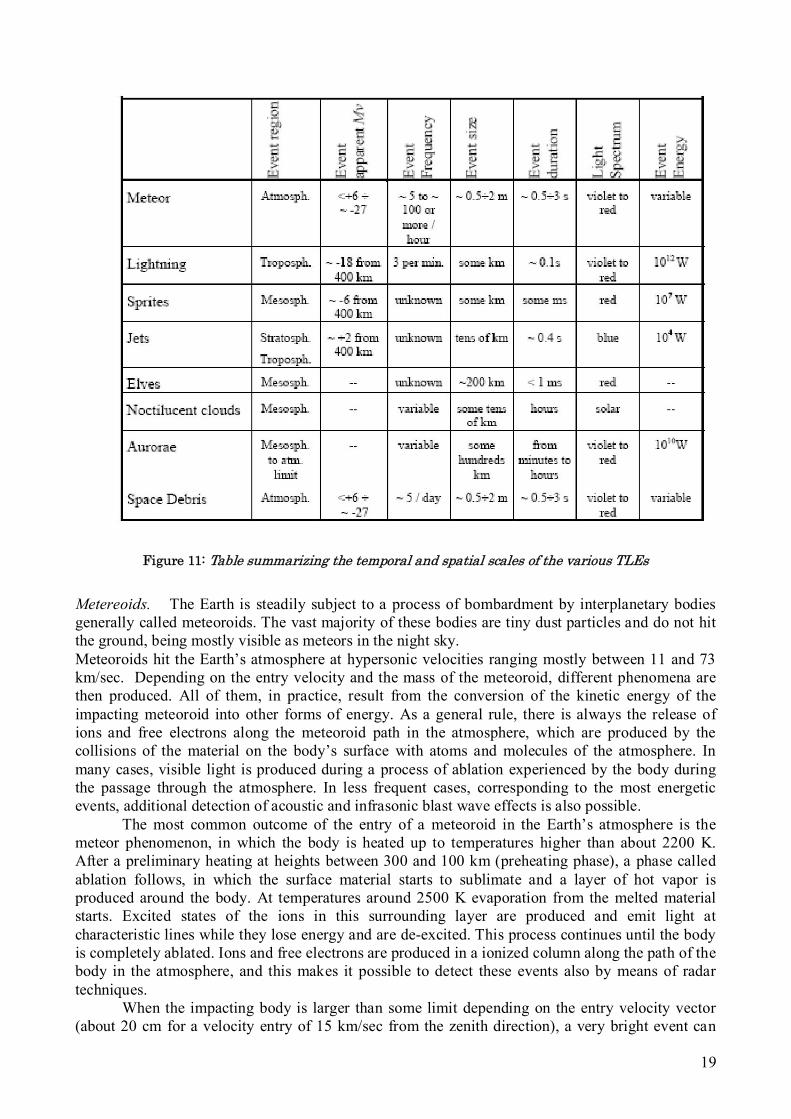
Figure 11: Table summarizing the temporal and spatial scales of the various TLEs
Metereoids. The Earth is steadily subject to a process of bombardment by interplanetary bodies generally called meteoroids. The vast majority of these bodies are tiny dust particles and do not hit the ground, being mostly visible as meteors in the night sky. Meteoroids hit the Earth’s atmosphere at hypersonic velocities ranging mostly between 11 and 73 km/sec. Depending on the entry velocity and the mass of the meteoroid, different phenomena are then produced. All of them, in practice, result from the conversion of the kinetic energy of the impacting meteoroid into other forms of energy. As a general rule, there is always the release of ions and free electrons along the meteoroid path in the atmosphere, which are produced by the collisions of the material on the body’s surface with atoms and molecules of the atmosphere. In many cases, visible light is produced during a process of ablation experienced by the body during the passage through the atmosphere. In less frequent cases, corresponding to the most energetic events, additional detection of acoustic and infrasonic blast wave effects is also possible.
The most common outcome of the entry of a meteoroid in the Earth’s atmosphere is the meteor phenomenon, in which the body is heated up to temperatures higher than about 2200 K. After a preliminary heating at heights between 300 and 100 km (preheating phase), a phase called ablation follows, in which the surface material starts to sublimate and a layer of hot vapor is produced around the body. At temperatures around 2500 K evaporation from the melted material starts. Excited states of the ions in this surrounding layer are produced and emit light at characteristic lines while they lose energy and are de-excited. This process continues until the body is completely ablated. Ions and free electrons are produced in a ionized column along the path of the body in the atmosphere, and this makes it possible to detect these events also by means of radar techniques.
When the impacting body is larger than some limit depending on the entry velocity vector (about 20 cm for a velocity entry of 15 km/sec from the zenith direction), a very bright event can
20
occur. When the apparent brightness of the meteor reaches a magnitude around –8 or brighter at visible wavelengths, it is called meteoric fireball. The term bolide, or fireball, is also generally used for events reaching magnitude –14 or brighter. When the magnitude reaches –17, the term super-bolide is also used. Fireballs are produced by bodies with sizes mostly within the 10-100 meters range. Apart from the very rare and hugely destructive explosive impacts producing craters on the Earth’s surface and regional or global devastations, bright meteors and fireballs represent the most spectacular events of impact with extraterrestrial material. Since several decades a big effort has been made in order to be able to detect and record the maximum possible number of these events, with the general purpose of being able to determine the three-dimensional entry velocity vector of the bodies, in order to derive their pristine heliocentric orbits, and to determine the path in the atmosphere in order to determine also the likely regions of fall of possible associated meteorites. The derivation of the inventory and size distribution of the bodies which can intersect the orbit of the Earth with a non-zero probability of collision with our planet, has been since a long time a high priority task of modern Planetary Science. Apart from obvious considerations about mitigation of the impact hazard for the terrestrial biosphere, this is also a challenging theoretical problem, with important implications for our understanding of the orbital and physical evolution of the minor bodies of our Solar System.
Several mechanisms have been discovered and analyzed in recent years to explain a steady influx of bodies from different regions of the Solar System to the zone of the terrestrial planets. Several unstable regions in the space of the orbital elements have been identified in the asteroid main belt, which can lead bodies to be decoupled from the belt and to evolve into Near Earth Object (NEO) orbits. Both collisional mechanisms and dynamical non-gravitational mechanisms (mainly the so-called Yarkovsky effect, due to the thermal irradiation from the surface) can be responsible of a steady injection of main belt asteroids into these unstable orbits. It should be noted that the effectiveness of the different supply mechanisms is eminently size dependent. This is trivially true in the case of the Yarkovsky effect, since the acceleration induced by the thermal radiation force becomes progressively less relevant for increasing mass of the object, but also the average collisional lifetimes of the possible parent bodies in the main belt in the case of direct collisional injection of fragments, are size dependent. A better knowledge of the NEO inventory and size distribution, therefore, would have important implications for our understanding of the inventory and size distribution of the possible parent populations (main belt asteroids and comets) down to sizes which are practically not observable by means of remote sensing, as well as on the effectiveness of the supply and transport mechanisms in different size ranges. A major problem, however, is the still scarce knowledge of the size distribution of NEOs at small sizes. The known NEO population can be considered essentially complete above 1 km, and includes only a minor fraction of the existing objects. Then, it would be very useful to obtain more information on the bodies smaller than the current completeness limit. In particular, the size range between 10 and 100 meters corresponds to the least known objects of the Solar System. There is practically no hope to detect objects in this size range but in the case they approach very much the Earth. In particular, with current technology these bodies can be efficiently detected only when they actually collide with the Earth. These events typically occur at a sufficiently high rate to justify a systematic observational effort. The observations of bright meteors and fireballs can thus provide crucial information on the inventory and size distribution of the NEO population in a very important interval of sizes, and can at the same time be used to derive data on the physical properties of these bodies, and on their likely origin. In particular, it may be very interesting to determine the relative ratio between the asteroidal and the cometary components of the NEO population at these sizes.
About 75% of the meteor events are sporadic, whereas one fourth of the observed meteors are genetically associated in a number of meteoroid streams producing meteor showers in well defined epochs of the year. This is due to the fact that each meteoroid stream is formed by bodies having very similar orbits, likely produced by low velocity ejection from a common parent body. Many known meteor showers (like the Lyrids and the Perseids to mention only a few of them) are
21
known to be associated with a parent comet. In the case of the Geminids, the parent body is an object previously classified as an asteroid, 3200 Phaeton.
Large networks of ground-based observing stations are needed for visible detection of the events, but they are affected by a number of problems. First, the covered sky area is in any case forcedly limited in practice (for instance, the potentially conceivable development of an all-sky system would face the problem that most of the Earth’s surface is covered by oceans). Second, these observations can be made only during the night or around dawn. Third, the efficiency is affected by the varying weather conditions. Moreover, in spite of the fact that large observing networks had among their main goals also the capability of predicting the likely location of fall of meteorites, the results have been so far largely insufficient.
On the other hand, the observable phenomena exhibited by fireball events are best detectable from space-based facilities. This includes both observations of the light spike at visible wavelengths, and the thermal infrared radiation produced by the heating of the meteoroid material all along its path in the atmosphere. Infrared observations are possible also from the ground, but it is known that space-based detectors work better and more efficiently in the infrared. This is trivially true when sources above the atmosphere are concerned, but also in cases like this in which the infrared emission takes place in the high layers of the atmosphere, space-base detectors suffer in any case from much reduced atmospheric extinction at these wavelengths with respect to ground-based facilities. Moreover, fireball events include also phases during which the meteoroid material is heated up to very high temperatures, and emits detectable radiation also in the ultraviolet spectral region. The emission of the ionized material along the meteoroid track is expected to include spectral lines in the UV spectral region; therefore space-based sensors optimized to work at these wavelengths can be very useful to record these events.
Space-based sensors have also a number of other obvious advantages with respect to ground-based observing stations. They can cover wide areas of sky, and, being located above the atmosphere, a satellite is not limited by weather conditions, and can operate in principle also in day time.
Given the very big number of satellites currently in orbit, it can seem strange that fireball detections have not been so far very frequently reported. The simple reason is that current satellites are dedicated to other purposes, and it is not usual that meteoric events are detected and recorded. Most satellites currently equipped with sensors useful for fireball detections have military purposes. Unless the operators have some reason to record an observed event, this is discarded and no data remain of it. Even recorded events, moreover, can be not made public, being included in the records of classified activities. Moreover, even in cases of satellites devoted to civilian activities, like systematic monitoring of large areas of the Earth for various purposes, what happens is that generally the data pipeline has been conceived to record data having much different time scales with respect to meteoric events. For instance, satellites aimed at monitoring the long-time evolution of some echological environments, are not supposed to record events with typical durations of a couple of seconds. As a consequence, data showing sudden changes like meteors or fireballs are automatically discarded as a source of high frequency noise.
Meteor and fireball observations are important to derive important physical information on the population of meteoroids orbiting in the vicinity of the Earth. After decades of excellent ground-based activities, which have been able to obtain the best conceivable results based on ground-based detectors, the times seem now mature to plan the development of a new generation of dedicated, space-based observing facilities. Apart from the purely scientific issues, a space-based system for fireball surveillance could have also some more immediately practical purposes. It is known, in fact, that the clouds of dust released by these events can be a hazard for aircraft, and moreover the impact of a sufficiently big meteorite in an ocean or sea could produce a dangerous Tsunami wave. For these and other reasons a prompt detection of these events could be of the highest importance also for mitigation of possible danger for human beings in particular circumstances.

22
1.3 Improvements over ESA-EUSO
Compared to the former project, EUSO, which with similar scientific and technical objectives and a comparable operation mode, had successfully completed Phase A of the ESA in 2004, a number of improvements have been made. The most significant are: Improvement of SNR through: • PMTs quantum efficiency increased, and therefore a higher collection efficiency of the light. • Greater lens transparency, through the use of the CYTOP material instead of PMMA. • Lower light dispersion through the use of CYTOP, whose index varies very little inside the wavelength badwidth used: this reduces the "point spread function" of the lens system and therefore improves the signal / noise on the pixels of the focal surface. All this helps to reduce the energy threshold of the instrument. In addition, JEM-EUSO benefits from the following improvements: • 25% more power (1 kW instead of 800 W), which allows more flexibility on electronics and on board data acquisition system. • The use of a FPGA/DSP based computer on board, allowing for an online recognition of the shape of the tracks, and therefore an intelligent trigger: the ability to use a more sophisticated algorithm for the trigger is a significant improvement, increasing the detection efficiency. • A gain of 50% over the allowed weight (2 tons). • An infrared camera to measure the temperature and thus the height of clouds, which allows to know the depth of development of showers in the case of clouds and thus to improve the energy resolution. • A simpler LIDAR, lighter, more mobile and using less energy for the survey of the region of atmosphere where a shower was developed, immediately after its detection. • A measurement of the background noise prior to the JEM-EUSO mission by the Russian satellite Tatiana (who has already flown) and the TUS instrument, funded by the Russians to be launched in 2011, which will operate similarly to JEM-EUSO, with some of its PMTs (too small to do physics, but ideal for measuring noise in real conditions). • access to a powerful source of cooling provided by the JEM platform (if necessary).
Finally, JEM-EUSO will be able to operate in inclined (“tilted mode"), which allows it to increase largely its collection surface at very high energy. It is planned to use this method after 2 years of operation in nadir mode (nominal).

23
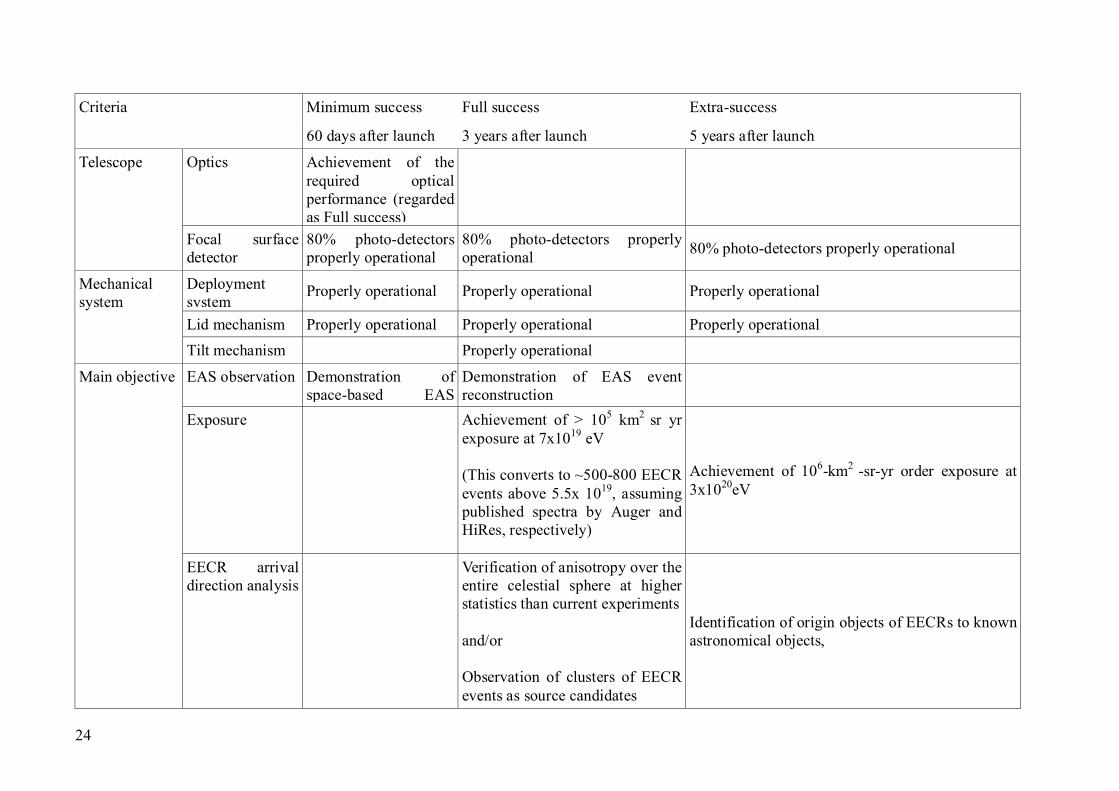
1.4 Summary of the scientific objectives and related scientific requirements. Scientific Objectives. The successful criteria defined on the various time scales of the mission are summarized in Table 1 while the primary observational goals of JEM-EUSO, and the science questions it will answer are:
Identification of the sources of ultra high energy particles by high statistics arrival direction analysis.
Measurement of the flux and energy spectra of single sources and search for features (pile-up bump, recovery at higher energies) in the spectral shape.
Identification of the astrophysical nature of the sources emitting this extreme component. Understanding and constraining the production, emission and acceleration mechanisms of
ultra high energy cosmic rays. Probe the galactic and local intergalactic structure of magnetic fields. Probe multiple anisotropies that could result from large scale nearby cosmic structure
and/or subdominant components in the ultra high energy particle flux (such as decay of super-heavy relics in the Galactic halo or high-energy neutrino annihilation on the relic neutrino background - the Zburst mechanism).
Probe the GZK intensity profile of distant sources and the temporal evolution of cosmic ray activity in the near Universe.
Other key objectives include:
Separation of neutrinos and gamma rays from nucleons and nuclei. Potentially break-through in starting neutrino astronomy. Detection of cosmogenic
neutrinos. Theoretically challenging acceleration mechanisms to 1021eV. Test Super Heavy Dark matter models, Z-burst models and other non-conventional
mechanisms. Exploratory objectives include:
The search for new physics. Constrain of extra-dimension theory via detection of ultra high energies neutrinos. Constrain
of UHE neutrino cross sections. Test of relativity at ultra high energies. Super-LHC physics: exploration of high energy physics beyond the accelerator limit.
Atmospheric science
Understanding space-atmosphere interactions and possibly related climate changes. Interaction of dust in the atmosphere. Understanding light transient phenomena (Elves, Sprites, Terrestrial Gamma Flashes...). Study of meteroids and associated phenomena.
24
Minimum success Full success Extra-success Criteria
60 days after launch 3 years after launch 5 years after launch
Optics Achievement of the required optical performance (regarded as Full success)
Telescope
Focal surface detector
80% photo-detectors properly operational
80% photo-detectors properly operational
80% photo-detectors properly operational
Deployment system
Properly operational Properly operational Properly operational
Lid mechanism Properly operational Properly operational Properly operational
Mechanical system
Tilt mechanism Properly operational
EAS observation Demonstration of space-based EAS
Demonstration of EAS event reconstruction
Exposure Achievement of > 105 km2 sr yr exposure at 7x10¹⁹ eV (This converts to ~500-800 EECR events above 5.5x 10¹⁹, assuming published spectra by Auger and HiRes, respectively)
Achievement of 106-km2 -sr-yr order exposure at 3x10²⁰eV
Main objective
EECR arrival direction analysis
Verification of anisotropy over the entire celestial sphere at higher statistics than current experiments and/or Observation of clusters of EECR events as source candidates
Identification of origin objects of EECRs to known astronomical objects,
25
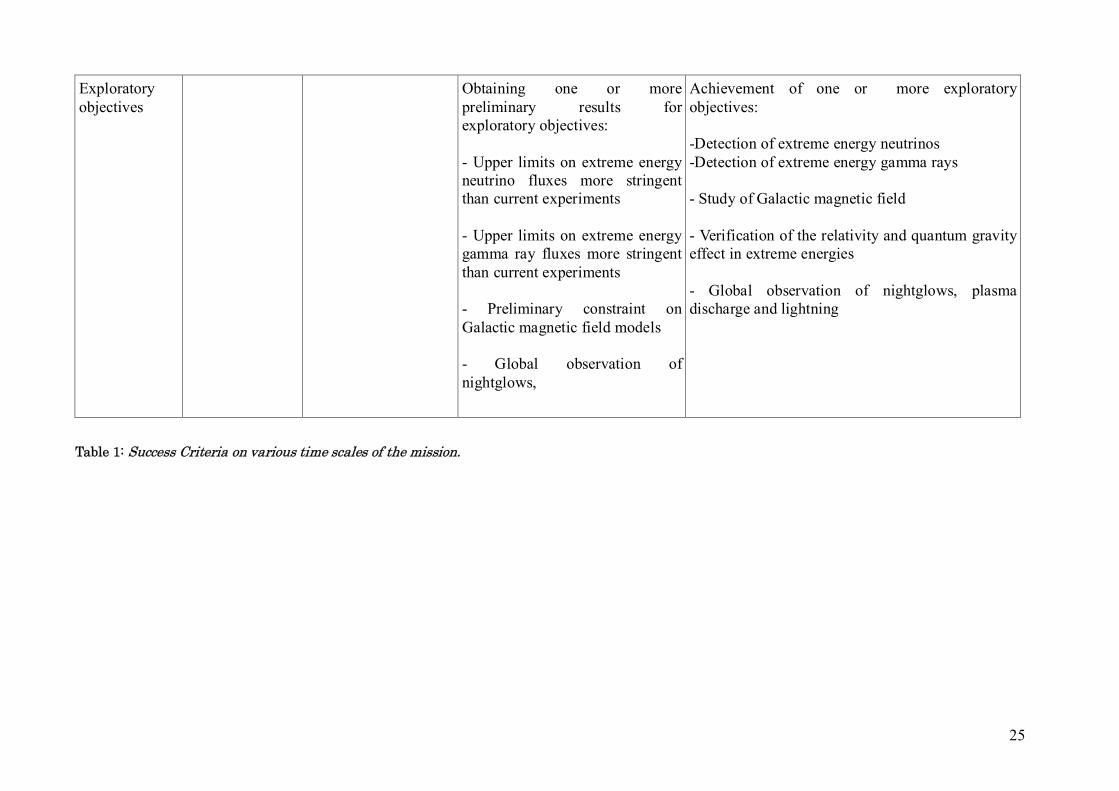
Exploratory objectives
Obtaining one or more preliminary results for exploratory objectives: - Upper limits on extreme energy neutrino fluxes more stringent than current experiments - Upper limits on extreme energy gamma ray fluxes more stringent than current experiments - Preliminary constraint on Galactic magnetic field models - Global observation of nightglows,
Achievement of one or more exploratory objectives: -Detection of extreme energy neutrinos -Detection of extreme energy gamma rays - Study of Galactic magnetic field - Verification of the relativity and quantum gravity effect in extreme energies - Global observation of nightglows, plasma discharge and lightning
Table 1: Success Criteria on various time scales of the mission.
26
Chapter 2 Expected performances
2.1 Acceptance and cumulative exposure
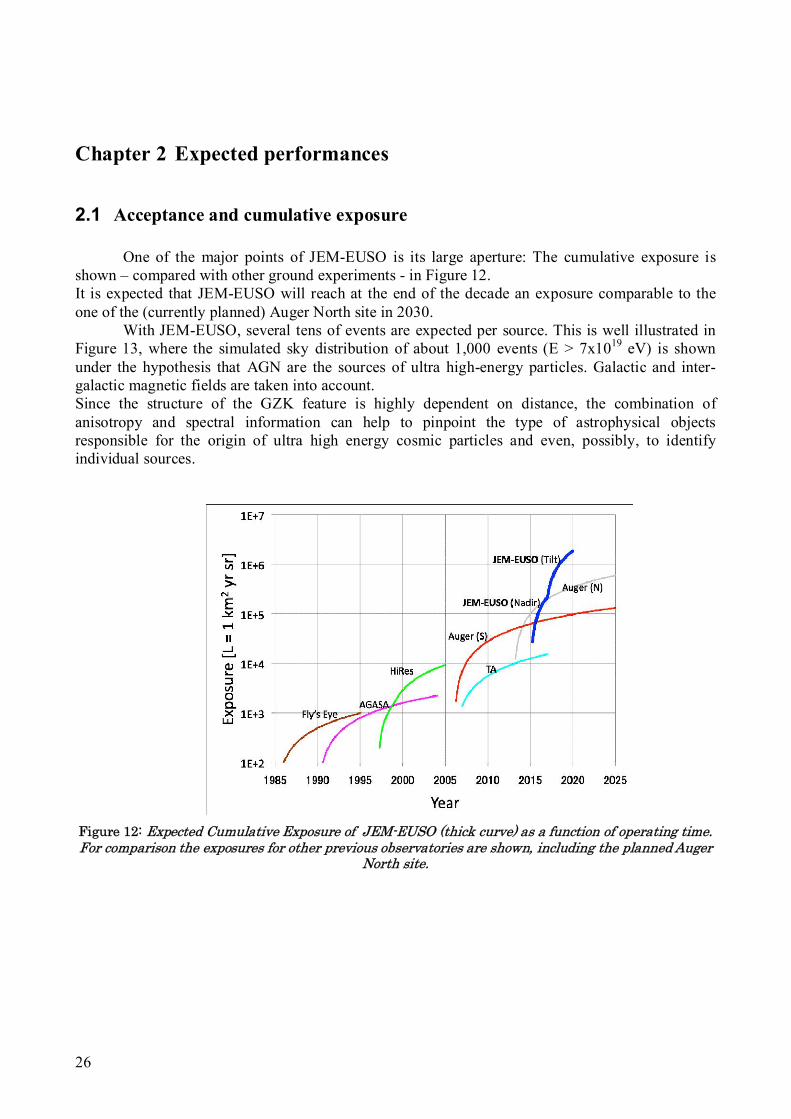
One of the major points of JEM-EUSO is its large aperture: The cumulative exposure is shown – compared with other ground experiments - in Figure 12. It is expected that JEM-EUSO will reach at the end of the decade an exposure comparable to the one of the (currently planned) Auger North site in 2030.
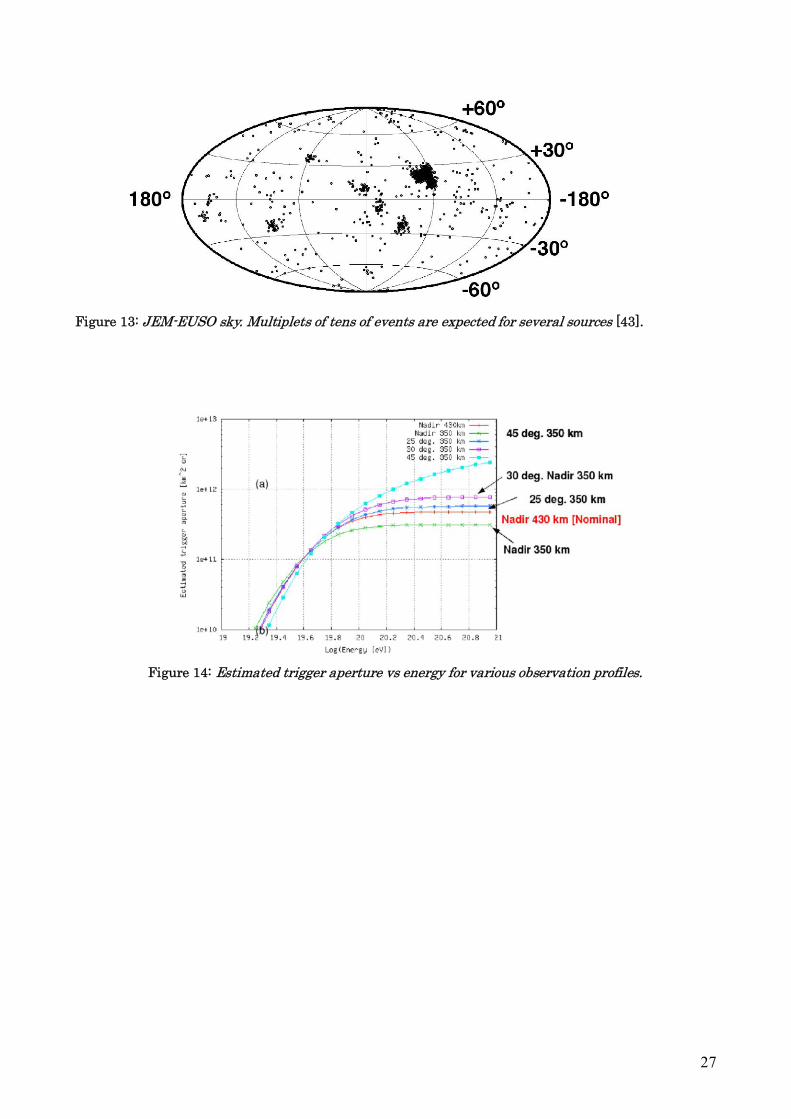
With JEM-EUSO, several tens of events are expected per source. This is well illustrated in Figure 13, where the simulated sky distribution of about 1,000 events (E > 7x10¹⁹ eV) is shown under the hypothesis that AGN are the sources of ultra high-energy particles. Galactic and inter-galactic magnetic fields are taken into account. Since the structure of the GZK feature is highly dependent on distance, the combination of anisotropy and spectral information can help to pinpoint the type of astrophysical objects responsible for the origin of ultra high energy cosmic particles and even, possibly, to identify individual sources.
Figure 12: Expected Cumulative Exposure of JEM-EUSO (thick curve) as a function of operating time. For comparison the exposures for other previous observatories are shown, including the planned Auger
North site.
27
Figure 13: JEM-EUSO sky. Multiplets of tens of events are expected for several sources [43].
Figure 14: Estimated trigger aperture vs energy for various observation profiles.
28
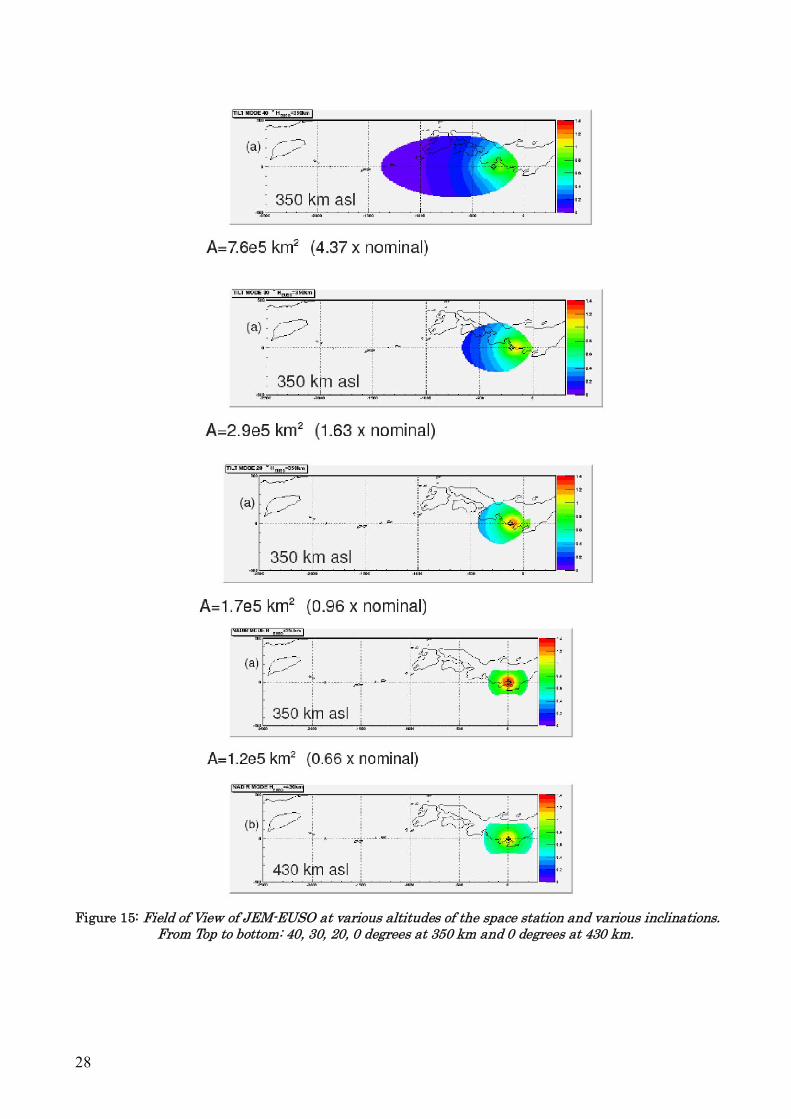
Figure 15: Field of View of JEM-EUSO at various altitudes of the space station and various inclinations. From Top to bottom: 40, 30, 20, 0 degrees at 350 km and 0 degrees at 430 km.
29
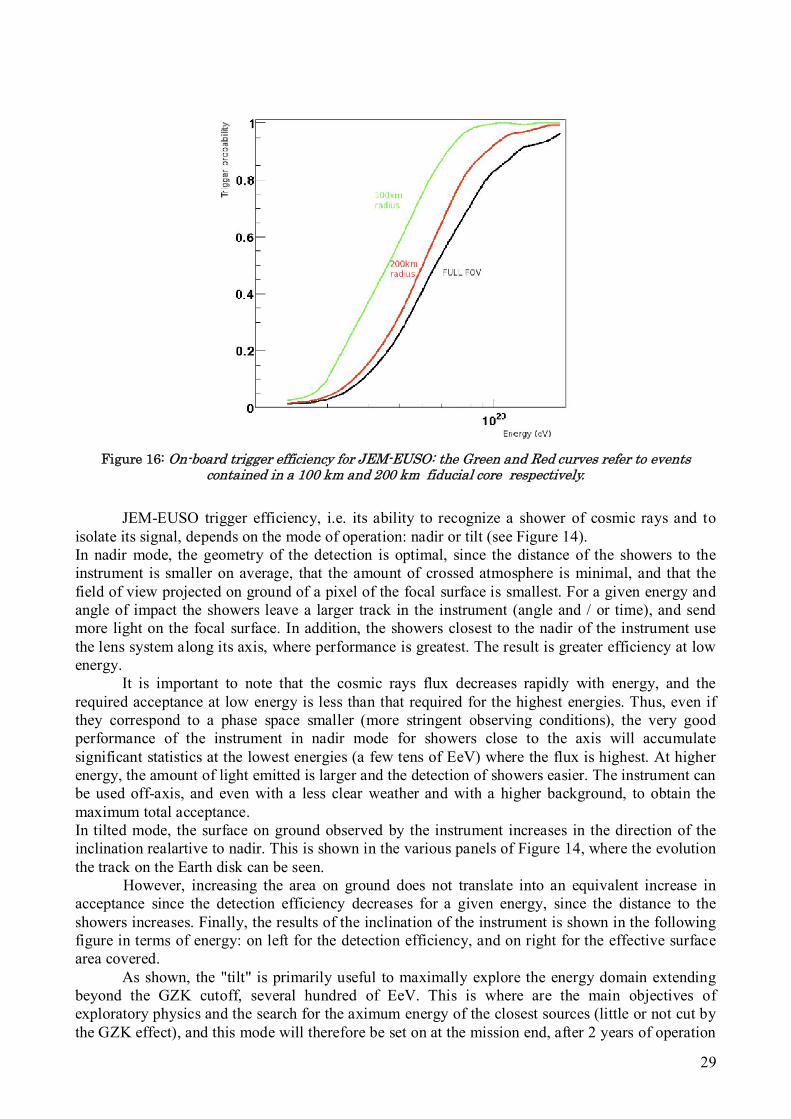
Figure 16: On-board trigger efficiency for JEM-EUSO: the Green and Red curves refer to events contained in a 100 km and 200 km fiducial core respectively.
JEM-EUSO trigger efficiency, i.e. its ability to recognize a shower of cosmic rays and to
isolate its signal, depends on the mode of operation: nadir or tilt (see Figure 14). In nadir mode, the geometry of the detection is optimal, since the distance of the showers to the instrument is smaller on average, that the amount of crossed atmosphere is minimal, and that the field of view projected on ground of a pixel of the focal surface is smallest. For a given energy and angle of impact the showers leave a larger track in the instrument (angle and / or time), and send more light on the focal surface. In addition, the showers closest to the nadir of the instrument use the lens system along its axis, where performance is greatest. The result is greater efficiency at low energy.
It is important to note that the cosmic rays flux decreases rapidly with energy, and the required acceptance at low energy is less than that required for the highest energies. Thus, even if they correspond to a phase space smaller (more stringent observing conditions), the very good performance of the instrument in nadir mode for showers close to the axis will accumulate significant statistics at the lowest energies (a few tens of EeV) where the flux is highest. At higher energy, the amount of light emitted is larger and the detection of showers easier. The instrument can be used off-axis, and even with a less clear weather and with a higher background, to obtain the maximum total acceptance. In tilted mode, the surface on ground observed by the instrument increases in the direction of the inclination realartive to nadir. This is shown in the various panels of Figure 14, where the evolution the track on the Earth disk can be seen.
However, increasing the area on ground does not translate into an equivalent increase in acceptance since the detection efficiency decreases for a given energy, since the distance to the showers increases. Finally, the results of the inclination of the instrument is shown in the following figure in terms of energy: on left for the detection efficiency, and on right for the effective surface area covered.
As shown, the "tilt" is primarily useful to maximally explore the energy domain extending beyond the GZK cutoff, several hundred of EeV. This is where are the main objectives of exploratory physics and the search for the aximum energy of the closest sources (little or not cut by the GZK effect), and this mode will therefore be set on at the mission end, after 2 years of operation
30
in nadir mode for the implementation of the main scientific program. The low-energy acceptance, product of the area covered by the detection efficiency, however, remains very important (right figure), comparable to the acceptance in nadir mode, but with degraded resolutions in energy and direction (this is more annoying at low-energy than high-energy). The JEM-EUSO mission plan has a baseline of a nadir mode observation for 2 years, then in tilted mode for 3 years, as shown Figure 12. The real observation plan will take into account the observations, focusing on the region of highest interest.
The ambitious million Linsley threshold (i.e. 106 km2 sr yr) at the highest energies, identified by the community as the next key step for the study of ultra-high energy cosmic rays and the implementation of a "cosmic ray astronomy”, appears to be within JEM-EUSO scope on a reasonable time scale, consistent with the theoretical and observational efforts underway in the field of astroparticle physics.
2.2 Energy resolution
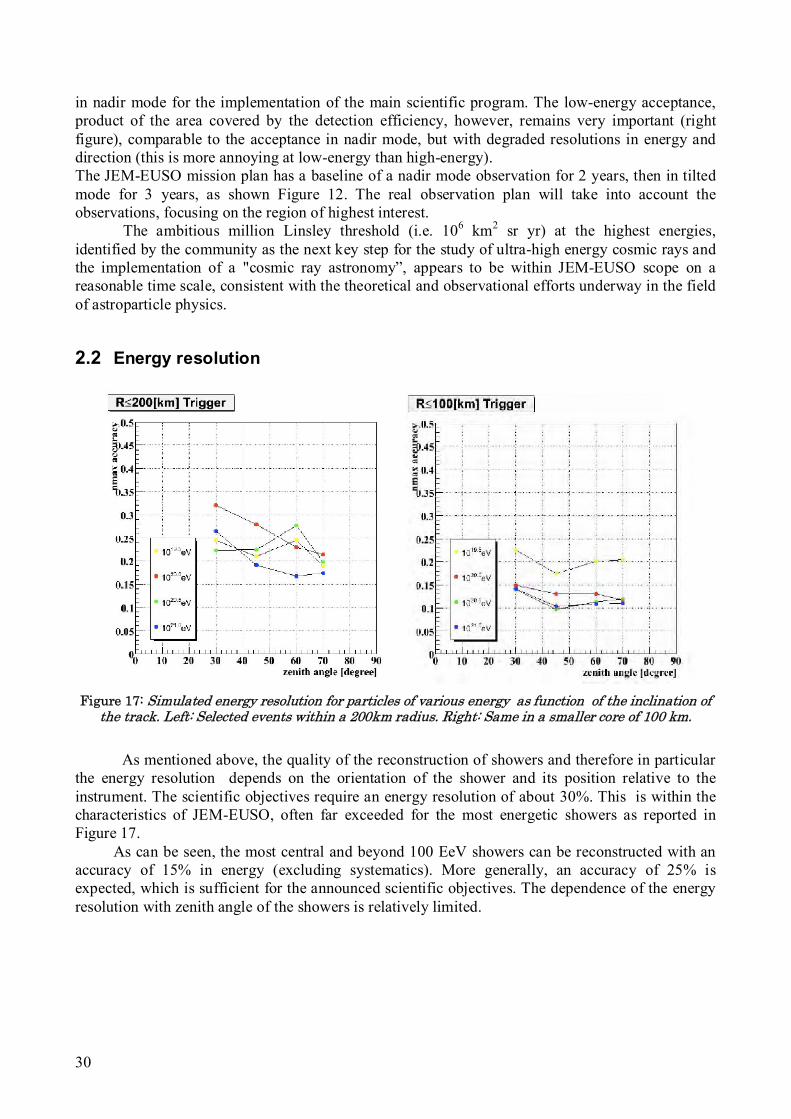
Figure 17: Simulated energy resolution for particles of various energy as function of the inclination of the track. Left: Selected events within a 200km radius. Right: Same in a smaller core of 100 km.
As mentioned above, the quality of the reconstruction of showers and therefore in particular
the energy resolution depends on the orientation of the shower and its position relative to the instrument. The scientific objectives require an energy resolution of about 30%. This is within the characteristics of JEM-EUSO, often far exceeded for the most energetic showers as reported in Figure 17.
As can be seen, the most central and beyond 100 EeV showers can be reconstructed with an accuracy of 15% in energy (excluding systematics). More generally, an accuracy of 25% is expected, which is sufficient for the announced scientific objectives. The dependence of the energy resolution with zenith angle of the showers is relatively limited.
31
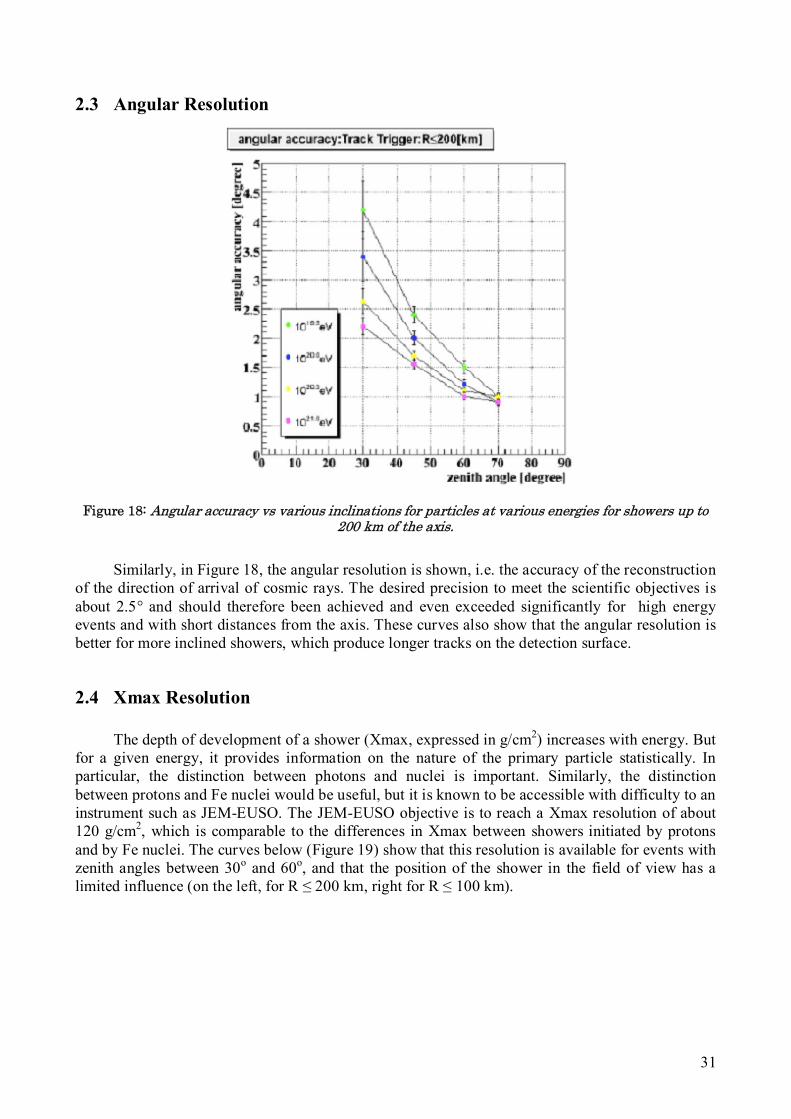
2.3 Angular Resolution
Figure 18: Angular accuracy vs various inclinations for particles at various energies for showers up to 200 km of the axis.
Similarly, in Figure 18, the angular resolution is shown, i.e. the accuracy of the reconstruction
of the direction of arrival of cosmic rays. The desired precision to meet the scientific objectives is about 2.5° and should therefore been achieved and even exceeded significantly for high energy events and with short distances from the axis. These curves also show that the angular resolution is better for more inclined showers, which produce longer tracks on the detection surface.
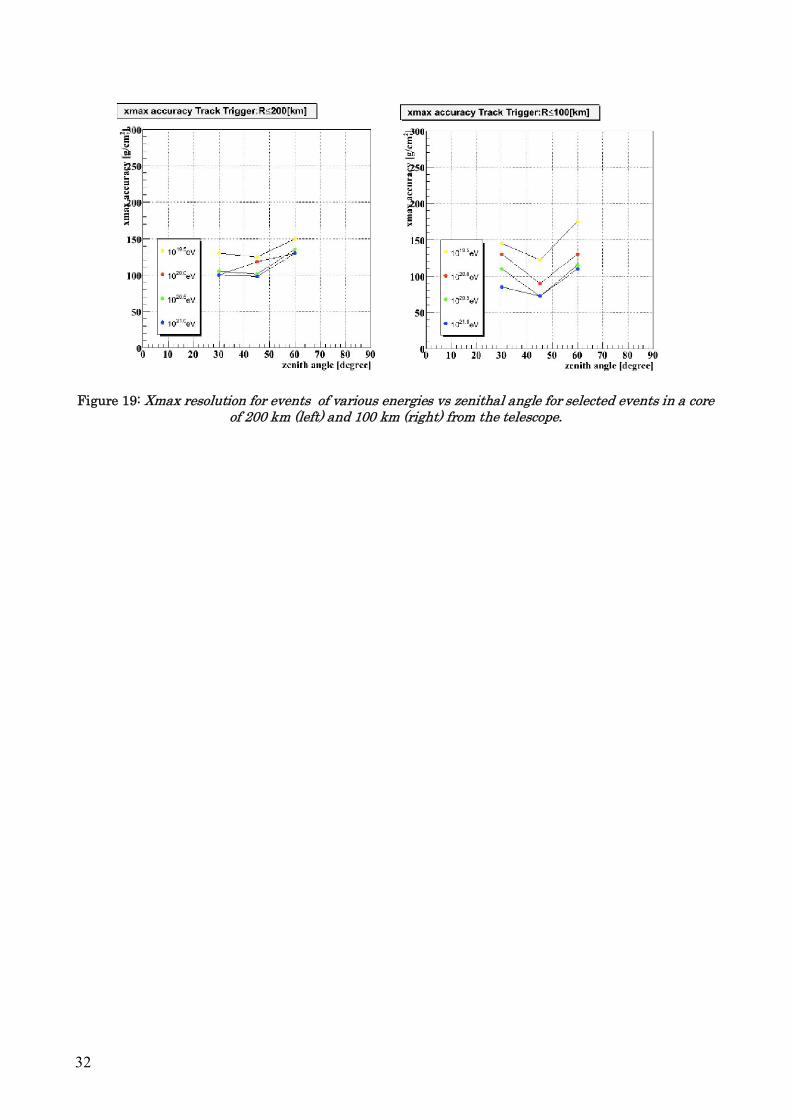
2.4 Xmax Resolution
The depth of development of a shower (Xmax, expressed in g/cm2) increases with energy. But for a given energy, it provides information on the nature of the primary particle statistically. In particular, the distinction between photons and nuclei is important. Similarly, the distinction between protons and Fe nuclei would be useful, but it is known to be accessible with difficulty to an instrument such as JEM-EUSO. The JEM-EUSO objective is to reach a Xmax resolution of about 120 g/cm2, which is comparable to the differences in Xmax between showers initiated by protons and by Fe nuclei. The curves below (Figure 19) show that this resolution is available for events with zenith angles between 30o and 60o, and that the position of the shower in the field of view has a limited influence (on the left, for R ≤ 200 km, right for R ≤ 100 km).
32
Figure 19: Xmax resolution for events of various energies vs zenithal angle for selected events in a core of 200 km (left) and 100 km (right) from the telescope.
33
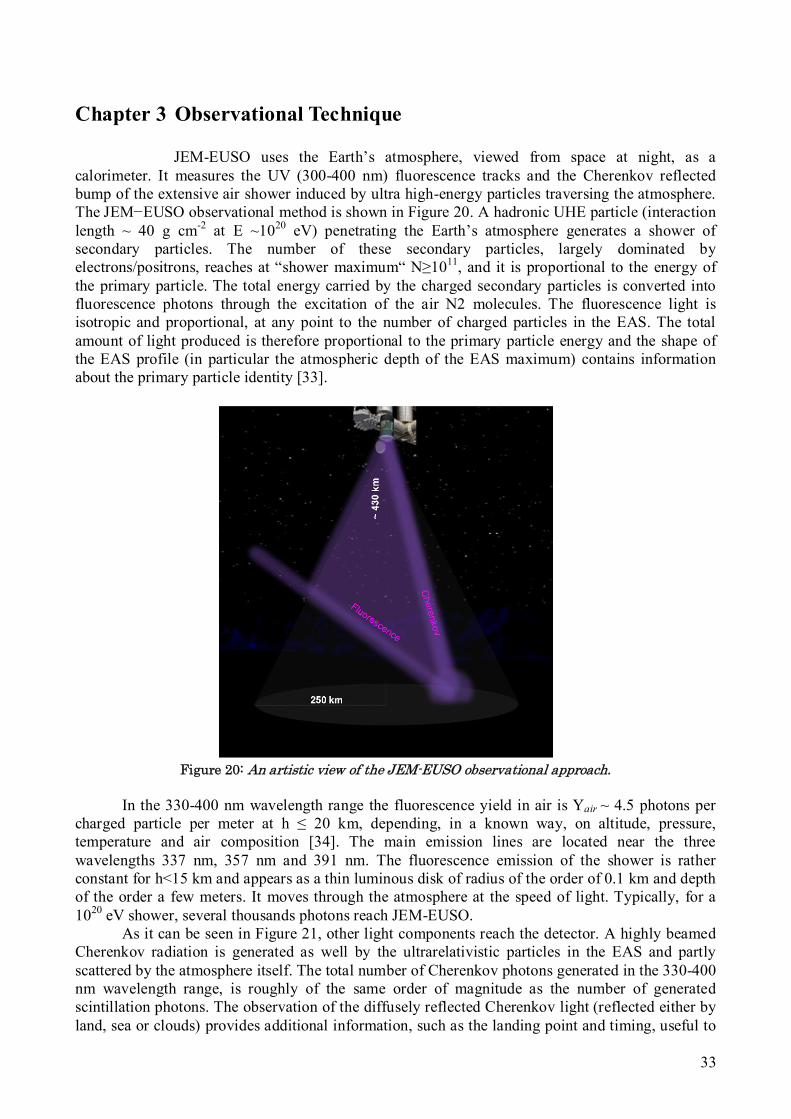
Chapter 3 Observational Technique JEM-EUSO uses the Earth’s atmosphere, viewed from space at night, as a calorimeter. It measures the UV (300-400 nm) fluorescence tracks and the Cherenkov reflected bump of the extensive air shower induced by ultra high-energy particles traversing the atmosphere. The JEM−EUSO observational method is shown in Figure 20. A hadronic UHE particle (interaction length ~ 40 g cm-2 at E ~1020 eV) penetrating the Earth’s atmosphere generates a shower of secondary particles. The number of these secondary particles, largely dominated by electrons/positrons, reaches at “shower maximum“ N≥1011, and it is proportional to the energy of the primary particle. The total energy carried by the charged secondary particles is converted into fluorescence photons through the excitation of the air N2 molecules. The fluorescence light is isotropic and proportional, at any point to the number of charged particles in the EAS. The total amount of light produced is therefore proportional to the primary particle energy and the shape of the EAS profile (in particular the atmospheric depth of the EAS maximum) contains information about the primary particle identity [33].
Figure 20: An artistic view of the JEM-EUSO observational approach.
In the 330-400 nm wavelength range the fluorescence yield in air is Yair ~ 4.5 photons per
charged particle per meter at h ≤ 20 km, depending, in a known way, on altitude, pressure, temperature and air composition [34]. The main emission lines are located near the three wavelengths 337 nm, 357 nm and 391 nm. The fluorescence emission of the shower is rather constant for h<15 km and appears as a thin luminous disk of radius of the order of 0.1 km and depth of the order a few meters. It moves through the atmosphere at the speed of light. Typically, for a 1020 eV shower, several thousands photons reach JEM-EUSO.
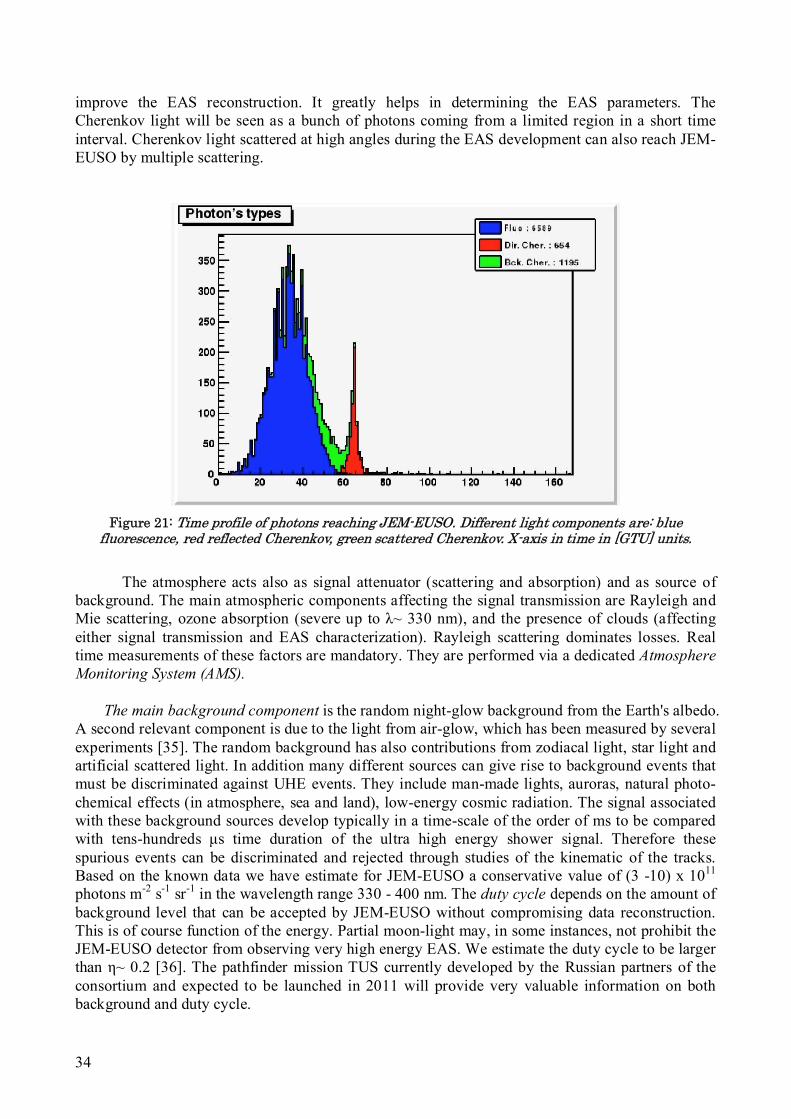
As it can be seen in Figure 21, other light components reach the detector. A highly beamed Cherenkov radiation is generated as well by the ultrarelativistic particles in the EAS and partly scattered by the atmosphere itself. The total number of Cherenkov photons generated in the 330-400 nm wavelength range, is roughly of the same order of magnitude as the number of generated scintillation photons. The observation of the diffusely reflected Cherenkov light (reflected either by land, sea or clouds) provides additional information, such as the landing point and timing, useful to
34
improve the EAS reconstruction. It greatly helps in determining the EAS parameters. The Cherenkov light will be seen as a bunch of photons coming from a limited region in a short time interval. Cherenkov light scattered at high angles during the EAS development can also reach JEM-EUSO by multiple scattering.
Figure 21: Time profile of photons reaching JEM-EUSO. Different light components are: blue fluorescence, red reflected Cherenkov, green scattered Cherenkov. X-axis in time in [GTU] units.
The atmosphere acts also as signal attenuator (scattering and absorption) and as source of
background. The main atmospheric components affecting the signal transmission are Rayleigh and Mie scattering, ozone absorption (severe up to λ~ 330 nm), and the presence of clouds (affecting either signal transmission and EAS characterization). Rayleigh scattering dominates losses. Real time measurements of these factors are mandatory. They are performed via a dedicated Atmosphere Monitoring System (AMS).
The main background component is the random night-glow background from the Earth's albedo. A second relevant component is due to the light from air-glow, which has been measured by several experiments [35]. The random background has also contributions from zodiacal light, star light and artificial scattered light. In addition many different sources can give rise to background events that must be discriminated against UHE events. They include man-made lights, auroras, natural photo-chemical effects (in atmosphere, sea and land), low-energy cosmic radiation. The signal associated with these background sources develop typically in a time-scale of the order of ms to be compared with tens-hundreds μs time duration of the ultra high energy shower signal. Therefore these spurious events can be discriminated and rejected through studies of the kinematic of the tracks. Based on the known data we have estimate for JEM-EUSO a conservative value of (3 -10) x 1011 photons m-2 s-1 sr-1 in the wavelength range 330 - 400 nm. The duty cycle depends on the amount of background level that can be accepted by JEM-EUSO without compromising data reconstruction. This is of course function of the energy. Partial moon-light may, in some instances, not prohibit the JEM-EUSO detector from observing very high energy EAS. We estimate the duty cycle to be larger than η~ 0.2 [36]. The pathfinder mission TUS currently developed by the Russian partners of the consortium and expected to be launched in 2011 will provide very valuable information on both background and duty cycle.
35
Chapter 4 The JEM-EUSO instrument
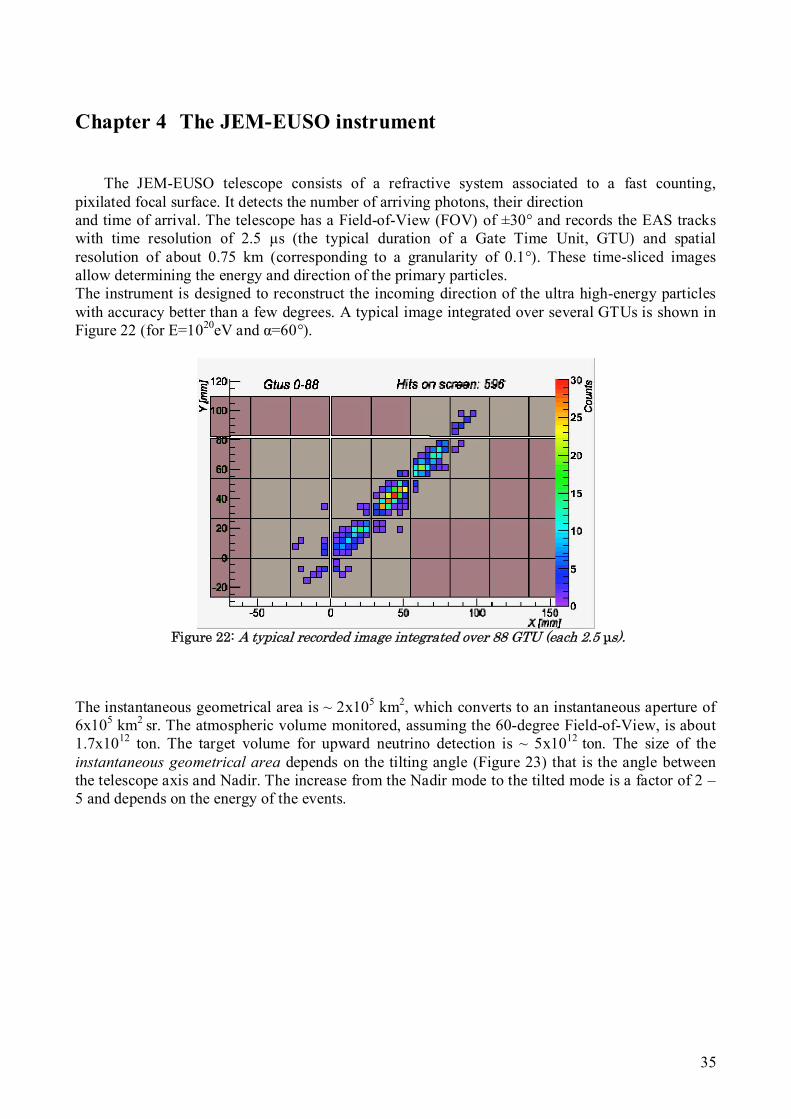
The JEM-EUSO telescope consists of a refractive system associated to a fast counting, pixilated focal surface. It detects the number of arriving photons, their direction and time of arrival. The telescope has a Field-of-View (FOV) of ±30° and records the EAS tracks with time resolution of 2.5 μs (the typical duration of a Gate Time Unit, GTU) and spatial resolution of about 0.75 km (corresponding to a granularity of 0.1°). These time-sliced images allow determining the energy and direction of the primary particles. The instrument is designed to reconstruct the incoming direction of the ultra high-energy particles with accuracy better than a few degrees. A typical image integrated over several GTUs is shown in Figure 22 (for E=1020eV and α=60°).
Figure 22: A typical recorded image integrated over 88 GTU (each 2.5 μs).
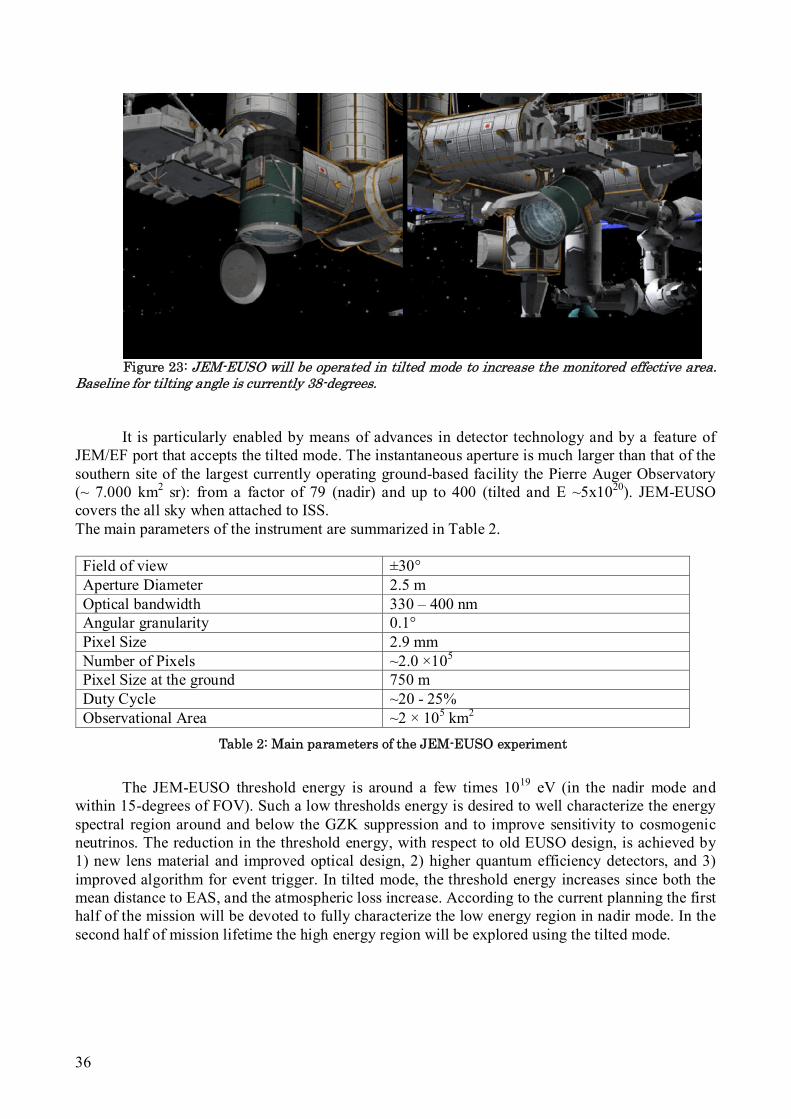
The instantaneous geometrical area is ~ 2x10⁵ km2, which converts to an instantaneous aperture of 6x10⁵ km2 sr. The atmospheric volume monitored, assuming the 60-degree Field-of-View, is about 1.7x10¹² ton. The target volume for upward neutrino detection is ~ 5x10¹² ton. The size of the instantaneous geometrical area depends on the tilting angle (Figure 23) that is the angle between the telescope axis and Nadir. The increase from the Nadir mode to the tilted mode is a factor of 2 – 5 and depends on the energy of the events.
36
Figure 23: JEM-EUSO will be operated in tilted mode to increase the monitored effective area.
Baseline for tilting angle is currently 38-degrees. It is particularly enabled by means of advances in detector technology and by a feature of
JEM/EF port that accepts the tilted mode. The instantaneous aperture is much larger than that of the southern site of the largest currently operating ground-based facility the Pierre Auger Observatory (~ 7.000 km2 sr): from a factor of 79 (nadir) and up to 400 (tilted and E ~5x10²⁰). JEM-EUSO covers the all sky when attached to ISS. The main parameters of the instrument are summarized in Table 2. Field of view ±30° Aperture Diameter 2.5 m Optical bandwidth 330 – 400 nm Angular granularity 0.1° Pixel Size 2.9 mm Number of Pixels ~2.0 ×10⁵ Pixel Size at the ground 750 m Duty Cycle ~20 - 25% Observational Area ~2 × 10⁵ km2
Table 2: Main parameters of the JEM-EUSO experiment
The JEM-EUSO threshold energy is around a few times 1019 eV (in the nadir mode and
within 15-degrees of FOV). Such a low thresholds energy is desired to well characterize the energy spectral region around and below the GZK suppression and to improve sensitivity to cosmogenic neutrinos. The reduction in the threshold energy, with respect to old EUSO design, is achieved by 1) new lens material and improved optical design, 2) higher quantum efficiency detectors, and 3) improved algorithm for event trigger. In tilted mode, the threshold energy increases since both the mean distance to EAS, and the atmospheric loss increase. According to the current planning the first half of the mission will be devoted to fully characterize the low energy region in nadir mode. In the second half of mission lifetime the high energy region will be explored using the tilted mode.
37
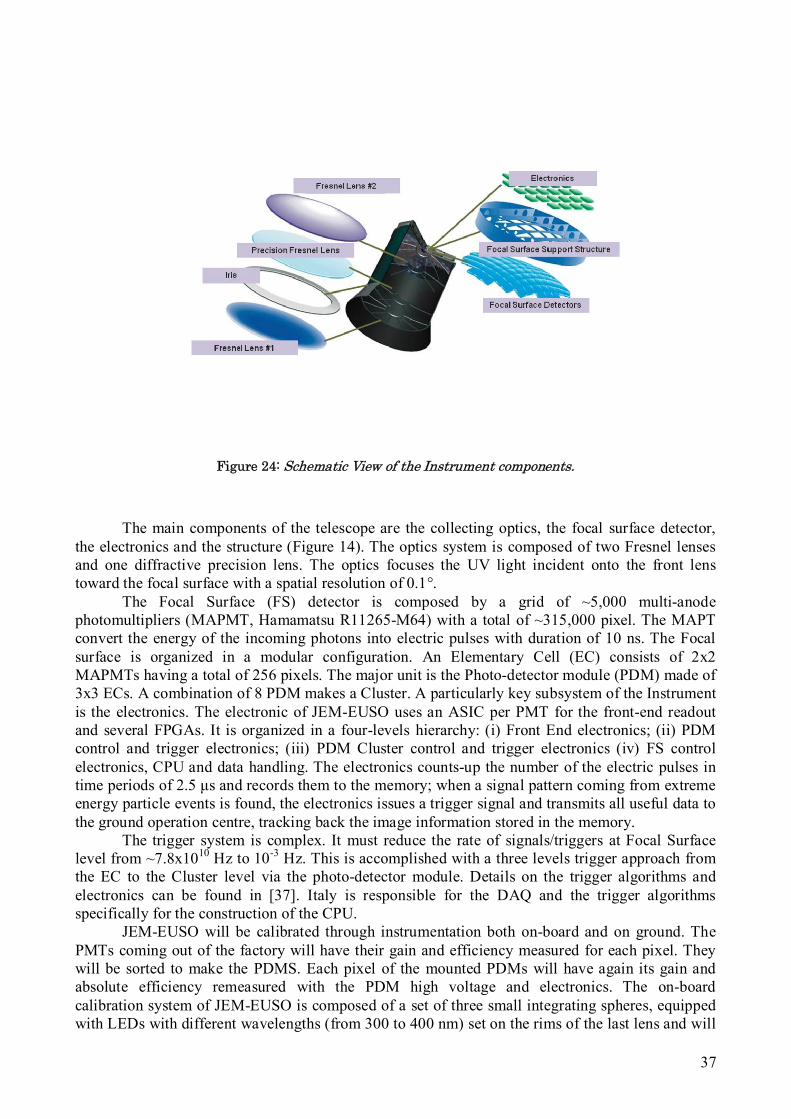
Figure 24: Schematic View of the Instrument components.
The main components of the telescope are the collecting optics, the focal surface detector,
the electronics and the structure (Figure 14). The optics system is composed of two Fresnel lenses and one diffractive precision lens. The optics focuses the UV light incident onto the front lens toward the focal surface with a spatial resolution of 0.1°.
The Focal Surface (FS) detector is composed by a grid of ~5,000 multi-anode photomultipliers (MAPMT, Hamamatsu R11265-M64) with a total of ~315,000 pixel. The MAPT convert the energy of the incoming photons into electric pulses with duration of 10 ns. The Focal surface is organized in a modular configuration. An Elementary Cell (EC) consists of 2x2 MAPMTs having a total of 256 pixels. The major unit is the Photo-detector module (PDM) made of 3x3 ECs. A combination of 8 PDM makes a Cluster. A particularly key subsystem of the Instrument is the electronics. The electronic of JEM-EUSO uses an ASIC per PMT for the front-end readout and several FPGAs. It is organized in a four-levels hierarchy: (i) Front End electronics; (ii) PDM control and trigger electronics; (iii) PDM Cluster control and trigger electronics (iv) FS control electronics, CPU and data handling. The electronics counts-up the number of the electric pulses in time periods of 2.5 μs and records them to the memory; when a signal pattern coming from extreme energy particle events is found, the electronics issues a trigger signal and transmits all useful data to the ground operation centre, tracking back the image information stored in the memory.
The trigger system is complex. It must reduce the rate of signals/triggers at Focal Surface level from ~7.8x10¹⁰ Hz to 10-3 Hz. This is accomplished with a three levels trigger approach from the EC to the Cluster level via the photo-detector module. Details on the trigger algorithms and electronics can be found in [37]. Italy is responsible for the DAQ and the trigger algorithms specifically for the construction of the CPU.
JEM-EUSO will be calibrated through instrumentation both on-board and on ground. The PMTs coming out of the factory will have their gain and efficiency measured for each pixel. They will be sorted to make the PDMS. Each pixel of the mounted PDMs will have again its gain and absolute efficiency remeasured with the PDM high voltage and electronics. The on-board calibration system of JEM-EUSO is composed of a set of three small integrating spheres, equipped with LEDs with different wavelengths (from 300 to 400 nm) set on the rims of the last lens and will
38
illuminate homogeneously the focal surface, calibrating all the pixels. Another of these small spheres, set in the middle of the focal surface will send light through the lenses to the closed lid covered with diffusive material. The light will go back through the lenses again to reach the focal surface. This will control very efficiently the lenses behavior. Also Xenon flasher lamps, installed on ground in a dozen of sites will be used to calibrate JEM-EUSO, once a day or so.
The JEM-EUSO european teams are also engaged in an original program to measure the fluorescence yield of nitrogen in air, at all conditions of pressure, temperature and water pollution. In particular, electron beams produced at lines like the Beam Test Facility (BTF) at the INFN Frascati Laboratories are available for proptotype testing and calibration.
The enabling technologies of the JEM-EUSO instrument have been already developed and no new key technologies are required. Key technologies are: (1) wide-angle refractive fine-precision optics (Fresnel lenses), (2) light-weight efficient photomultipliers (Multi-anode PMTs), and (3) fast trigger electronics, and (calibration systems). These technologies were initially developed during the Phase A ESA study of EUSO period (2000 – 2004). Thanks to the efforts of the consortium advanced developments have been reached during the JAXA Phase-A/B study period (2007 – present).
Atmospheric Monitoring System (AMS). An essential part of the instrument is the AMS [3, 38]. The optical yield of the ultra high-
energy event depends on the integrated air mass along the pathway of the cosmic ray, i.e. on the attenuation of the atmosphere above the region of the track development. The detected Cherenkov emissions also depends strongly on the same atmospheric conditions, and on the surface albedo. The objective of the AMS may be defined as: to observe the Earth’s atmosphere continuously inside the FOV of the JEM-EUSO telescope providing key parameters for the optical yield determination; this encompasses the determination of the 3D distribution of opaque cloud tops and the subvisible cloud heights, thicknesses and optical depths. In its present concept, the AMS will integrate the following methods and instruments: (i) Infrared Camera, (ii) Elastic backscatter Lidar.
The objective of the infrared (IR) camera, developed under the responsibility of Spain, is to obtain IR images of the cloud-top temperature inside FOV of the JEM-EUSO telescope. Using these images, contour maps of the cloud-top altitude and the fractional cloud coverage can be estimated. The camera will be a separate unit, mounted side-by-side with the JEM-EUSO instrument and observing the same area on the surface/atmosphere, as JEM-EUSO. We have to account for limitations in the spatial resolution of the IR camera in evaluating cloud tops. Typically the altitude accuracy is ~500 m [26], what may lead to large uncertainties in the evaluation of the optical yield requiring continuous calibration/correction.
The primary objectives of the Lidar will be to provide absolute measurements of the tops of opaque clouds in selected directions into the FOV of the JEM-EUSO telescope. These measurements will be used to continuously calibrate and correct the assessment of the cloud top altitudes provided by the IR camera based on estimated cloud top temperatures. The proposed Lidar will be a backscatter type using wavelength in the UV spectral range, i.e., coinciding with the wavelength of the event’s track. We have to note that space-borne Lidars are already in operation, based on similar concept and engaged in similar tasks [27, 39].
An open question is still the optimal way of the laser beam scanning inside the FOV. Three ways are presently considered: (i) the use of three-to-four separate, relatively low power, independently operating lasers, each probing in its defined direction, and using the EUSO telescope as Lidar receiver; (ii) to “scan” in a proper way the beam from one laser only along a specified pattern, while again using the EUSO telescope as Lidar receiver; (iii) to use a stand-alone Lidar system, operating side-by-side with JEM-EUSO and scanning independently its FOV. In the first and second options the measurements will be carried in selected directions, using part of the PMTs mounted on the focal plane as Lidar dedicated detectors. The final selection of the concept is the
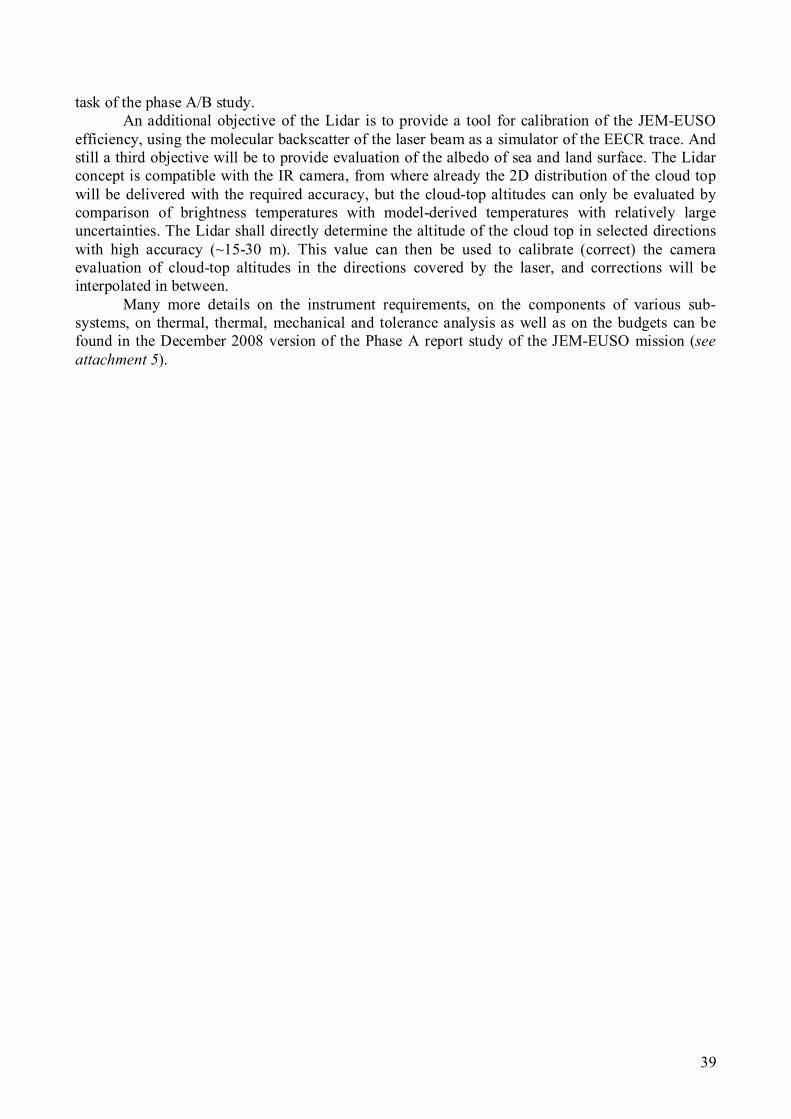
39
task of the phase A/B study. An additional objective of the Lidar is to provide a tool for calibration of the JEM-EUSO
efficiency, using the molecular backscatter of the laser beam as a simulator of the EECR trace. And still a third objective will be to provide evaluation of the albedo of sea and land surface. The Lidar concept is compatible with the IR camera, from where already the 2D distribution of the cloud top will be delivered with the required accuracy, but the cloud-top altitudes can only be evaluated by comparison of brightness temperatures with model-derived temperatures with relatively large uncertainties. The Lidar shall directly determine the altitude of the cloud top in selected directions with high accuracy (~15-30 m). This value can then be used to calibrate (correct) the camera evaluation of cloud-top altitudes in the directions covered by the laser, and corrections will be interpolated in between.
Many more details on the instrument requirements, on the components of various sub-systems, on thermal, thermal, mechanical and tolerance analysis as well as on the budgets can be found in the December 2008 version of the Phase A report study of the JEM-EUSO mission (see attachment 5).
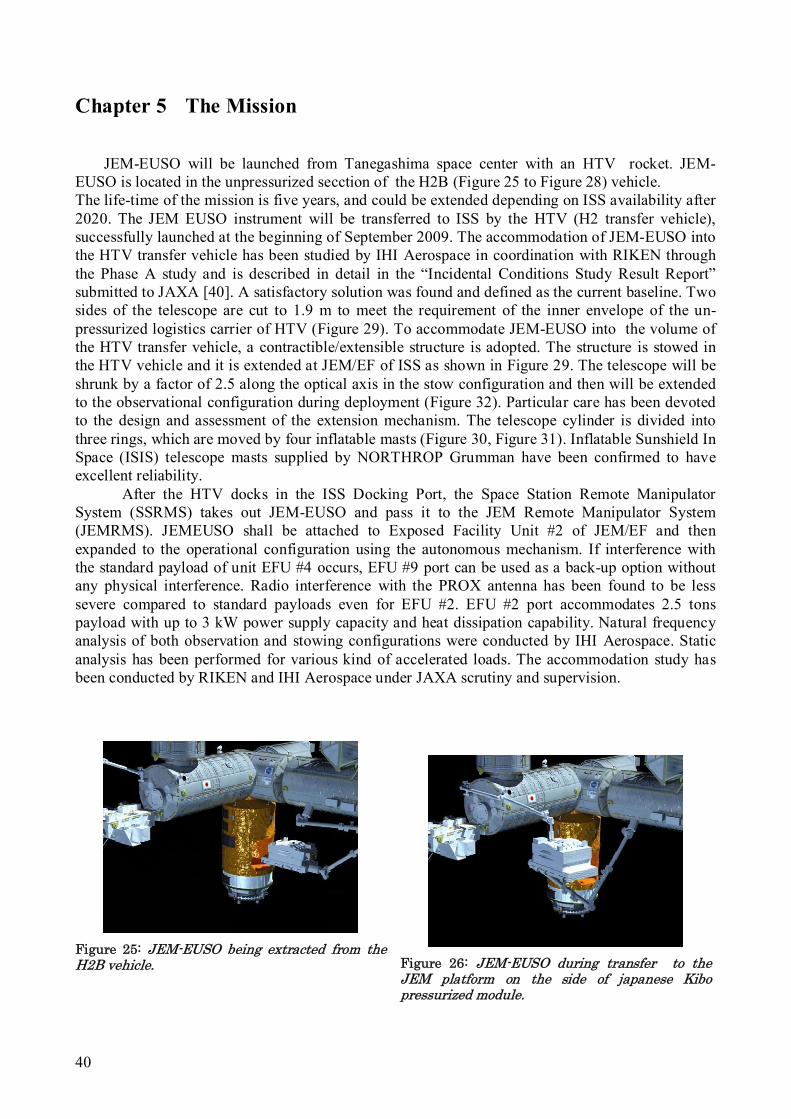
40
Chapter 5 The Mission
JEM-EUSO will be launched from Tanegashima space center with an HTV rocket. JEM-EUSO is located in the unpressurized secction of the H2B (Figure 25 to Figure 28) vehicle. The life-time of the mission is five years, and could be extended depending on ISS availability after 2020. The JEM EUSO instrument will be transferred to ISS by the HTV (H2 transfer vehicle), successfully launched at the beginning of September 2009. The accommodation of JEM-EUSO into the HTV transfer vehicle has been studied by IHI Aerospace in coordination with RIKEN through the Phase A study and is described in detail in the “Incidental Conditions Study Result Report” submitted to JAXA [40]. A satisfactory solution was found and defined as the current baseline. Two sides of the telescope are cut to 1.9 m to meet the requirement of the inner envelope of the un-pressurized logistics carrier of HTV (Figure 29). To accommodate JEM-EUSO into the volume of the HTV transfer vehicle, a contractible/extensible structure is adopted. The structure is stowed in the HTV vehicle and it is extended at JEM/EF of ISS as shown in Figure 29. The telescope will be shrunk by a factor of 2.5 along the optical axis in the stow configuration and then will be extended to the observational configuration during deployment (Figure 32). Particular care has been devoted to the design and assessment of the extension mechanism. The telescope cylinder is divided into three rings, which are moved by four inflatable masts (Figure 30, Figure 31). Inflatable Sunshield In Space (ISIS) telescope masts supplied by NORTHROP Grumman have been confirmed to have excellent reliability.
After the HTV docks in the ISS Docking Port, the Space Station Remote Manipulator System (SSRMS) takes out JEM-EUSO and pass it to the JEM Remote Manipulator System (JEMRMS). JEMEUSO shall be attached to Exposed Facility Unit #2 of JEM/EF and then expanded to the operational configuration using the autonomous mechanism. If interference with the standard payload of unit EFU #4 occurs, EFU #9 port can be used as a back-up option without any physical interference. Radio interference with the PROX antenna has been found to be less severe compared to standard payloads even for EFU #2. EFU #2 port accommodates 2.5 tons payload with up to 3 kW power supply capacity and heat dissipation capability. Natural frequency analysis of both observation and stowing configurations were conducted by IHI Aerospace. Static analysis has been performed for various kind of accelerated loads. The accommodation study has been conducted by RIKEN and IHI Aerospace under JAXA scrutiny and supervision.
Figure 25: JEM-EUSO being extracted from the H2B vehicle.
Figure 26: JEM-EUSO during transfer to the JEM platform on the side of japanese Kibo pressurized module.
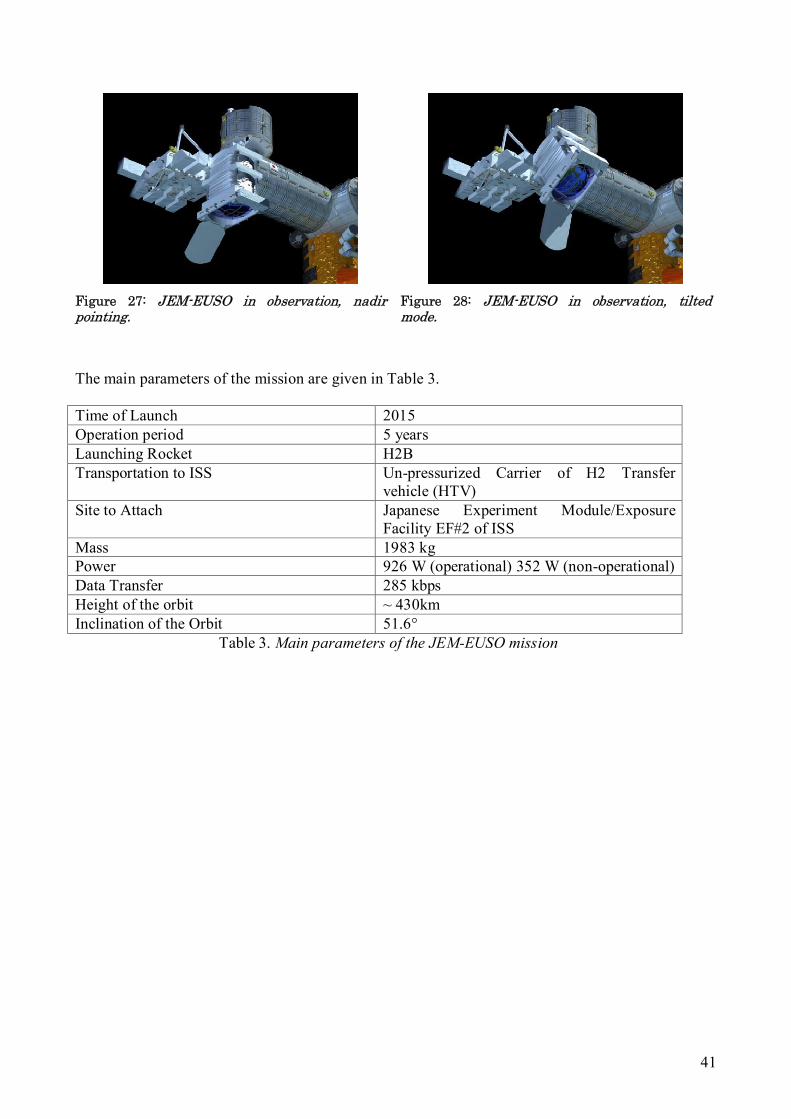
41
Figure 27: JEM-EUSO in observation, nadir pointing.
Figure 28: JEM-EUSO in observation, tilted mode.
The main parameters of the mission are given in Table 3. Time of Launch 2015 Operation period 5 years Launching Rocket H2B Transportation to ISS Un-pressurized Carrier of H2 Transfer
vehicle (HTV) Site to Attach Japanese Experiment Module/Exposure
Facility EF#2 of ISS Mass 1983 kg Power 926 W (operational) 352 W (non-operational) Data Transfer 285 kbps Height of the orbit ~ 430km Inclination of the Orbit 51.6°
Table 3. Main parameters of the JEM-EUSO mission
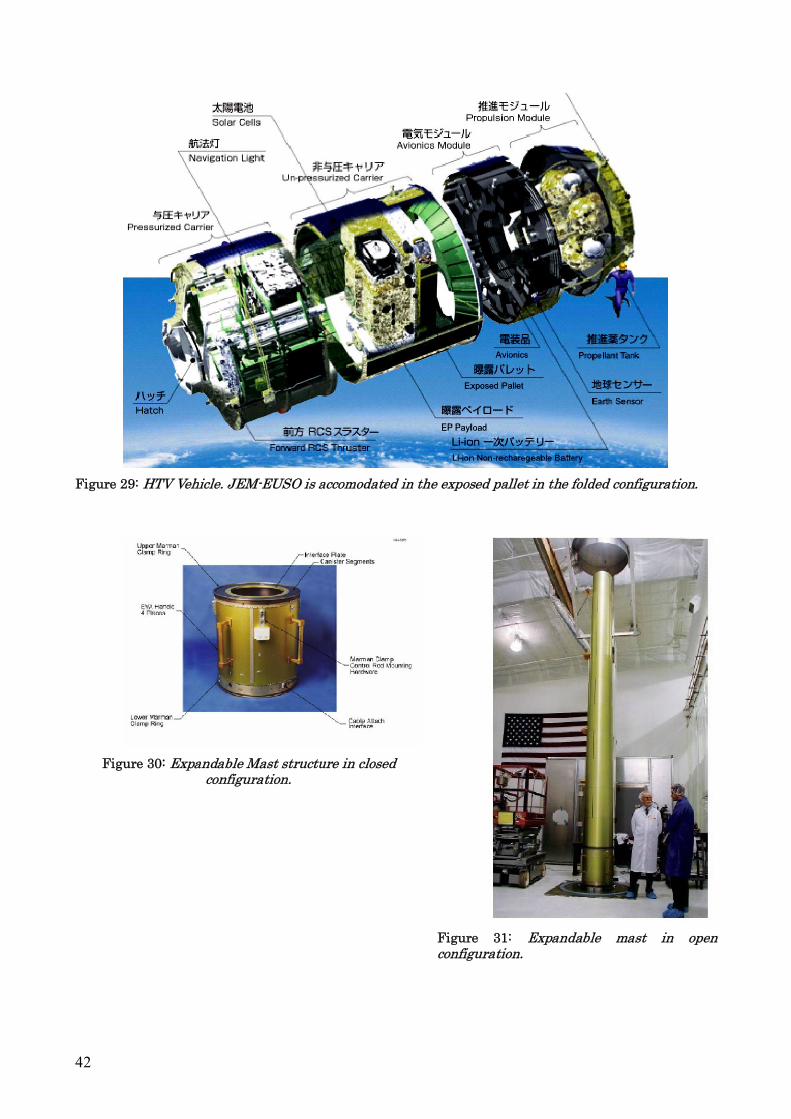
42
Figure 29: HTV Vehicle. JEM-EUSO is accomodated in the exposed pallet in the folded configuration.
Figure 30: Expandable Mast structure in closed configuration.
Figure 31: Expandable mast in open configuration.
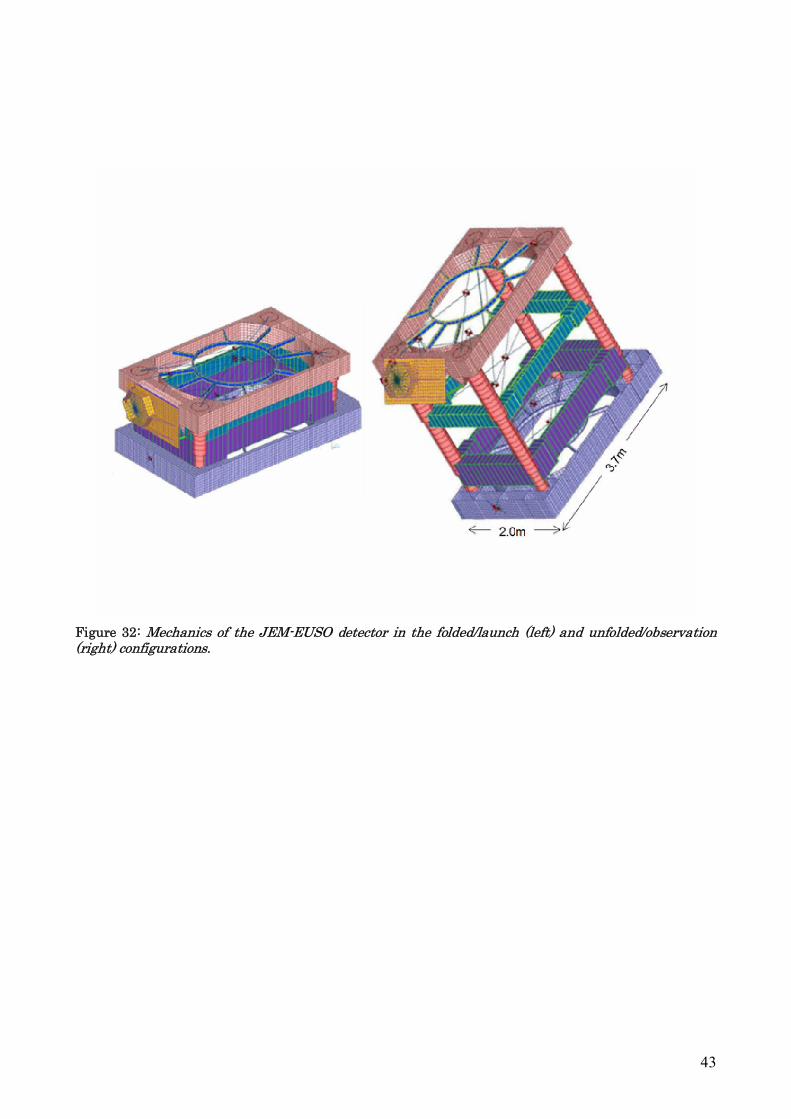
43
Figure 32: Mechanics of the JEM-EUSO detector in the folded/launch (left) and unfolded/observation (right) configurations.
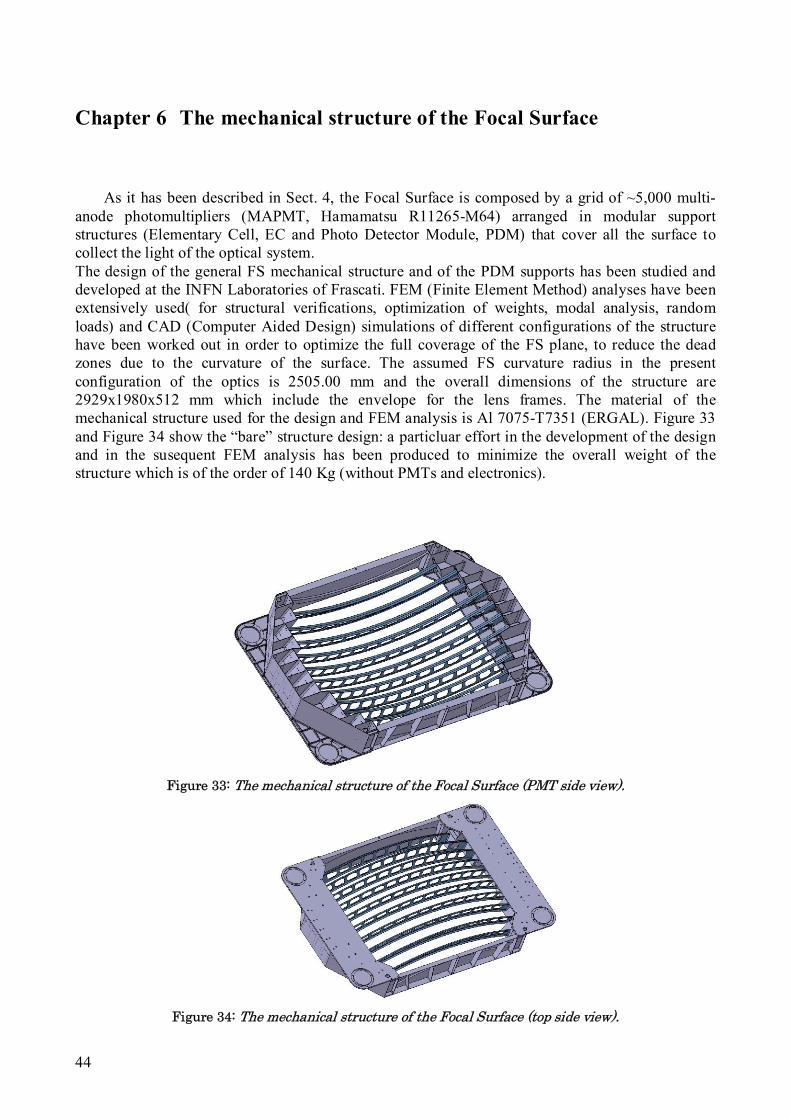
44
Chapter 6 The mechanical structure of the Focal Surface
As it has been described in Sect. 4, the Focal Surface is composed by a grid of ~5,000 multi-anode photomultipliers (MAPMT, Hamamatsu R11265-M64) arranged in modular support structures (Elementary Cell, EC and Photo Detector Module, PDM) that cover all the surface to collect the light of the optical system. The design of the general FS mechanical structure and of the PDM supports has been studied and developed at the INFN Laboratories of Frascati. FEM (Finite Element Method) analyses have been extensively used( for structural verifications, optimization of weights, modal analysis, random loads) and CAD (Computer Aided Design) simulations of different configurations of the structure have been worked out in order to optimize the full coverage of the FS plane, to reduce the dead zones due to the curvature of the surface. The assumed FS curvature radius in the present configuration of the optics is 2505.00 mm and the overall dimensions of the structure are 2929x1980x512 mm which include the envelope for the lens frames. The material of the mechanical structure used for the design and FEM analysis is Al 7075-T7351 (ERGAL). Figure 33 and Figure 34 show the “bare” structure design: a particluar effort in the development of the design and in the susequent FEM analysis has been produced to minimize the overall weight of the structure which is of the order of 140 Kg (without PMTs and electronics).
Figure 33: The mechanical structure of the Focal Surface (PMT side view).
Figure 34: The mechanical structure of the Focal Surface (top side view).
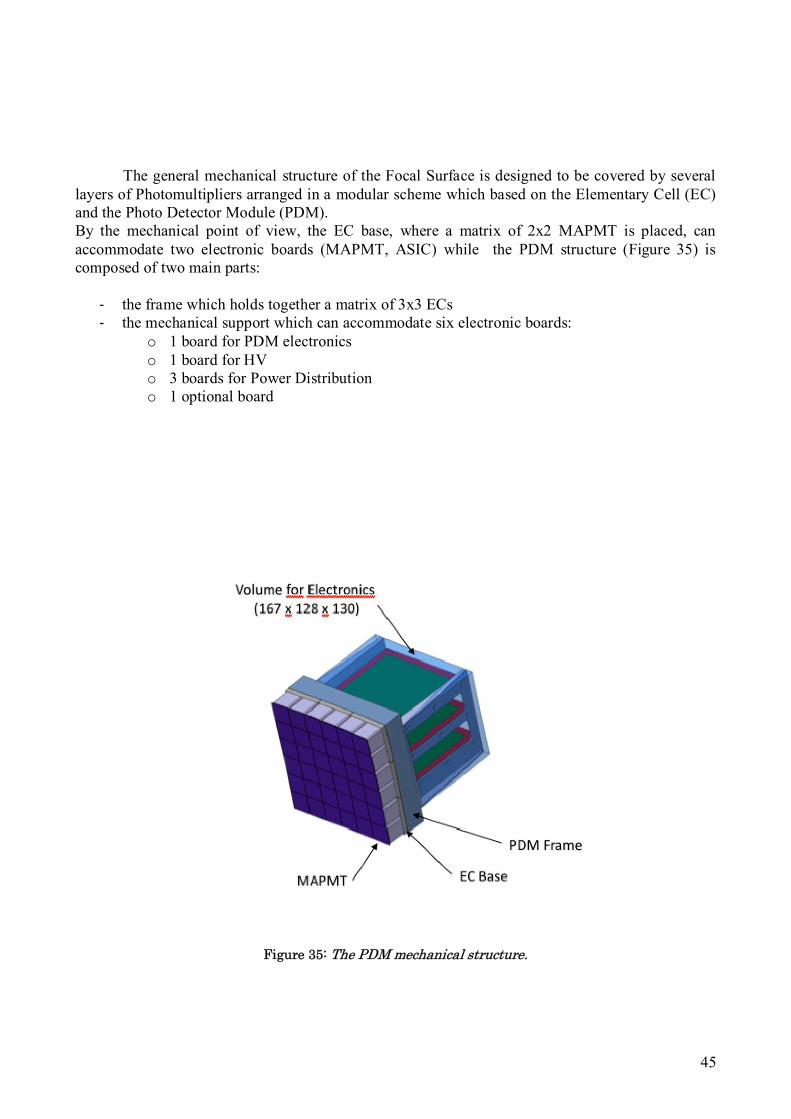
45
The general mechanical structure of the Focal Surface is designed to be covered by several layers of Photomultipliers arranged in a modular scheme which based on the Elementary Cell (EC) and the Photo Detector Module (PDM). By the mechanical point of view, the EC base, where a matrix of 2x2 MAPMT is placed, can accommodate two electronic boards (MAPMT, ASIC) while the PDM structure (Figure 35) is composed of two main parts:
- the frame which holds together a matrix of 3x3 ECs - the mechanical support which can accommodate six electronic boards:
o 1 board for PDM electronics o 1 board for HV o 3 boards for Power Distribution o 1 optional board
Figure 35: The PDM mechanical structure.
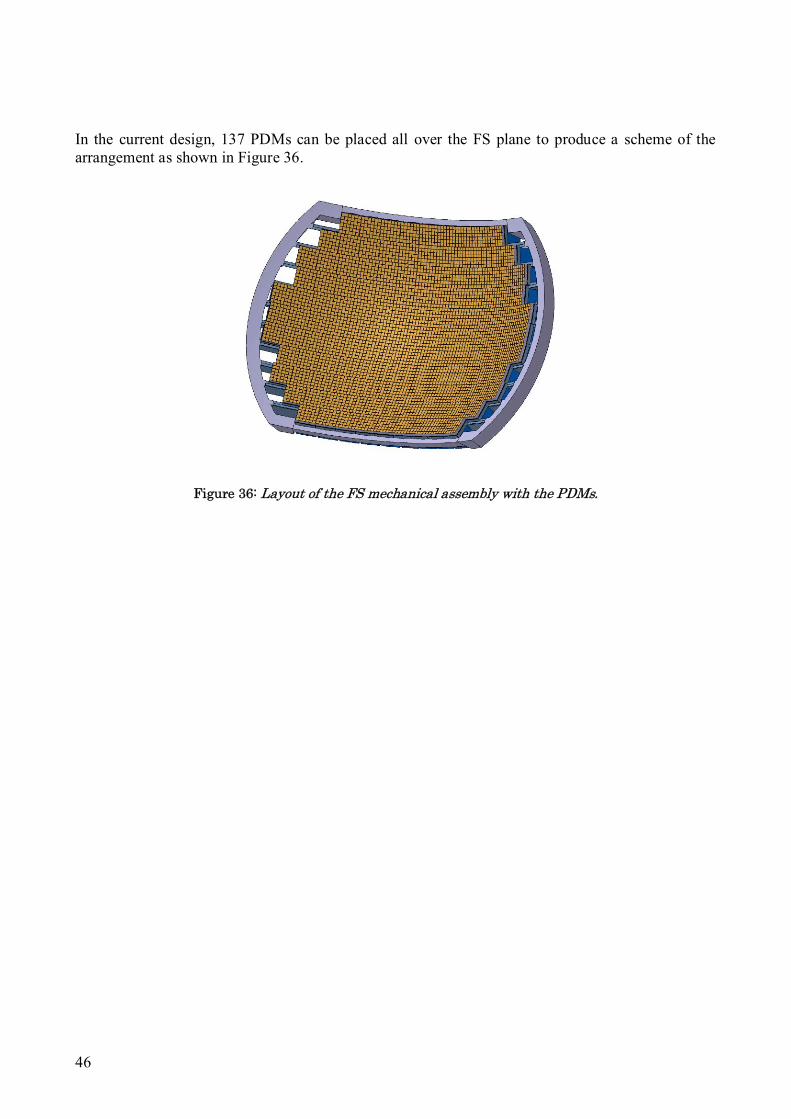
46
In the current design, 137 PDMs can be placed all over the FS plane to produce a scheme of the arrangement as shown in Figure 36.
Figure 36: Layout of the FS mechanical assembly with the PDMs.
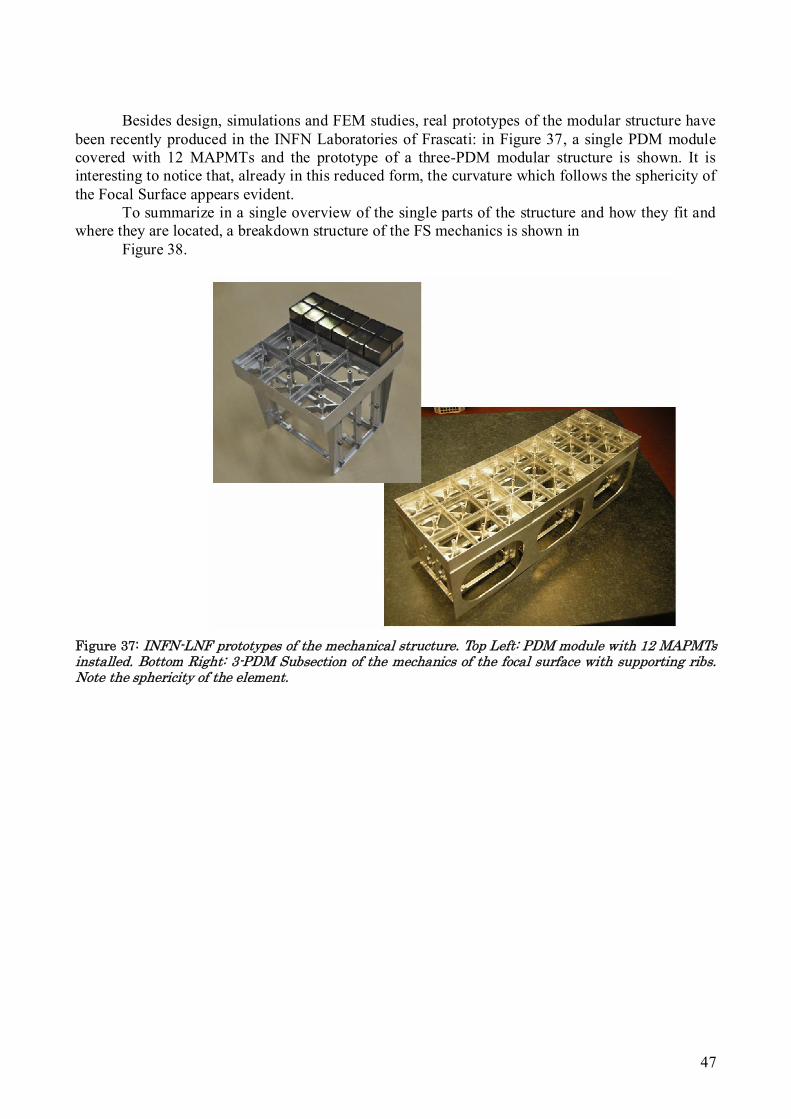
47
Besides design, simulations and FEM studies, real prototypes of the modular structure have
been recently produced in the INFN Laboratories of Frascati: in Figure 37, a single PDM module covered with 12 MAPMTs and the prototype of a three-PDM modular structure is shown. It is interesting to notice that, already in this reduced form, the curvature which follows the sphericity of the Focal Surface appears evident.
To summarize in a single overview of the single parts of the structure and how they fit and where they are located, a breakdown structure of the FS mechanics is shown in
Figure 38.
Figure 37: INFN-LNF prototypes of the mechanical structure. Top Left: PDM module with 12 MAPMTs installed. Bottom Right: 3-PDM Subsection of the mechanics of the focal surface with supporting ribs. Note the sphericity of the element.
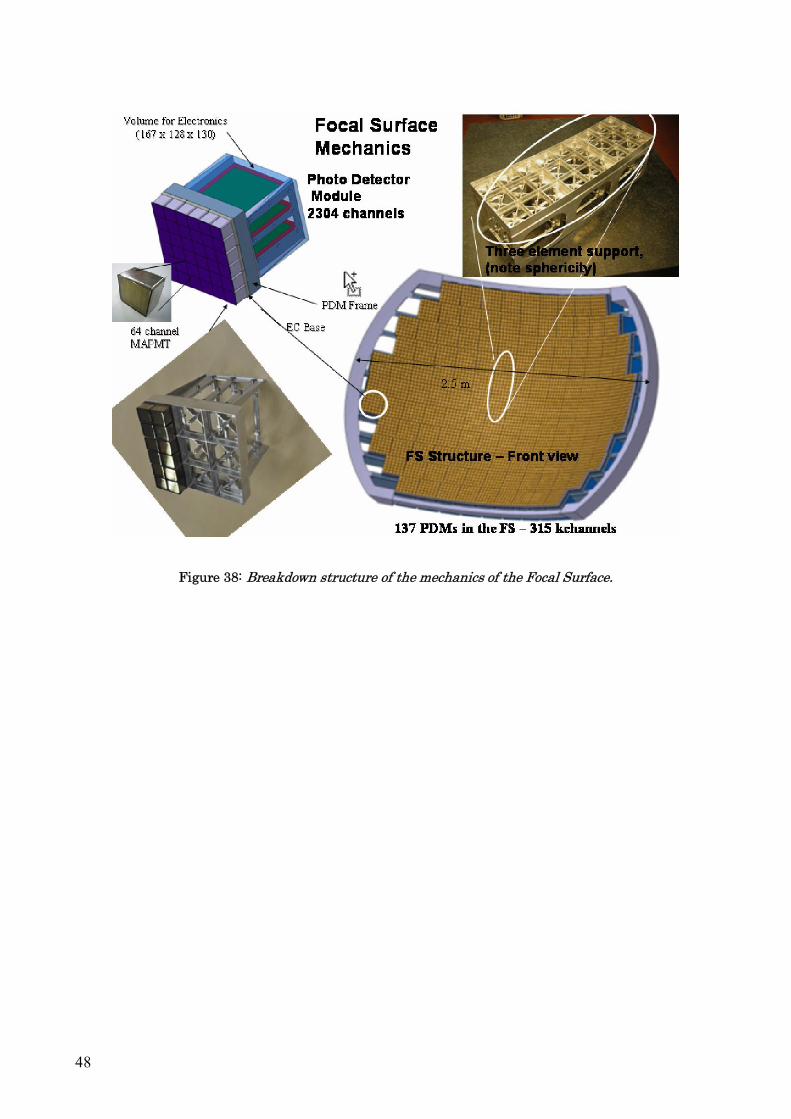
48
Figure 38: Breakdown structure of the mechanics of the Focal Surface.
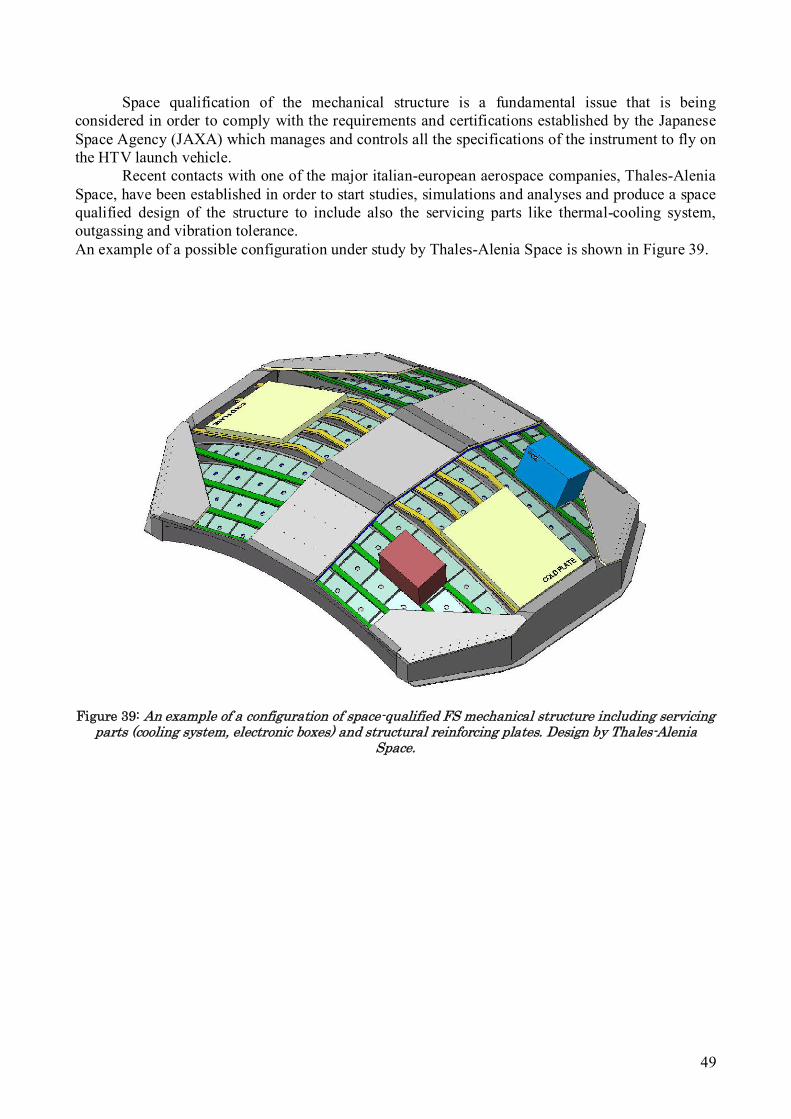
49
Space qualification of the mechanical structure is a fundamental issue that is being considered in order to comply with the requirements and certifications established by the Japanese Space Agency (JAXA) which manages and controls all the specifications of the instrument to fly on the HTV launch vehicle.
Recent contacts with one of the major italian-european aerospace companies, Thales-Alenia Space, have been established in order to start studies, simulations and analyses and produce a space qualified design of the structure to include also the servicing parts like thermal-cooling system, outgassing and vibration tolerance. An example of a possible configuration under study by Thales-Alenia Space is shown in Figure 39.
Figure 39: An example of a configuration of space-qualified FS mechanical structure including servicing
parts (cooling system, electronic boxes) and structural reinforcing plates. Design by Thales-Alenia Space.
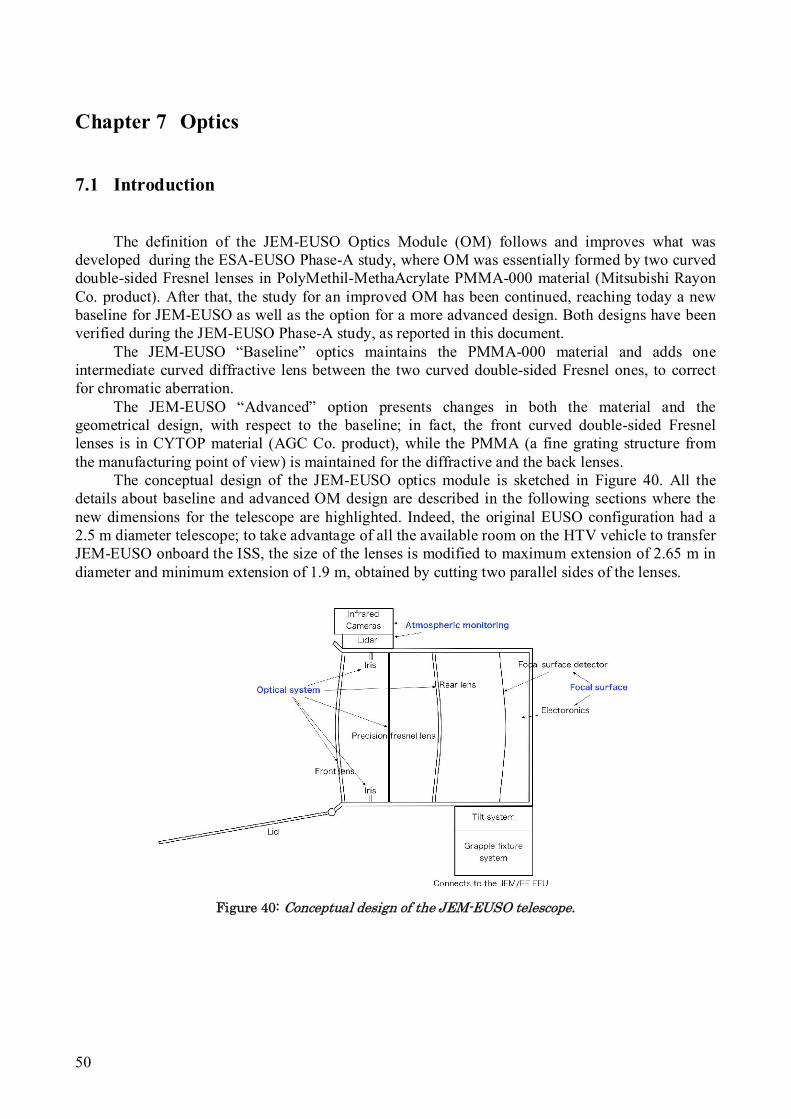
50
Chapter 7 Optics
7.1 Introduction
The definition of the JEM-EUSO Optics Module (OM) follows and improves what was developed during the ESA-EUSO Phase-A study, where OM was essentially formed by two curved double-sided Fresnel lenses in PolyMethil-MethaAcrylate PMMA-000 material (Mitsubishi Rayon Co. product). After that, the study for an improved OM has been continued, reaching today a new baseline for JEM-EUSO as well as the option for a more advanced design. Both designs have been verified during the JEM-EUSO Phase-A study, as reported in this document.
The JEM-EUSO “Baseline” optics maintains the PMMA-000 material and adds one intermediate curved diffractive lens between the two curved double-sided Fresnel ones, to correct for chromatic aberration.
The JEM-EUSO “Advanced” option presents changes in both the material and the geometrical design, with respect to the baseline; in fact, the front curved double-sided Fresnel lenses is in CYTOP material (AGC Co. product), while the PMMA (a fine grating structure from the manufacturing point of view) is maintained for the diffractive and the back lenses.
The conceptual design of the JEM-EUSO optics module is sketched in Figure 40. All the details about baseline and advanced OM design are described in the following sections where the new dimensions for the telescope are highlighted. Indeed, the original EUSO configuration had a 2.5 m diameter telescope; to take advantage of all the available room on the HTV vehicle to transfer JEM-EUSO onboard the ISS, the size of the lenses is modified to maximum extension of 2.65 m in diameter and minimum extension of 1.9 m, obtained by cutting two parallel sides of the lenses.
Figure 40: Conceptual design of the JEM-EUSO telescope.

51
JEM-EUSO optics focuses the incoming photon toward a pixel of the detector set on the optical focal surface. The collection of photons by the optics requires: Field of view ±30°. Entrance Pupil Diameter (EPD): 2.3m. Focal number f/# 1.25. Spot size smaller than the pixel size of the focal surface detector.
The large FoV is needed to retrieve enough statistics, while the pupil aperture must be as big as possible in order to detect the faint fluorescence and Cherenkov photons with enough signal.
Main parts:
Optics consists of the following parts: 1st lens (Curved double Fresnel lens) Stop (Iris) 2nd lens (Diffractive + Fresnel lens) 3rd lens (Curved double Fresnel lens) Filter Lens frame Focusing adjust system Housekeeping sensor
7.2 Requirements
Optics is able to detect atmospheric fluorescence and Cherenkov light from EAS. Optics is able to determine the emission point with spatial resolution of 0.1°. Optics is able to collect photons (330÷400 nm wavelength band) to a pixel of the focal detector
with a high efficiency (see performances). Spot size satisfies that the spatial resolution is 0.1° or less. Life span of optics is 5 years or more. Optics is “space qualified”.
Temperature requirements:
Optics basically depends on the surrounding environment. Allowed fluctuations for each lens have to be 10°C.
7.3 Optics design
The Optics Module (OM) is formed by two curved double Fresnel lenses and a diffractive lens for chromatic aberration correction. Indeed, the scientific requirements demand a challenging optical system, which is necessarily shaped by the need of large aperture, wide FoV and small F/# (to reduce the focal surface dimensions). A Fresnel system is the solution adopted for this mission: a Fresnel lens basically works as its prescription lens, with the advantage of being lighter and consequently more transparent on the UV. A lightweight design is really compulsory, since for the considered conditions a normal lens system would be too expensive, not adequate and also difficult to carry into space. The design of the OM is therefore constrained also on the availability of suitable materials that are enough transparent in the UV.
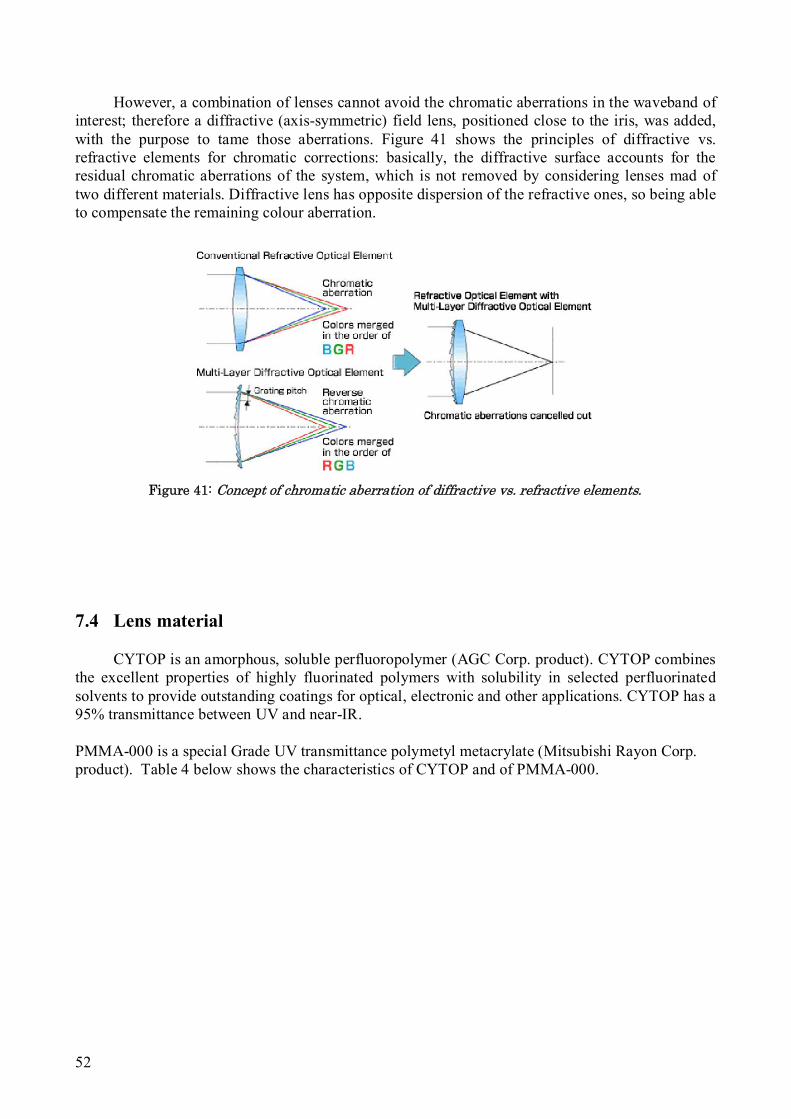
52
However, a combination of lenses cannot avoid the chromatic aberrations in the waveband of interest; therefore a diffractive (axis-symmetric) field lens, positioned close to the iris, was added, with the purpose to tame those aberrations. Figure 41 shows the principles of diffractive vs. refractive elements for chromatic corrections: basically, the diffractive surface accounts for the residual chromatic aberrations of the system, which is not removed by considering lenses mad of two different materials. Diffractive lens has opposite dispersion of the refractive ones, so being able to compensate the remaining colour aberration.
Figure 41: Concept of chromatic aberration of diffractive vs. refractive elements.
7.4 Lens material
CYTOP is an amorphous, soluble perfluoropolymer (AGC Corp. product). CYTOP combines the excellent properties of highly fluorinated polymers with solubility in selected perfluorinated solvents to provide outstanding coatings for optical, electronic and other applications. CYTOP has a 95% transmittance between UV and near-IR. PMMA-000 is a special Grade UV transmittance polymetyl metacrylate (Mitsubishi Rayon Corp. product). Table 4 below shows the characteristics of CYTOP and of PMMA-000.
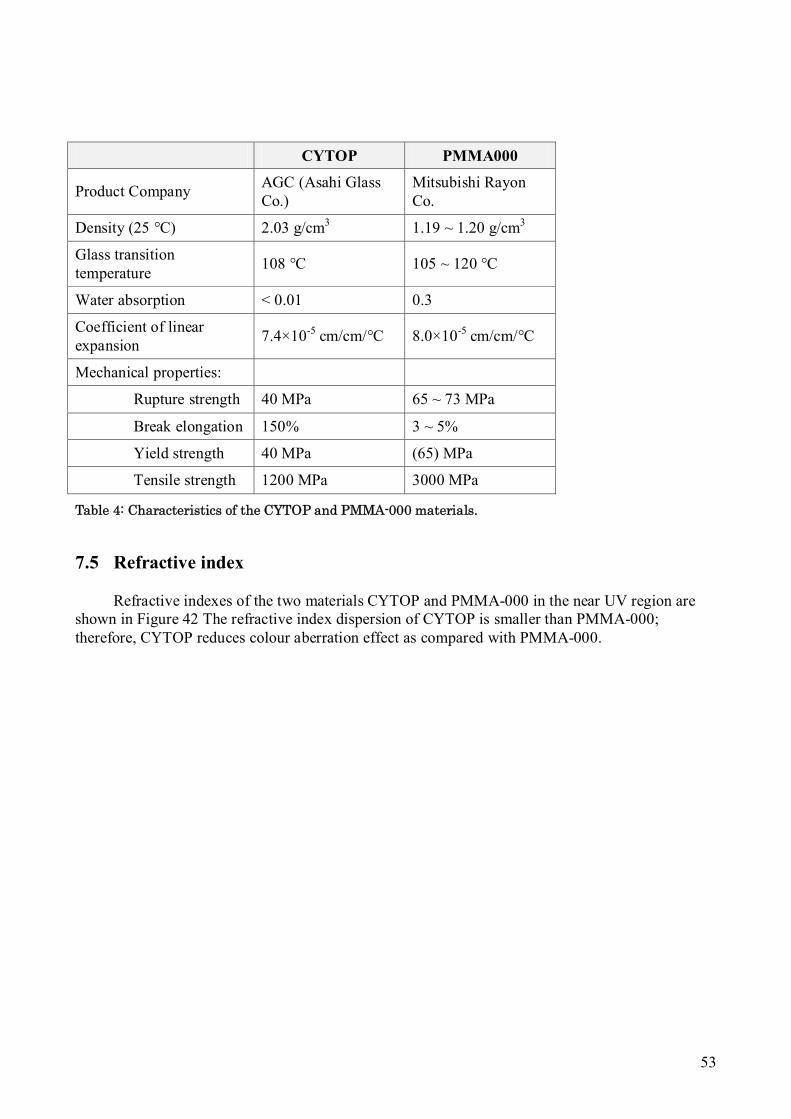
53
CYTOP PMMA000
Product Company AGC (Asahi Glass Co.)
Mitsubishi Rayon Co.
Density (25 °C) 2.03 g/cm3 1.19 ~ 1.20 g/cm3
Glass transition temperature
108 °C 105 ~ 120 °C
Water absorption < 0.01 0.3
Coefficient of linear expansion
7.4×10⁻⁵ cm/cm/°C 8.0×10⁻⁵ cm/cm/°C
Mechanical properties:
Rupture strength 40 MPa 65 ~ 73 MPa
Break elongation 150% 3 ~ 5%
Yield strength 40 MPa (65) MPa
Tensile strength 1200 MPa 3000 MPa
Table 4: Characteristics of the CYTOP and PMMA-000 materials.
7.5 Refractive index
Refractive indexes of the two materials CYTOP and PMMA-000 in the near UV region are shown in Figure 42 The refractive index dispersion of CYTOP is smaller than PMMA-000; therefore, CYTOP reduces colour aberration effect as compared with PMMA-000.
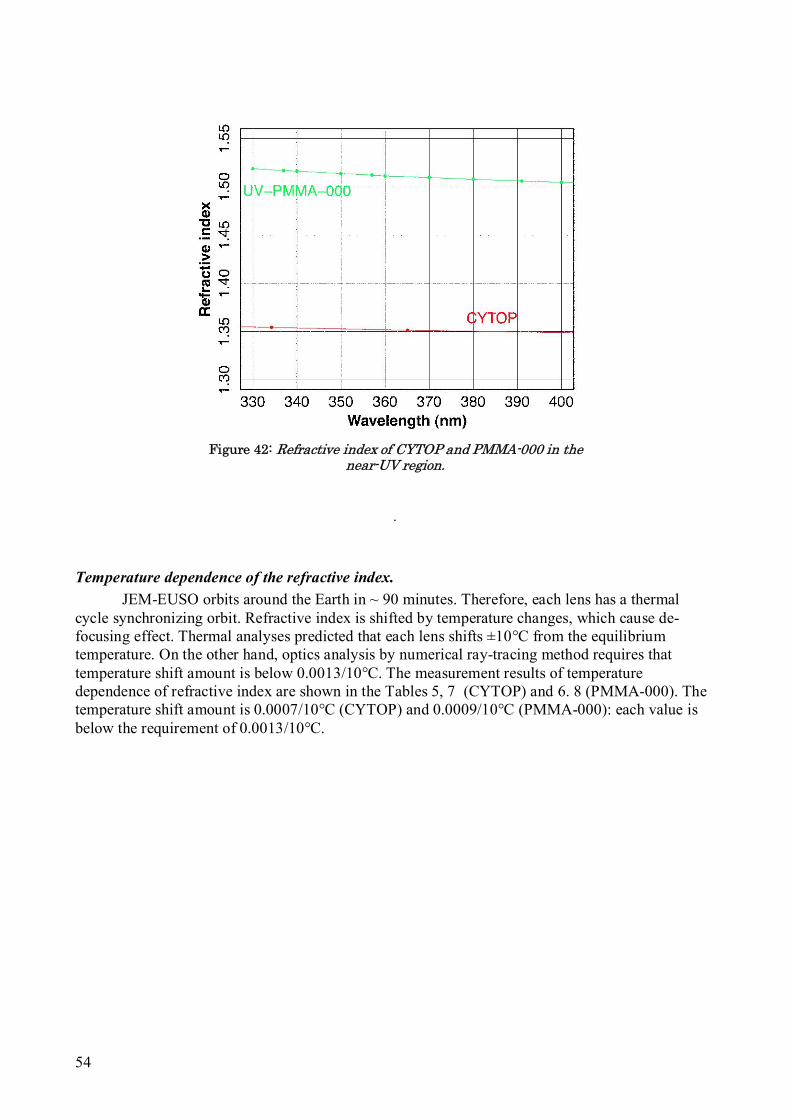
54
Figure 42: Refractive index of CYTOP and PMMA-000 in the near-UV region.
.
Temperature dependence of the refractive index.
JEM-EUSO orbits around the Earth in ~ 90 minutes. Therefore, each lens has a thermal cycle synchronizing orbit. Refractive index is shifted by temperature changes, which cause de-focusing effect. Thermal analyses predicted that each lens shifts ±10°C from the equilibrium temperature. On the other hand, optics analysis by numerical ray-tracing method requires that temperature shift amount is below 0.0013/10°C. The measurement results of temperature dependence of refractive index are shown in the Tables 5, 7 (CYTOP) and 6. 8 (PMMA-000). The temperature shift amount is 0.0007/10°C (CYTOP) and 0.0009/10°C (PMMA-000): each value is below the requirement of 0.0013/10°C.
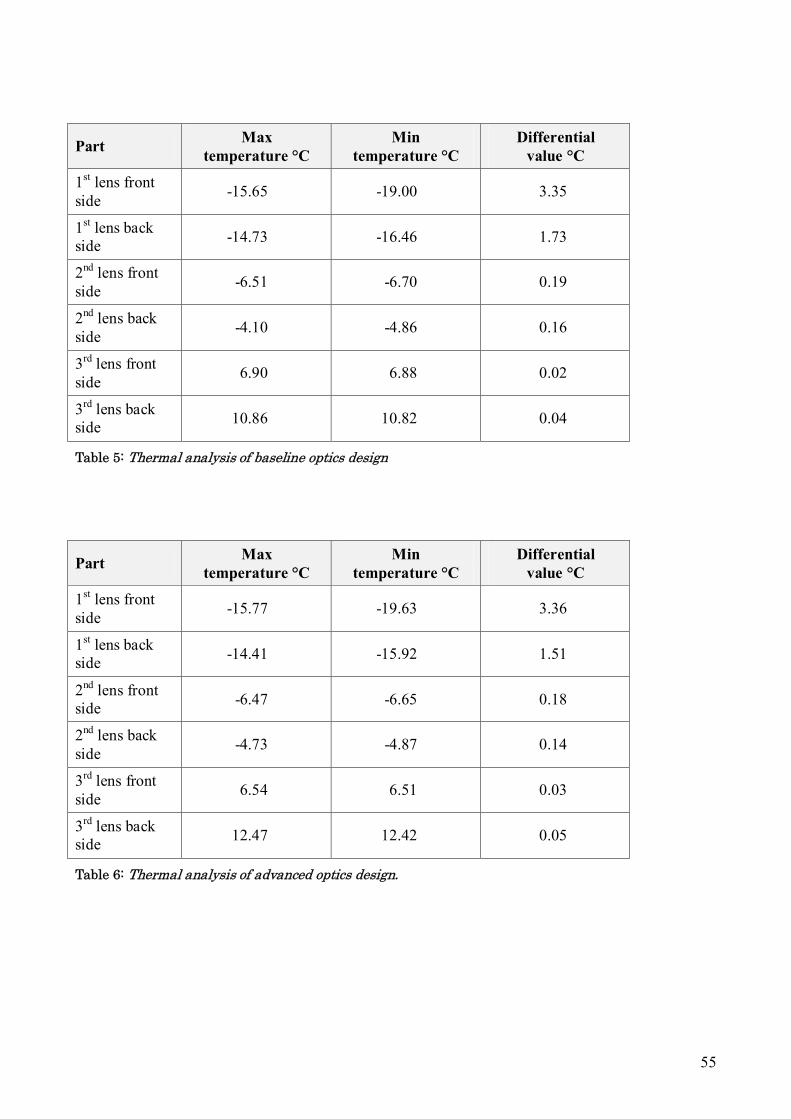
55
Part Max
temperature °C Min
temperature °C Differential
value °C
1st lens front side
-15.65 -19.00 3.35
1st lens back side
-14.73 -16.46 1.73
2nd lens front side
-6.51 -6.70 0.19
2nd lens back side
-4.10 -4.86 0.16
3rd lens front side
6.90 6.88 0.02
3rd lens back side
10.86 10.82 0.04
Table 5: Thermal analysis of baseline optics design
Part Max
temperature °C Min
temperature °C Differential
value °C
1st lens front side
-15.77 -19.63 3.36
1st lens back side
-14.41 -15.92 1.51
2nd lens front side
-6.47 -6.65 0.18
2nd lens back side
-4.73 -4.87 0.14
3rd lens front side
6.54 6.51 0.03
3rd lens back side
12.47 12.42 0.05
Table 6: Thermal analysis of advanced optics design.
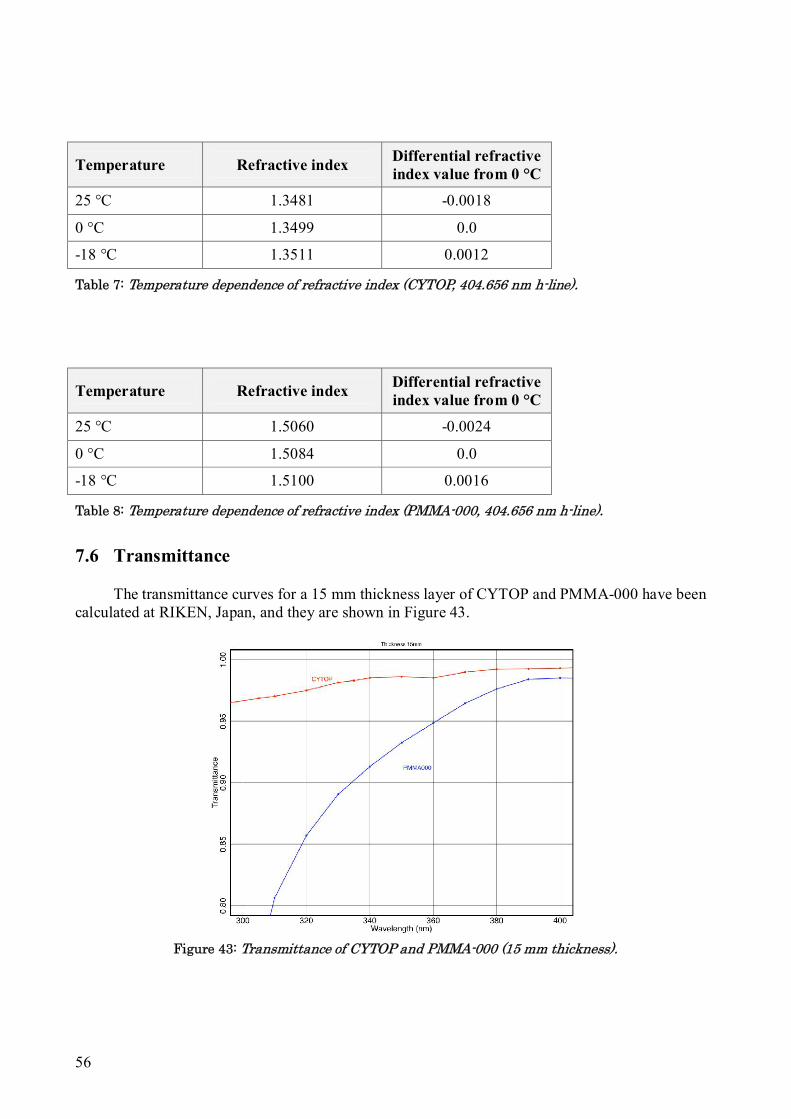
56
Temperature Refractive index Differential refractive index value from 0 °C
25 °C 1.3481 -0.0018
0 °C 1.3499 0.0
-18 °C 1.3511 0.0012
Table 7: Temperature dependence of refractive index (CYTOP, 404.656 nm h-line).
Temperature Refractive index Differential refractive index value from 0 °C
25 °C 1.5060 -0.0024
0 °C 1.5084 0.0
-18 °C 1.5100 0.0016
Table 8: Temperature dependence of refractive index (PMMA-000, 404.656 nm h-line).
7.6 Transmittance
The transmittance curves for a 15 mm thickness layer of CYTOP and PMMA-000 have been calculated at RIKEN, Japan, and they are shown in Figure 43.
Figure 43: Transmittance of CYTOP and PMMA-000 (15 mm thickness).
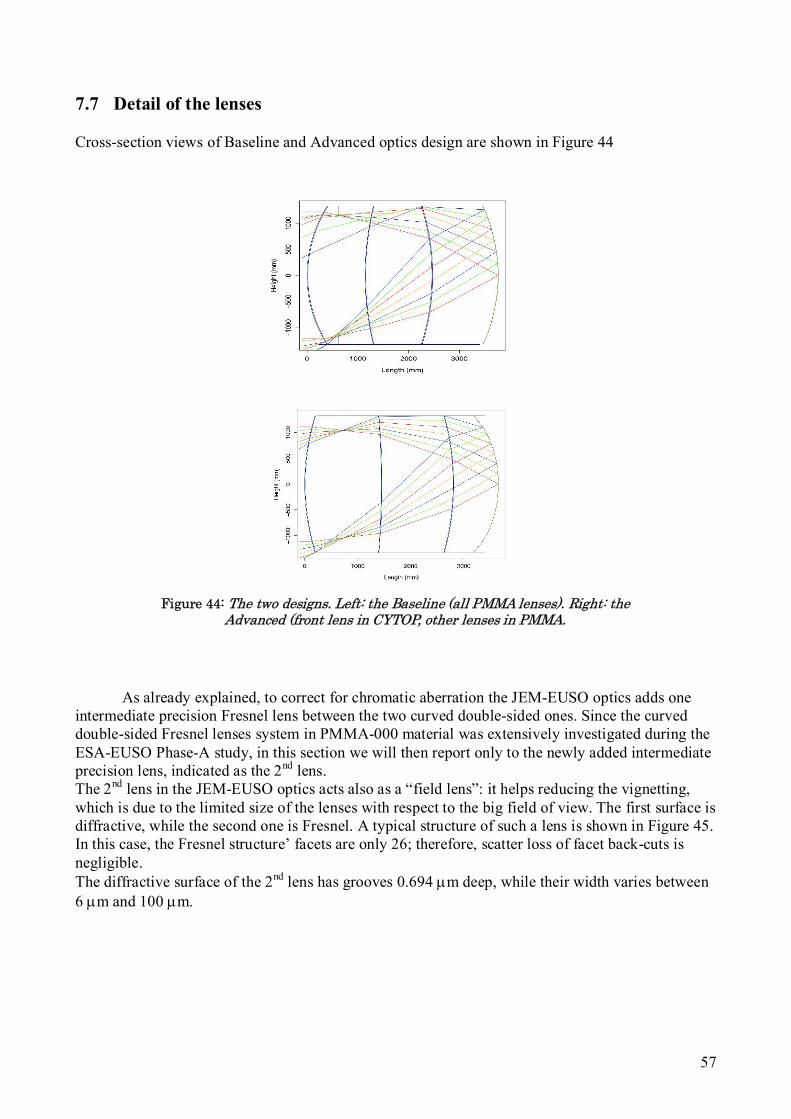
57
7.7 Detail of the lenses Cross-section views of Baseline and Advanced optics design are shown in Figure 44
Figure 44: The two designs. Left: the Baseline (all PMMA lenses). Right: the Advanced (front lens in CYTOP, other lenses in PMMA.
As already explained, to correct for chromatic aberration the JEM-EUSO optics adds one
intermediate precision Fresnel lens between the two curved double-sided ones. Since the curved double-sided Fresnel lenses system in PMMA-000 material was extensively investigated during the ESA-EUSO Phase-A study, in this section we will then report only to the newly added intermediate precision lens, indicated as the 2nd lens. The 2nd lens in the JEM-EUSO optics acts also as a “field lens”: it helps reducing the vignetting, which is due to the limited size of the lenses with respect to the big field of view. The first surface is diffractive, while the second one is Fresnel. A typical structure of such a lens is shown in Figure 45. In this case, the Fresnel structure’ facets are only 26; therefore, scatter loss of facet back-cuts is negligible. The diffractive surface of the 2nd lens has grooves 0.694 m deep, while their width varies between 6 m and 100 m.
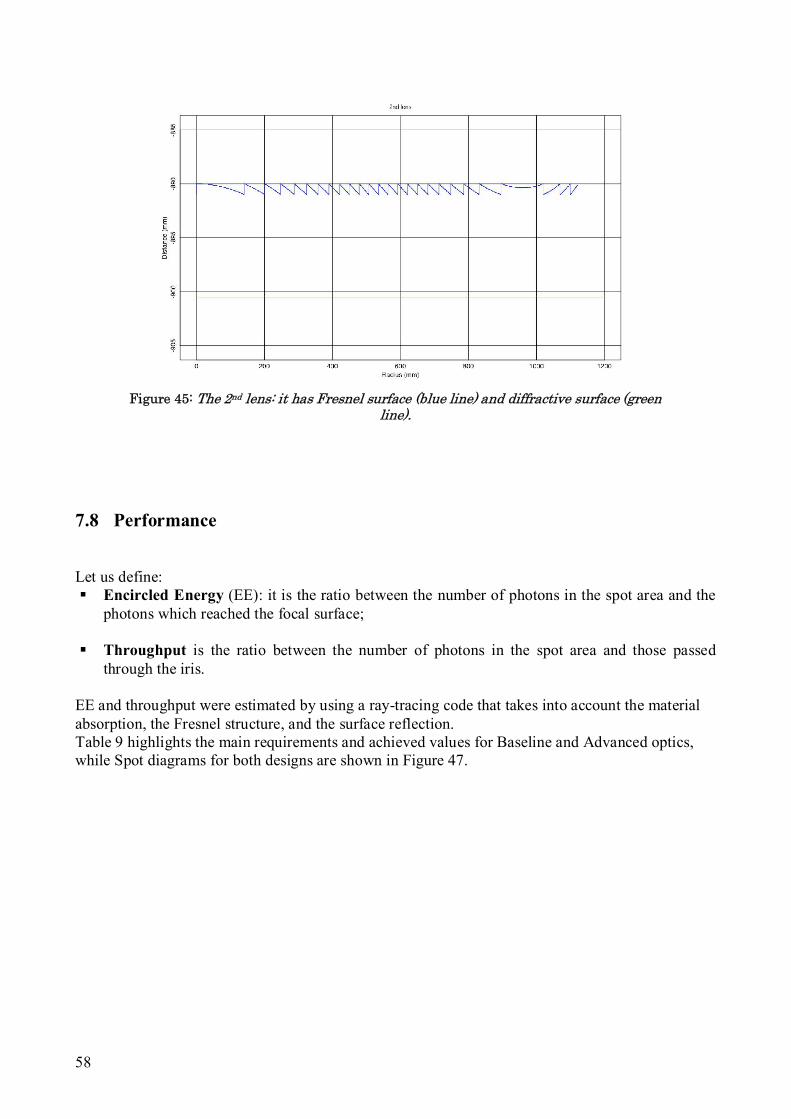
58
Figure 45: The 2nd lens: it has Fresnel surface (blue line) and diffractive surface (green line).
7.8 Performance
Let us define: Encircled Energy (EE): it is the ratio between the number of photons in the spot area and the
photons which reached the focal surface; Throughput is the ratio between the number of photons in the spot area and those passed
through the iris. EE and throughput were estimated by using a ray-tracing code that takes into account the material absorption, the Fresnel structure, and the surface reflection. Table 9 highlights the main requirements and achieved values for Baseline and Advanced optics, while Spot diagrams for both designs are shown in Figure 47.
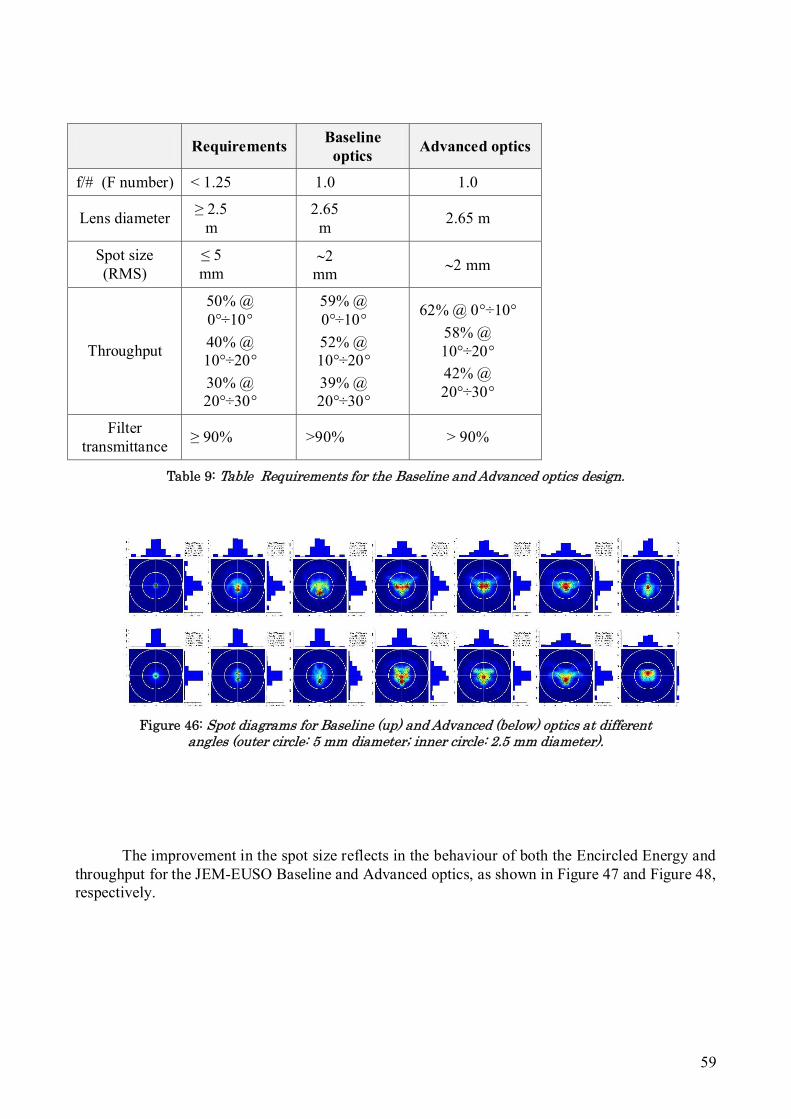
59
Requirements Baseline
optics Advanced optics
f/# (F number) < 1.25 1.0 1.0
Lens diameter ≥ 2.5
m 2.65
m 2.65 m
Spot size (RMS)
≤ 5 mm
2 mm
2 mm
Throughput
50% @ 0°÷10°
40% @ 10°÷20°
30% @ 20°÷30°
59% @ 0°÷10°
52% @ 10°÷20°
39% @ 20°÷30°
62% @ 0°÷10°
58% @ 10°÷20°
42% @ 20°÷30°
Filter transmittance
≥ 90% >90% > 90%
Table 9: Table Requirements for the Baseline and Advanced optics design.
Figure 46: Spot diagrams for Baseline (up) and Advanced (below) optics at different angles (outer circle: 5 mm diameter; inner circle: 2.5 mm diameter).
The improvement in the spot size reflects in the behaviour of both the Encircled Energy and throughput for the JEM-EUSO Baseline and Advanced optics, as shown in Figure 47 and Figure 48, respectively.
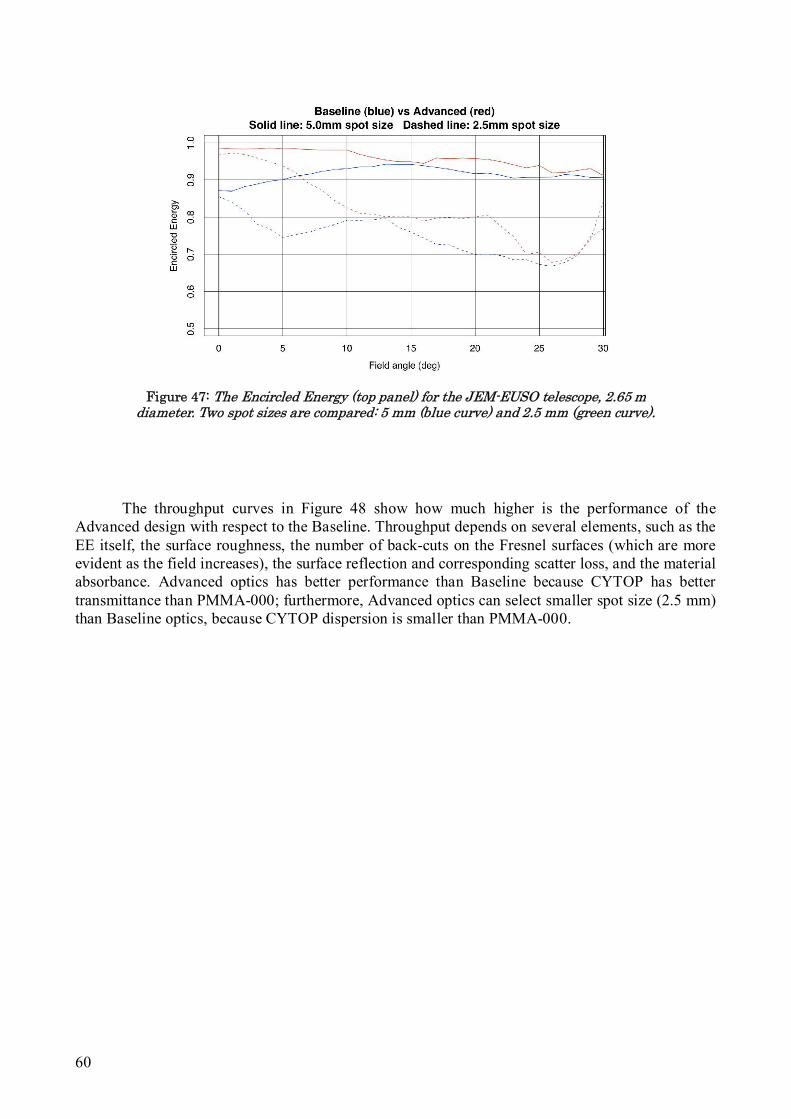
60
Figure 47: The Encircled Energy (top panel) for the JEM-EUSO telescope, 2.65 m diameter. Two spot sizes are compared: 5 mm (blue curve) and 2.5 mm (green curve).
The throughput curves in Figure 48 show how much higher is the performance of the
Advanced design with respect to the Baseline. Throughput depends on several elements, such as the EE itself, the surface roughness, the number of back-cuts on the Fresnel surfaces (which are more evident as the field increases), the surface reflection and corresponding scatter loss, and the material absorbance. Advanced optics has better performance than Baseline because CYTOP has better transmittance than PMMA-000; furthermore, Advanced optics can select smaller spot size (2.5 mm) than Baseline optics, because CYTOP dispersion is smaller than PMMA-000.
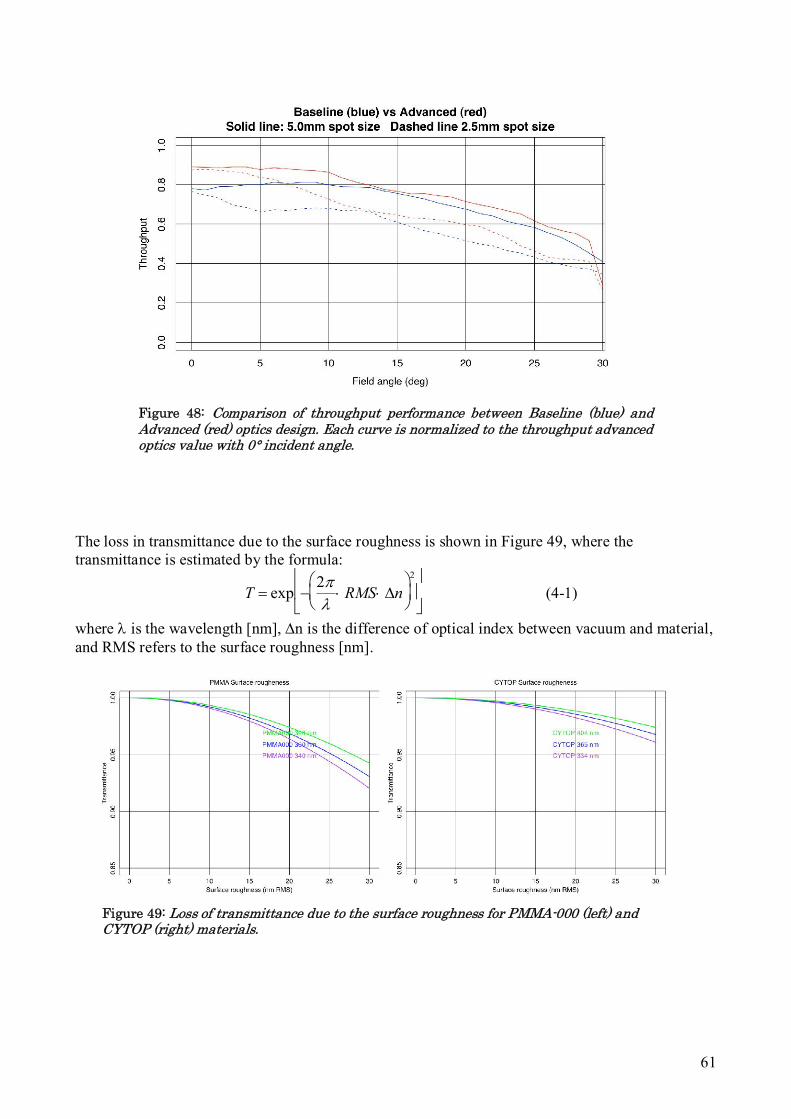
61
Figure 48: Comparison of throughput performance between Baseline (blue) and Advanced (red) optics design. Each curve is normalized to the throughput advanced optics value with 0° incident angle.
The loss in transmittance due to the surface roughness is shown in Figure 49, where the transmittance is estimated by the formula:
T exp 2
RMS n
2
(4-1)
where is the wavelength [nm], n is the difference of optical index between vacuum and material, and RMS refers to the surface roughness [nm].
Figure 49: Loss of transmittance due to the surface roughness for PMMA-000 (left) and CYTOP (right) materials.
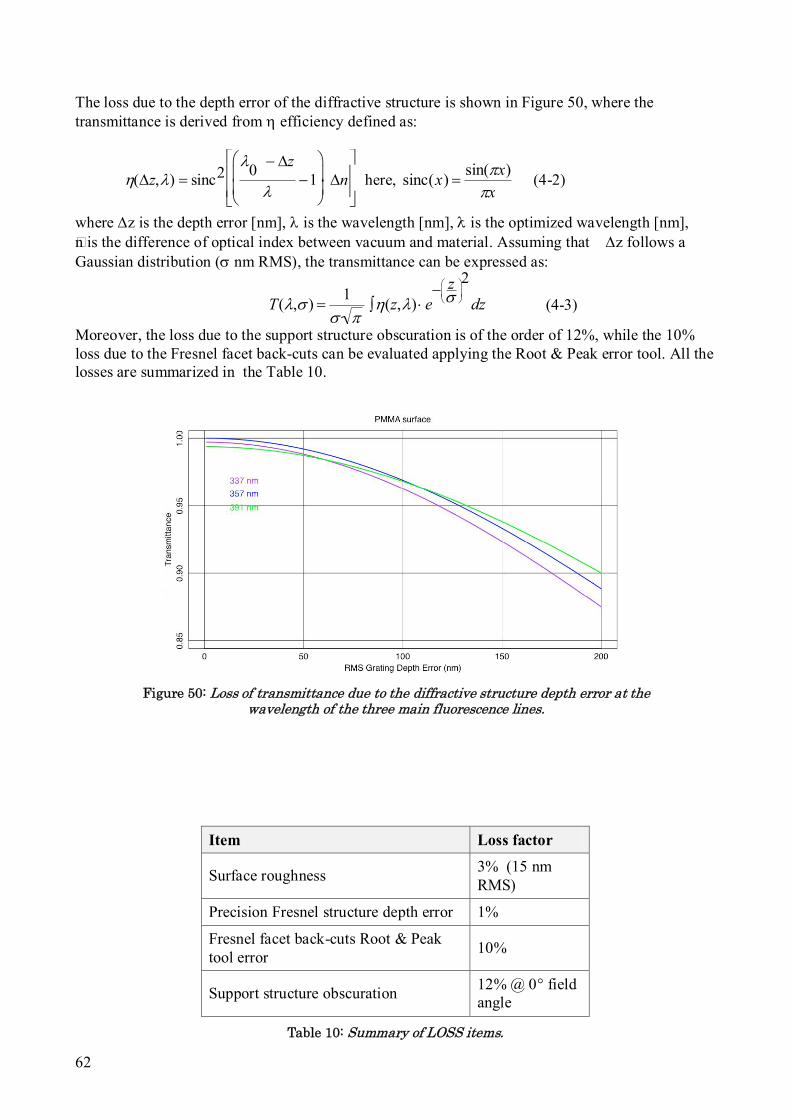
62
The loss due to the depth error of the diffractive structure is shown in Figure 50, where the transmittance is derived from efficiency defined as:
(z,) sinc2
0 z
1
n
here, sinc(x)
sin(x)
x (4-2)
where z is the depth error [nm], is the wavelength [nm], is the optimized wavelength [nm], n is the difference of optical index between vacuum and material. Assuming that z follows a Gaussian distribution ( nm RMS), the transmittance can be expressed as:
T(, ) 1
(z,) e
z
2
dz (4-3)
Moreover, the loss due to the support structure obscuration is of the order of 12%, while the 10% loss due to the Fresnel facet back-cuts can be evaluated applying the Root & Peak error tool. All the losses are summarized in the Table 10.
Figure 50: Loss of transmittance due to the diffractive structure depth error at the wavelength of the three main fluorescence lines.
Item Loss factor
Surface roughness 3% (15 nm RMS)
Precision Fresnel structure depth error 1%
Fresnel facet back-cuts Root & Peak tool error
10%
Support structure obscuration 12% @ 0° field angle
Table 10: Summary of LOSS items.
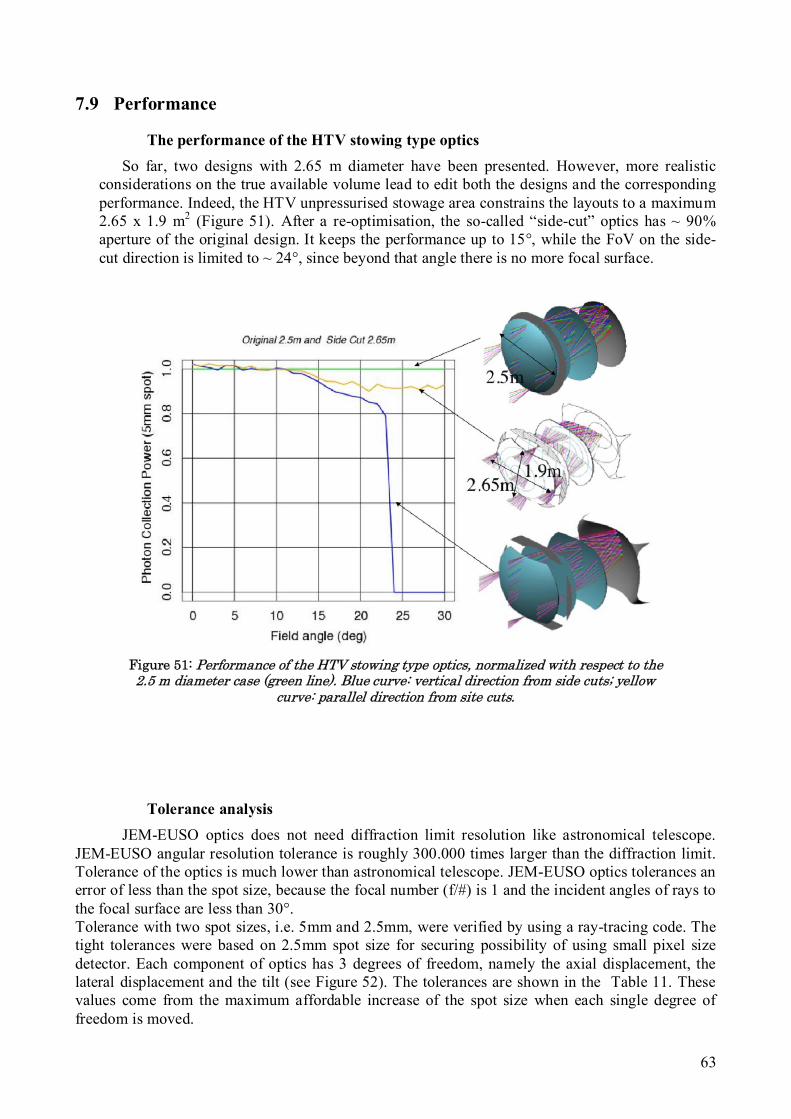
63
7.9 Performance
The performance of the HTV stowing type optics
So far, two designs with 2.65 m diameter have been presented. However, more realistic considerations on the true available volume lead to edit both the designs and the corresponding performance. Indeed, the HTV unpressurised stowage area constrains the layouts to a maximum 2.65 x 1.9 m2 (Figure 51). After a re-optimisation, the so-called “side-cut” optics has ~ 90% aperture of the original design. It keeps the performance up to 15°, while the FoV on the side-cut direction is limited to ~ 24°, since beyond that angle there is no more focal surface.
Figure 51: Performance of the HTV stowing type optics, normalized with respect to the 2.5 m diameter case (green line). Blue curve: vertical direction from side cuts; yellow
curve: parallel direction from site cuts.
Tolerance analysis
JEM-EUSO optics does not need diffraction limit resolution like astronomical telescope. JEM-EUSO angular resolution tolerance is roughly 300.000 times larger than the diffraction limit. Tolerance of the optics is much lower than astronomical telescope. JEM-EUSO optics tolerances an error of less than the spot size, because the focal number (f/#) is 1 and the incident angles of rays to the focal surface are less than 30°. Tolerance with two spot sizes, i.e. 5mm and 2.5mm, were verified by using a ray-tracing code. The tight tolerances were based on 2.5mm spot size for securing possibility of using small pixel size detector. Each component of optics has 3 degrees of freedom, namely the axial displacement, the lateral displacement and the tilt (see Figure 52). The tolerances are shown in the Table 11. These values come from the maximum affordable increase of the spot size when each single degree of freedom is moved.
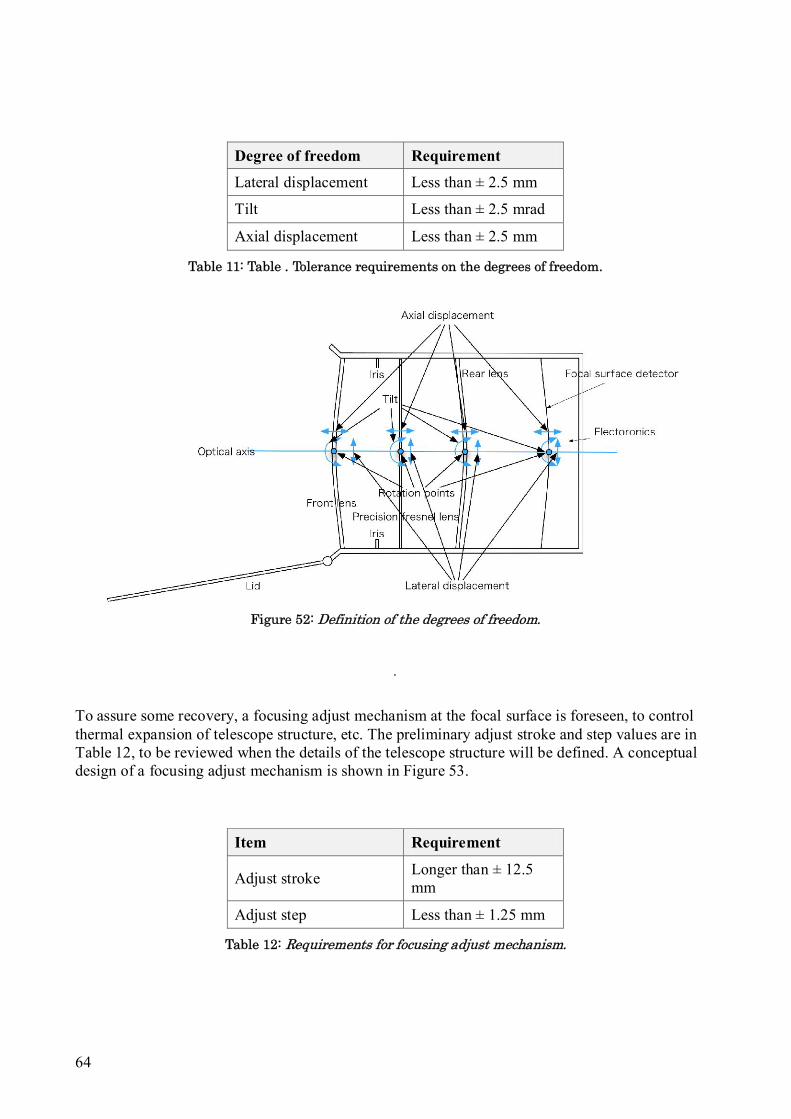
64
Degree of freedom Requirement
Lateral displacement Less than ± 2.5 mm
Tilt Less than ± 2.5 mrad
Axial displacement Less than ± 2.5 mm
Table 11: Table . Tolerance requirements on the degrees of freedom.
Figure 52: Definition of the degrees of freedom.
.
To assure some recovery, a focusing adjust mechanism at the focal surface is foreseen, to control thermal expansion of telescope structure, etc. The preliminary adjust stroke and step values are in Table 12, to be reviewed when the details of the telescope structure will be defined. A conceptual design of a focusing adjust mechanism is shown in Figure 53.
Item Requirement
Adjust stroke Longer than ± 12.5 mm
Adjust step Less than ± 1.25 mm
Table 12: Requirements for focusing adjust mechanism.
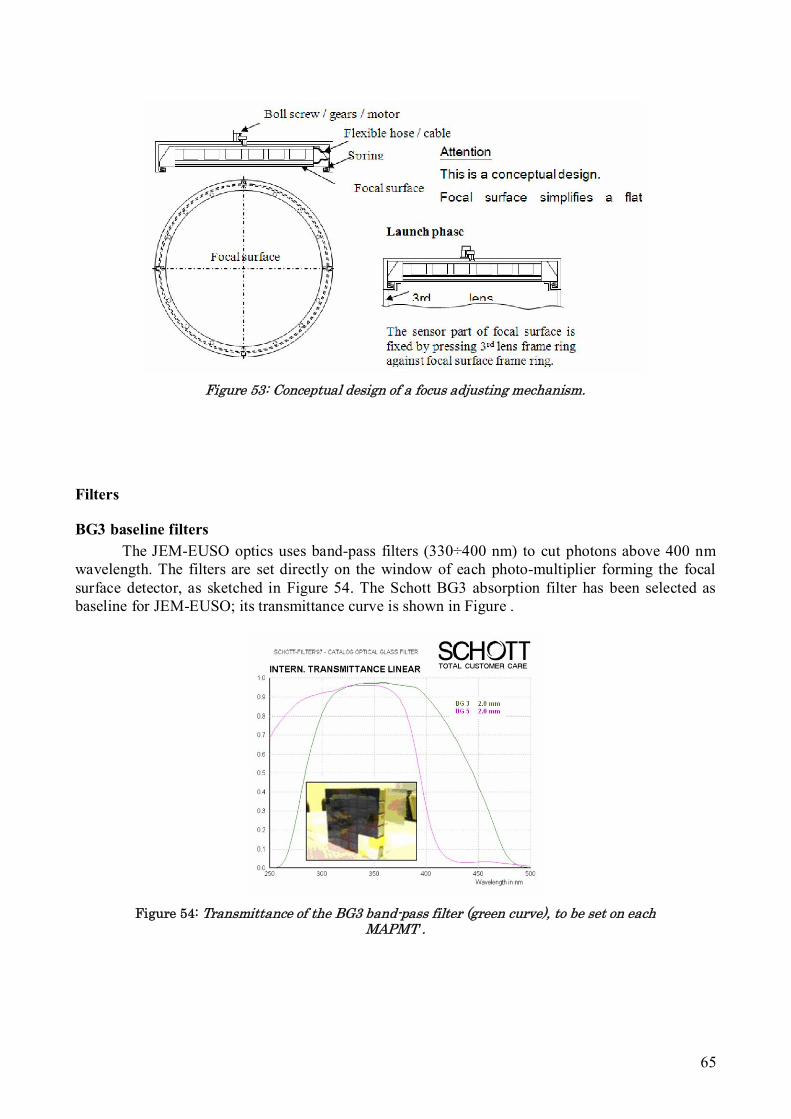
65
Figure 53: Conceptual design of a focus adjusting mechanism.
Filters
BG3 baseline filters
The JEM-EUSO optics uses band-pass filters (330÷400 nm) to cut photons above 400 nm wavelength. The filters are set directly on the window of each photo-multiplier forming the focal surface detector, as sketched in Figure 54. The Schott BG3 absorption filter has been selected as baseline for JEM-EUSO; its transmittance curve is shown in Figure .
Figure 54: Transmittance of the BG3 band-pass filter (green curve), to be set on each MAPMT .
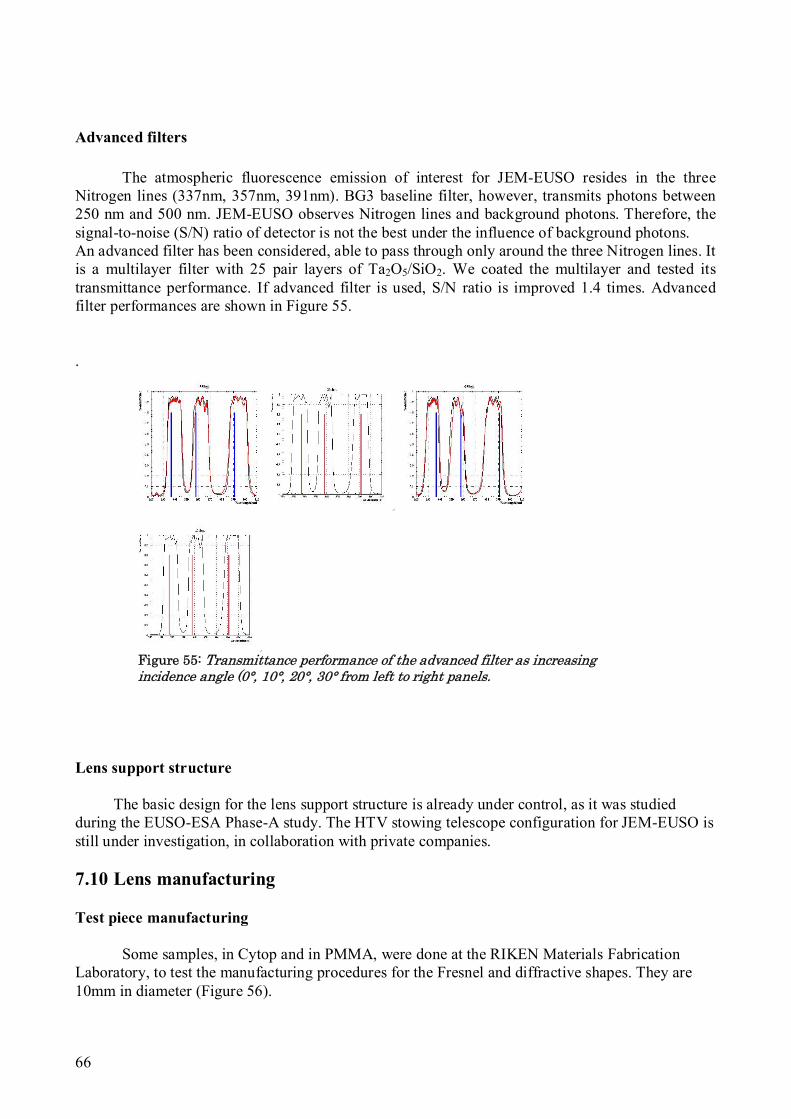
66
Advanced filters
The atmospheric fluorescence emission of interest for JEM-EUSO resides in the three
Nitrogen lines (337nm, 357nm, 391nm). BG3 baseline filter, however, transmits photons between 250 nm and 500 nm. JEM-EUSO observes Nitrogen lines and background photons. Therefore, the signal-to-noise (S/N) ratio of detector is not the best under the influence of background photons. An advanced filter has been considered, able to pass through only around the three Nitrogen lines. It is a multilayer filter with 25 pair layers of Ta2O5/SiO2. We coated the multilayer and tested its transmittance performance. If advanced filter is used, S/N ratio is improved 1.4 times. Advanced filter performances are shown in Figure 55. .
Figure 55: Transmittance performance of the advanced filter as increasing incidence angle (0°, 10°, 20°, 30° from left to right panels.
Lens support structure
The basic design for the lens support structure is already under control, as it was studied during the EUSO-ESA Phase-A study. The HTV stowing telescope configuration for JEM-EUSO is still under investigation, in collaboration with private companies.
7.10 Lens manufacturing Test piece manufacturing
Some samples, in Cytop and in PMMA, were done at the RIKEN Materials Fabrication Laboratory, to test the manufacturing procedures for the Fresnel and diffractive shapes. They are 10mm in diameter (Figure 56).
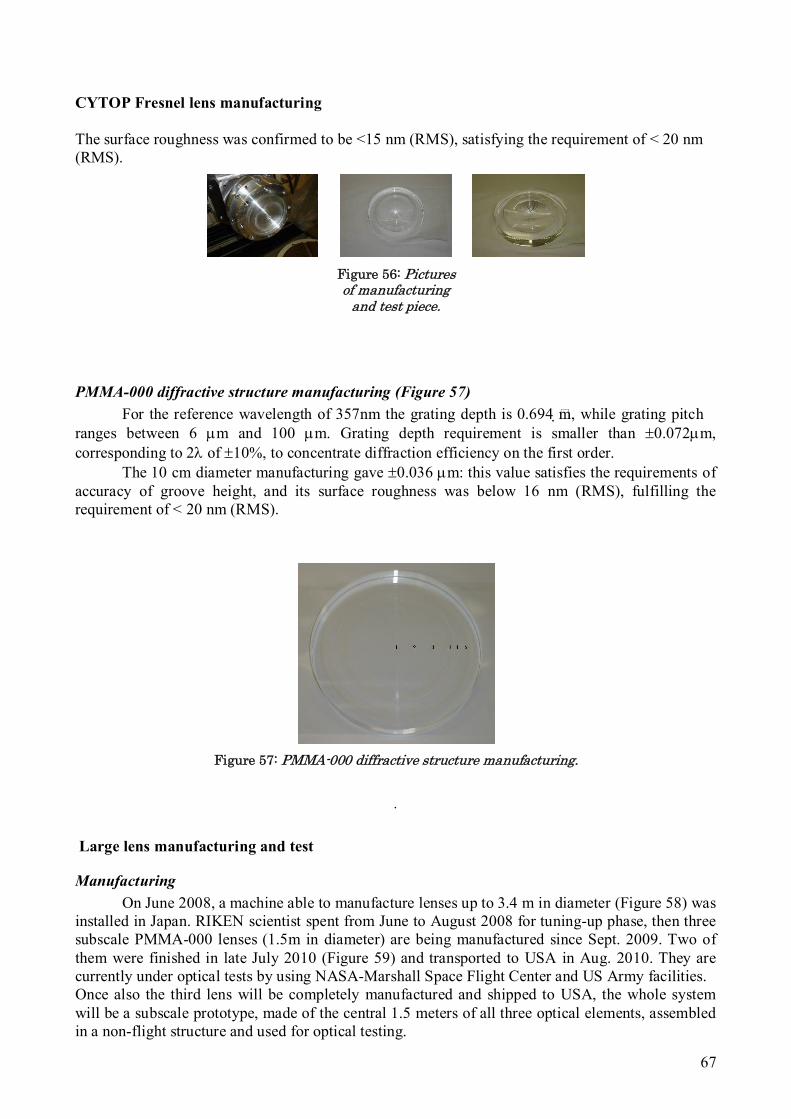
67
CYTOP Fresnel lens manufacturing The surface roughness was confirmed to be <15 nm (RMS), satisfying the requirement of < 20 nm (RMS).
Figure 56: Pictures of manufacturing
and test piece.
PMMA-000 diffractive structure manufacturing (Figure 57)
For the reference wavelength of 357nm the grating depth is 0.694 m, while grating pitch ranges between 6 m and 100 m. Grating depth requirement is smaller than 0.072m, corresponding to 2 of 10%, to concentrate diffraction efficiency on the first order.
The 10 cm diameter manufacturing gave 0.036 m: this value satisfies the requirements of accuracy of groove height, and its surface roughness was below 16 nm (RMS), fulfilling the requirement of < 20 nm (RMS).
Figure 57: PMMA-000 diffractive structure manufacturing.
.
Large lens manufacturing and test
Manufacturing
On June 2008, a machine able to manufacture lenses up to 3.4 m in diameter (Figure 58) was installed in Japan. RIKEN scientist spent from June to August 2008 for tuning-up phase, then three subscale PMMA-000 lenses (1.5m in diameter) are being manufactured since Sept. 2009. Two of them were finished in late July 2010 (Figure 59) and transported to USA in Aug. 2010. They are currently under optical tests by using NASA-Marshall Space Flight Center and US Army facilities. Once also the third lens will be completely manufactured and shipped to USA, the whole system will be a subscale prototype, made of the central 1.5 meters of all three optical elements, assembled in a non-flight structure and used for optical testing.
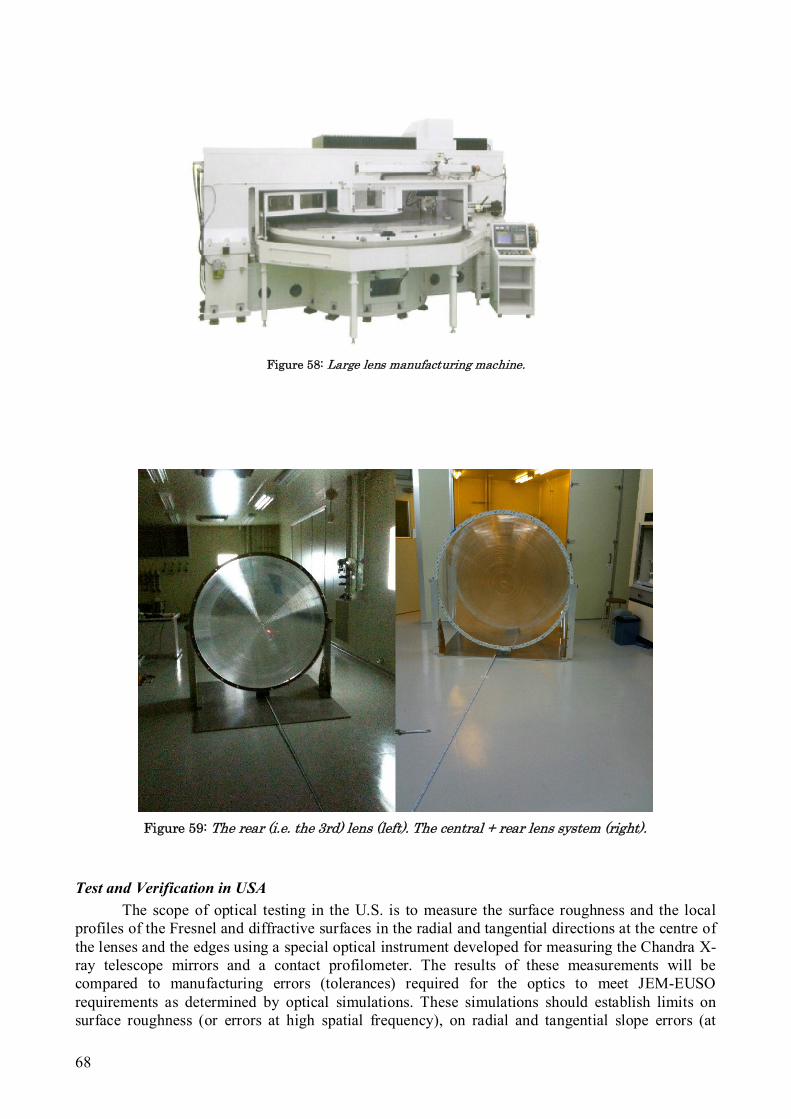
68
Figure 58: Large lens manufacturing machine.
Figure 59: The rear (i.e. the 3rd) lens (left). The central + rear lens system (right).
Test and Verification in USA
The scope of optical testing in the U.S. is to measure the surface roughness and the local profiles of the Fresnel and diffractive surfaces in the radial and tangential directions at the centre of the lenses and the edges using a special optical instrument developed for measuring the Chandra X-ray telescope mirrors and a contact profilometer. The results of these measurements will be compared to manufacturing errors (tolerances) required for the optics to meet JEM-EUSO requirements as determined by optical simulations. These simulations should establish limits on surface roughness (or errors at high spatial frequency), on radial and tangential slope errors (at
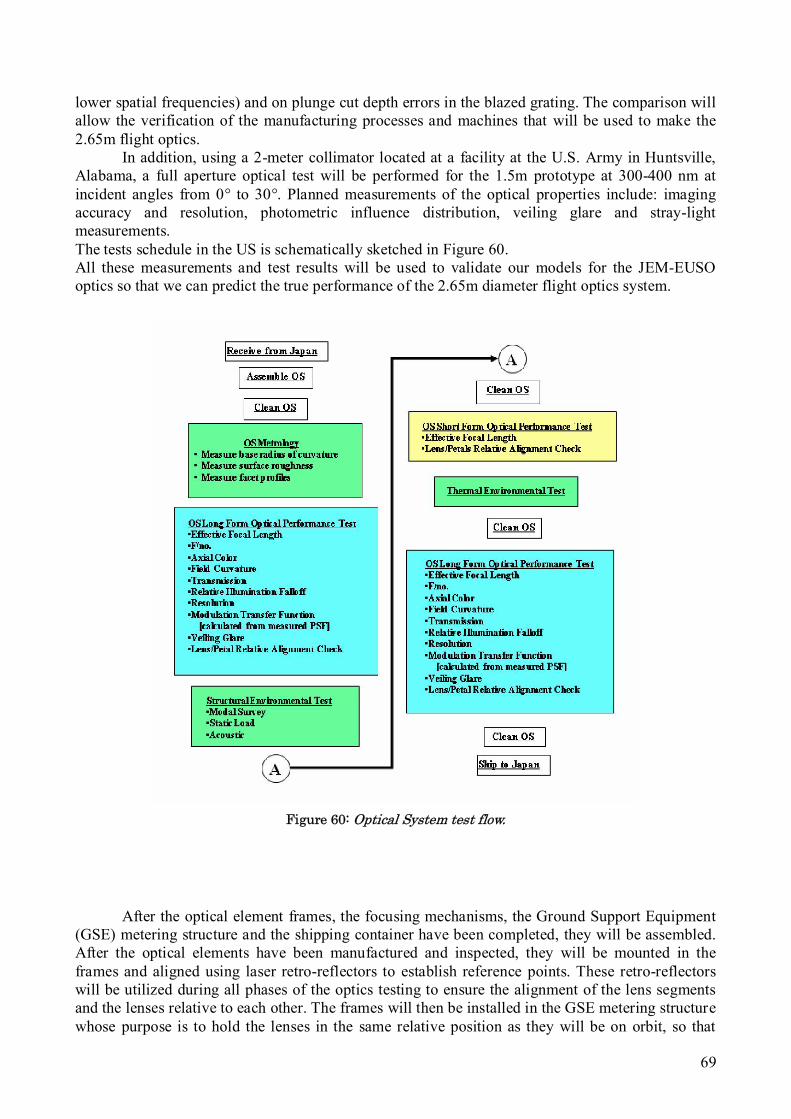
69
lower spatial frequencies) and on plunge cut depth errors in the blazed grating. The comparison will allow the verification of the manufacturing processes and machines that will be used to make the 2.65m flight optics.
In addition, using a 2-meter collimator located at a facility at the U.S. Army in Huntsville, Alabama, a full aperture optical test will be performed for the 1.5m prototype at 300-400 nm at incident angles from 0° to 30°. Planned measurements of the optical properties include: imaging accuracy and resolution, photometric influence distribution, veiling glare and stray-light measurements. The tests schedule in the US is schematically sketched in Figure 60. All these measurements and test results will be used to validate our models for the JEM-EUSO optics so that we can predict the true performance of the 2.65m diameter flight optics system.
Figure 60: Optical System test flow.
After the optical element frames, the focusing mechanisms, the Ground Support Equipment
(GSE) metering structure and the shipping container have been completed, they will be assembled. After the optical elements have been manufactured and inspected, they will be mounted in the frames and aligned using laser retro-reflectors to establish reference points. These retro-reflectors will be utilized during all phases of the optics testing to ensure the alignment of the lens segments and the lenses relative to each other. The frames will then be installed in the GSE metering structure whose purpose is to hold the lenses in the same relative position as they will be on orbit, so that
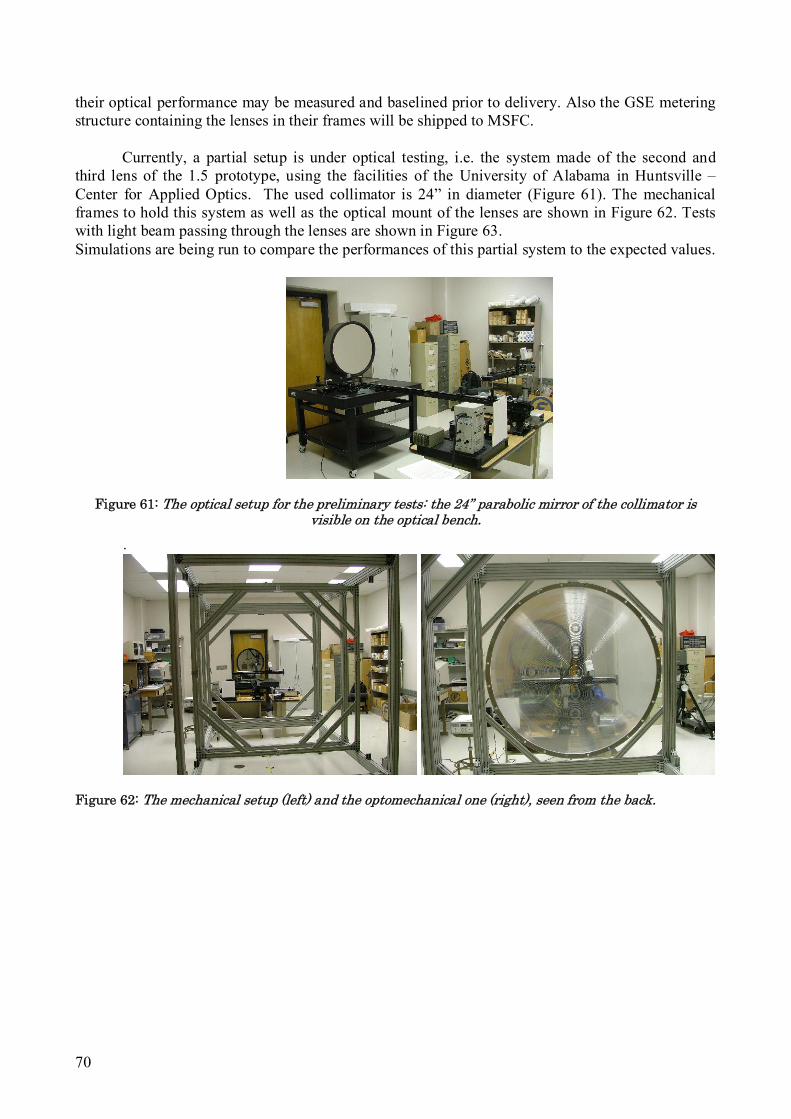
70
their optical performance may be measured and baselined prior to delivery. Also the GSE metering structure containing the lenses in their frames will be shipped to MSFC.
Currently, a partial setup is under optical testing, i.e. the system made of the second and third lens of the 1.5 prototype, using the facilities of the University of Alabama in Huntsville – Center for Applied Optics. The used collimator is 24” in diameter (Figure 61). The mechanical frames to hold this system as well as the optical mount of the lenses are shown in Figure 62. Tests with light beam passing through the lenses are shown in Figure 63. Simulations are being run to compare the performances of this partial system to the expected values.
Figure 61: The optical setup for the preliminary tests: the 24” parabolic mirror of the collimator is visible on the optical bench.
.
Figure 62: The mechanical setup (left) and the optomechanical one (right), seen from the back.
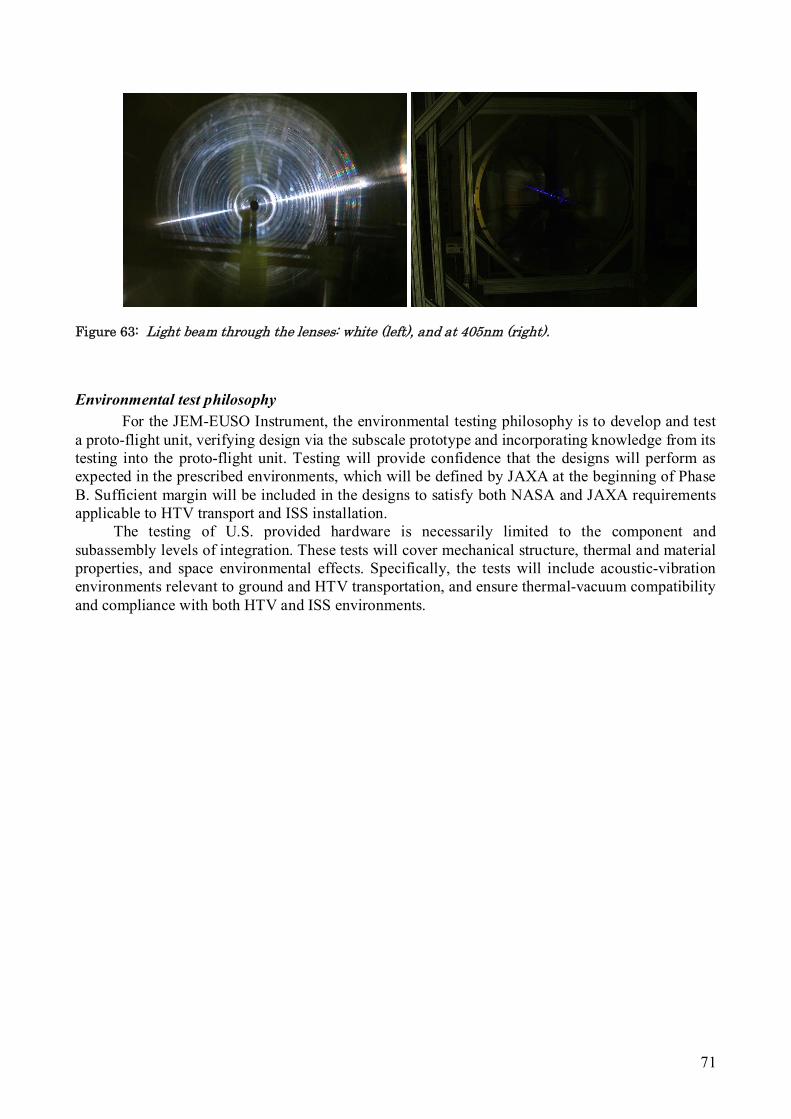
71
Figure 63: Light beam through the lenses: white (left), and at 405nm (right).
Environmental test philosophy
For the JEM-EUSO Instrument, the environmental testing philosophy is to develop and test a proto-flight unit, verifying design via the subscale prototype and incorporating knowledge from its testing into the proto-flight unit. Testing will provide confidence that the designs will perform as expected in the prescribed environments, which will be defined by JAXA at the beginning of Phase B. Sufficient margin will be included in the designs to satisfy both NASA and JAXA requirements applicable to HTV transport and ISS installation.
The testing of U.S. provided hardware is necessarily limited to the component and subassembly levels of integration. These tests will cover mechanical structure, thermal and material properties, and space environmental effects. Specifically, the tests will include acoustic-vibration environments relevant to ground and HTV transportation, and ensure thermal-vacuum compatibility and compliance with both HTV and ISS environments.
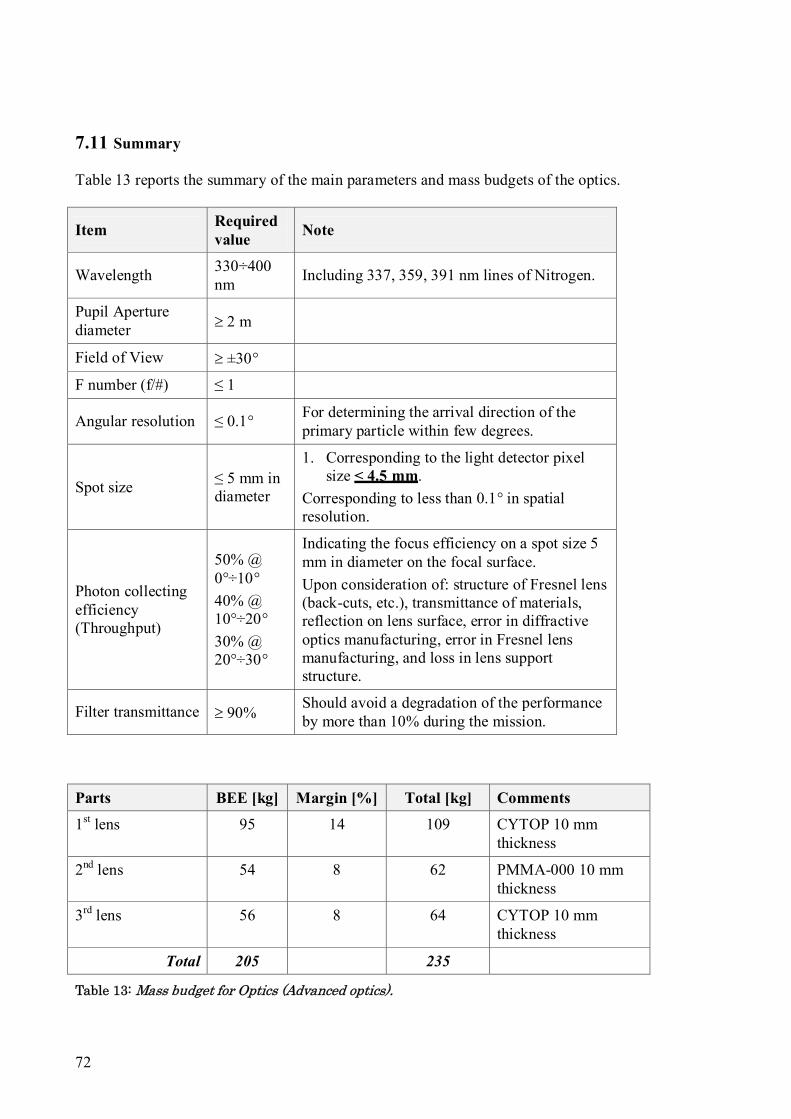
72
7.11 Summary Table 13 reports the summary of the main parameters and mass budgets of the optics.
Item Required value
Note
Wavelength 330÷400 nm
Including 337, 359, 391 nm lines of Nitrogen.
Pupil Aperture diameter
2 m
Field of View ±30°
F number (f/#) ≤ 1
Angular resolution ≤ 0.1° For determining the arrival direction of the primary particle within few degrees.
Spot size ≤ 5 mm in diameter
1. Corresponding to the light detector pixel size < 4.5 mm.
Corresponding to less than 0.1° in spatial resolution.
Photon collecting efficiency (Throughput)
50% @ 0°÷10°
40% @ 10°÷20°
30% @ 20°÷30°
Indicating the focus efficiency on a spot size 5 mm in diameter on the focal surface.
Upon consideration of: structure of Fresnel lens (back-cuts, etc.), transmittance of materials, reflection on lens surface, error in diffractive optics manufacturing, error in Fresnel lens manufacturing, and loss in lens support structure.
Filter transmittance 90% Should avoid a degradation of the performance by more than 10% during the mission.
Parts BEE [kg] Margin [%] Total [kg] Comments
1st lens 95 14 109 CYTOP 10 mm thickness
2nd lens 54 8 62 PMMA-000 10 mm thickness
3rd lens 56 8 64 CYTOP 10 mm thickness
Total 205 235
Table 13: Mass budget for Optics (Advanced optics).
73
7.12 Role of the Italian collaboration in Optics design Optical simulations of the main optics system (CNR-INO) Optics is responsibility of RIKEN, Japan. Other groups working on optics are in NASA
Marshall Space Flight Center (Huntsville, AL, USA), where the major optical tests are scheduled, and at the University of Alabama in Huntsville.
The presence of CNR-INO, via INFN-FI, in the Italian collaboration is fundamental, since the knowledge on simulations on this kind of system exists since 2000, for the ESA-EUSO project. In collaboration with RIKEN, NASA and UAH, the Italian role will be essentially for:
a) Optimization of the lenses system
Both the optical systems, as previously described, are currently under deep investigation. Indeed, the different transparency of Cytop and PMMA in this spectrum, and the different dispersion make the two systems to behave quite differently. Although Cytop is heavier and much more expensive than PMMA, its optical performances are better. However, optical designing must take into consideration any difficulty in manufacturing the designed system, so that some changes may be needed in order to reduce construction risks or complexities. Therefore, the optimization of the optical system must take into account the whole optical system: not only manufacturing problems, but also optomechanical issues as well as (thermal, mechanical,…) tolerances, the geometry of the focal surface, and so on.
b) Realistic simulations (with dedicated software) of the back-cuts effects on the
quality of image on the focal surface and the loss of photons
The optimization of both optical designs, as previously described, is not the final work for the optical designers. Indeed, it is only the geometric part, and a radiometric analysis must continue, in order to fully represent the configuration. The used software codes span between commercial ones to others property of universities and/or institutes. The Japanese group uses one of them to calculate, from the optimized design, the amount of photons reaching the focal surface in a determined position (given by the optimized design), while the Italian collaboration’s goal, for this topic, is to confirm that the output is correct, by using commercial software named ASAP. Radiometric analysis takes into account not only the Encircled Energy output, but also many other issues, in order to provide a realistic Throughput analysis (as already shown in the previous chapters). Being a complex study, a verification of the Japanese results is therefore compulsory.
c) Support to the optical tests in USA and Japan
Optical tests are pursued by Japanese and American colleagues. However, since deep knowledge of the behaviour of the designed optical system is in Italy, this help becomes very important, as well as the one from the other subsystems’ designers, since a comparison between tests’ results and foreseen performances is compulsory.
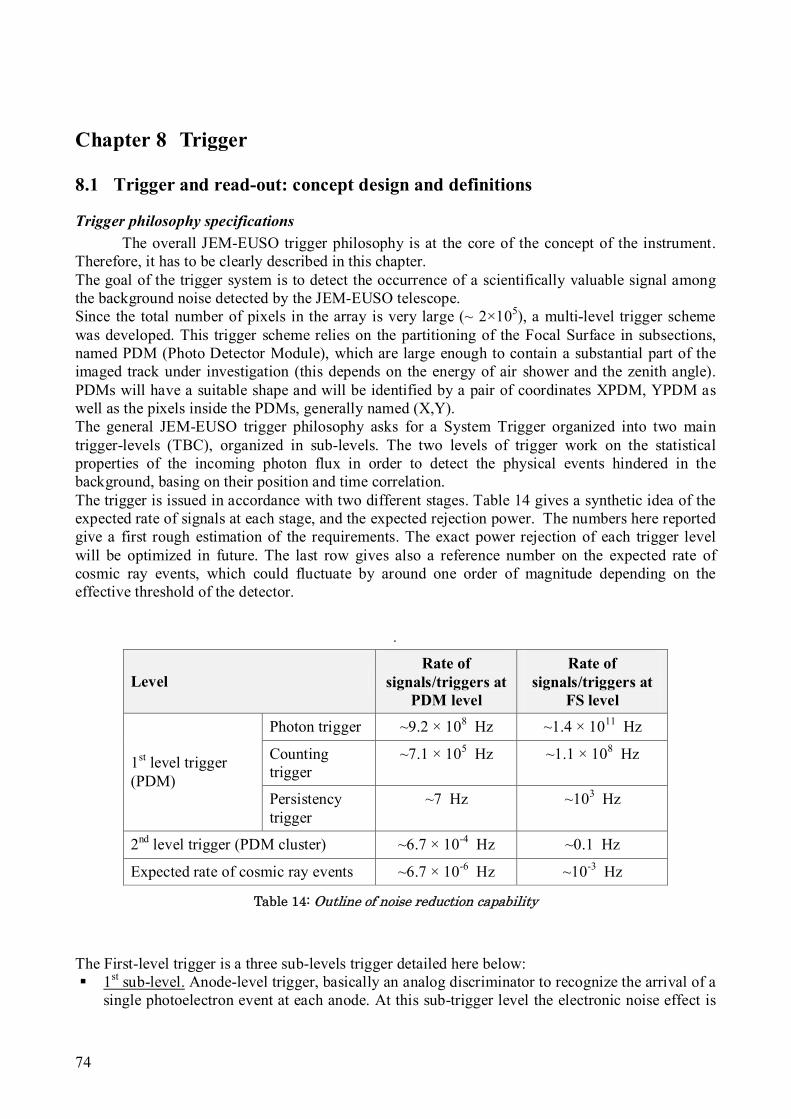
74
Chapter 8 Trigger
8.1 Trigger and read-out: concept design and definitions
Trigger philosophy specifications
The overall JEM-EUSO trigger philosophy is at the core of the concept of the instrument. Therefore, it has to be clearly described in this chapter. The goal of the trigger system is to detect the occurrence of a scientifically valuable signal among the background noise detected by the JEM-EUSO telescope. Since the total number of pixels in the array is very large (~ 2×10⁵), a multi-level trigger scheme was developed. This trigger scheme relies on the partitioning of the Focal Surface in subsections, named PDM (Photo Detector Module), which are large enough to contain a substantial part of the imaged track under investigation (this depends on the energy of air shower and the zenith angle). PDMs will have a suitable shape and will be identified by a pair of coordinates XPDM, YPDM as well as the pixels inside the PDMs, generally named (X,Y). The general JEM-EUSO trigger philosophy asks for a System Trigger organized into two main trigger-levels (TBC), organized in sub-levels. The two levels of trigger work on the statistical properties of the incoming photon flux in order to detect the physical events hindered in the background, basing on their position and time correlation. The trigger is issued in accordance with two different stages. Table 14 gives a synthetic idea of the expected rate of signals at each stage, and the expected rejection power. The numbers here reported give a first rough estimation of the requirements. The exact power rejection of each trigger level will be optimized in future. The last row gives also a reference number on the expected rate of cosmic ray events, which could fluctuate by around one order of magnitude depending on the effective threshold of the detector.
.
Level Rate of
signals/triggers at PDM level
Rate of signals/triggers at
FS level
Photon trigger ~9.2 × 10⁸ Hz ~1.4 × 10¹¹ Hz
Counting trigger
~7.1 × 10⁵ Hz ~1.1 × 10⁸ Hz 1st level trigger (PDM)
Persistency trigger
~7 Hz ~103 Hz
2nd level trigger (PDM cluster) ~6.7 × 10⁻⁴ Hz ~0.1 Hz
Expected rate of cosmic ray events ~6.7 × 10⁻⁶ Hz ~10-3 Hz
Table 14: Outline of noise reduction capability
The First-level trigger is a three sub-levels trigger detailed here below: 1st sub-level. Anode-level trigger, basically an analog discriminator to recognize the arrival of a
single photoelectron event at each anode. At this sub-trigger level the electronic noise effect is
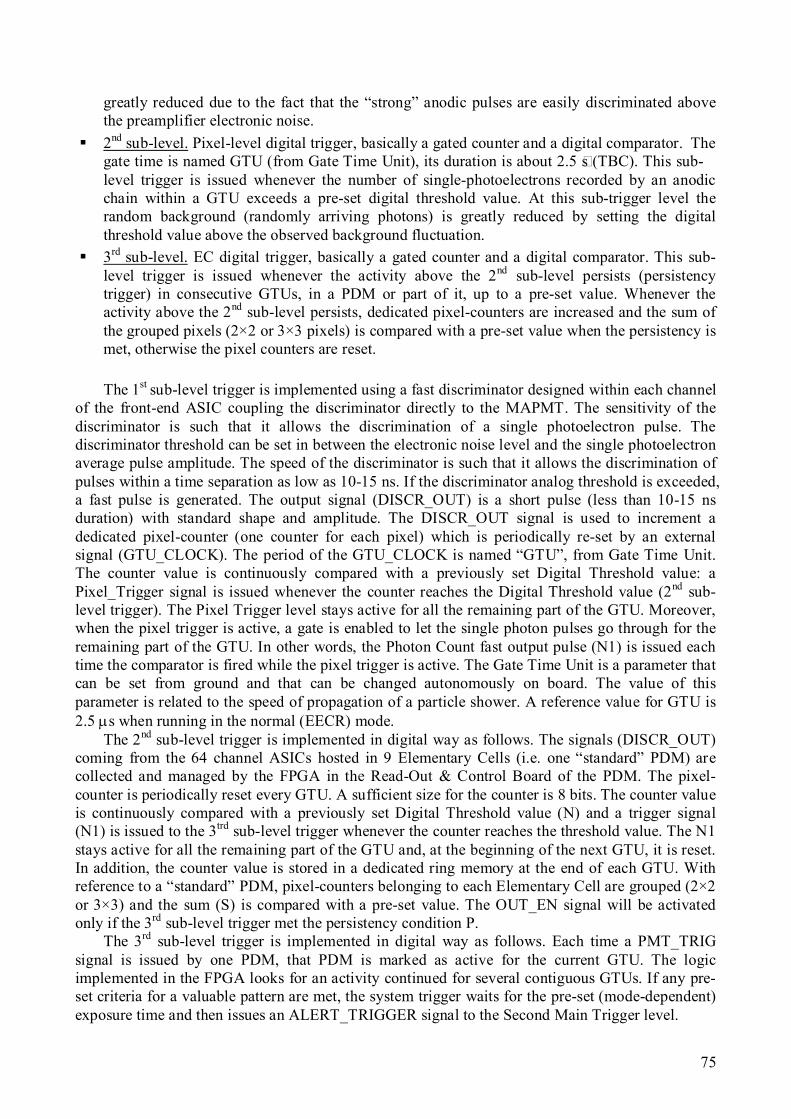
75
greatly reduced due to the fact that the “strong” anodic pulses are easily discriminated above the preamplifier electronic noise.
2nd sub-level. Pixel-level digital trigger, basically a gated counter and a digital comparator. The gate time is named GTU (from Gate Time Unit), its duration is about 2.5 s (TBC). This sub-level trigger is issued whenever the number of single-photoelectrons recorded by an anodic chain within a GTU exceeds a pre-set digital threshold value. At this sub-trigger level the random background (randomly arriving photons) is greatly reduced by setting the digital threshold value above the observed background fluctuation.
3rd sub-level. EC digital trigger, basically a gated counter and a digital comparator. This sub-level trigger is issued whenever the activity above the 2nd sub-level persists (persistency trigger) in consecutive GTUs, in a PDM or part of it, up to a pre-set value. Whenever the activity above the 2nd sub-level persists, dedicated pixel-counters are increased and the sum of the grouped pixels (2×2 or 3×3 pixels) is compared with a pre-set value when the persistency is met, otherwise the pixel counters are reset.
The 1st sub-level trigger is implemented using a fast discriminator designed within each channel
of the front-end ASIC coupling the discriminator directly to the MAPMT. The sensitivity of the discriminator is such that it allows the discrimination of a single photoelectron pulse. The discriminator threshold can be set in between the electronic noise level and the single photoelectron average pulse amplitude. The speed of the discriminator is such that it allows the discrimination of pulses within a time separation as low as 10-15 ns. If the discriminator analog threshold is exceeded, a fast pulse is generated. The output signal (DISCR_OUT) is a short pulse (less than 10-15 ns duration) with standard shape and amplitude. The DISCR_OUT signal is used to increment a dedicated pixel-counter (one counter for each pixel) which is periodically re-set by an external signal (GTU_CLOCK). The period of the GTU_CLOCK is named “GTU”, from Gate Time Unit. The counter value is continuously compared with a previously set Digital Threshold value: a Pixel_Trigger signal is issued whenever the counter reaches the Digital Threshold value (2nd sub-level trigger). The Pixel Trigger level stays active for all the remaining part of the GTU. Moreover, when the pixel trigger is active, a gate is enabled to let the single photon pulses go through for the remaining part of the GTU. In other words, the Photon Count fast output pulse (N1) is issued each time the comparator is fired while the pixel trigger is active. The Gate Time Unit is a parameter that can be set from ground and that can be changed autonomously on board. The value of this parameter is related to the speed of propagation of a particle shower. A reference value for GTU is 2.5 s when running in the normal (EECR) mode.
The 2nd sub-level trigger is implemented in digital way as follows. The signals (DISCR_OUT) coming from the 64 channel ASICs hosted in 9 Elementary Cells (i.e. one “standard” PDM) are collected and managed by the FPGA in the Read-Out & Control Board of the PDM. The pixel-counter is periodically reset every GTU. A sufficient size for the counter is 8 bits. The counter value is continuously compared with a previously set Digital Threshold value (N) and a trigger signal (N1) is issued to the 3trd sub-level trigger whenever the counter reaches the threshold value. The N1 stays active for all the remaining part of the GTU and, at the beginning of the next GTU, it is reset. In addition, the counter value is stored in a dedicated ring memory at the end of each GTU. With reference to a “standard” PDM, pixel-counters belonging to each Elementary Cell are grouped (2×2 or 3×3) and the sum (S) is compared with a pre-set value. The OUT_EN signal will be activated only if the 3rd sub-level trigger met the persistency condition P.
The 3rd sub-level trigger is implemented in digital way as follows. Each time a PMT_TRIG signal is issued by one PDM, that PDM is marked as active for the current GTU. The logic implemented in the FPGA looks for an activity continued for several contiguous GTUs. If any pre-set criteria for a valuable pattern are met, the system trigger waits for the pre-set (mode-dependent) exposure time and then issues an ALERT_TRIGGER signal to the Second Main Trigger level.

76
An auto-level-trigger function will be implemented within the First level trigger: this will use the persistence rate measurements (number of consecutive active PDM_trigger) as the input of a software algorithm that calculates the proper setting for the second digital trigger level. This would allow for the instrument to set the optimum trigger levels in case of varying background conditions due to slowly transient phenomena (moon phase, clouds coverage, large urbanized area and so on). This special auto-trigger mode will be switchable ON/OFF and be fully re-programmable in flight. The thresholds of the first trigger level will be set at a level sufficient to reduce the rate of fake events from fluctuations of the background to the level of about 7 Hz/PDM.
The Second-level trigger is issued at the cluster level and according to this trigger we make the final decision to start the readout procedure. The Second-level trigger logic must collect data coming from the whole Focal Surface divided in 18 subsections consisting of 8 PDMs. The Second-level trigger logic will provide a decision about the presence of any interesting feature, by collecting the First-level trigger coming from each PDM. The algorithm working as a 2nd level trigger, presently proposed for JEM-EUSO, is called ‘Linear Track Trigger’ method (LTT), which searches for light points moving with the light speed at 400 km ahead. The decision will be made in accordance with the optimized “trigger modes” for the different phenomena to be observed. At this level, the remaining statistical noise will be reduced to the point that only the “event-like” patterns will initiate the readout sequence. The system-level trigger will be fully in-flight programmable in order to allow for any adjustment in the trigger modes.
8.2 Trigger mode specifications
The System Trigger shall be fully in-flight programmable in order to set it for all triggers modes. The following trigger modes have been identified: Standard EECR (Extreme Energy Cosmic Rays) mode Slow mode Fast mode Analog Trigger (sub-mode)
The EECR mode shall be the standard one where the trigger looks for signals which rise above
the Second-level trigger for a duration between about 30 µs and about 300 µs (the exact value shall be in-flight programmable). The Extreme Energy Cosmic Rays are observed by means of this mode. Event which does not match the above duration window will be ignored. The Slow mode shall be normally not active; it will be activated by telecommand when required by the observers or as a programmed feature in the System Trigger. When the Slow mode is activated, the signals with Third-level trigger activity lasting more than a pre-set time (e.g. 300 s) will be anyway recorded, however, with a slower sampling frequency (GTU). Most atmospheric phenomena (e.g. meteoroids) are observed with this mode. The Fast mode shall be normally not active; it will be activated by telecommand when required by the observers. When the Fast mode is activated, the sampling frequency is increased by a factor 8 with respect to the EECR mode, and signals with 3rd level trigger activity lasting less than a pre-set time (e.g. 30 s) will be anyway acquired. This feature will be used during on board calibration. The Analog Trigger should allow the instrument to trigger on: (i) transient phenomena, i.e. extremely short (<< 1 GTU) but intense flashes (Cherenkov mark or Cherenkov from tau neutrinos), and (ii) events with propagation speed << c (meteors) and lightning. The details of the Analog Trigger need still to be defined.
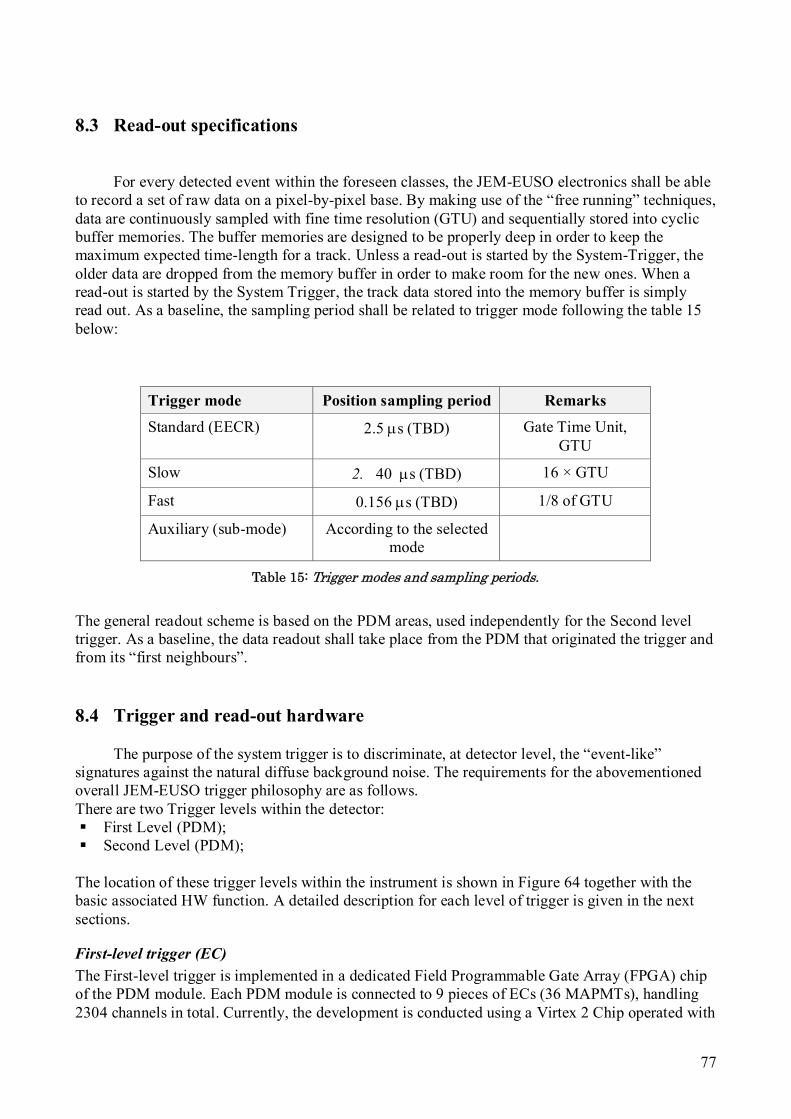
77
8.3 Read-out specifications
For every detected event within the foreseen classes, the JEM-EUSO electronics shall be able to record a set of raw data on a pixel-by-pixel base. By making use of the “free running” techniques, data are continuously sampled with fine time resolution (GTU) and sequentially stored into cyclic buffer memories. The buffer memories are designed to be properly deep in order to keep the maximum expected time-length for a track. Unless a read-out is started by the System-Trigger, the older data are dropped from the memory buffer in order to make room for the new ones. When a read-out is started by the System Trigger, the track data stored into the memory buffer is simply read out. As a baseline, the sampling period shall be related to trigger mode following the table 15 below:
Trigger mode Position sampling period Remarks
Standard (EECR) 2.5 s (TBD) Gate Time Unit, GTU
Slow 2. 40 s (TBD) 16 × GTU
Fast 0.156 s (TBD) 1/8 of GTU
Auxiliary (sub-mode) According to the selected mode
Table 15: Trigger modes and sampling periods.
The general readout scheme is based on the PDM areas, used independently for the Second level trigger. As a baseline, the data readout shall take place from the PDM that originated the trigger and from its “first neighbours”.
8.4 Trigger and read-out hardware
The purpose of the system trigger is to discriminate, at detector level, the “event-like” signatures against the natural diffuse background noise. The requirements for the abovementioned overall JEM-EUSO trigger philosophy are as follows. There are two Trigger levels within the detector: First Level (PDM); Second Level (PDM);
The location of these trigger levels within the instrument is shown in Figure 64 together with the basic associated HW function. A detailed description for each level of trigger is given in the next sections.
First-level trigger (EC)
The First-level trigger is implemented in a dedicated Field Programmable Gate Array (FPGA) chip of the PDM module. Each PDM module is connected to 9 pieces of ECs (36 MAPMTs), handling 2304 channels in total. Currently, the development is conducted using a Virtex 2 Chip operated with
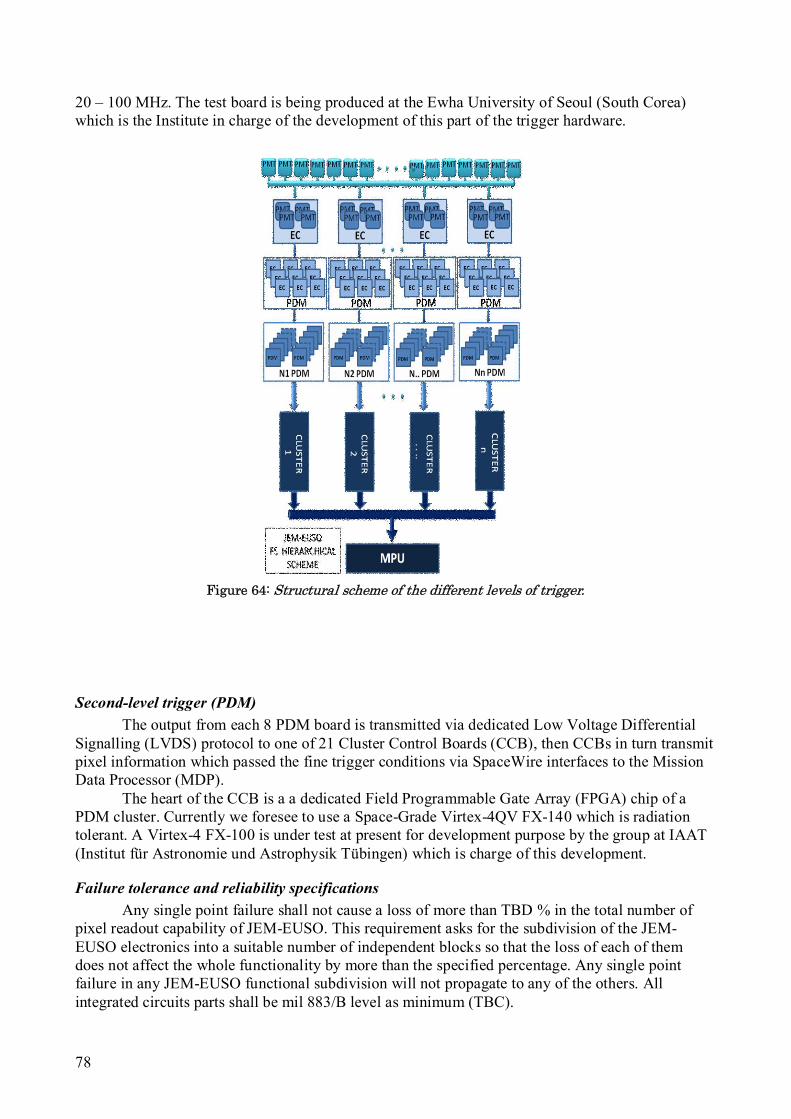
78
20 – 100 MHz. The test board is being produced at the Ewha University of Seoul (South Corea) which is the Institute in charge of the development of this part of the trigger hardware.
Figure 64: Structural scheme of the different levels of trigger.
Second-level trigger (PDM)
The output from each 8 PDM board is transmitted via dedicated Low Voltage Differential Signalling (LVDS) protocol to one of 21 Cluster Control Boards (CCB), then CCBs in turn transmit pixel information which passed the fine trigger conditions via SpaceWire interfaces to the Mission Data Processor (MDP).
The heart of the CCB is a a dedicated Field Programmable Gate Array (FPGA) chip of a PDM cluster. Currently we foresee to use a Space-Grade Virtex-4QV FX-140 which is radiation tolerant. A Virtex-4 FX-100 is under test at present for development purpose by the group at IAAT (Institut für Astronomie und Astrophysik Tübingen) which is charge of this development.
Failure tolerance and reliability specifications
Any single point failure shall not cause a loss of more than TBD % in the total number of pixel readout capability of JEM-EUSO. This requirement asks for the subdivision of the JEM-EUSO electronics into a suitable number of independent blocks so that the loss of each of them does not affect the whole functionality by more than the specified percentage. Any single point failure in any JEM-EUSO functional subdivision will not propagate to any of the others. All integrated circuits parts shall be mil 883/B level as minimum (TBC).
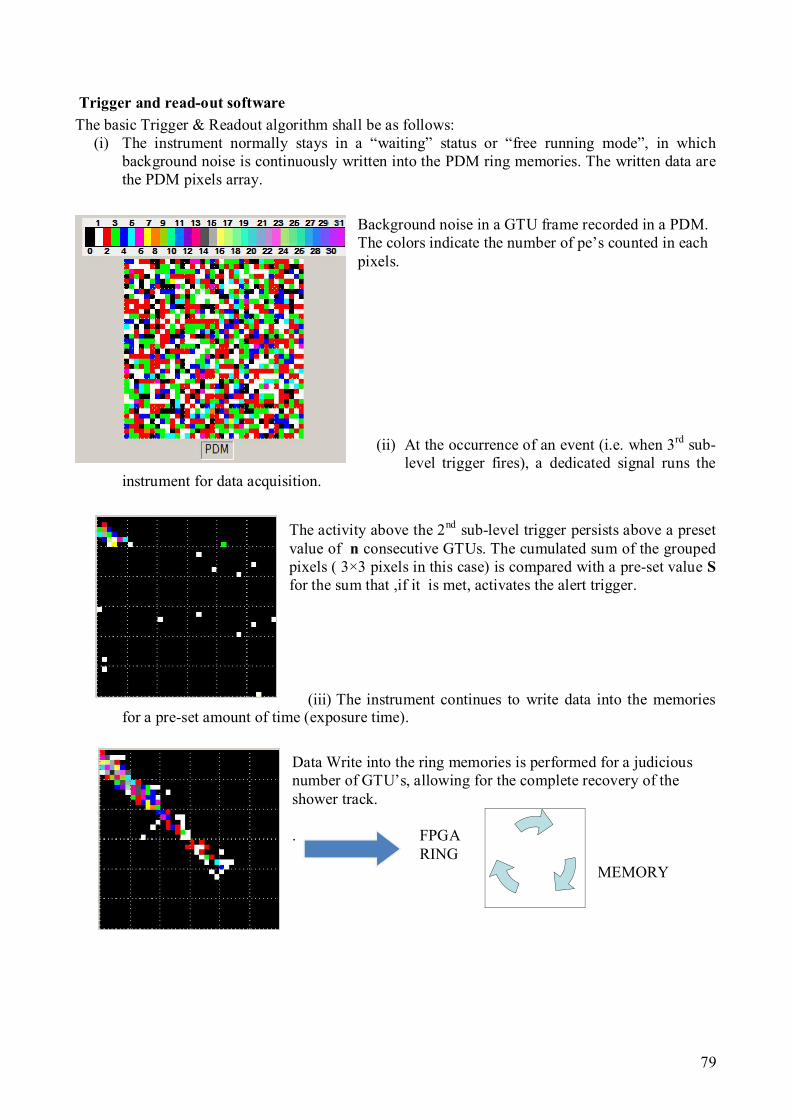
79
Trigger and read-out software
The basic Trigger & Readout algorithm shall be as follows: (i) The instrument normally stays in a “waiting” status or “free running mode”, in which
background noise is continuously written into the PDM ring memories. The written data are the PDM pixels array.
Background noise in a GTU frame recorded in a PDM. The colors indicate the number of pe’s counted in each pixels.
(ii) At the occurrence of an event (i.e. when 3rd sub-level trigger fires), a dedicated signal runs the
instrument for data acquisition.
The activity above the 2nd sub-level trigger persists above a preset value of n consecutive GTUs. The cumulated sum of the grouped pixels ( 3×3 pixels in this case) is compared with a pre-set value S for the sum that ,if it is met, activates the alert trigger.
(iii) The instrument continues to write data into the memories for a pre-set amount of time (exposure time).
Data Write into the ring memories is performed for a judicious number of GTU’s, allowing for the complete recovery of the shower track. . FPGA RING MEMORY
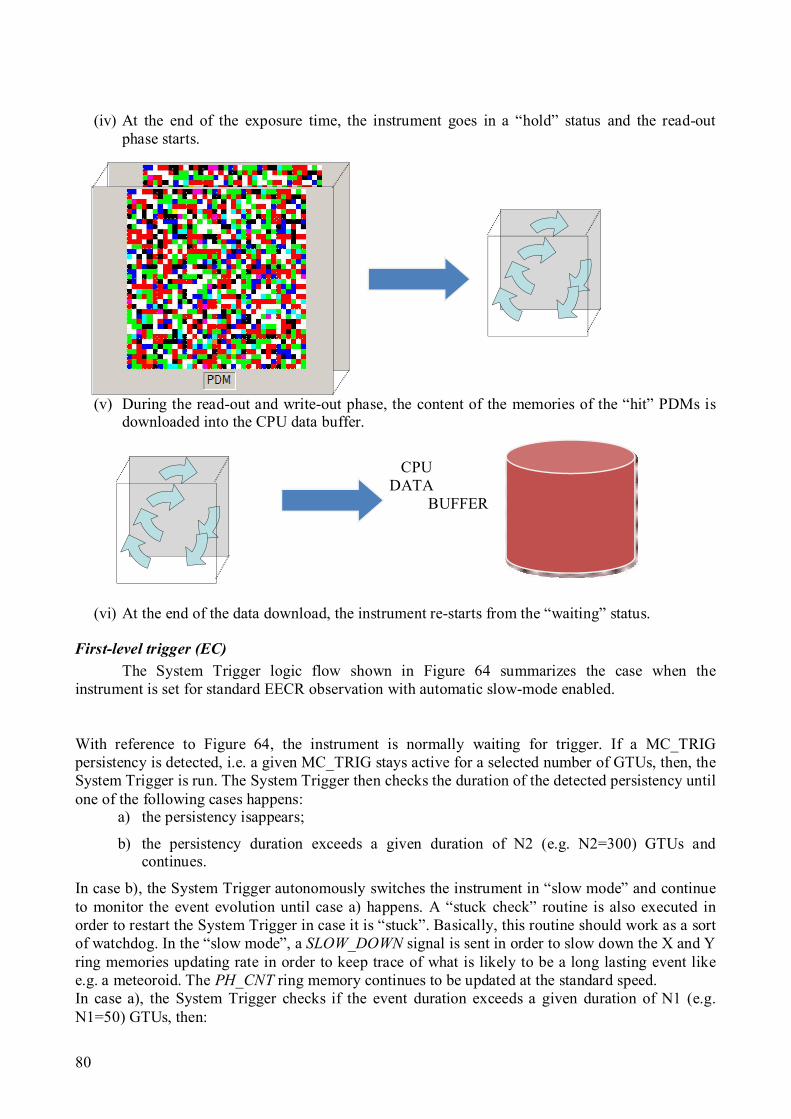
80
(iv) At the end of the exposure time, the instrument goes in a “hold” status and the read-out
phase starts.
(v) During the read-out and write-out phase, the content of the memories of the “hit” PDMs is downloaded into the CPU data buffer.
CPU DATA BUFFER
(vi) At the end of the data download, the instrument re-starts from the “waiting” status.
First-level trigger (EC)
The System Trigger logic flow shown in Figure 64 summarizes the case when the instrument is set for standard EECR observation with automatic slow-mode enabled. With reference to Figure 64, the instrument is normally waiting for trigger. If a MC_TRIG persistency is detected, i.e. a given MC_TRIG stays active for a selected number of GTUs, then, the System Trigger is run. The System Trigger then checks the duration of the detected persistency until one of the following cases happens:
a) the persistency isappears;
b) the persistency duration exceeds a given duration of N2 (e.g. N2=300) GTUs and continues.
In case b), the System Trigger autonomously switches the instrument in “slow mode” and continue to monitor the event evolution until case a) happens. A “stuck check” routine is also executed in order to restart the System Trigger in case it is “stuck”. Basically, this routine should work as a sort of watchdog. In the “slow mode”, a SLOW_DOWN signal is sent in order to slow down the X and Y ring memories updating rate in order to keep trace of what is likely to be a long lasting event like e.g. a meteoroid. The PH_CNT ring memory continues to be updated at the standard speed. In case a), the System Trigger checks if the event duration exceeds a given duration of N1 (e.g. N1=50) GTUs, then:
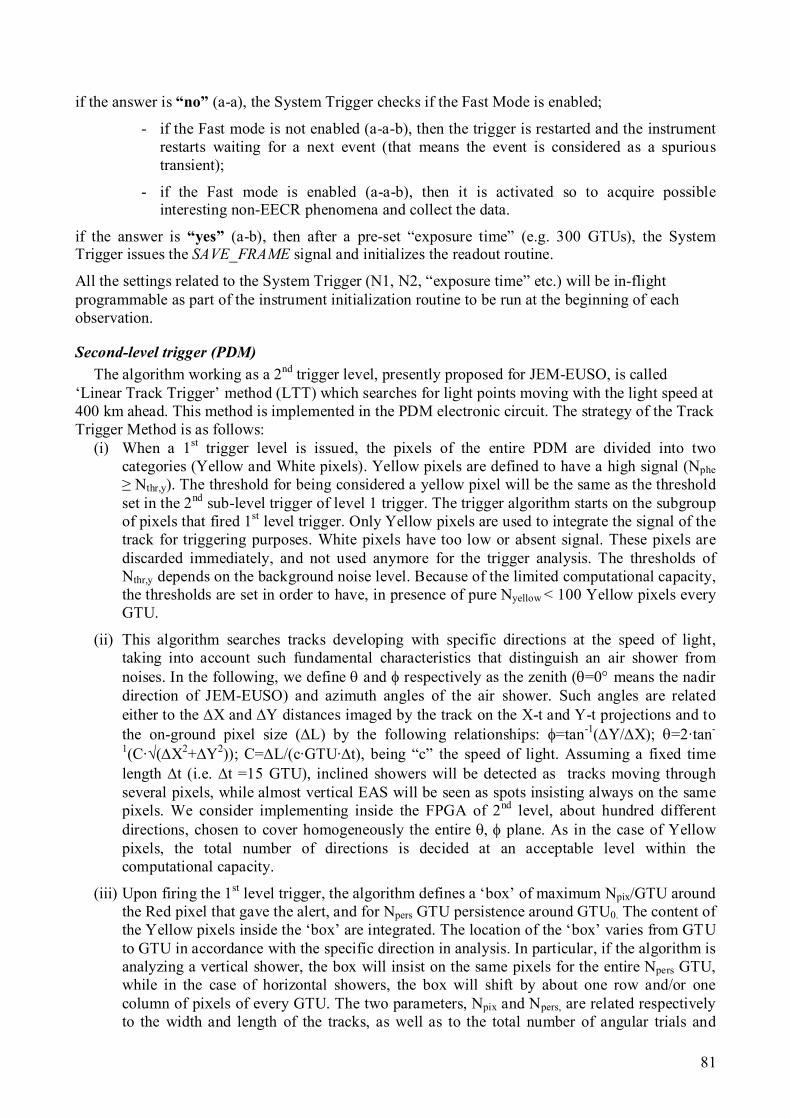
81
if the answer is “no” (a-a), the System Trigger checks if the Fast Mode is enabled;
- if the Fast mode is not enabled (a-a-b), then the trigger is restarted and the instrument restarts waiting for a next event (that means the event is considered as a spurious transient);
- if the Fast mode is enabled (a-a-b), then it is activated so to acquire possible interesting non-EECR phenomena and collect the data.
if the answer is “yes” (a-b), then after a pre-set “exposure time” (e.g. 300 GTUs), the System Trigger issues the SAVE_FRAME signal and initializes the readout routine.
All the settings related to the System Trigger (N1, N2, “exposure time” etc.) will be in-flight programmable as part of the instrument initialization routine to be run at the beginning of each observation.
Second-level trigger (PDM)
The algorithm working as a 2nd trigger level, presently proposed for JEM-EUSO, is called ‘Linear Track Trigger’ method (LTT) which searches for light points moving with the light speed at 400 km ahead. This method is implemented in the PDM electronic circuit. The strategy of the Track Trigger Method is as follows:
(i) When a 1st trigger level is issued, the pixels of the entire PDM are divided into two categories (Yellow and White pixels). Yellow pixels are defined to have a high signal (Nphe
≥ Nthr,y). The threshold for being considered a yellow pixel will be the same as the threshold set in the 2nd sub-level trigger of level 1 trigger. The trigger algorithm starts on the subgroup of pixels that fired 1st level trigger. Only Yellow pixels are used to integrate the signal of the track for triggering purposes. White pixels have too low or absent signal. These pixels are discarded immediately, and not used anymore for the trigger analysis. The thresholds of Nthr,y depends on the background noise level. Because of the limited computational capacity, the thresholds are set in order to have, in presence of pure Nyellow < 100 Yellow pixels every GTU.
(ii) This algorithm searches tracks developing with specific directions at the speed of light, taking into account such fundamental characteristics that distinguish an air shower from noises. In the following, we define and respectively as the zenith (=0 means the nadir direction of JEM-EUSO) and azimuth angles of the air shower. Such angles are related either to the X and Y distances imaged by the track on the X-t and Y-t projections and to the on-ground pixel size (L) by the following relationships: =tan-1(Y/X); =2·tan-
1(C·√(X2+Y2)); C=L/(c·GTU·t), being “c” the speed of light. Assuming a fixed time length t (i.e. t =15 GTU), inclined showers will be detected as tracks moving through several pixels, while almost vertical EAS will be seen as spots insisting always on the same pixels. We consider implementing inside the FPGA of 2nd level, about hundred different directions, chosen to cover homogeneously the entire plane. As in the case of Yellow pixels, the total number of directions is decided at an acceptable level within the computational capacity.
(iii) Upon firing the 1st level trigger, the algorithm defines a ‘box’ of maximum Npix/GTU around the Red pixel that gave the alert, and for Npers GTU persistence around GTU0. The content of the Yellow pixels inside the ‘box’ are integrated. The location of the ‘box’ varies from GTU to GTU in accordance with the specific direction in analysis. In particular, if the algorithm is analyzing a vertical shower, the box will insist on the same pixels for the entire Npers GTU, while in the case of horizontal showers, the box will shift by about one row and/or one column of pixels of every GTU. The two parameters, Npix and Npers, are related respectively to the width and length of the tracks, as well as to the total number of angular trials and

82
computational capacity. In the present setup, Npix equals 4, and Npers equals 15. The width of the track is related to the EAS energy, to the spot size of the optics (~2.5 mm), to the position of the spot on the FS (in the center of a pixel, or in between pixels), and to the response of the PMT (cross-talk). The final configuration will depend on a trade-off between number of directions, dimension of the boxes, and thresholds on Yellow pixels.
(iv) After defining the location of the ‘box’ in the Npers GTU, the content of the Yellow pixels of such boxes is integrated and the total number of photoelectrons (track) is compared to a preset threshold THR (bkg), that depends on the average background level. The THR (bkg) as well as the Nthr,y strongly depend on the average background level and on the rate of fake events that is acceptable for the experiment. At present, the thresholds (in particular THR(bkg)) are set in order to achieve a trigger rate on fake events about 0.1 Hz/FS. The stricter condition is applied to match the signaling speed to the ground. It is important to be aware that the rate of real events detected will probably not exceed few events per hour (~10-3 Hz/FS) on the entire Focal Surface, FS (see Table 15).
The software for the 2nd level trigger should also have the following characteristics: limit on the total number of GTUs in which the signal exceeds the average background; lower threshold for events in which near-by PDMs issue a 2nd level trigger in a close time
window and space location; monitor possible failures or anomalies at PMT, EC or PDM levels and, temporarily inhibits their functions.
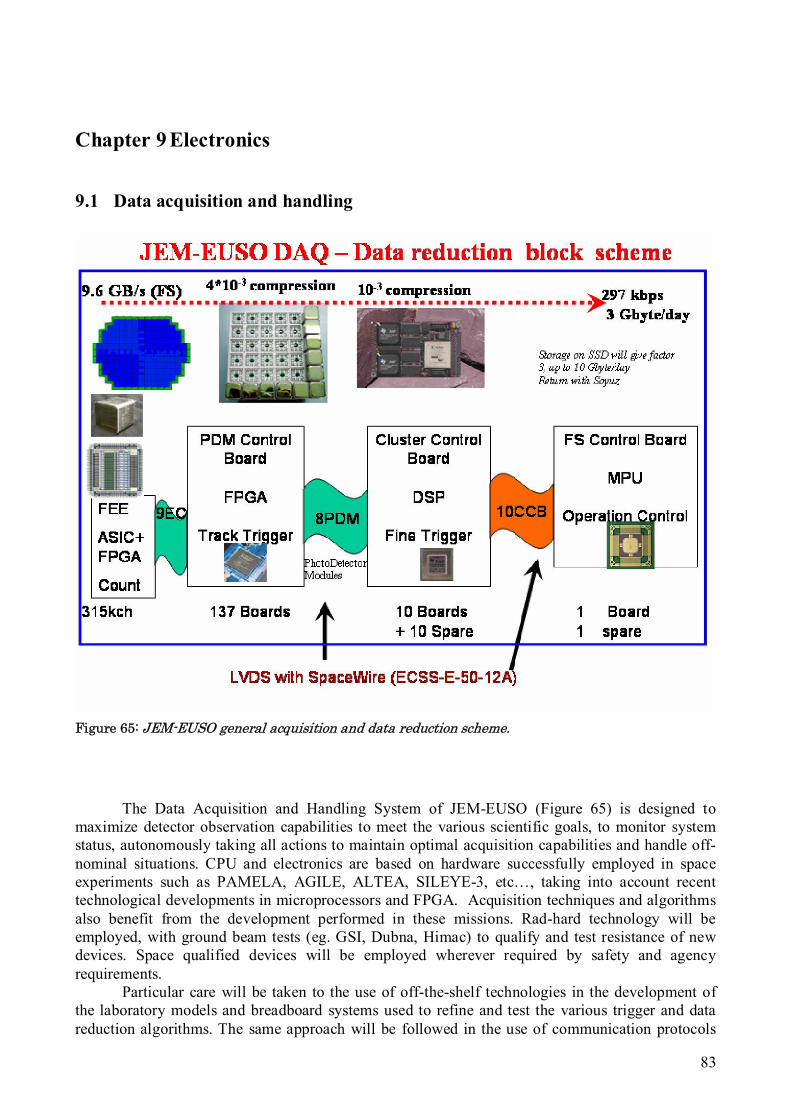
83
Chapter 9 Electronics
9.1 Data acquisition and handling
Figure 65: JEM-EUSO general acquisition and data reduction scheme.
The Data Acquisition and Handling System of JEM-EUSO (Figure 65) is designed to maximize detector observation capabilities to meet the various scientific goals, to monitor system status, autonomously taking all actions to maintain optimal acquisition capabilities and handle off-nominal situations. CPU and electronics are based on hardware successfully employed in space experiments such as PAMELA, AGILE, ALTEA, SILEYE-3, etc…, taking into account recent technological developments in microprocessors and FPGA. Acquisition techniques and algorithms also benefit from the development performed in these missions. Rad-hard technology will be employed, with ground beam tests (eg. GSI, Dubna, Himac) to qualify and test resistance of new devices. Space qualified devices will be employed wherever required by safety and agency requirements.
Particular care will be taken to the use of off-the-shelf technologies in the development of the laboratory models and breadboard systems used to refine and test the various trigger and data reduction algorithms. The same approach will be followed in the use of communication protocols
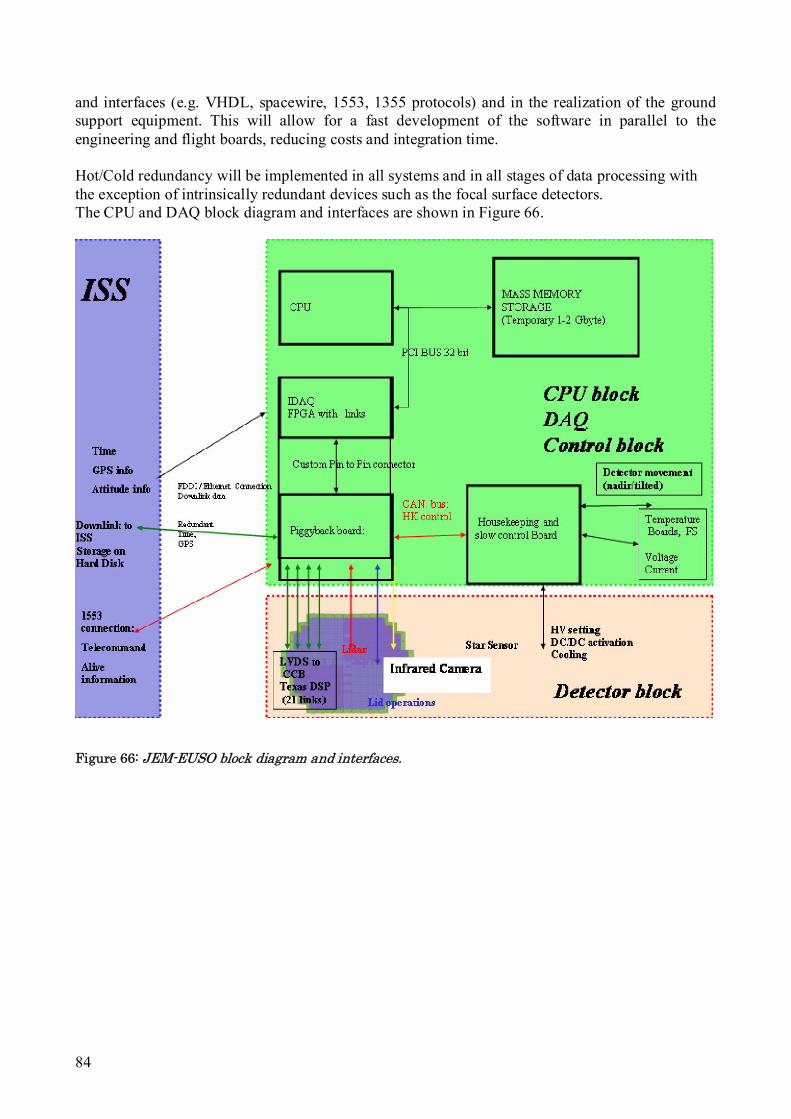
84
and interfaces (e.g. VHDL, spacewire, 1553, 1355 protocols) and in the realization of the ground support equipment. This will allow for a fast development of the software in parallel to the engineering and flight boards, reducing costs and integration time. Hot/Cold redundancy will be implemented in all systems and in all stages of data processing with the exception of intrinsically redundant devices such as the focal surface detectors. The CPU and DAQ block diagram and interfaces are shown in Figure 66.
Figure 66: JEM-EUSO block diagram and interfaces.
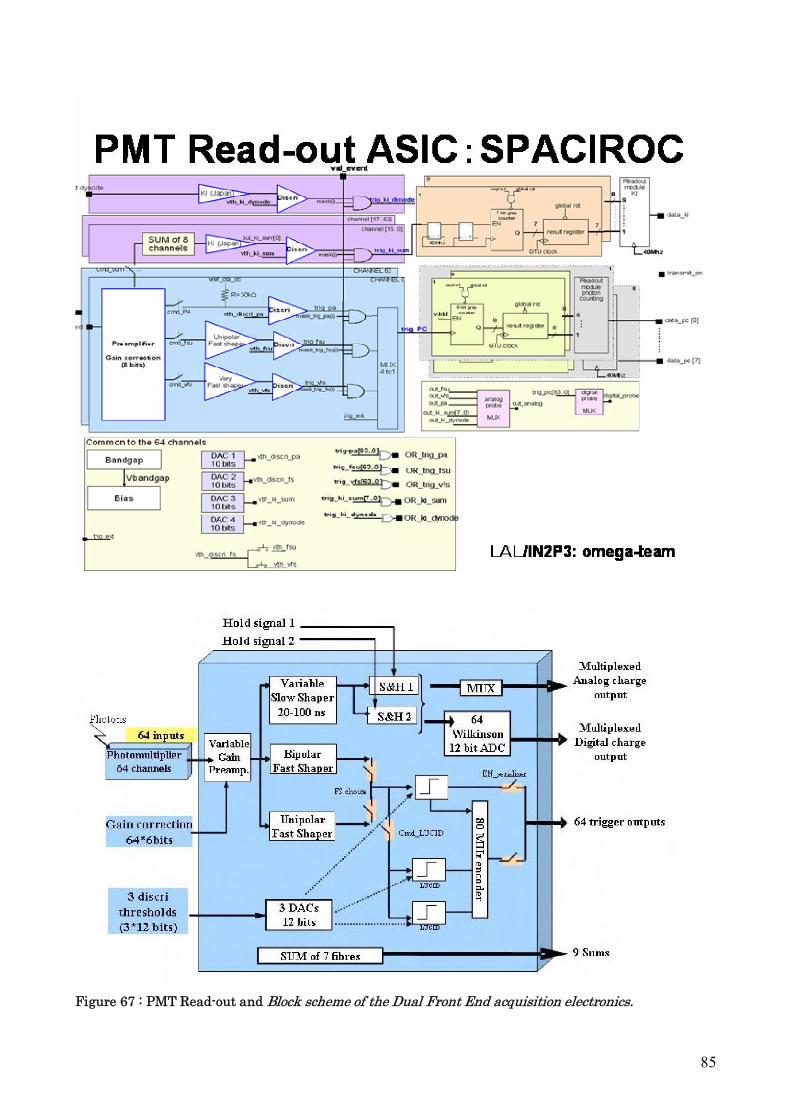
85
Figure 67 : PMT Read-out and Block scheme of the Dual Front End acquisition electronics.
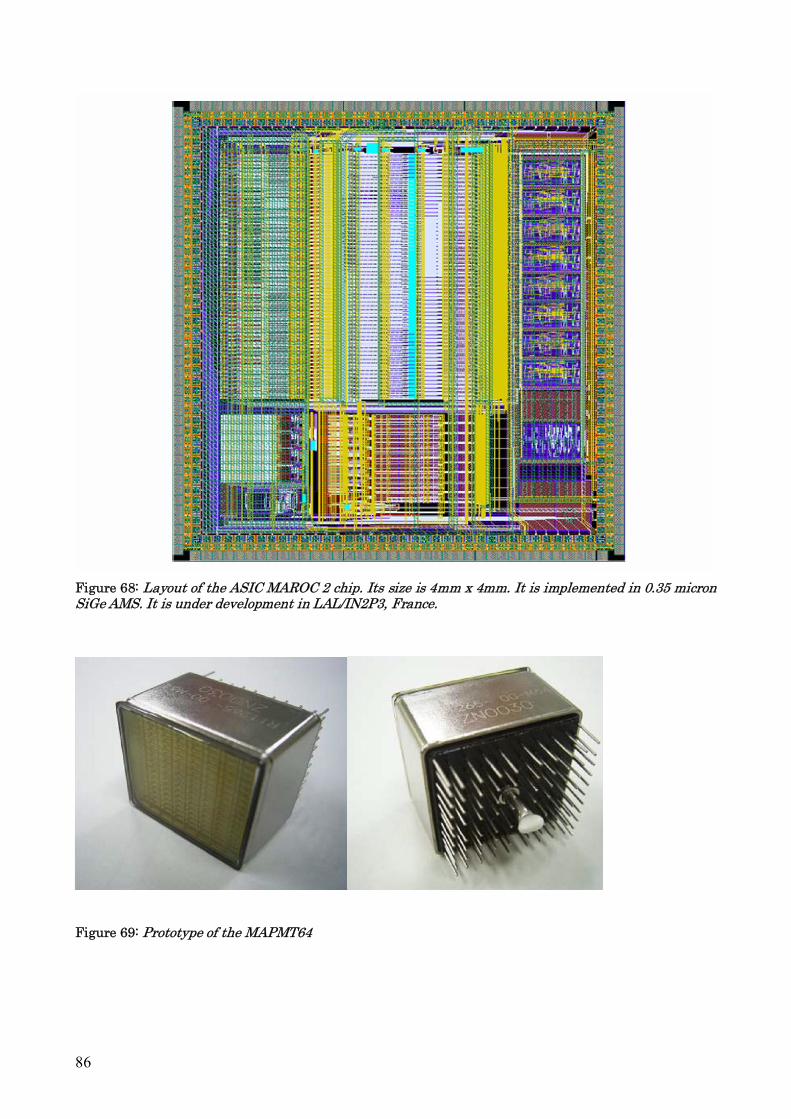
86
Figure 68: Layout of the ASIC MAROC 2 chip. Its size is 4mm x 4mm. It is implemented in 0.35 micron SiGe AMS. It is under development in LAL/IN2P3, France.
Figure 69: Prototype of the MAPMT64
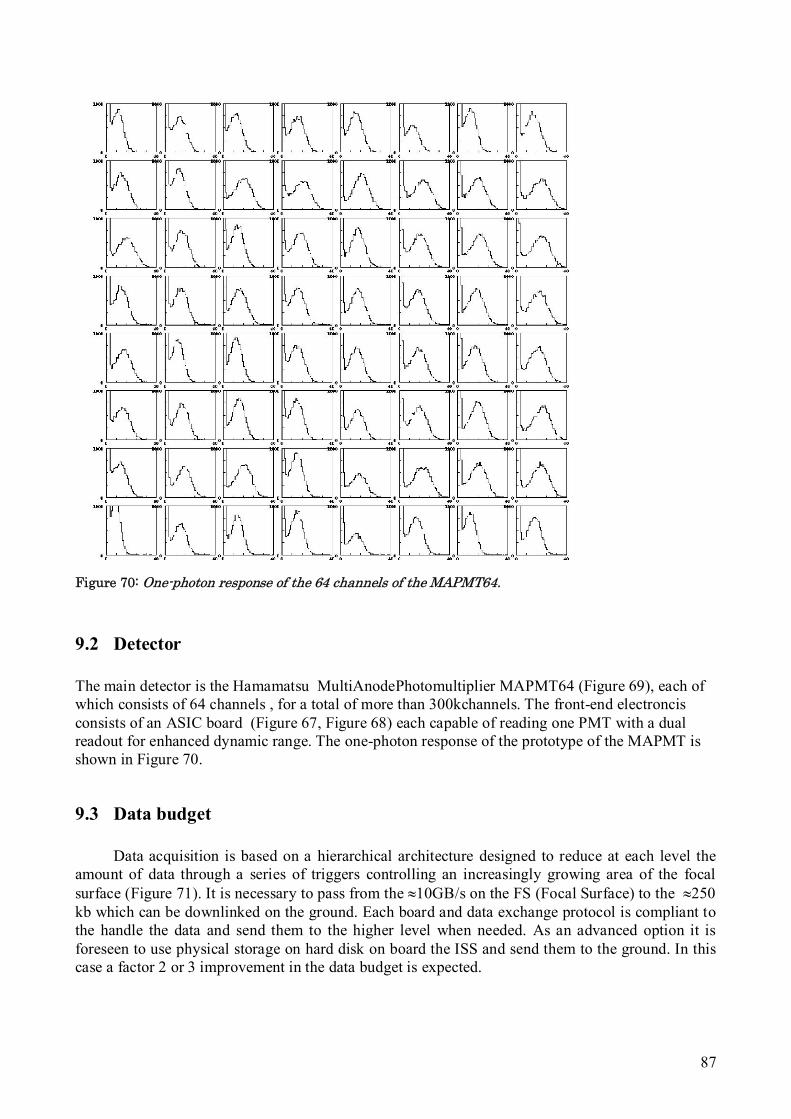
87
Figure 70: One-photon response of the 64 channels of the MAPMT64.
9.2 Detector The main detector is the Hamamatsu MultiAnodePhotomultiplier MAPMT64 (Figure 69), each of which consists of 64 channels , for a total of more than 300kchannels. The front-end electroncis consists of an ASIC board (Figure 67, Figure 68) each capable of reading one PMT with a dual readout for enhanced dynamic range. The one-photon response of the prototype of the MAPMT is shown in Figure 70.
9.3 Data budget
Data acquisition is based on a hierarchical architecture designed to reduce at each level the amount of data through a series of triggers controlling an increasingly growing area of the focal surface (Figure 71). It is necessary to pass from the 10GB/s on the FS (Focal Surface) to the 250 kb which can be downlinked on the ground. Each board and data exchange protocol is compliant to the handle the data and send them to the higher level when needed. As an advanced option it is foreseen to use physical storage on hard disk on board the ISS and send them to the ground. In this case a factor 2 or 3 improvement in the data budget is expected.
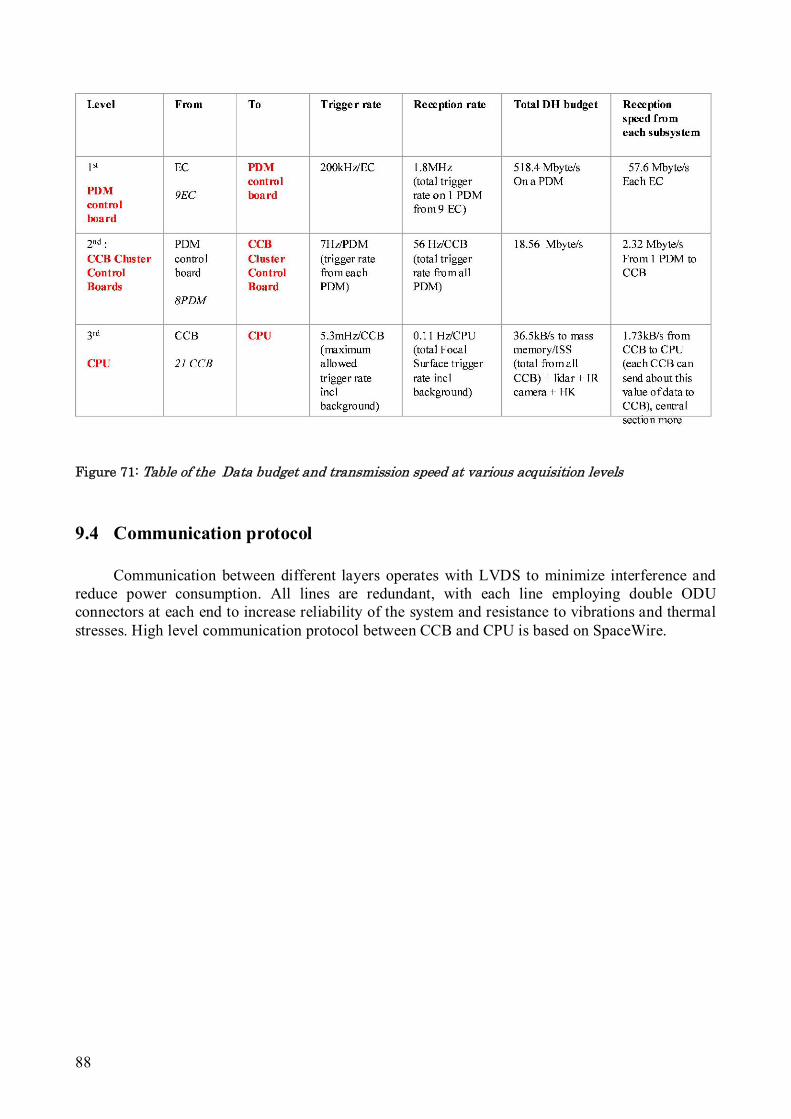
88
Figure 71: Table of the Data budget and transmission speed at various acquisition levels
9.4 Communication protocol
Communication between different layers operates with LVDS to minimize interference and reduce power consumption. All lines are redundant, with each line employing double ODU connectors at each end to increase reliability of the system and resistance to vibrations and thermal stresses. High level communication protocol between CCB and CPU is based on SpaceWire.
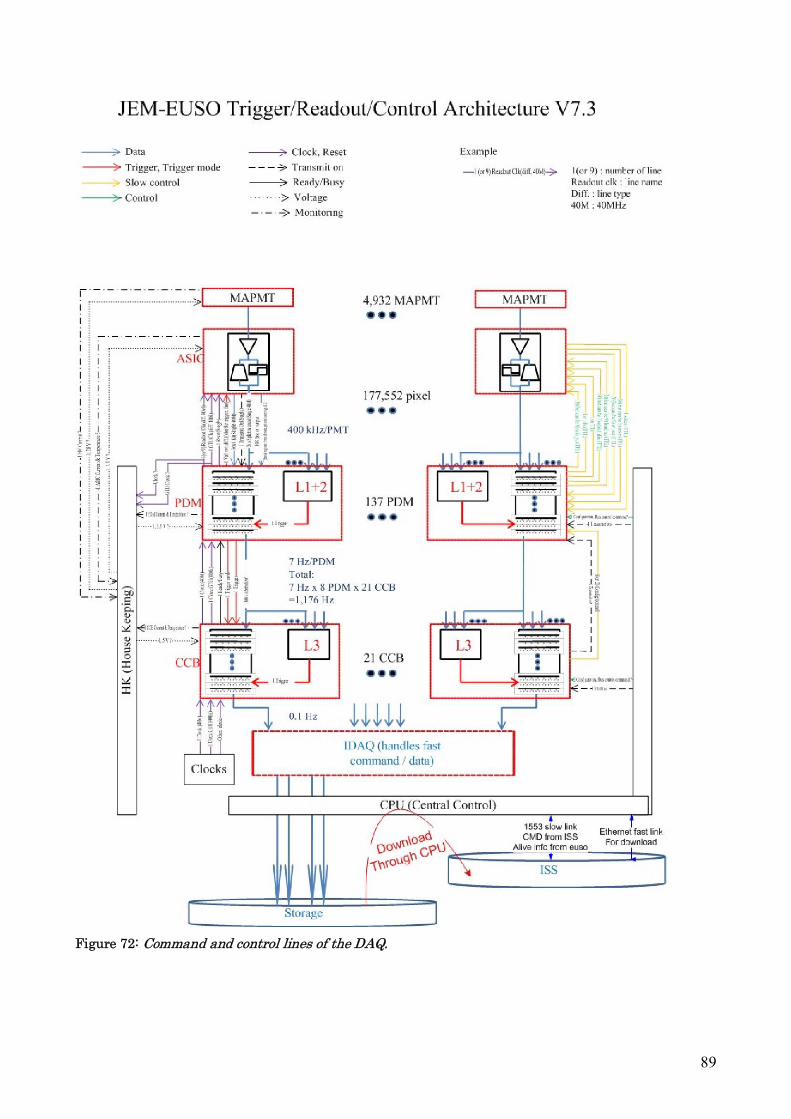
89
Figure 72: Command and control lines of the DAQ.
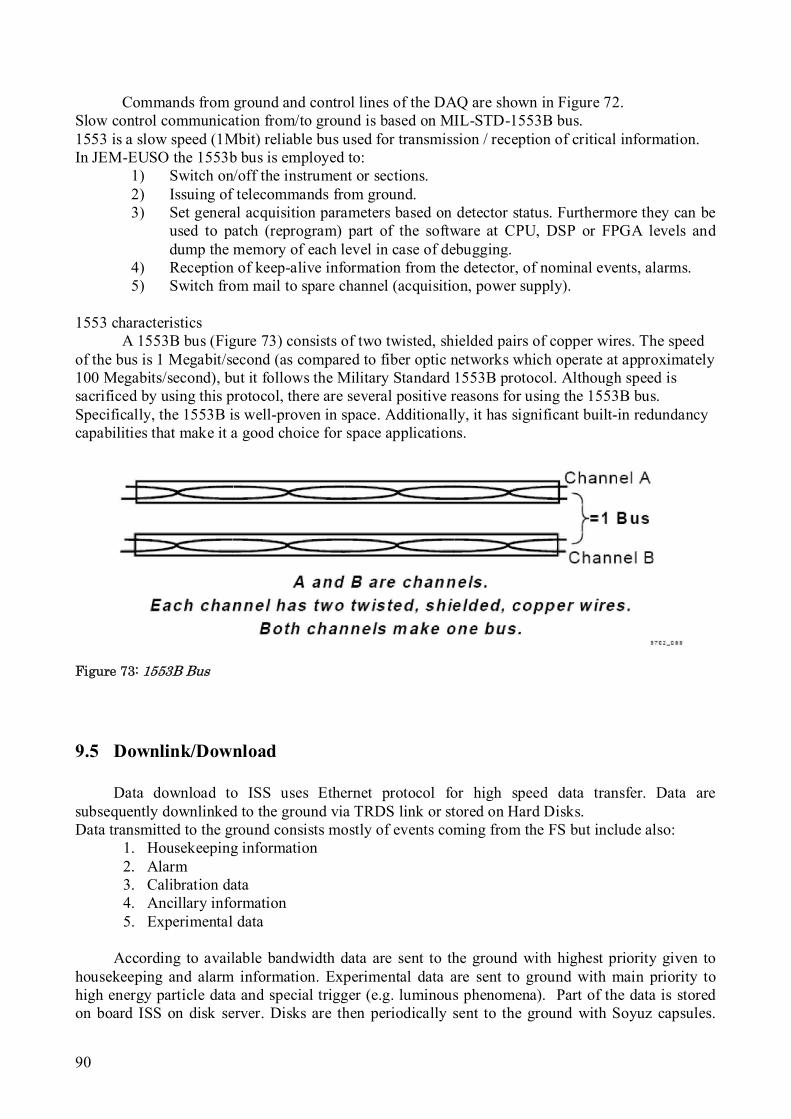
90
Commands from ground and control lines of the DAQ are shown in Figure 72. Slow control communication from/to ground is based on MIL-STD-1553B bus. 1553 is a slow speed (1Mbit) reliable bus used for transmission / reception of critical information. In JEM-EUSO the 1553b bus is employed to:
1) Switch on/off the instrument or sections. 2) Issuing of telecommands from ground. 3) Set general acquisition parameters based on detector status. Furthermore they can be
used to patch (reprogram) part of the software at CPU, DSP or FPGA levels and dump the memory of each level in case of debugging.
4) Reception of keep-alive information from the detector, of nominal events, alarms. 5) Switch from mail to spare channel (acquisition, power supply).
1553 characteristics
A 1553B bus (Figure 73) consists of two twisted, shielded pairs of copper wires. The speed of the bus is 1 Megabit/second (as compared to fiber optic networks which operate at approximately 100 Megabits/second), but it follows the Military Standard 1553B protocol. Although speed is sacrificed by using this protocol, there are several positive reasons for using the 1553B bus. Specifically, the 1553B is well-proven in space. Additionally, it has significant built-in redundancy capabilities that make it a good choice for space applications.
Figure 73: 1553B Bus
9.5 Downlink/Download
Data download to ISS uses Ethernet protocol for high speed data transfer. Data are subsequently downlinked to the ground via TRDS link or stored on Hard Disks. Data transmitted to the ground consists mostly of events coming from the FS but include also:
1. Housekeeping information 2. Alarm 3. Calibration data 4. Ancillary information 5. Experimental data
According to available bandwidth data are sent to the ground with highest priority given to
housekeeping and alarm information. Experimental data are sent to ground with main priority to high energy particle data and special trigger (e.g. luminous phenomena). Part of the data is stored on board ISS on disk server. Disks are then periodically sent to the ground with Soyuz capsules.
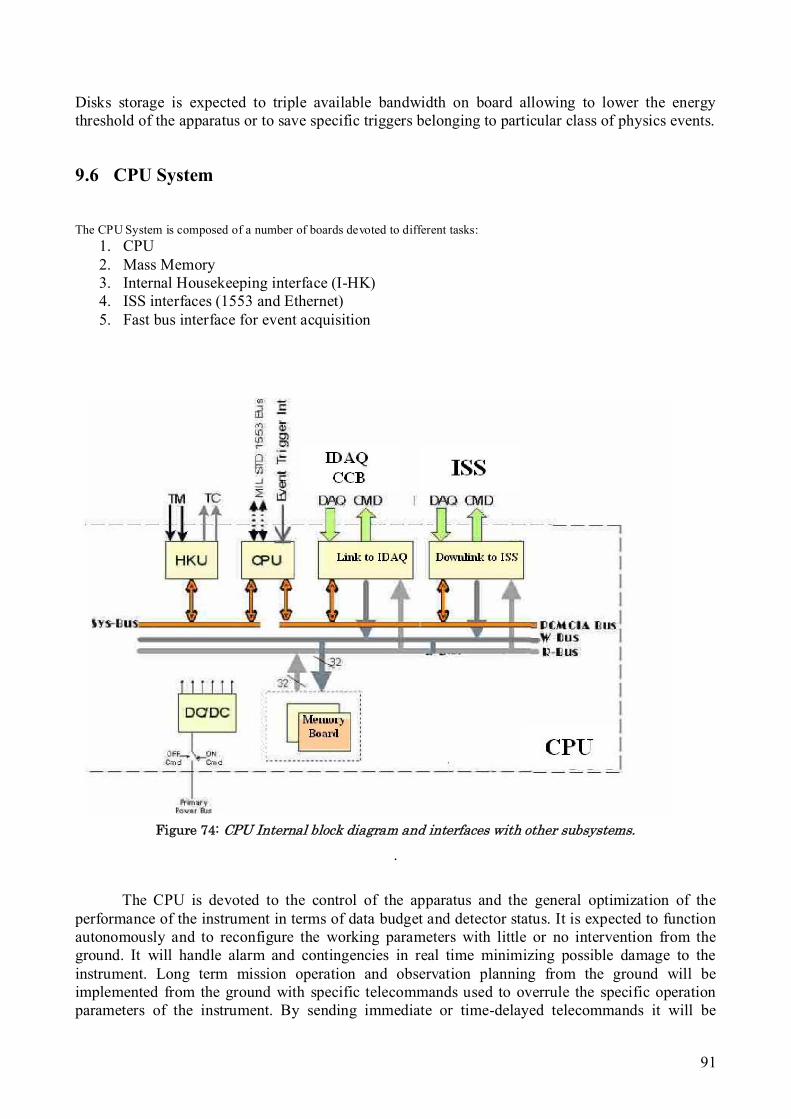
91
Disks storage is expected to triple available bandwidth on board allowing to lower the energy threshold of the apparatus or to save specific triggers belonging to particular class of physics events.
9.6 CPU System The CPU System is composed of a number of boards devoted to different tasks:
1. CPU 2. Mass Memory 3. Internal Housekeeping interface (I-HK) 4. ISS interfaces (1553 and Ethernet) 5. Fast bus interface for event acquisition
Figure 74: CPU Internal block diagram and interfaces with other subsystems.
.
The CPU is devoted to the control of the apparatus and the general optimization of the
performance of the instrument in terms of data budget and detector status. It is expected to function autonomously and to reconfigure the working parameters with little or no intervention from the ground. It will handle alarm and contingencies in real time minimizing possible damage to the instrument. Long term mission operation and observation planning from the ground will be implemented from the ground with specific telecommands used to overrule the specific operation parameters of the instrument. By sending immediate or time-delayed telecommands it will be

92
possible to define the various operation parameters of the instrument in terms of specific physics objectives or specific situations. In this scheme most of the computational power resides in the CCB (Cluster Control Boards), with the CPU being charged with trigger handling, telecommand reception and implementation, housekeeping monitor and so on. The main CPU tasks are:
1. Power on/off of all subsystems 2. Perform periodic calibrations 3. Start acquisition / Run 4. Define Trigger mode acquisition 5. Read Housekeeping 6. Take care of real time contingency planning 7. Perform periodic Download / downlink 8. Handle 1553 commands
CPU chip
CPU core for high level data acquisition and processing is based on Atmel AT697 Leon Chip. It is a Rad Hard 32-bit SPARC V8 (Figure 74, Figure 75 ) embedded processor, an implementation of the European Space Agency (ESA) LEON2 fault tolerant model. The baseline configuration is based on the Leon2 architecture, although different configurations (Leon3, HIREC) are also being considered. Baseline chip is AT697E, with AT697F as advanced option which is expected to have passed qualification tests by the end of 2008. AT697F is pin compatible to the AT697E, and it will have improved radiation resistant capabilities, >300 krads. ATMEL AT697 characteristics
The AT697 is a highly integrated, high-performance 32-bit RISC embedded processor based on the SPARC V8 architecture. By executing powerful instructions in a single clock cycle, the AT697 achieves throughputs approaching 1MIPS per MHz, allowing the system designer to optimize power consumption versus processing speed. The AT697 contains an on-chip Integer Unit (IU), a Floating Point Unit (FPU), separate instruction and data caches, hardware multiplier and divider, interrupt controller, debug support unit with trace buffer, two 24-bit timers, Parallel and Serial interfaces, a Watchdog, a PCI Interface and a flexible Memory Controller. The design is highly testable with the support of a Debug Support Unit (DSU) and a boundary scan through JTAG interface. An Idle mode holds the processor pipeline and allows Timer/Counter, Serial ports and Interrupt system to continue functioning. The processor is manufactured using the Atmel 0.18 μm CMOS process. It has been especially designed for space, by implementing on-chip concurrent transient and permanent error detection and correction.
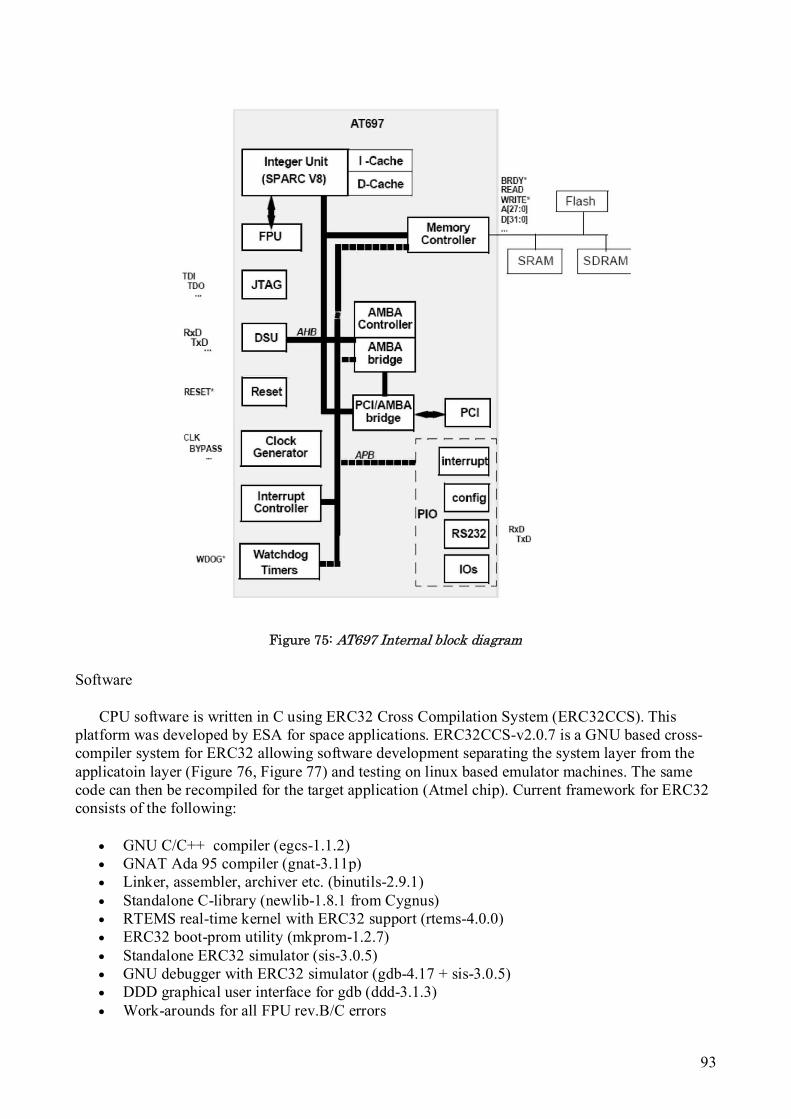
93
Figure 75: AT697 Internal block diagram
Software
CPU software is written in C using ERC32 Cross Compilation System (ERC32CCS). This platform was developed by ESA for space applications. ERC32CCS-v2.0.7 is a GNU based cross-compiler system for ERC32 allowing software development separating the system layer from the applicatoin layer (Figure 76, Figure 77) and testing on linux based emulator machines. The same code can then be recompiled for the target application (Atmel chip). Current framework for ERC32 consists of the following:
GNU C/C++ compiler (egcs-1.1.2) GNAT Ada 95 compiler (gnat-3.11p) Linker, assembler, archiver etc. (binutils-2.9.1) Standalone C-library (newlib-1.8.1 from Cygnus) RTEMS real-time kernel with ERC32 support (rtems-4.0.0) ERC32 boot-prom utility (mkprom-1.2.7) Standalone ERC32 simulator (sis-3.0.5) GNU debugger with ERC32 simulator (gdb-4.17 + sis-3.0.5) DDD graphical user interface for gdb (ddd-3.1.3) Work-arounds for all FPU rev.B/C errors
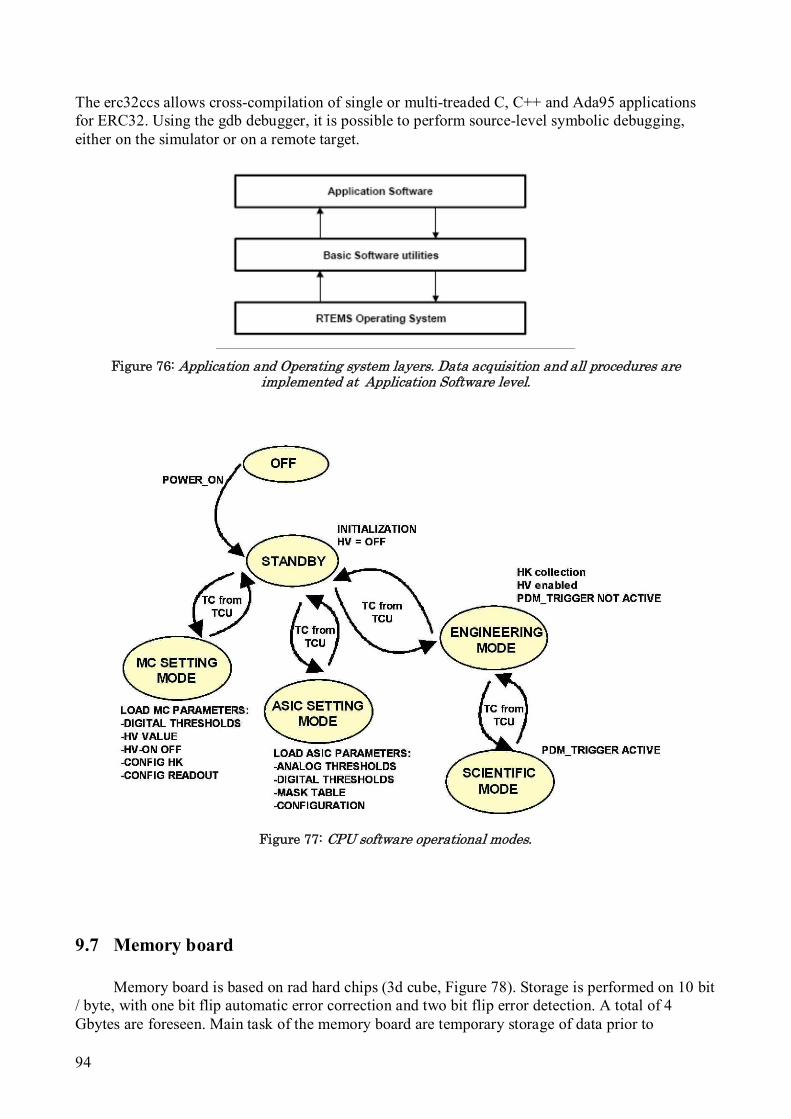
94
The erc32ccs allows cross-compilation of single or multi-treaded C, C++ and Ada95 applications for ERC32. Using the gdb debugger, it is possible to perform source-level symbolic debugging, either on the simulator or on a remote target.
Figure 76: Application and Operating system layers. Data acquisition and all procedures are implemented at Application Software level.
Figure 77: CPU software operational modes.
9.7 Memory board
Memory board is based on rad hard chips (3d cube, Figure 78). Storage is performed on 10 bit / byte, with one bit flip automatic error correction and two bit flip error detection. A total of 4 Gbytes are foreseen. Main task of the memory board are temporary storage of data prior to
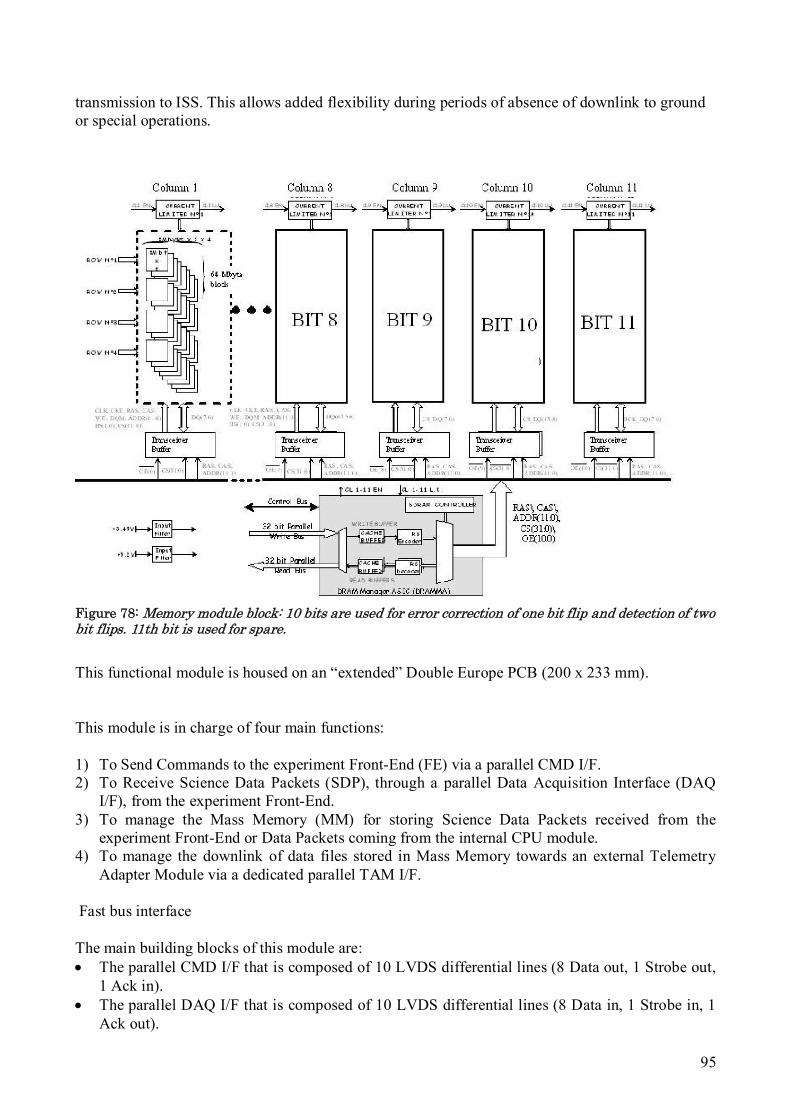
95
transmission to ISS. This allows added flexibility during periods of absence of downlink to ground or special operations.
Figure 78: Memory module block: 10 bits are used for error correction of one bit flip and detection of two bit flips. 11th bit is used for spare.
This functional module is housed on an “extended” Double Europe PCB (200 x 233 mm).
This module is in charge of four main functions:
1) To Send Commands to the experiment Front-End (FE) via a parallel CMD I/F. 2) To Receive Science Data Packets (SDP), through a parallel Data Acquisition Interface (DAQ
I/F), from the experiment Front-End. 3) To manage the Mass Memory (MM) for storing Science Data Packets received from the
experiment Front-End or Data Packets coming from the internal CPU module. 4) To manage the downlink of data files stored in Mass Memory towards an external Telemetry
Adapter Module via a dedicated parallel TAM I/F. Fast bus interface The main building blocks of this module are: The parallel CMD I/F that is composed of 10 LVDS differential lines (8 Data out, 1 Strobe out,
1 Ack in). The parallel DAQ I/F that is composed of 10 LVDS differential lines (8 Data in, 1 Strobe in, 1
Ack out).
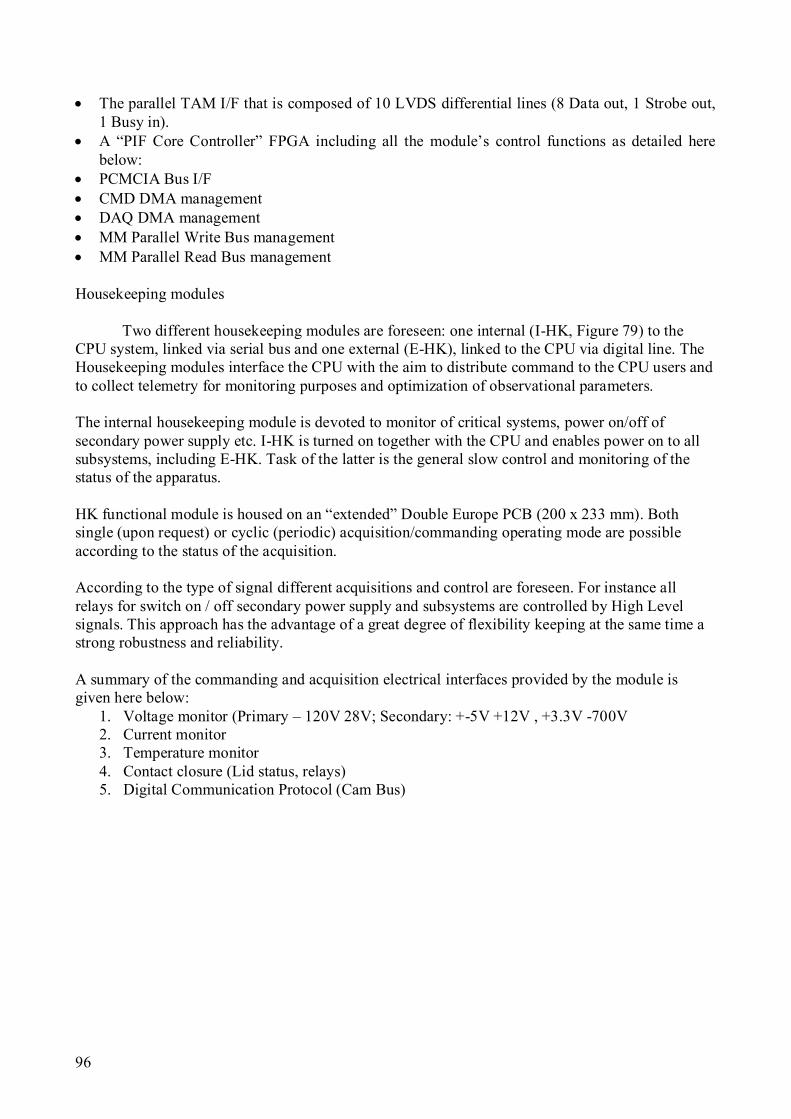
96
The parallel TAM I/F that is composed of 10 LVDS differential lines (8 Data out, 1 Strobe out, 1 Busy in).
A “PIF Core Controller” FPGA including all the module’s control functions as detailed here below:
PCMCIA Bus I/F CMD DMA management DAQ DMA management MM Parallel Write Bus management MM Parallel Read Bus management Housekeeping modules
Two different housekeeping modules are foreseen: one internal (I-HK, Figure 79) to the CPU system, linked via serial bus and one external (E-HK), linked to the CPU via digital line. The Housekeeping modules interface the CPU with the aim to distribute command to the CPU users and to collect telemetry for monitoring purposes and optimization of observational parameters. The internal housekeeping module is devoted to monitor of critical systems, power on/off of secondary power supply etc. I-HK is turned on together with the CPU and enables power on to all subsystems, including E-HK. Task of the latter is the general slow control and monitoring of the status of the apparatus. HK functional module is housed on an “extended” Double Europe PCB (200 x 233 mm). Both single (upon request) or cyclic (periodic) acquisition/commanding operating mode are possible according to the status of the acquisition. According to the type of signal different acquisitions and control are foreseen. For instance all relays for switch on / off secondary power supply and subsystems are controlled by High Level signals. This approach has the advantage of a great degree of flexibility keeping at the same time a strong robustness and reliability. A summary of the commanding and acquisition electrical interfaces provided by the module is given here below:
1. Voltage monitor (Primary – 120V 28V; Secondary: +-5V +12V , +3.3V -700V 2. Current monitor 3. Temperature monitor 4. Contact closure (Lid status, relays) 5. Digital Communication Protocol (Cam Bus)
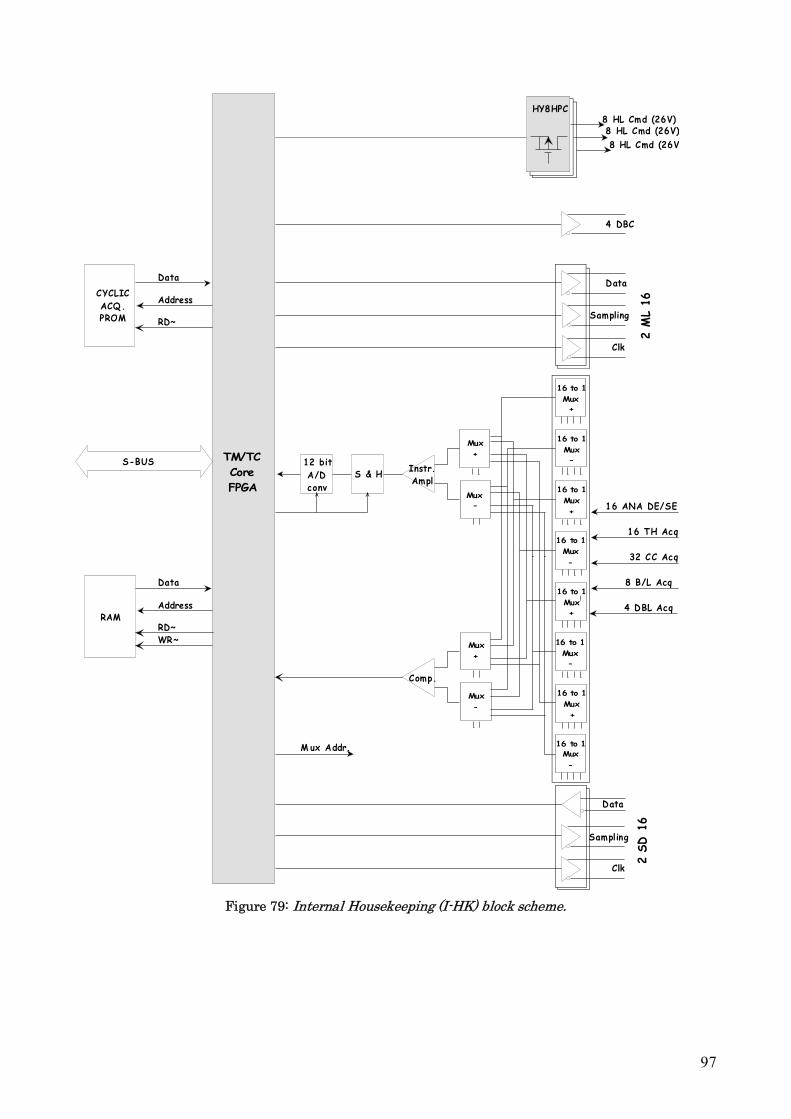
97
16 ANA DE/SE
8 B/L Acq
32 CC Acq
16 TH Acq
Data
Sampling
Clk
Sampling
Clk
Data
16 to 1
Mux
-
16 to 1
Mux
+
16 to 1
Mux
-
16 to 1
Mux
+
16 to 1
Mux
-
16 to 1
Mux
+
16 to 1
Mux
-
16 to 1
Mux
+
Mux
-
Mux
+
Mux
-
Mux
+
Instr.
Ampl
Comp.
12 bit
A/D
conv
S & H
M ux Addr.
2 S
D 1
62 M
L 16
HY8HPC
TM/TC
Core
FPGA
CYCLIC
ACQ.
PROM
Data
Address
RD~
RAM
Data
Address
RD~
WR~
S-BUS
8 HL Cmd (26V)8 HL Cmd (26V)
8 HL Cmd (26V
4 DBL Acq
4 DBC
Figure 79: Internal Housekeeping (I-HK) block scheme.
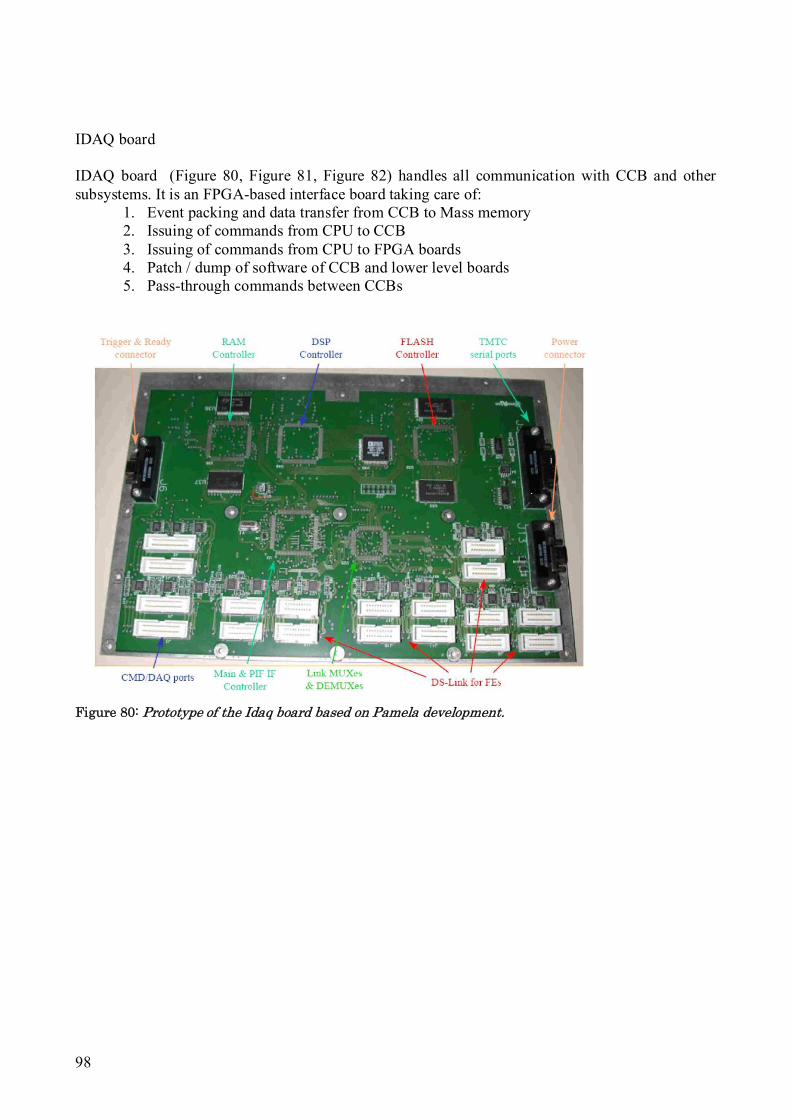
98
IDAQ board IDAQ board (Figure 80, Figure 81, Figure 82) handles all communication with CCB and other subsystems. It is an FPGA-based interface board taking care of:
1. Event packing and data transfer from CCB to Mass memory 2. Issuing of commands from CPU to CCB 3. Issuing of commands from CPU to FPGA boards 4. Patch / dump of software of CCB and lower level boards 5. Pass-through commands between CCBs
Figure 80: Prototype of the Idaq board based on Pamela development.
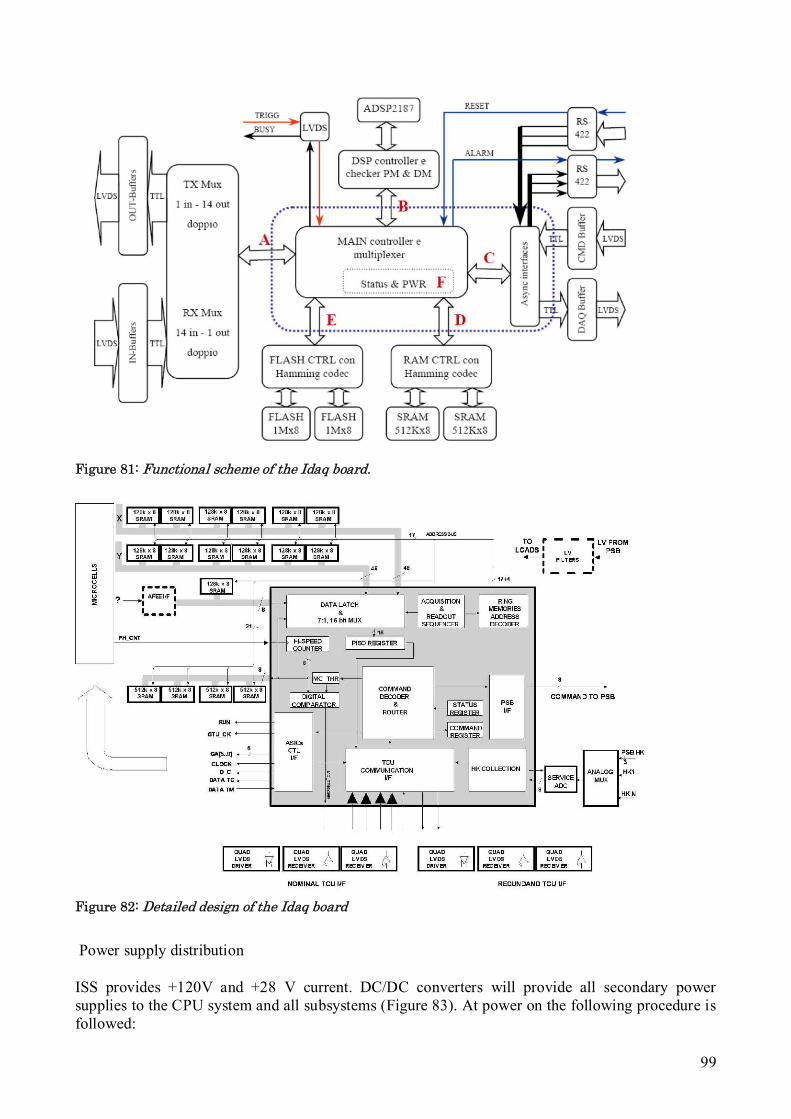
99
Figure 81: Functional scheme of the Idaq board.
Figure 82: Detailed design of the Idaq board
Power supply distribution ISS provides +120V and +28 V current. DC/DC converters will provide all secondary power supplies to the CPU system and all subsystems (Figure 83). At power on the following procedure is followed:
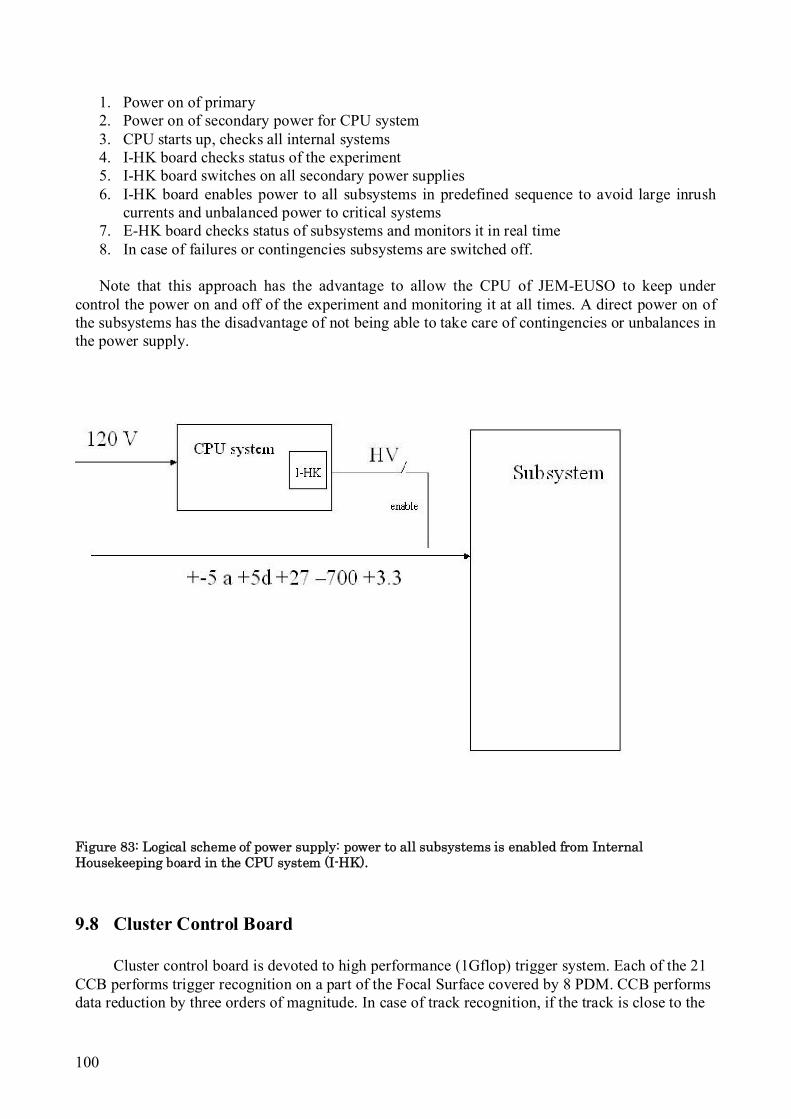
100
1. Power on of primary 2. Power on of secondary power for CPU system 3. CPU starts up, checks all internal systems 4. I-HK board checks status of the experiment 5. I-HK board switches on all secondary power supplies 6. I-HK board enables power to all subsystems in predefined sequence to avoid large inrush
currents and unbalanced power to critical systems 7. E-HK board checks status of subsystems and monitors it in real time 8. In case of failures or contingencies subsystems are switched off.
Note that this approach has the advantage to allow the CPU of JEM-EUSO to keep under
control the power on and off of the experiment and monitoring it at all times. A direct power on of the subsystems has the disadvantage of not being able to take care of contingencies or unbalances in the power supply.
Figure 83: Logical scheme of power supply: power to all subsystems is enabled from Internal Housekeeping board in the CPU system (I-HK).
9.8 Cluster Control Board
Cluster control board is devoted to high performance (1Gflop) trigger system. Each of the 21 CCB performs trigger recognition on a part of the Focal Surface covered by 8 PDM. CCB performs data reduction by three orders of magnitude. In case of track recognition, if the track is close to the
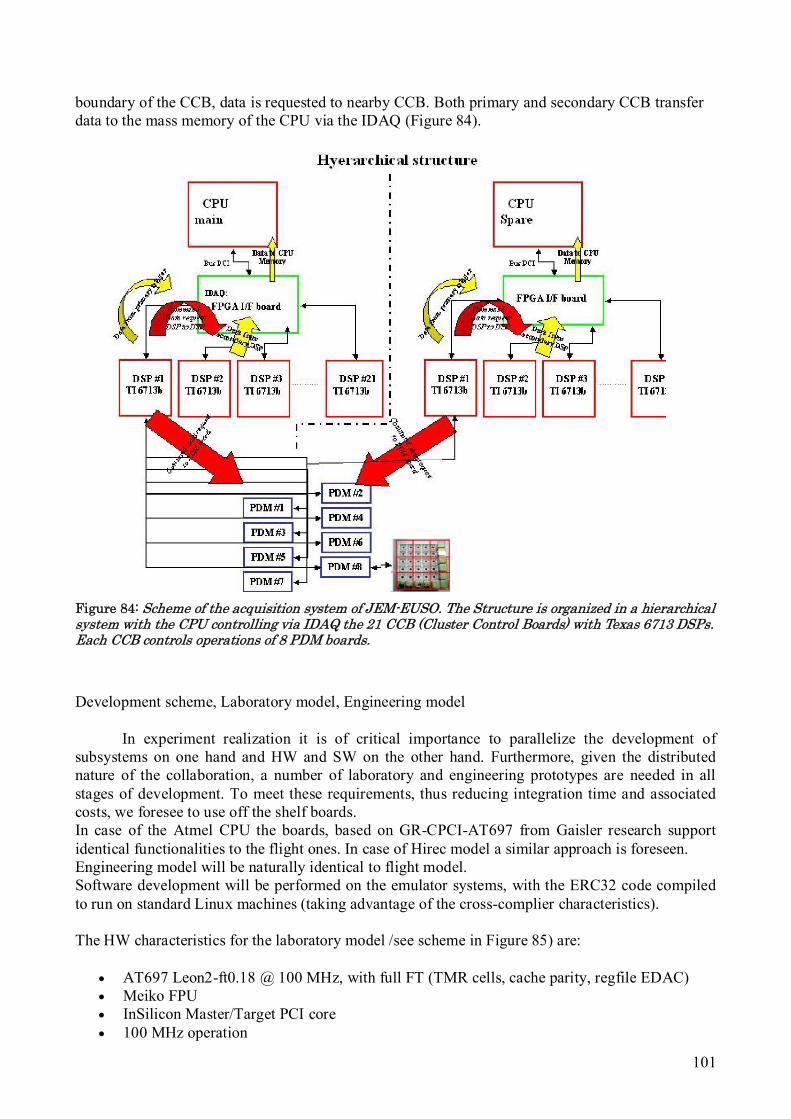
101
boundary of the CCB, data is requested to nearby CCB. Both primary and secondary CCB transfer data to the mass memory of the CPU via the IDAQ (Figure 84).
Figure 84: Scheme of the acquisition system of JEM-EUSO. The Structure is organized in a hierarchical system with the CPU controlling via IDAQ the 21 CCB (Cluster Control Boards) with Texas 6713 DSPs. Each CCB controls operations of 8 PDM boards.
Development scheme, Laboratory model, Engineering model
In experiment realization it is of critical importance to parallelize the development of subsystems on one hand and HW and SW on the other hand. Furthermore, given the distributed nature of the collaboration, a number of laboratory and engineering prototypes are needed in all stages of development. To meet these requirements, thus reducing integration time and associated costs, we foresee to use off the shelf boards. In case of the Atmel CPU the boards, based on GR-CPCI-AT697 from Gaisler research support identical functionalities to the flight ones. In case of Hirec model a similar approach is foreseen. Engineering model will be naturally identical to flight model. Software development will be performed on the emulator systems, with the ERC32 code compiled to run on standard Linux machines (taking advantage of the cross-complier characteristics). The HW characteristics for the laboratory model /see scheme in Figure 85) are:
AT697 Leon2-ft0.18 @ 100 MHz, with full FT (TMR cells, cache parity, regfile EDAC) Meiko FPU InSilicon Master/Target PCI core 100 MHz operation
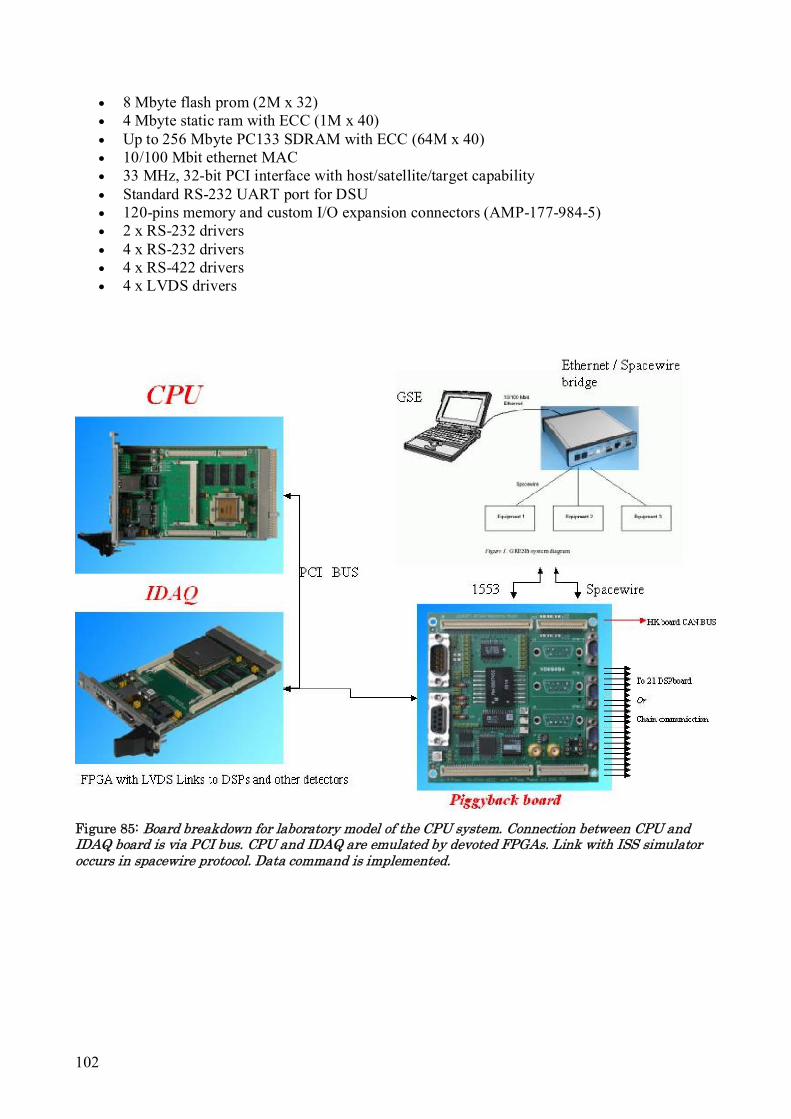
102
8 Mbyte flash prom (2M x 32) 4 Mbyte static ram with ECC (1M x 40) Up to 256 Mbyte PC133 SDRAM with ECC (64M x 40) 10/100 Mbit ethernet MAC 33 MHz, 32-bit PCI interface with host/satellite/target capability Standard RS-232 UART port for DSU 120-pins memory and custom I/O expansion connectors (AMP-177-984-5) 2 x RS-232 drivers 4 x RS-232 drivers 4 x RS-422 drivers 4 x LVDS drivers
Figure 85: Board breakdown for laboratory model of the CPU system. Connection between CPU and IDAQ board is via PCI bus. CPU and IDAQ are emulated by devoted FPGAs. Link with ISS simulator occurs in spacewire protocol. Data command is implemented.
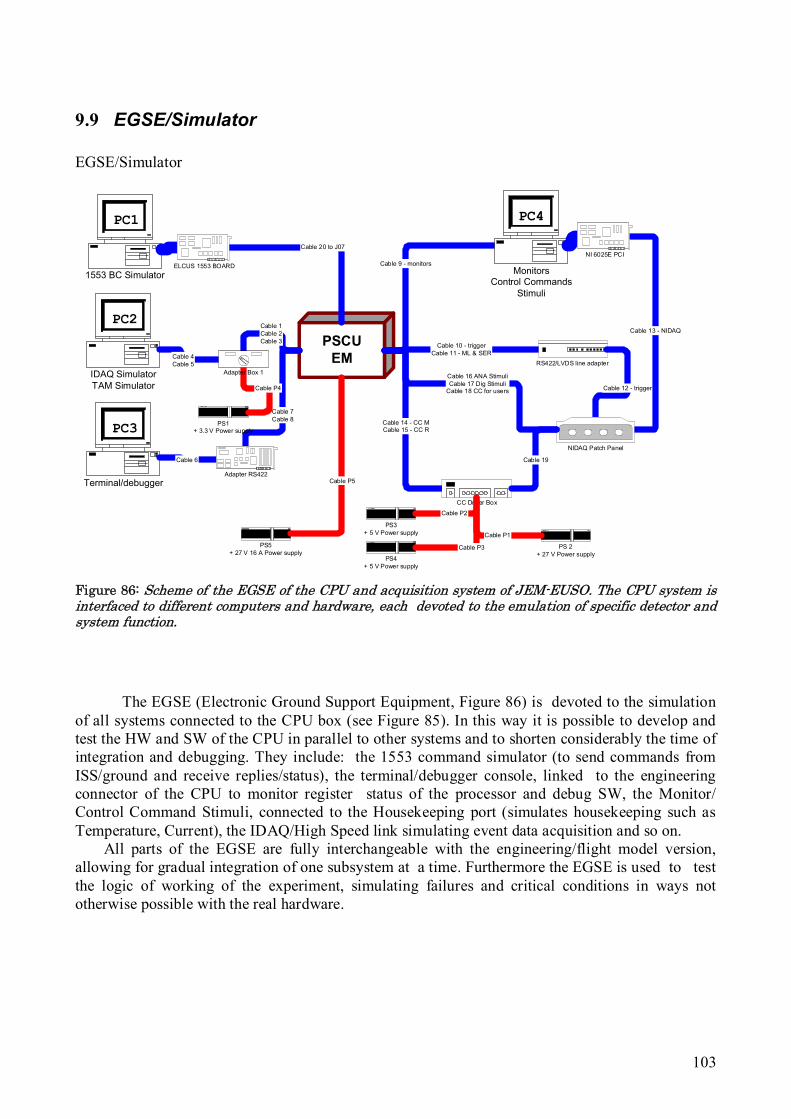
103
9.9 EGSE/Simulator EGSE/Simulator
PSCUEM
Cable 20 to J07
Cable 1Cable 2Cable 3
Cable 7Cable 8
Cable 9 - monitors
1553 BC Simulator
PC1
IDAQ SimulatorTAM Simulator
PC2
Terminal/debugger
PC3
MonitorsControl Commands
Stimuli
PC4
ELCUS 1553 BOARD
Cable 6
Adapter RS422
Cable 4Cable 5
Cable 10 - triggerCable 11 - ML & SER
RS422/LVDS line adapter
Cable 12 - trigger
Cable 13 - NIDAQ
NIDAQ Patch Panel
Cable 14 - CC MCable 15 - CC R
CC Driver Box
Cable 19
Cable 16 ANA StimuliCable 17 Dig Stimuli
Cable 18 CC for users
PS 2+ 27 V Power supply
Cable P1
PS1+ 3.3 V Power supply
Cable P4
PS3+ 5 V Power supply
PS4+ 5 V Power supply
Cable P2
Cable P3
Adapter Box 1
PS5+ 27 V 16 A Power supply
Cable P5
NI 6025E PCI
Figure 86: Scheme of the EGSE of the CPU and acquisition system of JEM-EUSO. The CPU system is interfaced to different computers and hardware, each devoted to the emulation of specific detector and system function.
The EGSE (Electronic Ground Support Equipment, Figure 86) is devoted to the simulation of all systems connected to the CPU box (see Figure 85). In this way it is possible to develop and test the HW and SW of the CPU in parallel to other systems and to shorten considerably the time of integration and debugging. They include: the 1553 command simulator (to send commands from ISS/ground and receive replies/status), the terminal/debugger console, linked to the engineering connector of the CPU to monitor register status of the processor and debug SW, the Monitor/ Control Command Stimuli, connected to the Housekeeping port (simulates housekeeping such as Temperature, Current), the IDAQ/High Speed link simulating event data acquisition and so on.
All parts of the EGSE are fully interchangeable with the engineering/flight model version, allowing for gradual integration of one subsystem at a time. Furthermore the EGSE is used to test the logic of working of the experiment, simulating failures and critical conditions in ways not otherwise possible with the real hardware.
104
Chapter 10 Simulations
One of the key efforts in JEM-EUSO is the development of End-to-End simulation Packages.
End-to-end simulations are needed to: 1) understand the response of the Instrument under different design, operational and mission configurations; 2) optimize the design and the working parameters of the instrument; 3) test and develop reconstruction algorithms for the measurement of the EAS parameters (arrival angle, energy, position of the maximum); 4) possibly estimate the scientific performances of the mission (trigger efficiency, angular, energy and Xmax resolution) under different environmental conditions (clouds, background, duty cycle etc.). End-to-end simulations are indeed very complex and should take into account all the many aspects of the production, transport and detection of the light/signal in EUSO.
Two totally independent codes have been developed within the international collaboration. In particular in Europe we have focused our attention on the development of the EUSO Simulation and Analysis Framework (ESAF), which was initiated by the EUSO collaboration, and is based on ROOT and uses a C++ object oriented approach [41]. ESAF is highly modular and different packages have been developed to treat (i) shower production; (ii) light production and radiative transport in the atmosphere; (iii) instrument configuration and light transport through optics onto the focal surface; (iv) production and processing of the electronic signal produced by the incoming light; (v) generation of the time resolved track under the presence of background; (vi) reconstruction of the parameters of the EAS. European, Russian and Mexican groups are strongly engaged in the development of ESAF. In particular, the group in Tubingen (IAAT), which is coordinating the ESAF efforts, has the responsibility of the implementation of instrument configuration (Optics, Focal Surface, Electronics, Trigger) and, together with Russia, of the testing, optimization and development of reconstruction algorithms [42]. This is particularly critical in view of the fact that the developed algorithms and procedures will be used later for the analysis of real data.
Another key area of work is the discrimination of neutrinos and gammas vs. charged particles. The discrimination between gammas and protons at high energies depends on the interplay of two competing phenomena: the LPM effect [44], which tends to increase the depth of the maximum development of an EAS in the atmosphere, Xmax, and pair production in the geomagnetic field, which moves upwards, between 1000 and 2000 km of height, the starting point of the electromagnetic cascades. The latter phenomenon depends strongly on the intensity of the perpendicular component of the geomagnetic field, and therefore on the position over the Earth and incidence direction of the UHE particle. Also on the basis of Xmax, neutrinos, which are deeply penetrating, will be discriminated from protons.
Poland is, together with Mexico, actively working in the generation of showers databases using wellestablished production packages (Corsika, Conex). Mexico, Poland, Italy and Spain are actively working on different aspects related to atmosphere conditions (role of optically thin an optically thick clouds, measurement of clouds cover and altitude) and events (Transient luminous events, Terrestrial Gamma Flashes).
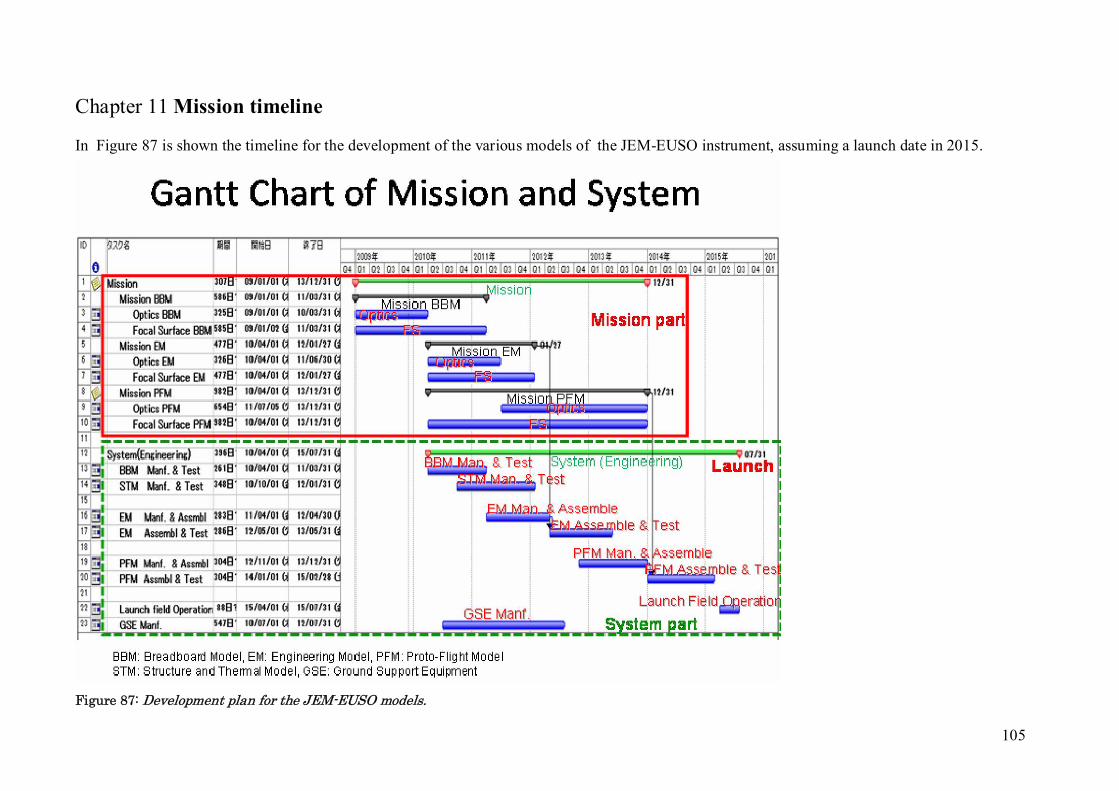
105
Chapter 11 Mission timeline In Figure 87 is shown the timeline for the development of the various models of the JEM-EUSO instrument, assuming a launch date in 2015.
Figure 87: Development plan for the JEM-EUSO models.

106
REFERENCES [1] ESA EUSO Report of the Phase A Study Scarsi, L. et al., http://euso.iasf-palermo.inaf.it/ [2]NASA MIDEX: http://www1.nasa.gov/home/hqnews/2003/mar/HP_news_c03h_prt.htm; http://aquila.lbl.gov/EUSO/ [3] JAXA Phase A Report, Unpublished 2008; http://jemeuso.riken.jp/en/index.html [4] A historical review: Nagano M. and Watson A. A. 2000, Rev. Mod. Phys. 72-73, 689. [5] Greisen K. 1966, Phys rev. Lett. 16, 748; Zatsepin G. T., Kuzmin V. A. Zh. 1966, Eksp. Teor. Fiz., 4, 114 (JETP Lett., 4, 78). [6] Takeda M. et al. 2003, Astropart. Phys., 19, 447; Abu-Zayyad T. et al. 2004, Phys.Rev.Lett., 92. [7] Abraham, J. et al. (The Pierre Auger Collaboration) 2008 Phys. Rev. Lett. 101 0611101; HiRes Collaboration 2008 Phys. Rev. Lett., 100, 101101. [8] Takeda M. et al. 1999, Astrophys. J., 522, 225; Abbasi et al. 2004, Astrophys. J., 610, L79. [9] Abraham J. et al. (The Pierre Auger Collaboration) 2007, Science, 318, 5852 938. [10] Berezinsky V. S. 2005, Proc. of 13th Int. Symposium on VHECR Interactions, Pylos, 2004, astro-ph/0509069. [11] Bhattacharjee P. & Sigl G. 2000, Phys. Rep., 327, 109. [12] Berezinsky, V.S. et al. 1990, “Astrophysics of Cosmic Rays,” North-Holland, Amsterdam. [13] Waxman E. & Bahcall J. N. 1998, Phys.Rev. D59, 023002. [14] Abraham J et al. (The Auger Collaboration) 2008, Phys. Rev. Lett., 100, 211101. [15] Berezinsky V., Kachelriess M. and Vilenkin A. 1997, Phys Rev Letters, 79, 4302; Medina-Tanco G. & Watson, A. A. 1999, Astropart. Phys., 12, 25. [16] Weiler T. 1982, Phys. Rev. Lett. 49, 234; Weiler T. 1984, Astrophys. J., 285, 495. [17] G. Medina-Tanco et al. 2009, White Paper on “Fundamental physics from space with ultra-high energy cosmic rays”, submitted to ESA’s Fundamental Physics Roadmap Advisory Team. [18] Ancordoqui L. A., Feng J. L. and Goldberg H. 2002, Phys. Lett. B, 525, 302. [19] Palomares-Ruiz S, Irimia A. and Weiler T. J. 2006, Phys. Rev. D, 73, 083003. [20] Weiler T.J. 1999, Astropart. Phys. 11, 303 and 317; Fargion D., Mele B., and Salis A. 1999, ApJ 157, 725; Bottai S. & Giurgola S. 2003, Astropart.Phys., 539 [21] D. Colladay and V.A. Kosteleck´y 1997, Phys. Rev. D 55, 6760 hep-ph/9703464; D. Colladay and V.A. Kosteleck´y 1998, Phys. Rev. D, 58, 116002 hep-ph/9809521; S.R. Coleman, S. L. Glashow 1997, Phys. Lett. B, 405, 249 hep-ph/9703240; S.R. Coleman, S. L. Glashow 1999, Phys. Rev. D, 59, 116008 hep-ph/9812418. [22] F.W. Stecker, S.L. Glashow 2001, Astropart. Phys., 16, 97 astro-ph/0102226. [23] Bluhm R. 2006, Special Relativity, Lecture Notes in Phys., Springer Verlag, 702 191. [24] Kostelecky V. A. 2004, Phys.Rev. D, 69, 105009. [25] Parizot. E. et al. 2009, White paper on “Towards a new era in ultra high energy cosmic ray studies”, submitted to ESA’s Fundamental Physics Roadmap Advisory Team; Olinto a. et al. 2009, Astro2010: The astromomy and astrophysics decadal survey,

107
science white papers n. 225, astro-ph/0903.0205. [26] Anzalone A., Isgrò F., Tegolo D.2009 “Combining Fuzzy C-Mean and Normalized Convolution for Cloud Detection in IR images”, WILF'09. [27] Zwally H. J. et al. 2002, Journal of Geodynamics, 34, 405-455. [28] H.Svensmark, E.Friis-Christensen 1997, J. Atmos. Solar Terr. Phys., 59, 1225; N.Marsh, H.Svensmark 2000, Phys. Rev. Lett., 85, 5004; but see also K. S. Carslaw, R. G. Harrison, J. Kirkby, Science, 298, 1732, 2002. [29] Winker D. M., et al. 2004, Proc. SPIE, vol 5575, 8-15. [30] C. D. Hatch, V.H. Grassian 2008, J. Environ. Monitoring, 10 (8), 919-934. [31] A. Wiacek, T. Peter 2009, Geophys. Res. Lett., 36, L17801. [32] Wiacek A., Taddeo M., Peter T. 2009, IGAC Newsletter, Ed. S. Doherty, No. 40. [33] Takahashi, Y. et al. 2007, Journal of Physics C, 65, 012022; Ebisuzaki, T. 2008, Nuclear Physics B, 175, 237. [34] Kakimoto F. et al. 1996, Nucl. Instr. Meth., A372, 527; Nagano F. et al. 2004, Astropart. Phys., 22, 235 [35] Barbier L. M. et al. 2005, Astropart. Phys., 22, 439; Garipov G. K. et al. 2005, JEPT Letters, 82(4), 185 [36] Berat C. et al. 2003, Proceedings of the 28th ICRC, Tsukuba, Japan. [37] Catalano O. et al. 2009, Proceedings of the 31th ICRC, Lodz, Poland. [38] Wada S. et al. 2009, Proceedings of the 31th ICRC Lodz, Poland. [39] Winker D. M. et al. 2004, Proc. SPIE, vol 5575, 8-15. [40] IHI Aerospace Engineering Co., Ltd. 2008, “Conceptual design support/achievement report (Vol. 3) about the missions candidates of the 2nd phase utilization of JEM-EF”. [41] Fenu F. et al. 2009, Proceedings of the 31th ICRC, Lodz, Poland. [42] Mernik T. et al. 2009, Proceedings of the 31th ICRC, Lodz, Poland. [43] Takami, H. and Sato, K., 2008, Astrophys. J., 678, 606; Ebisuzaki T. et al. (The JEM-EUSO Collaboration) 2009, Proceedings of the 31th ICRC, Lodz, Poland; [44] Landau L. D. & Pomeranchuk I. J. 1935, Dokl. Akad. Nauk SSSR, 92, 535; Migdal A. B. 1956, Phys Rev., 103, 1811

108
ATTACHMENTS Attachment 1.
A Roadmap for Fundamental Physics in Space Prepared by the ESA-appointed
Fundamental Physics Roadmap Advisory Team (FPR-AT) 26 July 2010

109
Attachment 2. ESA-AWG(Astronomy Working Group)

110
Attachment 3. ESA(European Space Agency)

111

112
Attachment 4. ESF(European Science Foundation)

113

114
Attachment 5. JEM-EUSO Report on the Phase A Study (December 2008)