Embed Size (px)
Citation preview

The IPCC Special Report on Managing the Risks
of Extreme Events and Disasters to Advance
Climate Change Adaptation
Roger Pulwarty (NOAA, GCOS, IPCC)

2
“This IPCC report addresses (for the first time) how
integrating expertise in climate science, hazards and
disaster risk management, and adaptation can
inform, help to reduce and manage the risks of
extreme events and disasters in a changing climate”

Sea-Surface Temperature
Sea-ice
Sea Level
Glaciers (Glacier Mass Balance)
Snow Cover (March-April, Northern Hemisphere)
Land Surface Air
Temperature Over Land Ocean Heat Content
Specific
Humidity
3
4 Datasets
2 Datasets
5 Datasets
7 Datasets 3 Datasets
7 Datasets 7 Datasets
5 Datasets
Temperature Over Oceans
7 Datasets
Air Temperature Near Surface
(Troposphere)
3 Datasets

4
In many regions, the time between “20-year” (unusually) warm days will
decrease
Climate models project more frequent hot days throughout
the 21st century

A changing climate leads to changes in
extreme weather and climate events
5

Disaster risk management and climate change adaptation can influence the
degree to which extreme events translate into impacts and disasters
6
Increasing vulnerability, exposure, or
severity and frequency of climate events
increases disaster risk

Exposure to sea-level rise
Population exposed in 2050 (millions) relative to present
8
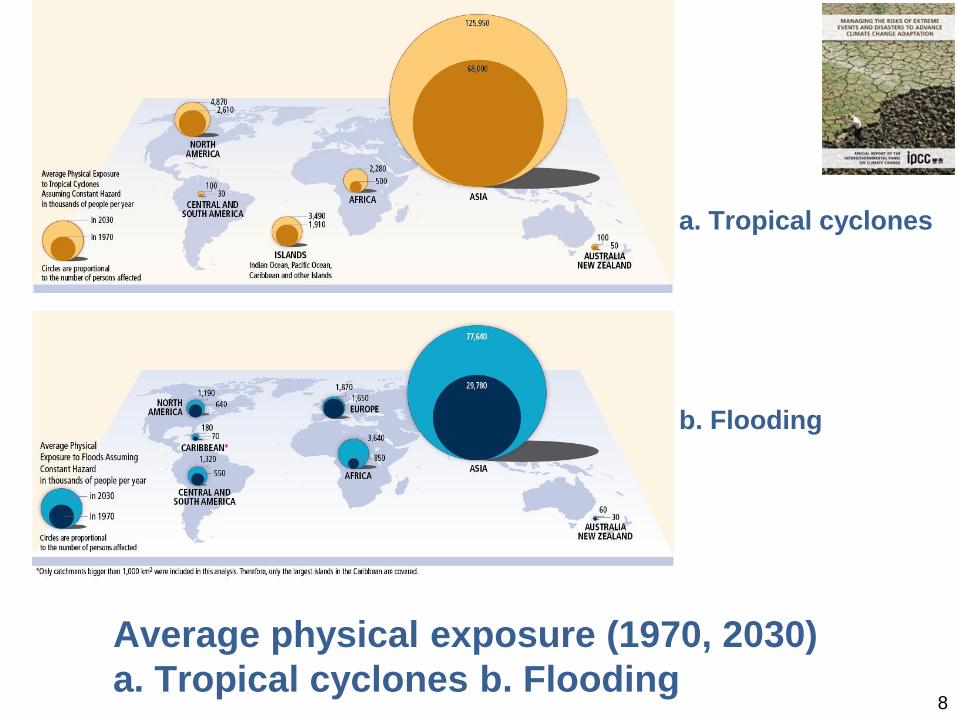
Average physical exposure (1970, 2030)
a. Tropical cyclones b. Flooding
a. Tropical cyclones
b. Flooding

World grain trade depends on exports from a
few countries
World Development Report 2010
Source: FAO 2009c.
Note: Annual exports and imports are based on the average over four years (2002–2006)
Caribbean annual food import $3.5b.
Annual exports and imports (2002-2006 average)

10
Prevalent Vulnerability Index: >>> property and wealth
• Exposure and Susceptibility
• Socio-economic Fragility
• Lack of Resilience

Linking Preparedness and adaptation • Information systems
• Infrastructure/technology
• Insurance
• Integrated systems
• Institutional capacity
IPCC SREX-the Solution Space
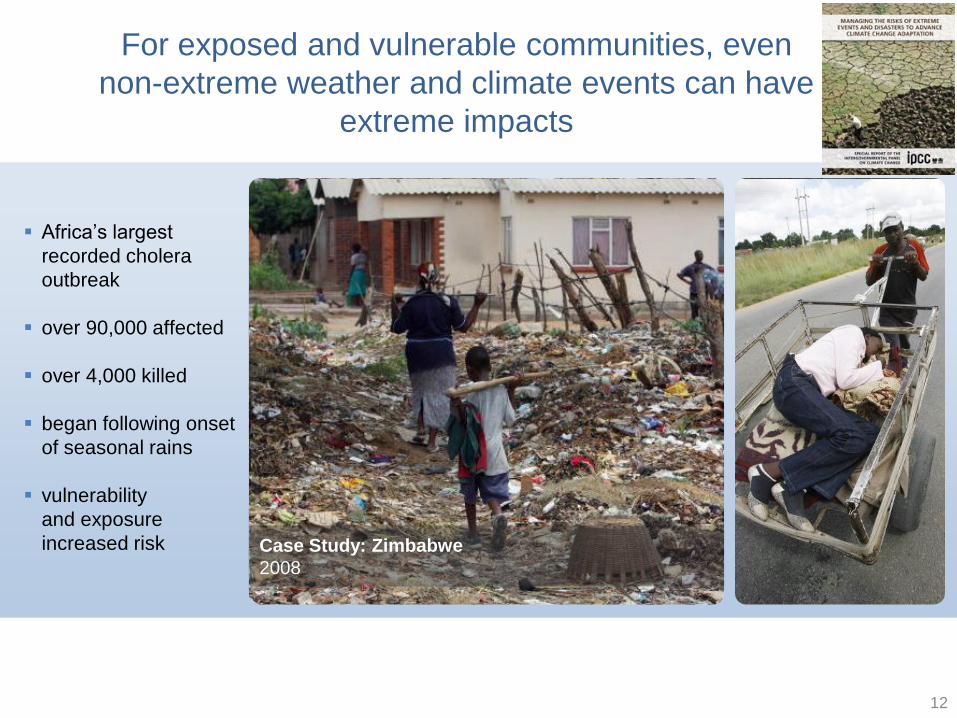
For exposed and vulnerable communities, even
non-extreme weather and climate events can have
extreme impacts
12
Looking for a good example here.
Africa’s largest
recorded cholera
outbreak
over 90,000 affected
over 4,000 killed
began following onset
of seasonal rains
vulnerability
and exposure
increased risk Case Study: Zimbabwe
2008

Managing the risks: heat waves in Europe
13
Risk Factors Risk Management/
Adaptation
lack of access to
cooling
age
pre-existing
health problems
poverty and
isolation
infrastructure
cooling in public
facilities
Early warning
systems
social care
networks
urban
green space
changes in urban
infrastructure
France, August 2003 (over 14,000 dead)
Projected: likely increase in heat wave frequency and very likely
increase in warm days and nights across Europe

Managing the risks: sea level rise in tropical
Small Island Developing States
14
Risk Factors
shore erosion
saltcoastal
intrusion
coastal
populations
tourism
economies
early
warning systems
maintenance of
drainage
regional
risk pooling
relocation
Projected globally: very likely contribution of sea level rise to extreme
coastal high coastal levels (such as storm surges)
Risk Management/
Adaptation
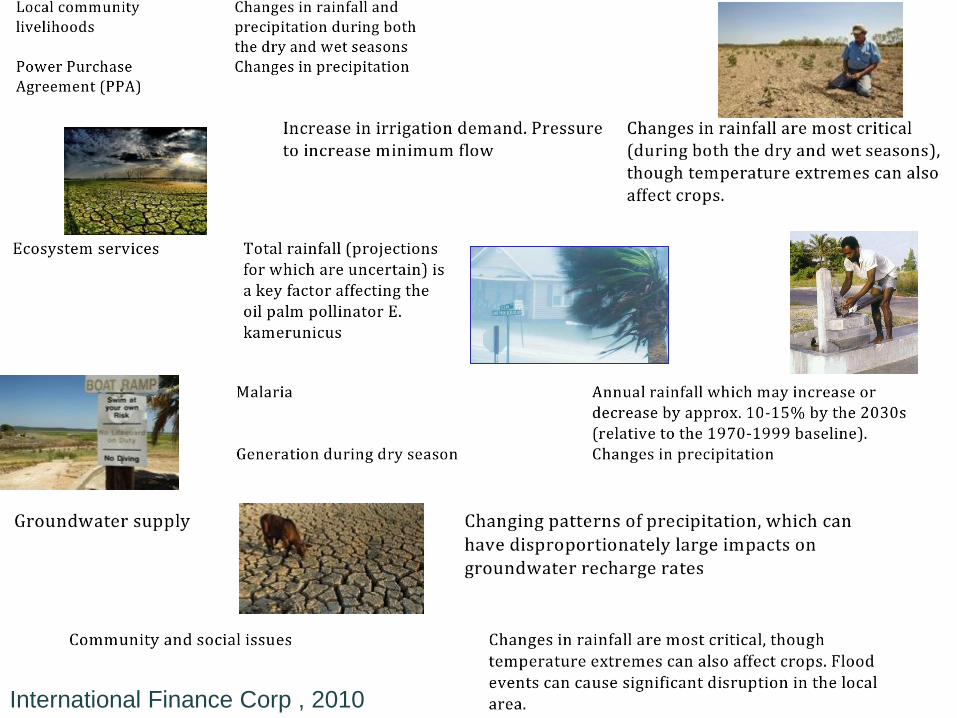
International Finance Corp , 2010

Marine Ecosystems
1 DAY 1
WEEK 1
MONTH 1
YEAR 1
DECADE 100
YEARS
Fronts, convective
systems PDO AMO
The Weather-climate continuum……..
…………..and Adaptation deficits
Ocean surface upper full
Atmosphere region global
Atmospheric chemistry Ice sheets
Land
Cyclones Blocking
1 SEASON
MJO NAO
ENSO QBO
16

Effective early
warning systems and
emergency
preparedness
Vulnerability reducing
measures such as pro-
poor economic and
human development,
through improved social
services and protection
Risk
Management
Resilience

Selected Driving Forces for Storyline Development
General Driving Force Category
Key Driving Forces Identified
Natural Systems (Hydroclimate)
Changes in streamflow variability and trends Changes in climate variability and trends (e.g. temperature,
precipitation, etc.)
Demographics & Land Use Changes in population and distribution Changes in agricultural land use (e.g. irrigated agricultural areas, crop
mixes, etc.)
Technology & Economics Changes in agricultural water use efficiency Changes in municipal and industrial water use efficiency Changes in water needs for energy generation (e.g. solar, oil shale,
thermal, nuclear, etc.)
Social & Governance Changes in institutional and regulatory conditions (e.g. laws, regulations, etc.)
Changes in flow-dependent ecosystem needs for ESA-listed species Changes in other flow-dependent ecosystem needs Changes in social values affecting water use Changes in water availability due to tribal water use and settlement
of tribal water rights claims
Sensitivity to ECVs-other variables?

For exposed and vulnerable communities, even non-
extreme weather and climate events can have extreme
impacts
19
Short-term actions do not always provide long term risk
reduction-can reduce or increase longer-term risks
Most estimates of disaster losses exclude
indirect losses – livelihoods, informal economies,
intangible losses including ecosystem services,
quality of life and cultural impacts
In some areas drying due to climate change will
be overlain on the periodic events/droughts those
areas have always experienced

• Ocean
– Global coverage
• Satellites
– Weather and Climate
• Atmospheric
– Global and domestic
• Capacity Building
– WMO/IOC JCOMM Capacity
Building Workshops
– SERVIR
– Global Climate Observing System (GCOS)
Observations and Monitoring: the current availability and quality of climate observations and impacts data to support adaptation are inadequate for large parts of the globe
Approach climate model output far
more critically than at present,
especially for impact assessment and
scenario development at the local
level-No substitute for monitoring and
understanding local climates
.

Domain GCOS Essential Climate Variables
Atmosphere (over land, sea and ice)
Surface:[1] Air temperature, Wind speed and direction, Water vapor, Pressure, Precipitation, Surface radiation budget. Upper-air:[2] Temperature, Wind speed and direction, Water vapor, Cloud properties, Earth radiation budget (including solar irradiance). Composition: Carbon dioxide, Methane, and other long-lived greenhouse gases[3], Ozone and Aerosol, supported by their precursors[4].
Ocean Surface:[5] Sea-surface temperature, Sea-surface salinity, Sea level, Sea state, Sea ice, Surface current, Ocean color, Carbon dioxide partial pressure, Ocean acidity, Phytoplankton. Sub-surface: Temperature, Salinity, Current, Nutrients, Carbon dioxide partial pressure, Ocean acidity, Oxygen, Tracers.
Terrestrial River discharge, Water use, Groundwater, Lakes, Snow cover, Glaciers and ice caps, Ice sheets, Permafrost, Albedo, Land cover (including vegetation type), Fraction of absorbed photosynthetically active radiation (FAPAR), Leaf area index (LAI), Above-ground biomass, Soil carbon, Fire disturbance, Soil moisture.
[1] Including measurements at standardized, but globally varying heights in close proximity to the surface. [2] Up to the stratopause.
[3] Including (N2O), (CFCs), (HCFCs), (HFCs), (SF6), and s (PFCs). [4] In particular (NO2), (SO2), (HCHO) and (CO). [5] Including
measurements within the surface mixed layer, usually within the upper 15m.

Historical Climatologies Indices Status reports Near real time
Data Special Analyses for CC Reviews data/
Publication Metadata analysis
Web accessible
statistics,
visualization
Relative status of information
STATIC……………………………DYNAMIC
Design
Safety factors
Energy
Site planning
Community health
and well being
Climate related standards
Siting designs
Hazards and health
Streamflow
National drought
planning
Resource
allocation
Agriculture
Hazards and
health
Monthly/
seasonal
Planning
International
Markets
Demand
Structural Management Operations Public information Planning
Zillman, Pulwarty others
Climate Information products

1. Acknowledge the cross-timescale nature of climate and of early warning information
Decadal prediction lies between initialized weather or seasonal forecasts, and
future climate change projections-not just “extremes” OR “trends”-
Globally
The total benefits of improved early warning systems could reach
between 4 and 36 billion USD per year. Benefit-cost ratios between 4
and 35 with co-benefits (World Bank, 2011)

2. Understand and communicate the economic and social value
of novel resource configurations, such as land-use, for resilience

3. Recognize “communication” as critical
but not sufficient
• Broad societal processes that create dynamic pressures and unsafe conditions are not easy to change, yet are
fundamental to human vulnerability
• More challenging is an understanding the socialization of
lessons learned by particular individuals and organizations
through their own, direct trial and error experiences
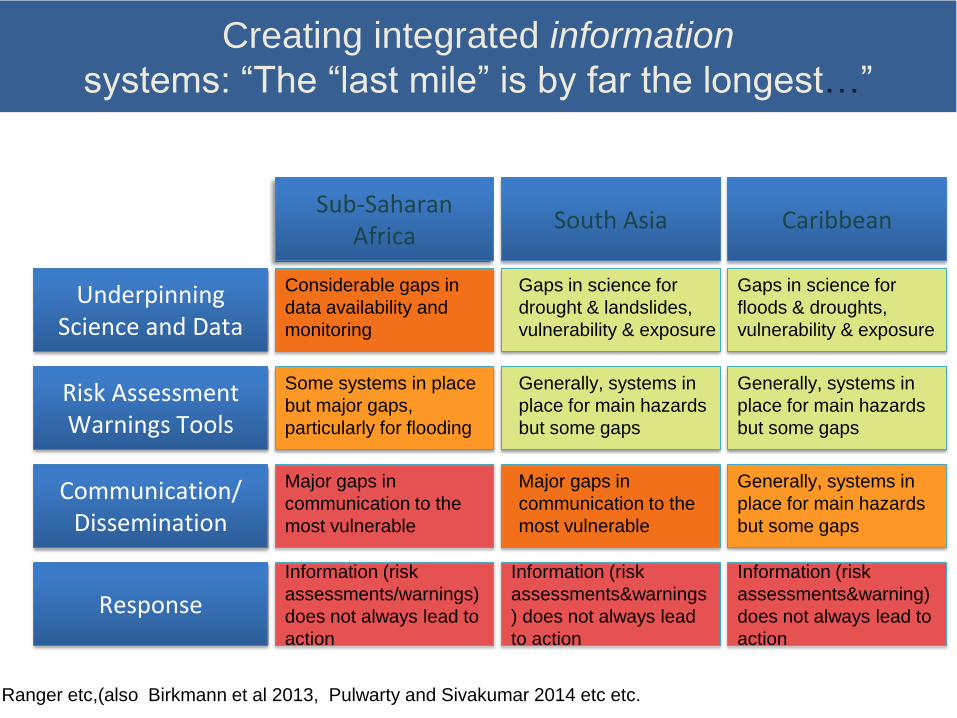
Creating integrated information
systems: “The “last mile” is by far the longest…”
Underpinning Science and Data
Risk Assessment Warnings Tools
Communication/ Dissemination
Response
Sub-Saharan Africa
South Asia Caribbean
Gaps in science for
drought & landslides,
vulnerability & exposure
Gaps in science for
floods & droughts,
vulnerability & exposure
Generally, systems in
place for main hazards
but some gaps
Generally, systems in
place for main hazards
but some gaps
Considerable gaps in
data availability and
monitoring
Some systems in place
but major gaps,
particularly for flooding
Generally, systems in
place for main hazards
but some gaps
Major gaps in
communication to the
most vulnerable
Major gaps in
communication to the
most vulnerable
Information (risk
assessments/warnings)
does not always lead to
action
Information (risk
assessments&warnings
) does not always lead
to action
Information (risk
assessments&warning)
does not always lead to
action
Ranger et al 2013,14) Ranger etc,(also Birkmann et al 2013, Pulwarty and Sivakumar 2014 etc etc.
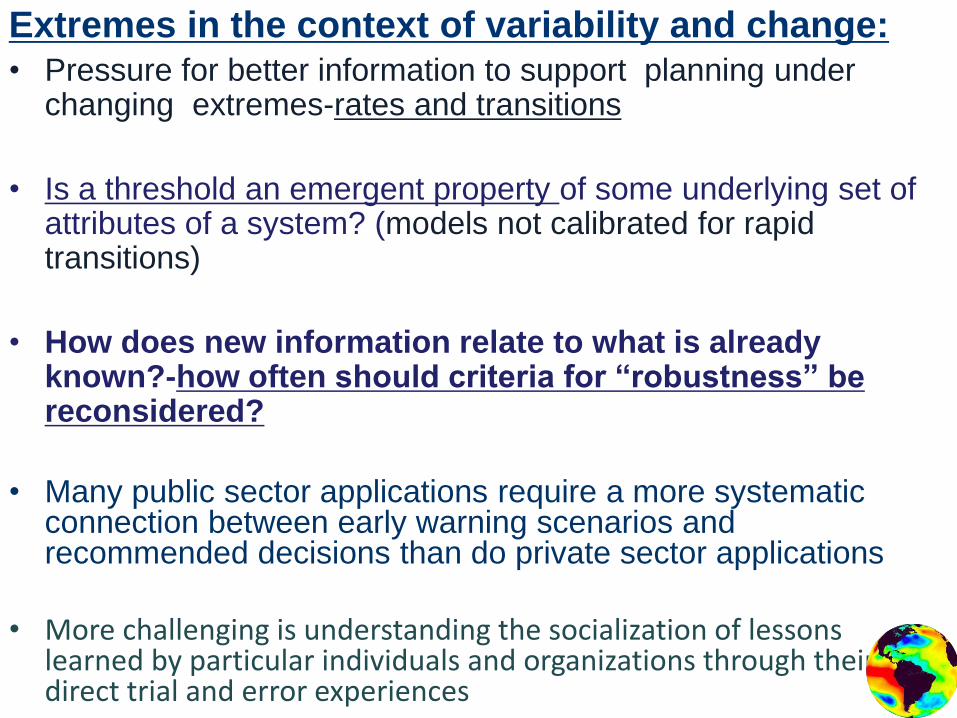
Extremes in the context of variability and change: • Pressure for better information to support planning under
changing extremes-rates and transitions
• Is a threshold an emergent property of some underlying set of attributes of a system? (models not calibrated for rapid transitions)
• How does new information relate to what is already known?-how often should criteria for “robustness” be reconsidered?
• Many public sector applications require a more systematic connection between early warning scenarios and recommended decisions than do private sector applications
• More challenging is understanding the socialization of lessons learned by particular individuals and organizations through their own, direct trial and error experiences

28

How often should criteria for
“robustness” be (re)considered?
Focus on capacity and improving decisions-
not just information use
Innovation Evaluation
Learning
Monitoring

Hyogo Framework: Priorities for Action
IPCC SREX, 2012 Chapter 9

What the SREX did not do
• Mitigation and avoided risk
• Detailed sector by sector impacts
• Interaction between disaster risk and
shared socioeconomic pathways
• Developed applications of alternative risk
management approaches

32
Question: The current availability and quality of climate
observations and impacts data appear to be inadequate to
support adaptation (from extremes, variability and change) for
large parts of the globe. What actions and work are needed to
show and/or increase the value of existing observations for
impacts assessments and warnings, and adaptation? Where are
and how do we address the gaps?
Challenge: Sustain observations, research and management
networks with at-risk, development and private sector
communities that integrate probabilistic risk management based
on past events and trends, with resilience strategies based on
scenarios of rates of change, potential surprise and cumulative
risks across climate timescales.

Addressing all levels of observational requirements
to meet sectors needs
All levels of observational needs to support
services and adaptations
http://www.wmo.int/gfcs
Thanks!

The relationship between public and private
monitoring and research is not linear
• More than the simple costless transfer of basic knowledge from publicly-funded institutions to profit-oriented firms
• Ability to access and interact with federal sector research activity is an important determinant of the productivity of downstream state and private sector research
• Participating in this exchange can be an important determinant of private sector research productivity
• This works both ways

35

36
The DDI captures the relationship between the demand for contingent
resources to cover the losses caused by the Maximum Considered Event
(MCE) and the public sector’s economic resilience (i.e. the availability of
internal and external funds for restoring affected inventories). DDI is greater than 1.0 = economic incapacity of the country to cope with extreme disasters even
where indebtedness is carried to a maximum-greater the DDI, the greater the gap.

SREX Firsts
• First joint product of WGII and WGI
• First IPCC report with a focus on risk
management
• First SPM to focus on multi-chapter key
findings
• Novel figures and tables
• First IPCC report with a COI process
• First IPCC report with ambitious outreach
goals
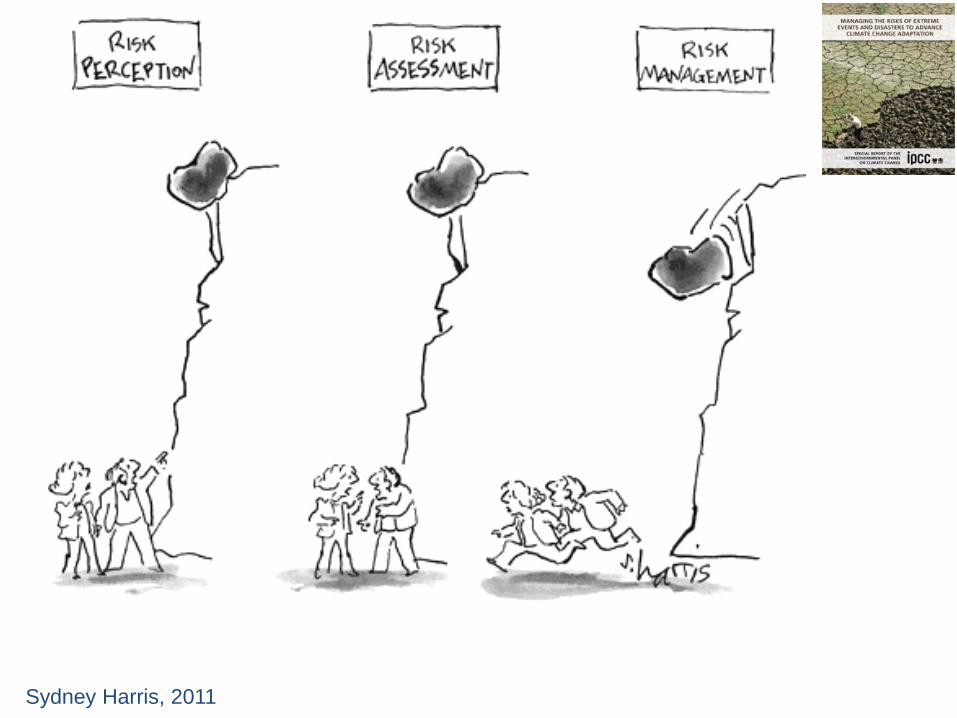
Sydney Harris, 2011

• Information systems for extremes and critical
thresholds across temporal and spatial scales:
Systems may change faster than the models can be recalibrated-Projections
may be most unreliable in precisely the situations where they are most desired
Approach climate model outputs far more critically than at present, especially
for impact assessment and scenario development to support adaptation at the
local level-confront models with data
Place multiple indicators within a statistically consistent triggering framework-
esp. cross-correlation among units before a critical threshold is reached
Scenario planning (based on past, present and projected events)- better
understand whether and how best to use probabilistic information with past
data, potential surprise and cumulative risks across climate timescales

4. Sustaining “services” Climate risk
management governance
Accountability- located with planning/fiscal oversight- political authority and policy coherence
across sectors. Emergency management organizations can rarely play that role
Efficiency- achieved in partnership with at-risk sectors and local communities and organizations
that represent them-
Partners do not
just share
information-they
also share
risks and
responsibilities