Embed Size (px)
Citation preview
Loughborough UniversityInstitutional Repository
Modelling the risks ofextreme weather events for
Australasian hospitalinfrastructure using rich
picture diagrams
This item was submitted to Loughborough University's Institutional Repositoryby the/an author.
Citation: LOOSEMORE, M., CHOW, V. and MCGEORGE, D., 2012. Mod-elling the risks of extreme weather events for Australasian hospital infrastruc-ture using rich picture diagrams. Construction Management and Economics, 30(12), pp.1071-1086.
Additional Information:
• This is a Submitted Manuscript of an article published by Taylor & Fran-cis in `Construction Management and Economics' on 05/10/2012, avail-able online: http://dx.doi.org/10.1080/01446193.2012.725941.
Metadata Record: https://dspace.lboro.ac.uk/2134/26736
Version: Submitted for publication
Publisher: c© Taylor & Francis
Rights: This work is made available according to the conditions of the Cre-ative Commons Attribution-NonCommercial-NoDerivatives 4.0 International(CC BY-NC-ND 4.0) licence. Full details of this licence are available at:https://creativecommons.org/licenses/by-nc-nd/4.0/
Please cite the published version.
MODELLING THE RISKS OF EXTREME WEATHER EVENTS TO HOSPITAL
INFRASTRUCTURE USING RICH PICTURE DIAGRAMS
Abstract
Climate change has been linked to an increase in the occurrence of extreme weather
events. This will expose hospital infrastructure to new risks which are poorly
understood. Traditional approaches to risk identification and analysis produce linear,
narrow and static risk profiles which fail to consider complex sub-system
interdependencies that may assist or hinder healthcare delivery during an extreme
weather event. The ability to create resilient hospitals depends on new risk
management methodologies which provide an understanding of these complex
relationships. To this end focus groups with key stakeholders in three major tertiary
hospitals in Australia, are used to construct Rich Picture Diagrams (RPDs) of
hospital infrastructure interdependencies under different extreme weather event
scenarios. They show that the risks posed to hospitals by extreme weather events
cannot be considered in isolation from the surrounding infrastructure, emergency
management systems, health systems and communities in which they are imbedded.
The new insights provided have major governance and policy implications for those
agencies who are responsible for ensuring hospital infrastructure can continue to
support the delivery of effective health services during extreme weather events.
Keywords: Extreme weather events, hospitals, risk, resilience, stakeholders, soft
systems.
INTRODUCTION
It is now widely accepted that over the next fifty years, we are likely to experience
more frequent extreme weather events which will test the resilience of national
critical infrastructure and services (SSEFR 2011: 5). The inability of healthcare to
respond to these new physical and health-related risks is clearly evident in the many
recorded instances of hospitals failing to support effective healthcare delivery during
such events. For example, in 2005, the Sydney heatwaves highlighted insufficient
surge capacity in hospitals to cope with increased demand and changed admission
profiles. In 2006, Tropical Cyclone Larry forced the closure of numerous hospitals in
Queensland (Queensland Government 2006) and in 2007, floods in New South
Wales cut-off hospital power supplies and access to surrounding roads for almost
two days (Hunter New England NSW Health 2007). More recently, in 2011, the
evacuation of both Cairns Base and Cairns Private Hospitals in the face of Cyclone
Yasi is a further graphic example of the inability of hospital facilities to cope with the
risks posed by extreme weather events (Miles 2011).
While many aspects of healthcare delivery are being researched in the context of
climate change (McCaughrin et al. 2003; Bonnett et al. 2007; Lalonde 2007),
research into healthcare infrastructure has been relatively neglected. This is an
important deficiency which needs to be addressed as acknowledged by the
Australian Science Engineering and Innovation Council (PMSEIC 2007) and by the
Council of Australian Governments which recommended that Australian
governments should give priority to developing climate change adaptation strategies
for Australia’s health infrastructure (COAG 2007). To address this challenge, the aim
of this paper is to explore the risk exposure of Australiasian hospitals to extreme
weather events. More specifically, it will do this in the context of the complex system
interdependencies which exist in the healthcare sector which have hitherto been
ignored.
UNDERSTANDING HOSPITALS AS COMPLEX SYSTEMS
In understanding the risk exposure of hospitals to extreme weather events, it is
important to point to Becker and Carthey’s (2007) description of the healthcare
systems as a “tangled web of interdependencies”. Becker and Carthey make the
point that the many problems experienced in healthcare systems around the world
are systemic, rather than being caused by any single factor. This means that there is
rarely a simple and single solution to any challenge faced. Furthermore, if one is to
understand how the health system works in response to an extreme weather event,
one must understand the interdependent sub systems that need to interact to enable
a hospital to respond effectively. This in turn requires not only an appreciation of
specific hospital infrastructures but also an appreciation of the interaction between a
hospital system, its users and the wider socio-political and emergency management
environment in which it is imbedded. A hospital is a complex organisation with many
diverse internal and external stakeholders and functions which combine to deliver
appropriate health services to a community. Responses to extreme weather events
are similarly complex and involve the interplay of many economic, social,
organisational, political and cultural considerations.
Although it is widely acknowledged that health infrastructure systems are complex,
we have a poor understanding of the interdependencies between critical health
infrastructure subsystems and of the “cascading uncertainties” which they can
produce (Arboleda et al 2009, PCI 2011). For example, power outages caused by a
heatwave can affect heating and cooling systems, waste treatment, sterilisation, and
telecommunications, making treatment of patients impossible precisely at the time
when admissions are likely to increase. These interdependencies are likely to
increase as hospital technologies become more complex through the use of smart
grids, virtual power plants, decentralised power production, the integration of
fluctuating renewables and the break-up of previously vertically integrated electricity
utility companies (Heite et al 2011). Unfortunately, as Koubatis and Schonberger
(2005) point out, traditional approaches to risk identification and analysis are unable
to help us understand these types of complex and dynamic interdependencies.
These approaches and the tools and techniques which underpin them were
developed for simple linear systems in relatively stable environments which in turn
means that current hospital policies and response strategies to such events are also
likely to be linear in nature.
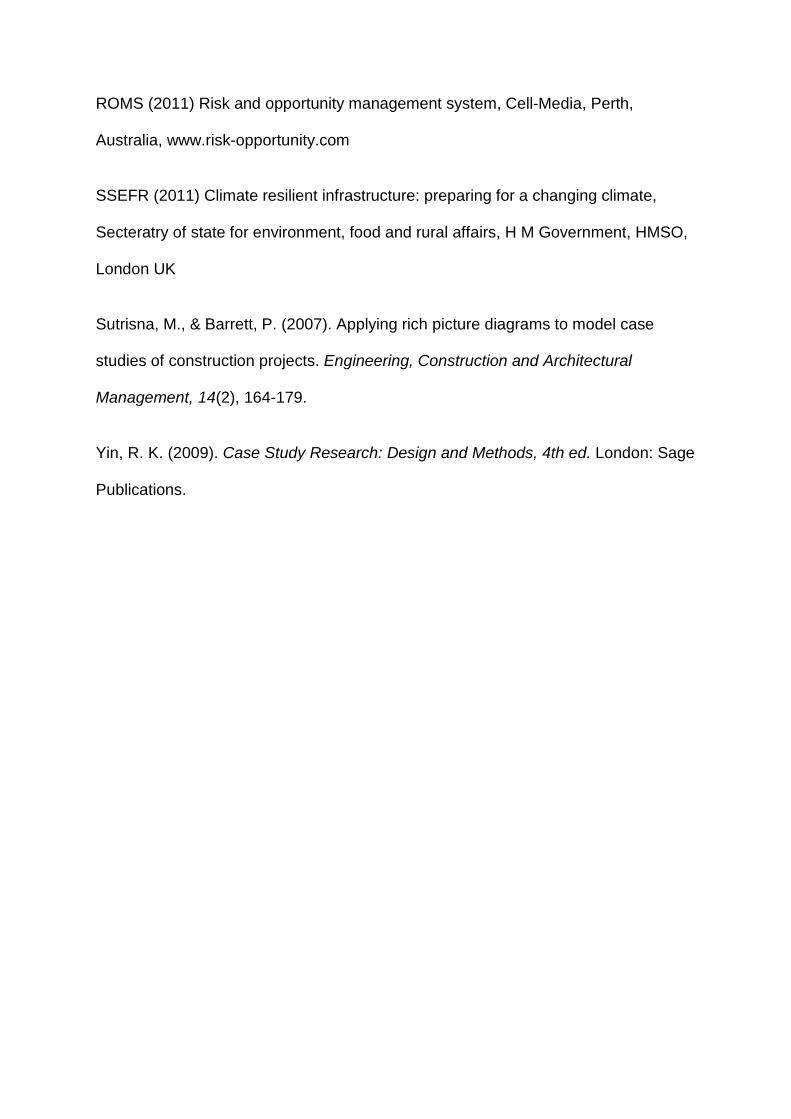
A useful starting point in understanding these interdependencies is Markus et al’s
(1972:1) systems-based conceptual model which encapsulates the interrelationships
between built infrastructure and the wider systems in which it exists (see Figure 1).
Despite being over four decades old, the basic construct of the Markus’s model
holds good today since it views a building facility and its stakeholders as an ‘adaptive
system’ which comprises five key elements (sub-systems): the building system; the
environmental system; the activity system; the objectives system and the resources
system. These systems are in a dynamic relationship and are not conceived as silos
but as discrete but interactive components.
INSERT FIGURE 1 HERE
Figure 1 Markus’s conceptual building sub-systems model (Source: Markus 1971: 1)
In Markus’s model The Building System comprises three interdependent sub-
systems: Construction (the external envelope; the structure; the division of internal
spaces i.e. the building fabric); Services (mechanical and electrical services
providing air conditioning; lighting and power) and Contents (furniture and fittings – in
a hospital context this would include surgical equipment; beds; diagnostic equipment
etc.). The Environmental System refers to the internal building environment created
by the Building System which comprises two sub-systems: Spatial (the layout of the
facilities; the relationship of one space to another) and; Physical (the air quality;
internal air temperatures; infection control etc). The Activity System represents what
happens within the facility and comprises several “organisational” subsystems which
control the way people interact and work together to enable the Objective System to
function, which in a hospital context involves the continuity of health care delivery to
the community during an extreme weather event. Finally, the Resources System
represents the external “environmental” from which the other sub systems draw to
enable them to function effectively. This includes the supply of physical, financial and
human resources.
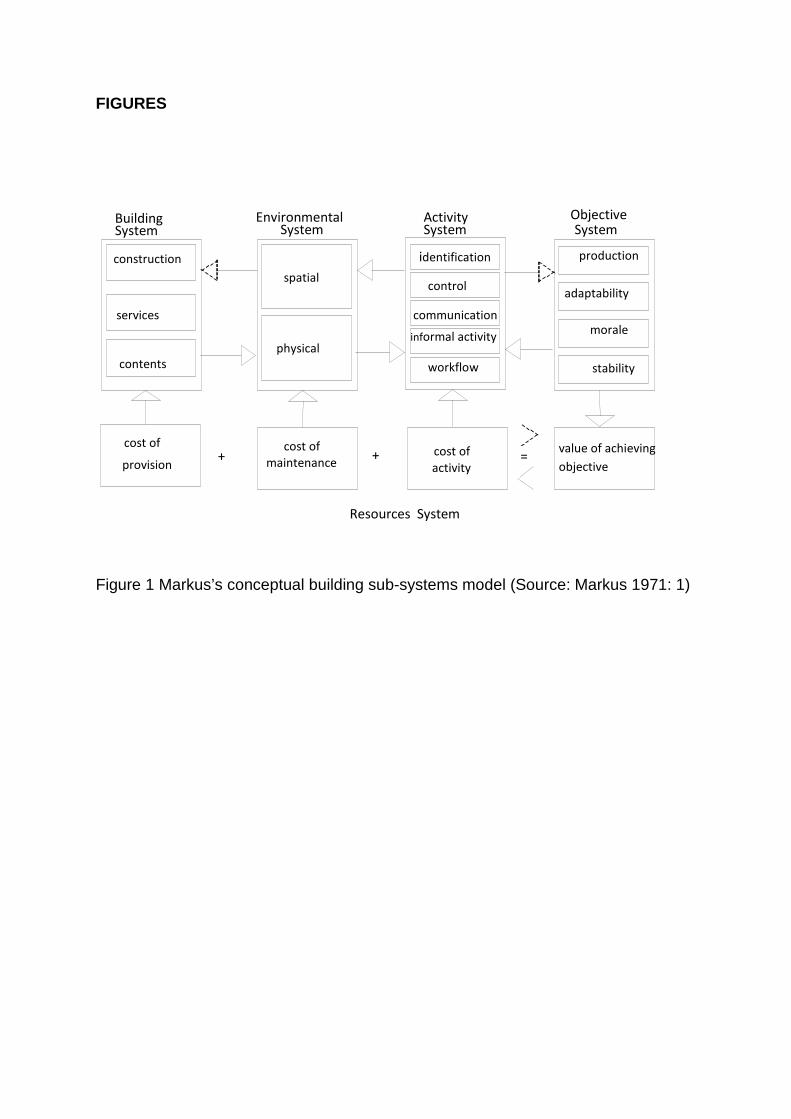
Using Markus’ model, Figure 2 shows how an extreme weather event might impact
on the environmental; activity; objectives and resource systems of a hospital. In this
example, which reflects a number of examples which have occurred in reality, a
heatwave causes an electricity supply outage because of excess demand on the
national electricity supply system. This in turn causes the hospital to use emergency
generators which in turn restricts power supplies internally to essential services such
as life-support systems, which in turn causes the cancellation of elective surgery and
reduced admissions, which in turn affects the continuity of health care delivery into
the community.
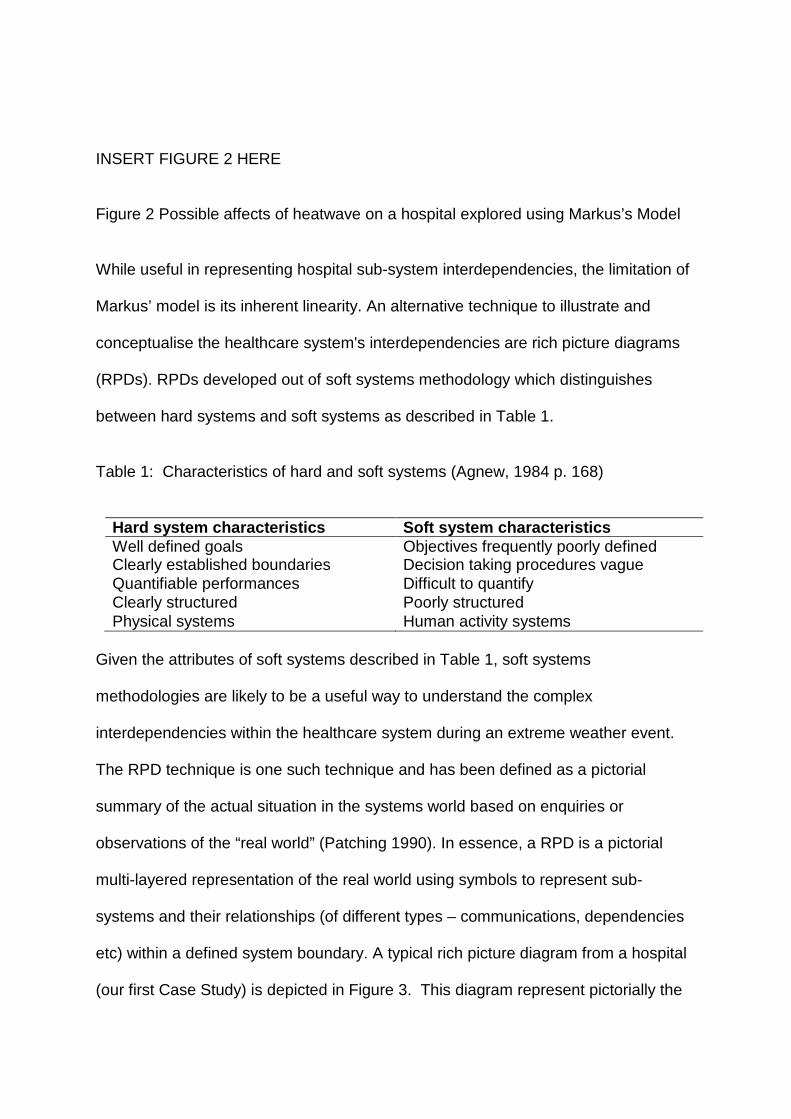
INSERT FIGURE 2 HERE
Figure 2 Possible affects of heatwave on a hospital explored using Markus’s Model
While useful in representing hospital sub-system interdependencies, the limitation of
Markus’ model is its inherent linearity. An alternative technique to illustrate and
conceptualise the healthcare system's interdependencies are rich picture diagrams
(RPDs). RPDs developed out of soft systems methodology which distinguishes
between hard systems and soft systems as described in Table 1.
Table 1: Characteristics of hard and soft systems (Agnew, 1984 p. 168)
Hard system characteristics Soft system characteristics Well defined goals Objectives frequently poorly defined Clearly established boundaries Decision taking procedures vague Quantifiable performances Difficult to quantify Clearly structured Poorly structured Physical systems Human activity systems
Given the attributes of soft systems described in Table 1, soft systems
methodologies are likely to be a useful way to understand the complex
interdependencies within the healthcare system during an extreme weather event.
The RPD technique is one such technique and has been defined as a pictorial
summary of the actual situation in the systems world based on enquiries or
observations of the “real world” (Patching 1990). In essence, a RPD is a pictorial
multi-layered representation of the real world using symbols to represent sub-
systems and their relationships (of different types – communications, dependencies
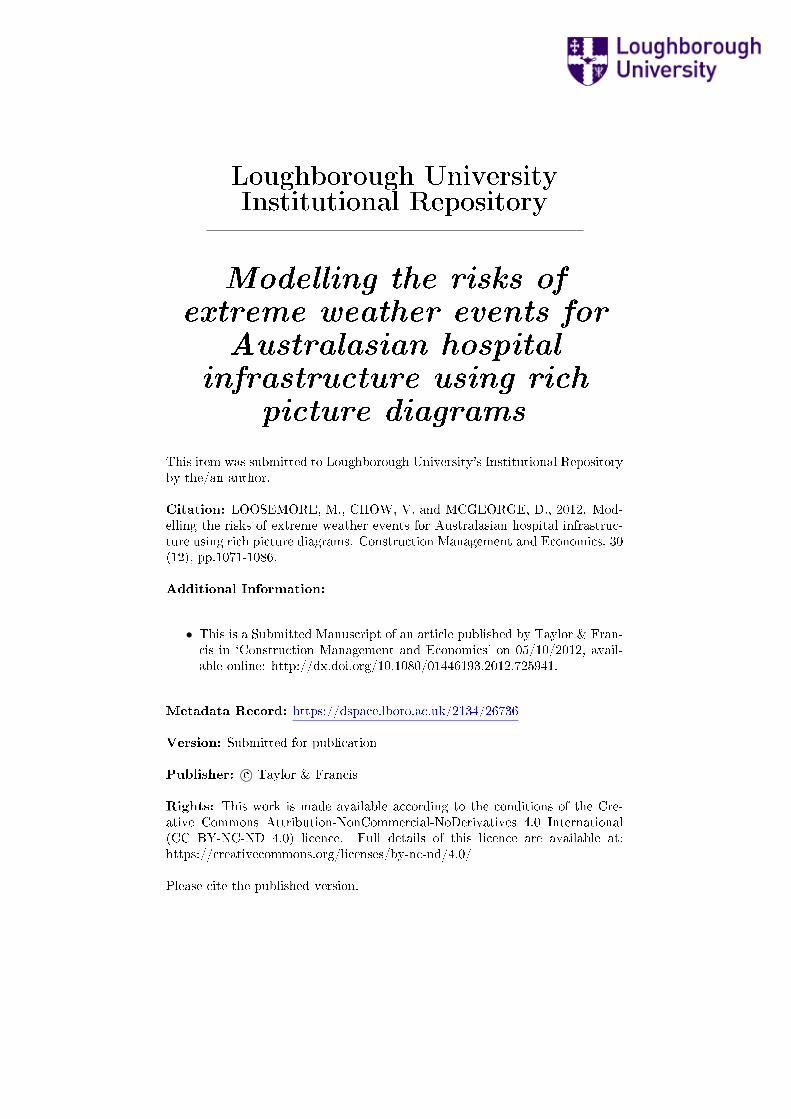
etc) within a defined system boundary. A typical rich picture diagram from a hospital
(our first Case Study) is depicted in Figure 3. This diagram represent pictorially the
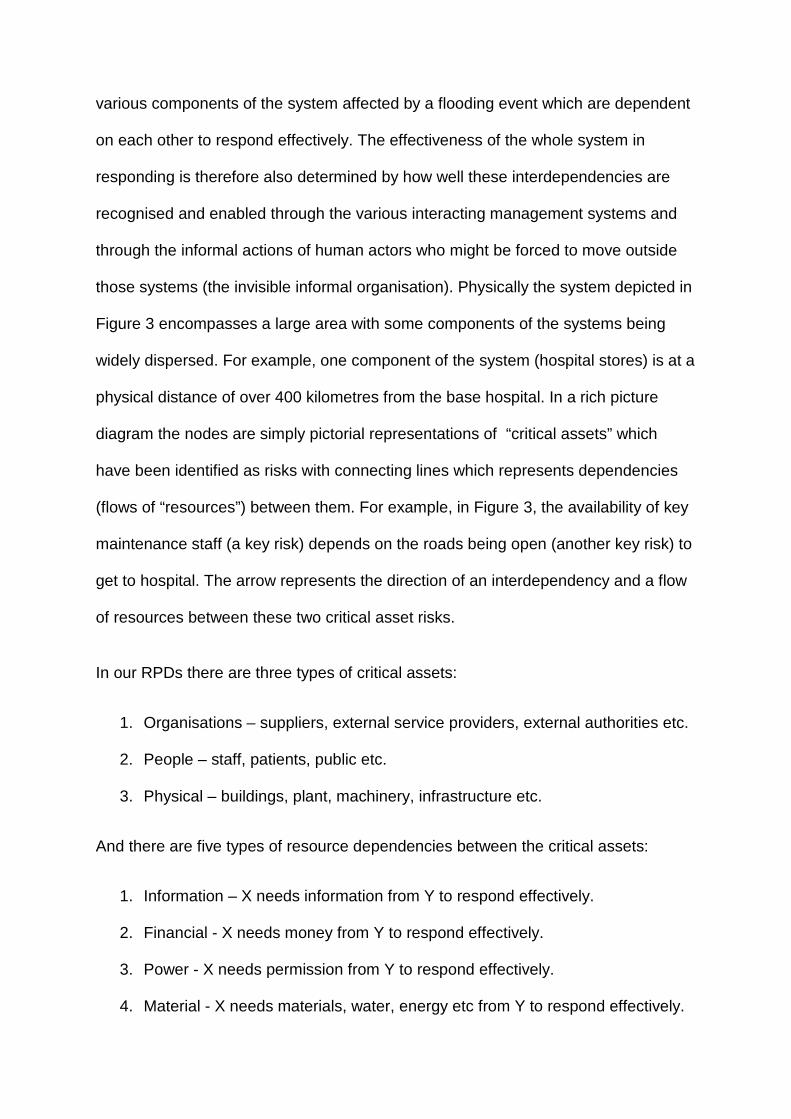
various components of the system affected by a flooding event which are dependent
on each other to respond effectively. The effectiveness of the whole system in
responding is therefore also determined by how well these interdependencies are
recognised and enabled through the various interacting management systems and
through the informal actions of human actors who might be forced to move outside
those systems (the invisible informal organisation). Physically the system depicted in
Figure 3 encompasses a large area with some components of the systems being
widely dispersed. For example, one component of the system (hospital stores) is at a
physical distance of over 400 kilometres from the base hospital. In a rich picture
diagram the nodes are simply pictorial representations of “critical assets” which
have been identified as risks with connecting lines which represents dependencies
(flows of “resources”) between them. For example, in Figure 3, the availability of key
maintenance staff (a key risk) depends on the roads being open (another key risk) to
get to hospital. The arrow represents the direction of an interdependency and a flow
of resources between these two critical asset risks.
In our RPDs there are three types of critical assets:
1. Organisations – suppliers, external service providers, external authorities etc.
2. People – staff, patients, public etc.
3. Physical – buildings, plant, machinery, infrastructure etc.
And there are five types of resource dependencies between the critical assets:
1. Information – X needs information from Y to respond effectively.
2. Financial - X needs money from Y to respond effectively.
3. Power - X needs permission from Y to respond effectively.
4. Material - X needs materials, water, energy etc from Y to respond effectively.
5. Human - X needs staff, people, emotional support etc from Y to respond
effectively.
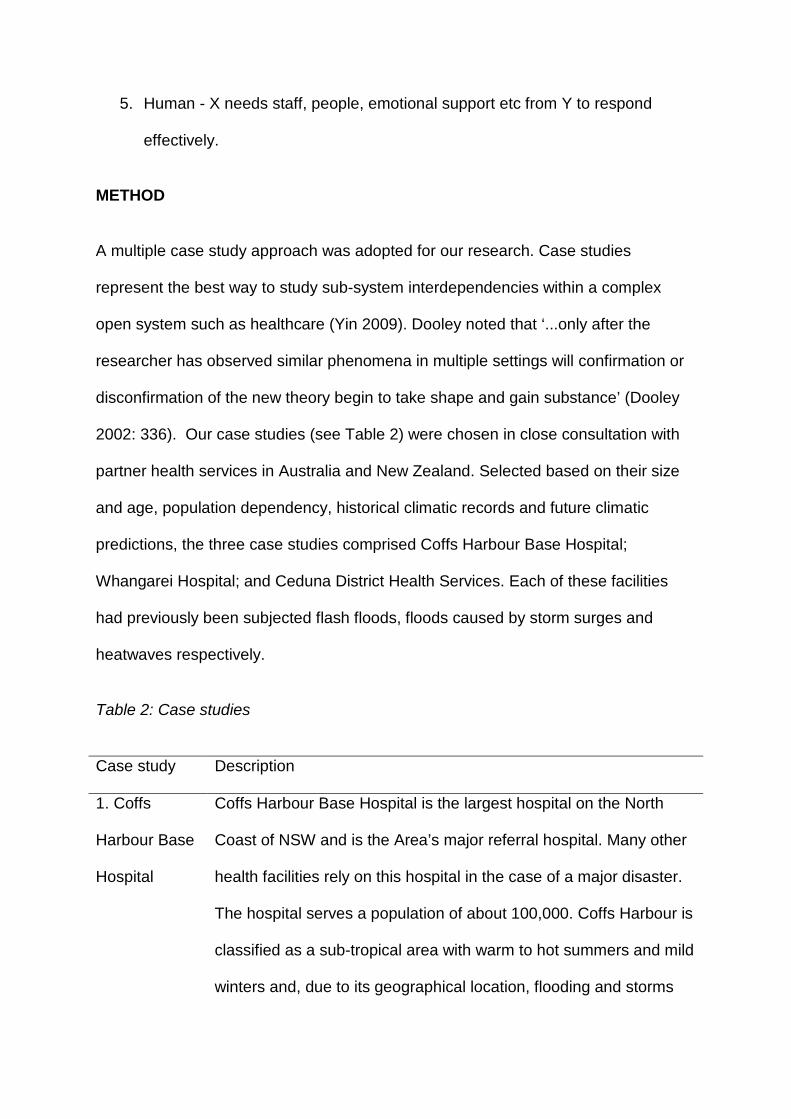
METHOD
A multiple case study approach was adopted for our research. Case studies
represent the best way to study sub-system interdependencies within a complex
open system such as healthcare (Yin 2009). Dooley noted that ‘...only after the
researcher has observed similar phenomena in multiple settings will confirmation or
disconfirmation of the new theory begin to take shape and gain substance’ (Dooley
2002: 336). Our case studies (see Table 2) were chosen in close consultation with
partner health services in Australia and New Zealand. Selected based on their size
and age, population dependency, historical climatic records and future climatic
predictions, the three case studies comprised Coffs Harbour Base Hospital;
Whangarei Hospital; and Ceduna District Health Services. Each of these facilities
had previously been subjected flash floods, floods caused by storm surges and
heatwaves respectively.
Table 2: Case studies
Case study Description
1. Coffs
Harbour Base
Hospital
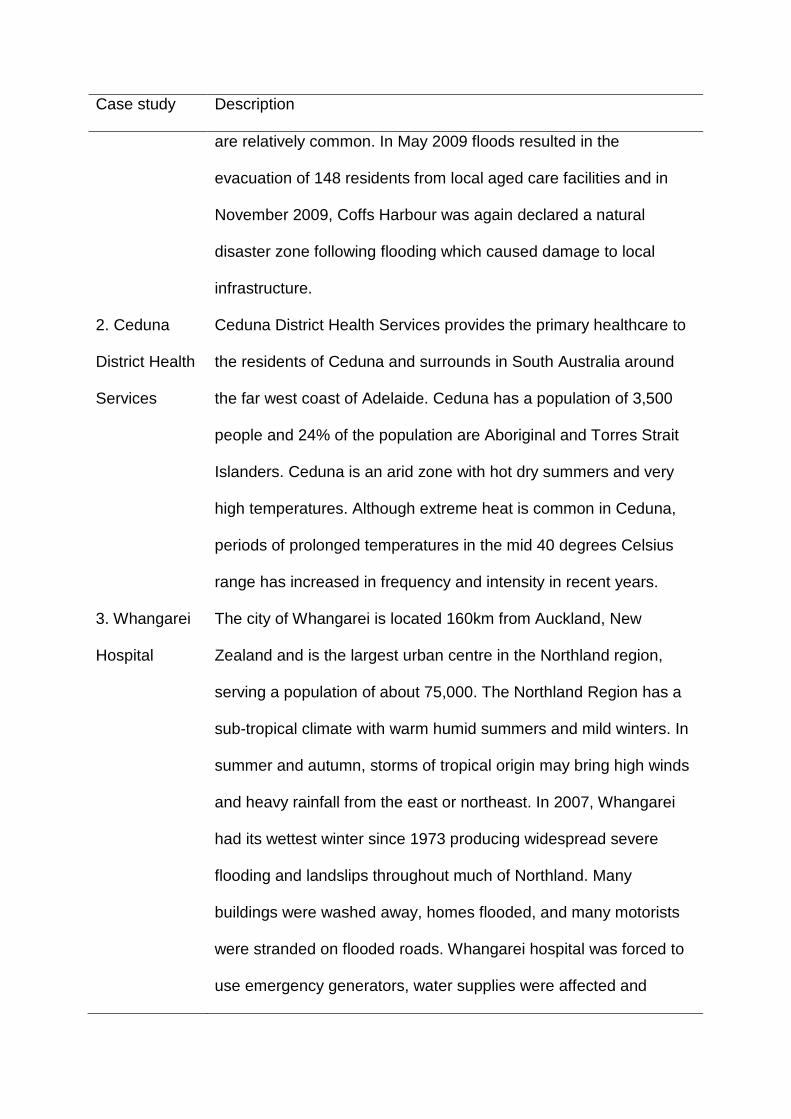
Coffs Harbour Base Hospital is the largest hospital on the North
Coast of NSW and is the Area’s major referral hospital. Many other
health facilities rely on this hospital in the case of a major disaster.
The hospital serves a population of about 100,000. Coffs Harbour is
classified as a sub-tropical area with warm to hot summers and mild
winters and, due to its geographical location, flooding and storms
Case study Description
are relatively common. In May 2009 floods resulted in the
evacuation of 148 residents from local aged care facilities and in
November 2009, Coffs Harbour was again declared a natural
disaster zone following flooding which caused damage to local
infrastructure.
2. Ceduna
District Health
Services
Ceduna District Health Services provides the primary healthcare to
the residents of Ceduna and surrounds in South Australia around
the far west coast of Adelaide. Ceduna has a population of 3,500
people and 24% of the population are Aboriginal and Torres Strait
Islanders. Ceduna is an arid zone with hot dry summers and very
high temperatures. Although extreme heat is common in Ceduna,
periods of prolonged temperatures in the mid 40 degrees Celsius
range has increased in frequency and intensity in recent years.
3. Whangarei
Hospital
The city of Whangarei is located 160km from Auckland, New
Zealand and is the largest urban centre in the Northland region,
serving a population of about 75,000. The Northland Region has a
sub-tropical climate with warm humid summers and mild winters. In
summer and autumn, storms of tropical origin may bring high winds
and heavy rainfall from the east or northeast. In 2007, Whangarei
had its wettest winter since 1973 producing widespread severe
flooding and landslips throughout much of Northland. Many
buildings were washed away, homes flooded, and many motorists
were stranded on flooded roads. Whangarei hospital was forced to
use emergency generators, water supplies were affected and
Case study Description
thousands of residents were left without phones and electricity.
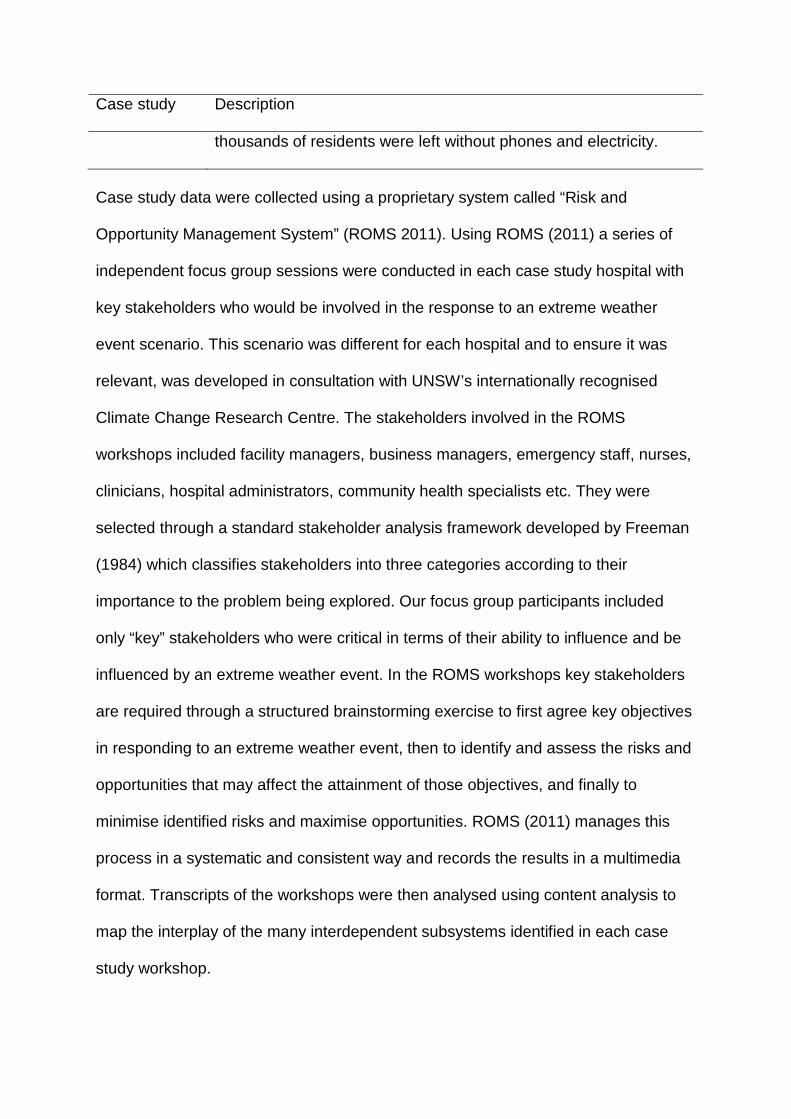
Case study data were collected using a proprietary system called “Risk and
Opportunity Management System” (ROMS 2011). Using ROMS (2011) a series of
independent focus group sessions were conducted in each case study hospital with
key stakeholders who would be involved in the response to an extreme weather
event scenario. This scenario was different for each hospital and to ensure it was
relevant, was developed in consultation with UNSW’s internationally recognised
Climate Change Research Centre. The stakeholders involved in the ROMS
workshops included facility managers, business managers, emergency staff, nurses,
clinicians, hospital administrators, community health specialists etc. They were
selected through a standard stakeholder analysis framework developed by Freeman
(1984) which classifies stakeholders into three categories according to their
importance to the problem being explored. Our focus group participants included
only “key” stakeholders who were critical in terms of their ability to influence and be
influenced by an extreme weather event. In the ROMS workshops key stakeholders
are required through a structured brainstorming exercise to first agree key objectives
in responding to an extreme weather event, then to identify and assess the risks and
opportunities that may affect the attainment of those objectives, and finally to
minimise identified risks and maximise opportunities. ROMS (2011) manages this
process in a systematic and consistent way and records the results in a multimedia
format. Transcripts of the workshops were then analysed using content analysis to
map the interplay of the many interdependent subsystems identified in each case
study workshop.
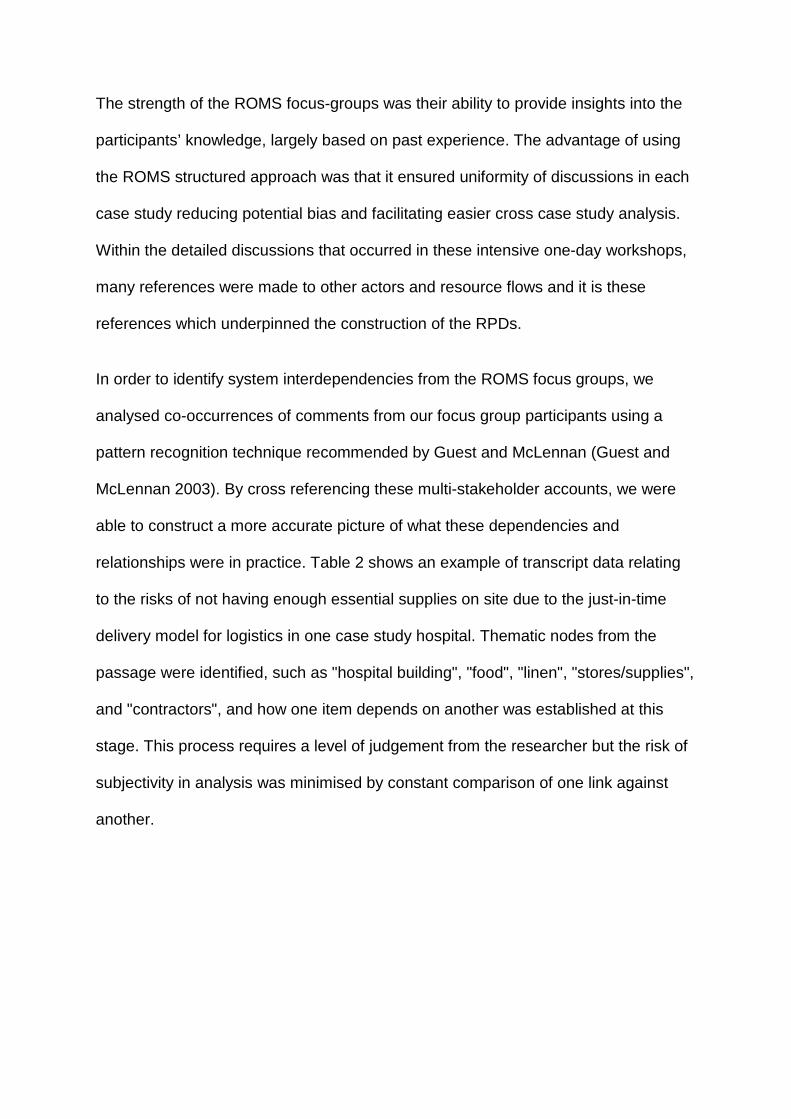
The strength of the ROMS focus-groups was their ability to provide insights into the
participants’ knowledge, largely based on past experience. The advantage of using
the ROMS structured approach was that it ensured uniformity of discussions in each
case study reducing potential bias and facilitating easier cross case study analysis.
Within the detailed discussions that occurred in these intensive one-day workshops,
many references were made to other actors and resource flows and it is these
references which underpinned the construction of the RPDs.
In order to identify system interdependencies from the ROMS focus groups, we
analysed co-occurrences of comments from our focus group participants using a
pattern recognition technique recommended by Guest and McLennan (Guest and
McLennan 2003). By cross referencing these multi-stakeholder accounts, we were
able to construct a more accurate picture of what these dependencies and
relationships were in practice. Table 2 shows an example of transcript data relating
to the risks of not having enough essential supplies on site due to the just-in-time
delivery model for logistics in one case study hospital. Thematic nodes from the
passage were identified, such as "hospital building", "food", "linen", "stores/supplies",
and "contractors", and how one item depends on another was established at this
stage. This process requires a level of judgement from the researcher but the risk of
subjectivity in analysis was minimised by constant comparison of one link against
another.
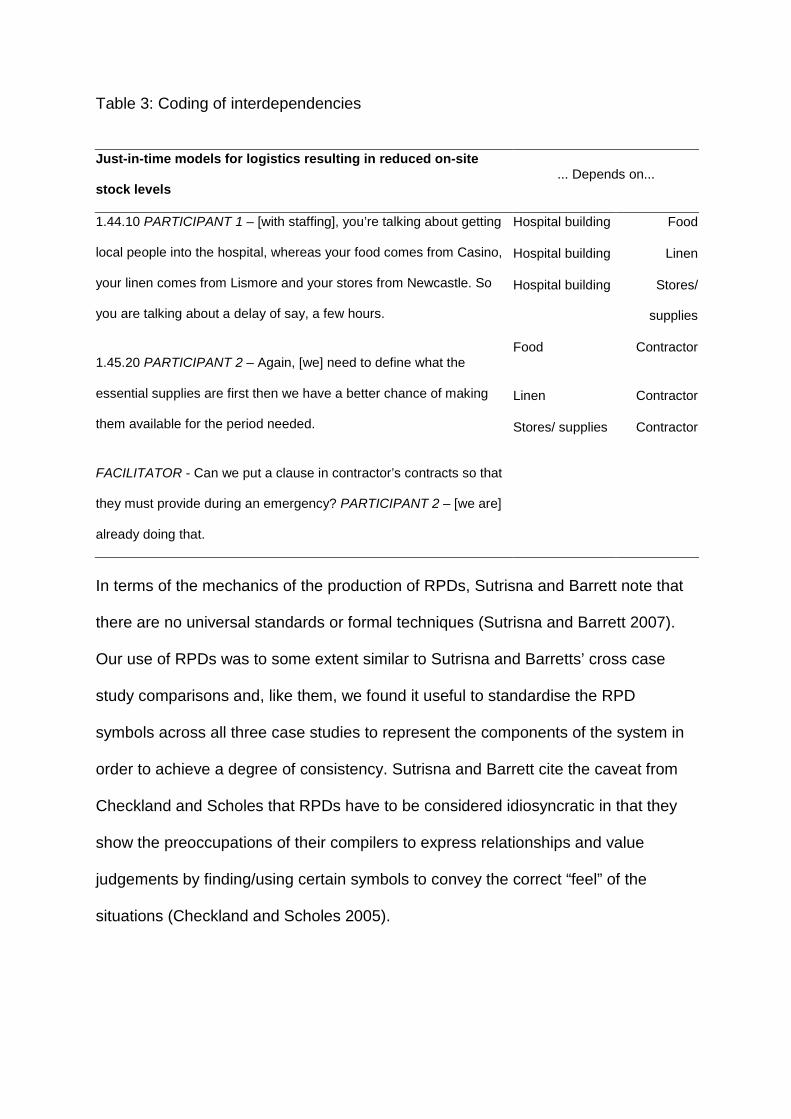
Table 3: Coding of interdependencies
Just-in-time models for logistics resulting in reduced on-site
stock levels ... Depends on...
1.44.10 PARTICIPANT 1 – [with staffing], you’re talking about getting
local people into the hospital, whereas your food comes from Casino,
your linen comes from Lismore and your stores from Newcastle. So
you are talking about a delay of say, a few hours.
1.45.20 PARTICIPANT 2 – Again, [we] need to define what the
essential supplies are first then we have a better chance of making
them available for the period needed.
FACILITATOR - Can we put a clause in contractor’s contracts so that
they must provide during an emergency? PARTICIPANT 2 – [we are]
already doing that.
Hospital building Food
Hospital building Linen
Hospital building Stores/
supplies
Food Contractor
Linen Contractor
Stores/ supplies Contractor
In terms of the mechanics of the production of RPDs, Sutrisna and Barrett note that
there are no universal standards or formal techniques (Sutrisna and Barrett 2007).
Our use of RPDs was to some extent similar to Sutrisna and Barretts’ cross case
study comparisons and, like them, we found it useful to standardise the RPD
symbols across all three case studies to represent the components of the system in
order to achieve a degree of consistency. Sutrisna and Barrett cite the caveat from
Checkland and Scholes that RPDs have to be considered idiosyncratic in that they
show the preoccupations of their compilers to express relationships and value
judgements by finding/using certain symbols to convey the correct “feel” of the
situations (Checkland and Scholes 2005).
RESULTS
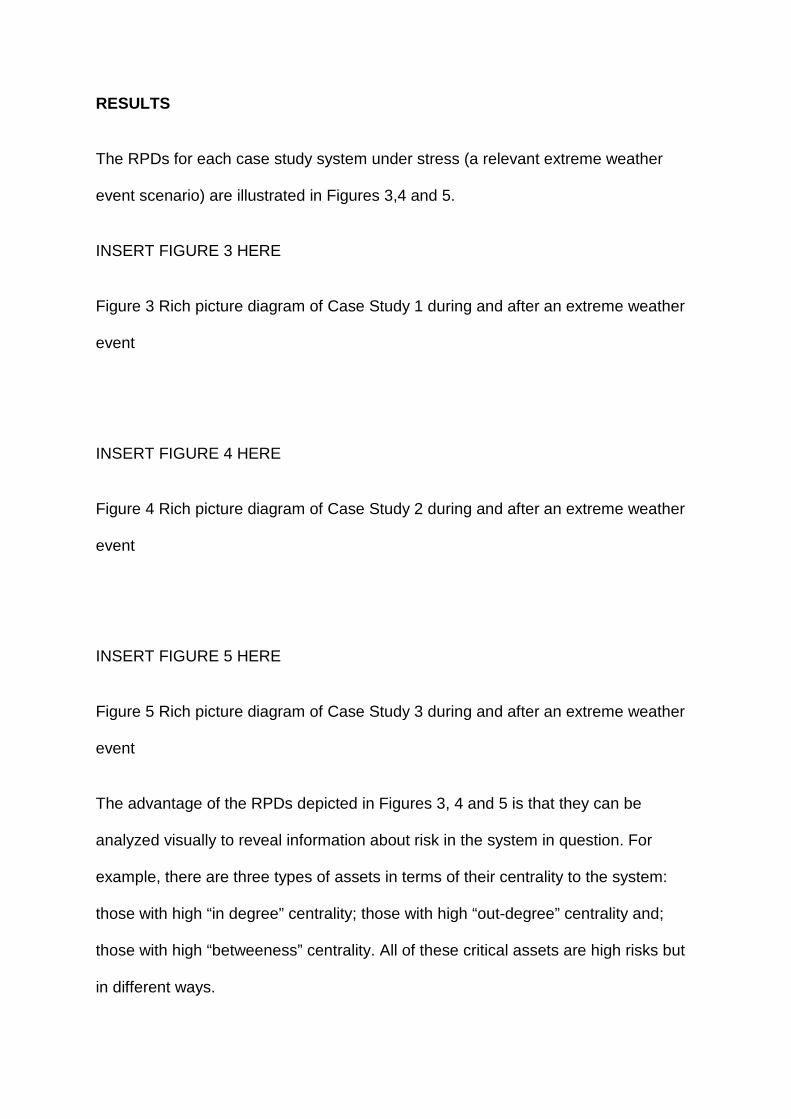
The RPDs for each case study system under stress (a relevant extreme weather
event scenario) are illustrated in Figures 3,4 and 5.
INSERT FIGURE 3 HERE
Figure 3 Rich picture diagram of Case Study 1 during and after an extreme weather
event
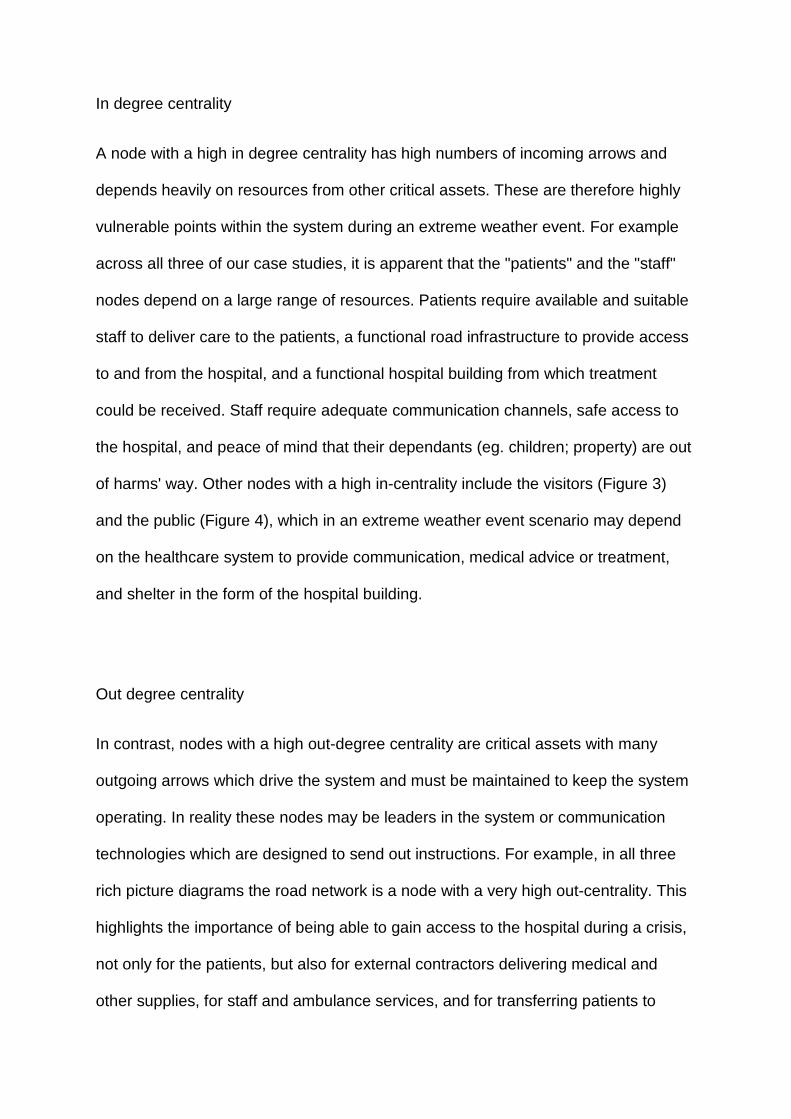
INSERT FIGURE 4 HERE
Figure 4 Rich picture diagram of Case Study 2 during and after an extreme weather
event
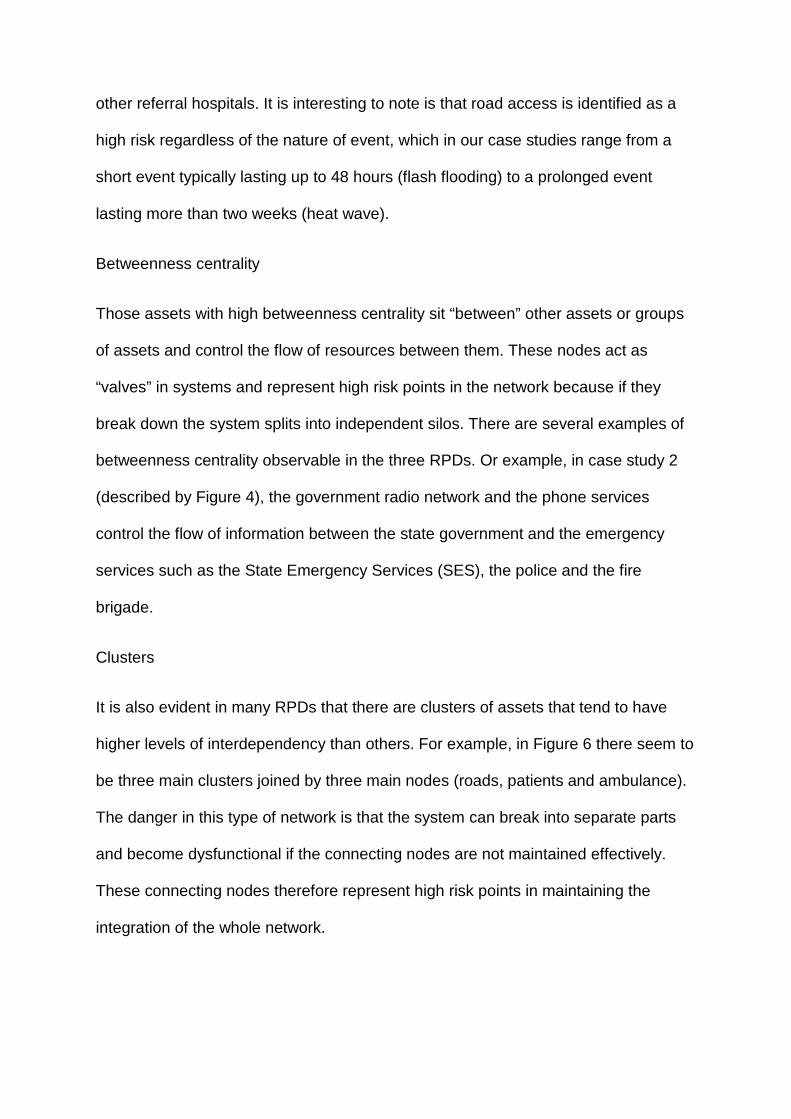
INSERT FIGURE 5 HERE
Figure 5 Rich picture diagram of Case Study 3 during and after an extreme weather
event
The advantage of the RPDs depicted in Figures 3, 4 and 5 is that they can be
analyzed visually to reveal information about risk in the system in question. For
example, there are three types of assets in terms of their centrality to the system:
those with high “in degree” centrality; those with high “out-degree” centrality and;
those with high “betweeness” centrality. All of these critical assets are high risks but
in different ways.
In degree centrality
A node with a high in degree centrality has high numbers of incoming arrows and
depends heavily on resources from other critical assets. These are therefore highly
vulnerable points within the system during an extreme weather event. For example
across all three of our case studies, it is apparent that the "patients" and the "staff"
nodes depend on a large range of resources. Patients require available and suitable
staff to deliver care to the patients, a functional road infrastructure to provide access
to and from the hospital, and a functional hospital building from which treatment
could be received. Staff require adequate communication channels, safe access to
the hospital, and peace of mind that their dependants (eg. children; property) are out
of harms' way. Other nodes with a high in-centrality include the visitors (Figure 3)
and the public (Figure 4), which in an extreme weather event scenario may depend
on the healthcare system to provide communication, medical advice or treatment,
and shelter in the form of the hospital building.
Out degree centrality
In contrast, nodes with a high out-degree centrality are critical assets with many
outgoing arrows which drive the system and must be maintained to keep the system
operating. In reality these nodes may be leaders in the system or communication
technologies which are designed to send out instructions. For example, in all three
rich picture diagrams the road network is a node with a very high out-centrality. This
highlights the importance of being able to gain access to the hospital during a crisis,
not only for the patients, but also for external contractors delivering medical and
other supplies, for staff and ambulance services, and for transferring patients to
other referral hospitals. It is interesting to note is that road access is identified as a
high risk regardless of the nature of event, which in our case studies range from a
short event typically lasting up to 48 hours (flash flooding) to a prolonged event
lasting more than two weeks (heat wave).
Betweenness centrality
Those assets with high betweenness centrality sit “between” other assets or groups
of assets and control the flow of resources between them. These nodes act as
“valves” in systems and represent high risk points in the network because if they
break down the system splits into independent silos. There are several examples of
betweenness centrality observable in the three RPDs. Or example, in case study 2
(described by Figure 4), the government radio network and the phone services
control the flow of information between the state government and the emergency
services such as the State Emergency Services (SES), the police and the fire
brigade.
Clusters
It is also evident in many RPDs that there are clusters of assets that tend to have
higher levels of interdependency than others. For example, in Figure 6 there seem to
be three main clusters joined by three main nodes (roads, patients and ambulance).
The danger in this type of network is that the system can break into separate parts
and become dysfunctional if the connecting nodes are not maintained effectively.
These connecting nodes therefore represent high risk points in maintaining the
integration of the whole network.
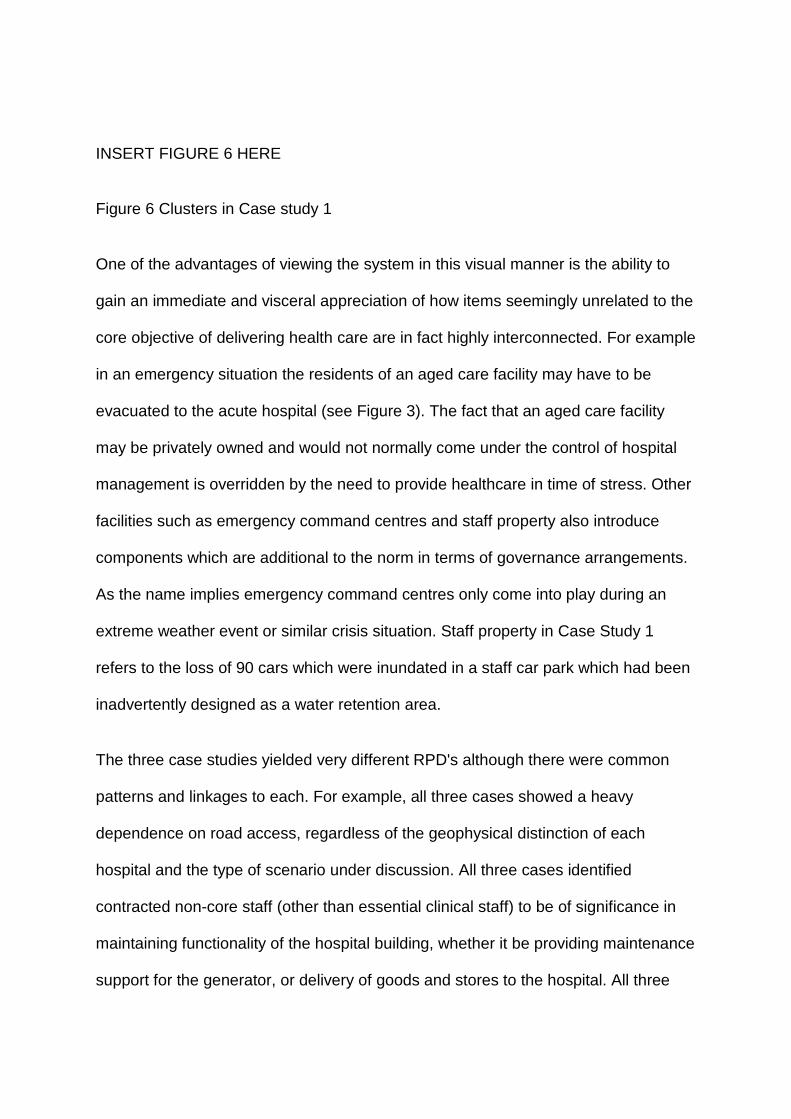
INSERT FIGURE 6 HERE
Figure 6 Clusters in Case study 1
One of the advantages of viewing the system in this visual manner is the ability to
gain an immediate and visceral appreciation of how items seemingly unrelated to the
core objective of delivering health care are in fact highly interconnected. For example
in an emergency situation the residents of an aged care facility may have to be
evacuated to the acute hospital (see Figure 3). The fact that an aged care facility
may be privately owned and would not normally come under the control of hospital
management is overridden by the need to provide healthcare in time of stress. Other
facilities such as emergency command centres and staff property also introduce
components which are additional to the norm in terms of governance arrangements.
As the name implies emergency command centres only come into play during an
extreme weather event or similar crisis situation. Staff property in Case Study 1
refers to the loss of 90 cars which were inundated in a staff car park which had been
inadvertently designed as a water retention area.
The three case studies yielded very different RPD's although there were common
patterns and linkages to each. For example, all three cases showed a heavy
dependence on road access, regardless of the geophysical distinction of each
hospital and the type of scenario under discussion. All three cases identified
contracted non-core staff (other than essential clinical staff) to be of significance in
maintaining functionality of the hospital building, whether it be providing maintenance
support for the generator, or delivery of goods and stores to the hospital. All three
cases also identified the important role of staff dependents and property, especially
the safety of the children of staff, on staff attendance at the hospital. By
understanding the key drivers that may assist or hinder how each of the objectives
are being met, any proposed strategy can be viewed with a clearer understanding as
to how it may affect the whole system, not just the item to which it is originally
targeted.
CONCLUSION
The aim of this paper was to explore the risk posed to hospitals by extreme weather
events by better understanding the complex system interdependencies within and
around them. The Rich Picture Diagrams demonstrate that buildings cannot be
treated in isolation from the wider systems in which they exist and that to understand
the impact of an external extreme weather event, they must be seen in this system
entirety. Our results show that in considering how to respond to extreme weather
events it is not enough to focus on the physical aspects of healthcare infrastructure
alone. At the same time, it is important to be mindful of the needs of the numerous
stakeholders who depend on these facilities and conversely, of the stakeholders on
which hospital infrastructure itself depends, to achieve its core objective of
supporting the delivery of healthcare to the community in a time of increased need.
It is clear from this research that an understanding of how to create and manage
resilient healthcare infrastructure depends, in part, on developing a conceptual
understanding of the complex relationships between the various components of a
healthcare system which includes emergency services and command centres; off-
campus hospital supplies; polyclinics; aged care facilities etc. We have shown how
the RPD approach can be a useful tool in providing an insight into these highly
complex and dynamic system relationships and as such brings a fresh perspective to
the design, construction and management of healthcare facilities particularly in terms
of the new challenges being imposed on both on buildings and people by extreme
weather events.
However, we finish with a warning. Although useful for representing
interdependencies, RPDs remain a static representation of the systems our
respondents discussed in our focus group sessions. There is no doubt that the
system adapts and changes over time in response to these events, sometimes
rapidly in response to a sudden crisis and sometimes slowly in response to a
creeping crisis. The ability to assess the behaviour of the system over time would
provide an even better understanding of the risks posed to healthcare systems by
these events.
ACKNOWLEDGEMENTS
The authors wish to acknowledge the contribution of our partners in this research:
Prof Andy Pitman, Co-director of the Climate Change Research Centre at UNSW;
Prof Tony McMichael and Dr Keith Dear, National Centre for Epidemiology and
Population Health at ANU; Mr Mark Meurisse of Palisade Asia-Pacific Pty Limited;
and our industry partners NSW Department of Health, Government of South
Australia Department of Health and New Zealand Ministry of Health.
REFERENCES
Agnew, C. T. (1984). Checkland's soft sytems approach - a methodology for
geographers? Area, 16(2), 167-174.
Arboleda, C. A., Abraham, D. M., Richard, J.-P. P., & Lubitz, R. (2009). Vulnerability
Assessment of Health Care Facilities during Disaster Events (). Journal of
infrastructure systems, 15(3), 149-161.
Becker, F., & Carthey, J. ( 2007). Evidence-Based Healthcare Facility Design: Key
Issues in a Collaborative Process Paper presented at the Interdisciplinarity in Built
Environment Procurement CIB W092, University of Newcastle.
Bonnett, C J, Peery, B N, Cantrill, S V, Pons, P T, Haukoos, J S, McVaney, K E and
Colwell, C B (2007) Surge capacity: a proposed conceptual framework. “The
American Journal of Emergency Medicine”, 25(3), 297-306.
Checkland, P B and Scholes, J (2005) “Soft Systems Methodology in Action”.
Chichester: Wiley.
COAG (2007) National Climate Change Adaptation Framework. Council of Australian
Governments, Canberra, Australia.
Dooley, L. M. (2002). Case Study Research and Theory Building. Advances in
Developing Human Resources, 4(3), 335-354.
Guest, G., & McLennan, E. (2003). Distinguishing the Trees from the Forest:
Applying Cluster Analysis to Thematic Qualitative Data. Field Methods, 15(2), 186-
201.
Hiete, M , Merz, M and Schultman F (2011) Scenario-based impact analysis of power outages on healthcare facilities in Germany, Disaster Resilience in the Built environment, 2 (3) 222-245
Hunter New England. ( 2007). Storm devastation brings out the best in us. NHE
Health Matters
Koubatis, A., & Schonberger, J. Y. (2005). Risk management of complex critical
systems. Int. J. Critical Infrastructures, 1(2/3), 195-215.
Lalonde, C (2007) Primary healthcare organizations facing a disaster: the Quebec
experience. “Disaster Prevention and Management”, 16(1), 42-55.
Markus, T A, Whyman, P, Morgan, J, Whitton, D, Maver, T, Canter, D and Fleming,
J. (1972) “Building Performance”. London: Applied Science Publishers Ltd.
McCaughrin, W. C. and Mattammal, M. (2003), ‘Perfect storm: Organizational
management of patient care under natural disaster conditions’, Journal of Healthcare
Management, 48 (5), pp 295-308.
Miles, J. (2011). Cairns hospital open again after Cyclone Yasi. Courier Mail.
Retrieved 19 April 2011 from
http://www.couriermail.com.au/news/queensland/cairns-hospital-open-again-after-
cyclone-yasi/story-e6freoof-1225999549260
Patching, D. (1990). Practical Soft Systems Analysis. London: Pitman Publishing.
PCI (2011) Barriers to effective climate change adaptation, Productivity commission issues
paper oct 2011, Prod commission, commonwealth gov of Australia
PMSEIC Independent Working Group (2007) “Climate Change in Australia: Regional
Impacts and Adaptation – Managing the Risk for Australia”. Canberra: Report
Prepared for the Prime Minister’s Science, Engineering and Innovation Council.
Queensland Government. (2006). Tropical Cyclone Larry Report Retrieved 29
August, 2006, from http://www.disaster.qld.gov.au/news/view.asp?id=1274
ROMS (2011) Risk and opportunity management system, Cell-Media, Perth,
Australia, www.risk-opportunity.com
SSEFR (2011) Climate resilient infrastructure: preparing for a changing climate,
Secteratry of state for environment, food and rural affairs, H M Government, HMSO,
London UK
Sutrisna, M., & Barrett, P. (2007). Applying rich picture diagrams to model case
studies of construction projects. Engineering, Construction and Architectural
Management, 14(2), 164-179.
Yin, R. K. (2009). Case Study Research: Design and Methods, 4th ed. London: Sage
Publications.
FIGURES
Figure 1 Markus’s conceptual building sub-systems model (Source: Markus 1971: 1)
construction
services
contents
spatial
physical
identification
control
communication
production
adaptability
morale
stability
cost of
provision cost of
maintenance cost of activity
value of achieving objective
Building System
Environmental System
Activity System
+ + =
Resources System
Objective
System
informal activity
workflow
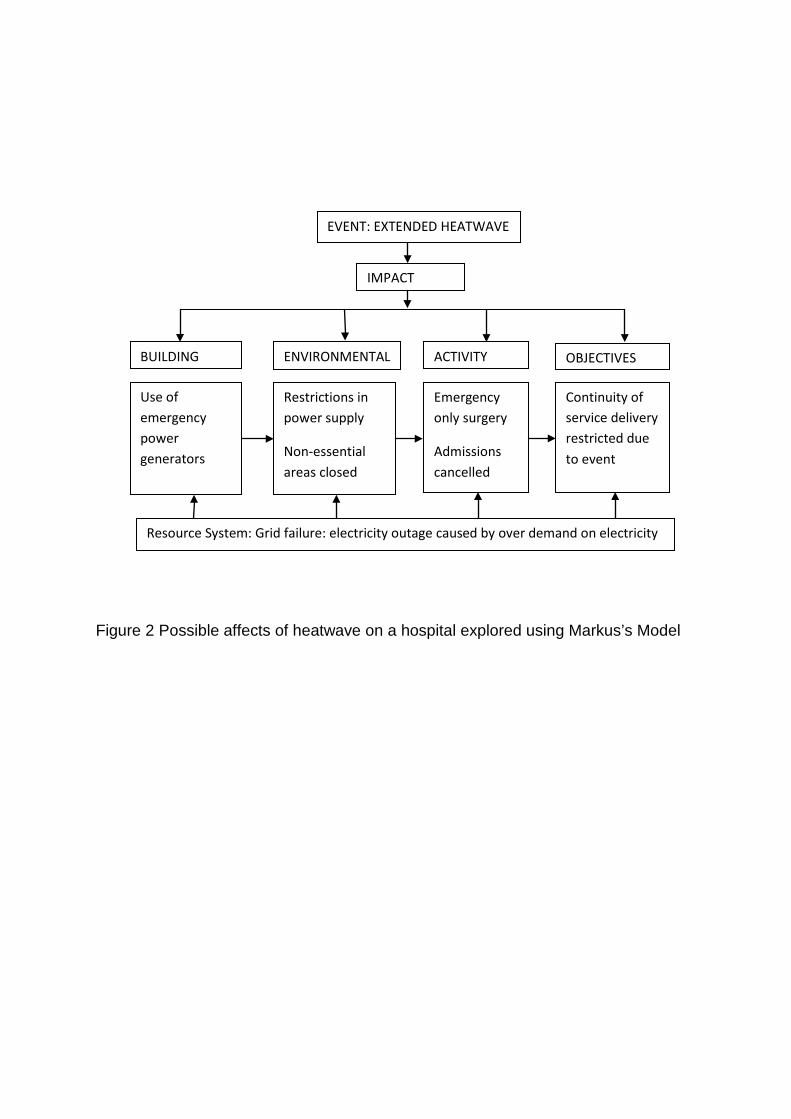
Figure 2 Possible affects of heatwave on a hospital explored using Markus’s Model
IMPACT
BUILDING ENVIRONMENTAL
ACTIVITY OBJECTIVES
Use of emergency power generators
Restrictions in power supply
Non-essential areas closed
Emergency only surgery
Admissions cancelled
Continuity of service delivery restricted due to event
Resource System: Grid failure: electricity outage caused by over demand on electricity
EVENT: EXTENDED HEATWAVE
Figure 3 Rich picture diagram of Case Study 1 during and after an extreme weather
event
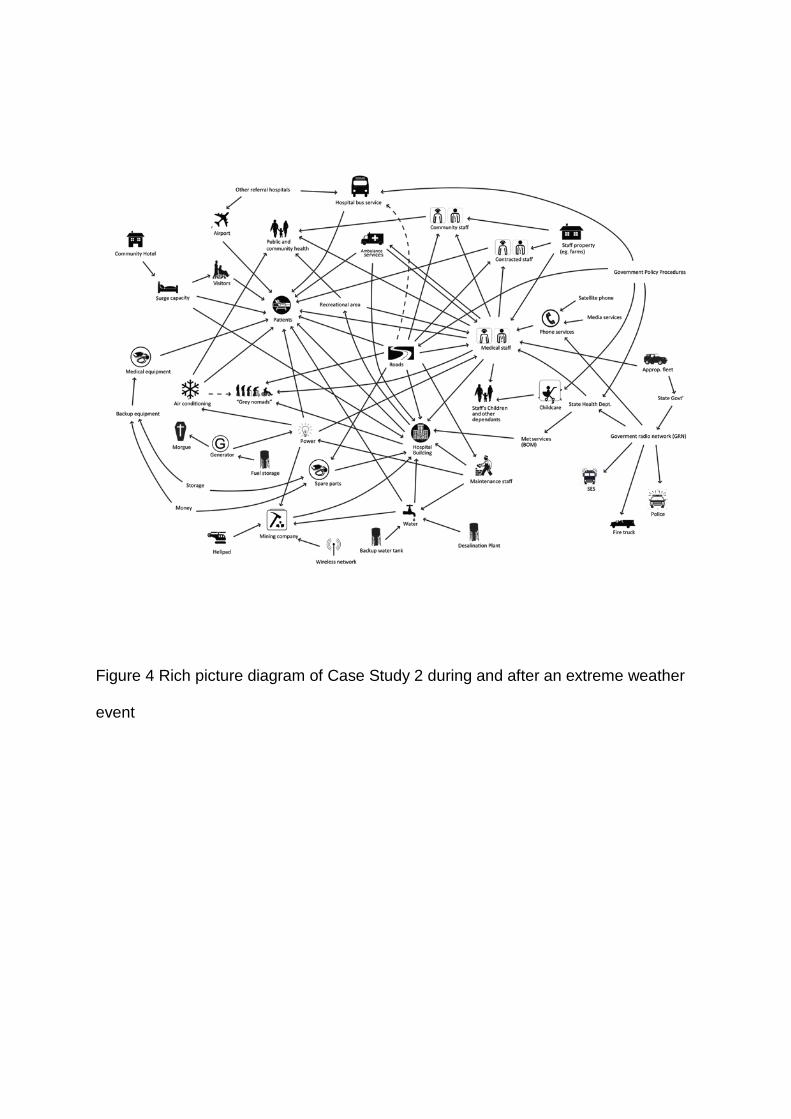
Figure 4 Rich picture diagram of Case Study 2 during and after an extreme weather
event
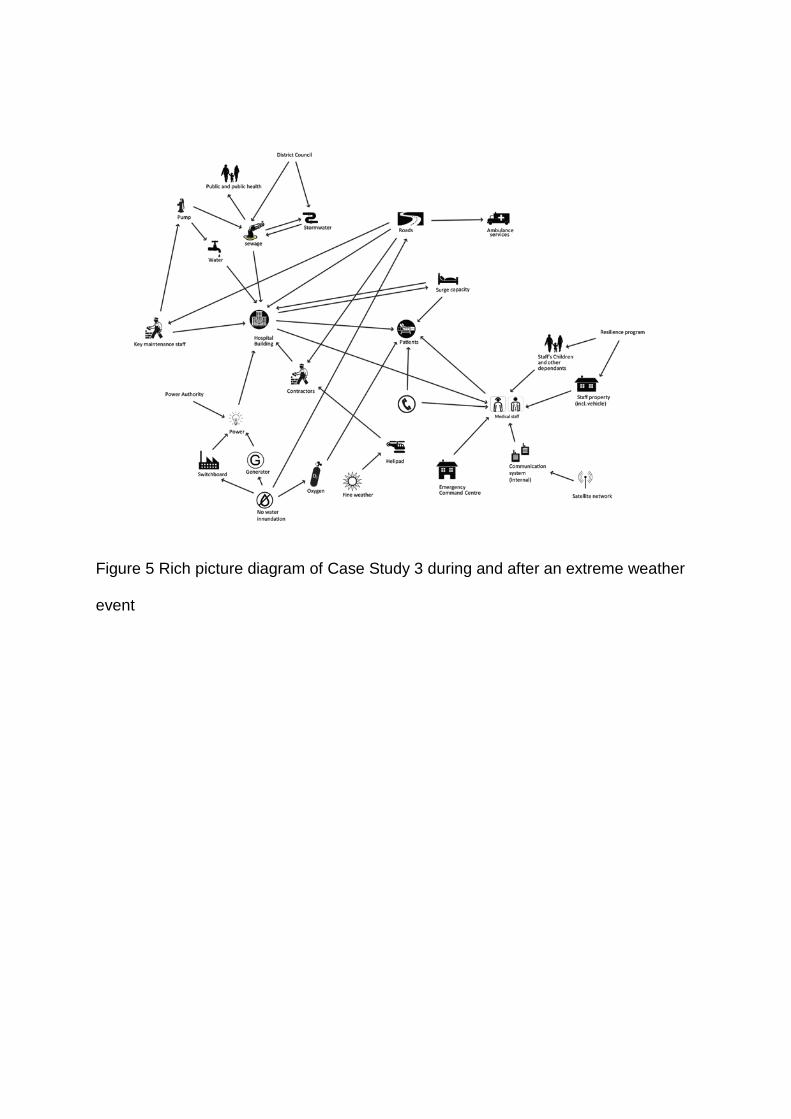
Figure 5 Rich picture diagram of Case Study 3 during and after an extreme weather
event
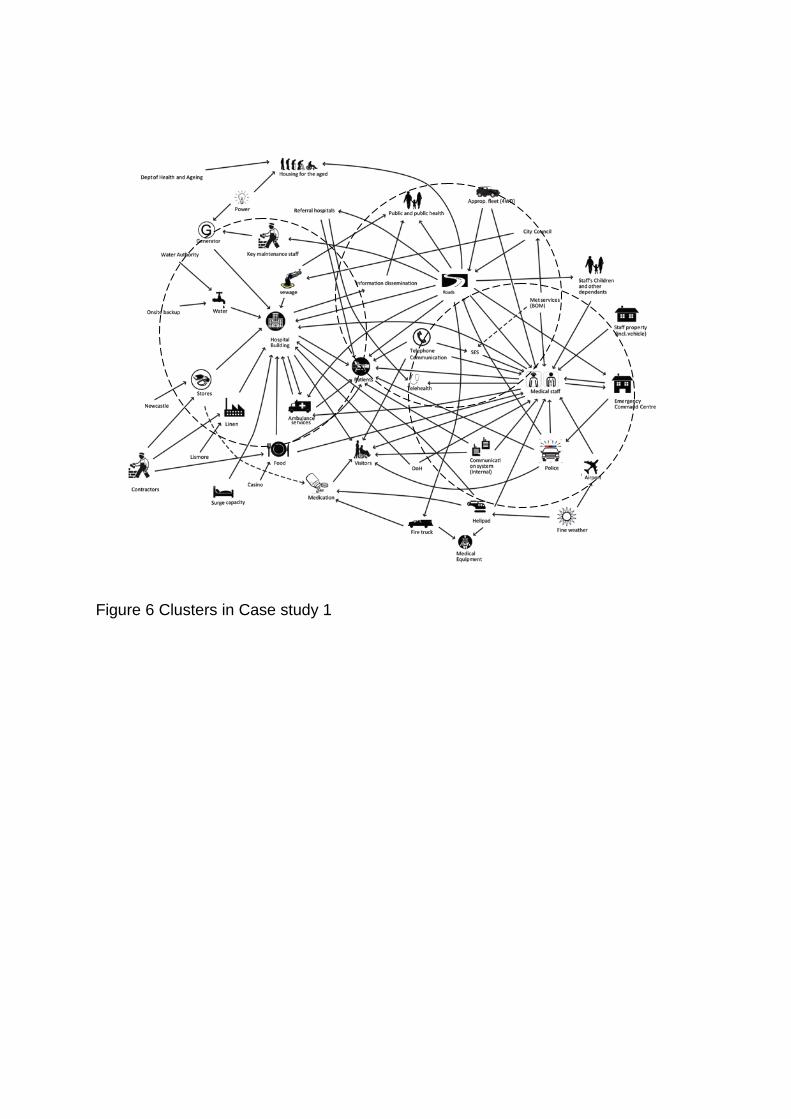
Figure 6 Clusters in Case study 1