Embed Size (px)
Citation preview

HESSD
Interactivecomment
Printer-friendly version
Discussion paper
Hydrol. Earth Syst. Sci. Discuss.,https://doi.org/10.5194/hess-2018-400-AC1, 2019© Author(s) 2019. This work is distributed underthe Creative Commons Attribution 4.0 License.
Interactive comment on “Risks of seasonalextreme rainfall events in Bangladesh under 1.5and 2.0 degrees’ warmer worlds – Howanthropogenic aerosols change the story” byRuksana H. Rimi et al.
Ruksana H. Rimi et al.
Received and published: 2 July 2019
We thank for the constructive comments from the anonymous Reviewer 1. We havecarefully revised the manuscript to incorporate necessary amendments as per sug-gestions. Responses to the Referee Comments 1(RC1) are presented in the followingparagraph in the Author’s Comments 1(AC1):
Introduction
RC1: The introduction provides a general background on the research topic with clearly
C1
HESSD
Interactivecomment
Printer-friendly version
Discussion paper
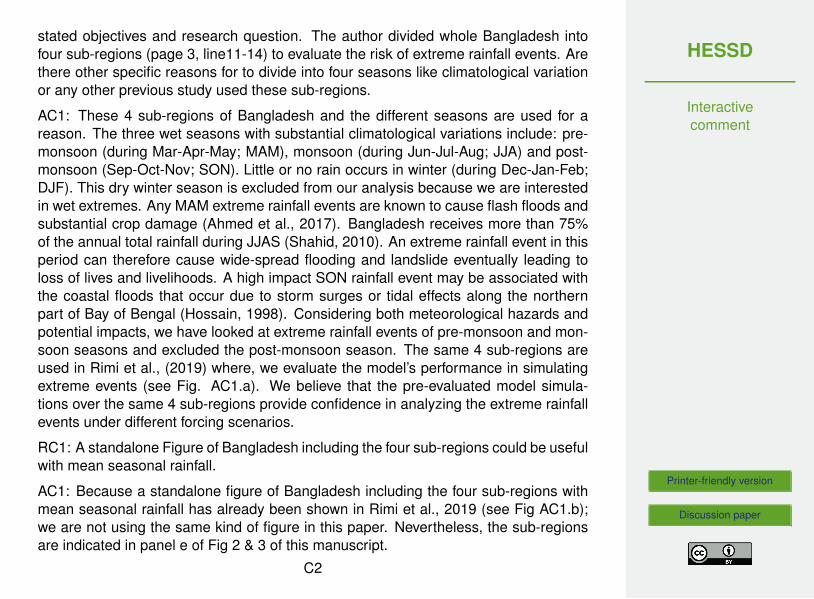
stated objectives and research question. The author divided whole Bangladesh intofour sub-regions (page 3, line11-14) to evaluate the risk of extreme rainfall events. Arethere other specific reasons for to divide into four seasons like climatological variationor any other previous study used these sub-regions.
AC1: These 4 sub-regions of Bangladesh and the different seasons are used for areason. The three wet seasons with substantial climatological variations include: pre-monsoon (during Mar-Apr-May; MAM), monsoon (during Jun-Jul-Aug; JJA) and post-monsoon (Sep-Oct-Nov; SON). Little or no rain occurs in winter (during Dec-Jan-Feb;DJF). This dry winter season is excluded from our analysis because we are interestedin wet extremes. Any MAM extreme rainfall events are known to cause flash floods andsubstantial crop damage (Ahmed et al., 2017). Bangladesh receives more than 75%of the annual total rainfall during JJAS (Shahid, 2010). An extreme rainfall event in thisperiod can therefore cause wide-spread flooding and landslide eventually leading toloss of lives and livelihoods. A high impact SON rainfall event may be associated withthe coastal floods that occur due to storm surges or tidal effects along the northernpart of Bay of Bengal (Hossain, 1998). Considering both meteorological hazards andpotential impacts, we have looked at extreme rainfall events of pre-monsoon and mon-soon seasons and excluded the post-monsoon season. The same 4 sub-regions areused in Rimi et al., (2019) where, we evaluate the model’s performance in simulatingextreme events (see Fig. AC1.a). We believe that the pre-evaluated model simula-tions over the same 4 sub-regions provide confidence in analyzing the extreme rainfallevents under different forcing scenarios.
RC1: A standalone Figure of Bangladesh including the four sub-regions could be usefulwith mean seasonal rainfall.
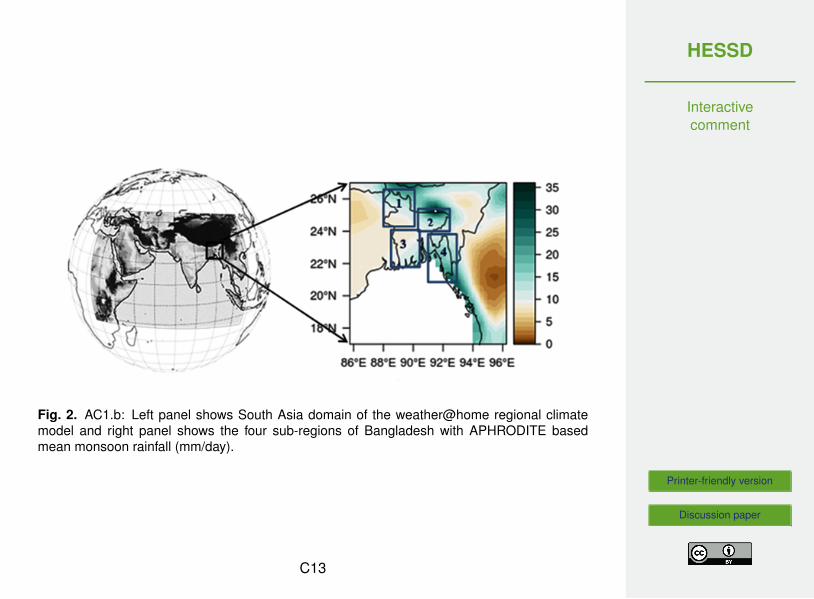
AC1: Because a standalone figure of Bangladesh including the four sub-regions withmean seasonal rainfall has already been shown in Rimi et al., 2019 (see Fig AC1.b);we are not using the same kind of figure in this paper. Nevertheless, the sub-regionsare indicated in panel e of Fig 2 & 3 of this manuscript.
C2

HESSD
Interactivecomment
Printer-friendly version
Discussion paper
RC1: Line 16 page 2 – In June 2017, heavy rainfall killed at least 156 people (needs acitation).
AC1: The following citation is added for this information: Paul, R. and Hussain, Z.:Landslide, floods kill 156 in Bangladesh, India; toll could rise, Reuters, 14th June [on-line] Available from: https://uk.reuters.com/article/uk-bangladesh-landslides/landslide-floods-kill-156-in-bangladesh-india-toll-could-rise-idUKKBN1950AG, 2017.
Data and Methods Model setup and experiment design
RC1: The wettest and driest years are not well presented in the Table S2. Is it range ofyears or individual year? Classification of wet years and dry is not clearly mentioned.It has been mentioned that spatiotemporal average of rainfall has been used here. Isthere any threshold for the classification of wet period and dry period? In Bangladeshflooding years are considered as wet year during monsoon. This needs to be madeclear.
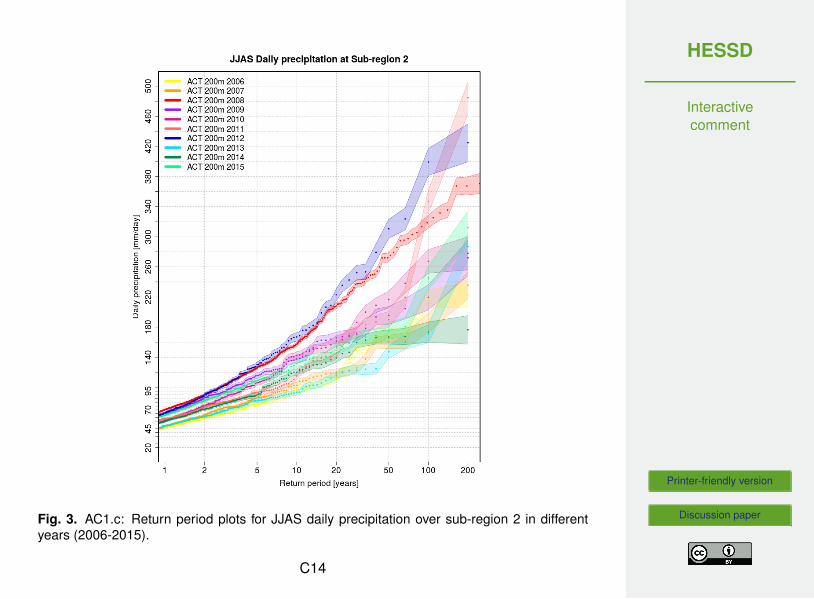
AC1: We identified the two wettest and two driest years during 2006–2015 over eachof the four sub-regions of Bangladesh using ACT data. This identification processinvolved comparing the magnitude along with return periods of rainfall events duringMAM and JJAS in each of the years throughout 2006 to 2015 (ACT model ensemblewith 200 members per year used). Then a pair of wettest and driest years is used toapproximately indicate the noise-to-signal ratio. For example, according to ACT modelensemble, during monsoon season at sub-region 2, the wettest years with extremerainfall events are 2008 and 2012 (see Fig. AC1.c, the red and blue dots for individualmodel runs and shadings for 5-95% confidence intervals) and the driest years are 2006and 2013 (yellow and cyan dots for individual model runs and shadings for 5-95%confidence intervals). Using the pair of these wettest and driest years from the modelensemble, we could demonstrate the plausible spread of the rainfall events within thismodel ensemble as a measure of noise-to-signal ratio. Because this model ensemblehas same forcings in each year for the historical period of 2006-2015, the only variability
C3

HESSD
Interactivecomment
Printer-friendly version
Discussion paper
playing a role in changing the intensity of rainfall is natural variability of sea surfacetemperatures (SSTs). The use of two wettest and driest years, therefore explains howmuch natural variability of SSTs contributes to the variability of rainfall intensities overthis study area. We agree with your comment and changed the presentation of theyears in the supplementary Table 2 to make it clear that they are the two individualyears with either wettest or, driest conditions in a 10-year period over a specific sub-region.
Results and Discussion Section 3.1 Model Evaluation for Five day mean rainfall
RC1: “Five day mean rainfall is used to represent the timescale responsible for riverflooding as opposed to daily extremes that cause flash floods primarily in the pre-monsoon season.” Is the 5 days rainfall causes flooding or 1-day extreme rainfallcauses flash flood in Bangladesh and what is the intensity of rainfall termed as ex-treme (what is the amount of rainfall mm/day considered as extreme value)? Citationmay clear this statement.
AC1: By extreme rainfall event, we mean a high impact rainfall event (i.e., sufficientto cause flooding or landslides) with up to 100 year return period (a rare event withlow frequency of occurrence). The intensity of the rainfall event can vary dependingon both location and season. For example, at north-east Bangladesh, in pre-monsoonseason, more than 150 mm rainfall event over a 6-day period can lead to an early flashflood (Ahmed et al., 2017). On the other hand, at south-east parts of Bangladesh, inmonsoon season, more than 350 mm rainfall events over a 3-day period is enoughto cause a landslide (Ali et al., 2014). Whereas, for a wide-spread river flooding e.g.,the Brahmaputra River Basin flooding in August 2017, 10-day extreme rainfall event isconsidered (Philip et al., 2018). Considering the range from 1- to 10-day high impactrainfall events that can trigger flooding and landslides in Bangladesh, we focused ondaily and 5-day events because these events can provide a typical idea about thepotential risks.
C4

HESSD
Interactivecomment
Printer-friendly version
Discussion paper
RC1: Fig.1 represents annual cycle of the four sub-regions in Bangladesh and resultsof the five models (ACT, NAT, GHG, HAPPI 1.5 and HAPPI 2.0) show maximum rainfalloccurs in June. June to September is the monsoon month and June is the monthof monsoon onset. Usually, July is the maximum rainfall month in Bangladesh. Dothe results indicate any shifting of monsoon timing Due to the monsoon climate, theoverall variation (inter-annual) of rainfall in JJAS months (seasonal) is not quite high?Bangladesh has almost similar pattern of monsoon precipitation in the JJAS months.Underestimation by 25-65% is quite high. The bias and uncertainty within these valuesis very high. The authors need to explain the reasoning for this a bit more.
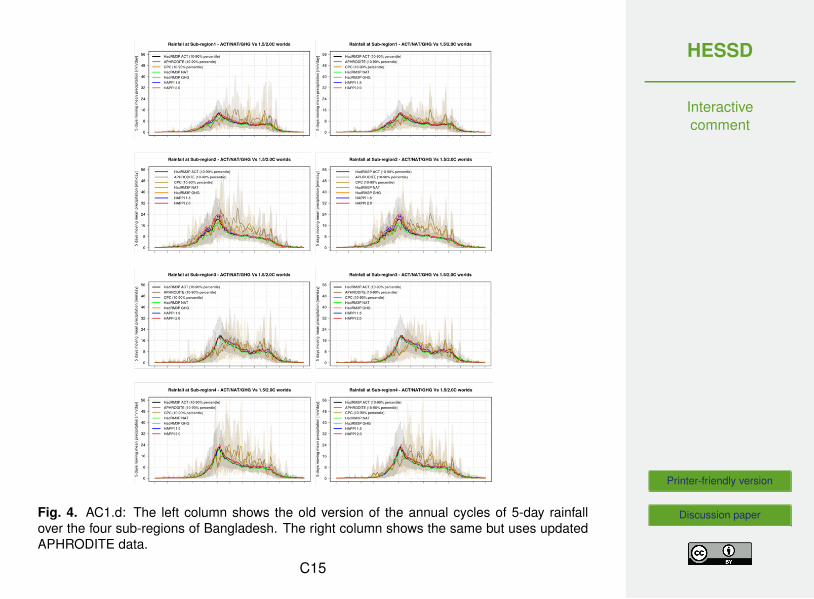
AC1: No, as per observational data (APHRODITE and CPC) that are used in the an-nual cycles in Fig 1; there are no indications of temporal shifting of monsoon. We seean early monsoon onset in the model simulations. Such early onset of monsoon isalso reported in other model based studies (e.g., in Caesar et al., 2015; Fahad et al.,2017; Janes and Bhaskaran, 2012). At the time of writing this paper, APHRODITEwas only available until 2007, so we used 1998-2007 data for comparison. Recently,APHRODITE has been updated until 2015, allowing us to use 2006-2015 data for com-parison (which is now same as CPC). As a result, APHRODITE and CPC observationsare now in better agreement (see Fig. AC1.d) and model bias is also smaller thanbefore (highest bias level of 65% dropped to 50%). The 25-50% underestimation ofmonsoon precipitation is quantified based on the model ensemble mean compared toobservations. Most of the observed rainfall is found to be within the 10-90% confidenceinterval of the model data. Overall, the weather@home model simulates the annualcycle of rainfall with satisfactory agreement, despite the dry monsoon rainfall bias. Fur-thermore, Rimi et al. (2019) shows that the weather@home model gives a reasonablerepresentation of extreme rainfall events with return periods of 50-100 years. There-fore, we are confident that these biases will not affect our risk assessments for extremerainfall events.
Section 3.2: Impact of Climate Change and Aerosol Reduction on Seasonal Mean
C5

HESSD
Interactivecomment
Printer-friendly version
Discussion paper
Rainfall
RC1: Provides important information regarding rainfall change due to warming 1.5ËŽCto 2ËŽC and aerosol impact. However, the change has been computed using modelbased on simulated observed data. The actual changes can be presented by usingobservation data (e.g., Aphrodite).
AC1: While it is definitely useful to look at the observed changes between pre-industrialand present-day rainfall, present day and future warmer (1.5 and 2.0 degrees) sce-narios or the aerosol impacts; we can only do this kind of comparison using modelsimulated data. Because no high resolution gridded observational dataset offersthe pre-industrial records and the future scenarios of 1.5 and 2.0 degrees warming.APHRODITE data was only available from 1963 to 2007 at the time of writing thispaper. Recently they have updated their data up to 2015. CPC observation datasetextends from 1979-present.
Page 7 line23 -24
RC1: “While aerosol effects are consistent with other regions, the GHG induced rainfallis hampered, likely due to dynamic changes such as a delayed onset of the monsoonin response to warming”, It can be supported with other relevant studies (e.g. thevariation of interannual rainfall may depend on the onset of monsoon).
AC1: While it is beyond the scope of this study to identify the exact mechanisms thatlead to future changes associated with aerosol removal (or the change due to contem-porary emissions for that matter), we point to the literature where this issue has beeninvestigated in some detail already. The seminal paper by Bollasina et al. (2011), aswell as more recent work by Zhao et al. (2019) are excellent resources that supportour point.
3.3 Rainfall extreme: Line 40, page7 RC1: “The signal-to-noise ratio is higher in themonsoon season across all sub-regions with the lowest and highest ratio in sub-region
C6

HESSD
Interactivecomment
Printer-friendly version
Discussion paper
1 and 3, respectively (Figs. 8a & 9a)”. This statement may be needed further explana-tion.
AC1: This statement is rewritten as “Overall, the signal-to-noise ratio is higher acrossall sub-regions, during JJAS compared to that during MAM. During MAM, the highestand lowest signal-to-noise ratio is over sub-region 1 and 3, respectively (Figs. 6a &7a). On the other hand, during JJAS, we find the highest and lowest signal-to-noiseratio is over sub-region 3 and 1, respectively (Figs. 9a & 8a). The lower the ratio, themore difficult it is to establish causality as natural variability due to ENSO or circulationanomalies is higher.”
References
RC1: The author referred Banglapedia, 2012 as citation in page 2 line 10. However,did not provide in the reference list.
AC1: We have now added this citation as “Banglapedia: River and Drainagesystem, Banglapedia- Natl. Encycl. Bangladesh [online] Available from:http://en.banglapedia.org/index.php?title=River_and_Drainage_System, 2012.” Othercomments:
(a) The title of the paper says risks of seasonal extreme rainfall events and presentedrainfall extreme using daily and five day mean rainfall. One day max and 5day maxwould be better presentation of rainfall extreme. It is also necessary to have a betterdescription why daily and five day mean rainfall has been used.
AC1: This is because our focus is on unusual rare rainfall events with the potential tocause high impacts on the ground in pre-monsoon and monsoon seasons. We haveused daily and 5-day running mean rainfall events throughout a season and then lookedat events crossing a threshold (e.g. 250mm/day that can trigger floods or, landslides)with a high return period (e.g. 100 years). In particular, we have explored whetheror not, and to what extent, the probability of having that same magnitude event (i.e.
C7

HESSD
Interactivecomment
Printer-friendly version
Discussion paper
250mm/day) changes in that particular season from one forcing scenario to another(e.g. from ACT to HAPPI 1.5).
(b) Inconsistent in figure indexing spacing: In the results (e.g. Sect. 3.2) it is needed tobe consistent with spacing when referencing to figures. For example, Fig.2 d and (Fig.2d), (Figs. 8a & 8b) and (Fig. 4 a & c).
AC1: Figure indexing spacing issue has been resolved. Now this is uniformly donethroughout the manuscript using Fig. 1a; Figs. 1a & b; Figs. 1a-d and Figs. 1b & 2bstyle.
(c) The Figure captions are too long. The author started to describe the results in someof them (e.g. Fig. 5). The results or discussion should be in text. Caption should beconcise and just define what the Figure shows with the necessary information to gatherinformation from it.
AC1: We have now moved parts of the figure captions to result and discussion sectionto reduce the length, and make them concise.
(d) Line 6 (page 4) – Evaluation of the model for the region was conducted by Rimiet al. (2019) and demonstrated a reasonable agreement between model results andobservational datasets for extreme rainfall events. What is a reasonable agreement?Which statistical skills show general agreement (e.g. r2, KGE). For example, 60% ofstations achieved values greater than 0.6 between modelled and observed data.
AC1: We present here Fig. AC1.a adapted from Rimi et al., (2019) for reference. InFigure AC1a., the black line represents the model simulated rainfall events; while, red,blue, orange and sky-blue colours indicate APHRODITE, GPCC, CPC gridded obser-vations and TRMM satellite data, respectively. Based on these figures, Rimi et al.,(2019) reports that the pre-monsoon and monsoon extreme rainfall events with up to100 years of return periods are adequately well captured by the model over Bangladeshwhen compared to APHRODITE, GPCC, CPC gridded observations and TRMM satel-
C8
HESSD
Interactivecomment
Printer-friendly version
Discussion paper
lite data. Although the observation data sets used in that model evaluation paper hadshort lengths of records; by fitting a Generalized Extreme Value distribution, the au-thors demonstrated that the model simulated extreme events are in good agreementwith the observations.
RC1: The discussion article ‘Risks of seasonal extreme rainfall events in Bangladeshunder 1.5 and 2.0degrees’ warmer worlds – How anthropogenic aerosols change thestory’ by Ruksana H. Rimi et al. is very interesting focused on the extreme rainfallevents due climate change particularly 1.5 and 2 degrees warmer world. This is acomprehensive analysis of future projection of multi model rainfall over several sub-region of Bangladesh. The author provides sufficient graphs and maps in the articlewhich explained the results. The major findings of the article are related with the globalwarming and its implication extreme weather events for Bangladesh. Finally, I suggestthat the author will consider the above comments in finalizing the script. The article isrecommended to publish with minor correction.
AC1: The authors highly appreciate your careful review with constructive comments.We have updated the manuscript following most of your suggestions. In case of anydisagreement, we have provided our explanation behind that. We hope that now themanuscript is ready to be accepted for publication.
References Ahmed, M. R., Rahaman, K. R., Kok, A. and Hassan, Q. K.: Re-mote sensing-based quantification of the impact of flash flooding on the rice pro-duction: A case study over Northeastern Bangladesh, Sensors (Switzerland), 17(10),doi:10.3390/s17102347, 2017.
Ali, R. M. E., Tunbridge, L. W., Bhasin, R. K., Akter, S., Khan, M. M. H. and Uddin, M. Z.:Landslides susceptibility of chittagong city, bangladesh and development of landslidesearly warning system, in Landslide Science for a Safer Geoenvironment, vol. 1, pp.423–429., 2014.
Bollasina, M.A., Ming, Y. and Ramaswamy, V.: Anthropogenic Aerosols and the Weak-
C9

HESSD
Interactivecomment
Printer-friendly version
Discussion paper
ening of the South Asian Summer Monsoon, Science 334 (6055), 502-505, doi:10.1126/science.1204994, 2011. Caesar, J., Janes, T., Lindsay, A. and Bhaskaran, B.:Temperature and precipitation projections over Bangladesh and the upstream Ganges,Brahmaputra and Meghna systems, Environ. Sci. Process. Impacts, 17(6), 1047–1056, doi:10.1039/C4EM00650J, 2015.
Fahad, M. G. R., Saiful Islam, A. K. M., Nazari, R., Alfi Hasan, M., Tarekul Is-lam, G. M. and Bala, S. K.: Regional changes of precipitation and temperature overBangladesh using bias-corrected multi-model ensemble projections considering high-emission pathways, Int. J. Climatol., doi:10.1002/joc.5284, 2017.
Hauser, M., Gudmundsson, L., Orth, R., Jézéquel, A., Haustein, K., Vautard, R., vanOldenborgh, G. J., Wilcox, L. and Seneviratne, S. I.: Methods and Model Dependencyof Extreme Event Attribution: The 2015 European Drought, Earth’s Futur., 5(10), 1034–1043, doi:10.1002/2017EF000612, 2017.
Hossain, A. N. H. A.: Flood management. [online] Available from:http://www.apfm.info/publications/casestudies/cs_bangladesh_sum.pdf, 1998.
Janes, T. and Bhaskaran, B.: Evaluation of regional model performance in simulatingkey climate variables over Bangladesh, Met Office, Exeter, United Kingdom., 2012.
Kumar, D., Arya, D. S., Murumkar, A. R. and Rahman, M. M.: Impact of climate changeon rainfall in Northwestern Bangladesh using multi-GCM ensembles, Int. J. Climatol.,34(5), 1395–1404, doi:10.1002/joc.3770, 2014.
NAS: Attribution of Extreme Weather Events in the Context of Climate Change, Na-tional Academies Press., 2016.
Nirapad: Bangladesh: Flash Flood Situation - April 19, 2017, Situat. Rep., 7 [online]Available from: https://reliefweb.int/sites/reliefweb.int/files/resources/Flash_Flood%2CUpdated %28April 19%29%2C 2017.pdf (Accessed 14 November 2017), 2017.
Philip, S., Sparrow, S., Kew, S. F., van der Wiel, K., Wanders, N., Singh, R., Hassan, A.,C10

HESSD
Interactivecomment
Printer-friendly version
Discussion paper
Mohammed, K., Javid, H., Haustein, K., Otto, F. E. L., Hirpa, F., Rimi, R. H., Islam, A.S., Wallom, D. C. H. and van Oldenborgh, G. J.: Attributing the 2017 Bangladesh floodsfrom meteorological and hydrological perspectives, Hydrol. Earth Syst. Sci. Discuss.,1–32, doi:10.5194/hess-2018-379, 2018.
Rimi, R. H., Haustein, K., Barbour, E. J., Jones, R. G., Sparrow, S. N. and Allen,M. R.: Evaluation of a large ensemble regional climate modelling system for ex-treme weather events analysis over Bangladesh, Int. J. Climatol., 39(6), 2845–2861,doi:10.1002/joc.5931, 2019.
Shahid, S.: Rainfall variability and the trends of wet and dry periods in Bangladesh, Int.J. Climatol., 30(15), 2299–2313, doi:10.1002/joc.2053, 2010.
Zhao, A.D., Stevenson, D.S. and Bollasina, M.A., The role of anthropogenic aerosolsin future precipitation extremes over the Asian Monsoon Region, Climate Dynamics52:6257-6278, doi: 10.1007/s00382-018-4514-7, 2019
Interactive comment on Hydrol. Earth Syst. Sci. Discuss., https://doi.org/10.5194/hess-2018-400, 2018.
C11

HESSD
Interactivecomment
Printer-friendly version
Discussion paperFig. 1. AC1.a: Left panels show 5-day rainfall events in JJA and MAM over Bangladesh whileright panels show the same but for sub-region 2.
C12
HESSD
Interactivecomment
Printer-friendly version
Discussion paper
Fig. 2. AC1.b: Left panel shows South Asia domain of the weather@home regional climatemodel and right panel shows the four sub-regions of Bangladesh with APHRODITE basedmean monsoon rainfall (mm/day).
C13
HESSD
Interactivecomment
Printer-friendly version
Discussion paperFig. 3. AC1.c: Return period plots for JJAS daily precipitation over sub-region 2 in differentyears (2006-2015).
C14
HESSD
Interactivecomment
Printer-friendly version
Discussion paperFig. 4. AC1.d: The left column shows the old version of the annual cycles of 5-day rainfallover the four sub-regions of Bangladesh. The right column shows the same but uses updatedAPHRODITE data.
C15