Embed Size (px)
Citation preview

The International Journal of Organizational Innovation Vol 10 Num 4 April 2018
300
THE INTERNATIONAL JOURNAL OF ORGANIZATIONAL INNOVATION
Vol 10 Num 4 April 2018 Section D:
Table Of Contents
Page: Title: Author(s): 301. Analysis Of Condominium Building Management Performance In Central Taiwan - Wei Tong Chen, Chao Wei Wang, Pei Sam Tan, Shih Tong Lu, Nai Hsin Pan
315. Links Between Switching Costs, Brand Trust, And Customer Loyalty In Mobile Phone Services - Ying-Chieh Yang, Sheng-Wen Liu 327. An Exploration Of Relationship Among Leisure Involvement, Leisure Benefits, Quality Of Life, And Training Effects Of Collegiate Athletes - Tang-Sheng Ho 345. Feasibility Analysis Of Using Highway Guardrails To Produce Cleaned Carbon Dioxide To Nourish Economic Plants Jung-Hsiang Lai, Po-Yu Chen, Miao-Sheng Chen, Hsien-Bin Wang
The International Journal of Organizational Innovation Vol 10 Num 4 April 2018
301
ANALYSIS OF CONDOMINIUM BUILDING MANAGEMENT
PERFORMANCE IN CENTRAL TAIWAN
Wei Tong Chen Department of Construction Engineering
National Yunlin University of Science & Technology [email protected]
Chao Wei Wang
Graduate School of Engineering Science and Technology National Yunlin University of Science & Technology
Pei Sam Tan Construction Division, Chung Li Construction Inc., 13F-2, No. 77, Xinpu 6th St.,
Taoyuan County 33044, Taiwan. [email protected]
Shih Tong Lu
School of Transportation & Tourism Kainan University
Nai Hsin Pan Department of Civil and Construction Engineering
National Yunlin University of Science & Technology [email protected]
Abstract
Management performance of condominium building projects is mainly assessed based on subjective judgment with limited objective evidence, thus calling into question the objec-

The International Journal of Organizational Innovation Vol 10 Num 4 April 2018
302
tive value of such assessments. The study utilizes data envelopment analysis (DEA) to assess management performance of 26 condominium building projects (decision making units; DMUs) in central Taiwan, from four dimensions (operational finance, management system, service quality, personnel quality) with eight input and five output items. Vari-able differential analysis is applied to improve efficiency by reducing the ratio of inputs for each project. Key influence of each dimension was identified using sensitivity analy-sis. Five benchmarked and five least efficient DMUs were identified. The approach pro-vides a positive mechanism for facilitating the objective assessment of property manage-ment. The empirical outcomes provide managerial insights for assessing project perform-ance efficiency. Keywords: Condominium building management, performance assessment, data envelopment analysis, input and output, efficiency
Introduction The trends of residents demanding
the gradual improvement of living envi-ronment quality and standards have in-creased the importance of condominium building management (CBM). A condo-minium is the form of housing tenure and other real property where a specified part of a piece of real estate is individually owned, while use of and access to com-mon facilities in the piece such as hall-ways, heating system, and exterior areas are executed under legal rights associated with the individual ownership and con-trolled by the association of owners that jointly represent ownership of the whole piece (Condominium, 2016). CMB is con-cerned with the comprehensive mainte-nance and management of a building’s hardware and services, along with the software of the community and living en-vironment. CBM requires integrating a variety of business operations and ser-vices, and is a key service industry with considerable output value and employ-
ment effects. The management and execu-tion of these business items requires the attention of a professional team which represents the building management com-pany in implementing management and service work, and is responsible for main-taining operational efficiency and service quality.
The property management industry
(PMI) is a highly profitable service indus-try in many advanced countries such as UK and Japan. However, in Taiwan, PMI is actually a low margin industry in which firms compete on price rather than quality of service. In fact, these low margins pre-vent firms from investing in improve-ments, thus quality service is generally declining. In Taiwan, CBM companies are typically selected by tender for one-year renewable contracts of building manage-ment. The determination of whether to extend the contract is made through ir-regular on-site performance assessments by the management committee accompa-nied by management firm executives.

The International Journal of Organizational Innovation Vol 10 Num 4 April 2018
303
Therefore, raising building site service quality and ensuring the overall efficiency of operational management are critical to winning contract rewards.
The current type of assessment
method is easily influenced by the subjec-tive opinions of the resident management committee members or the management firm executives, and does not easily re-flect actual objective conditions. Thus, there is a need for an objective and rea-sonable comparison mechanism based on objective field data analysis as the basis for performance assessment. Such a mechanism would establish performance benchmarks, identify areas of poor per-formance and assist the project manager in improving overall operating performance.
The study assesses the management
performance of condominium building projects. “Performance” in this study is defined as “the ratio of outputs and inputs as determined by the proper use of re-sources and skills.” Assessment is per-formed using data envelopment analysis (DEA) based on empirical data collected from 26 condominium building projects in central Taiwan. The targeted 26 condo-minium building projects as seen as 26 Decision Making Units (DMU) for the application of DEA. The following sec-tions cover application of DEA, research methodology, data collection and results discussion, and conclusions.
Use DEA to Performance Assessment
Both for-profit and non-profit or-
ganizations hope to maximize their output
(or services) and minimize their inputs. Organization performance is evaluated on the basis of the balance of inputs and out-puts. Evaluating staff performance pro-vides managers with information required to achieve the organization’s goals and improve management deficiencies. Many viewpoints have been expressed on the implications of performance assessment. Several methods, such as Balanced Score-card, Ratio Analysis, Multi-criteria Analy-sis, Regression Analysis and Production Frontier Approach, are used to measure performance in practice. While many of the measurement methods are practical, they are subject to many restrictions.
DEA is a method of measuring the
comparative efficiency of homogeneous operating units. It obtains efficiency val-ues via mathematical planning methods without using production behavior to pro-duce assumptions (or without any alpha-numeric settings). Using units with neutral characteristics (i.e., the input and output units are not consistent), it is used to measure technical efficiency, allocation efficiency, technological change and changes in total factor productivity. When using DEA for assessment, only inputs and outputs need to be decided, and it is not necessary to pre-determine mutual weighting, nor is a large data sample re-quired.
Via mathematical modeling of inputs
and outputs, DEA calculates production boundaries as the base measurement of efficiency, citing the concept of the pro-duction function in executing efficiency

The International Journal of Organizational Innovation Vol 10 Num 4 April 2018
304
Table 1. DEA-related studies
Authors Research topics Research results
Žižka et al. (2016)
Used a two-stage DEA method with BCC model orientated at inputs to evaluate the selected Czech innovative companies, and the impact of a branch on their performance in terms of effectiveness and efficiency.
There are significant differences in both the overall level of performance, and in its pillars – effectiveness and efficiency among branches.
Chiu et al. (2017)
Adopted the context-dependent DEA model to analyze the operating efficiency of 49 in-ternational tourism hotels (ITHs) in Taiwan.
Of the 49 ITHs, 17 have been operating at the same levels for over three years; 25 have similar rankings in all levels of attractiveness values; 11 have the same progress values in all levels.
Park & Kim (2016)
Assessed Korea’s energy efficiency using a modified hybrid model of index decomposi-tion analysis, artificial neural network, and DEA. The research predicts the optimal en-ergy consumption and estimate the difference between the optimal and real values.
Energy consumption was the most efficient be-tween 1993 and 1994, 1994 and 1995, 1997 and 1998, and 1999 and 2000. If the over-fitting and negative value problems are properly controlled, the proposed hybrid model can be used to pre-dict energy efficiency.
Titko et al. (2014)
Used non-parametric frontier technique DEA via 14 alternative models with different in-puts-outputs combinations to measure effi-ciency of Latvian banks.
Provides general recommendations about the variables selection for DEA applied to the Lat-vian banking sector. The research contributes to the existing analytical data on bank performance in Latvia.
Hadad et al. (2013)
Proposed a 7-step decision making support system (DMSS) module for selecting project managers based on the past performance of potential managers. The proposed DMSS was demonstrated using an Israeli informa-tion technology firm selecting a project man-ager.
A ranking method within the DEA context (the Cross-Efficient method) was implemented with three inputs and four outputs selected for the project ranking. The DMSS aims to maintain the matching process where subjective considera-tions can be replaced by objective ones.
Luo et al. (2012)
Proposed a new method for choosing DEA variables based on statistic results. The method was applied to 14 Chinese commer-cial banks, and both regression and statistic test results were satisfactory.
The proposed method has several advantages including: (1) improves objectivity; (2) provides managers and researchers with measurement variables and exact classifications of the factors; (3) variables come from easily available financial statements.
El-Mashaleh et al. (2010)
Evaluated and benchmarked the safety per-formance of 45 Jordanian construction con-tractors.
Input items include annual costs of safety pro-grams and salaries of safety personnel, and con-tractor safety expenses revenues. The amount of different types of accidents suffered by the con-tractor are used as the outputs.
Zhang et al. (2013)
Proposed a non-radial DEA model with the slacks-based measure to analyze the envi-ronmental efficiency of China's transporta-tion sector.
China's transportation industry is inefficient in terms of environmental impacts. China can sig-nificantly reduce carbon emissions, ranging from at least 1.6 million TOEs in Qinghai and at most 33 million TOEs in Guangdong and Shanghai.
Chen et al. Uses Network DEA to develop a 3-phase The model is equipped with three dimensions

The International Journal of Organizational Innovation Vol 10 Num 4 April 2018
305
(2017) based residential building operation assess-ment model and use it to assess the opera-tional efficiency of 26 DMUs to obtain the performance index of dimensions.
(with its weight) named staff quality, customer satisfaction and operation performance. Most of the total DMU efficiency values fell between 0.75 and 0.90, with one DMU equipped with 1.
Kheirollahi et al. (2015)
The research proposed a model of conges-tion, based on relaxed combination of inputs, in stochastic data envelopment analysis with chance constrained programming approaches to solve non-linear problems.
Replacing stochastic models with ‘‘determinis-tic equivalents”, the study used chance con-strained programming approaches to identify congestion input in six Iranian hospitals with one input and two outputs in the period of 2009 to 2012.
Table 2. Inputs and outputs for four different dimensions
Inputs Definition OF MS SQ PQ
Direct personnel costs Labor costs for on-site personnel I I I
Overhead costs Main office labor costs and on-site office supply costs
I I I
Number of personnel deployed
Number of personnel deployed on-site (includ-ing general work, security and custodial), based on a unit of 1 person/time = 8 hours.
I I I I
Total floor area Total floor area including each floor of the building, basement levels, roof areas, balconies, mezzanines, and attics.
I I I
Number of disaster drills Number of annual disaster drills I I
Hours of personnel train-ing
Average total number of annual training hours for personnel
I I I I
Number of professional licenses
Total number of licenses and certifications held by on-site personnel
I I
Number of community activities
Number of internal activities conducted annually. I I I
Contract amount Annual contractual income for the case O
Satisfaction with man-agement service center
Satisfaction score awarded by the residents’ committee (full score = 50)
O
Disaster score Annual number of police and fire alerts (full score = 10)
O
Staff retention rate Annual retention of staff O
Rate of management fee collection
Percentage of management fee collection O
Note: I indicates the selected inputs while O indicates the selected outputs; OF = Operational finance; \MS = Management system; SQ= Service quality; PQ= Personnel quality

The International Journal of Organizational Innovation Vol 10 Num 4 April 2018
306
assessment. DEA has been widely used as an effective tool to assess the relative performance efficiency of the completed projects by incorporating multiple input and output variables. Table 1 shows that DEA has been recognized as a robust tool for assessing the performance of business organizations and projects, with analysis methods divided into vertical and horizontal for comparison. The main difference is that vertical analysis uses different annual data to discover changes in efficiency between organizations or projects, while horizontal analysis com-pares performance between organiza-tions and projects in the same year. This paper focuses on performance assess-ment in CBM, particularly in terms of the ad hoc nature of projects, and thus uses horizontal analysis.
Although DEA has been exten-
sively utilized for efficiency measure-ment in various industries, it has not been widely used in the property man-agement industry, let alone in measuring the efficiency of CBM. We suggest DEA could be useful in producing a system-atic analysis and assessment of such per-formance. DEA model and data analysis
The DEA model can be differenti-
ated by “returns to scale” and “orienta-tion” into six types (Golany & Roll, 1989). This study uses the input orienta-tion of the CCR and BCC models. The CCR model demonstrates that the effi-ciency of a DMU can be expressed as the maximum of the ratio of weighted outputs to weighted inputs (Charnes et al., 1978). The objective in the CCR
model is constant return to scale, mean-ing that a proportional increase in inputs leads to a proportionate increase in out-puts. The BCC model was developed to estimate the pure technical efficiency of DMUs with reference to the efficient frontier (Banker et al., 1984). The BCC model also identifies if a DMU is operat-ing in increasing, decreasing or constant returns to scale. Thus, in this context CCR models are considered a specific type of BCC model.
DEA can be differentiated into six
steps to implement performance assess-ment including: (1) define DMU, (2) se-lect inputs and outputs, (3) collect and organize data, (4) process data analysis, (5) build a solution model, and (6) pre-sent and interpret results. In this study, the collected data were analyzed using several methods as follows.
Pearson correlation: The correlation be-tween two variables can be measured by multiple statistical methods. One of the most commonly used methods is the lin-ear correlation coefficient (r, Pearson correlation coefficient). This study uses Pearson product differential relation analysis to determine the degree of cor-relation for the inputs and outputs of each dimension.
Efficiency analysis: Whenever the effi-ciency value of DMU=1, it indicates that the DMU is efficient. When the corre-sponding efficiency value < 1, it indi-cates that the DMU is inefficient. Nor-man and Stocker (1991) classified

The International Journal of Organizational Innovation Vol 10 Num 4 April 2018
307
DMUs into four types based on their overall efficiency values.
Sensitivity Analysis: Sensitivity analysis is defined as “the degree of influence of a change in the number of DMUs or of inputs and outputs on the DMU’s corre-sponding efficiency value” (Charnes et al., 1985). Different inputs and outputs result in different efficiency frontiers. One can identify the key contributions of inputs and outputs to the efficiency and advantages of each DMU by adjusting the inputs and outputs.
Scale efficiency analysis: The BCC model can be used to determine the indi-cators of returns to scale. Constant re-turns to scales indicate the DMU is pro-ducing under optimal scale conditions, where the BCC and CCR models have similar efficiency values. Increasing re-turns to scales indicate that the DMU is producing at lower than optimal condi-tions, and that the rate of increase for outputs exceeds that of inputs. Decreas-ing returns to scales indicate the DMU is producing under beyond optimal scale conditions, and the rate of increase for outputs is less than that for inputs.
Collection and Results Discussion
DMU, Inputs And Outputs
Determination
In this study, management services
purchased by CBM committees are re-garded as a DMU. These services in-clude integrated community manage-
ment, building management planning, consulting and advisory services (i.e., counseling management operation and the acting). To utilize DEA to perform relative efficiency assessment, one must first determine the DMU in considera-tion of the following:
1. Similar internal characters: The
residential DMUs involve similar management and service items, and the input and output items for man-agement performance are also roughly similar.
2. Different external environment: The environment for each DMU is different in terms of location, area, number of units and scale. Each DMU thus entails different personnel inputs.
3. Number of DMUs: This study col-
lected 26 DMUs and assessed their corresponding efficiency values based on input and output data. According to Norman and Stocker (1991), the number of DMUs (= 26) should not be less than the double of the total number of inputs and outputs (= 13). Six top management professionals,
each with more than 15 years of property management experience, were invited to extract performance indicators from the Handbook of Property Management Ser-
vice Quality Management and Perform-
ance Indicators published by Taiwan’s Ministry of Economic Affairs. The same professionals also recommend that the efficiency of targeted CBM be

The International Journal of Organizational Innovation Vol 10 Num 4 April 2018
308
measured from the viewpoints of opera-tional finance (OF), management system (MS), service quality (SQ) and personnel quality (PQ). A 3-stage interview was conducted to determine the proposed model’s performance indicators in terms of inputs and outputs (Table 2). Pearson correlation coefficient analysis was per-formed to determine whether inputs and outputs are significantly correlated. Shown in Table 2, the proposed inputs and outputs are positively correlated, indicating that the eight inputs and five outputs determined by this study are rea-sonable.
Efficiency Analysis Of The Operational
Finance Dimension
This study assesses DMU effi-
ciency through four dimensions includ-ing operational finance, management system, service quality and personnel quality. Operational finance is taken as an example to show the process and re-sults of efficiency analysis, with the analysis of the other dimensions follow-ing a similar process.
Overall Efficiency Analysis
The overall efficiency of each
DMU is sorted by technical efficiency and referred counts. If a DMU has a value equals to 1, it is an efficient DMU, while a value below 1 indicates rela-tively inefficient. This study utilizes the CCR input-oriented method to calculate the technical efficiency of each DMU, separately sorting DMUs by technical efficiency (technical efficiency and re-
ferred counts), as in Table 3. The table shows 10 efficient DMUs (technical ef-ficiency value = 1), and 16 inefficient DMUs. Overall efficiency is optimal in the top five DMUs (DMU09, DMU11, DMU10, DMU17 and DMU08) and least optimal in the bottom five DMUs (DMU25, DMU21, DMU03, DMU05 and DMU23). DMU09 is the most optimal DMU, and was referred 17 times by in-efficient DMUs, followed by DMU11 (referred 11 times). DMU25 was the least optimal DMU, with a technical effi-ciency of 0.6175, with 38.25% of re-sources being wasted.
Analysis Of Pure Technical Efficiency,
Technical Efficiency And Return Of
Scale
The CCR model can be used to ob-
tain the technical efficiency for each DMU. The pure technical efficiency can then be obtained through the BCC model, and dividing the technical effi-ciency by pure technical efficiency ob-tains the scale efficiency, thus indicating whether the inefficiency is due to scale inefficiency or technical inefficiency. If it is due to scale inefficiency, return of scale analysis can determine whether to expand or reduce the scale of operations, depending on whether the return of scale is increasing or decreasing. If technical inefficiency is prompted by pure techni-cal inefficiency, it is subject to manage-ment control and could be improved in the short term. If it comes from scale inefficiency, it would be difficult to im-prove in the short term, and may require the integration of technical efficiency

The International Journal of Organizational Innovation Vol 10 Num 4 April 2018
309
Table 3. Overall efficiency ranking, efficiency and RS type for all DMUs
DMU Overall TE
Referred counts
Rank DMU TE PTE SE RS
type DMU09 17 DMU01 1.00000 1.00000 1.00000 CRS DMU10 10 DMU05 1.00000 1.00000 1.00000 DMU11 11 DMU08 1.00000 1.00000 1.00000 DMU17 5 DMU09 1.00000 1.00000 1.00000 DMU08 4 DMU10 1.00000 1.00000 1.00000 DMU20 4 DMU11 1.00000 1.00000 1.00000 DMU19 3 DMU15 1.00000 1.00000 1.00000 DMU01 2 DMU17 1.00000 1.00000 1.00000 DMU15 2 DMU19 1.00000 1.00000 1.00000 DMU05
1.00000
1
1
DMU20 1.00000 1.00000 1.00000 DMU04 0.99756 11 DMU04 0.99756 0.99917 0.99840 DMU16 0.96367 12 DMU16 0.96367 1.00000 0.96367 IRS DMU06 0.93632 13 DMU06 0.93632 1.00000 0.93632 DMU07 0.93395 14 DMU07 0.93395 1.00000 0.93395 DMU26 0.92360 15 DMU26 0.92360 1.00000 0.92360 DMU18 0.91574 16 DMU18 0.91574 1.00000 0.91574 DMU24 0.87618 17 DMU24 0.87618 1.00000 0.87618 DMU13 0.84750 18 DMU13 0.84750 1.00000 0.84750 DMU22 0.80750 19 DMU22 0.80750 1.00000 0.80150 DMU02 0.79774 20 DMU02 0.79774 0.91644 0.87048 DMU14 0.75228 21 DMU14 0.75228 0.85660 0.87822 DMU23 0.72467 22 DMU23 0.72467 0.85583 0.84675 DMU12 0.70809 23 DMU12 0.70809 0.88011 0.80454 DMU03 0.69735 24 DMU03 0.69735 0.89179 0.78196 DMU21 0.63376 25 DMU21 0.63367 0.78019 0.81232 DMU25 0.61750
0
26 DMU25 0.61750 0.73736 0.83745
Note: TE= Technical efficiency; PTE= Pure technical efficiency; SE= Scale efficiency
and return of scale to be adjusted to opti-mal scale. According to Norman and Stocker (1991), DMUs can be classified into four types. Explaining details, based on Table 3, are as follows: 1. Robustly efficient units: Technical
efficiency, pure technical efficiency and scale efficiency are all equal to 1 for robustly efficient unit which is the benchmark of other units. The return of scale of robustly efficient unit should
be fixed or it may maintain an ineffi-cient state. Thus, there is no need to in-crease outputs or decrease inputs to maintain the current production scale. For example: DMU09 (17 times), DMU11 (11), DMU10 (10), DMU17 (5) and DMU08 (4).
2. Marginal efficient units: Technical
efficiency, pure technical efficiency and scale efficiency are all 1, and effi-ciency reference sets appear only once
The International Journal of Organizational Innovation Vol 10 Num 4 April 2018
310
or twice. If there is a slight change in inputs or outputs, the efficiency value may be below 1. For example: DMU01 (2 times), DMU15 (2) and DMU05 (1).
3. Marginal inefficient units: Technical
efficiency value is below 1 but greater than 0.9. If the pure technical effi-ciency is 1 and scale efficiency is less than 1, the technical efficiency and in-efficiency stems from scale ineffi-ciency. For example: DMU06, DMU07, DMU16, DMU18 and DMU26 are stages of ISR, and the scale of production should be decreased to improve ineffi-ciencies. If scale efficiency values are very close to 1 and the scale efficiency value is greater than the pure technical efficiency value, then total efficiency and inefficiency stems from technical inefficiency. To improve these ineffi-ciencies, the most suitable inputs should be used to maximize outputs. Fortunately, this type of situation did not arise in the performance dimen-sions.
4. Distinctly inefficient units: Unit ef-
ficiency values are apparently below 0.9, e.g., DMU02 (0.79774), DMU03 (0.69735), DMU12 (0.70809), DMU13 (0.84750), DMU14 (0.75228), DMU22 (0.80750), DMU23 (0.72467), and DMU25 (0.61750). Technical effi-ciency, pure technical efficiency and scale efficiency may all be below 1, with inefficiency stemming from tech-nical inefficiency or scale inefficiency. Improving this type of inefficient situa-tion requires the simultaneous im-provement of the ratio of inputs and
outputs to adjust the scale of produc-tion.
Analysis For Each Performance
Dimension
Table 4 shows DMUs which appear
at least twice among the top five for each efficiency dimension. Ranked in descend-ing order, they are DMU05, DMU15, DMU18, DMU08, DMU24, DMU08, and DMU24. DMUs which appear at least twice among the bottom five for each effi-ciency dimension include DMU25, DMU21, DMU03, DMU23, DMU20 and DMU02. Some key findings of Table 5 are summarized as follows:
1. The overall efficiency of the four di-
mensions generally exceeds 0.85. The overall efficiency of the personnel quality dimension was the lowest. Only limited DMUs reach the efficiency frontier in terms of personnel quality performance.
2. The technical efficiency of the opera-
tional finance dimension was 0.8897, indicating that 11.03% of project re-sources were wasted. Pure technical ef-ficiency and scale efficiency were 0.9584 and 0.9244, respectively, indi-cating that 4.16% of the resource wast-age was due to technical inefficiency, while 7.56% was due to scale ineffi-ciency.
3. The technical efficiency of the man-
agement system dimension was 0.9443, indicating that 5.57% of DMU re-sources were wasted in this dimension.

The International Journal of Organizational Innovation Vol 10 Num 4 April 2018
311
Pure technical efficiency and scale ef-ficiency were 0.9644 and 0.9788, re-spectively, indicating that 3.56% of the resource wastage was due to technical inefficiency, while 2.12% was due to scale inefficiency.
4. The technical efficiency of the service
quality dimension was 0.9197, indicat-ing that 8.03% of project resources were wasted in this dimension. Pure technical efficiency and scale effi-ciency were 0.9375 and 0.9803, respec-tively, indicating that 6.25% of the re-source wastage was due to technical inefficiency, while 1.97% was due to scale inefficiency.
5. The technical efficiency of the person-
nel quality dimension was 0.8579, in-dicating that 14.21% of project re-sources were wasted in this dimension. Pure technical efficiency and scale ef-ficiency were 0.9584 and 0.8929, re-spectively, indicating that 4.16% of the resource wastage was due to technical inefficiency, while 10.71% was due to scale inefficiency.
Conclusions
In today’s competitive business envi-
ronment, companies need a method to ef-fectively compare the performance of various projects within a given time pe-riod. Such a method is needed to allow managers to effectively allocate resources, motivate project managers and their teams and to create an environment conducive to continuous improvement. The DEA ap-proach provides an input–output frame-
work and can be used to assess overall efficiency and the relative efficiency of each DMU, rather than absolute effi-ciency. In this study, DEA measures the management efficiency of VBM via eight inputs and five outputs confirmed by the Pearson correlation coefficient, producing management efficiency ratings on a scale of 0–1. The key findings are as follows:
1. For the four dimensions used to assess
DMU efficiency, technical efficiency typically averaged more than 0.85. The personnel quality dimension is ranked the lowest in efficiency while the management system dimension is the most efficient. The most efficient DMU in each dimension was DMU06 (operational finance), DMU26 (man-agement system), DMU05 (service quality) and DMU18 (personnel qual-ity), respectively.
2. The key influence of each dimension was identified using sensitivity analy-sis. The management system dimen-sion is found to have a significant de-gree of influence, while service quality does not. The personnel quality di-mension only has a significant degree of influence on overhead costs, but less influence elsewhere.
3. Resource wastage by each dimension can be identified via pure technical ef-ficiency and scale efficiency. Resource wastage for technical efficiency and scale inefficiency are measured for the operational finance dimension (4.16% and 7.56%, respectively), the man-agement system dimension

312
Table 4. Top five efficiency performers in each dimension
Better ← Efficiency → Worse Better ← Efficiency → Worse
1st 2nd 3rd 4th 5th 5th to last 4th to last 3rd to last 2nd to last Last
OF DMU06 DMU11 DMU10 DMU17 DMU08, DMU20
DMU23 DMU12 DMU03 DMU21 DMU25
MS DMU26 DMU05, DMU15
DMU02, DMU18
DMU08, DMU24
DMU19 DMU23 DMU25 DMU16 DMU20 DMU03
SQ DMU05 DMU22 DMU15 DMU04, DMU06
DMU03, DMU18
DMU25 DMU23 DMU02 DMU21 DMU20
PQ DMU18 DMU10 DMU05, DMU26
DMU02, DMU15
DMU13, DMU24
DMU21 DMU11 DMU02 DMU03 DMU22
Note: OF = Operational finance; MS = Management system; SQ= Service quality; PQ= Personnel quality
Table 5. Average efficiency and resources wasted for each dimension
TE PTE SE Indicator
Dimension Average TE
Resource wastage
Average PTE
Resource wastage
Average SE
Resource wastage
OF 0.8897 11.03% 0.9584 4.16% 0.9244 7.56% MS 0.9443 5.57% 0.9644 3.56% 0.9788 2.12% SQ 0.9197 8.03% 0.9375 6.25% 0.9803 1.97% PQ 0.8579 14.21% 0.9584 4.16% 0.8929 10.71%
Note: OF = Operational finance; MS = Management system; SQ= Service quality; PQ= Personnel qual-ity; TE= Technical efficiency; PTE= Pure technical efficiency; SE= Scale efficiency
(3.56% and 2.12%), the service quality dimension (6.25% and 1.97%), and the personnel quality dimension (4.16% and 10.71%).
4. Among the five most efficient DMUs,
DMU08, DMU05, DMU15 and DMU18 are considered the benchmark DMUs, while DMU25, DMU21, DMU03, DMU12 and DMU23 are in the five least efficient and most in need of ur-gent improvement. The main causes of inefficiency and the corresponding ad-justment methods to improve particu-lar DMUs are provided, allowing for
the improvement of inefficient situa- tions.
This research makes three primary
contributions. First, it provides building site managers and researchers with rele-vant variables for consideration in meas-uring performance of CBM. Second, the proposed approach is more objective in that DEA relates resources expended on a certain performance to its associated level of success. Third, the data required for analysis can be easily obtained since all relevant variables should be easily col-lected in the project.

313
Taiwan’s property management in-dustry currently lacks any readily avail-able efficiency measure to objectively as-sess the efficiency of CBM. Similar situa-tions can be found in Great Chinese Area, and there is a pressing need for a system-atic approach to gap filling. The proposed DEA approach is suited to fill this gap, and can be used to measure the manage-ment performance of a particular condo-minium building over time. The authors believe that the proposed approach is appli-cable to the Great Chinese Area, particularly China, Taiwan, and Macao due to their similar building management environment and philosophy.
Collection of a complete data set
should assist in more extensive perform-ance assessment for CBM, and allow for the discovery and remediation of more on-site problems. This study was limited to data collection, and only a single year’s data was used for analysis. A longitudinal study may provide effective comparison if DMU data for multiple years are col-lected. Taking each year as a single DMU, the quality of CBM could be assessed quantitatively over time. In addition, the proposed methodology can be employed at the company level, with each company taken as a single DMU. As a result, man-agement companies will be able to iden-tify their best performing projects and in-ternal factors that contributed to better performance.
Conflict of Interests The authors declare that there is no
conflict of interests regarding the publica-tion of this paper.
Acknowledgment
The authors are grateful to the refe-rees for their valuable comments and ad-vanced suggestions. This research was partially supported by the MOST of Tai-wan and Ghope Property Inc. Special thanks also go to all survey participants.
References
Cao, Q. & Hoffman, J.J. (2011). A case
study approach for developing a pro-ject performance evaluation system, International Journal of Project
Management, Vol. 29,155-164. Banker, R.D., Charnes, A. & Cooper,
W.W. (1984). Some models for es-timating technical and scale ineffi-ciency in data envelopment analysis, Management Science, Vol. 30, 1078-1092.
Charnes, A., Cooper, W.W. & Rhodes, E.
(1978). Measuring the efficiency of decision-making units, European
Journal of Operation Research, Vol. 2, 429-444.
Charnes, A., Cooper, W.W., Lewin, A.Y.,
Morey R.C. & Rousseau, J. (1985). Sensitivity and stability analysis in DEA, Annals of Operations Re-
search, Vol. 2, No. 2, 139-156. Chen, W.T., Tan, P.S., Nida, F. & Wang,
C.W. (2017). Performance assess-ment of residential buildings man-agement utilizing network data en-velopment analysis, Proceedings of
the ISARC 2017, Taipei, Taiwan, D-2-4.

314
Chiu, Y.-H. & Wu, M.-F. (2017). Per-formance evaluation of international tourism hotels in Taiwan- Applica-tion of context-dependent DEA, In-
formation Systems and Operational
Research, Vol. 48, No. 3, 155-170. Condominium.
http://en.wikipedia.org/wiki/Condominium, 09/16/2016.
El-Mashaleh, M.S., Rababeh, S.M. &
Hyari, K.H. (2010). Utilizing data envelopment analysis to benchmark safety performance of construction contractors, International Journal of
Project Management, Vol. 28, No. 1, 61-67.
Golany, B. & Roll, Y. (1989). An applica-
tion procedure for DEA, OMEGA, Vol. 17, No. 3, 237-250.
Hadad, Y., Keren, B. & Laslo, Z. (2013).
A decision-making support system module for project manager selection according to past performance, Inter-
national Journal of Project Man-
agement, Vol. 31, 532-541. Kheirollahi, H., Matin, B.K.,
Mahboubi, M. & Alavijeh, M.M. (2015). Chance constrained input re-laxation to congestion in stochastic DEA- An application to Iranian hos-pitals, Global Journal Health
Science, Vol. 7, No. 4, 151-160. Luo, Y., Bi, G. & Liang, L. (2012). In-
put/output indicator selection for DEA efficiency evaluation: An em-pirical study of Chinese commercial banks, Expert Systems with Applica-
tions, Vol. 39, 1118-1123.
Norman, M. & Stocker, B. (1991). Data
envelopment analysis: The assess-
ment of performance. New York: John Wiley and Sons.
Park, S. & Kim, J. (2016). Energy effi-
ciency in Korea: Analysis using a hybrid DEA model, Geosystem En-
gineering, Vol. 19, No. 3, 143-150. Titko, J., Stankevičienė, J. & Lāce, N.
(2014). Measuring bank efficiency: DEA application, Technological and
Economic Development of Economy, Vol. 20, No. 4, 739-757.
Zhang, N., Danao, D. & Zhang, N. (2013).
Environmental efficiency analysis of transportation system in China: A non-radial DEA approach, Energy
Policy, Vol. 58, 277-283. Žižka, M., Valentovâ, V.M. & Turčok, L.
(2016). Performance evaluation of Czech innovative companies: Data envelopment analysis approach, In-
ternational Journal of Strategic
Property Management, Vol. 20, No. 4, 427-438.

The International Journal of Organizational Innovation Vol 10 Num 4 April 2018
315
LINKS BETWEEN SWITCHING COSTS, BRAND TRUST, AND CUSTOMER LOYALTY IN MOBILE PHONE SERVICES
Ying-Chieh Yang
Associate Professor of Finance Department, Fuzhou University of International Studies, China
Email: [email protected]
*Sheng-Wen Liu Assistant Professor of Department of Marketing Management, Transworld University,
1221, Jen-Nang Rd., Chia-Tong Li, Douliou, Yunlin, Taiwan *Corresponding Author Email: [email protected]
Abstract
The purpose of this study is to integrate and examine empirically for the relationships between switching costs, brand trust, and customer loyalty. All data collected from the target population are analyzed through two-step structural equation modeling (SEM) to examine the hypotheses. 1,050 questionnaires are randomly distributed at 21 telecommunication service stores in Taiwan. As a result, findings indicate that the only moral hazard cost and hold-up cost have indirect impact on behavioral loyalty via brand trust or attitudinal loyalty. Moreover, findings identify not only switching costs as the multidimensional concept but also brand trust and attitudinal loyalty as mediating roles in strengthening customer real purchase action. Besides the need for empirical confirmation of the hypotheses given, finally, there are several practical im-plications for service marketers and future research directions for scholars. Keywords: Information Search Cost, Moral Hazard Cost, Hold-Up Cost, Customer
Loyalty
Introduction
Customer loyalty has received great attention to be one of the key central elements that generate benefits and gain sustainable competitive ad-vantages to corporations (Matzler et
al., 2008; Moisescu & Allen, 2010; Ngo & Pavelkova, 2017). In the mar-keting literature, therefore, customer loyalty has been recognized as market-ing advantages to corporations for dec-ades (Aaker, 1991; Chaudhuri & Hol-brook, 2001; Chinomona et al., 2013; Moisescu & Allen, 2010; Ngo & Pav-elkova, 2017; Zhang & Mattila, 2015).

The International Journal of Organizational Innovation Vol 10 Num 4 April 2018
316
To maintain or enhance consumer cus-tomer loyalty, not only do companies do their best to provide consumers with better products and services, but also try to prevent consumer switching behavior. What companies do is to hope that consumers can continue pur-chasing their products or services. Numerous studies have focused on fac-tors as determinants of customer loy-alty in different areas and examined the relationships between those factors, such as service quality, brand trust, and risk aversion. Most of studies have demonstrated those factors have posi-tive correlation with customer loyalty (Chaudhuri & Holbrook, 2001; Chi-nomona et al., 2013; El-Manstrly et al., 2011; Lui et al., 2017; Matzler et al., 2008; Ngo & Pavelkova, 2017; Zhang & Mattila, 2015). However, relatively few studies have examined relation-ships between switching costs and cus-tomer loyalty even though evidence indicates switching costs will increase switching difficulty or prevent con-sumer switching behavior (Jones et al., 2002). This is because the measure-ment of switching costs lacks a consis-tent instrument (Hu et al., 2016). Moreover, the role of switching costs in a service industry has been rarely acknowledged (Jones et al., 2002). To fill this gap, therefore, the purpose of this study is to integrate and examine empirically for the relationships be-tween switching costs, brand trust, and customer loyalty in order to obtain a deeper understanding of customer sub-sequent brand choice when facing switching barriers. Empirical illustration of this study is also focused on the mobile phone service market in Taiwan. As of June 2017, the number of mobile phone us-ers has reached 29.68 million with
about 130% of penetration rate and indicates that mobile phones in Taiwan are very prevalent (National Commu-nications Commission in Taiwan, 2017). Therefore, it is of great interest to marketing researchers not only for its rapid growth, but also for its impli-cations to customer loyalty manage-ment in the competitive mobile phone service market. To accomplish these objectives, the present paper is organ-ized as follows: through literature re-view and integration in several relevant fields, first of all, the paper derives re-search hypotheses and develops a con-ceptual model. Through structural equation modeling (SEM) and Boot-strapping test, next, all data collected from the target population in Taiwan are analyzed. Finally, the findings are presented, followed by conclusions and discussions of the findings including several managerial implications and future research directions.
Related Literature and Development of Hypotheses
Brand Trust and Customer Loyalty
In the marketing literature, cus-tomer loyalty is not only defined as a deeply held commitment to rebuy or repatronize a preferred product or ser-vice consistently in the future, despite situational influences and marketing efforts having potential to cause switching behavior (Oliver, 1997), but is also viewed as a measure of the at-tachment that “a customer has to a brand” (Aaker, 2005, p.50). Authors point out customer loyalty is formed in a gradual, sequential manner from cognitive loyalty to affective loyalty to conative loyalty and, finally, to behav-ioral loyalty. These different aspects of loyalty do not emerge simultaneously,

The International Journal of Organizational Innovation Vol 10 Num 4 April 2018
317
but rather consecutively over time (Adia et al., 2015; Oliver, 1999). In accordance with Oliver (1999), who suggests that customer loyalty should be categorized into attitudinal loyalty (including cognitive, affective, and conative loyalty) and behavioral loy-alty. In the marketing literature, more-over, if the companies make it possible to put more emphasis on the cognitive dimension by offering customized products or services to their customers, then the results will lead to strengthen the affective dimension and followed by conative dimension, finally, in-crease behavioral loyalty of their cus-tomers. This is because once customer attitude towards a brand is positive, highly loyal buyers tend to stay loyal (Adia et al., 2015; Blut et al., 2007; El-Manstrly et al., 2011; Matzler et al., 2006, 2008). Therefore, it is recom-mended that customer attitude has a significant impact on behavioral loy-alty. In the mobile phone service field, therefore, the following hypothesis is proposed:
H1 Attitudinal loyalty is positively re-lated to behavioral loyalty.
In the commitment-trust litera-ture, brand trust is defined as “the will-ingness of on the average consumer to rely on the ability of the brand to per-form its stated function” (Chaudhuri & Holbrook, 2001, p.82). Riegelsberger et al. (2005) classify trust as cognitive and affective/emotional trust. Cogni-tive trust based on evaluating the com-petence, reliability, and predictability of the trusted object reflects the eco-nomic understanding of trust as ra-tional choice, while affective trust is the emotion-driven form of trust be-cause of originating from immediate affective reactions, on attractiveness,
aesthetics, and signals of benevolence. Orzan et al. (2016) point out a mix of cognitive and affective trust leads to frequently trust-based behavior. In or-der to build brand trust, therefore, products or services have to meet or even exceed expectations of the cus-tomers. Prior studies also consider brand trust as a key factor building long-term relationships between a company and her consumers. This is because if a consumer trusts a company providing highly values of products/services, then he/she will more likely develop some form of positive behavioral in-tention towards this company (Lau & Lee, 1999; Liu et al., 2017; Morgan & Hunt, 1994; Rousseau et al., 1998). As a result, customer loyalty as an impor-tant outcome of brand trust has been conceptualized either as behavioral intention towards the brand or as actual pattern of purchase behavior, or both (Matzler et al., 2006, 2008). Under un-certain or ambiguous circumstances, especially, not only do higher trust rat-ings reduce psychological anxiety and may positively affect consumer deci-sion-making process, but also correlate positively with attitudinal and behav-ioral loyalty (Reast, 2005). In the mo-bile phone service context, therefore, the two hypotheses are proposed as follows: H2a Brand trust positively influences
attitudinal loyalty. H2b Brand trust positively influences
behavioral loyalty.
Switching Costs, Brand Trust, and
Customer Loyalty

The International Journal of Organizational Innovation Vol 10 Num 4 April 2018
318
In marketing literature, not only is switching cost considered as one of switching barriers that will increase switching difficulty or prevent con-sumer switching behavior (Jones et al, 2000), but is also defined as the costs that customers need to incur when they move from one service or product pro-vider to others (Heide & Weiss, 1995). That is, when considering changing service providers, customers will evaluate the benefits after are switch-ing and the cost (price) they will pay (Hu et al., 2016). In accordance with Jones et al. (2002, 2003), when con-sumers perceive that they must pay higher switching costs, the switching motivation will decline. As a result, the related switching costs will diminish the exchange relationship between a service provider and her customers (El-Manstrly et al., 2011). Based on the study by Ngo and Pavelkova (2017), moreover, switching costs are divided into two different types, including the positive switching costs (the benefits from interpersonal relationships and the emotional connection with the ser-vice providers) and negative switching costs (monetary costs and procedural expenses like times and efforts). The two switching costs in banking indus-tries significantly impact on customer loyalty. In this study, switching costs can be clustered into three main groups: information search cost, moral hazard cost, and hold-up cost. Information search costs refer to when changing from one provider to another, specifi-cally, consumers entail search and learning costs (Chiu, 2006; Jones et al., 2002). The higher level of information search costs, the stronger customer loyalty is (Chiu, 2006; Ngo & Pavelk-ova, 2017). However, empirical results
by El-Manstrly et al. (2011) indicate no impact of information search costs on customer loyalty. In order to build the gap, therefore, the two hypotheses are proposed as followed: H3a Information search costs positively
influences attitudinal loyalty. H4a Information search costs positively
influences behavioral loyalty. In the telecommunication services context, in order to build a good cus-tomer relationship with service provid-ers, mobile phone service providers often give consumers promises that consumers can obtain specific services or benefits from their companies be-fore the transaction. All specific ser-vices or benefits will be terminated once customers change from the cur-rent provider into another (Chiu, 2006). This is the so-called moral haz-ard cost and belongs to one of rela-tional costs. The higher level of moral hazard costs, the stronger customer loyalty is. Therefore, we propose two hypotheses as follows: H3b Moral hazard costs positively in-
fluences attitudinal loyalty. H4b Moral hazard costs positively in-
fluences behavioral loyalty. As to hold-up cost, authors point out it is one of sunk costs or financial switching costs (Blut et al., 2007; Chiu, 2006; Ngo & Pavelkova, 2017). This is because preferential programs or a special discount always provide a stronger customer incentive to con-tinue purchasing from the same pro-vider, even when others are offering functionally identical products or ser-vices (El-Manstrly et al., 2011). How-
The International Journal of Organizational Innovation Vol 10 Num 4 April 2018
319
ever, once customers switch from the current provider into others, they may need to pay more money back. In the telecommunication service context, therefore, we propose two hypotheses as follows: H3c Hold-up costs positively influences
attitudinal loyalty. H4c Hold-up costs positively influences
behavioral loyalty. In the commitment-trust litera-ture, switching costs explicitly foster brand trust and then transferring inten-tions into action (Burnham et al., 2003). Through setting up higher level of moral hazard costs, for example, mobile phone service providers can build better relationship with their cus-tomers and further increase customer brand trust. Moreover, service provid-ers offer specific services or preferen-tial programs to their customers so as to enhance customer satisfaction. The higher customer satisfaction will lead to increase customer brand trust (Ald-isert, 1999; Lee et al, 2001). In the mobile phone service context, there-fore, the hypothesis is proposed as fol-lows: H5 Switching costs positively influences brand trust.
Research Model
Based on the earlier literature, not only does the proposed model in this study examine the mediating role of brand trust in the relationships between switching costs and customer loyalty, but also explores the effects of switch-ing costs on customer loyalty (see Fig-ure 1).
Methodology
The Questionnaire Design and Sample
A personally administered ques-tionnaire was used to collect the date. A total 23 items questionnaire which contains seven parts: Personal charac-ters, switching costs, brand trust, and customer loyalty. Personal characters (6items) contain gender, age, educa-tion, occupation, year income, and marriage situation. Brand trust (4 items) and customer loyalty were (4 items) were measured using the scales developed by Chaudhuri and Holbrook (2001). Switching costs (9 items) was measured with a modified version of Chiu (2006), which divided switching costs into three parts: information search cost (3 items), moral hazard cost (3 items) and hold-up cost (3 items).
Based on the study by Licit and
Green (1975), Likert-type scales are easily completed by respondents and provide reliable. Therefore, in this study all statements were measured on a five-point Likert-type (1 = strongly agree, 5 = strongly disagree). More-over, based on recommendation of Hair et al. (2006), to have reliable sample size the minimum sample will be five respondents per survey item. The measurement instrument used in this study had 23 items, which means the minimum number of respondents for factor analysis for this study should be 260. The total of 292 respondents completed the questionnaires on-site.
Data Collection and Analysis of
Reliability and Validity
All data collected from the target population are analyzed through a
The International Journal of Organizational Innovation Vol 10 Num 4 April 2018
320
Figure 1. Research model.
Table 1. Standardized loadings and reliabilities
Construct Indicators Standardized loadings
AVE Cronbach’s α
SC1 0.76*** SC2 0.90***
ISC
SC3 0.65***
0.60 0.81
MC1 0.77*** MC2 0.85***
MHC
MC3 0.80***
0.65 0.79
HC1 0.69*** HC2 0.72***
HUC
HC3 0.76***
0.52 0.75
Trust1 0.77*** Trust2 0.58*** Trust3 0.90***
Brand Trust
Trust4 0.87***
0.62 0.86
BL1 0.87*** Behavioral loyalty BL2 0.90***
0.78 0.88
AL1 0.92*** Attitudinal loyalty AL2 0.66***
0.64 0.75
Goodness-of-fit indices (N = 291); 667.278)51(2=χ (p < 0.001); RMSEA = 0.047; RMR = 0.046;
GFI = 0.940; AGFI = 0.919; CFI = 0.967; NFI = 0.921. ISC = information search cost; MHC = moral hazard cost; HUC = hold-up cost.
Switching Costs Information Search
Cost
Moral Hazard Cost
Hold-Up Cost
Attitudinal
Loyalty
Behavioral
Loyalty
Brand
Trust
H1
H2b
H2a H5
H3
H4

The International Journal of Organizational Innovation Vol 10 Num 4 April 2018
321
two-step structural equation modeling (SEM) to analyze a measurement model and a structural model in order to examine the hypotheses. For achieving this statistical analysis, Amos 22.0 is adopted to examine va-lidity and reliability of the instrument as well as all hypotheses. In accor-dance with Hair et al. (2006), not only is SEM capable of dealing with theo-retical constructs which are measured by latent factors, but is also more pow-erful to fulfill multiple regression and path analysis for examining the com-plex interrelationships between con-structs. 1050 questionnaires were ran-domly selected from 21 telecommuni-cations service stores of 7 sections of Taichung in Taiwan. Each telecommu-nications service stores were selected 10 customers to participate in this study for 5 weeks and the question-naires based interview were conducted face-to-face. Each week go for differ-ent day from Monday to Friday. At the end of date collection process, from the total of 303 completed interviews, and only 291 were validated.
Through confirmatory factor analysis (CFA), measurement validity is first evaluated. It is because the measurement model shows an accept-
able model fit to the data: χ2 = 278.667 (p < .0001); df = 51; RMSEA = .047 (< .05); RMR = .046 (< .05); GFI = .947 (> .90); AGFI = .919 (> .90); CFI = .967 (> .90); NFI = .921 (> .90) (Bagozzi & Yi, 1988). Convergent va-lidity assesses the extent to which items designed to measure the same construct are related, while discrimi-nate validity assesses the degree to which items designed to measure dif-ferent constructs are related (Hair et al., 2006). It is found that standardized factor loadings of all items measuring
the same constructs are over .60 and significantly related (p < .001), as well as the average variance extracted (AVE) for all reach constructs of this study exceeds .50 (see Table 1). Reli-ability of the instrument, moreover, is assessed with Cronbach alpha. Results illustrate alpha coefficients of all con-structs exceed .70 and the fact that the internal consistency and stability of the instrument is acceptable (Nunnally, 1978). Therefore, convergent validity is established. Discriminant validity, finally, is tested by comparing the shared variance among indicators of a construct with the variance shared be-tween constructs. The test for dis-criminant validity is met when the square root of AVE for the construct is greater than its correlations with other constructs. As a result, correlation val-ues of all items measuring different constructs are significantly low and range from .00 to .62. Therefore, dis-criminant validity is established (For-nell & Larcker, 1981).
Results
The conceptual model was as-sessed by examining the path coeffi-cients (the β weight values in Table 2). Overall the structural model fit was acceptable: 2
χ = 68.794 (p = .04); df = 50; RMSEA = .036 (< .05); RMR = .039 (< .05); GFI = .966 (> .90); AGFI = .939 (> .90); CFI = .990 (> .90); NFI = .963 (> .90). All path coefficients and t-statistics for hypothesized rela-tionships were calculated through Maximum Likelihood in AMOS. These findings indicate that the indices are all within the acceptable criteria and the structural model has a good fit (Bagozzi & Yi, 1988). Results of hy-pothesis testing were presented in Ta-ble 2. The results (see Table 2)

The International Journal of Organizational Innovation Vol 10 Num 4 April 2018
322
Table 2. Path coefficients and t value
Path Standardized coeffi-cients
t Value
ISC Attitudinal loyalty -0.078 -1.305 ISC Behavioral loyalty 0.026 0.558 ISC Brand trust 0.023 0.367 MHC Attitudinal loyalty 0.234*** 3.386 MHC Behavioral loyalty 0.146** 2.568 MHC Brand trust 0.462** 6.241 HUC Attitudinal loyalty 0.176** 2.642 HUC Behavioral loyalty 0.019 0.361 HUC Brand trust 0.082 1.208 Brand trust Attitudinal loyalty 0.505*** 6.419 Brand trust Behavioral loyalty 0.152* 2.289 Attitudinal loyalty Behavioral loyalty 0.677*** 8.002
*p < 0.05; **p < 0.01; ***p < 0.001. Goodness-of-fit indices (N = 291); 794.68)50(2=χ (p = .04); RMSEA =
0.036; RMR = 0.039; GFI = 0.966; AGFI = 0.939; CFI = 0.990; NFI = 0.963. ISC = information search cost; MHC = moral hazard cost; HUC = hold-up cost.
indicate that moral cost has positive and significant effects on attitudinal and behavioral loyalty, but hold-up cost only has positive and significant effects on attitudinal loyalty. Search cost, however, has insignificant im-pacts on brand trust, attitudinal and behavioral loyalty. Moreover, not only do results indicate the positive impact of attitudinal loyalty on behavioral loyalty, but also reveal the significant effects of brand trust on customer loy-alty. As a result, H1, H2a, H2b and H5 are supported. However, H4 are partly supported. On further examining indi-rect effects of switching costs on cus-tomer loyalty, of three switching costs, not only do Bootstrapping test results reveal that moral hazard cost has a sig-nificantly indirect impact on behav-ioral loyalty via brand trust and attitu-dinal loyalty, but also indicate that hold-up cost has an indirect impact on behavioral loyalty via attitudinal loy-alty. However, information search costs have no indirect impacts on be-havioral loyalty via either brand trust or attitudinal loyalty.
Discussion, Conclusion and
Implications
The purpose of this study is to examine switching costs – brand trust – customer loyalty link in mobile phone service market. The findings demonstrate that when customers have perception of higher switching costs, the positive direct effects of moral hazard cost on customer brand trust, attitudinal loyalty, and behavioral loy-alty. Moreover, moral hazard costs have indirect impacts on behavioral loyalty via brand trust and attitudinal loyalty. It is recommended that mobile phone service providers need to build exit an excellent relationship with their customers to prevent consumer switch-ing behavior. For example, not only do mobile phone service providers offer incentives to attract their customers, but also have to put more emphasis on training their employees in order to provide better services to their custom-ers. On enhancing brand trust, the study shows mobile phone users

The International Journal of Organizational Innovation Vol 10 Num 4 April 2018
323
Table 3. Bootstrapping Test Results
Mediation path Indirect effect ISC Brand Trust Behavioral loyalty 0.003 ISC Brand Trust Attitudinal loyalty 0.012 ISC Attitudinal loyalty Behavioral loyalty -0.053 ISC Brand Trust Attitudinal loyalty Behavioral loyalty 0.008 MHC Brand Trust Behavioral loyalty 0.07* MHC Brand Trust Attitudinal loyalty 0.233*** MHC Attitudinal loyalty Behavioral loyalty 0.158*** MHC Brand Trust Attitudinal loyalty Behavioral loyalty 0.219* HUC Brand Trust Behavioral loyalty 0.012 HUC Brand Trust Attitudinal loyalty 0.041 HUC Attitudinal loyalty Behavioral loyalty 0.119* HUC Brand Trust Attitudinal loyalty Behavioral loyalty 0.028 *p < 0.05; **p < 0.01; ***p < 0.001. ISC = information search cost; MHC = moral hazard cost; HUC = hold-up cost. worried about whether the product is really capabilities and commitment, hope to sign the contract as well as many of the supervisory action to pro-tect the contents of the transaction. Therefore, if the company can enhance consumer trust through a contract, is more likely to enhance consumer loy-alty to the brand.
Based on empirical results, hold-up costs have impact on attitudinal loyalty, even though hold-up costs have no impact on brand trust and be-havioral loyalty. Moreover, hold-up costs indirectly influence behavioral loyalty via attitudinal loyalty. This is because the mobile phone users gain-ing exclusive rights and assets due to having a contractual relationship with the mobile phone service providers. The higher asset specificity is, the higher the degree of interdependence between the two sides is. In order to improve the renewal rates of consum-ers, for example, the mobile phone service providers in Taiwan always offer various types of preferential or discount programs, such as mobile
phone discounts, more favorable cost of telephone communications and so on. Once the customer defaults on con-tracts they previously signed, they will be required to pay liquidated damages. When giving up the contract, losing the asset specificity, and then turning to other competitors to purchase goods, on the other hand, customers will pay high switching costs. Therefore, this study shows that the higher hold-up cost leads to prevent consumer switch-ing behavior (Chiu, 2006; Ngo & Pav-elkova, 2017). As expected, brand trust and atti-tudinal loyalty play important roles in mediating the relationships between switching costs and behavioral loyalty. These findings are in line with prior research about the mediating roles of customer brand trust and attitude (Chi-nomona et al., 2013; Lee et al, 2001; Matzler et al, 2006; Zhang & Mattila, 2015).
Limitations and Future Research

The International Journal of Organizational Innovation Vol 10 Num 4 April 2018
324
This study provides some insight into the way in which switching costs affecting consumer perceptions on cus-tomer loyalty interact to influence cus-tomer loyalty outcomes, but it has sev-eral limitations. First of all, the results in this study may not be generalized in all commodities due to only focusing on one type of service - mobile phone service. Therefore, it is recommended that future studies are needed to exam-ine and validate the generalizability of the findings to more service sectors (Zhang & Mattila, 2015). Second, the results are limited due to the respon-dents only from one national service context. Consequently, not only could future research replicate the current study with a larger sample, but could also consider that customer loyalty is influenced by other factors, including salesperson service behaviors, gov-ernment relations, and national culture. Moreover, future research can examine the relationship between the mutual influences of these factors and verify the results more accurately.
Reference
Aldisert, L. (1999). Reinventing rela-tionship marketing. Banking Marketing, 31(6), June, 37.
Aaker, D.A. (1991). Managing Brand
Equity: Capitalizing on the value of a Brand Name. N.Y.: The Free Press.
Aaker, D.A. (2005). Strategic Market
Management, (7th ed.). Hoboken, N.J.: John Wiley and Sons, Inc.
Adia, A.-A.A., Kim, H.J., Abdul,
M.R., Osman, Z., Razli, I.A., & Ing, G.P. (2015). Purchase behav-ior in advergame and the effect of
brand attitude as a mediator. Asian Social Science, 11, 249-257.
Bagozzi, R.P., & Yi, Y. (1988). On the
evaluation of structural equation models. Journal of the Academy of Marketing Science, 16(2), 74-94.
Blue, M., Evanschitzky, H., Vogel, V.,
& Ahlert, D. (2007). Switching barriers in the four-stage loyalty model. Advances in Customer Research, 34, 726-734.
Burnham, T., Frels, J., & Mahajan, V.
(2003). Consumer switching costs: a typology, antecedents, and consequences. Journal of the Academy of Marketing Science, 31(2), 109-126.
Chiu, J.S. (2006). Strategic Marketing
Analysis: Framework and Practi-cal Applications. Taipei: Best Wise.
Chaudhuri, A., & Holbrook, M.B.
(2001). The China of effects from brand trust and brand affect to brand performance: the role of cus-tomer loyalty. Journal of Market-ing, 65, 81-93.
Chinomona, R., Mahlangu, D., & Pooe,
D. (2013). Brand service quality, satisfaction, trust and preference as predicators of customer loyalty in the retailing industry. Mediterra-nean Journal of Social Science, 4, 181-190.
El-Manstrly, D., Paton, R., Veloutsou,
C., & Moutinho, L. (2011). An em-pirical investigation of the relative effect of trust and switching costs on service loyalty in the UK retail

The International Journal of Organizational Innovation Vol 10 Num 4 April 2018
325
banking industry. Journal of Finan-cial Services Marketing, 16(2), 101-110.
Fornell, C., & Larcker, D.F. (1981).
Evaluating structural equation models with unobservable variables and measure error. Journal of Mar-keting Research, 18(1), 39-50.
Hair, J.F. Jr., Black, W.C., Babin, B.J.,
Anderson, R.E., Tatham, R.L. (2006). Multivariate Data Analysis, (6th ed.). Upper Saddle River, NJ: Pearson Prentice Hall.
Heide, J.B., & Weiss, A.M. (1995).
Vendor consideration and switch-ing behavior for buyers in high-technology markets. Journal of Marketing, 59(3), 30, doi: 10.2307/1252117.
Hu, H.-Y., Change, H.-C., & Cheng, C.-
C. (2016), Exploration on the rela-tionship between patient satisfac-tion, relationship inertia and loy-alty-switching barriers as the mod-erator. Journal of Accounting Fi-nance & Management Strategy, 11(1), 53-82.
Jones, M.A., Mothersbaugh, D.L., &
Beatty, S.E. (2000). Switching bar-riers and repurchase intentions in service. Journal of Retailing, 76(2), 259-274.
Jones, M.A., Mothersbaugh, D.L., &
Beatty, S.E. (2002). Why customer stay: measuring the underlying di-mensions of services switching costs and managing their differen-tial strategic outcomes. Journal of Business Research, 55, 441-445.
Jones, M.A., Mothersbaugh, D.L., &
Beatty, S.E. (2003). The effects of vocational convenience on cus-
tomer repurchase intentions across service types. Journal of Services Marketing, 17(7), 701-712.
Lau, G.-T., & Lee, S.-H. (1999). Con-
sumers’ trust in a brand and the link to customer loyalty. Journal of Market-Focused Management, 4, 341-370.
Lee, J., Lee, J., & Feick, L. (2001). The
impact of switching costs on the customer satisfaction-loyalty link: mobile phone service in France. Journal of Service Marketing, 15, 35-48.
Lissitz, R.W., & Green, S.B. (1975). Ef-
fect of the number of scale points on reliability: a Monte Carlo ap-proach. Journal of Apply Psychol-ogy, 60, 10-13.
Liu, S.-W., Yang, Y.-C., & Norcio, R.
(2017). Explore the buffering ef-fects of perceived hidden inflation on survival of mobile phone service providers in Taiwan. Sustainability (special issues), 9(4), 555, doi:10.3390/su9040555.
Matzler, K., Grabner-Krauter, S., &
Bidmon, S. (2006). The value-brand trust-customer loyalty chain: an analysis of some moderating variables. Innovative Marketing, 2(2), 76-88.
Matzler, K., Grabner-Krauter, S., &
Bidmon, S. (2008). Risk aversion and customer loyalty: the mediating role of bran trust and brand affect. Journal of Product & Brand Man-agement, 17, 154-162.
Moisescu, O.I., & Allen, B. (2010). The
relationship between the dimen-sions of customer loyalty: an em-pirical investigation among Roma-
The International Journal of Organizational Innovation Vol 10 Num 4 April 2018
326
nian Urban consumers. Manage-ment & Marketing Challenges for Knowledge Society, 5, 83-98.
Morgan, R., & Hunt, S. (1994). The
Commitment-trust theory of rela-tionship marketing. Journal of Marketing, 58, 20-38.
National Communications Commission
in Taiwan. Available online: http://www.ncc.gov.tw/english/index.aspx (accessed on 29 December 2017).
Ngo, V., & Pavelkova, D. (2017). Mod-
erating and mediating effects of switching costs on the relationship between service value, customer satisfaction and customer loyalty: investigation of retail banking in Vietnam. Journal of International Studies, 10(1), 9-33. doi:10.14254/2071 -8330.2017/10-1/1.
Nunnally, J.C. (1978). Psychometric
theory. N.Y.: McGraw-Hill. Oliver, R.L. (1997). Satisfaction: a be-
havioral perspective on the con-sumer. Boston, M.A.: McGraw-Hill, Irwin.
Oliver, R.L. (1999). Whence consumer
loyalty? Journal of Marketing, 63, 33-44.
Orzan, G., Platon, O.-E., Stefansson,
C.D., & Orzan, M. (2016). Concep-tual model regarding the influence of social media marketing commu-nication on brand trust, brand affect and customer loyalty. Economic Computation and Economic Cyber-netics Studies and Research, 50(1), 141-156.
Reast, D.F. (2005). Does trust and brand extension acceptance: the relation-ship. Journal of Product & Brand Management, 14(1), 4-13.
Riegelsberger, J., Sasses, M.A., &
McCarthy, J.D. (2005). The me-chanics of trust: a framework for research and design. International Journal of Human-Computer Stud-ies, 62, 381-422.
Rousseau, D.M., Sit-in, S.B., Butt, R.S.,
& Caterer, C. (1998). Not so differ-ent after all: a cross-discipline view of trust. Academy of Management Review, 23(3), 393-404.
Zhang, L., & Mattila, A.S. (2015). An
examination of corporate social re-sponsibility and processing fluency in a service context. Journal of Ser-vices Marketing, 29, 103-111

The International Journal of Organizational Innovation Vol 10 Num 4 April 2018
327
AN EXPLORATION OF RELATIONSHIP AMONG LEISURE INVOLVEMENT, LEISURE BENEFITS, QUALITY OF LIFE, AND TRAINING EFFECTS OF COLLEGIATE ATHLETES
Tang-Sheng Ho
Department of Physical Education, Health & Recreation National Chia-Yi University, Taiwan R.O.C.
Abstract
This research aims to discuss the predictions and relations among leisure involvement, leisure benefit, quality of life, and training effect of elite collegiate athletes in Taiwan. Multiple Regression and Path Analysis (LISREL) were applied in this research as well. The results of this research are as follow, in collegiate athletes: (1) The life wellness promotion in leisure benefit is the best predictor of training effect; (2) leisure involvement directly effects on both leisure benefits and quality of life; (3) leisure in-volvement has no impact on training effect; (4) Leisure benefits directly effects on both quality of life and training effect; (5) Quality of life directly effects on training effect. Finally, in accordance with achieved findings, discussions were made and rec-ommendations were offered to future collegiate athletes. Keywords: Leisure, Quality of Life, Athletes
Introduction
Being outstanding athletes, it is necessary to dedicate a great amount of time on training to carry out their best performance in competitions. Colle-giate athletes are in a more complex situation, because they must maintain both of their competition and academic performance. Whether collegiate ath-letes can make themselves available for leisure activities or not has been an interesting issue for researchers. Since participating leisure activities can help relieving stress and gaining appropriate
relaxation for reserving stamina, there-fore it is important for athletes. We expect collegiate athletes to participate more leisure activities to avoid detri-mental effects of pressure and anxiety, thus achieve a balanced physical and psychological state. The importance of leisure activi-ties to human being was postulated by Gunter and Gunter (1980) who com-pared subjects of participation and non-participation of leisure activities to probe individual’s degree of participa-tion and context, and further discov-
The International Journal of Organizational Innovation Vol 10 Num 4 April 2018
328
ered that leisure involvement includes elements of behaviors, cognition, and emotions. Many studies revealed that participation of leisure activities obtain positive effects on quality of life (Leung and Lee, 2005), as well as physical and psychological health and well-being (Su, Lee & Shinger, 2014). Therefore, this study inferred that col-legiate athletes participate leisure ac-tivities promote their quality of life.
Leisure involvement is a long-
term and continuous participation in-volving multiple aspects and awaken-ing self-awareness and motivations. Leisure involvement reflects the level of focus and the outcome after activi-ties participation, which could attribute to the value that individual has toward leisure activity (Peter & Olson, 1987; Kyle & Chick, 2004). People partici-pate in leisure activities in a long-term period obtained a higher score in at-tractiveness; the benefit and experience that one received from participating leisure activity may be varied accord-ing to time spent and attitude he/she has (Havitz & Howard, 1995; Gah-wiler & Havitz,1998). Further, Wiley, Shaw and Havitz (2000) pointed out that leisure involvement concerns with the meaning, importance and relative-ness that the participants received from leisure activities, which further influ-ence participants’ decision toward the activities. Huang, Tsai, and Lee (2014) conducted a study to compare different levels of participation and discovered that greater participation of leisure ac-tivities result in greater leisure bene-fits. Therefore, this study inferred that collegiate athletes participate leisure activities would receive leisure bene-fits.
Celsi and Olson (1988) revealed
that the degree of leisure involvement is positively correlated to the aware-ness of subjects. Mannel (1993) pos-ited that leisure involvement is posi-tively correlated to the experience of psychological tranquility, and further claimed that flow experience is essen-tial to leisure involvement. From the study conducted by Decloe, Karczyn-ski and Havitz (2009), they found that social faction, flow experience and situational involvement are factors of leisure behavior, and further discov-ered that the degree of involvement in different peers and situations would affect the interest toward leisure activi-ties. Study from Heo and King (2009) showed that experienced athletes tend to invest their time on training, compe-titions and travelling. According to the study conducted by Liu, Canedy and Tapps (2013) on athletes’ lifestyle un-veiled that athletes from different re-gions and areas obtained discrepancy in serious leisure characteristics. Also, athletes’ sport skill development, the gaining of social rewards, physical im-provements and self-determined en-hancement were found positively cor-relating to the pursuit of leisure activi-ties (Heo, Lee, Lundberg, McCormick & Chun, 2008). Therefore, this study inferred that athletes participate leisure activities would improve the training effect.
Leisure benefit is a subjective
concept, and it concerns with personal experiences and feeling. According to subjective evaluation, the benefits that people received from leisure activities may be varied. While participating lei-sure activities, positive feedback could positively affect the person himself/ herself and the society (Kao, 1995). The benefits of participating leisure activities are the relieve of stress and
The International Journal of Organizational Innovation Vol 10 Num 4 April 2018
329
enhanced development of both physi-cal and psychological abilities. Man-nell and Stynes (1991) proposed that people participate sports as leisure ac-tivities would be stimulated by many external factors, such as environment, activity types, time and mood. Further, study from Lin, Wong, and Ho (2013) discovered that satisfaction from lei-sure benefit reveals a positive relation with quality of life. Therefore, manag-ing leisure times and activities become important for collegiate athletes (Chen, Chen & Wu, 2004). According to Kuo (2008), leisure benefits have influences on training effect among elite athletes. Therefore, helping athletes regain con-fidence and self-assurance, participa-tion of leisure activities is important to training. Thus, this study inferred that athletes receive benefits from partici-pating leisure activities would promote their quality of life. Moreover, this study also inferred that training effects would be affected by leisure benefits.
According to World Health Or-
ganization, quality of life is individ-ual’s perception of self-goals, self-expectations, standards and care within a cultural value system under six as-pects: physical health, mental condi-tions, independence, social relations, self-beliefs and environments (Yao, 2002). Because athletes have been un-der a long-term stress, therefore their quality of life is under great influences. It is easy to distinguish athletes from non-athletes in the holistic health. Snyder and colleagues (2010) com-pared non-athletes with athletes and discovered that athletes are better in physical function, wellness, psycho-logical health and lower body pain; they are also highly active and have a greater sense of happiness. Meanwhile, athletes also perform better than non-
athletes in psychological, emotional and physical aspect. Athletes’ stressful emotions are often resulted from their strong will and these stressful emotions stir their physical health, psychological conditions, social relations, independ-ence, self-beliefs and surrounding en-vironments. According to Katelaris, Carrozzi and Burke (2003), physical health is often affected by quality of life. For elite athletes, performance is greatly related to quality of life that also being affected by any physical change, for instance, insomnia, lack of focus, or degrading in fitness perform-ance. Therefore, this study inferred that the promotion of quality of life of athletes would also bring forth the promotion of training effects.
Training effect is an interesting
issue to be inspected in leisure-related research as well. To inspect the effect of training, data collected from both pre-training and post-training are often compared. Performance excellency and victories in competition, training and periodization are constantly being the focus of the training program, how-ever, recovery (physical, mental and psychological) often remains neglected by coaches and athletes. Such neglect usually leads athletes to insufficient recovery and injuries. Coaches of col-legiate athletes often have a clear un-derstanding of how and why athletes succeeded or failed by inspecting the results of evaluation and competition, which lead to adjustment and im-provement. This is also the main rea-son that this study proposes training effects as the canonical variable.
On leisure involvement, the
causal relation models of leisure in-volvement and leisure benefits have been the issue of attention as well as

The International Journal of Organizational Innovation Vol 10 Num 4 April 2018
330
studies conducted and results contrib-uted. However, there are small re-search on leisure involvement, benefits to quality of life and training effect. Especially for elite athletes from dif-ferent categories and sports, what would be the effects on the physical and psychological condition if they are highly focusing on their training and neglecting the rest and recovery? Therefore, according on the aforemen-tioned studies, this study aims to inves-tigate the predictions and effects among leisure involvement, leisure benefits, quality of life and training effects in elite collegiate athletes of Taiwan. The present study also inves-tigates elite collegiate athletes’ leisure involvement, leisure benefits, quality of life and training effects, and applies the findings on individual and team sports. This study is expected to help and benefit coaches, athletes and teachers of athletics training and sports in different stages of schools.
The Purpose
From research motivation, the
purpose of the present research aims to explore, inspect and predict the rela-tionships and influences among leisure involvement, leisure benefits, quality of life and training effect.
Methodology
Subjects and Data
Subjects of this study were se-lected from random sampling, 538 col-legiate athletes participated 2016 Na-tional Collegiate Sports Game in Tai-wan. Among these athletes, 298 were males and 240 females; 142 college freshmen, 152 sophomores, 120 jun-iors, 110 seniors, and 14 from graduate
schools. These athletes, 27.52% have been training for 1-3 years, 18.40% for 4-5 years, 24.10% for 6-7 years, and 29.98% for more than 8 years. About training days per week, 7.5% trains 1-2 days/week, 13.52% trains 3 days/week, 24.81% trains 4 days/week, and 54.17% trains more than 5 days/week.
Pilot Testing and Formal Testing
In pilot testing, 250 scales were
distributed and 225 retrieved; 15 inva-lid questionnaires eliminated, which left 210 effective questionnaires, the effective response rate were 84%. Scales retrieved from pilot testing were analyzed and examined through item analysis, reliability analysis and valid-ity analysis to eliminate ineffective items. Formal version of these scales were then produced, scales adopted all obtain high factor loadings.
Tools
Questionnaires.
Scales used in the research were all Likert Scales (1: strongly disagree, 2: slightly agree, 3: agree, 4: mostly agree, 5: strongly agree).
The Leisure Involvement Scale
of Collegiate Athletes (LISCA) used in this research was adopted and modified from Leisure Involvement Scale by Kuo and Yen (2012). Two subscales are contained in this scale: life central-ity and attractiveness. Life centrality aimed to investigate the feeling occurs after participated leisure activities, not affected by other stimulants and felt the need to share the experience with others; attractiveness subscale investi-gates the attraction from leisure activi-ties to the ones participate.

The International Journal of Organizational Innovation Vol 10 Num 4 April 2018
331
The Leisure Benefits Scale of Collegiate Athletes (LBSCA) was adopted and modified from Leisure Benefits Scale by Kuo and Yen (2012). Two subscales are contained: life well-ness promotion and balanced life ex-periences; life wellness promotion aimed to investigate the experience of enhancing life qualities and giving meanings to life, while balanced life experiences investigate how stress-free of the lifestyle that participants have.
The Quality of Life Scale of Col-
legiate Athletes (QLSCA) was adopted and modified from Quality of Life Scale by Kuo and Yen (2012) as well. Three subscales are in the QLSCA: physical factors, social and environ-ment factors and psychological factors. Physical factors subscale investigates to the improvement of body condition after training; psychological factors subscale investigates the relaxation stage and process of collegiate athletes after training; social and environment factors subscale investigates the satis-faction of surrounding environment and social relations with others after training.
The Training Effect Scale of Col-
legiate Athletes (TESCA) was adopted and modified from the Training Effect Scale by Kuo (2008). Three subscales are in the TESCA as well: physical fit-ness, tactical ability and team spirit. Physical fitness investigates the im-provement of performance and abilities after training, and tactical ability inves-tigates the ability of enforcing strate-gies in competition and performance after training; team spirit investigates to the sense of co-operation with teammates after training.
Item Analysis.
Each scale was analyzed by crite-rion of internal consistency and corre-lation analysis from SPSS for Win-dows 18.0. Items with significant CR value and with correlation value greater than .50 was remained. The LISCA contains CR value 13.54-20.85, r value .64-.83 (p<.05). The LBSCA contains CR value 10.12-18.30, r value .61-.85, (p<.05). The QLSCA with CR value 9.87-23.01, r value .57-.83 (p<.05). The TESCA contains the CR value 14.57-24.68, r value .70-.87 (p<.05). Validity Analysis.
Principle factor analysis of ex-ploratory factor analysis was adopted to analyze the validity of scales. The Bartlett sphericity test was applied to all scales as well (LISCA, χ2 = 4957.92, KMO= .95; LBSCA, χ2= 7205.90, KMO= .96; QLSCA, χ
2=7158.75, KMO= .96; TESCA, χ
2=4825.92, KMO= .95). Factor load-ing of each item have achieved higher than .50 and the eigenvalue of each factor is greater than 1, corresponding to the requirement of factor analysis. For total variance explained of each scale, this study discovered that LISCA explained 68.02% of the vari-ance, for LBSCA explained 69.47%, QLSCA explained 70.17% and TESCA explained 81.44% of the vari-ance; the results of validity show the favorable validity of the scales.
Reliability Analysis.
The internal consistency reliabil-ity (Cronbach’s α) of scales and sub-scales were examined as well. The Cronbach α of the LISCA (full-scale) was .96, while the subscales ranged within .93-.94. The Cronbach α of LBSCA (full-scale) was .97, and the
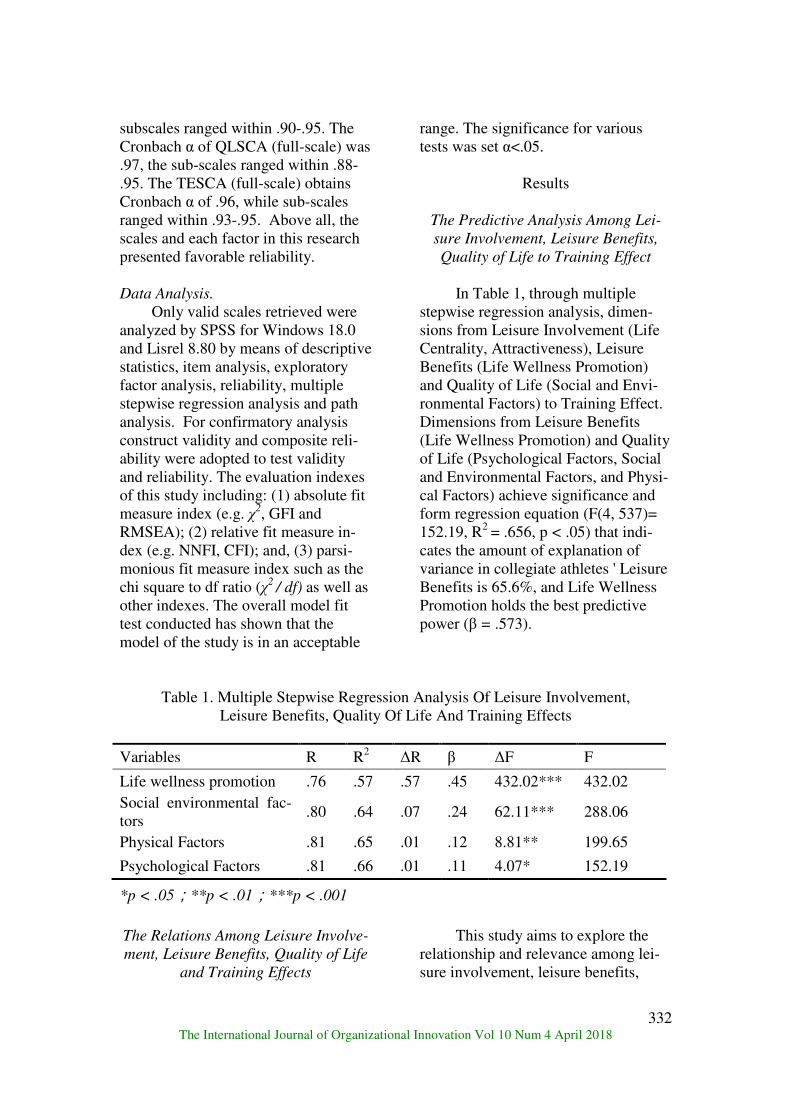
The International Journal of Organizational Innovation Vol 10 Num 4 April 2018
332
subscales ranged within .90-.95. The Cronbach α of QLSCA (full-scale) was .97, the sub-scales ranged within .88-.95. The TESCA (full-scale) obtains Cronbach α of .96, while sub-scales ranged within .93-.95. Above all, the scales and each factor in this research presented favorable reliability. Data Analysis.
Only valid scales retrieved were analyzed by SPSS for Windows 18.0 and Lisrel 8.80 by means of descriptive statistics, item analysis, exploratory factor analysis, reliability, multiple stepwise regression analysis and path analysis. For confirmatory analysis construct validity and composite reli-ability were adopted to test validity and reliability. The evaluation indexes of this study including: (1) absolute fit measure index (e.g. χ2, GFI and RMSEA); (2) relative fit measure in-dex (e.g. NNFI, CFI); and, (3) parsi-monious fit measure index such as the chi square to df ratio (χ2
/ df) as well as other indexes. The overall model fit test conducted has shown that the model of the study is in an acceptable
range. The significance for various tests was set α<.05.
Results
The Predictive Analysis Among Lei-
sure Involvement, Leisure Benefits,
Quality of Life to Training Effect
In Table 1, through multiple stepwise regression analysis, dimen-sions from Leisure Involvement (Life Centrality, Attractiveness), Leisure Benefits (Life Wellness Promotion) and Quality of Life (Social and Envi-ronmental Factors) to Training Effect. Dimensions from Leisure Benefits (Life Wellness Promotion) and Quality of Life (Psychological Factors, Social and Environmental Factors, and Physi-cal Factors) achieve significance and form regression equation (F(4, 537)= 152.19, R2 = .656, p < .05) that indi-cates the amount of explanation of variance in collegiate athletes ' Leisure Benefits is 65.6%, and Life Wellness Promotion holds the best predictive power (β = .573).
Table 1. Multiple Stepwise Regression Analysis Of Leisure Involvement, Leisure Benefits, Quality Of Life And Training Effects
Variables R R2 ΔR β ΔF F
Life wellness promotion .76 .57 .57 .45 432.02*** 432.02 Social environmental fac-tors
.80 .64 .07 .24 62.11*** 288.06
Physical Factors .81 .65 .01 .12 8.81** 199.65
Psychological Factors .81 .66 .01 .11 4.07* 152.19
*p < .05;**p < .01;***p < .001
The Relations Among Leisure Involve-
ment, Leisure Benefits, Quality of Life
and Training Effects
This study aims to explore the relationship and relevance among lei-sure involvement, leisure benefits,

The International Journal of Organizational Innovation Vol 10 Num 4 April 2018
333
quality of life and training effect of collegiate athletes, also construct the relations that verified by Structural Equation Modeling (SEM). Model Specification.
This research aimed to explore and construct the conceptual model of leisure involvement, leisure benefits, quality of life, and training effect in collegiate athletes. The following hy-pothesis were proposed.
Hypothesis 6-1: Leisure involvement
directly and positively effects lei-sure benefits.
Hypothesis 6-2: Leisure involvement
directly and positively effects quality of life.
Hypothesis 6-3: Leisure involvement
directly and positively effects training effect.
Hypothesis 6-4: Leisure benefits di-
rectly and positively effects qual-ity of life.
Hypothesis 6-5: Leisure benefits di-
rectly and positively effects train-ing effect.
Hypothesis 6-6: Quality of life directly
and positively effects training ef-fect.
According to effects of variables in
Structural Equation Modeling, vari-ables in this model were further ex-plained as follow.
(1) Exogenous latent variable.
Exogenous latent variable of this study is Leisure Involvement, which consists of the observed variables: At-tractiveness and Life Centrality (Table
2).
(2) Endogenous latent variable. Two endogenous variables are in
this study: mediating variables and re-sult variables.
(3) Mediating latent variables.
In this study, the mediating latent variables were Leisure Benefits and Quality of Life. Leisure Benefits were composed of the observed variables: Life Wellness Promotion and Balanced Life Experience; Quality of Life was composed of Psychological Benefits, Physiological Benefits, and Social & Environmental Benefits.
(4) Result latent variables.
Training Effect is the only result latent variable in this study, which composes of Physical Fitness, Tactical Abilities and Team Spirit (Table 2).
Analysis of Skewness and Kurtosis
In order to verify the theoretical model, Structural Equation Modeling with LISREL 8.80 was used in this study. Since the model verification was estimated and effected by sample distribution, therefore the method of estimation needs to be based on the distribution of sample. From table 3 shows that both skewness and kurtosis of the variables are in acceptable range (Huang, 2002; Kline, 1998); for skew-ness is ranging from -.82 to -.06 and kurtosis ranging from -.66 to .40. The result reveals that ML could be applied to the model estimation (Table 3).
Summary of Overall Model Test
Table 4 shows that the Chi-square Test of the model fails to reach significance (χ2 = 101.83, p > .05),
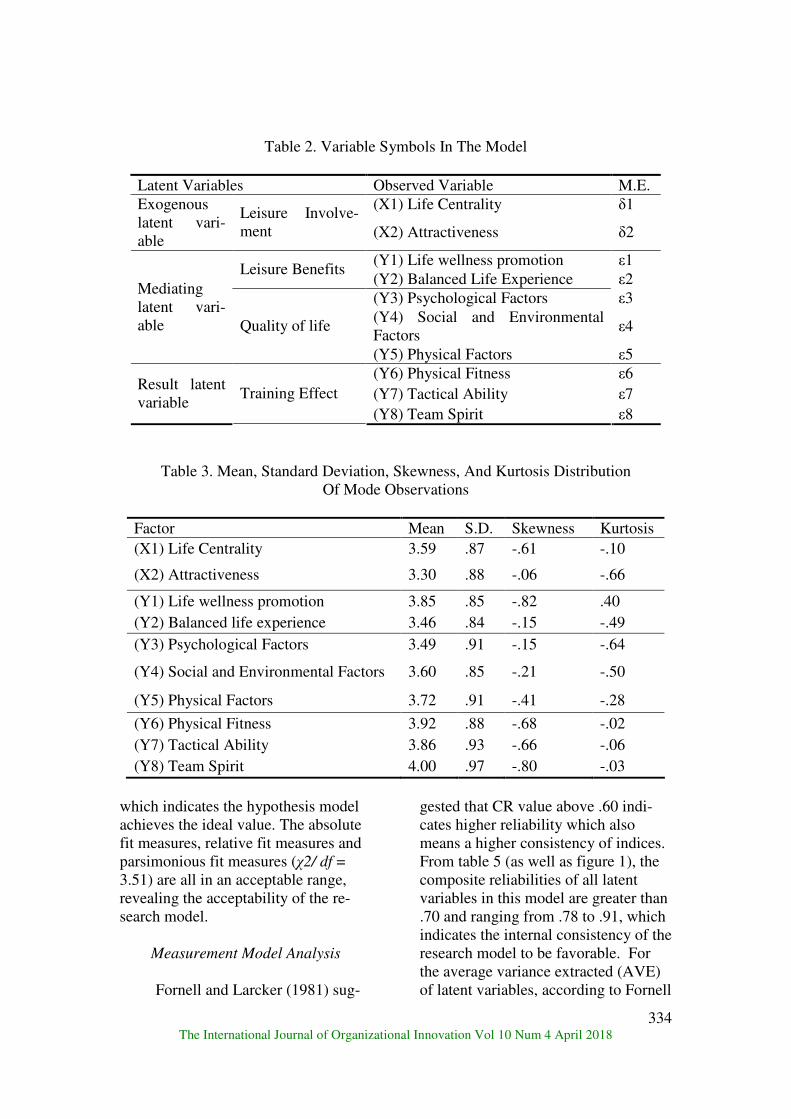
The International Journal of Organizational Innovation Vol 10 Num 4 April 2018
334
Table 2. Variable Symbols In The Model
Latent Variables Observed Variable M.E.
(X1) Life Centrality δ1 Exogenous latent vari-able
Leisure Involve-ment (X2) Attractiveness δ2
(Y1) Life wellness promotion ε1 Leisure Benefits
(Y2) Balanced Life Experience ε2 (Y3) Psychological Factors ε3 (Y4) Social and Environmental Factors
ε4
Mediating latent vari-able Quality of life
(Y5) Physical Factors ε5 (Y6) Physical Fitness ε6 (Y7) Tactical Ability ε7
Result latent variable
Training Effect (Y8) Team Spirit ε8
Table 3. Mean, Standard Deviation, Skewness, And Kurtosis Distribution Of Mode Observations
Factor Mean S.D. Skewness Kurtosis (X1) Life Centrality 3.59 .87 -.61 -.10
(X2) Attractiveness 3.30 .88 -.06 -.66
(Y1) Life wellness promotion 3.85 .85 -.82 .40 (Y2) Balanced life experience 3.46 .84 -.15 -.49 (Y3) Psychological Factors 3.49 .91 -.15 -.64
(Y4) Social and Environmental Factors 3.60 .85 -.21 -.50
(Y5) Physical Factors 3.72 .91 -.41 -.28
(Y6) Physical Fitness 3.92 .88 -.68 -.02 (Y7) Tactical Ability 3.86 .93 -.66 -.06 (Y8) Team Spirit 4.00 .97 -.80 -.03
which indicates the hypothesis model achieves the ideal value. The absolute fit measures, relative fit measures and parsimonious fit measures (χ2/ df = 3.51) are all in an acceptable range, revealing the acceptability of the re-search model.
Measurement Model Analysis
Fornell and Larcker (1981) sug-
gested that CR value above .60 indi-cates higher reliability which also means a higher consistency of indices. From table 5 (as well as figure 1), the composite reliabilities of all latent variables in this model are greater than .70 and ranging from .78 to .91, which indicates the internal consistency of the research model to be favorable. For the average variance extracted (AVE) of latent variables, according to Fornell
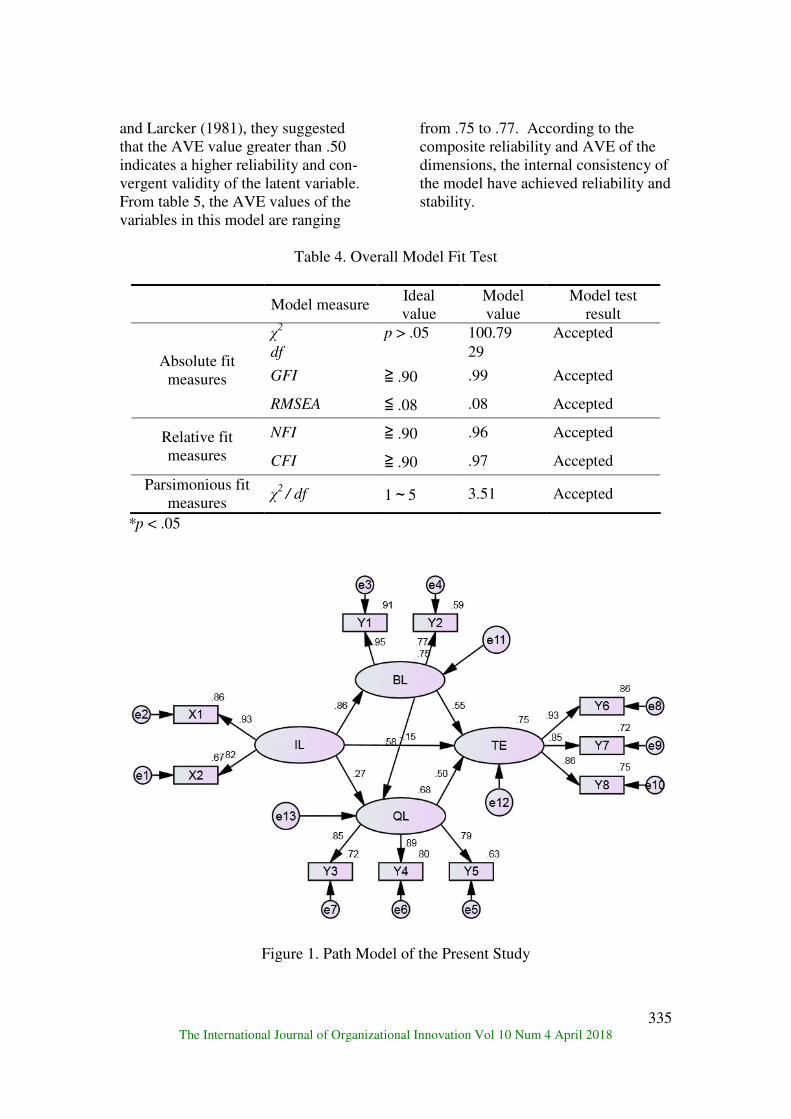
The International Journal of Organizational Innovation Vol 10 Num 4 April 2018
335
and Larcker (1981), they suggested that the AVE value greater than .50 indicates a higher reliability and con-vergent validity of the latent variable. From table 5, the AVE values of the variables in this model are ranging
from .75 to .77. According to the composite reliability and AVE of the dimensions, the internal consistency of the model have achieved reliability and stability.
Table 4. Overall Model Fit Test
Model measure Ideal value
Model value
Model test result
χ2 p > .05 100.79 Accepted
df 29
GFI ≧ .90 .99 Accepted Absolute fit
measures
RMSEA ≦ .08 .08 Accepted
NFI ≧ .90 .96 Accepted Relative fit measures CFI ≧ .90 .97 Accepted
Parsimonious fit measures
χ2
/ df 1~5 3.51 Accepted
*p < .05
Figure 1. Path Model of the Present Study
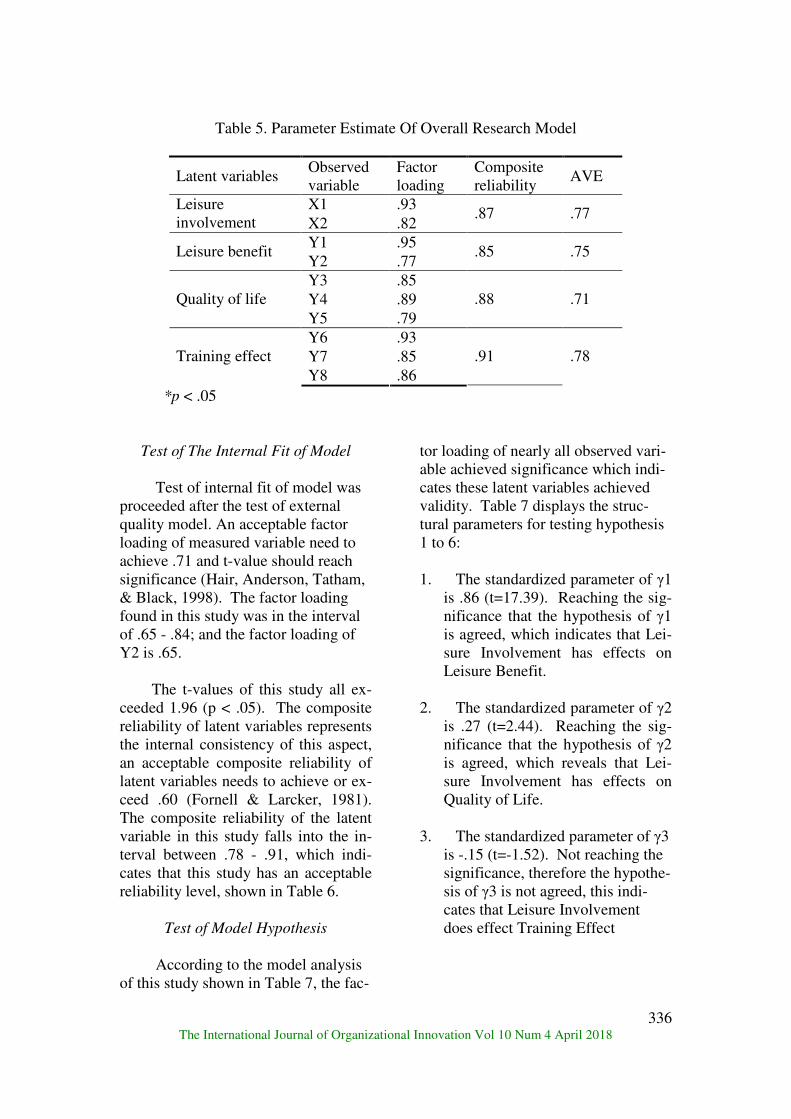
The International Journal of Organizational Innovation Vol 10 Num 4 April 2018
336
Table 5. Parameter Estimate Of Overall Research Model
Latent variables Observed variable
Factor loading
Composite reliability
AVE
X1 .93 Leisure involvement X2 .82
.87 .77
Y1 .95 Leisure benefit
Y2 .77 .85 .75
Y3 .85 Y4 .89 Quality of life Y5 .79
.88 .71
Y6 .93 Y7 .85 Training effect Y8 .86
.91 .78
*p < .05
Test of The Internal Fit of Model
Test of internal fit of model was proceeded after the test of external quality model. An acceptable factor loading of measured variable need to achieve .71 and t-value should reach significance (Hair, Anderson, Tatham, & Black, 1998). The factor loading found in this study was in the interval of .65 - .84; and the factor loading of Y2 is .65.
The t-values of this study all ex-
ceeded 1.96 (p < .05). The composite reliability of latent variables represents the internal consistency of this aspect, an acceptable composite reliability of latent variables needs to achieve or ex-ceed .60 (Fornell & Larcker, 1981). The composite reliability of the latent variable in this study falls into the in-terval between .78 - .91, which indi-cates that this study has an acceptable reliability level, shown in Table 6.
Test of Model Hypothesis
According to the model analysis of this study shown in Table 7, the fac-
tor loading of nearly all observed vari-able achieved significance which indi-cates these latent variables achieved validity. Table 7 displays the struc-tural parameters for testing hypothesis 1 to 6:
1. The standardized parameter of γ1
is .86 (t=17.39). Reaching the sig-nificance that the hypothesis of γ1 is agreed, which indicates that Lei-sure Involvement has effects on Leisure Benefit.
2. The standardized parameter of γ2
is .27 (t=2.44). Reaching the sig-nificance that the hypothesis of γ2 is agreed, which reveals that Lei-sure Involvement has effects on Quality of Life.
3. The standardized parameter of γ3
is -.15 (t=-1.52). Not reaching the significance, therefore the hypothe-sis of γ3 is not agreed, this indi-cates that Leisure Involvement does effect Training Effect
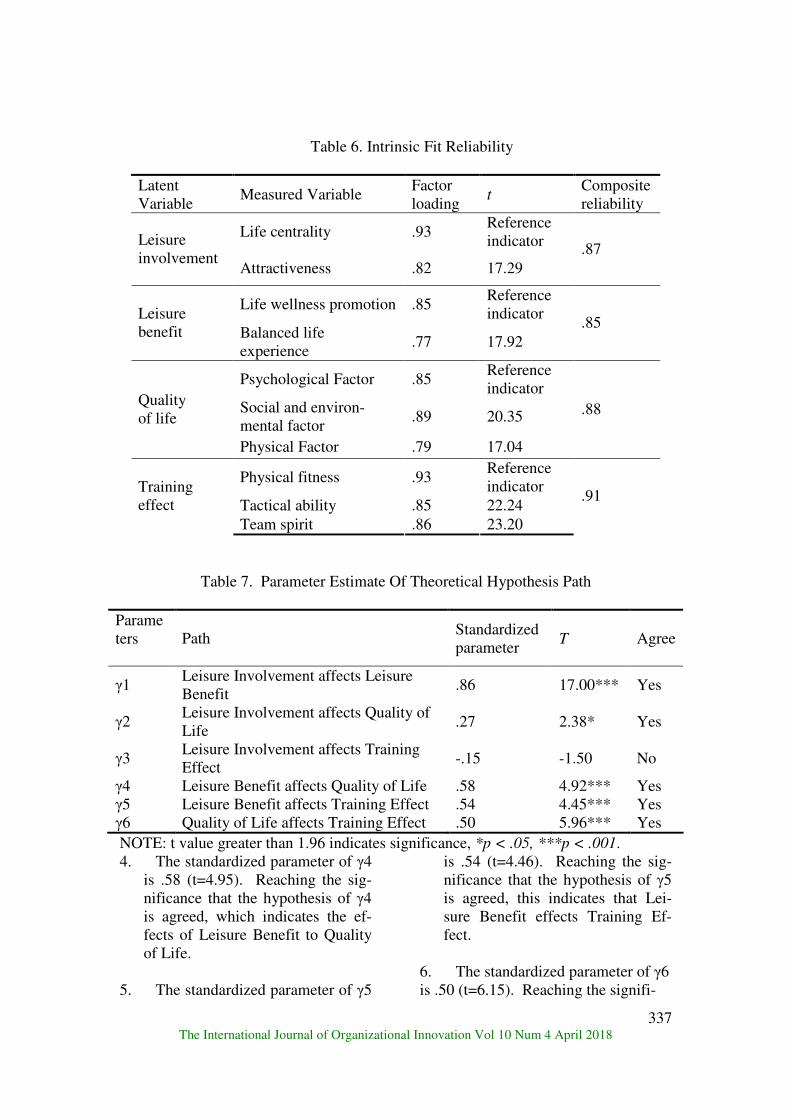
The International Journal of Organizational Innovation Vol 10 Num 4 April 2018
337
Table 6. Intrinsic Fit Reliability
Latent Variable
Measured Variable Factor loading
t Composite reliability
Life centrality .93 Reference indicator Leisure
involvement Attractiveness .82 17.29
.87
Life wellness promotion .85 Reference indicator Leisure
benefit Balanced life experience
.77 17.92 .85
Psychological Factor .85 Reference indicator
Social and environ-mental factor
.89 20.35 Quality of life
Physical Factor .79 17.04
.88
Physical fitness .93 Reference indicator
Tactical ability .85 22.24 Training effect
Team spirit .86 23.20
.91
Table 7. Parameter Estimate Of Theoretical Hypothesis Path
Parameters Path
Standardized parameter
T Agree
γ1 Leisure Involvement affects Leisure Benefit
.86 17.00*** Yes
γ2 Leisure Involvement affects Quality of Life
.27 2.38* Yes
γ3 Leisure Involvement affects Training Effect
-.15 -1.50 No
γ4 Leisure Benefit affects Quality of Life .58 4.92*** Yes γ5 Leisure Benefit affects Training Effect .54 4.45*** Yes γ6 Quality of Life affects Training Effect .50 5.96*** Yes NOTE: t value greater than 1.96 indicates significance, *p < .05, ***p < .001. 4. The standardized parameter of γ4
is .58 (t=4.95). Reaching the sig-nificance that the hypothesis of γ4 is agreed, which indicates the ef-fects of Leisure Benefit to Quality of Life.
5. The standardized parameter of γ5
is .54 (t=4.46). Reaching the sig-nificance that the hypothesis of γ5 is agreed, this indicates that Lei-sure Benefit effects Training Ef-fect.
6. The standardized parameter of γ6 is .50 (t=6.15). Reaching the signifi-

The International Journal of Organizational Innovation Vol 10 Num 4 April 2018
338
cance that the hypothesis of γ6 is agreed, which indicates that Quality of Life effects Training Effect.
Discussion
According to the test of collinear-ity, it reveals that the tolerance values have all exceeded .400, and the VIF values below 2.578. Therefore, the multiple stepwise regression analysis of this study was found to be freed from collinearity. Dimensions from leisure benefits (life wellness promo-tion, β = .449, p < .001) and quality of life (social and environmental factors, β = .235, p < .001; physical factors, β = .119, p < .01; psychological factors, β = .111, p < .05) were found capable of predicting training effects, and life wellness promotion serves as the best predictor of training effects. This study discovered that the life wellness pro-motion of collegiate athletes relates to stress-releasing and relaxing, also the gaining of trust and supports from partners and friend.
Social and environmental factors
in quality of life is important to colle-giate athletes, as the results showed that collegiate athletes often felt confi-dent about themselves when feeling satisfied about their living environ-ments and relationships with peers; such satisfaction and confidence affect their training effects and eventually lead to improvements on performance in competitions. For psychological fac-tors, it is revealed that when athletes are focused and relaxed, they will have enough stamina and energy to manage the physical fatigue from training, which leads to satisfaction on their quality of life and training effects. The finding of the study also corresponds to the research conducted by Kuo
(2008) in which stated life wellness promotion obtains a greater explana-tory power to collegiate athletes’ train-ing effect.
Originally, this study hypothe-
sized that elite collegiate athletes with greater participation of leisure activi-ties would result better training effects, however the result shows differently. The findings of this study discovered that leisure involvement is not related to better training outcome. This study infer that such result relates to the un-passionate and uninterested attitude toward leisure activities of Taiwanese elite athletes.
The relevance among leisure in-
volvement, leisure benefit, quality of life and training effect of collegiate athletes in this study will be discussed as follow:
1. This study discovered that colle-giate athletes’ leisure involvement has direct effect on leisure benefit, which supports the first hypothesis, revealing a positive correlation of leisure in-volvement to leisure benefits. Leisure involvement is able to promote physi-cal, psychological, and social effect to a person’s wellness in which leads to the promotion of self-worth and leisure benefit (Chen, Cheng, & Lin, 2013). And this research found that collegiate athletes’ leisure involvement achieves a high significance and positive corre-lation with leisure benefits, which also corresponds with previous research on related issues (Currier, 2004; Fun, 1997; Huang, 2013; Kujala, Kaprio, Sarna, & Koskenvuo, 1998; Kuo, 2013; Lu & Argyle, 1994; Tinsley & Tinsley, 1986). 2. The hypothesis of the direct posi-

The International Journal of Organizational Innovation Vol 10 Num 4 April 2018
339
tive correlation of leisure involvement to quality of life was supported by the result of this study as well. Leisure in-volvement is able to promote the feel-ing of happiness and relieve the pres-sure from daily life, also helps main-taining psychological and physical health state, further creating the indis-pensable factor of quality of life. Ac-cording to Chuang, Li and Lai (2009), leisure involvement effects on people’s daily life, especially on improving physical/psychological health, enrich-ing meaning of life and expanding vi-sion, which eventually leads to the promotion of overall quality of life. Agyar (2014) postulated that leisure involvement promotes the satisfaction of life, which is found to be corre-sponded with the result of this study. The result of this study further found that higher frequency of leisure activi-ties participation would produce more positive effects on health and thus lead to a better quality of life. 3. No correlation found between leisure involvement and training effect, which the third hypothesis of this study would not be supported and approved. Previous studies found that leisure ac-tivities involvement was able to relieve negative psychological conditions and bring forth positive effects (Lu, 2002; Siegenthaler & Lam, 1992; Kim, Scott & Crompton, 1997). But, the result of this study shows different results, the reason may be that Taiwanese colle-giate athletes excessively focus on training and ignore the importance of leisure activity participation, which leads them unable to have a clear sense of leisure benefits that promote their training effect and performance. 4. This study discovered that leisure benefits obtain direct and positive ef-
fect on quality of life, which supports the fourth hypothesis of this study. Which means that athletes’ quality of life is influenced by the leisure benefits they gained. Leisure benefits obtain the function of releasing stress and pro-moting physical and mental health, which leads to a better performance in competition and quality of life (Kuo, 2013). Further it is worth mentioning that the results of this study correspond with previous research findings that investigated the correlation of leisure benefits to quality of life and found that greater leisure benefits lead to bet-ter quality of life (Kao, Wang & Lin, 2009; Kao & Chen, 2012; Kuo & Sun, 2011). 5. This study also discovered that leisure benefit has directly and posi-tively affected training effects, which support the fifth hypothesis as well. This study found that athletes obtain better performance in training and the following effect when they devote more time in leisure activities. This result shares correspondence with other research relate to this issue, which pointed out that leisure benefits influence physical activities on behav-ior development; leisure benefit from physical activities promotes physical performance development, further en-hances physical coordination. (Kao & Chen 2011; Kuo & Kao, 2008). There-fore, it is recommended that collegiate athletes to participate leisure activities to enhance training effect. 6. The last hypothesis of this re-search concerning the positively ef-fects of quality of life on training ef-fect. The result of this study also sup-ports this hypothesis, which stated that quality of life is positively correlated to training effect. It is worth mention-

The International Journal of Organizational Innovation Vol 10 Num 4 April 2018
340
ing the correspondence between this study result and other studies related to this issue, which found that physical activities lead to a better quality of life, and further pointed out that there is a positive relation between quality of life and exercise (Anokye, Trueman, Green, Pavey & Taylor, 2012; Mok-htari& Parvane, 2012). By inspecting the quality of life of collegiate athletes, this study has found that athletes with a better quality of life will have a better training effect.
Conclusion and Suggestions
Conclusion
This study discovered that higher life wellness promotion, greater satis-faction on psychological, physical and social and environmental factors will lead to a better training effect, and life wellness promotion is the most influ-ential factor.
This study found that the leisure
involvement of elite collegiate athletes directly and positively effects leisure benefits and quality of life, but not training effects; leisure benefits di-rectly and positively effects quality of life and training effect. Also, quality of life directly and positively affects training effect as well.
Suggestions
According to the conclusion, the following suggestions are for colle-giate athletes and coaches, athlete ad-ministrators, schools, physical educa-tion teachers and parents:
1. `This study suggests athletes should focus on their own life wellness promotion, psychological, physical,
and social and environmental condi-tions and status during or after leisure activities, especially the satisfaction. Achieving life wellness promotion, psychologically, physically, socially and environmentally satisfaction will promote quality of life of athletes, as the leisure benefit and quality of life is promoted, athletes tends to perform better in competitions. 2. Further, this study suggests that it is important for athletes to fulfill their leisure time with leisure activities, which lead to better competition per-formance. This study shows that lei-sure involvement did no positively af-fect training effects may result from the amount of time on training that has compressed time spent on leisure ac-tivities. But there is still a need for athletes to participate leisure activities, because leisure involvement was found to positively affect leisure benefits and quality of life. Leisure activities were also found to release athletes’ stress and pressure from training and compe-tition. 3. Moreover, athletes should care-fully plan their post-training and post-competition leisure activities. The purpose aims to relieve stress and anxiety, and make sure that athletes have a balanced psychological and physical conditions. Leisure involve-ment could ensure athletes to have a good quality of life and a better per-formance in competition. As for coaches and teachers, they should learn how to plan and manage athletes’ lei-sure activities as well, and pay a close attention on types of activities athletes participate, in regard to safety and benefits.
The International Journal of Organizational Innovation Vol 10 Num 4 April 2018
341
Reference Agyar, E. (2014). Contribution of per-
ceived freedom and leisure satis-faction to life satisfaction in a sample of Turkish women. Social
Indicators Research, 116(1), 1-15. doi:10.1007/s11205-013-0268-0
Anokye, N. K., Trueman, P., Green,
C., Pavey, T. G., & Taylor, R. S. (2012). Physical activity and health related quality of life. Bio-
Med Central Public Health,
12:624. doi:10.1186/1471-2458-12-624.
Celsi, R. L., & Olson, J. C. (1988). The
role of involvement in attention and comprehension processes.
Journal of Consumer Research,
15(2), 210-224. Chen, C. C., Cheng, C. H., & Lin, S.
Y. (2013). The relationship among leisure involvement, leisure bene-fits, and happiness of elementary school teachers in Tainan county. International Research in Educa-
tion, 1(1), 29-51. http://dx.doi.org/ 10.5296/ire.v1i1.3970
Chen, H. J., Chen, L. S., & Wu, C. H.
(2004). The obstruction factors re-search of participating leisure ac-tivities among junior/senior high school track and field athletes in Taiwan northern area .Yu Da Aca-
demic Journal, 8, 215-228. Chuang, Y. U., Li, W. L., & Lai, W. L.
(2009, May). The relationships be-
tween Leisure involvement, work-
ing pressure, and quality of life-
For example of the motor vehicle's
public servants. Paper presented at Conference of Advanced Sports
Career Management 2009, Tai-wan, Aletheia University, College of Tourism, Leisure and Sports, Sport Business Management, re-trieved from http://ir.lib.au.edu.tw/ dspace/handle/987654321/4753
Currier, J. (2004). Motherhood, stress
and the exercise experience: Free-dom or constraint? Leisure Stud-
ies, 23(3), 225-242. Decloe, M. D., & Kaczynski, A. T., &
Havitz, M. E. (2009). Social par-ticipation, flow and situational in-volvement in recreational physical activity. Journal of Leisure Re-
search, 1(41), 73-90. Fornell, C., & Larcker, D. F. (1981).
Evaluating structural equation models with unobservable vari-ables and measurement error. Journal of Marketing Research,
18(1), 39-50. Fun, J. L. (1997). Principles and labs
for fitness and wellness. Taipei: Han-Wen.
Gahwiler, P., & Havitz, M. E. (1998).
Towards an understanding of lei-sure social worlds, involvement, psychological commitment, and behavioral loyalty. Leisure Sci-
ences, 20(1), 1-23. Gunter, B., & Gunter, N. (1980). Lei-
sure styles: A conceptual frame-work for modern leisure. Socio-
logical Quarterly, 21(3), 361-374. Hair, J. F., Anderson, R. E., Tatham,
R. L., & Black, W. C. (1998). Multivariate data analysis (5th
ed.). Upper Saddle River, NJ: Prentice-Hall.
The International Journal of Organizational Innovation Vol 10 Num 4 April 2018
342
Havitz, M. E., & Howard, D. R. (1995). How enduring is enduring involvement? A seasonal examina-tion of three recreational activities. Journal of Consumer Psychology,
4(3), 255-276. Heo, J., & King, C. (2009). Senior
games as serious sport tourism. Journal of Research, 4 (2), 6-9.
Heo, J., Lee, Y., Lundberg, N.,
McCormick, B. P., & Chun, S. (2008). Adaptive sport as serious leisure: Do self-determination, skill level, and leisure constraints matter? Annual in Therapeutic
Recreation, 16, 31-38. Huang, C. E., Tsai, C. Y., & Lee, S. C.
(2014). A study of the influence of college students’ exercise and lei-sure motivations on the leisure benefits - Using leisure involve-ment as a moderator. International
Journal of Social, Behavioral,
Educational, Economic, Business
and Industrial Engineering, 8(8), 2419-2423.
Huang, F. M. (2002). Theory and
Practice of Structural Equation
Modeling. Taipei City: Wunan. Huang, Y. T. (2013). A study on the
relationships between leisure ac-tivity involvement, well-being, the benefits of serious leisure activity, and sports volunteer self-actualization in the Changhua na-tional games. The Journal of Hu-
man Resource and Adult Learning,
9(1), 12-25. Kao, C. H. & Chen, Y. T. (2012). A
study on early childhood teachers' motivation of participating in rec-
reational sports, leisure benefit, free time management, and quality of life. Childhood Education Re-
search, 4, 33-58. Kao, C. H. (1995). A three-factor
model of leisure benefits. Journal
of Outdoor Recreation Study, 8(1),
67-78。 Kao, C. H., & Chen, Y. T. (2011). A
study of young children's partici-pation in physical activity items, leisure efficiency, and behavioral development from the perspective of young children's parents in Taipei city. Early Childhood Edu-
cation Research, 3, 41-58. Kao, C. H., Wang, H. H., & Lin W. H.
(2009). A study of participative motives of sport club, leisure effi-ciency, life quality and scholarship achievement in universities. Chung Cheng Physical Education
Journal. 1(2), 47-62. Katelaris, C. H., Carrozzi, F. M., &
Burke, T. V. (2003). Allergic rhino conjunctivitis in elite ath-letes: Optimal management for quality of life and performance. Sports Medicine, 33(6), 401-406.
Kim, S. S., Scott, D. L., & Crompton,
J. L. (1997). An exploration of the relationships among social psy-chological involvement, behavior involvement, commitment, and fu-ture intentions in the context of bird watching. Journal of Leisure
Research, 29(3), 320-341. Kline, R. B. (1998). Principles and
practice of structural equation
modeling. NY: The Guilford Press.

The International Journal of Organizational Innovation Vol 10 Num 4 April 2018
343
Kujala, U. M., Kaprio, J., Sarna, S., & Koskenvuo, M. (1998). Relation-ship of leisure-time physical activ-ity and mortality: The Finnish twin cohort. Journal of the American
Medical Association, 279(6), 440-444. http://dx.doi.org/ 10.1001/jama.279.6.440
Kuo, C T., & Kao, J. C. (2008). Col-
leges’ elite athletes’ leisure par-ticipation, free-time Management, leisure efficiency, and training ef-fects. Journal of National Taiwan
Sports University, 19(2), 51-72. Kuo, C. H. (2008). A study of the lei-
sure participation, free time man-agement, leisure benefits and training effect of elite athletes in colleges (Doctoral dissertation). Retrieved from http://ir.ntsu.edu. tw/handle/987654321/1028
Kuo, C. H., & Yen, H. Y. (2012). Re-
search of leisure involvement and job satisfaction-An example of Chia-Yi city, creating a sport is-land by sports commission in Ex-ecutive Yuan. Journal of both
sides between Taiwan strait
Physical Education and sports,
6(1), 15-29. Kuo, C. T. (2013). Leisure involve-
ment, leisure benefits, quality of life, and job satisfaction. Interna-
tional Review of Management and
Business Research, 2(2), 421-428. Kuo, C. T., & Sun, M. L. (2011).
Study on the recreational con-straints, leisure benefits, job stress, and quality of life for kindergarten teachers. International Journal of
Organizational Innovation, 3 (3), 155-171.
Kyle, G., & Chick. G. (2004). Endur-ing leisure involvement: The im-portance of personal relationships. Leisure Studies, 23(3), 243-266.
Leung, L., & Lee, P. S. N. (2005).
Multiple determinants of life qual-ity: The roles of internet activities, use of new media, social support, and leisure activities. Telematics
and Informatics, 22, 161-180. doi: 10.1016/j.tele.2004.04.003
Lin, Z. R., & Huang, C. Y. (2005). A
study on teenage depression and leisure sport benefits. Quarterly of
Chinese Physical Education,
19(4), 26-31. doi:10.6223/qcpe. 1904.200512.1304
Liu, H. L., Caneday, L., & Tapps, T.
(2013). An exploratory study of serious leisure and lifestyle for amateur athletes. The Cyber Jour-
nal of Applied Leisure and Rec-
reation Research, 16 (3), 13-22. Lu, J. H. (2002). Regular exercises,
mental health, and quality life. Na-
tional Sports Quarterly, 31(1), 60-73.
Lu, L., & Argyle, M. (1994). Leisure
satisfaction and happiness as a function of leisure activity. Kaoh-
siung Journal Medicine Science,
10, 89-96. Mannel, R. C., & Stynes, D. J. (1991).
A retrospective: the benefits of lei-sure. In B. L. Driver, P. J. Brown & G. L. Peterson (Eds.), Benefits
of leisure (pp. 461- 473). Stage College, PA: Venture Publishing.
Mannell, R. C. (1993). High invest-
ment activity and life satisfaction
The International Journal of Organizational Innovation Vol 10 Num 4 April 2018
344
among older adults. In J. R. Kelly (Eds.), Activity and Aging: Staying
Involved in Later Life (pp. 125–145). Newbury Park, CA: Sage.
Mokhtari, R., & Parvane, O. F. (2012).
An analysis of the quality of life of participants in sport for all. Inter-
national Research Journal of Ap-
plied and Basic Sciences, 3(9), 1891-1896.
Peter, J. P., & Olson, J. C. (1987).
Consumer behavior: Marketing
strategy perspectives. Home-wood, IL: Irwin.
Quaresma, A. M. M., Palmeira, A. L.,
Martins, S. S., Minderico, C. S., & Sardinha, L. B. (2015). Psychoso-cial predictors of change in physi-cal activity and quality of life in the PESSOA program: A school-based Intervention study. Archives
of Exercise in Health Disease 5 (1-2): 366-376.
Siegenthaler, K. L., & Lam, T. C. M.
(1992). Commitment and ego-involvement in recreational tennis. Leisure Sciences, 14(4), 303-315.
Snyder, A. R., Martinez, J. C., Bay, R.
C., Parsons, J. T., Sauers, E. L., & Valovich McLeod, T. C. (2010). Health-related quality of life dif-fers between adolescent athletes and adolescent nonathletes. Jour-
nal of Sport Rehabilitation. 19(3), 237-248.
Su, C. L., Lee, C. L., & Shinger, H. S.
(2014). Effects of involvement in recreational sports on physical and mental health, quality of life of the elderly. Anthropologist, 17(1), 45-52.
Tinsley, H. E. A., & Tinsley, D. J.
(1986). A theory of the attributes, benefits and causes of leisure ex-perience. Leisure Sciences, 8(1), 1-45.
Wiely, C. G. E., Shaw, S. M., &
Havitz, M. E. (2000). Men and women’s involvement in sport: An examination of the gendered as-pects of leisure involvement. Lei-
sure Sciences, 22(1), 19-31. Yao, K. P. (2002). Introduction of the
quality of life: concepts and meas-urement. Formosan Journal of
Medicine, 6 (2), 183-192. Zaichkowsky, J. L. (1985). Measuring
the involvement construct. Journal
of Consumer Research, 12(3), 341-352.
The International Journal of Organizational Innovation Vol 10 Num 4 April 2018
345
FEASIBILITY ANALYSIS OF USING HIGHWAY GUARDRAILS TO PRODUCE CLEANED CARBON DIOXIDE TO NOURISH
ECONOMIC PLANTS
Jung-Hsiang Lai
Ph.D. Student, Department of Business Administration,
Nanhua University, Taiwan
Po-Yu Chen
Associate Professor, Department of Advertising and Strategic Marketing,
Ming Chuan University, Taiwan
Miao-Sheng Chen
Chair Professor, Department of Business Administration,
Nanhua University, Taiwan
Hsien-Bin Wang*
Associate Professor, Graduate Institute of Public Affairs Management,
TransWorld University, Taiwan
*(Corresponding Author, [email protected])
Abstract
Gaseous waste recovery is an important undertaking to be developed, especially the
recycling of Carbon Dioxide from automobile emissions. The extent of harm of the
pollutant in automobile emissions shall be measured not only by how much the pol-
lutant can be eventually cleaned, but also by how long the duration from the point of
time the contaminant generated to the point of time the contaminant cleaned. The dust
absorbing chamber and wet-dust cleaning pipes with cyclone power can be mounted
on highway guardrails powering by solar energy. Once a contaminant is generated, it
is absorbed, and the cleaned Carbon Dioxide is produced. This framework of convert-

The International Journal of Organizational Innovation Vol 10 Num 4 April 2018
346
ing harmful air polluted Carbon Dioxide into beneficial cleaned Carbon Dioxide is
more precious for Taiwan, due to its insufficient natural resources.
Keywords: Greenhouse Effect; Cyclonic Dust Absorption; Wet Dust Cleaning
Background
The recovery of solid waste has been
considerably effective in Taiwan, which is
reflected by the situation that incinerators
have no waste to burn in recent years
(Chen & Chen, 2012). However, gaseous
waste recovery is an important undertak-
ing to be developed. CO2 (Carbon Diox-
ide) is the major factor in greenhouse gas
composition, which causes the green-
house phenomenon. As CO2 is generated
mainly by using fossil fuels (coal, petro-
leum, natural gas), the Kyoto Protocol
specifies that the future CO2 emissions of
various countries must return to the 2005
emissions by 2020, and 2025 emissions
must return to the emission standard of
2000. However, according to Taiwan's
CO2 emission data in recent years (Chen
& Chen, 2012), in order to return to the
2005 CO2 emissions (288.8 million MT),
the government must make drastic CO2
reduction policies, otherwise in the cur-
rent development trend, the annual CO2
emission of Taiwan will far exceed the
aforesaid target value in the future.
CO2 Emission per Capita of Taiwan and
Relevant Countries
According to the reference (Chen &
Chen, 2012), the U.S. has the highest an-
nual CO2 emission per capita, which is
one of the reasons the U.S. still refuses to
sign the Kyoto Protocol. Taiwan’s CO2
emission per capita was lower than that of
Japan before 1997, but higher than that of
Japan after 1997. The CO2 emission per
capita grew rapidly in Taiwan, China, and
Korea (Chen & Chen, 2012), meaning the
economic development in these three re-
gions still highly depend on energy-
consuming industries. There is slight dif-
ference among the U.S., Japan, and Hong
Kong in CO2 emissions per capita. Singa-
pore's CO2 emission decreased from 15.41
MT in 1990 to 6.39 MT in 2009, and the
effect was outstanding. Taiwan's CO2
emissions changed inversely to Singa-
pore's, from 5.88 MT in 1990 to 11.58
MT in 2000. It seems that Taiwan only
has three policies to improve severely
worsening CO2 emissions, including Pol-
icy 1: improving the energy structure;
Policy 2: readjusting the industrial struc-
ture; and Policy 3: cleaning CO2 directly
for the photosynthesis of economic crops,
changing harmful CO2 into beneficial
CO2.
Regarding Policy 1, as the demand
The International Journal of Organizational Innovation Vol 10 Num 4 April 2018
347
for a nonnuclear homeland rises, only re-
newable energy can be developed. Among
the renewable energy sources, wind en-
ergy is limited by high cost, as wind en-
ergy will result in low-frequency noise
and landscape problems. Hydraulic en-
ergy is limited to water resources. Waste
energy is confronted by insufficient
sources. In recent years, as the recycling
classification is effective in Taiwan, in-
cinerators have no waste to burn. Thus,
biomass energy becomes a unique item
that may be developed among numerous
renewable energy sources. According to
the encouraging afforestation efforts (for-
estation is subsidized with NT$90,000 per
hectare) being implemented in Taiwan,
importing the barbadosnut as an encour-
aged tree species, which can produce bio-
diesel, is one of the energy policies the
government shall consider.
Regarding Policy 2, as Taiwan's en-
terprises are mostly small and medium-
sized enterprises, their capital capacity is
relatively small, and their products must
be made from or integrated with high en-
ergy-consuming low-cost primary re-
sources for marketability. Therefore, Tai-
wan is unlikely to readjust the industrial
structure in the near future. Only Policy 3,
cleaning CO2 directly, may be adopted;
which is the focus of this study.
Use of Cleaned CO2
CO2 is the principal raw material for
the photosynthesis of crops, as the organic
substances formed by photosynthesis ac-
count for 90%~95% of the total solid
yield of crops, while only 5%~10% of
substances are supplied from soil and fer-
tilizer. Carbon and oxygen contents with
the highest solid density ratio are derived
from CO2, which has, at least, the follow-
ing kinds of use:
Planting Vegetables and Fruits
Taking cucumber planting in Taiwan
as an example, there are five effects (Yao
& Tian, 2008): (1) promoting the photo-
synthetic rate of vegetables; (2) increasing
vegetable biomass (plant weight, leaf
thickness, leaf area); (3) increasing fruit
set percentage of fruit and vegetables; (4)
increasing vegetable yield (growth and
development); (5) upgrading vegetable
quality (color and taste).
Cultivating Petroleum Plants with
Cleaned CO2
Petroleum plants include trees with
sap that can be made into diesel oil, bio-
diesel that can be abstracted from tree
seeds, and algae that contains petroleum.
A particular tree able to produce "pe-
troleum" was found in the Brazilian tropi-
cal rain forest, known as the "Copaiba
tree", which is an evergreen tree with
wide varieties, is as tall as 20-25 m, and
can be exploited once every 1.5 to 2 years.
A small hole with a diameter of about 5

The International Journal of Organizational Innovation Vol 10 Num 4 April 2018
348
cm is drilled into the trunk, and golden
yellow oily sap flows out within 1-2 hours.
A Copaiba tree with a diameter of 1-1.5 m
can produce 15-20 L of sap each time,
and the chemical composition of the sap
is similar to diesel oil, thus, it can be used
as diesel oil without refining (Yao & Tian,
2008).
The barbadosnut (also known as the
small tung tree, which scientific name is
Jatropha Curcas L.), from which biodiesel
can be extracted from the seed, was tested
in Miaoli County, Taiwan. The barba-
dosnut seedling is grown in 3 years, and
biodiesel can be extracted from its seeds;
during its average 50 year growth, the
barbadosnut absorbs a great deal of CO2
in the growing process, as the seed har-
vest increases with CO2. If the encourag-
ing forestation tree species of the 20-year
green sea project, as implemented by the
government since March 2008, included
barbadosnut, the average net income per
farmer from planting barbadosnut was
NT$304,760/year (Yang & Chen, 2011).
During the Japanese occupation, in order
to supply aircraft fuel for World War II,
Euphorbiaceae wood oil trees were
planted in north central Taiwan in a
planned manner, and there are 4,000 hec-
tare, which are tens of years old, wood oil
trees at present. This is an advantage of
Taiwan’s ability to produce biodiesel in
the short-term, as the yield per hectare is
about 10 MT, the bone-dry kernel oil con-
tent is 55%, and if it is nourished with
cleaned CO2, the yield will increase. As
the fruit ripening time of tungs is incon-
sistent, collection has high labor costs.
The seed collection cost of tall tungs is
much higher than that of the short barba-
dosnut (small tung).
Japanese research and development
personnel extracted petroleum from a type
of limnetic algae, which has high CO2 ab-
sorbsion, and the extracted petroleum has
high heating value and low nitrogen and
sulfur contents. In addition, the kelp con-
tains high CH4 content; if cleaned CO2
assists large-scale culture in the sea area,
as the leaves are mostly on the sea surface,
there can be three mechanized harvests
annually (Perkins, 2009)
Cleaned CO2 Help the Greenhouse Cul-
ture Vegetables and Fruits
The CO2 concentration in the atmos-
phere is about 0.03% (300mg/kg). With
daylight substituting sunlight in a green-
house to cultivate vegetables and fruits,
the CO2 concentration is sometimes insuf-
ficient. Thus, the growth and yield rate of
vegetables and fruits is reduced, but the
ventilation system can help. However, in
cold winters, the ventilation of cold air
will reduce the temperature, which affects
the growth rate of vegetables and fruits.
The only solution is to import cleaned
CO2 into the greenhouse.
Theoretically, in the complete com-
The International Journal of Organizational Innovation Vol 10 Num 4 April 2018
349
bustion of gasoline and diesel oil with
free of sulfur, nitrogen and lead pollution
sources, the hydrocarbon chain in the fuel
is restructured with oxygen to form harm-
less CO2 and water. With rising environ-
mental considerations, metal pollutions,
such as lead pollution, in Taiwanese pro-
duced oil products, have been greatly re-
duced. Therefore, besides CO2, the main
constituents of gas from vehicles running
on the highway are unburnt HC, S, and N
in the exhaust gas, as well as the particles
resulted from the friction between tires
and the ground.
Pollution Gases Generated in Vehicle
Running Process
CO2 is formed by one unit of carbon
and two units of oxygen, and is odorless
and tasteless. While CO2 is the first cause
of the greenhouse phenomenon, strictly
speaking, CO2 is not a pollutant, but is
actually the source of the fiber compo-
nents for roots, stems, leaves, and fruit
after the photosynthesis of all plants. The
relationship between CO2 and human wel-
fare can be described as: the water (HO2)
that bears the boat (human positive wel-
fare) is the same that swallows it up (hu-
man negative welfare), which is why
cleaned CO2 is known as CO2 fertilizer.
Therefore, the air pollutants discussed as
following do not include CO2.
Air pollutants generated by the vehi-
cle running process are divided into inter-
nal combustion (engine) system air pol-
lutants and waste gas system air pollutants.
Internal Combustion System Air
Pollutant
The internal combustion system is
resulted from the fuel tank, carburetor,
and crankcase. And, the pollution process
is almost all the HC spilled by evapora-
tion from the aforesaid three systems. Be-
fore antipollution measures were taken
(Figure 1), the amount of HC spilled from
the three systems account for about 40%
of the total amount of air pollutant HC; in
addition, 60% of air pollutant HC is dis-
charged from the waste gas system.
The effective measures for reducing
internal combustion system air pollutants
are described as follows, as dotted portion
in Figure 2: Measure 1: enhancing the de-
sign of fuel tank A, carburetor B, crank-
case C, and the engine to avoid HC spill-
ing or evaporating. Measure 2: intercept-
ing the HC spilled from fuel tank A and
carburetor B in a charcoal canister, where
compressed air drives it into the engine
for secondary combustion (see the upper
right of Figure 2). Measure 3: sealing the
air outlet connecting the crankcase to the
outside, and collecting the evaporated HC
gas into the Intake Manifold with a back-
stop exhaust valve

The International Journal of Organizational Innovation Vol 10 Num 4 April 2018
350
Figure 1. Traffic Pollution Generated by the Vehicle
Notes:
HC Emissions: A & B 20%; C 20%; D 60% CO, NOx, Lead & D Emissions: 100%
Particle Pollution during driving: E & F 100%

The International Journal of Organizational Innovation Vol 10 Num 4 April 2018
351
for secondary combustion (see the
left of Figure 2). At present, the afore-
said three measures are the consensus
for reducing internal combustion HC
system pollutants.
Waste Gas System Air Pollutant
The pollution reduction method is
to mount a catalytic reactor in front of
the silencer of the exhaust pipe, which
has the function of oxidizing CO and
HC to CO2 and water, as well as to re-
duce NO to N. At present, vehicles to
be sold in the U.S. must be equipped
with a catalytic reactor. In the internal
combustion engine, increasing the air-
fuel content ratio reduces CO and HC
contents, but increases the NO volume.
In the view of pollution reduction, the
optimum ratio of air to fuel content of
the internal combustion engine depends
on the cost of marginal CO and HC pol-
lution reduction being equal to the mar-
ginal NO pollution reduction cost value.
Referring to the U.S., Taiwan’s
government can require that the engine
systems and waste gas systems used by
auto plants are equipped with the afore-
said pollution reduction facility, in or-
der to minimize the pollution source
resulted from operating vehicles. The
next issue is to separate the CO2 outside
the vehicles on the highway from the
mixed polluted air.
Figure 2. The Way to Reduce HC in the Internal Engine (As Shown in the Dashed Box)

The International Journal of Organizational Innovation Vol 10 Num 4 April 2018
352
Mounting Pollution Reduction Facilities
on Highway Guardrails
The existing cyclone collector and
packed column dust scrubber are com-
bined and improved in this paper (Perkins,
2009) to form the (temporarily named)
"cyclonic sprinkling pollution reducer",
as shown in Figure 3. There can be nu-
merous identical cyclonic sprinkling pol-
lution reducers located on highway (es-
pecially freeways) guardrails.
The reasons for this design:
There are trees on both sides of highways
(including safety islands), which require
regular irrigation. In order to economize
irrigation labor, additional water pipes
can be mounted, roadside flowers and
trees can be watered by an automated
time switch, and the water required for
the sprinkle scrubbing section in Figure 3
can also be switched.
1. There is an open space above highway
guardrails where photovoltaic panels
can be installed, which can provide the
power source for the pollution absorb-
ing fans and the sprinkling scrubbing
section, as shown in Figure 3.
2. There are two types of existing cy-
clone collectors, the dry cyclone col-
lector and the wet cyclone collector.
While the wet cyclone collector has
better dust absorption effect, the ques-
tion of how to dispose of its polluted
mud presents another problem. There-
fore, Figure 3 is designed for dedust-
ing dry-wet region separation.
3. The pollutants from automobile ex-
haust pipes are complex, and the parti-
cle shapes and weights are different.
The polluted air, as shown in Figure 3,
is sucked or pushed in (pushed in by
the airflow driven by a running vehicle)
under the rotation effect, as resulted
from the semicone (large in-cone area
of polluted air, small out-cone area)
shape, where heavier particles impact
the inner wall of the semicone, which
are then slowed down by friction as
they slide down along the wall surface
to the dust collecting groove. As the
dust collecting groove is a semicircular
column opened upward, without the
interference of external force, the par-
ticles slide along the semicircular col-
umn wall surface to the bottom of
semicircular column groove. However,
the semiconic cyclone has external air
blown in at any time, thus, the parti-
cles that slid along the wall to the
groove bottom may be raised again by
the air. In order to avoid the probabil-
ity of raising the particles again, a half
cover is mounted above the semicol-
umnar dust collecting groove, which
enables the contaminated particles to
slide along the wall to the groove bot-
tom, which also reduces the particles
that have slid to the groove bottom
from being raised again by subsequent
airflow.
4. When the contaminated particles are
cleaned in the cyclone dust collection

The International Journal of Organizational Innovation Vol 10 Num 4 April 2018
353
Figure 3. The Solar Power Generation System Installed in Highway Guardrail Zone
5. zone (on the left of Figure 3), the re-
sidual air pollutant components are S
and N. As the wet scrubbing absorbs
SO2 and NO2, the sprinkling scrubbing
section is designed on the right of Fig-
ure 3. The cleaned SO2 and NO2 can
be used as disinsectization solution,
disinfection solution, and cleaning so-
lution; Figure 3 shows the cyclone
scrubbing pollution eliminator.
6. If the government gives rewards and
punishments; as the exhaust directions
of automobile exhaust pipes are op-
tional, the exhaust direction of small
vehicles running near the inside lane
can be left, while the exhaust direction
of large vehicles running the near slow
lane can be right, thus, the efficiency
of sucking exhaust gas in the cyclone
scrubbing pollution eliminator in Fig-
ure 3 will be increased.
Producing cleaned CO2 is the same as
producing electricity, meaning they
shall be distributed according to de-
mand immediately after production,
instead of being stored. While the use
of cleaned CO2 is mentioned in this
paper, the short time lag between
yield and demand must be considered.
Conclusion
Taiwan's greenhouse gas emission
was increased by 134% from 1990 to
2005, which ranked first in the world,
meaning Taiwan's economic development

The International Journal of Organizational Innovation Vol 10 Num 4 April 2018
354
remains highly dependent on energy-
consuming industries in the past. As Tai-
wan cannot improve its industrial struc-
ture to reduce carbon emission in the
short-term, producing cleaned CO2 to
turn the defect in CO2 into an advantage
seems to be a unique option.
Under the circumstance of being
hard to live, this paper proposes a frame-
work that not only saves energy, it also
cleans highway CO2 instantly. This
framework of cleaning highway CO2 ex-
tensively mounts the "cyclone sprinkling
scrubber", as designed in this paper, on
existing highway guardrails, in order to
produce cleaned CO2. This paper demon-
strates the component structure of the cy-
clone sprinkling scrubber, and describes
the principle of the design. A partial ef-
fect of producing cleaned CO2 is related
to the engine pollution prevention effect,
as implemented by vehicle manufacturers,
as well as to the exhaust direction of ex-
haust pipes, which are discussed and de-
scribed in this paper.
The idea of producing cleaned CO2
in this paper is still a preliminary concept.
Is it feasible? How many supporting
measures are required? Feasibility is to be
proved through actual experimental data
after "cyclone sprinkling scrubbers" are
manufactured and mounted on freeway
guardrails.
References
Chen, Y.T. & Chen, C.C. (2012). An in-
novative strategy for Taiwan’s en-
ergy policy in the challenge of
warming effect. Journal of Envi-
ronment and Management, 13(2),
53-75.
Perkins, H.C. (2009). Air Pollution.
Mcgraw-Hill College; International
Edition.
Foundation for Excellent Journalism
Award (2010). Chronicle of Carbon
Reduction in Taiwan. Chuliu Books
Company.
Yao, X.J. & Tian, Y.S. (2008). Biomass
Energy-Green Gold Development
Technology. New Wun Ching De-
velopmental Publishing Co., Ltd.
Yang, C.C. & Chen, M.S. (2011). A pre-
liminary feasibility assessment of
planting Jatropha Curcas in Taiwan.
Journal of Environment and Man-
agement, 11(2), 105-116.

The International Journal of Organizational Innovation Vol 10 Num 4 April 2018
355