Embed Size (px)
Citation preview
University of Arkansas, FayettevilleScholarWorks@UARK
Theses and Dissertations
12-1998
The Integration of Firm Resources: The Role ofCapabilities in Strategy and Firm PerformanceDaniel LynchUniversity of Arkansas, Fayetteville
Follow this and additional works at: https://scholarworks.uark.edu/etd
Part of the Business Administration, Management, and Operations Commons, and theMarketing Commons
This Dissertation is brought to you for free and open access by ScholarWorks@UARK. It has been accepted for inclusion in Theses and Dissertations byan authorized administrator of ScholarWorks@UARK. For more information, please contact [email protected], [email protected].
Recommended CitationLynch, Daniel, "The Integration of Firm Resources: The Role of Capabilities in Strategy and Firm Performance" (1998). Theses andDissertations. 2999.https://scholarworks.uark.edu/etd/2999
THE INTEGRATION OF FIRM RESOURCES: THE ROLE OF CAPABILITIES
IN STRATEGY AND FIRM PERFORMANCE
Reproduced with permission of the copyright owner. Further reproduction prohibited without permission.

THE INTEGRATION OF FIRM RESOURCES THE ROLE OF CAPABILITIES
IN STRATEGY AND FIRM PERFORMANCE
A dissertation proposal submitted in partial fulfillment of the requirements for the degree of
Doctor of Philosophy
By
Daniel F. Lynch, B.S., M.P.A. Fairleigh Dickinson University, 1975
University of Colorado, 1977
December 1998 University of Arkansas
Reproduced with permission of the copyright owner. Further reproduction prohibited without permission.

©1998 by Daniel F. Lynch All Rights Reserved
Reproduced with permission of the copyright owner. Further reproduction prohibited without permission.

ACKNOWLEDGMENTS
Little, if anything in life, can be accomplished without the assistance, support,
and love of others. I have many individuals who have done all of that and more for
me throughout this odyssey. First, and foremost, my family deserves the credit for
this accomplishment. My wife, Kathleen Mary Lynch, essentially became a single
mom during my doctoral studies. She is, and will always be, an inspiration to all of
us who are fortunate enough to know her. What is most important is, she was and
still remains, my first love, especially after all of this. My children, Erin Kathleen,
Daniel Ryan, and Brigid Moira Lynch, have been amazingly resilient and supportive
during this process. I will always miss and greatly regret the times that I was absent
from them during the doctoral program. These times cannot be replaced, and for that.
I am truly sorry. However, I hope that my children understand what Kathy and I have
always tried to instill in them. That one can accomplish anything you set out to do.
no matter what your current situation might seem to dictate. Kathy, Erin, Daniel, and
Brigid, I know it has been difficult, but I truly love you and am very proud of you.
Thank you very much for making this possible. I could not have accomplished this
without you.
My mother, Ann Lynch, deserves a tremendous amount of credit as well. She
has always shown me the merit of hard work and the rewards of giving to others. 1
truly wish to thank her for being there when I needed her. My father, Daniel Francis
Lynch, is also to be commended. He taught me to be a fighter, and that too has
served me well through this journey. I would also like to extend my gratitude to all
iv
Reproduced with permission of the copyright owner. Further reproduction prohibited without permission.

of my sisters and their husbands for the kindness and support through the years.
Peggy and Billy Hill, Denise and John Bambach, Rich and Cathy Olsen, Bobbie and
Tom Wanamaker, and Sharon Lynch. All of you, have helped me and my family, and
I am very grateful for that.
Throughout the Ph.D. Program I received tremendous support from faculty
and friends alike. I only hope that they know how much I appreciate their assistance.
Dr. Scott Keller deserves my highest regard as both a friend and a colleague. Thank
you for being my eyes from time to time. Dr. George Heilman, the hours spent
working together and alone were much more bearable due to your friendship and
sense of humor. Dr. Tracy Suter and Dr. Larry Yarbrough, I truly appreciate all the
help you provided to me—thank you, one and all.
Many faculty members were, of course, instrumental in this project. My
committee members were extremely supportive and understanding. Dr. John
Ozment, my dissertation chairperson, is one of the finest people I have had the
privilege to know. Dr. Jeff Murray, is truly a great teacher, scholar, and friend. Dr.
Molly Rapert, a true friend, was constantly available for direction, as well as being
extremely encouraging, and Dr. Parshotam Dass added instructive comments. Many
other faculty members are to be commended as well. Dr. Tom Jensen, my first
contact with the Ph.D. Program at Arkansas, was always encouraging. Dr. Scot
Burton was always available for consultation, and Dr. Dave Kurtz, was always
optimistic. Dr. Julie Gentry, Dr. Matt Waller, and Dr. Bob Stassen, thank you for
v
Reproduced with permission of the copyright owner. Further reproduction prohibited without permission.

your support and friendship. Additionally, Pam Witcraft, Donna Walker, and Terecia
Magee were always there when I needed them—thank you.
As this process comes to an end, I would like to especially thank Dr. John
Ozment who became my mentor, my friend and my colleague. He is truly an
outstanding individual whom I am very proud to know. I can never begin to express
my gratitude for his hard work, his understanding, and his support. Without him, this
could have never been accomplished.
In closing, for John, I would like to echo the words of a great writer, Mark
Twain, in his book Adventures o f Huckleberry Finn. Huck is quoted as saying, “... if
I’d a knowed what a trouble it was to make a book I wouldn’t a tackled i t ....” I must
admit, at first, I did tend to agree with Huck, but then, he did not have the privilege of
working with Dr. John Ozment. Nor did he have the support afforded me by my
family, friends, faculty, and colleagues.
It is to my family, Kathy, Erin, Daniel, and Brigid, that I dedicate this work.
vi
Reproduced with permission of the copyright owner. Further reproduction prohibited without permission.

TABLE OF CONTENTS
Page
CHAPTER I: INTRODUCTION ............................ 1
GENERIC BUSINESS STRATEGIES............................................................. 4
RESOURCE-BASED THEORY..................................................................... 8
DISTINCTIVE CAP ABILITIES..................................................................... 9
LOGISTICS CAP ABILITIES ....................................................................... 12
CONCEPTUAL MODEL ............................................................................. 15
PLAN OF THE DISSERTATION................................................................. 18
CHAPTER H: LITERATURE REVIEW ................................................................. 20
INTRODUCTION......................................................................................... 20
BUSINESS STRATEGY............................................................................... 20
Porter’s Generic Strategy................................................................... 21
Additional Theoretical Support......................................................... 23
RESOURCE-BASED THEORY................................................................... 27
DISTINCTIVE CAP ABILITIES................................................................... 32
LOGISTICS CAP ABILITIES ....................................................................... 36
CHAPTER m: METHODOLOGY ........................................................................... 40
INTRODUCTION............................................................................................40
HYPOTHESIZED MODEL............................................................................. 40
HYPOTHESES .................................................................................. 43
RESEARCH D ESIG N..................................................................................... 46
vii
Reproduced with permission of the copyright owner. Further reproduction prohibited without permission.

Research Setting and Method ..............................................................46
Data Collection .................................................................................... 47
MEASUREMENT OF CONSTRUCTS ..........................................................48
Logistics Capabilities............................................................................ 48
Porter’s Generic Strategy.................................................................... 51
Performance........................................................................................ 52
CHAPTER IV: RESEARCH FINDINGS.................................................................. 53
INTRODUCTION.......................................................................................... 53
RESPONSE RATES ...................................................................................... 53
RELIABILITY................................................................................................. 55
VALIDITY....................................................................................................... 61
Content Validity.................................................................................. 61
Unidimensionality and Convergent V alid ity .................................... 62
Discriminant Validity.......................................................................... 67
HYPOTHESES TESTING AND HYPOTHESES SUPPORTED ................72
Hypothesis One .................................................................................. 72
Hypothesis T w o .................................................................................. 73
Hypothesis T h re e ................................................................................ 73
Hypothesis F o u r .................................................................................. 74
Hypothesis F iv e .................................................................................. 75
Hypothesis S i x .................................................................................... 75
Reproduced with permission of the copyright owner. Further reproduction prohibited without permission.
Hypothesis Seven............................................................................... 76
Hypothesis Eight ............................................................................... 77
Hypothesis N ine ................................................................................. 78
Hypothesis Ten ................................................................................. 78
Hypothesis E lev en ............................................................................. 79
CHAPTER V: CONCLUSIONS ............................................................................. 81
INTRODUCTION.......................................................................................... 81
CONCLUSIONS AND IMPLICATIONS.................................................... 81
LIMITATIONS OF THE STUDY................................................................. 84
FUTURE RESEARCH ................................................................................. 85
CONCLUDING COM M ENTS..................................................................... 86
REFERENCES ........................................................................................................... 88
ix
Reproduced with permission of the copyright owner. Further reproduction prohibited without permission.

LIST OF FIGURES
PageFIGURE 1.1: THE RELATIONSHIP BETWEEN RESOURCE-BASED
THEORY & PORTER’S GENERIC STRATEGY........................................ 7
FIGURE 1.2: A CONCEPTUAL MODEL OF THE CONSTRUCTSAND RELATIONSHIPS............................................................................... 17
FIGURE 3.1: HYPOTHESIZED M O D E................................................................... 42
FIGURE 4.1: STRUCTURAL MODEL PARAMETER RESULTS..................... 70
x
Reproduced with permission of the copyright owner. Further reproduction prohibited without permission.

LIST OF TABLES
Page
TABLE 2.1: GLOBAL LOGISTICS RESEARCH TEAM AT MICHIGANSTATE UNIVERSITY ................................................................................. 39
TABLE 3.1: MEASURES OF LOGISTICS CAPABILITIES:GLOBAL LOGISTICS RESEARCH TEAM AT MICHIGAN STATE UNIVERSITY................................................................................................ 50
TABLE 4.1: SURVEY RESPONDENT CHARACTERISTICS........................... 58
TABLE 4.2: RELIABILITIES AND PRINCIPAL COMPONENT SCORES . . . . 59
TABLE 4.3: CONSTRUCT UNIDIMENSIONALITY AND ITEM LAMBDASFOR MEASUREMENT MODELS............................................................... 64
TABLE 4.4: OVERALL MODEL ITEM LAMBDAS...............................................66
TABLE 4.5: CONSTRUCT DISCRIMINANT VALIDITY .................................. 69
TABLE 4.6: OVERALL MODEL FIT STATISTICS ANDCONSTRUCT RELATIONSHIPS ............................................................... 71
xi
Reproduced with permission of the copyright owner. Further reproduction prohibited without permission.
EXHIBITS
Page
APPENDIX A: INITIAL COVER LETTER ............................................................. 96
APPENDIX B: REMINDER COVER LETTER ..................................................... 98
APPENDIX C: THIRD COVER LETTER............................................................. 100
APPENDIX D: QUESTIONNAIRE....................................................................... 102
APPENDIX E: CORRELATIONS, MEANS, AND STANDARDDEVIATIONS.............................................................................................. I l l
APPENDIX F: CONSTRUCTS AND RESULTING INDICANTS ................... 115
xii
Reproduced with permission of the copyright owner. Further reproduction prohibited without permission.
CHAPTER I
INTRODUCTION
The literature on firm performance has a rich history and is theoretically
grounded in several disciplines including economics, sociology, and organizational
behavior (Anderson 1982). However, there has not been much empirical support for
any specific theory. That is, authors have not been successful in explaining why
certain firms perform well while others do not. Several authors have attempted to
link strategy to performance (Miller 1986; Dess and Davis 1984; Miles and Snow
1978; Porter 1980), but with varying levels of success. More recently, authors have
attempted to tie firm performance to resources (Barney 1991; Hall 1993) and/or
capabilities (Day 1994; Droge et al. 1994; Hitt and Ireland 1986), but here, too, there
has not been convincing empirical support.
Three observations are pertinent at this point. First, there seems to be
reasonable theoretical bases for these two streams of research. For example, it is
intuitively appealing to assume that a well-planned strategy should lead to success.
Similarly, it is easy to believe that a firm cannot be successful without certain
resources and/or capabilities. The second observation is that these research streams
have emerged independently of one another. That is, it appears that those who
support the link between strategy and performance have not developed models that
incorporate into them resources and/or capabilities, and the authors who support the
link between capabilities and performance have not attempted to incorporate strategy
1
Reproduced with permission of the copyright owner. Further reproduction prohibited without permission.
into their models. The third observation is that the theories in both areas are too
sound to reject, irrespective of a lack of empirical support. Rather than viewing these
approaches separately such that one group of researchers is right while the other is
wrong, it may be beneficial to integrate the two approaches in an attempt to
determine if certain strategies are more successful if implemented with an adequate
resource base and/or the necessary capabilities. On the other hand, firms that pursue
certain strategies without the necessary resources or capabilities would not be
expected to perform as well as firms that carefully match resources and capabilities to
their strategic approaches.
The objectives of this dissertation are to examine whether superior firm
performance is achieved when resources/capabilities are properly matched with
market strategy (what one might call—-fit) and to ascertain which capabilities should
be linked to which strategy. Strategy, for the purpose of this study, will be those
strategic choices that were defined by Porter (1980). He hypothesized that firms may
pursue two (or three) different generic business strategies in order to achieve superior
firm performance, that is, cost leadership, differentiation, or focus. Miller (1988) and
Davis and Miller (1988), among others, have concluded that there are really only two
generic strategies, that is, cost leadership and differentiation. These two strategic
alternatives form the basis of our strategy construct for this thesis.
Since capabilities (firm resources) reside mostly at the functional level of the
organization, that is where this dissertation will begin. There are many resources
and/or capabilities that firms rely on to pursue their objectives. Some of these are
2
Reproduced with permission of the copyright owner. Further reproduction prohibited without permission.
related to specific functions such as finance, operations, logistics, or marketing.
However, there has been very little research that has identified and measured the
resources/capabilities of specific functional areas. One of the few areas in which
studies have been conducted and for which scales have been developed is the
logistics function (Global Logistics Research Team at Michigan State University
1995; Eckert and Fawcett 1996; Morash et al. 1996; Clinton and Closs 1997).
Moreover, logistics has been mentioned frequently as a functional area of the firm
that may provide sustainable competitive advantage and superior firm performance
(Bowersox et al. 1995; Eckert and Fawcett 1996; Morash et al. 1996; Global
Logistics Research Team at Michigan State University 1995). Unlike other
functions, logistics activities have the potential to affect performance in terms of
revenue enhancement as well as cost reduction. Logistics expenses may represent as
much as 20 percent of the total cost in many industries (Coyle, Bardi, and Langley
1996: Lambert and Stock 1993). Consequently, logistics capabilities that permit cost
reduction have the potential to significantly affect performance. Additionally,
Logistics activities have been shown to significantly affect revenue, and, therefore,
may affect performance from this perspective as well (Ozment and Chard 1986).
Accordingly, this study builds upon that prior knowledge in an effort to gain a better
understanding of how capabilities, strategy, and performance are related.
The remainder of this chapter is divided into several sections. Presented first
is a brief overview of generic business strategies. Next, the concepts of resource-
based theory, distinctive capabilities, and logistics capabilities are examined. This is
3
Reproduced with permission of the copyright owner. Further reproduction prohibited without permission.

followed by a section in which a conceptual model is proposed and relationships
briefly discussed. Finally, an outline of the remaining chapters of the dissertation is
provided.
GENERIC BUSINESS STRATEGIES
Strategy research has focused largely on factors outside the firm such as
market conditions and competition (Porter 1980, 1985). Porter (1980) identified
three generic strategies: differentiation, cost leadership, and a third he called focus.
All of these strategies, though not mutually exclusive, are based upon issues dealing
with competition and barriers to entry. These theories foresee the firm’s position in
the market and its strategy being based upon five market forces (Porter 1980). These
five market forces are threat of new entrants, rivalry within the industry, buyer power,
supplier power, and threat of substitution. Porter’s generic strategies are based in
industrial economics. As such, the above forces are said to determine industry
profitability. Porter postulates that a firm may pursue superior performance by
employing the five market forces to select an attractive industry, or by selecting a
strong competitive position within an industry; that is, become a cost leader, a
differentiator, or become focused. As can be seen, the emphasis in this work
suggests that a firm's success, or lack thereof, deals with the selection of the industry
in which to compete and the strategic choice employed within that industry. As
mentioned previously, this view of strategy is based upon traditional industrial
organization theory; that is, the structure - conduct - performance paradigm. This
4
Reproduced with permission of the copyright owner. Further reproduction prohibited without permission.

paradigm utilizes a value chain analysis in deciding strategic position which by its
very nature is competition and market oriented, incorporating the market forces
previously discussed.
Bamey (1991) perceives Porter’s view of strategy to be very externally
(market) oriented, dealing primarily with the opportunities and threats with which a
firm must contend. He contrasts this with an internally (resource) oriented approach
to strategy, being somewhat more strength and weaknesses oriented (see Figure 1.1).
Figure 1.1 illustrates the difference in the views of Porter and Bamey. As is shown,
Porter’s view is more externally oriented while that of Bamey is more internally
oriented. Conner (1991) expounds upon these differing views of strategy by pointing
out that internal firm resources might be the real source of firm success. This
discussion of the differing views of strategy becomes even more intriguing when one
reflects on two additional issues concerning which strategy approach is best; one that
is externally oriented, i.e., (market forces) or one that is internally oriented (i.e.,
resource-based theory).
One of the shortcomings of the market forces approach (Porter’s Generic
Strategy) is its lack of ability to explain how firms continue to achieve different
levels of performance even though they are competing within the same industry. This
lack of explanatory power may be due to the need to include resources and/or
capabilities into the strategy - performance relationship. However, Porter, himself,
has shed new light on this issue. Porter (1996) in discussing What is Strategy?
states:
5
Reproduced with permission of the copyright owner. Further reproduction prohibited without permission.

“Competitive strategy is about being different. It means deliberately choosing a different set of activities to deliver a unique mix of value... the essence of strategy is in the activities - choosing to perform activities differently or to perform different activities than rivals (Porter 1996, p. 64, italics added).”
Of particular interest to this study is that the ‘activities’ mentioned by Porter seem to
be tied closely to capabilities and resources associated with the Resource-Based
Theory of the firm with its internal versus external firm orientation which are
discussed next.
6
Reproduced with permission of the copyright owner. Further reproduction prohibited without permission.

FIGURE 1.1THE RELATIONSHIP BETWEEN RESOURCE-BASED
THEORY & PORTER’S GENERIC STRATEGY
INTERNALANALYSIS
•STRENGTHSA
•WEAKNESSES
EXTERNALANALYSIS
•OPPORTUNITIES
•THREATS
RESOURCEBASED-THEORY
PORTER’S GENERIC STRATEGY
RESOURCE-BASED THEORY
Resource-Based-Theory of the firm (Bamey 1991; Rumelt, Schendel, and
Teece 1991; Mahoney and Pandian 1992) differs from the traditional generic strategy
approach, previously discussed, by proposing that firm resources or capabilities are
developed over long periods of time and, in turn, serve as a competitive advantage to
be utilized by the firm to pursue superior firm performance (Rumelt, Schendel, and
Teece 1991).
In 1937, Coase commented on the importance of “...the allocation of
resources in a firm ...” (Coase 1937, p. 389). Penrose (1959) was one of the earliest
writers to propose a resource-based explanation of the firm. Her work examined the
firm much more from a strategy based on resources viewpoint than an economic and
industrial organization standpoint, as Coase had previously done.
Perhaps the seminal article on Resource-Based Theory was presented by
Wemerfelt (1984). He proposed that firms were made up of bundles of resources that
could be employed to affect firm performance. Bamey (1991) continued to expand
upon the Resource-Based Theory. He examined the link between sustainable
competitive advantage and firm resources and proposed a framework by which to
identify firm resources. He postulated that there were four indicators of firm
resources. They are value, rareness, imitability, and sustainability (Bamey 1991).
Rumelt, Schendel, and Teece (1991) believe that a firm develops certain
resources over a long period and that these capabilities eventually become the firm’s
competitive advantage. Bamey (1991) states that it is not the time period that defines
8
Reproduced with permission of the copyright owner. Further reproduction prohibited without permission.

a sustainable competitive advantage, but the inability of competitors to duplicate
these firm’s resources. Mahoney and Pandian (1992) expounded further upon the
Resource-Based Theory by offering some propositions by which to test the theory and
by proposing that it was management’s job to utilize firm resources for competitive
advantage.
In an extension of his earlier work, Barney (1995) looked at various firms and
their internal strengths and weaknesses. He proposed that firms can have a
competitive advantage and/or superior performance based upon firm resources.
Miller and Shamsie (1996) examined the resource-based view of the firm in order to
ascertain whether there was any empirical support for it. They examined historical
information from the motion picture industry between 1936 and 1965. Their findings
were that certain firm resources did lead to superior firm performance. Much of the
work previously mentioned uses the term “resources;” however, the aforementioned
theory seems to be implemented through the capabilities that reside within the firm
that will be discussed next.
DISTINCTIVE CAPABILITIES
How is Resource-Based Theory manifested within the firm? Day (1994)
points out that resource-based theory presents two sources of competitive advantage
and performance: firm assets and firm capabilities. Our focus here is on the firm’s
capabilities, or more specifically, distinctive capabilities. Distinctive capabilities are
not simply the resources of the firm but strictly those resources that are so deeply
9
Reproduced with permission of the copyright owner. Further reproduction prohibited without permission.
embedded in the organizational routines and practices of the firm that they cannot be
traded or imitated (Dierickx and Cool 1989). Day proposes a capabilities approach or
resource-based approach to competitive advantage. He believes this approach may
provide a firm with “[a] focus on customer value creation” (Day 1994, p. 50).
Day states that distinctive capabilities are “complex bundles of skills and
accumulated knowledge, exercised through organizational processes, that enable
firms to make use of their assets... and... functions like a key success factor” (Day
1994, p. 38). They enable the firm “...to deliver value to customers in an appreciably
more cost effective way” (Day 1994, p. 39). Capabilities are “...the glue that brings
... assets together and enables them to be deployed advantageously” (Day 1994, p.
38). Examples of distinctive capabilities are: Wal-Mart’s logistics capabilities
embodied in their cross-docking capabilities; the consistency of the McDonald’s
Corporation; and L.L. Bean’s superior order fulfillment processes (Day 1994). It is
interesting to take note that a number of these capabilities mentioned by Day are
logistics capabilities and are part of what Day refers to as a continuum of capabilities.
This continuum includes outside-in processes, spanning processes, and inside-out
processes which are discussed in more detail in the next chapter. According to Day
(1994), more research is needed on how firms attain competitive advantage through
distinctive capabilities.
Some authors believe that capabilities are based on knowledge and are
distributed on separate dimensions of knowledge and skills, technical systems,
management systems, and values and norms (Leonard-Barton 1992). She
10
Reproduced with permission of the copyright owner. Further reproduction prohibited without permission.
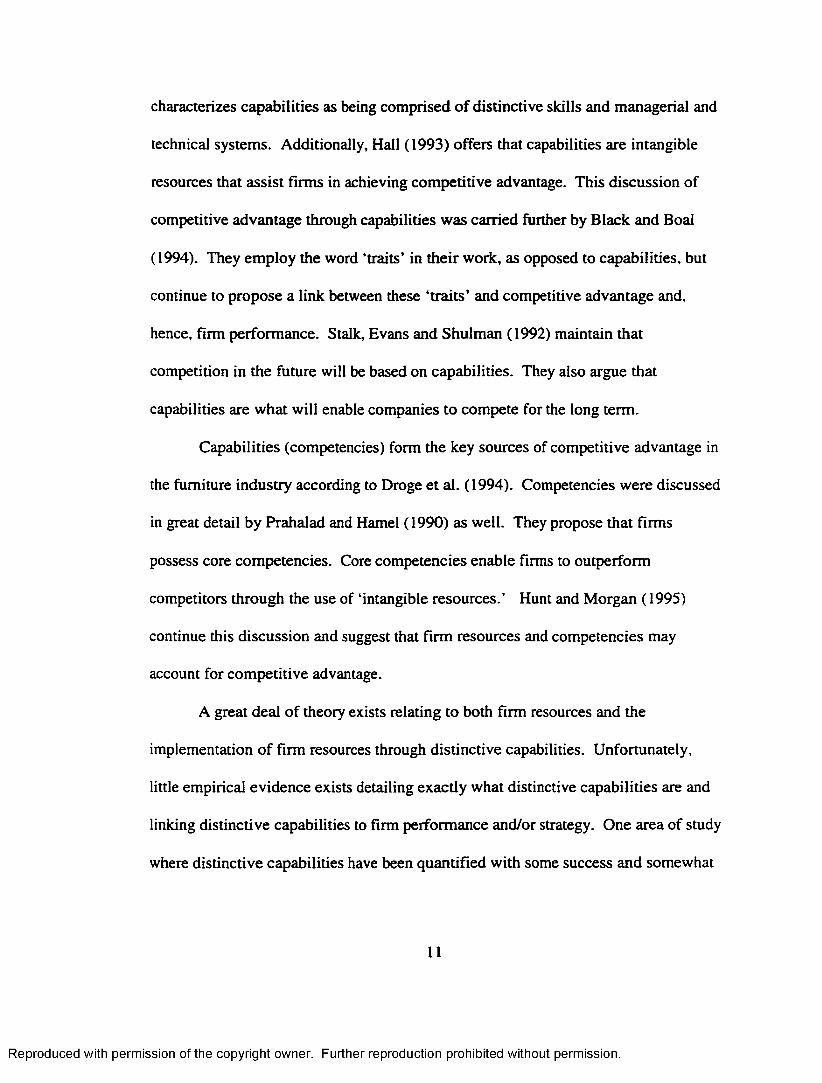
characterizes capabilities as being comprised of distinctive skills and managerial and
technical systems. Additionally, Hall (1993) offers that capabilities are intangible
resources that assist firms in achieving competitive advantage. This discussion of
competitive advantage through capabilities was carried further by Black and Boal
(1994). They employ the word ‘traits’ in their work, as opposed to capabilities, but
continue to propose a link between these ‘traits’ and competitive advantage and.
hence, firm performance. Stalk, Evans and Shulman (1992) maintain that
competition in the future will be based on capabilities. They also argue that
capabilities are what will enable companies to compete for the long term.
Capabilities (competencies) form the key sources of competitive advantage in
the furniture industry according to Droge et al. (1994). Competencies were discussed
in great detail by Prahalad and Hamel (1990) as well. They propose that firms
possess core competencies. Core competencies enable firms to outperform
competitors through the use of ‘intangible resources.’ Hunt and Morgan (1995)
continue this discussion and suggest that firm resources and competencies may
account for competitive advantage.
A great deal of theory exists relating to both firm resources and the
implementation of firm resources through distinctive capabilities. Unfortunately,
little empirical evidence exists detailing exactly what distinctive capabilities are and
linking distinctive capabilities to firm performance and/or strategy. One area of study
where distinctive capabilities have been quantified with some success and somewhat
11
Reproduced with permission of the copyright owner. Further reproduction prohibited without permission.

linked to performance is logistics. Consequently, the next section provides a brief
overview of logistics capabilities and the related research.
LOGISTICS CAPABILITIES
The Resource-Based Theory of the firm, and/or the concept of Distinctive
Capabilities have had few, if any, empirical tests of their soundness. They are, as was
mentioned earlier, both intuitively and theoretically appealing but empirical evidence
is needed. One area of promise seems to be logistics in that some measurement of
logistics capabilities has taken place, and successful linkages have been made
between logistics capabilities and firm performance (Global Logistics Research Team
at Michigan State University 1995; Eckert and Fawcett, 1996). It, therefore, seems
appropriate to extend this work to test the proposed relationships with strategy and
performance in the logistics area since scales of logistics capabilities exist and some
have been successfully linked to performance (Global Logistics Research Team at
Michigan State University 1995; Eckert and Fawcett 1996; Morash et al. 1996).
Some additional considerations involve the service characteristics of logistics
and the strategy implications thereof. Most studies of capabilities have been in the
manufacturing arena, but of equal importance is the notion that logistics may be the
new frontier of strategy as proposed by some authors (Bowersox et al. 1995; Day
1994; Stalk et al. 1992). For example, a firm such as Wal-Mart that possesses a
distinctive capability in terms of its cross-docking logistics system that has an impact
on the firm performance (Day, 1994). Such a resource cannot be easily copied
12
Reproduced with permission of the copyright owner. Further reproduction prohibited without permission.

(Barney 1991), and it significantly reduces costs via high levels of efficiency. A
lower cost base can be an obvious benefit in terms of financial performance
measures, and the fact that it is not easily copied leads to a sustainable competitive
advantage in the marketplace. In addition, since Wal-Mart strives to be the low-cost
competitor as part of its strategy (Walton and Huey, 1992) its competitive advantage
is enhanced through this distinctive logistics capability. Wal-Mart, therefore, is an
excellent exemplar of the basic thesis of this study. That is, Wal-Mart is a firm that
has combined its distinctive low cost logistics capabilities with a low cost strategy in
order to produce superior firm performance.
Another excellent example of logistics capabilities becoming more important
in terms of logistics capabilities, firm strategy, and firm performance may be seen in
a new logistics strategy being employed by Levi Strauss & Company. Levi Straus &
Company now offers their customers a ‘Personal Pair of Jeans’ through their own
retail stores (Fox 1996). This program, pioneered by Levi’s, allows the company to
take exact measurements of the customer at the store. These measurements are sent
by computer to the main factory. At the factory, custom jeans are made for this
customer, all for only a ten dollar up-charge! Customers may have the jeans sent to
the store or by Federal Express to their home, for a small additional charge. This
program is reported to be one of a kind in the clothing industry (Fox 1996).
Olavarrieta and Ellinger (1997) mention that this program allows Levi’s to employ
logistical expertise to differentiate their products. Levi’s, through the use of the
logistics capabilities of quick response and superior customer service, is able to offer
13
Reproduced with permission of the copyright owner. Further reproduction prohibited without permission.
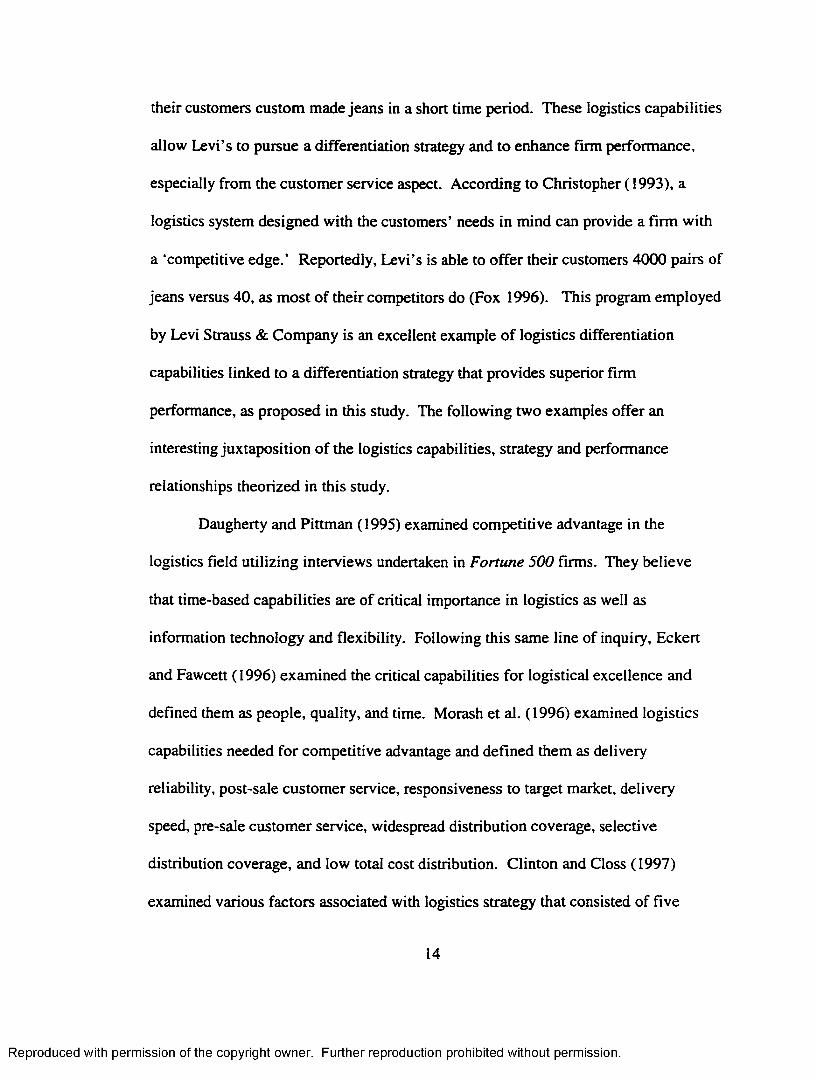
their customers custom made jeans in a short time period. These logistics capabilities
allow Levi’s to pursue a differentiation strategy and to enhance firm performance,
especially from the customer service aspect. According to Christopher (1993), a
logistics system designed with the customers’ needs in mind can provide a firm with
a ‘competitive edge.’ Reportedly, Levi’s is able to offer their customers 4000 pairs of
jeans versus 40, as most of their competitors do (Fox 1996). This program employed
by Levi Strauss & Company is an excellent example of logistics differentiation
capabilities linked to a differentiation strategy that provides superior firm
performance, as proposed in this study. The following two examples offer an
interesting juxtaposition of the logistics capabilities, strategy and performance
relationships theorized in this study.
Daugherty and Pittman (1995) examined competitive advantage in the
logistics field utilizing interviews undertaken in Fortune 500 firms. They believe
that time-based capabilities are of critical importance in logistics as well as
information technology and flexibility. Following this same line of inquiry, Eckert
and Fawcett (1996) examined the critical capabilities for logistical excellence and
defined them as people, quality, and time. Morash et al. (1996) examined logistics
capabilities needed for competitive advantage and defined them as delivery
reliability, post-sale customer service, responsiveness to target market, delivery
speed, pre-sale customer service, widespread distribution coverage, selective
distribution coverage, and low total cost distribution. Clinton and Closs (1997)
examined various factors associated with logistics strategy that consisted of five
14
Reproduced with permission of the copyright owner. Further reproduction prohibited without permission.

factors: alliances, information systems, EDI practices, inventory management, and re
engineering. These factors appear to be closely aligned with capabilities.
The largest undertaking to examine logistics capabilities was done by Global
Logistics Research Team at Michigan State University and published in 1995 by the
Council of Logistics Management in World Class Logistics: The Challenge o f
Managing Continuous Change. The research design involved in-depth interviews
and survey research. The in-depth interviews consisted of 111 firms representing 17
different nations. Their survey had a response rate of 17.1%, for a total of 3,693
usable responses. These surveys represent numerous firms and industries on three
continents. Their research identified four logistics competencies: positioning,
integration, agility, and measurement. The authors developed 17 capabilities grouped
into the aforementioned competencies. They initially identified 32 measures of
logistics capabilities, of which ten were significantly related to performance. In the
next section of this study we will discuss and present the conceptual model of the
relationships we have previously discussed.
CONCEPTUAL MODEL
Figure 1.2 is presented to graphically illustrate the constructs and proposed
relationships of the conceptual model to be tested in this study. Some of the linkages
that are hypothesized have been empirically tested. Among these is the link from
Porter’s Generic Strategy to performance, path A (Dess and Davis 1984), and the link
from resources/capabilities to performance, path B, Droge et al. (1994); Eckert and
15
Reproduced with permission of the copyright owner. Further reproduction prohibited without permission.

Fawcett (1996); Morash et al. (1996); Global Logistics Research Team at Michigan
State University (1995). There are, however, very few empirical links established
between resources/capabilities, strategy, (path C) and performance as proposed in the
conceptual model. Although, numerous linkages and relationships have been
hypothesized, very few, if any, of these relationships have been tested, as in path C.
It is, therefore, the goal of this research to test these linkages and to shed more light
on two differing views of strategy; that is, Porter’s Generic Strategy and the
Resource-Based Theory of the firm. Specifically, the results of this research should
show that superior performance will be achieved when resources/capabilities are
carefully matched with strategy. Thus, managers should be concerned with both
strategy and Resource-Based Theory of the firm. That is, it is quite important for
managers to understand that there are not right or wrong resources or right or wrong
strategies, but an understanding of both is needed.
16
Reproduced with permission of the copyright owner. Further reproduction prohibited without permission.

Reproduced
with perm
ission of the
copyright ow
ner. Further
reproduction prohibited
without
permission.
FIGURE 1.2A CONCEPTUAL MODEL OF THE CONSTRUCTS
AND RELATIONSHIPS
STRATEGY
COSTLEADERSHIPPath C
DISTINCTIVECAPABILITIES
DIFFERENTIATION
Path A
FIRMPERFORMANCE

PLAN OF THE DISSERTATION
The primary focus of this dissertation is to empirically examine the links
between distinctive capabilities, generic business strategies (specifically Porter’s
strategies of cost leadership and differentiation) and their relationships to firm
performance. This research attempts to ascertain which capabilities match best with
which strategy in order to produce superior firm performance. Lastly, as previously
mentioned, logistics and logistics capabilities have been put forth as an area of the
firm that can provide superior firm performance, competitive advantage and
therefore, a unique strategy for firms to pursue. Thus, this study examines these
relationships from within the logistics function.
Chapter I has been presented as an introduction and overview of the study.
Chapter II consists of the literature review. It is composed of an introduction, which
is followed by a section detailing Porter’s Generic Strategy. Next is a section
discussing the Resource-Based Theory of the firm and the numerous theoretical
works comprising this view. Distinctive Capabilities and Logistics Capabilities make
up the next two sections. In these sections both the theoretical support for these
concepts and related empirical studies are presented.
Chapter EH presents the methodology to be utilized in this study. Following
an introduction, the proposed model and specific hypotheses are presented. The next
section, data collection, details the research setting, the research approach to be
utilized, and the analytical technique to be employed. The next section discusses
measurement of the constructs. In this section the constructs of Strategy, Logistics
18
Reproduced with permission of the copyright owner. Further reproduction prohibited without permission.

Capabilities, and Performance are conceptualized, and measures of validity and
reliability are discussed.
Chapter IV, Research Findings is a detailed presentation of the results of this
study. Measurement of the constructs and results of the hypotheses testing are
presented. The sections are Introduction, Reliability, Validity, Discriminant Validity,
Hypotheses Testing and Hypotheses Supported. The first sections contain the results
of the analysis of each construct along with its validity, reliability and
unidimensionality. The Hypotheses Testing and Hypotheses Supported sections of
the study detail further the aforementioned psychometric properties of the constructs
and to what extent the hypothesized relationships transpired. Lastly, the Discussion
section details both the theoretical and practical implications of this study.
Chapter V, Conclusions, is separated into Introduction, Conclusions and
Implications, Limitations of the Study, Future Research, and Concluding Comments.
First, the contributions of this particular study are presented, both from a theoretical
and practical perspective. Next, the limitations of the study and, therefore,
suggestions for future research are presented. Lastly, in the concluding remarks
section, a discussion of the importance of this study and the lessons learned are
presented.
19
Reproduced with permission of the copyright owner. Further reproduction prohibited without permission.

CHAPTER n
LITERATURE REVIEW
INTRODUCTION
This chapter presents a somewhat detailed review of the relevant literature.
Discussed first is an overview of corporate level strategy and its relationship to firm
performance. This is followed by an explanation of Resource-Based Theory and
Distinctive Capabilities and the attempts to link these concepts to firm performance.
Finally, the research that identifies and analyzes Distinctive Capabilities in Logistics
is presented.
BUSINESS STRATEGY
One of the earliest writers concerned with strategy and the corporation was
Chandler (1962). Chandler viewed strategy as concerning itself with the long term
goals and objectives of the organization. He also proposed that strategy dealt with
the course(s) of action to follow and the allocation of resources to pursue the chosen
goals and objectives of the organization. Numerous authors have presented differing
paradigms by which to study strategy (Miles and Snow 1978; Porter 1980).
Miles and Snow (1978) proposed four differing typologies in their research.
These were defenders, prospectors, analyzers, and reactors. Defenders are typified by
firms that seek to protect their position, be it product or market driven. They do not
usually seek new markets and they mainly focus on efficiency in operations.
20
Reproduced with permission of the copyright owner. Further reproduction prohibited without permission.

Prospectors, on the other hand, constantly seek new products and markets in which to
compete. They tend to seek differentiation and embrace change easily. Analyzers
tend to straddle the fence and utilize components of the aforementioned two
strategies. That is, they attempt to be efficient at what they do, but are ready and
willing to enter new markets. Lastly, reactors seem to be risk averse and do not react
well to either change or environmental pressures. Porter (1980, 1985) presents a
view of strategy based on both market forces, and how firms might adapt to those
market forces. Of these two paradigms of strategy, we will utilize Porter’s Generic
Strategy in this study.
Porter’s Generic Strategy
Porter (1980, 1985) identified three different generic strategies that a firm
could pursue based on the underlying theories of industrial economics. The generic
competitive strategies he identified are cost leadership, differentiation and focus.
Cost leadership is when firms choose to pursue a low cost strategy. Cost leaders are
said to maintain a competitive advantage by keeping their per unit cost low compared
to the competition. Cost leaders tend to focus on efficiency to appeal to their cost-
sensitive customers. Firms that pursue differentiation appeal to a less price sensitive
customer by offering unique products or services. They achieve competitive
advantage by offering different products and/or services compared to the competition.
The last strategic choice identified by Porter was focus. Focus was said to involve a
strategy in which firms would try to concentrate on one particular market or segment
21
Reproduced with permission of the copyright owner. Further reproduction prohibited without permission.

of the market. Focus has since been considered less of a generic strategy and more of
a choice of arena (Day 1990). Additionally, Miller (1986) has suggested that focus
could not be pursued without one of the other two generic strategies. We are,
therefore, left with two ways a firm can gain competitive advantage; through cost
leadership or through differentiation.
Dess and Davis (1984) attempted to empirically test Porter’s theory. They
examined both the three generic strategies hypothesized by Porter, that is, cost-
Ieadership, differentiation, and focus. Additionally, they attempted to link these three
strategic choices to performance. Although their results were mixed, they did support
some links from having a chosen strategy to firm performance as well as supporting
Porter’s hypothesized generic strategies, to one degree or another. Dess and Davis
employed a three stage study. First, in phase one of their study they examined the
relationship between a firm’s ‘intended’ (Mintzberg 1978) strategy and Porter’s three
generic strategies. In phase two of their study they employed a panel of experts to
ascertain the importance of the ‘intended’ strategy along with the ‘competitive
methods’ employed by the firms, and the match to each generic strategy typology. In
phase three of the study they then clustered firms based upon the chief executive
officer’s (CEO) perceptions into groups with similar strategic orientation. Lastly,
these clustered groups were examined, by industry, to ascertain if there were any
significant differences between firms in like industries, but in different strategic
clusters. Their results were firms that did pursue a strategy, did perform better than
firms that did not. Additionally, they found a stronger link between cost leadership
22
Reproduced with permission of the copyright owner. Further reproduction prohibited without permission.

and return on total assets, then compared to a differentiation strategy. Also, a link
between firms that are focused and sales growth did materialize. As can be seen by
these studies, the strategy one decides to pursue may be quite important to firm
performance. Next, we examine some additional streams of research that seem to
support some of the relationships proposed in this thesis.
Additional Theoretical Support
Most authors would agree that one must have some level of resources in order
to pursue a given strategy. Recently, however, the emphasis has begun to shift
somewhat away from merely a reliance on strategy first and foremost, followed by
employing some level of resources to a newer paradigm based on resources being of
at least equal stature in the pursuit of one’s strategy (Barney 1991; Day 1994). There
are numerous streams of research that can both expand on the above thought and add
credence to the linkages we hypothesize. Presented here are additional streams of
research that add theoretical and empirical support to the hypothesized relationships
presented in this study.
Webster (1992) believes that superior value to customers through key
strategic resources of the firm will replace marketing management paradigms of the
past. If Webster is correct, the implications for marketing strategy and resource-
based theories of the firm are enormous and far reaching. The previous paradigms of
basing marketing strategy primarily on the marketplace (Porter 1980; 1985) may
indeed be replaced by strategies based upon firm distinctive capabilities/resources
23
Reproduced with permission of the copyright owner. Further reproduction prohibited without permission.

(Barney 1991; Day 1994) in order to remain competitive. If the future holds that
firms must base their strategies on their distinctive capabilities to remain competitive
and to provide customer value and firm performance, as Webster postulates, then
utilization of capabilities and resources within the firm, matched with the appropriate
strategy, may become of paramount importance. Such might be the case of the
aforementioned Wal-Mart and Levi’s examples.
Hrebiniak and Snow (1982) examined the role of agreement among top
managers and its relation to firm performance. Their findings were that top
management agreement on the firms’ strengths and weaknesses (Barney 1991) were
positively correlated to firm performance. These functional strengths and weaknesses
correlate closely to resources or distinctive capabilities (Barney 1991; Day 1994).
This being the case, distinctive capabilities may be connected to firm performance.
A number of other studies examined the areas of service and customer
service, two areas which are intrinsically tied to logistics both at the functional and
theoretical level, and as previously mentioned, might provide firms with a
competitive edge (Christopher 1993). McKenna (1991) points to the need for a new
paradigm in marketing strategy in which the customer is integrated into the company.
Schlesinger and Heskett (1991) call for a new model of the firm that provides high
quality customer service and a logic based on service. Therefore, a strategy based
upon distinctive capabilities and superior performance may create superior customer
value, especially in the logistics field, which is, by its very nature, service oriented.
Along similar lines of thought concerning service, Anderson, Fomell, and Lehmann
24
Reproduced with permission of the copyright owner. Further reproduction prohibited without permission.

(1994) report that quality, customer satisfaction and profitability are linked positively.
Bolton and Drew (1991) suggest that there is a strong relationship between a firm’s
change in service and customers' attitudes about that firm. Kelley et al. (1992) report
that the customer must be involved in providing both information and effort in order
to receive superior service.
Following this same line of thought, but more closely tied to logistics was a
study by Gattrona et al. (1991) in which they examined supply chain management
and developed what they term ‘logics’ to provide superior customer service in the
logistics field. They postulate companies that employ the appropriate logics may
achieve superior customer service and thereby competitive advantage. They examine
these logics from the standpoint of a firm being able to utilize the correct logic for
that particular firm's strategy. Although only theoretical in nature, these ‘logics’ also
coincide consummately with the hypothesized capabilities - strategy - performance
relationship hypothesized here.
Additionally, research into the area of market orientation seems to offer added
theoretical support for this study. Two areas of particular similarity involve the
resources of the firm and the long term nature of these resources as theorized by
Barney (1991). Narver and Slater (1990) discuss market orientation from the
standpoint of the firm being able to use its resources to provide superior customer
value. Slater and Narver (1994) point to the long term benefits of market orientation.
This, according to these authors, should be juxtaposed to a firm being too
competition oriented which may be short term and transient in nature. These beliefs
25
Reproduced with permission of the copyright owner. Further reproduction prohibited without permission.
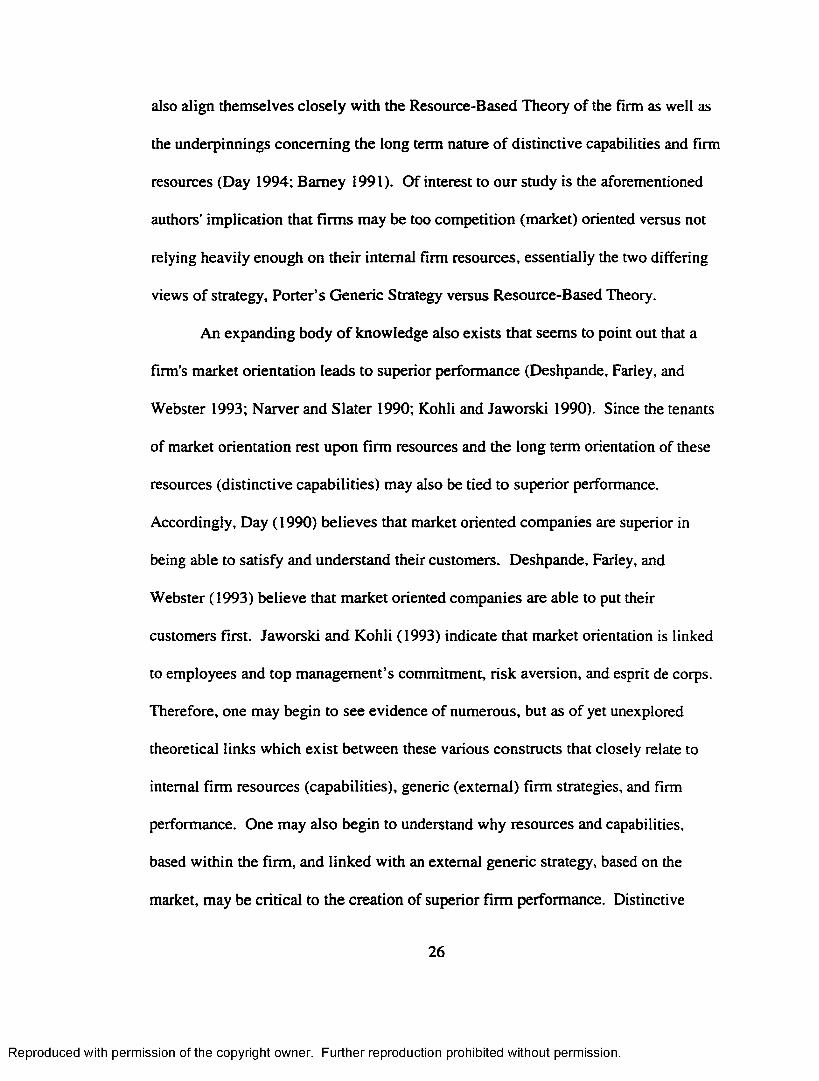
also align themselves closely with the Resource-Based Theory of the firm as well as
the underpinnings concerning the long term nature of distinctive capabilities and firm
resources (Day 1994; Barney 1991). Of interest to our study is the aforementioned
authors’ implication that firms may be too competition (market) oriented versus not
relying heavily enough on their internal firm resources, essentially the two differing
views of strategy, Porter’s Generic Strategy versus Resource-Based Theory.
An expanding body of knowledge also exists that seems to point out that a
firm’s market orientation leads to superior performance (Deshpande, Farley, and
Webster 1993; Narver and Slater 1990; Kohli and Jaworski 1990). Since the tenants
of market orientation rest upon firm resources and the long term orientation of these
resources (distinctive capabilities) may also be tied to superior performance.
Accordingly, Day (1990) believes that market oriented companies are superior in
being able to satisfy and understand their customers. Deshpande, Farley, and
Webster (1993) believe that market oriented companies are able to put their
customers first. Jaworski and Kohli (1993) indicate that market orientation is linked
to employees and top management’s commitment, risk aversion, and esprit de corps.
Therefore, one may begin to see evidence of numerous, but as of yet unexplored
theoretical links which exist between these various constructs that closely relate to
internal firm resources (capabilities), generic (external) firm strategies, and firm
performance. One may also begin to understand why resources and capabilities,
based within the firm, and linked with an external generic strategy, based on the
market, may be critical to the creation of superior firm performance. Distinctive
26
Reproduced with permission of the copyright owner. Further reproduction prohibited without permission.

capabilities may form this critical strategic link by which the organization is able to
achieve superior performance and competitive advantage (Day 1994).
It becomes apparent that the numerous connections proposed by the above
authors relate to, and may add additional theoretical support for the linkages we
suggest. It is therefore hypothesized that one may gain superior performance via the
combination of the appropriate distinctive logistical capabilities, and the correctly
matched generic business strategy(ies). The linkages suggested here may be seen in
the accompanying conceptual model (Figure 1.2). The hypothesized model along
with the exact hypotheses are presented in Chapter HI.
RESOURCE-BASED THEORY
Resource-Based Theory is the foundation upon which the concept of
distinctive capabilities is based. In past strategy research, resource-based models
dealt with the firm’s internal analysis such as the firm’s strengths and weaknesses
from a traditional “strengths-weaknesses-opportunities-threats” perspective (Barney
1991). Resource-Based Theory has now evolved to also include the intangible
resources that a firm can bring to bare in order to attain and sustain superior firm
performance, and hence, a competitive advantage.
How a firm achieves such a competitive advantage and maintains that
competitive advantage form some of the key questions for strategy research. Porter
(1980) points to a competitive forces approach in which a firm examines the external
environment -- such as the market and its rivals ~ and then develops the appropriate
27
Reproduced with permission of the copyright owner. Further reproduction prohibited without permission.
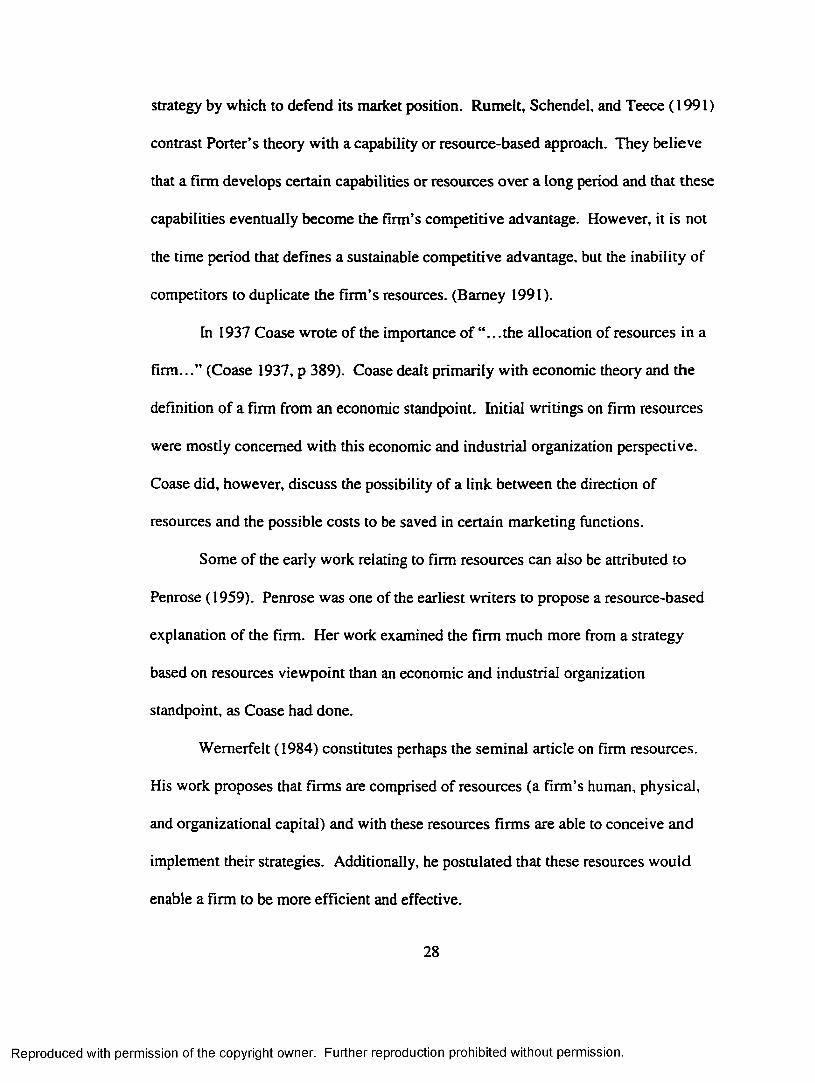
strategy by which to defend its market position. Rumelt, Schendel, and Teece (1991)
contrast Porter’s theory with a capability or resource-based approach. They believe
that a firm develops certain capabilities or resources over a long period and that these
capabilities eventually become the firm’s competitive advantage. However, it is not
the time period that defines a sustainable competitive advantage, but the inability of
competitors to duplicate the firm’s resources. (Barney 1991).
In 1937 Coase wrote of the importance of “...the allocation of resources in a
firm...” (Coase 1937, p 389). Coase dealt primarily with economic theory and the
definition of a firm from an economic standpoint. Initial writings on firm resources
were mostly concerned with this economic and industrial organization perspective.
Coase did, however, discuss the possibility of a link between the direction of
resources and the possible costs to be saved in certain marketing functions.
Some of the early work relating to firm resources can also be attributed to
Penrose (1959). Penrose was one of the earliest writers to propose a resource-based
explanation of the firm. Her work examined the firm much more from a strategy
based on resources viewpoint than an economic and industrial organization
standpoint, as Coase had done.
Wemerfelt (1984) constitutes perhaps the seminal article on firm resources.
His work proposes that firms are comprised of resources (a firm’s human, physical,
and organizational capital) and with these resources firms are able to conceive and
implement their strategies. Additionally, he postulated that these resources would
enable a firm to be more efficient and effective.
28
Reproduced with permission of the copyright owner. Further reproduction prohibited without permission.

Mahoney and Pandian (1992) took this resource-based view a step further by
developing a generalizable theory of a firm’s corporate strategy and of the firm’s
growth. Their Resource-Based Theory is founded upon a firm's distinctive
competencies and capabilities.1 These authors offer a number of propositions with
which to test their theory. They also discuss that it is management’s job to determine
how to best utilize the firm’s distinctive capabilities for competitive advantage.
Barney (1991) wrote perhaps the most in-depth and thought provoking
explanation of the Resource-Based Theory of the firm. Barney contemplated the link
between sustainable competitive advantage and firm resources and laid out a
framework by which to identify firm resources. He postulated that there were four
indicators of firm resources. They are value, rareness, imitability, and sustainability
(Barney 1991). Barney believed that in order for the resource to truly provide the firm
with superior performance and competitive advantage it was necessary that these
criteria be met. A description of each of the indicators of firm specific resources is
outlined below.
Value: According to Barney, resources are valuable if they allow a
firm to be more efficient or effective in pursuing their chosen strategy, that is,
they can exploit opportunities and neutralize threats.
‘Consistent with Day (1994), the terms competencies and capabilities are used essentially interchangeably.
29
Reproduced with permission of the copyright owner. Further reproduction prohibited without permission.
Rareness: Resources are considered rare when a firm’s existing or
potential competitors do not posses the same resource. If it were the case that
most competitors possessed the same resource, then there would be no
competitive advantage according to Bamey.
Imitability: Bamey refers to this as imperfectly imitable resources.
What he means by this is that these firm specific resources are not easily
copied by one's competition. This lack of ability to be copied by the
competition may be explained by many factors. Two of the explanations cited
by Bamey are that either unique historic conditions may have occurred, or the
resources may be socially complex in nature, and therefore, difficult to copy.
Sustainability: By sustainability Bamey believes that competing firms
should not be able to substitute similar or different resources that might allow
them to conceive of or implement the same strategy as their competitors.
At this point it might be important to expand upon the underlying differences
between Barney’s view of strategy versus Porter’s views on the subject. Porter
(1981) postulates that firms within the same strategic group are identical in terms of
available resources and in terms of strategic choices they pursue. Additionally, it has
been postulated that if there were differences in resource availability, for example,
first mover advantage that these differences would not last long (Bamey 1986). This
should be sharply contrasted with Barney’s (1991) view of strategy. He proposes the
above model that assumes resource heterogeneity rather than homogeneity, and that
30
Reproduced with permission of the copyright owner. Further reproduction prohibited without permission.
this resource heterogeneity can be long lasting and provide the firm with sustainable
competitive advantage.
Bamey (1995) extends his earlier work by looking at various firms and their
internal strengths and weaknesses. He believes firms must look inside at their own
firms’ specific resources, that is, their strengths and weaknesses for competitive
advantage. He once again proposes that firms can have and hold a competitive
advantage and/or superior performance based upon these firm resources/capabilities.
In this article he discusses a number of exemplars of this Resource-Based Theory.
He again postulates that these resources must meet his four criteria, that is, be
valuable, rare, sustainable, and difficult to imitate. Among some of the examples he
uses is Wal-Mart versus K-Mart. He believes that Wal-Mart has been able to
maintain its competitive advantage through the use of its point of purchase and
inventory control systems, that is, logistics capabilities. Although K-Mart has tried to
duplicate these systems, even hiring some of Wal-Marts’ employees, they have been
unable to duplicate Wal-Marts’ rare capabilities (Bamey 1995).
Miller and Shamsie (1996) offer one of the few empirical tests of the
Resource-Based Theory of the firm. The study done by these authors offers promise
in terms of shedding some additional light on the relationships hypothesized in our
study. The reason for this is that their study is one of the first to actually link firm
performance to firm specific resources (Bamey 1991). In their study they examined
and tested the Resource-Based Theory in the motion picture industry from 1936 to
1965 utilizing historical data. Their findings were that financial performance was
31
Reproduced with permission of the copyright owner. Further reproduction prohibited without permission.
enhanced through ‘property-based resources,’ that is, exclusive long term contracts
with theaters and starts in more stable environments (1936-1950). Additionally,
‘knowledge-based resources,’ that is, talent in the form of production and
coordination, enhanced financial performance in more unpredictable environments
(1951-1965). The authors, in commenting on the Resource-Based Theory believe
that:
“The resource-based view of the firm provides a useful compliment to Porter’s (1980) well-known structural perspective of strategy. This view shifts the emphasis from the competitive environment of firms to the resources that firms have developed to compete in that environment. Unfortunately, although it has generated a great deal of conceptualizing. ..the resource-based view is just beginning to occasion systematic empirical study...” (Miller and Shamsie 1996, p. 519).
With the importance o f an alternative view of strategy in place, or one that
might complement Porter’s view of strategy, we now turn our attention to distinctive
capabilities and logistics capabilities.
DISTINCTIVE CAPABILITIES
Distinctive capabilities are “complex bundles of skills and accumulated
knowledge, exercised through organizational processes, that enable firms to make use
of their assets” and “functions like a key success factor” (Day 1994, p. 38).
Capabilities are created by a firm being able “to deliver value to customers in an
appreciably more cost effective way” (Day 1994, p. 39). Capabilities are “...the glue
that brings ... assets together and enables them to be deployed advantageously” (Day
32
Reproduced with permission of the copyright owner. Further reproduction prohibited without permission.

1994, p. 38). Some examples of distinctive capabilities provided by Day (1994) are:
Wal-Mart’s unmatched logistics capabilities through cross-docking; the unparalleled
consistency of the McDonald’s Corporation; and L.L. Bean’s superior order
fulfillment processes.
Leonard-Barton (1992) explains that capabilities are based on knowledge and
are distributed on four separate dimensions. These dimensions are knowledge and
skills, technical systems, management systems, and values and norms. The author
describes capabilities as being composed of these distinctive skills and managerial
and technical systems. Twenty-one case studies are presented by the author that
outline the above dimensions and show support for the theory.
Hall (1993) proposes that capabilities are intangible resources of the firm. He
goes on to link these capabilities with competitive advantage through the use of six
case studies. He postulates that firms are able to maintain their competitive
advantage through their capabilities. Black and Boal (1994) discuss competitive
advantage as it relates to resource-based theories as well. They propose that certain
traits of the firm may play a role in sustainable competitive advantage. The traits
mentioned in this study are numerous and, according to the authors, may be
combined to form “factors” that would allow firms to maintain their competitive
position. The traits and factors mentioned by Black and Boal appear to be linked
closely to capabilities.
Stalk et al. (1992) argue that firms in the 1990s and beyond will be based on
what the authors call “capabilities-based competition" (Stalk, Evans and Shulman
33
Reproduced with permission of the copyright owner. Further reproduction prohibited without permission.

1992, p. 57). They discuss a number of firms and the capabilities these firms have
used to get to the top in their respective fields. Although anecdotal in nature, these
authors do lend credence to the distinctive capabilities approach to strategy. These
authors also believe these capabilities are what will enable companies to compete in
the long run.
Prahalad and Hamel (1990) discuss that certain firms possess core
competencies. These core competencies are what enables the firm to outperform its
competitors. Core competencies, in their opinion, are defined as intangible higher
order resources. Lastly, Hunt and Morgan (1995) discuss the fact that both a firm’s
resources and its competencies may account for that firm's competitive advantage.
Some of the resources and competencies they cite are: human competencies (for
example, “the skills and knowledge of individual employees”), organizational
competencies, informational competencies, and relational competencies.
As can be seen, a great deal of theory, case studies and anecdotal evidence
exists which seems to support the existence of distinctive capabilities within the firm.
However, little empirical evidence exists concerning how to define distinctive
capabilities. Additionally, one of the most important considerations is the possibility
of linking distinctive capabilities to superior firm performance and accordingly
sustainable competitive advantage. It may be equally important that firms couple
their distinctive capabilities with the appropriate generic strategies in order to attain
superior firm performance.
34
Reproduced with permission of the copyright owner. Further reproduction prohibited without permission.

Day (1994) believes that capabilities reside on a continuum. This continuum
consists of an external emphasis and an internal emphasis. Outside-in processes
represent the external emphasis, inside-out processes the internal emphasis, and
spanning processes lie in the middle. Day classifies capabilities in the following
manner.
Outside-in Processes: Which are composed of market sensing,
customer linking, channel bonding, and technology monitoring capabilities.
Spanning Processes: That consist of customer order fulfillment,
pricing, purchasing, customer service delivery, new product/ service
development, and strategy development.
Inside-out Processes: That consist of financial management, cost
control, technology development, integrated logistics, manufacturing/
transformation processes, human resources management, and environment
health and safety capabilities.
Droge et al. (1994) examined the key sources of competitive advantage in the
furniture industry in which they developed three “competency constructs.” The
competencies that they defined were marketing competency, innovation (product
design and development) competency, and manufacturing competency. Their
exploratory findings indicate that competency in innovation may be a key source of
competitive advantage. They examined 31 capabilities that they developed through
35
Reproduced with permission of the copyright owner. Further reproduction prohibited without permission.

an extensive literature review. These capabilities are: product flexibility, volume
flexibility, process flexibility, low production cost, new product introduction,
delivery speed, delivery dependability, production lead time, product reliability,
product durability, quality (conform to specifications), design quality/innovation,
product development cycle time, product technological innovation, product
improvement, new product development, original product development, brand image,
competitive pricing, low price, advertising/promotion, target market
identification/selection, responsive to target market, pre-sale customer service, post
sale customer service, broad product line, widespread distribution coverage, low cost
distribution, selective distribution, personal sales proficiency, and company
reputation. These 31 capabilities comprised the above referenced competencies.
They consider these functional area competencies sources of competitive advantage.
Next, we examine these distinctive capabilities in the logistics area of the firm.
LOGISTICS CAPABILITIES
Recently, capabilities have been examined in the logistics area (Global
Logistics Research Team 1995, Eckert and Fawcett 1996, Morashetal. 1996). By
far, the largest undertaking to examine logistical capabilities to date were done by
Global Logistics Research Team (GLRT) and published in 1995 by the Council of
Logistics Management in World Class Logistics: The Challenge o f Managing
Continuous Change. The GLRT study was part of an ongoing research project to
better understand the role of logistics in business. The research design included a
36
Reproduced with permission of the copyright owner. Further reproduction prohibited without permission.
baseline survey that was administered by mail in 11 countries. Also employed were
in-depth interviews and completion of accompanying workbooks in Europe, North
America, and the Pacific Basin. The base line survey resulted in 3,693 usable
responses, a response rate of 17.1 % overall. This survey was designed to: identify
trends in global logistics, elaborate on superior logistics performance, and to
prioritize concerns in logistics (Global Logistics Research Team 1995, p. 7). The in-
depth interview and workbook sample consisted of 111 firms representing 17 nations.
These firms were selected by logistics experts as having the most potential for
possessing superior logistical capabilities. This research project identified four
logistics competencies that are: positioning, integration, agility, and measurement.
The 17 capabilities that they mentioned are grouped into what the authors call
competencies. These competencies are composed of 17 capabilities. A list and
explanation of each competency/capability may be seen in the following table.
Daugherty and Pittman (1995) examined competitive advantage in the
logistics field with interviews of Fortune 500 firms. They believe that time-based
capabilities are of critical importance in logistics. They believe that “Speed...can
annihilate the competition.” (Daugherty and Pittman, 1995 p. 54). Additionally, the
authors mention that information technology, as well as communications through
information technology, and flexibility to be important capabilities.
Eckert and Fawcett (1996) examined the critical capabilities for logistical
excellence and defined them as people, quality, and time. The items they used may
be seen in Table 2.2.
37
Reproduced with permission of the copyright owner. Further reproduction prohibited without permission.

Morash et al. (1996) defined logistics capabilities needed for competitive
advantage as, delivery reliability, post-sale customer service, responsiveness to target
market, delivery speed, pre-sale customer service, widespread distribution coverage,
selective distribution coverage, and low total cost distribution. Clinton and Closs
(1997) in examining the underlying factors associated with logistics strategy arrived
at five factors that are; alliances, information systems, EDI practices, inventory
management, and re-engineering.
Chapter HI will follow. In Chapter El the methodology, research setting and
measures to be employed are presented.
38
Reproduced with permission of the copyright owner. Further reproduction prohibited without permission.
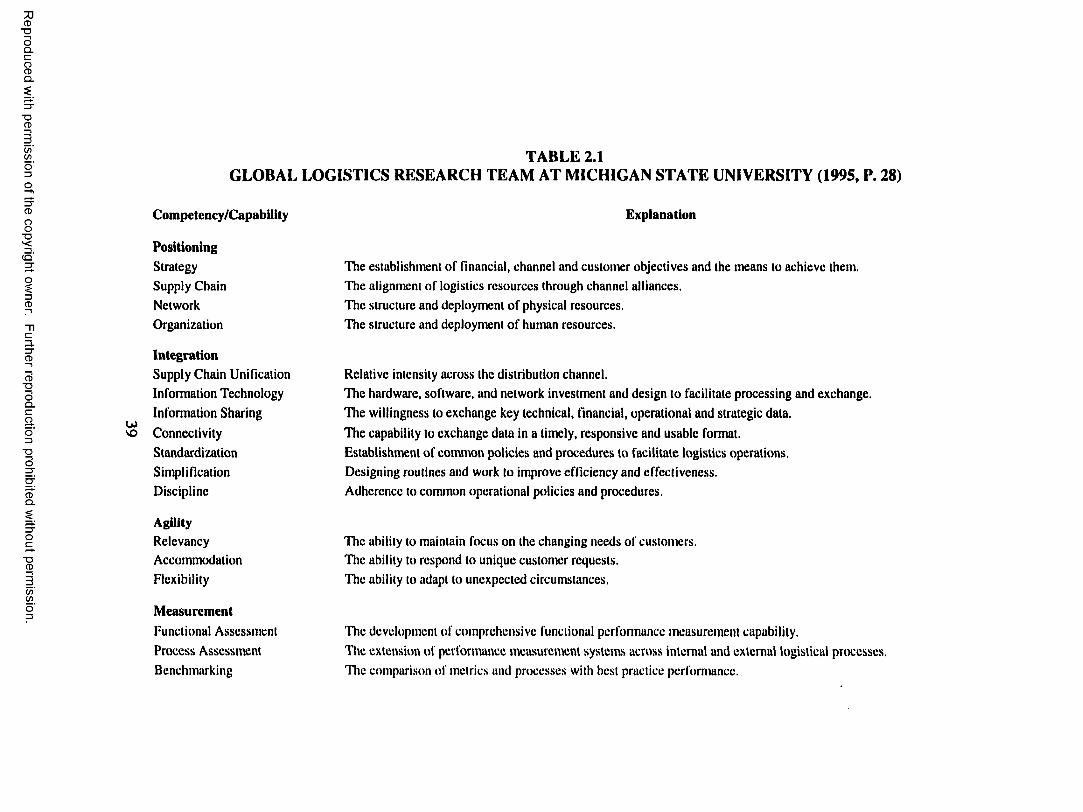
Reproduced
with perm
ission of the
copyright ow
ner. Further
reproduction prohibited
without
permission.
TABLE 2.1GLOBAL LOGISTICS RESEARCH TEAM AT MICHIGAN STATE UNIVERSITY (1995, P. 28)
Competency/Capability Explanation
u>NO
PositioningStrategy Supply Chain Network Organization
IntegrationSupply Chain UnificationInformation TechnologyInformation Sharing
ConnectivityStandardizationSimplificationDiscipline
AgilityRelevancyAccommodationFlexibility
MeasurementFunctional Assessment Process Assessment Benchmarking
The establishment of financial, channel and customer objectives and the means to achieve them.The alignment of logistics resources through channel alliances.The structure and deployment o f physical resources.The structure and deployment o f human resources.
Relative intensity across the distribution channel.The hardware, software, and network investment and design to facilitate processing and exchange.
The willingness to exchange key technical, financial, operational and strategic data.
The capability to exchange data in a timely, responsive and usable format.Establishment of common policies and procedures to facilitate logistics operations.Designing routines and work to improve efficiency and effectiveness.Adherence to common operational policies and procedures.
The ability to maintain focus on the changing needs of customers.The ability to respond to unique customer requests.
The ability to adapt to unexpected circumstances.
The development of comprehensive functional performance measurement capability.
The extension of performance measurement systems across internal and external logistical processes. The comparison of metrics and processes with best practice performance.

CHAPTER HI
METHODOLOGY
INTRODUCTION
Chapter I served as an introduction and overview of the problem being
researched. Chapter II provided a review of the literature as it relates to the
hypothesized Capabilities - Strategy - Performance relationship(s). As can be seen
from the previous two chapters, a number of questions remain unanswered that need
to be researched. Specifically, the question to be answered by this research is: Do
firms that match their capabilities to an appropriate business strategy perform better
than firms that do not? Chapter I attempted to illustrate conceptually the need to
match certain resources/capabilities with specific strategies. In the next section of
this chapter, a more detailed model is presented along with the hypotheses to be
tested. The section that follows details the research design. That section provides
details on the research setting, the method to be employed, and the data collection
procedures. This is followed by a section detailing the measurement of the various
constructs to be utilized: Logistics Capabilities, Generic Business Strategy, and
Performance.
HYPOTHESIZED MODEL
Figure 3.1 is provided as a graphical depiction of the hypothesized model.
The importance of capabilities (resources) and the link to various generic strategies is
40
Reproduced with permission of the copyright owner. Further reproduction prohibited without permission.
presented. With all of the proper elements in place, it is hypothesized that firms that
posses distinctive capabilities that cannot be imitated (Barney 1991) and that offer a
long term advantage in the marketplace (Hitt and Ireland 1986) should chose a
strategy that matches those capabilities in order to achieve superior firm performance.
41
Reproduced with permission of the copyright owner. Further reproduction prohibited without permission.
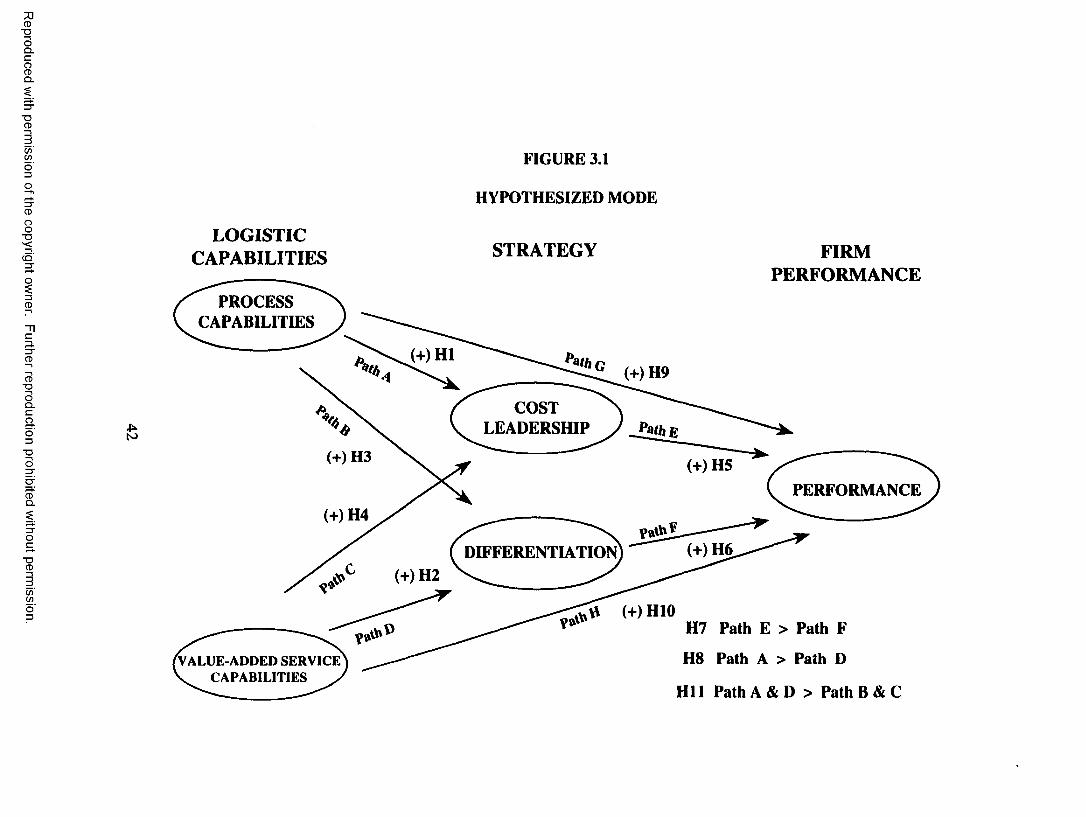
Reproduced
with perm
ission of the
copyright ow
ner. Further
reproduction prohibited
without
permission.
FIGURE 3.1
HYPOTHESIZED MODE
LOGISTICCAPABILITIES STRATEGY FIRM
PERFORMANCEPROCESS
CAPABILITIES
(+)H1(+) H9
COSTLEADERSHIP
(+) H3 (+) H5PERFORMANCE
(+)H4
(+) H6DIFFERENTIATION(+) H2
(+) H10H7 Path E > Path
H8 Path A > PathVALUE-ADDED SER V IC E V C A PA B ILITIES >
H ll Path A & D > Path B & C

HYPOTHESES
The following hypotheses are presented in support of the various linkages
suggested by the existing literature that has been presented previously; that is,
Capabilities - Strategy - Performance. Many authors have discussed the possible
links from resources to performance (Barney 1991; Hall 1993). Additionally, authors
have tried to link capabilities to performance (Day 1994; Hitt and Ireland 1986;
Droge et al. 1994; Morash et al. 1996). However, one of the gaps that seems to exist
in these research streams is linking capabilities to strategy, and then to performance.
Barney (1991) discusses the importance of resources in pursuing one's strategy.
Additionally, Porter (1996) discusses how important a firm’s activities and resources
are in pursuing one’s chosen strategy. However, central to this research is the
proposition that some firms will be more successful than others in their selection of
capabilities and strategy. Moreover, it is proposed here that the capabilities a firm
employs will match its chosen strategy. Therefore, it is hypothesized that:
H 1 Process capabilities will be positively linked to a Cost Leadership
strategy (Path A);
H2 Value Added Service capabilities will be positively linked to a
Differentiation strategy (Path D).
Additionally, based on the work of Porter (1980), Barney (1991), and Day
(1994) it is hypothesized that firms will employ any and all resources to achieve their
given strategy. The importance of resources in pursuing one’s strategy is not at
43
Reproduced with permission of the copyright owner. Further reproduction prohibited without permission.
contention here. What is at contention is the issue of the match (or fit) of these
resources to the correct strategy. Porter (1996) discusses the need for resources and
activities to support one’s chosen strategy. Barney (1991) also stresses the
importance of firm resources. Additionally, Day (1994) and Droge et al. (1994),
among others discusses the need for capabilities and resources. Therefore, in
addition to the previously hypothesized links from process (or value added service)
capabilities to cost leadership (or differentiation) strategy, there will be firms that
have not carefully matched their capabilities with their strategy. That is, some firms
will be less successful in selecting a strategy that matches their capabilities. Thus, it
is hypothesized that:
H3 Process capabilities will be positively linked to a Differentiation
strategy (Path B);
H4 Value Added Service capabilities will be positively linked to a Cost
Leadership strategy (Path C).
In testing Porter’s theory, Dess and Davis (1984) established linkages from
strategy to firm performance. Additionally, Dess and Davis (1984) found somewhat
stronger links from cost leadership to the more traditional measures of firm
performance (i.e., return on total assets) than from differentiation. These traditional
measures of firm performance are utilized in this research. Thus, consistent with
Dess and Davis’ findings concerning the relationship between Porter’s strategies and
firm performance, it is hypothesized that:
44
Reproduced with permission of the copyright owner. Further reproduction prohibited without permission.
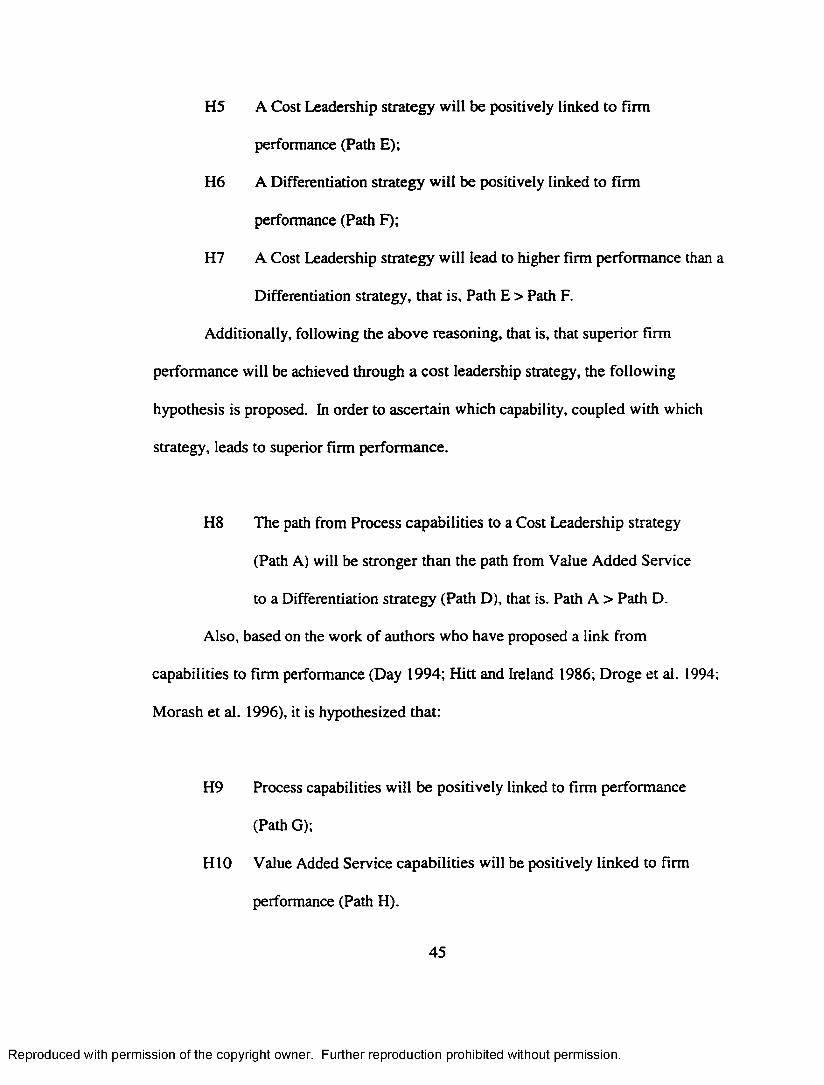
H5 A Cost Leadership strategy will be positively linked to firm
performance (Path E);
H6 A Differentiation strategy will be positively linked to firm
performance (Path F);
H7 A Cost Leadership strategy will lead to higher firm performance than a
Differentiation strategy, that is, Path E > Path F.
Additionally, following the above reasoning, that is, that superior firm
performance will be achieved through a cost leadership strategy, the following
hypothesis is proposed. In order to ascertain which capability, coupled with which
strategy, leads to superior firm performance.
H8 The path from Process capabilities to a Cost Leadership strategy
(Path A) will be stronger than the path from Value Added Service
to a Differentiation strategy (Path D), that is. Path A > Path D.
Also, based on the work of authors who have proposed a link from
capabilities to firm performance (Day 1994; Hitt and Ireland 1986; Droge et al. 1994;
Morash et al. 1996), it is hypothesized that:
H9 Process capabilities will be positively linked to firm performance
(Path G);
H10 Value Added Service capabilities will be positively linked to firm
performance (Path H).
45
Reproduced with permission of the copyright owner. Further reproduction prohibited without permission.

Additionally, as a further test of the hypothesized f i t , that is, that firms will
match their capabilities to the appropriate strategy, it is hypothesized that:
HI 1 The paths from Process capabilities to a Cost Leadership strategy, and
from Value Added Service to a Differentiation strategy (Path A &
Path D) will be stronger than the paths from Process capabilities to a
Differentiation strategy, and from Value Added Service capabilities to
a Cost Leadership strategy (Path B & Path C), that is, Path A & D >
Path B & C.
RESEARCH DESIGN
The methodology to be employed in this research is designed to be
confirmatory rather than exploratory in nature. It is expected that the relationships
hypothesized will be confirmed based on a partial test of existing theory.
Research Setting and Method
The primary objective of this research is to examine the relationships between
distinctive capabilities, generic business strategy, and firm performance. As
previously mentioned, the logistics function is utilized to test the proposed model
since logistics has a great deal of promise as a future arena of strategy, and logistics
capability scales presently exist. To further narrow the scope of the study, the
research setting that was chosen is the retail grocery industry. This industry has been
46
Reproduced with permission of the copyright owner. Further reproduction prohibited without permission.

selected for a number of reasons. First, although somewhat less generalizable,
utilizing just one industry allows for more control of extraneous variables and is well
suited for theory testing. Second, some grocery chains are clearly cost-leaders and
some are clearly differentiated. Third, in the retail grocery business, logistics is of
paramount importance due to the low margins, numerous inventory turns, and the
perishable nature of the products. Additionally, as an exploratory step in this
research process, a large retail grocery chain has provided information relative to its
strategy and the capabilities needed to achieve Having had the opportunity to be
involved in this firm’s strategic planning process should prove invaluable to this
research endeavor. Finally, this writer has spent sixteen years in the retail industry
which provides a good foundation from which to conduct this study.
In this study, confirmatory factor analysis via LISREL (Joreskog and Sorbom
1989) is employed to develop the actual distinctive capability items related to process
and value added service capabilities, as well as the strategy items. This confirmatory
factor analysis via LISREL does, of course, help to examine discriminant validity and
reliability issues. LISREL was also utilized to test the hypotheses via various
structural models to examine the proposed relationships between distinctive
capabilities, generic strategy, and firm performance.
Data Collection
A key informant survey research strategy was employed in this study
(Campbell 1955). The subjects consisted of the CEO, vice president or director of
47
Reproduced with permission of the copyright owner. Further reproduction prohibited without permission.
logistics from retail grocery chains across the nation. These informants should be
well aware of the business strategy employed and should be responsible for
implementing that strategy at the functional level. This follows Campbell’s (1955)
suggestions that key informants be both knowledgeable about the issues being studied
and willing and able to communicate this information. Although this technique has
received some criticism (Philips 1981), it has also been suggested that there may be
no other viable alternative where gaining information from top managers is
concerned (John and Reve 1982). A survey was mailed with a cover letter outlining
the goals of the research along with directions for filling out the survey. Before the
survey was mailed, phone calls were made to each grocery chain to verify the correct
individual to contact and then contact was made with that individual in order to
generate interest in the study and, hence, a good response rate.
MEASUREMENT OF CONSTRUCTS
Logistics Capabilities
Given that the bulk of strategy research has focused on external market
factors (Porter 1980; Dess and Davis 1984), enhancing features such as the firm’s
competitive advantage via internal resources/capabilities is relatively new in the
literature (Barney 1991; Day 994). Dess and Davis (1984) examined Porter’s
Generic Strategies and were able to group firms by the strategies originally postulated
by Porter. A similar methodology was employed here to enhance existing knowledge
concerning distinctive capabilities and their link to Porter’s cost leadership and
48
Reproduced with permission of the copyright owner. Further reproduction prohibited without permission.

differentiation strategies. Additionally, this approach may offer further insight into
the alternative strategy paradigm of Resource-Based Theory. Dess and Davis (1984)
developed the items that made up the scale by which to measure Porter’s Generic
Strategies. In this study the items that are used to measure capabilities have been
obtained from the logistics area since scales currently exist (Global Logistics
Research Team at Michigan State University 1995). However, the method employed
by Dess and Davis (1984) (i.e., utilizing a panel of experts and factor analysis) was
used to ascertain which logistics capabilities are necessary to successfully pursue a
specific strategy (i.e., cost leadership versus differentiation).
The panel of experts did help to ascertain which distinctive logistics
capabilities are most likely cost leadership oriented, and which distinctive logistics
capabilities are most likely differentiation oriented. The measurement of capabilities
were accomplished using the 32 logistics performance measurements along with the
managers’ perceptions of relative performance in comparison to competitors found in
the Global Logistics Research Team at Michigan State University (1995) study.
These measures may be seen in Table 3.1. Of the 32 measures, 17 were found to be
significant at the . 10 level, and of those 17, ten were significant at the .05 level. Even
though only half of these measures were significant, all 32 measures were initially
employed in this study. The 32 measures were split by the panel of experts to form
the initial dimensions of distinctive logistics capabilities previously mentioned (i.e.,
process capabilities and value-added service capabilities). Thereafter, factor analysis
was performed on the manager’s responses to formalize the final factors.
49
Reproduced with permission of the copyright owner. Further reproduction prohibited without permission.

TABLE 3.1MEASURES OF LOGISTICS CAPABILITIES:
GLOBAL LOGISTICS RESEARCH TEAM AT MICHIGAN STATEUNIVERSITY (1995, P. 313)
Capability Performance Measures Correlation With Performance
P-Val
Product Flexibility .394 .002*Volume Flexibility .106 .231Process Flexibility .218 .030*Low Logistics Cost .179 .068*Delivery Speed .122 .147Delivery Dependability .268 .001*Problem Avoidance .155 .091*Problem & Complaint Resolution .140 .113Responsiveness to Key Customers .214 .035*Order Fill Capacity .218 .029*Value-Added Service .289 .005*Widespread Distribution Coverage .127 .139Selective Distribution Coverage .120 .155Customer Service Flexibility .247 .015*Product Introduction .337 .001*Product Phase Out .076 .255Disruption in Supply .178 .062*Product Recall .107 .181Product Flexibility During Logistics .193 .059*Location Flexibility .106 .185Reverse Logistics Timing .129 .153Differentiation .159 .088*Product Innovation .200 .041*Order Flexibility .397 .001*Delivery Time Flexibility .013 .455Expedited Delivery .144 .108Advanced Notification .186 .053*Advanced Shipment Notification .099 .197Substitution Flexibility .088 .226Innovativeness .080 .247Operational Simplification .053 .325Operational Standardization .151 .099*
♦Significantly Different at the . 10 level or less
50
Reproduced with permission of the copyright owner. Further reproduction prohibited without permission.

Porter’s Generic Strategy
Generic business strategy was proposed and conceptualized by Porter (1980).
Empirical testing of Porter’s strategies was performed by Dess and Davis (1984),
Davis and Miller (1988), Miller and Friesen (1986), and Miller (1988). The
measurement of both the cost leadership and differentiation strategies will be done
utilizing the scales developed by Dess and Davis (1984). As previously mentioned
these authors empirically supported Porter’s three generic strategies: cost leadership,
differentiation, and focus. Since that study, a number of other authors have made the
case, rather convincingly, that only two trulv generic business strategies exist (cost
leadership and differentiation) (Davis and Miller 1988; Inhofe 1992; Vorhies 1993).
Additionally, Miller (1988) validated both the cost leadership and differentiation
strategies and found that focus was just a special case of these two strategic
alternatives. Therefore, the Dess and Davis (1984) scale is employed to measure both
cost leadership and differentiation.
Some recent applications of the Dess and Davis (1984) scales have resulted in
both adequate reliability and validity. Inhofe (1992) and Vorhies (1993) obtained
coefficient alphas (Crombach 1951) of .887 and .70, respectively on the
differentiation strategy items. In testing the cost leadership items the same two
authors obtained coefficient alphas of .798 and .67, respectively. Therefore, it
appears that adequate reliability exists for these scales according to Nunnally (1978).
Inhofe (1992) also examined the issue of validity relative to this scale.
Through the use of confirmatory factor analysis, the author was able to demonstrate
51
Reproduced with permission of the copyright owner. Further reproduction prohibited without permission.
adequate convergent validity. This was determined by having high loadings on one
factor while not having significant cross loadings on the other factor.
Performance
For the purposes of this study, the more traditional accounting performance
measures are utilized. These include return on investments (ROI), return on assets
(ROA), net profit margin, and yearly increases in revenue or sales growth
(Venkatraman and Ramanujam 1986). The measures used are self reported by
respondents utilizing a seven-point iikert scale. These measures will attempt to
ascertain both efficiency and effectiveness in terms of firm performance, as these may
differ by companies that are more efficiency oriented (cost leadership) versus those
that may be more effectiveness oriented (differentiated). In order to assess efficiency.
ROI, ROA, and sales growth were asked relative to the firm’s competitors.
Respondents were asked to rate their firm in comparison to their competition on each
measure of performance. Effectiveness refers to the ability of a firm to reach its goals
(Ruekert, Walker, and Roering 1985). As such, the same scales mentioned above are
utilized, with the addition of measures such as, overall customer service levels,
overall competitive position, and the like in order to measure effectiveness. It is
expected that the measures employed and discussed here will lead to the
hypothesized relationships and support for the thesis proposed here. That is, that the
correct match of distinctive capabilities with the correct generic strategy, will lead to
superior firm performance.
52
Reproduced with permission of the copyright owner. Further reproduction prohibited without permission.

CHAPTER IV
RESEARCH FINDINGS
INTRODUCTION
This chapter contains the results of the study. The study findings are
presented in six sections. The first four sections assess the psychometric properties
of the constructs. Those sections are: Response Rate, Reliability, Validity, and
Discriminant Validity. These sections are followed by a discussion of the
Hypotheses Testing and the Hypotheses Supported. Lastly, the chapter concludes
with a Discussion section.
RESPONSE RATES
The mailing list was obtained from The Marketing Guidebook published by
Trade Dimensions, a grocery industry trade group, and was used for the sampling
frame of this study. This list contained the names and addresses of the CEO’s and
Vice Presidents of Logistics for the corporate headquarters of grocery firms in the
United States and Canada. This list was reduced firms whose primary business
(more than 50 percent) was in the retail grocery industry, as opposed to convenience
stores, or warehouse stores. The final sample of 757 firms was randomly selected
from the sampling frame, using a random number generator. These potential key-
informants were then contacted by phone. Of those key-informants contacted by
phone, 480 agreed to take part in the survey. The initial mailing containing a cover
53
Reproduced with permission of the copyright owner. Further reproduction prohibited without permission.
letter, survey and a postage-paid return envelope yielded 35 responses (see Appendix
A and Appendix D, respectively). Due to the low response rate the initial mailing
was followed up by both a reminder letter (see Appendix B), and also reminder phone
calls. Shortly thereafter another mailing containing another cover letter, survey, and
an additional postage-paid envelope was mailed (see Appendix C and Appendix D).
These mailings resulted in another 67 surveys being returned. A final total of 102
surveys were returned, for a response rate of 21% (102/480). Of the 102 total
questionnaires returned, 17 had to be dropped from the final analysis due to missing
values. The final analysis was performed on the remaining 85 returned surveys. This
resulted in a response rate of 18% (85/480).
The respondent’s characteristics may be seen in Table 4.1. CEO’s comprised
26% of the key-informants. Vice Presidents of Logistics accounted for an additional
59% of the key-informants. An additional 12% of the respondents were also Vice
Presidents of other functional areas within the firm, such as customer service and
operations. The remaining 3% of the key-respondents were at the Director level in
the same aforementioned divisions, that is, logistics, customer service, and
operations. In summary, 97% of the key-informants were at the senior management
level.
In terms of their years of experience, three measures were used. The results
of which are also contained in Table 4.1. Experience in the grocery industry
averaged 27 years. Time spent with their present company averaged 20 years.
54
Reproduced with permission of the copyright owner. Further reproduction prohibited without permission.

Additionally, the respondents were asked how long they were in their present
position, which averaged nine years,
Lastly, the respondents were asked about their level of education. Twenty-
nine percent of the respondents had completed high school, 56 percent had completed
college, and 15 percent had obtained a graduate degree. Thus, 71 percent of the
respondents possessed a college degree or graduate degree. The remaining 29 percent
had a high school education. One more point of additional information might help
describe the key-informants, as well. The respondents were rather geographically
diverse. Thirty-two states were represented. Of the 32 states, no particular state, or
region of the country, was especially represented.
In conclusion, the key-informants who provided information for this study
clearly represent upper management (97% CEO and Vice President), and therefore
should be involved in the strategic planning process. Moreover, they are very
experienced and well educated.
RELIABILITY
Previously, in Chapter HI, the psychometric properties of both reliability and
validity of the constructs to be studied were underscored. Reliability is a measure of
internal consistency of a scale. It is normally assessed utilizing Cronbach’s alpha and
is utilized extensively in the social sciences (Churchill 1979). The purpose of this
measure is to determine if the scales employed provided consistent results across
55
Reproduced with permission of the copyright owner. Further reproduction prohibited without permission.
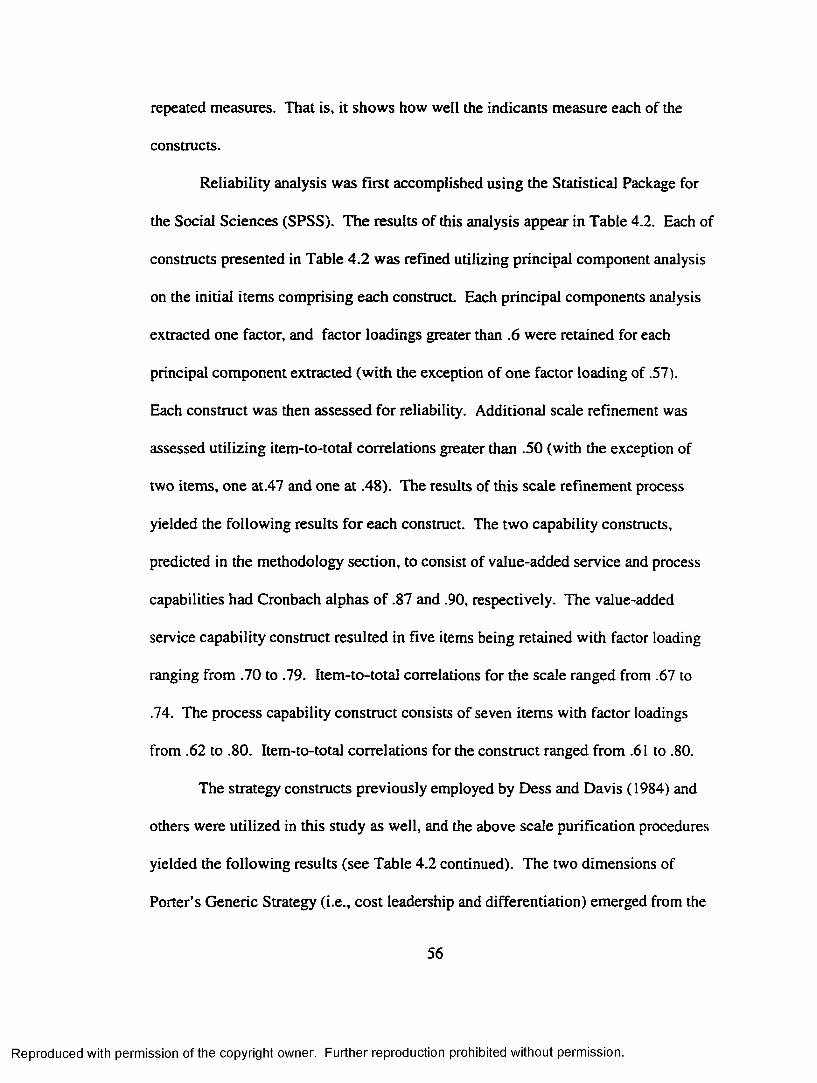
repeated measures. That is, it shows how well the indicants measure each of the
constructs.
Reliability analysis was first accomplished using the Statistical Package for
the Social Sciences (SPSS). The results of this analysis appear in Table 4.2. Each of
constructs presented in Table 4.2 was refined utilizing principal component analysis
on the initial items comprising each construct. Each principal components analysis
extracted one factor, and factor loadings greater than .6 were retained for each
principal component extracted (with the exception of one factor loading of .57).
Each construct was then assessed for reliability. Additional scale refinement was
assessed utilizing item-to-total correlations greater than .50 (with the exception of
two items, one at.47 and one at .48). The results of this scale refinement process
yielded the following results for each construct. The two capability constructs,
predicted in the methodology section, to consist of value-added service and process
capabilities had Cronbach alphas of .87 and .90, respectively. The value-added
service capability construct resulted in five items being retained with factor loading
ranging from .70 to .79. Item-to-total correlations for the scale ranged from .67 to
.74. The process capability construct consists of seven items with factor loadings
from .62 to .80. Item-to-total correlations for the construct ranged from .61 to .80.
The strategy constructs previously employed by Dess and Davis (1984) and
others were utilized in this study as well, and the above scale purification procedures
yielded the following results (see Table 4.2 continued). The two dimensions of
Porter’s Generic Strategy (i.e., cost leadership and differentiation) emerged from the
56
Reproduced with permission of the copyright owner. Further reproduction prohibited without permission.
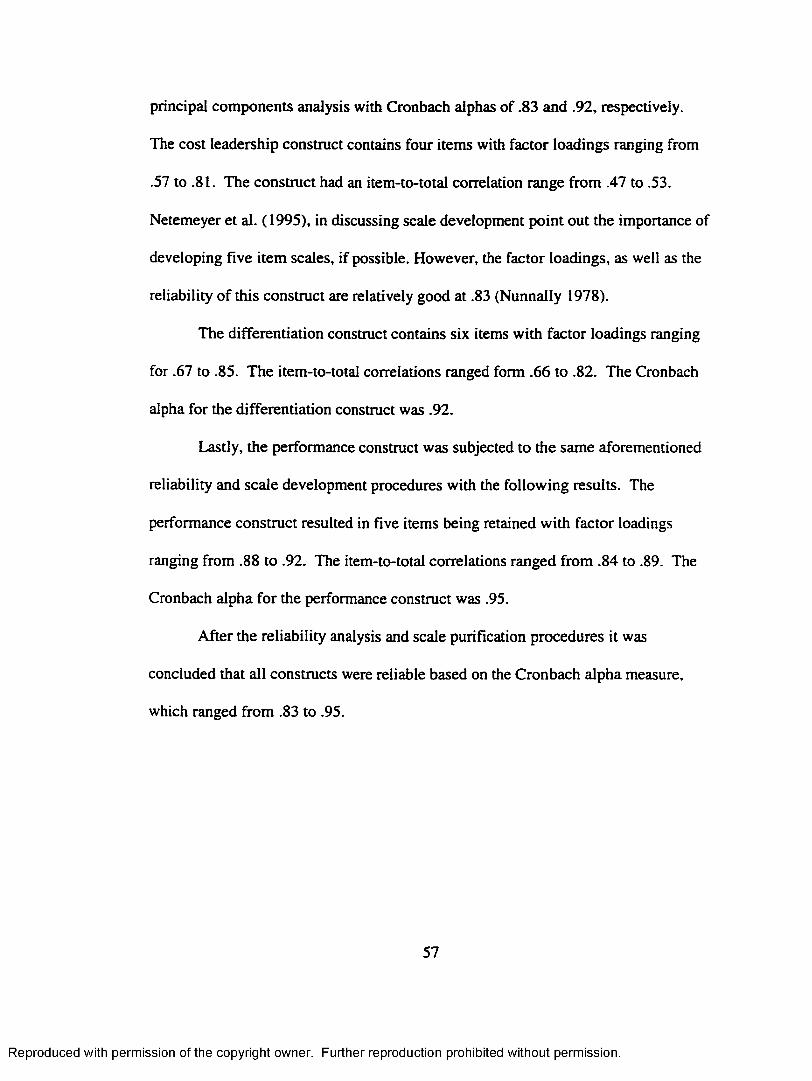
principal components analysis with Cronbach alphas of .83 and .92, respectively.
The cost leadership construct contains four items with factor loadings ranging from
.57 to .81. The construct had an item-to-total correlation range from .47 to .53.
Netemeyer et al. (1995), in discussing scale development point out the importance of
developing five item scales, if possible. However, the factor loadings, as well as the
reliability of this construct are relatively good at .83 (Nunnally 1978).
The differentiation construct contains six items with factor loadings ranging
for .67 to .85. The item-to-total correlations ranged form .66 to .82. The Cronbach
alpha for the differentiation construct was .92.
Lastly, the performance construct was subjected to the same aforementioned
reliability and scale development procedures with the following results. The
performance construct resulted in five items being retained with factor loadings
ranging from .88 to .92. The item-to-total correlations ranged from .84 to .89. The
Cronbach alpha for the performance construct was .95.
After the reliability analysis and scale purification procedures it was
concluded that all constructs were reliable based on the Cronbach alpha measure,
which ranged from .83 to .95.
57
Reproduced with permission of the copyright owner. Further reproduction prohibited without permission.

TABLE 4.1
SURVEY RESPONDENT CHARACTERISTICS
Usable Questionnaire Responses 85
Job Title
CEO 26%
VP Logistics 59%
VP Other 12%
Other 3%
Average
Years in Industry 27 yrs
Years in Company 20 yrs
Years in Position 9 yrs
Education
High School 29%
College 56%
Graduate Degree 15%
58
Reproduced with permission of the copyright owner. Further reproduction prohibited without permission.
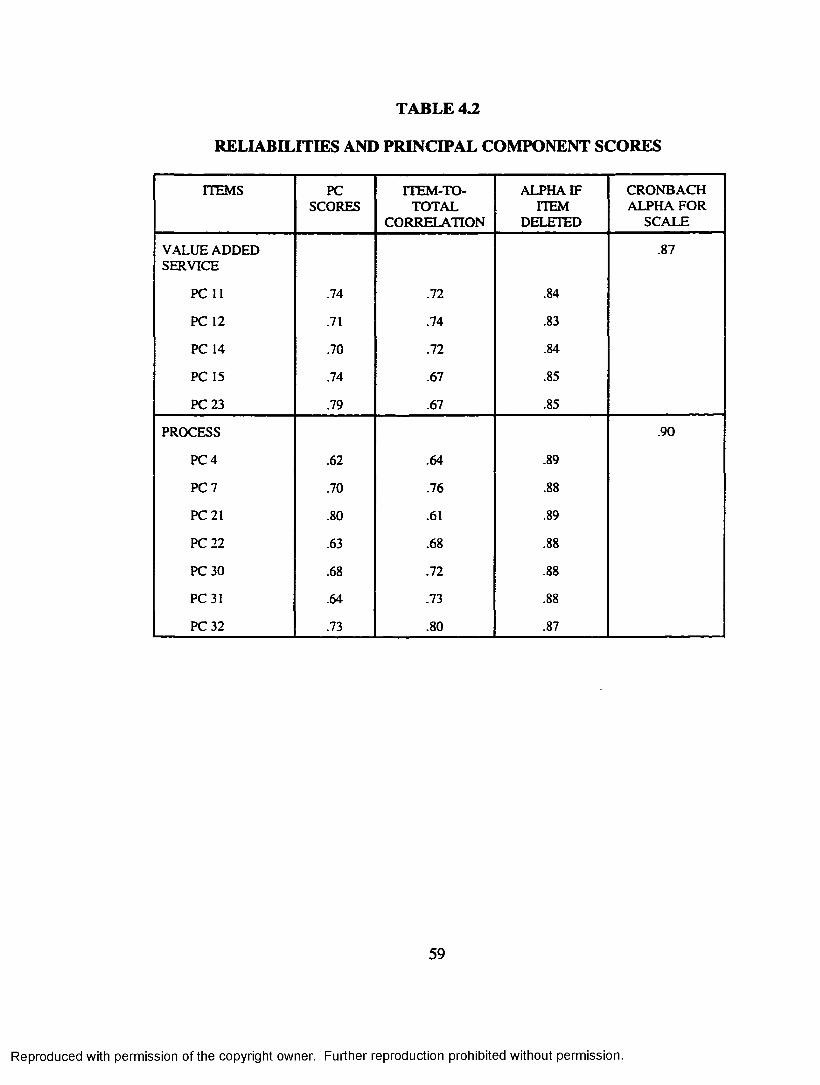
TABLE 4.2
RELIABILITIES AND PRINCIPAL COMPONENT SCORES
ITEMS PCSCORES
ITEM-TO-TOTAL
CORRELATION
ALPHA IF ITEM
DELETED
CRONBACH ALPHA FOR
SCALE
v a lue ADDED SERVICE
PC 11 .74 .72 .84
.87
PC 12 .71 .74 .83
PC 14 .70 .72 .84
PC 15 .74 .67 .85
PC 23 .79 .67 .85
PROCESS
PC 4 .62 .64 .89
.90
PC 7 .70 .76 .88
PC 21 .80 .61 .89
PC 22 .63 .68 .88
PC 30 .68 .72 .88
PC 31 .64 .73 .88
PC 32 .73 .80 .87
59
Reproduced with permission of the copyright owner. Further reproduction prohibited without permission.
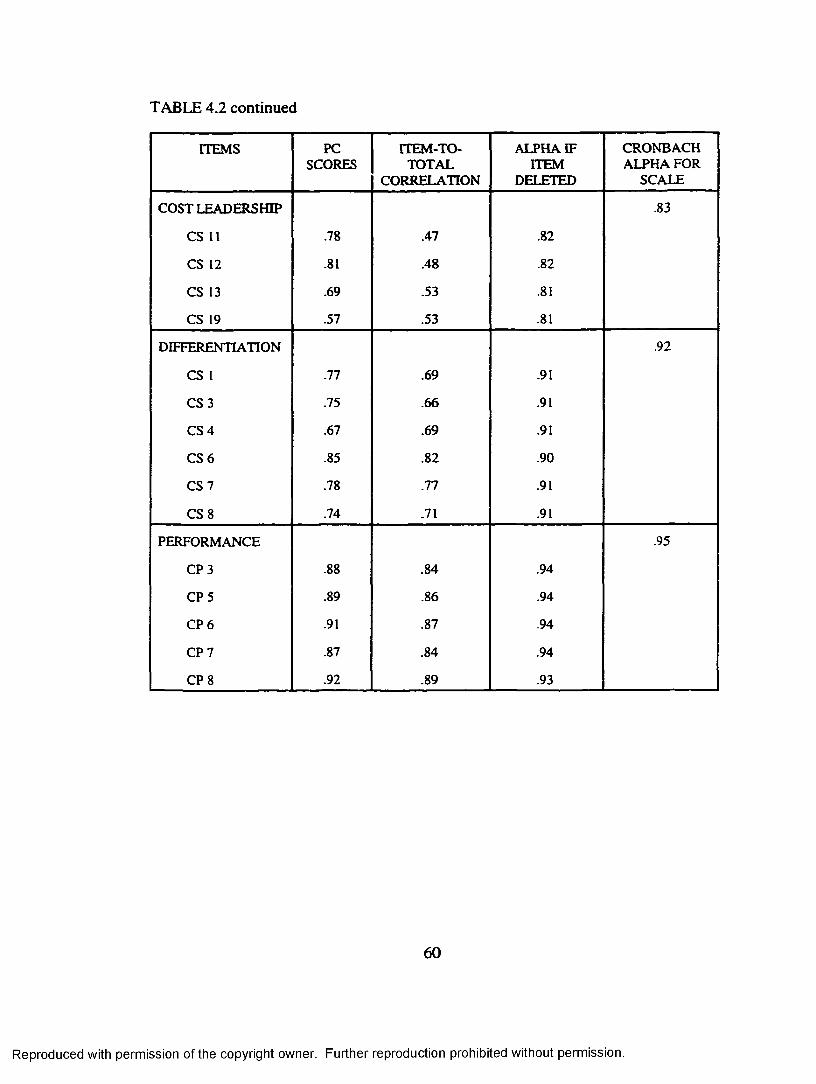
TABLE 4.2 continued
ITEMS PCSCORES
ITEM-TO-TOTAL
CORRELATION
ALPHA IF ITEM
DELETED
CRONBACH ALPHA FOR
SCALE
COST LEADERSHIP
CS 11 .78 .47 .82
.83
CS 12 .81 .48 .82
CS 13 .69 .53 .81
CS 19 .57 .53 .81
DIFFERENTIATION
CS 1 .77 .69 .91
.92
CS 3 .75 .66 .91
CS 4 .67 .69 .91
CS 6 .85 .82 .90
CS 7 .78 .77 .91
CS 8 .74 .71 .91
PERFORMANCE
CP 3 .88 .84 .94
.95
CPS .89 .86 .94
CP 6 .91 .87 .94
CP 7 .87 .84 .94
CP 8 .92 .89 .93
60
Reproduced with permission of the copyright owner. Further reproduction prohibited without permission.
VALIDITY
Validity is the ability of a construct to measure, accurately, what it is
attempting to measure (Bollen 1989; Hairet al. 1995). Validity, therefore, is crucial
in assessing the psychometric properties of the constructs under study. To ascertain
the validity of the scales utilized in this study, Confirmatory Factor Analysis was
performed as suggested by Gerbing and Anderson (1988) to assess unidimensionality.
Content, convergent, and discriminant validity were also examined to add to the
usefulness of the measures of the constructs utilized in this study. The results of this
analysis may be seen in Table 4.3 and are presented here.
Content Validity
The scales employed in this study were developed after a thorough review of
the literature on capabilities, strategy, and performance, as discussed in Chapters II
and in. The scales employed were derived from the aforementioned literature
review. Additionally, the initial items were reviewed by a panel of academic and
professional experts in the areas of logistics and strategy. Lastly, a pretest of the
questionnaire was mailed to several CEO’s and Vice Presidents in the retail grocery
industry. These procedures were employed to clarify the wording of the scales and to
assure the accurate use of terminology therein. The pretest also assisted in
clarification of the questionnaire instructions.
61
Reproduced with permission of the copyright owner. Further reproduction prohibited without permission.

Unidimensionalitv and Convergent Validity
Confirmatory Factor Analysis was performed on all of the scales via LISREL
8 (Joreskog and Sorbom 1996). The procedures employed were outlined by Alwin
and Jackson (1979), and the results are presented in Table 4.3.
The value-added service capability scale resulted in a five-item construct.
Based on the recommendations of Alwin and Jackson (1979), a parallel measurement
model is presented in Table 4.3. The results indicate a single dimension and
therefore, a unidimensional construct (x2 = 30.05, df = 5, p = .00; GFT = .86.
Additional fit indices are presented in Table 4.3. Convergent validity may be seen in
Table 4.4. All items loaded significantly (t values > 1.96) and therefore, indicate
convergent validity (Anderson and Gerbing 1988).
Process capability consists of a seven-item scale. A common factor
measurement model (Alwin and Jackson 1979), presented in Table 4.3, indicates a
single dimension exists and fits the data well (x2 = 24.56, df = 14, p = .03; GFI = .92.
Additional fit indices are presented in Table 4.3. Convergent validity results are
presented in Table 4.4. All items loaded significantly (t values > 1.96) and therefore,
indicate convergent validity as outlined by Anderson and Gerbing (1988) with the
process capability scale, as well.
The strategy scales of cost leadership and differentiation were also assessed
for unidimensionality. The cost leadership strategy construct resulted in a four-item
scale. Table 4.3 presents the results of a parallel measurement model (Alwin and
Jackson 1979). The results are as follows and indicate a single dimension which fits
62
Reproduced with permission of the copyright owner. Further reproduction prohibited without permission.

the data well (x2 = 18.07, df = 8, p = .02; GFI = .90. Additional fit indices are
presented in Table 4.3. Convergent validity may be observed in Table 4.4. All items
loaded significantly (t values > 1.96) and therefore, indicate convergent validity
(Anderson and Gerbing 1988).
Next, the differentiation strategy scale was examined for unidimensionality.
The results of a common factor measurement model (Alwin and Jackson 1979), are
presented in Table 4.3. The results indicate a single dimension exists and fits the data
well (x2 = 15.55, df = 9, p = .07; GFI = .99. Additional fit indices are presented in
Table 4.3. Convergent validity results, presented in Table 4.4, indicate all items
loaded significantly (t values > 1.96) and therefore, indicate convergent validity as
outlined by Anderson and Gerbing (1988).
Lastly, the performance scale resulted in a five-item construct. A common
factor measurement model is presented in Table 4.3 (Alwin and Jackson 1979). The
results presented indicate a single dimension which fits the data well (x2 = 19.80, df =
5, p = .00; GFI = .90. Additional fit indices are presented in Table 4.3. Convergent
validity may be observed in Table 4.4. All items loaded significantly (t values >
1.96) and therefore, indicate convergent validity (Anderson and Gerbing 1988).
63
Reproduced with permission of the copyright owner. Further reproduction prohibited without permission.

TABLE 4 3
CONSTRUCT UNIDIMENSIONALITY AND ITEM LAMBDAS FORMEASUREMENT MODELS
CONSTRUCTS/ITEMS X
TVAL x 2 DF
PVAL CFI NNFI EFI GFI
VALUED ADDED SERVICE
30.05 5 .000 .96 .95 .96 .86
PC 11 1.00 12.31
PC 12 .57 5.44
PC 14 .69 6.83
PC 15 .58 5.31
PC 23 1.00 12.31
PROCESS 24.56 14 .03 .96 .92 .96 .92
PC 4 .65 6.14
PC 7 .76 7.56
PC 21 .65 6.10
PC 22 .76 7.66
PC 30 .75 7.46
PC 31 .82 8.54
PC 32 .88 9.53
Reproduced with permission of the copyright owner. Further reproduction prohibited without permission.

TABLE 4.3 continued
CONSTRUCTS/ITEMS A.
TVAL 1
X~ DFP
VAL CFI NNFI IFI GFI
COST LEADERSHIP 18.07 8 .02 .89 .82 .89 .90
CS 11 .75 7.01
CS 12 .84 8.08
CS 13 .68 6.23
CS 19 .60 5.29
DIFFERENTIATION 15.55 9 .07 .97 .94 .98 .99
CS 1 .67 6.38
CS 3 .63 5.87
CS4 .77 7.79
CS 6 .89 9.76
CS 7 .84 8.84
CS 8 .81 8.43
PERFORMANCE 19.80 5 .001 .97 .96 .97 .90
CP 3 .91 10.26
CP 5 .94 10.94
CP 6 .96 11.29
CP 7 .81 8.54
CP 8 .95 11.10
65
Reproduced with permission of the copyright owner. Further reproduction prohibited without permission.

Reproduced
with perm
ission of the
copyright ow
ner. Further
reproduction prohibited
without
permission.
TABLE 4.4
OVERALL MODEL ITEM LAMBDAS
Value Added Service Process Cost Leadership Differentiation Performance
PC 11 .99 (12.18) PC 4 .65 (4.84) CS 11 .71 (5.92) CS 1 .67 (6.33) CP 3 .90 (9.11)
PC 12 .57 (6.05) PC 7 .74 (5.41) CS 12 .78 (5.96) CS 3 .63 (5.00) CP 5 .94(13.92)
PC 14 .68 (8.12) PC 21 .63 (5.87) CS 13 .77 (5.92) CS 4 .78 (6.07) CP 6 .95(14.64)
PC 15 .56 (5.16) PC 22 .78 (5.60) CS 19 .60(4.71) CS 6 .88 (6.64) CP 7 .81 (9.81)
PC 23 .99 (51.38) PC 30 .73 (5.43) CS 7 .84 (6.43) CPS .95(14.35)
PC 31 .83 (5.85) CS 8 .80(6.15)
PC 32 .87 (6.04)
T-values are in parentheses.
Discriminant Validity
In a further effort to assess the validity of the constructs under study, the
procedures outlined by Fomell and Larcker (1981) were employed. Fomell and
Larcker (1981) recommend examining the average variance extracted as a stringent
test of discrimant validity. The average variance extracted is the ratio of the sum of
squared loadings to the sum of the squared loadings plus the error variance (Fomell
and Larcker 1981). In order to determine discrimant validity, the average variance
extracted for the construct should exceed the squared correlation among the latent
constructs (Fomell and Larcker 1981).
Table 4.5 contains the average variance extracted measures for each construct
as well as the construct correlation coefficients as recommended in the literature
(Anderson and Gerbing 1988; Fomell and Larcker 1981). The procedures outlined by
Fomell and Larcker (1981) were followed and the variance extracted measures were
all greater than the shared variance. As can be seen in Table 4.5, this criterion was
met for all the constructs employed in this study. Therefore, it may be concluded that
the constructs meet this stringent test of discriminant validity.
Based upon the previous discussions as well as the information presented, it
was ascertained that the measures of the constructs employed in this study have high
reliabilities. Additionally, it was concluded that the constructs had reasonable
validities.
67
Reproduced with permission of the copyright owner. Further reproduction prohibited without permission.
Therefore, it was determined that the resultant constructs were appropriate
measures to be employed in the testing of the various hypotheses proposed in Chapter
m. The results of hypothesis tests are presented in the next section.
68
Reproduced with permission of the copyright owner. Further reproduction prohibited without permission.

Reproduced
with perm
ission of the
copyright ow
ner. Further
reproduction prohibited
without
permission.
TABLE 4.5
CONSTRUCT DISCRIMINANT VALIDITYValue Added
Service Process Cost Leadership Differentiation PerformanceAverage Variance Extracted .44 .57 .52 .60 .83
Shared Variance
Value Added Service
Process
Cost LeadershipDifferentiation
Performance
.24 (.49)
.03 (.16)
.18 (.43)
.09 (.30)
.41 (.64)
.14 (.38)
.09 (.30)
.16 (.40)
.27 (.52) .24 (.49)
Construct correlation coefficients are in parentheses.

Reproduced
with perm
ission of the
copyright ow
ner. Further
reproduction prohibited
without
permission.
FIGURE 4.1
STRUCTURAL MODEL PARAMETER RESULTS
o
LOGISTICCAPABILITIES STRATEGY FIRM
PERFORMANCEPROCESS
CAPABILITIESHI: = .90 (t = 3.80)
COSTLEADERSHIP
H5: = .79 (t = 2.97)H3: = .30
(t = 1.66)
PERFORMANCEH4: =-.19 (t = -2.22)
H6: = .40 (t = 2.11)
DIFFERENTIATION
H2: = .21 (t = 2.40) H10: = .2!
(t =1.75)H7 Path E > Path FALUE-ADDED SERVICE
w CAPABILITIES > H8 Path A > Path D HU Path A & D > Path B & C

Reproduced
with perm
ission of the
copyright ow
ner. Further
reproduction prohibited
without
permission.
TABLE 4.6
OVERALL MODEL FIT STATISTICS AND CONSTRUCT RELATIONSHIPS
Value Added Service Process Cost Leadership Differentiation
Process <J>= .49 (3.24)
Cost Leadership Y = -.19 (-2.22) Y = .90 (3.80)
Differentiation Y = .21 (2.40) Y = .30 (1.66) Y = .26 (1.99)
Performance Y = .22 (1.75) Y = -.50 (-1.47) P = .79 (2.97) P = .40 (2.11)
x2 DF P-VAL CFI IFI NNFI GFI
852.65 314 .00 .74 .75 .71 .64
T-values are in parentheses.

HYPOTHESES TESTING AND HYPOTHESES SUPPORTED
As discussed in Chapter IE, the hypotheses were tested using LISREL 8. The
paths between the constructs represent each individual hypothesis. Each path was
assessed for the statistical significance of the path coefficients. The results of each
hypothesis are discussed in this section. The results o f the hypothesis tests are
presented in Table 4.6 and are also depicted in a graphic format in Figure 4.1.
Hypothesis One
HI: Process capabilities will be positively linked to a Cost Leadership
strategy (Path A).
As hypothesized, there was a positive relationship between process
capabilities and a cost leadership strategy (y = .90, t-value = 3.80). Therefore,
hypothesis one is supported. The results may be seen in both Table 4.6 and are
depicted graphically in Figure 4.1.
As one may remember, the essence of the research at hand was to ascertain if
capabilities are related to strategy. It appears, given the data at hand, that this is the
case. Therefore, authors such as Barney (1991), who postulated that resources
(capabilities) were an important component in both strategy and in attaining a
sustainable competitive advantage may be correct. In an effort to further test this
theory, hypothesis two was examined.
72
Reproduced with permission of the copyright owner. Further reproduction prohibited without permission.
Hypothesis Two
H2: Value Added Service capabilities will be positively linked to a
Differentiation strategy (Path D).
As hypothesized, there was a positive relationship between value added
service capabilities and a differentiation strategy (y = .21, t-value = 2.40). Therefore,
hypothesis two is also supported. The results may be seen in both Table 4.6 and are
also depicted graphically in Figure 4.1.
Again, it appears that there is a significant path from value-added service
capabilities to a differentiation strategy. The importance of this path, as well as the
aforementioned findings, is that, as Barney (1991), Porter (1996) and others have
postulated, some firms in the retail grocery industry do seem to match their
capabilities to their strategy. Therefore, the fit that was originally proposed between
capabilities and strategy appears to correspond with the data presented here.
Hypothesis Three
H3: Process capabilities will be positively linked to a Differentiation
strategy (Path B).
As hypothesized, there was a positive relationship between process
capabilities and a differentiation strategy (y = .30, t-value = 1.66). However, where
the previous two hypotheses were supported at the .05 level (t-value > 1.96), this
relationship is significant at the .10 level (t-value > 1.645). Therefore, hypothesis
73
Reproduced with permission of the copyright owner. Further reproduction prohibited without permission.
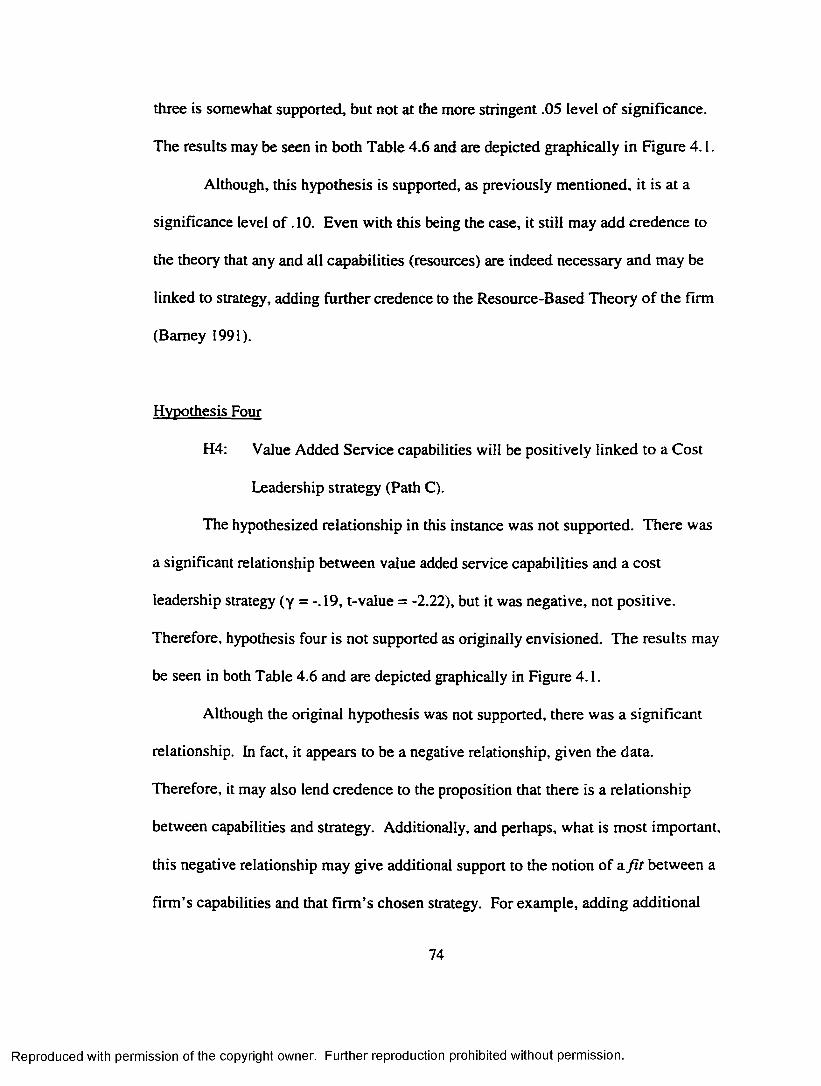
three is somewhat supported, but not at the more stringent .05 level of significance.
The results may be seen in both Table 4.6 and are depicted graphically in Figure 4.1.
Although, this hypothesis is supported, as previously mentioned, it is at a
significance level o f . 10. Even with this being the case, it still may add credence to
the theory that any and all capabilities (resources) are indeed necessary and may be
linked to strategy, adding further credence to the Resource-Based Theory of the firm
(Barney 1991).
Hypothesis Four
H4: Value Added Service capabilities will be positively linked to a Cost
Leadership strategy (Path C).
The hypothesized relationship in this instance was not supported. There was
a significant relationship between value added service capabilities and a cost
leadership strategy (y = -. 19, t-value = -2.22), but it was negative, not positive.
Therefore, hypothesis four is not supported as originally envisioned. The results may
be seen in both Table 4.6 and are depicted graphically in Figure 4.1.
Although the original hypothesis was not supported, there was a significant
relationship. In fact, it appears to be a negative relationship, given the data.
Therefore, it may also lend credence to the proposition that there is a relationship
between capabilities and strategy. Additionally, and perhaps, what is most important,
this negative relationship may give additional support to the notion of a f i t between a
firm’s capabilities and that firm’s chosen strategy. For example, adding additional
74
Reproduced with permission of the copyright owner. Further reproduction prohibited without permission.
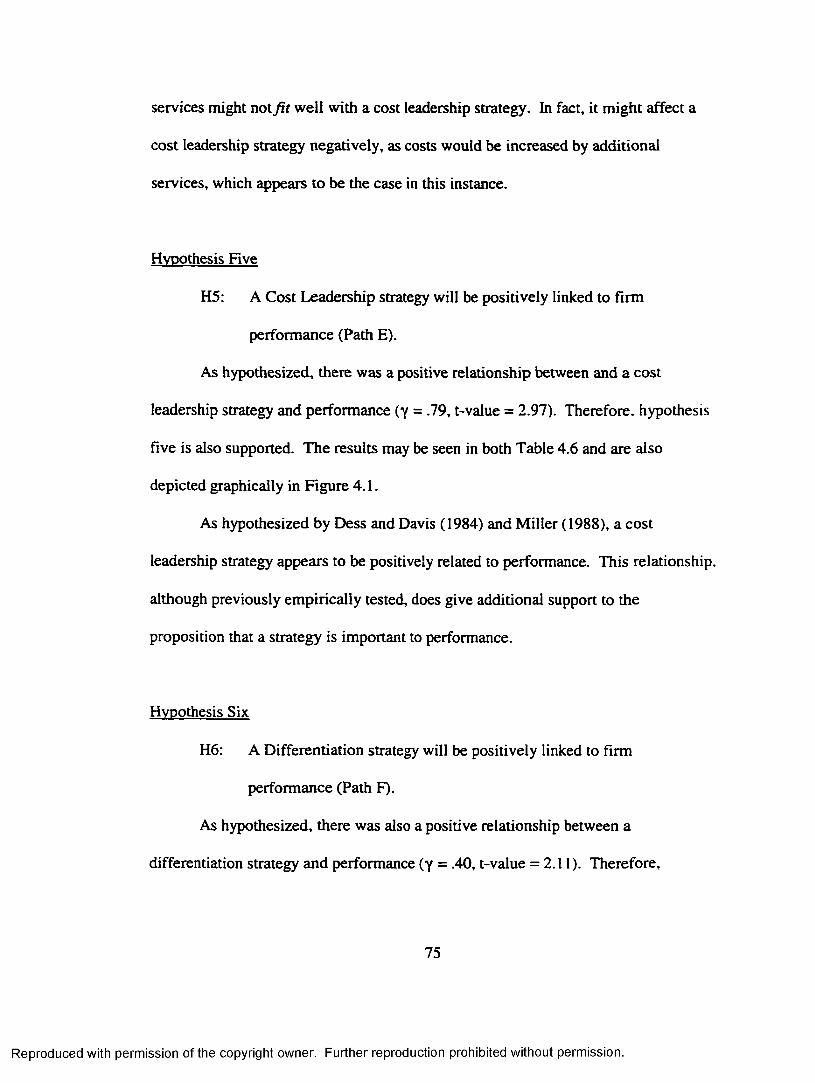
services might not f i t well with a cost leadership strategy. In fact, it might affect a
cost leadership strategy negatively, as costs would be increased by additional
services, which appears to be the case in this instance.
Hypothesis Five
H5: A Cost Leadership strategy will be positively linked to firm
performance (Path E).
As hypothesized, there was a positive relationship between and a cost
leadership strategy and performance (y = .79, t-value = 2.97). Therefore, hypothesis
five is also supported. The results may be seen in both Table 4.6 and are also
depicted graphically in Figure 4.1.
As hypothesized by Dess and Davis (1984) and Miller (1988), a cost
leadership strategy appears to be positively related to performance. This relationship,
although previously empirically tested, does give additional support to the
proposition that a strategy is important to performance.
Hypothesis Six
H6: A Differentiation strategy will be positively linked to firm
performance (Path F).
As hypothesized, there was also a positive relationship between a
differentiation strategy and performance (y = .40, t-value = 2.11). Therefore,
75
Reproduced with permission of the copyright owner. Further reproduction prohibited without permission.
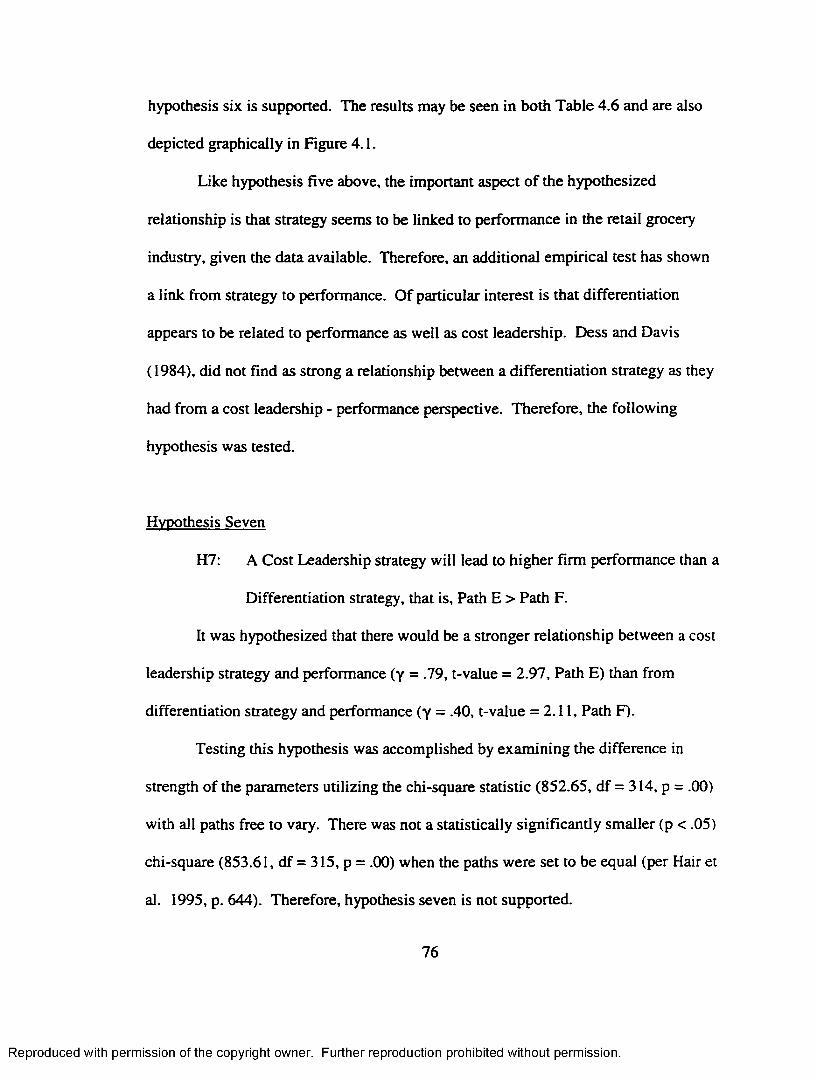
hypothesis six is supported. The results may be seen in both Table 4.6 and are also
depicted graphically in Figure 4.1.
Like hypothesis five above, the important aspect of the hypothesized
relationship is that strategy seems to be linked to performance in the retail grocery
industry, given the data available. Therefore, an additional empirical test has shown
a link from strategy to performance. Of particular interest is that differentiation
appears to be related to performance as well as cost leadership. Dess and Davis
(1984), did not find as strong a relationship between a differentiation strategy as they
had from a cost leadership - performance perspective. Therefore, the following
hypothesis was tested.
Hypothesis Seven
H7: A Cost Leadership strategy will lead to higher firm performance than a
Differentiation strategy, that is, Path E > Path F.
It was hypothesized that there would be a stronger relationship between a cost
leadership strategy and performance (y = .79, t-value = 2.97, Path E) than from
differentiation strategy and performance (y = .40, t-value = 2.11, Path F).
Testing this hypothesis was accomplished by examining the difference in
strength of the parameters utilizing the chi-square statistic (852.65, df = 314, p = .00)
with all paths free to vary. There was not a statistically significantly smaller (p < .05)
chi-square (853.61, df = 315, p = .00) when the paths were set to be equal (per Hair et
al. 1995, p. 644). Therefore, hypothesis seven is not supported.
76
Reproduced with permission of the copyright owner. Further reproduction prohibited without permission.

Therefore, it appears there is not a stronger relationship to performance given
a cost leadership strategy versus a differentiation strategy. This may perhaps be
explained in that, regardless of the strategy chosen, both a cost leadership strategy
and a differentiation strategy may lead to firm performance equally well. This seems
to somewhat contradict the findings of Dess and Davis (1984), and may require
further empirical research in the future to examine the relationship of strategy to
performance.
A number of conclusions, as well as several implications, may be tied to the
above findings. Chapter V presents a discussion of the conclusions and the
implications of this study along with the limitations of the study and the directions for
future research.
Hypothesis Eight
H8: The path from Process capabilities to a Cost Leadership strategy (Path
A) will be stronger than the path from Value Added Service to a
Differentiation strategy (Path D), that is. Path A > Path D.
It was hypothesized that there would be a stronger relationship between
process capabilities and a cost leadership strategy (y = .90, t-value = 3.80, Path A)
than from value-added service capabilities to a differentiation strategy (y = .21, t-
value = 2.40, Path D).
Testing this hypothesis was accomplished by examining the difference in
strength of the parameters utilizing the chi-square statistic (852.65, df = 314, p = .00)
77
Reproduced with permission of the copyright owner. Further reproduction prohibited without permission.

with all paths free to vary. There was a statistically significantly smaller (p < .05)
chi-square (863.53, df = 315, p = .00) when the paths were set to be equal (per Hair et
al. 1995, p. 644). Therefore, hypothesis eight is supported.
Hypothesis Nine
H9 Process capabilities will be positively linked to firm performance
(Path G).
The hypothesized relationship in this instance was not supported (y = .50, t-
value = -1.47, Path G). It therefore appears that, at least in this sample, that
capabilities are not positively linked to firm performance directly as has been
previously proposed by some authors (Day 1994; Hitt and Ireland 1986; Droge et al.
1994; Morash et al. 1996).
Hypothesis Ten
H10 Value Added Service capabilities will be positively linked to firm
performance (Path H).
The hypothesized relationship in this instance was also not supported (y =
.22, t-value = 1.75, Path H). It therefore appears that, again, in this sample,
capabilities are not positively linked to firm performance as has been contemplated
by various authors (Day 1994; Hitt and Ireland 1986; Droge et al. 1994; Morash et al.
1996).
78
Reproduced with permission of the copyright owner. Further reproduction prohibited without permission.
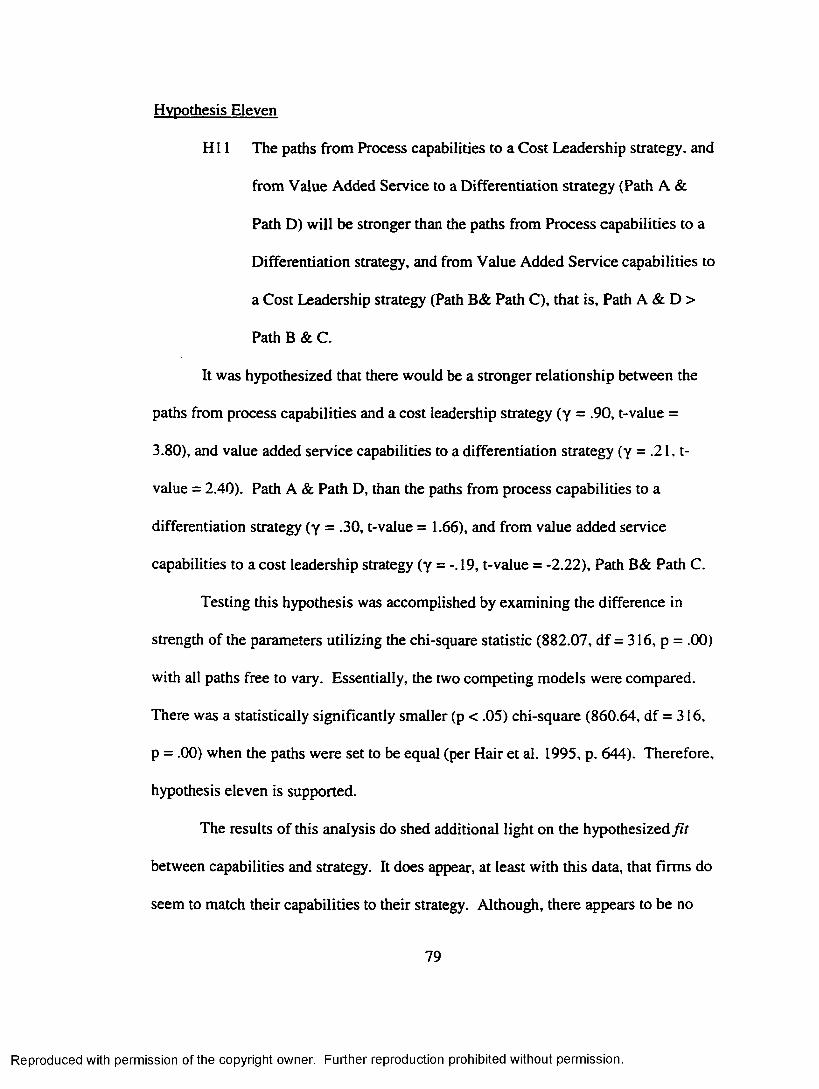
Hypothesis Eleven
HI 1 The paths from Process capabilities to a Cost Leadership strategy, and
from Value Added Service to a Differentiation strategy (Path A &
Path D) will be stronger than the paths from Process capabilities to a
Differentiation strategy, and from Value Added Service capabilities to
a Cost Leadership strategy (Path B& Path C), that is, Path A & D >
Path B & C.
It was hypothesized that there would be a stronger relationship between the
paths from process capabilities and a cost leadership strategy (y = .90, t-value =
3.80), and value added service capabilities to a differentiation strategy (y = .21, t-
value = 2.40). Path A & Path D, than the paths from process capabilities to a
differentiation strategy (y = .30, t-value = 1.66), and from value added service
capabilities to a cost leadership strategy (y = -.19, t-value = -2.22), Path B& Path C.
Testing this hypothesis was accomplished by examining the difference in
strength of the parameters utilizing the chi-square statistic (882.07, df = 316, p = .00)
with all paths free to vary. Essentially, the two competing models were compared.
There was a statistically significantly smaller (p < .05) chi-square (860.64, df = 3 16,
p = .00) when the paths were set to be equal (per Hair et al. 1995, p. 644). Therefore,
hypothesis eleven is supported.
The results of this analysis do shed additional light on the hypothesized f it
between capabilities and strategy. It does appear, at least with this data, that firms do
seem to match their capabilities to their strategy. Although, there appears to be no
79
Reproduced with permission of the copyright owner. Further reproduction prohibited without permission.
significant difference from strategy to performance (hypothesis seven), there is a
significant difference between capabilities and strategy. Therefore, the data points
the direction that firms might be best served by investing in process capabilities
linked to a cost leadership strategy to attain superior firm performance.
80
Reproduced with permission of the copyright owner. Further reproduction prohibited without permission.
CHAPTER V
CONCLUSIONS
INTRODUCTION
This chapter presents a recap of the results of this study along with the
contributions associated with the study. Additionally, the limitations inherent in the
study are presented along with the possible directions that future research might be
directed. The chapter is separated into five main sections. The first section presents
the conclusions and implications. The second section discusses the contributions of
the study. In section three, the limitations of the study are presented. Section four,
future research, presents possible directions for additional avenues of research.
Lastly, a concluding comments section is included.
CONCLUSIONS AND IMPLICATIONS
The focus and the motivation for this study were to ascertain if capabilities
were indeed related to strategy, and if so, in what manner. Additionally, an
examination of firm strategy, the dimensions of firm strategy, and its possible link to
firm performance was important to this endeavor. As may be seen in the previous
chapter, Chapter IV, a number of the relationships hypothesized did transpire. One is
therefore, faced with the question, what are the implications of this study?
There are several important implications relevant to this study. First, and
foremost, capabilities, and most specifically, logistics capabilities appear to be
81
Reproduced with permission of the copyright owner. Further reproduction prohibited without permission.

significantly linked to strategy. Therefore, two issues related to the link from
capabilities to strategy seem to be clear. First, Barney (1991), among others,
postulated that resources (capabilities) were necessary in order for firms to pursue a
given strategy. That appears to be evident, at least in the retail grocery industry.
Secondly, and perhaps most interesting, there appears to be a f i t between capabilities
and strategy. Porter (1996) postulated the activities that a firm performs would lead
to sustainable competitive advantage. This study adds empirical support for the
above two author’s theories. That is, capabilities appear to be linked to strategy and
therefore, are necessary in order to pursue a strategy, and perhaps capabilities and
strategies need to be properly matched.
Although there has been previous empirical work in the area of strategy (Dess
and Davis 1984; Miller 1988), the exact number of strategies and relationships have
not been consistent throughout all studies. Porter (1980), hypothesized that two or
three strategies existed that a firm could pursue. In this study two strategies emerged,
and two issues seem evident given the available data. First, firms in the retail grocery
industry pursue two clearly defined strategies. They appear to be either cost leaders
or differentiators. Secondly, some firms do seem, for the most part, to match their
capabilities to their strategy. That is, firms that are cost leaders appear to invest in
the processes and technology to pursue that strategy. Additionally, differentiators,
appear to differentiate their firm by providing services that add value to their supply
chain. One other aspect of the relationships that is quite interesting is the negative
relationship between value-added service capabilities and a cost leadership strategy.
82
Reproduced with permission of the copyright owner. Further reproduction prohibited without permission.

What is particularly interesting about this relationship is that it is intuitively
appealing, and perhaps most telling with regard to the hypothesized f i t between
capabilities and strategy. For example, if there are capabilities that may be matched
with the correct strategy to form the correct fit, the corollary that some capabilities
may be mismatched with an incorrect strategy seems prudent.
Although the links from strategy to performance had been previously
examined (Dess and Davis 1984), the results were not always consistent. Again, two
issues are important here. Number one, strategy does appear to be positively linked
to performance, while capabilities, by themselves, were not. Therefore, it is
important for a firm to both adopt and pursue a strategy. Number two, and again,
perhaps most intriguing, is that superior firm performance may be obtained by being
both a cost leader and a differentiator. Conventional wisdom seems to dictate that
cost savings measures, along with a low price strategy, is the only avenue to firm
performance. It is somewhat enlightening to see that it appears, at least in the retail
grocery industry, that differentiating a firm (based on value-added service, and
perhaps even process capabilities) may also lead to superior firm performance.
Additionally, the link from cost leadership to firm performance was not stronger.
Therefore, given the significant link from differentiation to firm performance it
appears both strategies may be equally linked to performance. If this is indeed the
case, determining the capabilities to be employed in pursuing either strategy becomes
even more intriguing and important. Hence, further research endeavors might
concentrate on the apparently stronger link from process capabilities to a cost
83
Reproduced with permission of the copyright owner. Further reproduction prohibited without permission.
leadership strategy, as well as a further investigation of the matching between
capabilities and strategy.
LIMITATIONS OF THE STUDY
As with any research endeavor, there are inherently limitations. This study
was undertaken in the retail grocery industry. As such, any generalizations to other
contexts or industries must be acknowledged as a limitation of this particular study.
Also, the focus was on the provider side of the relationship. Therefore, the customer
might have a different view of the Firm’s capabilities and its strategy. Additionally,
key informants were used for the data collection. This being the case the validity of
the responses may be questioned. It is, however, important to point out that 97% of
the respondents were at either the CEO or Vice President level. Since these
individuals hold positions at the upper levels of management they would be involved
in the strategic planning process of the firm, and, therefore, have adequate knowledge
of the firm’s capabilities, strategy, and performance.
Another limitation is that firm performance may be effected by various other
extraneous variables not accounted for in this study; additionally, only measures of
logistics capabilities were employed. It would be beneficial to examine the myriad of
extraneous variables, as well as other capabilities and resources, such as marketing,
Finance and the like, which might be employed by firms to enhance the understanding
of the relationships hypothesized here.
84
Reproduced with permission of the copyright owner. Further reproduction prohibited without permission.

One other limitation of the study is sample size. The low response rate of
21% (102/480), along with the resulting low usable sample size of 18% (85/480)
raises questions as to the statistical power of the results, given the data available. A
greater sample size would have definitely increased the statistical power. However, it
is important to note that of the six hypothesized paths, five were significant at the .05
level. Additionally, as previously mentioned, the majority of respondents were in
upper management and possessed considerable industry and firm experience. This
should add some credibility to the results of this study.
FUTURE RESEARCH
A number of issues that have been addressed in this study may warrant
additional research. The original research objectives of this dissertation were to
examine whether superior firm performance is achieved when resources/capabilities
are properly matched with strategy (what one might call—-fit) and to ascertain which
capabilities should be linked to which strategy. To a certain degree, this was
accomplished. However, as was mentioned in the limitations section of this study, a
number of other avenues for future research seem evident.
Although we have successfully linked logistics capabilities to strategy, it
would be quite beneficial to examine other types of capabilities and their links to
strategy. In this manner the role(s) of capabilities and resources within a firm and
their link to strategy and performance may become clearer. Additionally, this study
was conducted in one industry, the retail grocery industry. Therefore, there are
85
Reproduced with permission of the copyright owner. Further reproduction prohibited without permission.

obvious generalizability issues due to this limitation. It would be quite beneficial to
examine the role that logistics capabilities, as well as other capabilities, play in
strategy and firm performance in other industries.
As an empirical test of the Resource-Based Theory of the firm, this study is
but a small step to empirically testing this theory. Additional and significant
contributions could be made by further tests of this theory. Along those same lines, it
might be beneficial to examine further the relationships of the two divergent views of
strategy. That is, are they two distinct theories, the Resource-Based Theory and
Porter’s Generic Strategy Theory, that stand alone and are indeed dichotomous. Or,
perhaps, do these theories exist on a continuum, one in which capabilities (resources)
are every bit as important to the success of a firm as is its Generic Strategy based on
competitive market forces. These are but a few of the areas worthy of additional
research.
CONCLUDING COMMENTS
Firm strategy, and the antecedents to firm strategy, for example, structure,
have formed many of the more important questions concerning firm performance and
sustainable competitive advantage for a number of decades. Also, recently much has
been written concerning firm resources and capabilities with regards to firm strategy.
This research endeavor is perhaps a small contribution linking these two previous
research streams. That is, as previously mentioned, there may not be two divergent
theories of strategy, Resource-Based Theory (based on firm capabilities) and Porter’s
86
Reproduced with permission of the copyright owner. Further reproduction prohibited without permission.

Generic Strategy (based on competitive market forces), but there may indeed be a
strategy continuum based on matching one’s capabilities (resources) with an
appropriate strategy based on the market forces at hand.
The results of this study seem to point to the linkages of capabilities and
strategy, the fit of those two, and ultimately a link to firm performance. This is
ultimately the question to be answered in more depth, what exact capabilities need to
be matched with which firm strategy for superior firm performance, and ultimately,
sustainable competitive advantage.
87
Reproduced with permission of the copyright owner. Further reproduction prohibited without permission.

REFERENCES
Alwin, Duane F. and David F. Jackson (1979), “Measurement Models for Response Errors in Surveys: Issues and Applications,” in Sociological Methodology, Ed. K.F. Schessler, San Francisco: Josey-Bass.
Anderson, Eugene W., Claes Fomell, and Donald R. Lehmann (1994), “Customer Satisfaction, Market Share, and Profitability: Findings From Sweden,” Journal o f Marketing, 58 (July), 53-66.
Anderson, James C. and David W. Gerbing (1988), “Structural Equation Modeling in Practice: a Review and Recommended Two-Step Approach,” Psychological Bulletin, 103 (3), 411-423.
Anderson, Paul F. (1982), “Marketing Strategic Planning and the Theory of the Firm,” Journal o f Marketing, 46, (Spring), 2:15-26.
Barney, Jay (1995), “Looking Inside for Competitive Advantage,” Academy of Management Executive, Vol. 9, No. 4,49-61.
Barney, Jay (1991), “Firm Resources and Sustained Competitive Advantage," Journal o f Management, 17(1), 99-120.
Barney, Jay (1986), “Strategic Factor Markets: Expectations, Luck, and Business Strategy,” Management Science, 42, 1231-1241.
Black, Janice A. and Kimberly B. Boal (1994), “Strategic Resources: Traits,Configurations and Paths to Sustainable Competitive Advantage,” Strategic Management Journal, 15, 131-148.
Bollen, Kenneth (1989), Structural Equations with Latent Variables, Ch. 3, New York, NY: John Wiley and Sons, Inc.
Bolton, Ruth N. and James H. Drew (1991), "A Longitudinal Analysis of the Impact of Service Changes on Customer Attitudes," Journal o f Marketing, 55 (January), 1-9.
Bourgeois, L. J., Ill (1980), “Performance and Consensus,” Strategic Management Journal, 1,227-248.
Bowersox, D. J., Mentzer, J. T. and Speth, T. W. (1995), “Logistics Leverage,” Journal o f Business Strategies, 12, No. 2, 36-49.
88
Reproduced with permission of the copyright owner. Further reproduction prohibited without permission.

Campbell, Donald T. (1955), “The Informant in Quantitative Research,” American Journal o f Sociology, (January) 339-342.
Chandler, A.D., Jr. (1962), “Strategy and Structure: Chapters in the History of the Industrial Enterprise,” Cambridge, MA, MTT Press.
Christopher, M. (1993), “Logistics and Competitive Strategy,” European Management Journal, 11, No. 2, 258-261.
Churchill, Gilbert A. (1979), “A Paradigm for Developing Better Measures ofMarketing Constructs,” Journal o f Marketing Research, Vol 16, (February), 64-73.
Clemens, Samuel Langhome, Adventures o f Huckleberry Finn: An Authoritative Text, Backgrounds and Sources, Criticism, W.W. Norton & Company, Inc. Second Edition, New York, 1977.
Clinton, Steven R. and David J. Closs (1997), “Logistics Strategy: Does it Exist?,” Journal o f Business Logistics, 18, No. 1, 19-44.
Coase, Ronald H. (1937), “The Nature of the Firm,” Economica, n. s., 4, No. 16, 386- 405.
Conner, K. R. (1991), “A Historical Comparison of Resource-Based Theory and Five Schools of Thought Within Industrial Organization Economics: Do We Have a New Theory of the Firm, ” Journal o f Management, 17(1), 121-154.
Coyle, John J., Edward J. Bardi and C. John Langley, Jr. (1996), The Management of Business Logistics, Minneapolis/St. Paul: West Publishing Company.
Crombach, Lee J. (1951), “Coefficient Alpha and the Internal Structure of Tests,” Psychometrika, 16, 297-334.
Daugherty, Patricia J. and Paul H. Pittman, “Utilization of Time-based Strategies,” International Journal of Operations & Production Management, Vol. 15,No. 2, 1995, pp. 54-60.
Davis, Peter S. and Chris Miller (1988), “Marketing Mix Variables and theDevelopment of Mid-Rang Theories of Marketing Strategy,” 1988 AMA Educator’s Proceedings Efficiency and Effectiveness in Marketing, 54, 33-38.
Day, George S. (1994), “The Capabilities of Market-Driven Organizations,” Journal o f Marketing, 58 (October) 37-52.
89
Reproduced with permission of the copyright owner. Further reproduction prohibited without permission.
Day, George S. (1990), Market-Driven Strategy: Processes for Creating Value, New York: The Free Press.
Deshpande, Rohit, John U. Farley, and Frederick Webster, Jr. (1993), "Corporate Culture, Customer Orientation, and Innovativeness in Japanese Firms: A Quadrad Analysis," Journal o f Marketing, 57 (January), 23-37.
Dess, Gregory G. and Peter S. Davis (1984), “Porter’s Generic Strategies as Determinants of Strategic Group Membership and Organizational Performance,” Academy o f Management Journal, 27, No. 3,467-488.
Dierickx, I. and K. Cool (1989), “Asset Stock Accumulation and Sustainability of Competitive Advantage,” Management Science, 35, 1504-1511.
Droge, Cornelia, Shawnee Vickery, and Robert E. Markland (1994), “Sources and Outcomes of Competitive Advantage: An Exploratory Study in the Furniture Industry,” Decision Sciences, 25, No. 5/6,669-689.
Eckert, James A. and Stanley J. Fawcett (1996), “Critical Capabilities for Logistics Excellence: People, Quality, and Time,” Proceedings o f the Council o f Logistics Management, 183-197.
Fomell, Claes and David F. Larcker (1981), “Evaluating Structural Equation Models with Unobservable Variables and Measurement Error,” Journal o f Marketing Research, 18 (February), 39-50.
Fox, B. (1996), “Levi’s Personal Pair Prognosis Positive,” Chain Store Age, 72, No. 3, 35-36.
Gattrona, John L., Norman H. Chom and Abby Day (1991), “Pathways to Customers: Reducing Complexity in the Logistics Pipeline,” International Journal o f Physical Distribution & Logistics Management, 21, No. 8, 5-11.
Global Logistics Research Team at Michigan State University (1995), World Class Logistics: The Challenge o f Managing Continuous Change, Oak Brook, IL: Council of Logistics Management.
Gerbing, David W. and James C. Anderson (1988), “An Updated Paradigm for Scale Development Incorporating Undimensionality and Its Assessment,” Journal o f Marketing Research, 25 (May), 186-192.
90
Reproduced with permission of the copyright owner. Further reproduction prohibited without permission.

Hair, Joseph F., Rolph E. Anderson, Ronald L. Tatham, and William C. Black(1995), Multivariate Data Analysis, Ch. 11, Englewood Cliffs, NJ: Prentice Hail.
Hall, Richard (1993), “A Framework Linking Intangible Resources and Capabilities to Sustainable Competitive Advantage,” Strategic Management Journal, 14, 607-618.
Hall, William K. (1980), “Survival Strategies in a Hostile Environment,” Harvard Business Review, 58 (September-October), 75-85).
Hambrick, Donald C. (1981), “Strategic Awareness Within Top Management Teams,” Strategic Management Journal, 2, 263-279.
Hill, Charles W. L. (1988), “Differentiation Versus Low Cost or Differentiation and Low Cost: A Contingency Framework,” Academy o f Management Review. 13 (3), 401-412.
Hitt, Michael A. and R. Duane Ireland (1986), “Relationships Among CorporateLevel Distinctive Competencies, Diversification Strategy, Corporate Structure and Performance,” Journal of Management Studies, 23 (July), 401-416.
Hrebiniak, Lawrence G. and Charles C. Snow (1982), “Top-Management Agreement and Organizational Performance,” Human Relations, 35 (12), 1139-1158.
Hunt, Shelby D. and Robert M. Morgan (1995), “The Competitive Advantage Theory of Competition,” Journal of Marketing, 58 (April), 1-15.
Inhofe, Molly M. (1992), “Consequences of Organizational Communication: The Role of the Marketing Function in the Hospital Industry,” Unpublished Doctoral Dissertation, Memphis State University.
Jaworski, Bernard and Ajay Kohli (1993), "Market Orientation: Antecedents and Consequences," Journal o f Marketing, 57, (July), 53-70.
John, George and Torger Reve (1982), ‘The Validity and Reliability of KeyInformant Data from Dyadic Relationships in Marketing Channels,” Journal o f Marketing Research, 19 (November), 517-524.
Joreskog, Karl and Dag Sorbom (1996), LISREL 8: User’s Reference Guide,Chicago, EL: Scientific Software International, Inc.
91
Reproduced with permission of the copyright owner. Further reproduction prohibited without permission.
Joreskog, Karl G. and Dag Sorbom (1989), LISREL 7 Guide to the Programs and Applications, Second Ed., Chicago IL: SPSS, Inc.
Kelley, Scott W., Steven J. Skinner, and James H. Donnelly, Jr. (1992),"Organizational Socialization of Service Customers," Journal o f Business Research, 25 (November), 197-214.
Kohli, Ajay K. and Bernard Jaworski (1990), "Market Orientation: The Construct, Research Propositions, and Managerial Implications," Journal o f Marketing, 54 (April), 1-18.
Lambert, Douglas M. and James R. Stock (1993), Strategic Logistics Management, Norwood, IL: Richard D. Irwin, Inc.
Leonard-Barton, Dorothy (1992), "Core Capabilities and Core Rigidities: A Paradox in Managing New Product Development," Strategic Management Journal, 13 (Summer), 111-25.
Mahoney, John T. and J. Rajendran Pandian (1992), "The Resource-Based ViewWithin the Conversation of Strategic Management," Strategic Management Journal, 13 (June), 363-80.
McKenna, R. (1991), "Marketing is Everything," Harvard Business Review, 69 (January/February), 65-79.
Miles, Raymond E. and Charles C. Snow (1978), Organizational Strategy, Structure and Process, New York: McGraw Hill.
Miller, Danny (1988), “Relating Porter’s Business Strategies to Environment andStructure: Analysis and Performance Implications, Academy o f Management Journal, Vol. 39, No. 3,280-308.
Miller, Danny (1986), “Configurations of Strategy and Structure: Towards a Synthesis,” Strategic Management Journal, Vol. 7, 233-249.
Miller, Danny and Jamal Shamsie (1996), ‘T he Resource-based View of the Firm in Two Environments” The Hollywood Film Studios From 1936 to 1965,” Academy o f Management Journal, Vol. 39, No. 3,519-543.
Miller, Danny, and P.H. Friesen (1986), “Porter’s Generic Strategies and Performance,” Organizational Studies, 7 (3), 255-261.
92
Reproduced with permission of the copyright owner. Further reproduction prohibited without permission.

Mintzberg, H. (1978), “Patterns in Strategy Formation,” Management Science, 24. 934-948.
Morash, Edward A., Cornelia L. M. Droge, and Shawnee K. Vickery (1996), “Strategic Logistics Capabilities for Competitive Advantage and Firm Success,'' Journal o f Business Logistics, 17, No. 1, 1-21.
Murray, Allan I. (1988), “The Contingency View of Porter’s ‘Generic Strategies’,” Academy o f Management Review, 13 (30), 390-400.
Narver, John C. and Stanley F. Slater (1990), "The Effect of a Marketing Orientation on Business Profitability," Journal o f Marketing, 54 (October), 20-35.
Netemeyer, Richard G., Scot Burton, and Donald R. Lichtenstein (1995), ‘Trait Aspects of Vanity: Measurement and Relevance to Consumer Behavior,” Journal o f Consumer Research, 21 (March), 612-626.
Novack, R., L. Rinehart, and M. Wells (1992), “Rethinking Concept Foundations in Logistics Management,” Journal o f Business Logistics, 13, No. 2, 233-268.
Nunnally, Jum C. (1978), Psychometric Theory, 2nd ed. New York: McGraw-Hill Book Company.
Olavarrieta, Sergio and Alexander E. Ellinger (1997), “Resource-Based Theory and Strategic Logistics Research,” International Journal o f Physical Distribution and Logistics Management, Vol. 27, No. 9-10, pp. 559-587.
Ozment, John, and Douglas M. Chard (1986), “Effects of Customer ServiceVariables on Sales: An Analysis of Historical Data,” International Journal o f Physical Distribution and Materials Management, 16, No. 3, 5-14.
Penrose, Edith (1959), The Theory o f the Growth o f the Firm, Guilford, London, and Worcester: Billing and Sons Limited.
Phillips, Lynn W. (1981), “Assessing Measurement Error in Key Informant Reports: A Methodological Note on Organizational Analysis in Marketing,” Journal o f Marketing Research, (November), 395-415.
Porter, Michael E. (1996), “What is Strategy?,” Harvard Business Review, (November-December), 61-78.
Porter, Michael E. (1985), Competitive Advantage-Creating and Sustaining Superior Performance, New York: The Free Press.
93
Reproduced with permission of the copyright owner. Further reproduction prohibited without permission.

Porter, Michael E. (1981), “The Contributions of Industrial Organizations to Strategic Management,” Management Review, 6, 609-620.
Porter, Michael E. (1980), Competitive Strategies. New York: The Free Press.
Prahalad, C. K. and Gary Hamel (1990), “The Core Competence of the Corporation,” Harvard Business Review, (May/June), 79-91.
Ruekert, Robert W, Orville C. Walker and Kenneth J. Roering (1985), “TheOrganization Of Marketing Activities: A Contingency Theory of Structure and Performance,” Journal o f Marketing, 49 (Winter), 13-25.
Rumelt, Richard P., Dan Schendel, and David Teece (1991), "Strategic Management and Economics," Strategic Management Journal, 12 (Winter), 5-30.
Schlesinger, Leonard A. and James L. Heskett (1991), "The Service-Driven Service Company," Harvard Business Review (September/October), 71-81.
Slater, Stanley F. and John C. Narver (1994), “Does Competitive EnvironmentModerate the Market Orientation-Performance Relationship?” Journal o f Marketing, 58 (January), 46-55.
Stalk, George, Philip Evans, and Lawrence E. Shulman (1992), "Competing on Capabilities: The New Rules of Corporate Strategy," Harvard Business Review, 70 (March/April), 57-69.
Venkatraman, N. and Vasudevan Ramanujam (1986), “Measurement of BusinessPerformance in Strategy Research: A Comparison of Approaches.” Academy o f Management Review, 11, 4. 801-814.
Vorhies, Douglas, W. (1993), “Strategy, Implementation and Performance inMarketing: A Theoretical Integration and Empirical Test,” Unpublished Doctoral Dissertation, University of Arkansas.
Walton, Sam and John Huey, Sam Walton, Made in America, My Story, Doubleday. New York, New York, 1992.
Webster, Frederick E., Jr. (1992), "The Changing Role of Marketing in the Corporation," Journal o f Marketing, 56 (October), 1-17.
Wemerfelt, Birger (1984), “A Resource-based View of the Firm,” Strategic Management Journal, Vol. 5, p. 171-180.
94
Reproduced with permission of the copyright owner. Further reproduction prohibited without permission.

EXHIBITS
95
Reproduced with permission of the copyright owner. Further reproduction prohibited without permission.

APPENDIX AINITIAL COVER LETTER
96
Reproduced with permission of the copyright owner. Further reproduction prohibited without permission.

APPENDIX AINITIAL COVER LETTER
Dear
This is a request for you to participate in a research study on firm capabilities and business strategy being sponsored by The Center for Supply Chain Management at the University o f Arkansas. Because o f your company’s success in providing services to its customers, your firm has been selected to participate in this research. We understand that you are very busy, therefore we have tried to make the survey as short as possible and easy to fill out. All that is required o f you is that you take approximately fifteen minutes to fill out the survey, and enclose it in the postage paid envelope provided.
The research investigates the relationships among firm capabilities, business strategies, and company performance. The benefits o f the study are three-fold. The study will help to gain further insight into firm capabilities, provide a context for understanding the relationship o f firm capabilities to business strategy, and build a foundation for further research on the strategic role of logistics and capabilities in the success o f the firm.
We have enclosed a questionnaire and a postage paid return envelope for your convenience. WE PROMISE THAT ALL YOUR RESPONSES WILL REMAIN STRICTLY CONFIDENTIAL.
The research benefits envisioned are very much dependent on getting the survey back. Therefore, your participation is very important, and very much appreciated. In return for your efforts we will send you a summary of the findings. Should you wish to receive the summary please provide your name and address on the last page o f this survey.
In closing, several o f the questions ask for information you might not have at your fingertips. In that case, please estimate this information, to the best o f your ability. If you have any questions, or need additional information please contact me at (501) 575-6142. We are confident o f your support and look forward to your response.
Thank you for your valuable time and support.
Dr. John D. Ozment Daniel F. LynchOren Harris Chair Senior Research Associate
97
Reproduced with permission of the copyright owner. Further reproduction prohibited without permission.
APPENDIX BREMINDER COVER LETTER
98
Reproduced with permission of the copyright owner. Further reproduction prohibited without permission.

APPENDIX BREMINDER COVER LETTER
Dear
A few weeks ago we mailed you a questionnaire concerning firm capabilities, logistics and business strategy being sponsored by The Supply Chain Management Research Center at the University of Arkansas. We have not received your completed questionnaire yet and would very much like to include your responses in our data base. We plan to start analyzing and summarizing the responses in about three weeks.
If you have already completed and returned the questionnaire, we would like to take this opportunity to thank you. If you have not yet had the time to complete the questionnaire, we would like to encourage you to do so at your earliest convenience.
The research benefits are very much dependent on getting the surv ey back. Individuals such as yourself are essential to this study. You can provide meaningful and useful information concerning the relationships among logistics capabilities, business strategies, and company performance in a retail setting. Therefore, your participation is very important, and very much appreciated. The information you provide will be considered strictly confidential. We are enclosing another copy of the questionnaire, and a postage-paid return envelope, for your convenience.
We appreciate and acknowledge the contribution you are making by providing us with your valuable time, assistance, and support. We look forward to receiving you completed questionnaire.
Sincerely.
Dr. John Ozment Oren Harris Chair University of Arkansas
Daniel F. Lynch Assistant Professor Montana State University
99
Reproduced with permission of the copyright owner. Further reproduction prohibited without permission.

APPENDIX CTHIRD COVER LETTER
100
Reproduced with permission of the copyright owner. Further reproduction prohibited without permission.
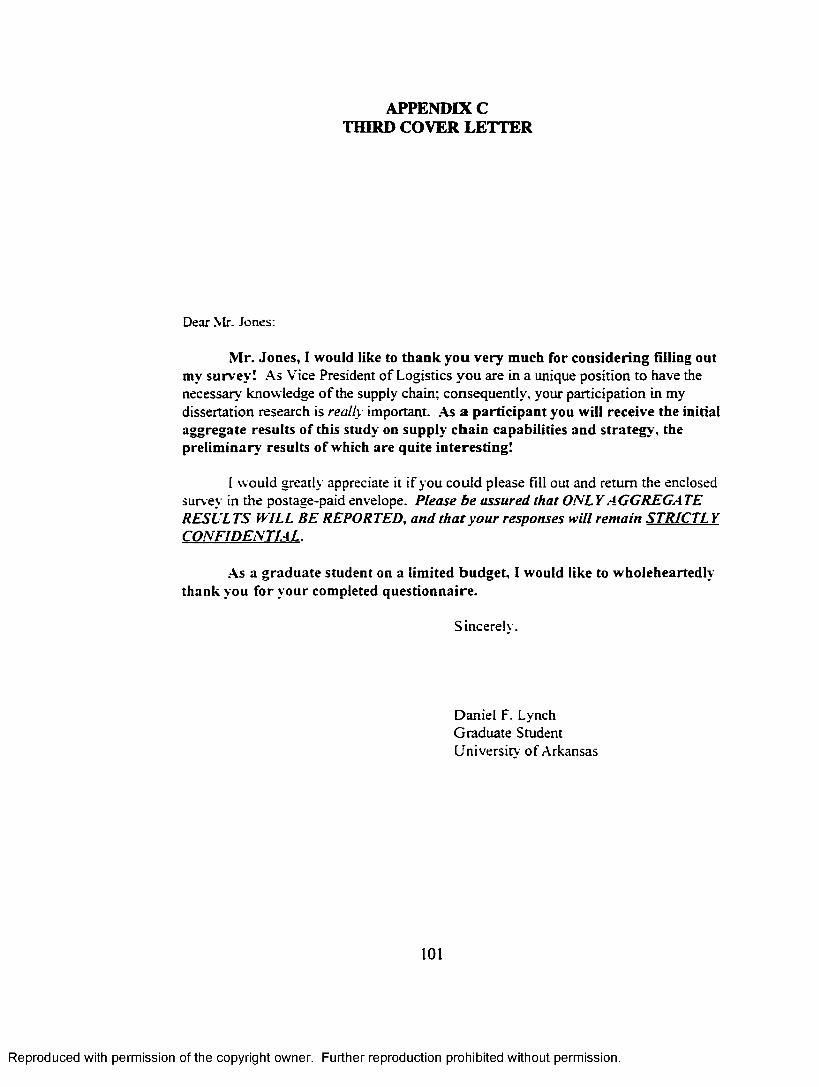
APPENDIX CTHIRD COVER LETTER
Dear Mr. Jones:
Mr. Jones, I would like to thank you very much for considering filling out my survey! As Vice President o f Logistics you are in a unique position to have the necessary knowledge o f the supply chain; consequently, your participation in my dissertation research is really important. As a participant you will receive the initial aggregate results of this study on supply chain capabilities and strategy', the preliminary results o f which are quite interesting!
1 would greatly appreciate it if you could please fill out and return the enclosed survey in the postage-paid envelope. Please be assured that ONL Y AGGREGA TE RESULTS WILL BE REPORTED, and that your responses will remain STRICTL Y CONFIDENTIAL.
As a graduate student on a limited budget, I would like to wholeheartedly thank you for your completed questionnaire.
Sincerely.
Daniel F. Lynch Graduate Student University o f Arkansas
101
Reproduced with permission of the copyright owner. Further reproduction prohibited without permission.

APPENDIX D QUESTIONNAIRE
102
Reproduced with permission of the copyright owner. Further reproduction prohibited without permission.

APPENDIX D QUESTIONNAIRE
L'XI VERS IT Y^ARKAXS A 5
CAPABILITIES AND STRATEGY QUESTIONNAIRE
A Study of Capabilities. Strategy , and Performance
Sponsored by The Supply Cham Management Research Center
College o f Business Administration University o f Arkansas Fayetteville. AR 72701
THANK Y O l IN ADVANCE FOR TAKING THE T IM E TO C O M PL ET E THIS Sl'RV'EY .i l l yo u r responses are strictly confidential We would be happy to provide >ou with a lummar. ot the resuits o f this survey If you would like to receive this information, please provide us with .our name and address, or attach a business card
Project Team:
John Ozment Oren Hams Chair o f Transportation
University o f Arkansas Fayetteville. AR 72701
(501) 575-6142
Daniel F Lynch Assistant Professor
Montana State Umversity-Billmgs Billings. MT 5010!
(406) 657-2035
NAME
TITLE
VDDR.ES'
103
Reproduced with permission of the copyright owner. Further reproduction prohibited without permission.
^

APPENDIX D (continued)
SECTION I: PERFORMANCE CAPABILITIES
INSTRUCTIONS: Please indicate the extent to which you agree or disagree with the following statement] by checking the appropriate column. (For retailers. please respond to the'customer " questions as your next logistical destination, fo r example, it could be a retail store * *
semced by a company-owned distribution center.) ^
My firm has the ability to: J 1 ^
1 Handle difficult, nonstandard orders to meet special customer specifications and to produce ^ —products characterized by numerous features, options, size and/or colors. . . . . 1 2 3 4 5 6
2 Rapidly modify capacity to accelerate/decelerate supply in response to changes in demand. 1 2 3 4 5 6
3 Supply smaller quantities efficiently so that product mix changes are easily accommodated. I 2 3 4 5 6
4 Attain the lowest total cost logistics by efficient operations, technolog}', or scale economies. I 2 3 4 5 6
3 Reduce the tune between order receipt and customer delivery to as close to zero as possible. 1 2 3 4 5 6
6 Meet quoted or anticipated delivery dates and quantities on a consistent basis. . . . 1 2 3 4 5 6
7 Proactively seek solutions to Iogisccs problems before they occur. ............................ 1 2 3 4 5 6
8 Quickly solve logistically-related customer problems and c o m p la in ts ............................. 1 2 3 4 5 6
4 Respond to the needs and wants ot'key customers. ......................................................... 1 2 3 4 5 6
10 Provide desired quantities on a consistent basis. .............................................................. I 2 3 4 5 6
11 Perform services that add value for the customer dunng the actual sales process. 1 2 3 4 5 6
12 Comprehensively and effectively target a given distribution region. ............................ 1 2 3 4 5 6
13 Effectively target selective or exclusive customers. ........................................................ 1 2 3 4 5 6
14 Accommodate special customer service r e q u e s t s . .............................................................. I 2 3 4 5 6
15 Accommodate new product/service introductions (roll-outs to market).............................. 1 2 3 4 5 6
lo Facilitate old product/service phase outs. ......................................................................... 1 2 3 4 5 6
17 Accommodate supply disruption in a manner that does not adversely alfect customers. I 2 3 4 5 6
IS Accommodate product recalls. .......................................................................................... I 2 3 4 5 6
W Handle product modifications while in the iogistics s y s t e m . ............................................. 1 2 3 4 5 6
20 Service customers from alternative warehouse locations. ............................................. 1 2 3 4 5 6
21 Perform reverse logistics operations in a timely m a n n e r . ................................................... 1 2 3 4 5 6
22 Differentiate logistical service offerings from that offered by competitors. . . . . 1 2 3 4 5 6
23 Continuously add new products or v a r ia tio n s ..................................................................... 1 2 3 4 5 6
24 Modify order size, volume or composuion during logistics operation! si............................. 1 2 3 4 5 6
25 Accommodate delivery rimes for specific c u s to m e rs . ......................................................... 1 2 3 4 5 6
2b Expedite shipments or partial shipments. ......................................................................... 1 2 3 4 5 6
27 Notify customers in advance of delivery delays or product s h o r ta g e s . ............................. 1 2 3 4 5 6
28 Notify customers m advance o f delivery when products will arnve. ............................. 1 2 3 4 5 6
29 Substitute product or service offerings in the event of a delay or stock out........................ 1 2 3 4 5 6
3D Dev elop creative logistical solutions rbr specific situations, emergences or customers. I 2 3 4 5 6
'•I Simplify the overall logistical process........................................................................................ 1 2 3 4 5 6
•2 Provide a consistent approach to cerforming key logistics work.......................................... 1 2 3 4 5 6
104
with permission of the copyright owner. Further reproduction prohibited without permission.
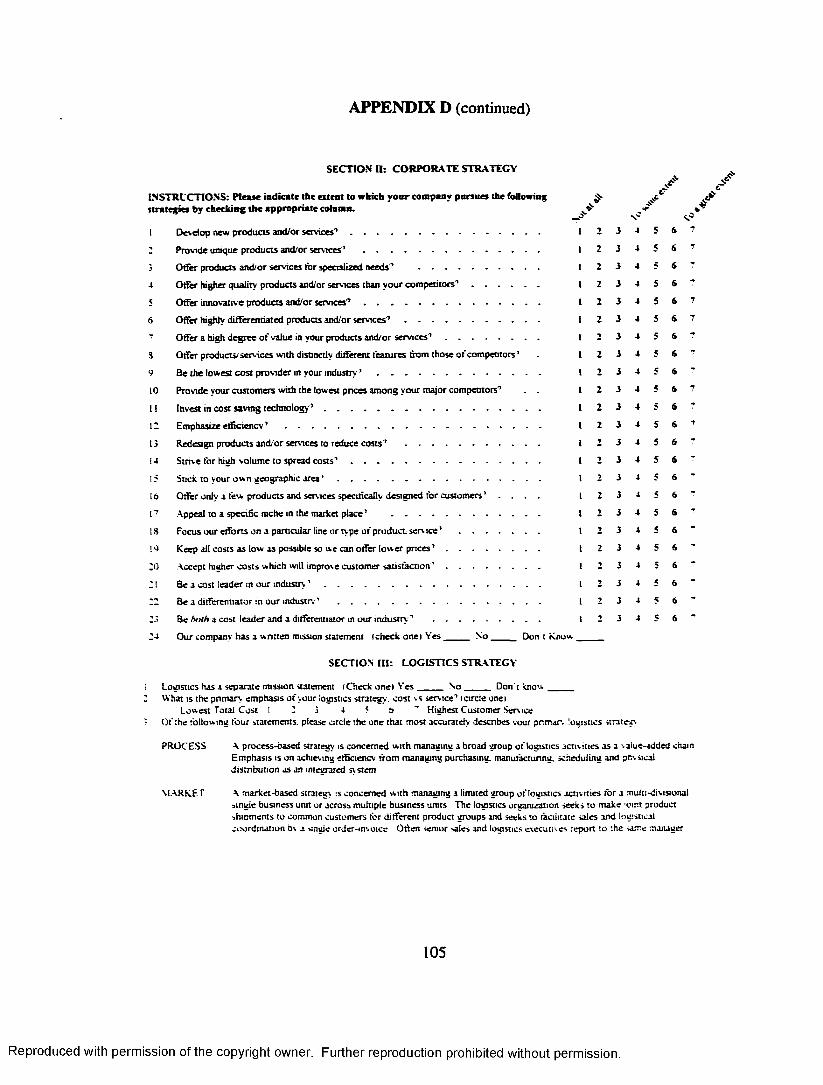
APPENDIX D (continued)
SECTION'II: CORPORATE STRATEGY
INSTRUCTIONS: Please indicate the extent to which yonr company pursues the following strategies by checking the appropriate column.
I Develop new products and/or services'’ ..............................................................................
3 Provide unique products and/or services ’ ........................................................................
3 Oder products and/or services tor specialized needs’ .................................................
-> Offer higher quality products and/or services than your competitors'1 ............................
5 Offer innovative products and/or services'’ ........................................................................
6 Offer highly differentiated products and/or services’ .......................................................
7 Offer a high degree o f value in your products and/or services ’ .......................................
S Offer products/ services with distinctly different features from those o f competitors ’
9 Be the lowest cost provider in your industry ’ ..................................................................
1 0 Provide your customers with the lowest prices among your major competitors’ . .
I I Invest in cost saving technology ’ ........................................................................................
1 2 Emphasize efficiency ’ .........................................................................................................
13 Redesign products and/or services to reduce costs’ ........................................................
14 Strive for high volume to spread costs’ ..............................................................................
15 Stick to your own geographic area’ ...................................................................................
16 Offer only a few products and services specifically designed tor customers ’ . . . .
17 Appeal to a specific niche in the market place’ .............................................................
IS Focus our efforts on a particular line or type of product, serv ice ’ ..................................
1 9 Keep all costs as low as possible so we can offer lower prices’ .......................................
30 Accept higher costs which will improve customer satisfaction’ .......................................
31 Be a cost leader in our industry ’ ........................................................................................
33 Be a differentiator in our industry ’ ..................................................................................
33 Be hnth a cost leader and a differentiator m our industry ’ ...........................................
34 Our company has a written mission statement (check one) Yes S o Don t Know
SECTION III: LOGISTICS STRATEGY
I Logistics has a separate mission statement (Check one) Yes . No Don't know
/V2’
5 6 7
5 6 7
5 6 7
5 6 7
5 6 7
5 6 7
5 6 7
5 6 7
5 6 7
5 6 7
5 6 7
5 6 7
5 6 ?
5 6 7
5 6 -
5 6 -
5 6 7
J 6 -
5 6 -
5 6 -
5 6 -
5 6 -
5 6 -
What is the primary emphasis o f your logistics strategy, cost vs service’ (circle oneiLowest Total Cost 1 3 3 4 5 6 ' Highest Customer Service
Of the following four statements, please circle the one that most accurately describes your pnmar. logistics strategy
PROCESS A process-based strategy is concerned with managing a broad group of logistics activities as a value-added chain Emphasis is on achieving efficiency from managing purchasing, manufacturing, scheduling and piivsicai distribution as an integrated sy stem
MARKET A market-based strategy is concerned with managing a limited group of logistics activities for a multi-divisional single business umt or across multiple business units The logistics organization seeks to make ;oint product shipments to common customers for different product groups and seeks to facilitate sales and logistical coordination bv a ungie order-invoice Otten senior sales and logistics executives report to the o n e manager
105
Reproduced with permission of the copyright owner. Further reproduction prohibited without permission.

APPENDIX D (continued)
CHANNEL A channel-based strategy is concerned with managing logistics activities performed jointly with dealers anddistributors. The strategic orientation places a great deal o f attention on external control. Significant amounts o f finished inventories are typically maintained forward or downstream in the distribution channel.
OTHER If your strategy does not fit into one o f the above, please briefly describe it below
Logistics strategy is frequently measured as a single cost- customer service continuum However, cost and customer service can also be represented as two dimensions o f logistics strategy Using a ( • ) . please indicate how you characterize your firm's logistics strategy in terms o f logistics cost and customer service (Example As marked, the (*) indicates a logisncs strategy o f moderately high customer service levels while achieving a low cost emphasis.)
HighestPossible
LogisticsC o s t
LowestPossible
HighestPossible
Logistics Customer Service Levels
SECTION IV: STRATEGIC TYPES
Which one o f the following descriptions most doseiv fits your company compared to other companies in the industry? (Pleaseconsider your company as a whole and note tha t none o f the types listed below is inherently '“good” or “bad. ") Please circle themost correct choice.
1 This company attempts to locate and maintain a secure niche in a relatively stable product o r service area The company tends tootfer a more limited range o f products or services than its competitors, and it tries to protect its domain by offering higher quality,superior service. lower prices, and so forth Often this company is not at the forefront o f developments in the industry—it tends to ignore industry changes that have no direct influence on current areas o f operation and concentrates instead on doing the best job possible in a limited area
2 This company typically operates within a broad product-market domain that undergoes periodic redefinition The company values being “first tri' in new product and market areas even if not all o f these efforts prove to be highly profitable The company responds rapidly to early signals concerning areas o f opportunity, and these responses often lead to a new round o f competitiv e actions However, this company may not maintain market strength in all o f the areas it enters
3 This company attempts to maintain a stable, limited line o f products or services, while at the same time moving out quickly tofollow a carefully selected set o f the more promising new developments in the industry The company is seldom “first in" with newproducts or services Howev er, by carefully monitoring the actions o f major competitors in areas compatible with its stable product-market basis, the company can frequently be “second in ' with a most cost-efficient product or ser.ice
4 This company does not appear to have a consistent product-market orientation The company is usually not as aggressive m maintaining established products and markets as some o f its competitors, nor is it willing to take as many nsks as other competitors Rather, the company responds m those areas where it is forced to by environmental pressures
106
Reproduced with permission of the copyright owner. Further reproduction prohibited without permission.
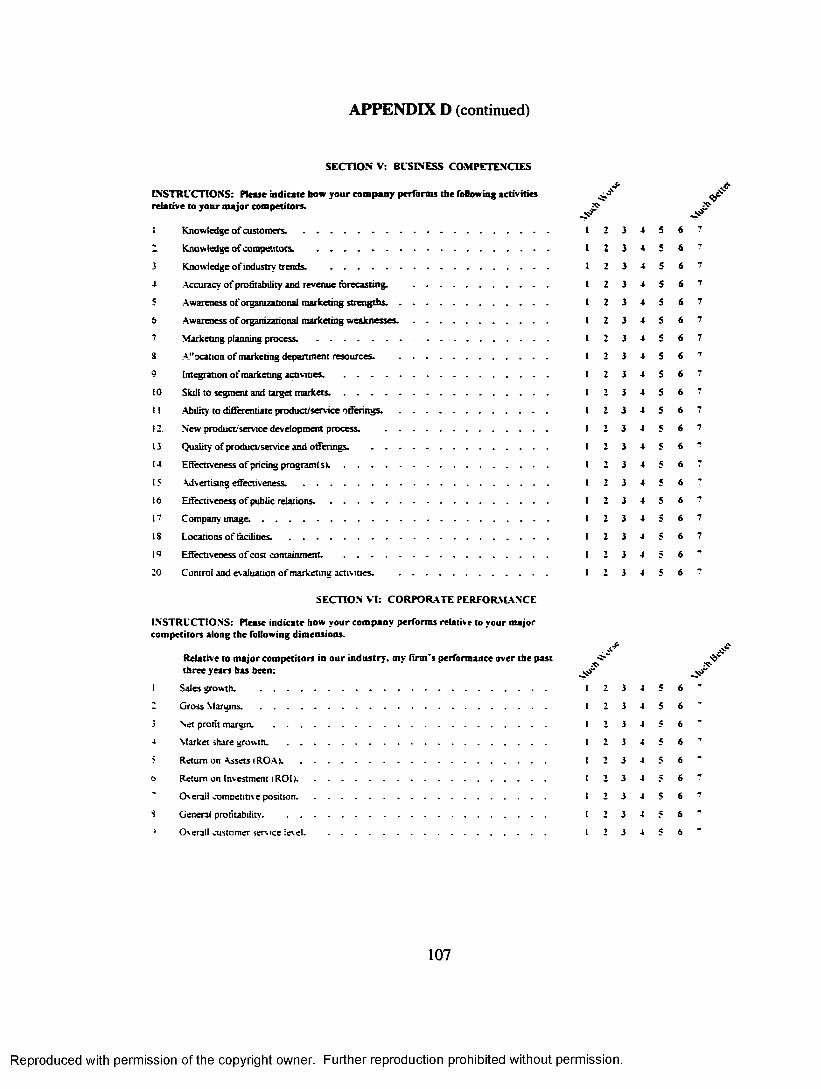
APPENDIX D (continued)
SECTION V: BUSINESS COMPETENCIES
INSTRUCTIONS: Pleaje indicate how your company performs the following activities jrelative to your major competitors. y
I Knowledge o f c u s to m e r s . .................................................................................................... 1 2 3 4 5 6 T
-■ Know ledge o f competitors. .............................................................................................. I 2 3 4 5 6 7
3 Knowledge o f industry trends. ........................................................................................ I 2 3 4 5 6**
4 Accuracy o f profitability and revenue forecasting. ....................................................... 1 2 3 4 5 6 7
5 Awareness o f organizational marketing s t r e n g th s . ............................................................ I 2 3 4 5 6 7
6 Awareness o f organizational marketing w e a k n e s s e s . ....................................................... I 2 3 4 5 6 7
7 Marketing planning p r o c e s s . .................................. ................................................. 1 2 3 4 « 6 7
S Al'ocation o f marketing department resources. ............................................................ I 2 3 4 5 6 7
9 Integration o f marketing activities. ................................................................................... I 2 3 4 5 6 7
1 0 Skill to segment and target m a r k e ts . ................................................................................... I 2 3 4 5 6 7
1 1 Ability to differentiate product/service o f f e r i n g s . ............................................................ I 2 3 4 5 6 7
1 2 New product/service development process. .................................................................. I 2 3 4 e 6 7
13 Quality of product/service and offerings. ........................................................................ 1 2 3 4 S 6 7
14 Effectiveness o f pricing program! s)......................................................................................... 1 2 3 4 < 6 7
15 Advertising e ffe c tiv e n ess ..................................................................................................... 1 2 3 4 j 6
16 Effectiveness o f public r e la t io n s . ........................................................................................ I 2 3 4 5 6
17 Company im a g e . .................................................................................................................... I 2 3 4 S 6 7
IS Locations o f f a c i l i t i e s . ......................................................................................................... I 2 3 4 5 6 7
19 Effectiveness o f cost containment. ................................................................................... I 2 3 4 5 6
20 Control and evaluation o f marketing activities. ............................................................
SECTION VI: CORPORATE PERFORMANCE
“ 4 5 6
INSTRUCTIONS: Please indicate how your company performs relative to your major competitors along the following dimensions.
Relative to major competitors in our industry, my Arm’s performance over the past three years has been:
J --S-“
-O
1 Sales growth. .................................................................................................................... 1 2 3 4 5 6
- Gross M a r g i n s . .................................................................................................................... 1 2 3 4 5 6
3 Net profit margin. ............................................................................................................... 1 2 3 4 5 6
4 Market share growth. ......................................................................................................... 1 2 3 4 ; 6
> Return on Assets (RO.A)........................................................................................................... I 2 3 4 5 6
6 Return on Investment IROI)..................................................................................................... 1 2 3 4 5 6
Overall competitive position..................................................................................................... 1 2 3 4 5 6
s General profitability................................................................................................................... I 2 3 4 5 6
> Overall customer service level.................................................................................................. 1 2 3 4 5 6 -
107
Reproduced with permission of the copyright owner. Further reproduction prohibited without permission.

APPENDIX D (continued)
SECTION VU: LOGISTICS PERFORMANCE
INSTRUCTIONS: Please indicate the importance o f these logistics performance measures in monitoring operations or identifying problems.
If you do not use the measure, please check NA- <3^ /1 In\entorv t u r n s .............................................................................................................. 1 2 3 4 5 6 7 NA
- Inventory levels, number o f davs supply ................................................................. 1 2 3 4 5 6 ? NA
3 Cost as a percentage o f s a l e s ........................................................................................ 1 2 3 4 S 6 7 NA
4 Inbound freight costs ................................................................................................... 1 2 3 4 5 6 7 NA5 Outbound freight c o s t s ................................................................................................... 1 2 3 4 S 6 7 NA6 I_ nits shipped per employee ........................................................................................ 1 2 3 4 5 6 7 NA7 Warehouse labor p roductiv ity ........................................................................................ 1 2 3 4 5 6 7 NA
s Fill rates ........................................................................................................................ 1 2 3 4 3 6 7 NA9 Shipping e r r o r s ............................................................................................................. 1 2 3 4 S 6 7 NA1 0 On time d e liv e ry ............................................................................................................. 1 2 3 4 5 6
7 NA
1 1 Cvde time ................................................................................................................... 1 2 3 4 3 6 7 NA
1 2 Overall reliability ....................................... ' .............................................................. 1 2 3 4 S 6 - NA13 Order entry accuracy ................................................................................................... 1 2 3 4 3 6 7 NA14 Document invoicing a c c u ra c y ........................................................................................ 1 2 3 4 S 6 - NA
i5 Number of customer r e t u r n s ........................................................................................ 3 6 7 NA
SECTION VIII: LOGISTICS ACTIVITIES
INSTRUCTIONS: Please indicate the extent to which you agree or disagree with each s V»statement by checking the appropriate column. > J&'
1 My firm s mission statement is widely disseminated internally and shared with customers. 1 2 3 4 5 6 *
- Our senior logistics executive is involved in business unit strategic planning. . . . 1 2 3 4 5 6
3 We are currently redesigning our logistics informauon s y s te m . ...................................... 1 2 3 4 5 6 **
4 Our logistics operations have more formal rules and procedures today than five years ago. 1 2 3 4 5 6 -
5 We utilize more postponement strategies to deter movement today than five years ago. 1 2 3 4 5 6 7
6 We have improved overall performance measurement capabilities over the past five years. 1 2 3 4 5 6 7
My company regularly solicits customer input for planning logistics strategy. . . . 1 2 3 4 5 6
3 Mv company has procedures in place to facilitate reverse logistics. ........................... I 2 3 4 5 6 -
-) Environmental considerations significantly impact logistics operations at my company. 1 2 3 4 5 b -
10 Mv company has inventory located at fewer sites today than five vears ago....................... I 2 3 4 5 b
i 1 Mv company has clear guidelines and procedures tor creating a l l ia n c e s . ...................... 1 2 3 4 5 6
1 2 My company has clear guidelines and procedures for monitoring alliances. . . . . 1 2 3 4 5 6 *
13 My company has specific logistics strategies to deal with distinct customers. . . . 1 2 3 4 5 6
14 My company has logistics alliances that operate under principles of shared rewards risks. t 2 3 4 5 6 -
On an equal volume basis, we hold less average inventory todav than five -.ears ago. I 2 3 4 5 6
10 Mv company is flexible in terms of accommodating customers special requests. . . 1 2 3 4 5 6
108
Reproduced with permission of the copyright owner. Further reproduction prohibited without permission.

APPENDIX D (continued)
J 4 ?17 My company requires a written agreement or contract to be an integral part o f all alliances. 1 2 4 5 6 7
IS Our logistics organization has undergone major restructuring during the past live years. I 2 4 5 6 7
19 To facilitate operations, employees of other companies in the supply chain are located at andwork in my company's b u s in e s s . ........................................................................................ I 2 4 5 6 -
20 My company uses activity based costing. ........................................................................ I 2 4 5 6 7
21 We have undergone major logistics process re-engineering during the past five years. . 1 2 4 5 6 77“> Senior logistics management in my company makes decisions using total cost measurements. I 2 4 5 6 7
23 My company is making significant investments in new information systems. . . . . 1 2 4 5 6 7
24 To facilitate operations, my company's employees are located at and work within businesses owned by other members of the supply c h a i n . .................................................................. 1 2 4 5 6 7
25 The number o f performance measures that we track is higher today than five years ago. I 2 4 5 6 7
26 Our routine, day-to-day logistics operations are simpler today than five years ago. . . 1 2 4 5 6
27 The cost o f capital used for inventory decisions is the same as the cost of capital used forother investment decisions. .............................................................................................. 1 2 4 5 6 7
28 My company's inventory turns have increased over the last five yean. ...................... 1 2 4 5 6
29 My company has a clear policy regarding cost o f capital tor inventory decisions. 1 2 4 5 6 7
30 Mv company has consistent interdepartmental operating g o a l s . ...................................... 1 2 4 5 6 •
31 My company’s logistics mtbrmation systems capability is better today than five years ago. 1 2 4 5 6 7
32 Mv companv uses equ’valent performance measures tor all d epartm en ts....................... 1 2 4 5 6 7
33 Our current logistics - formation systems are satisfactory to meet our requirements. 1 2 4 5 6
34 We utilize formal programs to measure customer satisfaction beyond internal performance s t a t i s t i c s . ............................................................................................................................... 1 2 4 5 6 -
3d Relative to other areas within my company, logistics' share o f information system resourceshas increased over the last five years. ............................................................................. 1 2 4 5 6 -
36 Our logistics information applications are highly integrated for order processing.selection/ s h i o p i n g . .............................................................................................................. 1 2 4 5 6 7
37 The percentage o f my company's EDI transactions has increased over the past five years. I 2 4 5 6 -
38 We utilize industry standards rather than proprietary standards for the majority o f our EDI transmissions. ................................................................................................................... 1 2 4 5 6 7
39 We utilize industry standards rather than proprietary standards for bar coding. . . . 1 2 4 5 6 -
40 My company views bar code technologies as essential to increase our competitiveness. 1 2 4 5 6 -
41 My company views EDI applications as essential to increase our competitiveness. . . 1 2 4 5 6 -
42 We view real time communication capability as essential to increase our competitiveness. 1 2 4 5 6 -
43 We view satellite communication systems as essential to increase our competitiveness. . 1 2 4 5 6 *
Please bnetlv describe in the space below the speciric ability t ;es) that set your company apart from the competition
109
Reproduced with permission of the copyright owner. Further reproduction prohibited without permission.

APPENDIX D (continued)
1 There is a clear vision guiding the strategic decisions in this comparts................................. 2 3 4 5 6 7
2 You believe the vision w hich is guiding decisions in this company is appropriate. . . 2 i 4 5 6 7
3 The leadership of the company seems to share a common vision o f our future. . . ■ 2 3 4 5 6 7
4 You are currently involved in straietnc planning efforts for vour company......................... 2 3 4 5 6 7
N Your job requires that you think about the long-term future o f your company. . . . 2 3 4 5 6 1
6 You participate in setting long-term plans for vour c o m p a n y . ....................................... 2 3 4 5 6 7
7 This companv is headed in the rinht d i r e c t io n . .................................................................. 2 3 4 5 6 7
8 This company is pursuing the best strategy for achieving our desired goals. . . . . 2 3 4 5 6 7
■5 Your department is in full agreement with the overall strategy of the company. . . . 2 3 4 5 6 7
10 This company is applying its resources in the most constructive manner possible. . . 2 3 4 5 6 7
1 1 There are no other strategic directions which this company should be pursuing. . . 2 3 4 5 6 7
12 You are willing to put a great deal o f effort bevond that normally expected in order to hdp this strategic priority come to realization. ........................................................................ 2 3 4 5 6 7
13 You talk up this strategic priority as a great goal to work towards. ............................ 2 3 4 5 6 ■*
[4 You would accept almost any assignment to keep working towards this strategic priority.. 2 3 4 5 6 -
1 5 The strategic priorities o f your department are similar to those o f the company. . . 2 3 4 5 6 T
10 You are excited to tdl others that the company pursues this strategic priority. . . . 2 3 4 5 6 7
17 This strategic priority really inspires the best in the way of job performance. . . . 2 3 4 S 6 7
1 3 You are glad the company chose this strategic priority over others considered recently. 2 3 4 5 6 7
Id You really care about the fate o f this company and believe that this strategic priority will go a long wav in aiding the company's performance. ............................................................. 2 3 4 5 6 7
20 This is the best of all strategic priorities for vour companv................................................... 2 3 4 5 6
Please describe in the space below the strategic priority which you fed is currently the primary vision for our company
SECTION X: BACKGROUND
(n [his section vie ask about your background and vour company's background Remember, all ofvour responses are strictly confidential We appreciate your help m providing this important information
1 W hat is vour official job title' 7 Companv * annual sales last vear were SI Number or*vears in this position ’ s Companv * av erase zrowth m sales a<»
What is your primary area of expertise’ 4 Companv * average -^ross manrin *■>a Logistics e Accounting 10 Companv'* averase net profit manpn *■*b Marketing f Finance 1 I The number o f independent locations we have isc Operations g Law II We operate i check one) Locallv Reiaonallvd Information systems h Other Nationailv CHoballv
4 Number o f vears in this companv'* 13 Number o f employees in companv' Number o f vears tn this industry* 14 Number o f fmplovees ;n division
Please circle your highest level o f education I * The competition facing our company :s ■ circle one)High School. College. Graduate Degree \ erv low I I 5 4 5 i Immense
110
Reproduced with permission of the copyright owner. Further reproduction prohibited without permission.

APPENDIX E CORRELATIONS, MEANS, AND STANDARD DEVIATIONS
1 1 1
Reproduced with permission of the copyright owner. Further reproduction prohibited without permission.

(n Zo<>EdaQeg«cQz
W gj X <Z3
S P
a£G£zo<_!aa*asOu
CN
sO
CNCN 00
OO CO Or* (S (Nr f wo
cO O ' P-*'O nO vO WOWO i n wo VO
on m oc wo—• CNwo —*
cn wo 00 00 CM m
COCN
O 00 00'O 0 0 CN <*1 ^
CN 0 0 T f WO WO vO
CN WO 0 0—• O ' ^c n c o c n
00CO
On co co CN~ wo O ' coO wo Tf Tf
ON O ' woO 9 0 0 0CO T f Tj*
— CN © —CN CN CO CO
CNCO
cu cu cu cu
112
Reproduced with permission of the copyright owner. Further reproduction prohibited without permission.

APPE
NDIX
E
(con
tinue
d)00 00 cn oo OO CN
oo
co oo oo os
oo oo r -CN CO CNm ttco
co
oco <n ^Tf wo »n
cnooCN
«n on wo— wo r->— c n —
00woCN
com cncn
incnco
CN 3 0 cn
CN CN — CN— © co wom c n m —
wo3 0wo
cncncn
— cn cn on^ . — — cnCO CO CO CO CO co co
113
Reproduced with permission of the copyright owner. Further reproduction prohibited without permission.
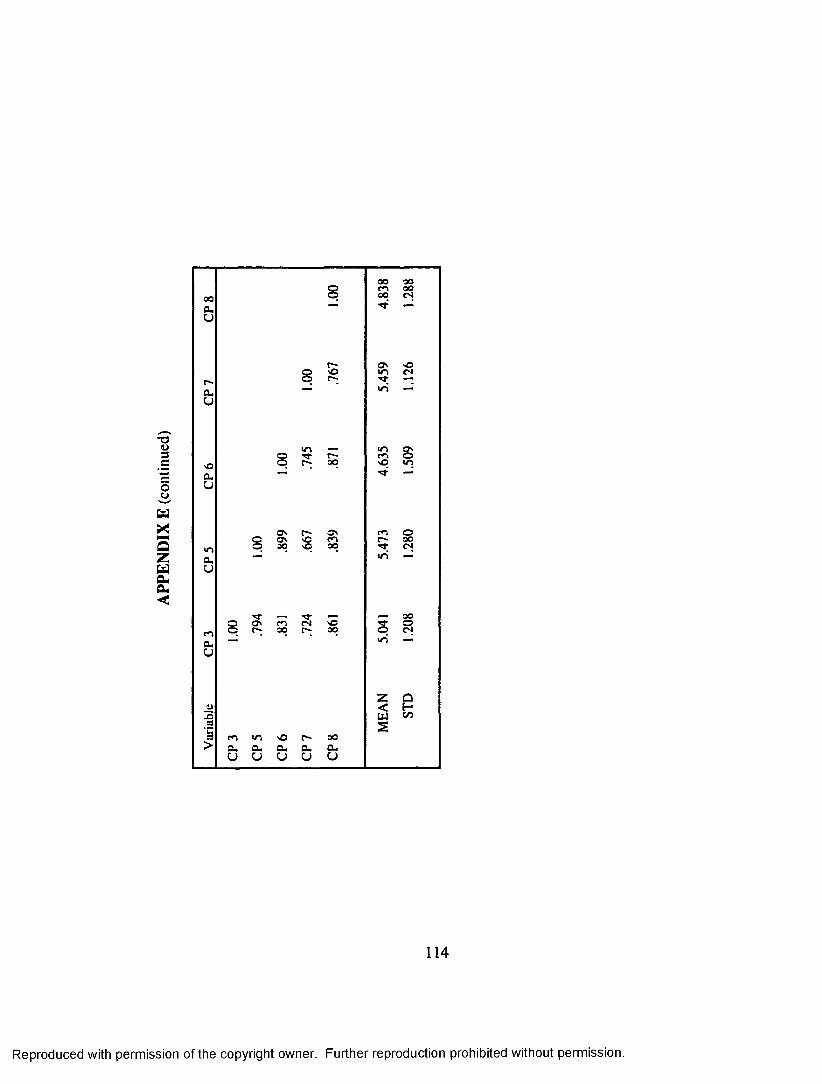
APPE
NDIX
E
(con
tinue
d)
OO OOoooo cs00
00
00n
oovOooon fO fSr-* oo r -m
co
00ro OCU 0^ CU CU
114
Reproduced with permission of the copyright owner. Further reproduction prohibited without permission.

APPENDIX F CONSTRUCTS AND RESULTING INDICANTS
115
Reproduced with permission of the copyright owner. Further reproduction prohibited without permission.

APPENDIX F CONSTRUCTS AND RESULTING INDICANTS
Value Added Service
PC 11 Perform services that add value for the customer during the actual sales process
PC 12 Comprehensively and effectively target a given distribution region PC 14 Accommodate special customer service requests PC 15 Accommodate new product/service introductions (roll-outs to market) PC 23 Continuously add new products or variations
Process
PC 4 Attain the lowest total cost logistics by efficient operations, technology, or scale economies
PC 7 Proactively seek solutions to logistics problems before they occur PC 21 Perform reverse logistics operations in a timely manner PC 22 Differentiate logistical service offerings from that offered by competitors PC 30 Develop creative logistical solutions for specific situations, emergencies or
customersPC 31 Simplify the overall logistical processPC 32 Provide a consistent approach to performing key logistics work
Cost Leadership
CS 11 Invest in cost saving technology CS 12 Emphasize efficiencyCS 13 Redesign products and/or services to reduce costsCS 19 Keep all costs as low as possible so we can offer lower prices
116
Reproduced with permission of the copyright owner. Further reproduction prohibited without permission.
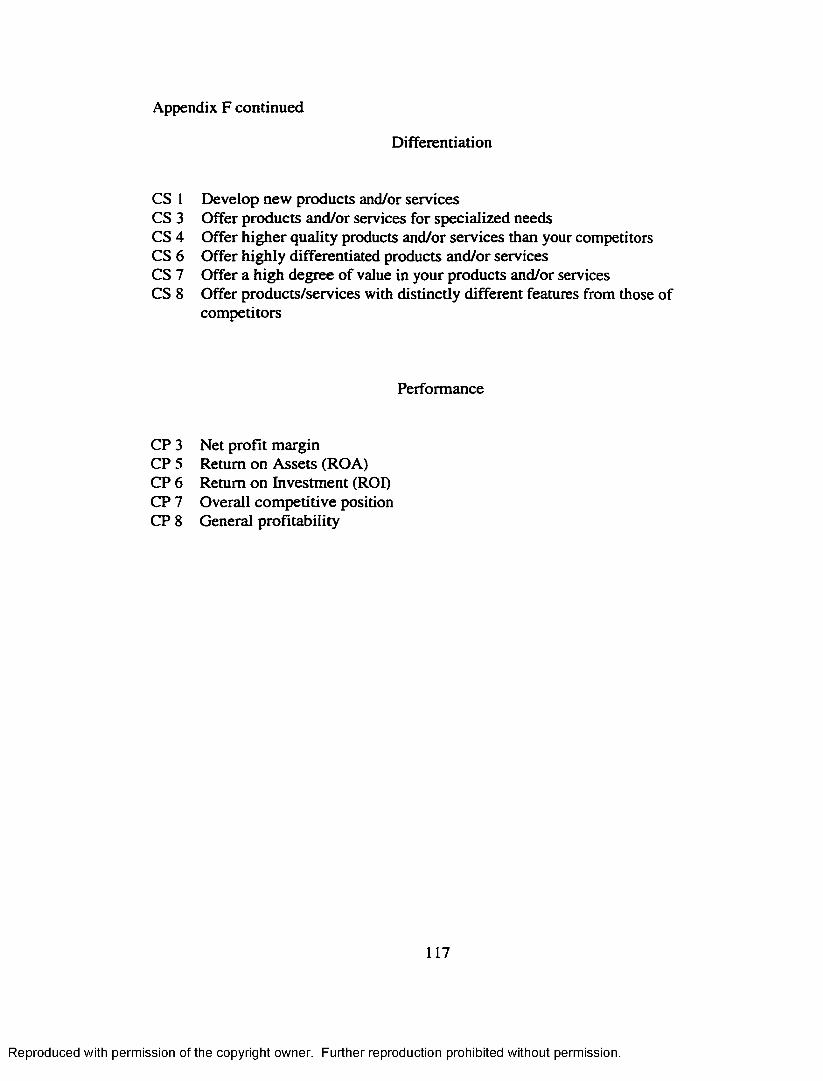
Appendix F continued
Differentiation
CS I Develop new products and/or services CS 3 Offer products and/or services for specialized needs CS 4 Offer higher quality products and/or services than your competitors CS 6 Offer highly differentiated products and/or services CS 7 Offer a high degree of value in your products and/or services CS 8 Offer products/services with distinctly different features from those of
competitors
Performance
CP 3 Net profit margin CP 5 Return on Assets (ROA)CP 6 Return on Investment (ROI) CP 7 Overall competitive position CP 8 General profitability
117
Reproduced with permission of the copyright owner. Further reproduction prohibited without permission.

THE INTEGRATION OF FIRM RESOURCES: THE ROLE OF CAPABILITIES
IN STRATEGY AND FIRM PERFORMANCE
Abstract of dissertation submitted in partial fulfillment of the requirements for the degree of
Doctor of Philosophy
By
Daniel F. Lynch, B.S., M.P.A. Fairleigh Dickinson University, 1975
University of Colorado, 1977
December 1998 University of Arkansas
Reproduced with permission of the copyright owner. Further reproduction prohibited without permission.

This abstract is approved by:
Dissertation Director:
Dr/John Ozment
Reproduced with permission of the copyright owner. Further reproduction prohibited without permission.

THE INTEGRATION OF FIRM RESOURCES:
THE ROLE OF CAPABILITIES
IN STRATEGY AND FIRM PERFORMANCE
Distinctive capabilities are defined as a firm’s accumulated skills and
knowledge that may lead to competitive advantage (Day 1994). Distinctive
capabilities are founded upon Resource-Based Theory (Barney 1991) that focuses on
internal resources as opposed to external market forces (Porter 1980). The present
research discusses the integration of distinctive capabilities into this framework; that
is, do certain distinctive capabilities (resources) create superior firm performance
when linked to the appropriate generic business strategy?
The literature on firm performance has a rich history and is theoretically
grounded in several disciplines including economics, sociology, and organizational
behavior (Anderson 1982). However, there has not been much empirical support for
any specific theory. That is, authors have not been successful in explaining why
certain firms perform well while others do not. Several authors have attempted to
link strategy to performance (Miller 1986; Dess and Davis 1984; Miles and Snow
1978; Porter 1980), but with varying levels of success. More recently, authors have
attempted to tie firm performance to resources (Barney 1991; Hall 1993) and/or
capabilities (Day 1994; Droge et al. 1994; Hitt and Ireland 1986), but here, too, there
has not been convincing empirical support.
1
Reproduced with permission of the copyright owner. Further reproduction prohibited without permission.

The objectives of this dissertation are to examine whether superior firm
performance is achieved when resources/capabilities are properly matched with
market strategy (what one might call—fit) and to ascertain which capabilities should
be linked to which strategy. Strategy, for the purpose of this study, will be those
strategic choices that were defined by Porter (1980). He hypothesized that firms may
pursue two different generic business strategies in order to achieve superior firm
performance, i.e., cost leadership or differentiation. These strategic alternatives will
form the basis of our strategy construct for this thesis.
Since capabilities (firm resources) reside mostly at the functional level of the
organization, that is where this dissertation will begin. There are many resources
and/or capabilities that firms rely on to pursue their objectives. Some of these are
related to specific functions such as finance, operations, logistics, or marketing.
However, there has been very little research that has identified and measured the
resources/capabilities of specific functional areas. One of the few areas in which
studies have been conducted and for which scales have been developed is the
logistics function (Global Logistics Research Team at Michigan State University
1995; Eckert and Fawcett 1996; Morash et al. 1996; Clinton and Closs 1997).
Logistics expenses may represent as much as twenty percent of the total cost in many
industries (Coyle, Bardi, and Langley 1996; Lambert and Stock 1993). Accordingly,
this study builds upon that prior knowledge in an effort to gain a better understanding
of how capabilities, strategy, and performance are related.
2
Reproduced with permission of the copyright owner. Further reproduction prohibited without permission.

DISSERTATION DUPLICATION RELEASE
I hereby authorize the University of Arkansas Libraries to duplicate this dissertation when needed for research and/or scholarship.
Agreed
Refused
Reproduced with permission of the copyright owner. Further reproduction prohibited without permission.