Embed Size (px)
Citation preview
NBER WORKING PAPER SERIES
INTERNATIONAL FINANCIAL INTEGRATION AND ENTREPRENEURIAL FIRMACTIVITY
Laura AlfaroAndrew Charlton
Working Paper 13118http://www.nber.org/papers/w13118
NATIONAL BUREAU OF ECONOMIC RESEARCH1050 Massachusetts Avenue
Cambridge, MA 02138May 2007
We thank Galina Hale, Ricardo Hausmann, Jean Imbs, Lakshmi Iyer, Simon Johnson, Cheryl Long,Roberto Rigobon, Steve Redding, Dani Rodrik, Kathy Terrell, Eric Werker, and participants at theStanford Institute for Theoretical Economics summer workshop on Emerging Market Firms' Behavior,the Harvard Business School-BGIE seminar, the Kennedy School's LIEP, 2006-LACEA Conference,the Capital Flows-IMF 7th Jacques Pollak Conference, the 2007 AEA meetings, and seminars at theLondon School of Economics, the University of Michigan, and Columbia Business School seminarfor valuable comments and suggestions. We are grateful to Todd Mitton for helping us with the IOdata, Dun & Bradstreet and Dennis Jacques for helping us with the D&B data set, and HBS and LSEfor financial support to purchase the data. We further thank Pamela Arellano for excellent researchassistance. The views expressed herein are those of the author(s) and do not necessarily reflect theviews of the National Bureau of Economic Research.
© 2007 by Laura Alfaro and Andrew Charlton. All rights reserved. Short sections of text, not to exceedtwo paragraphs, may be quoted without explicit permission provided that full credit, including © notice,is given to the source.
International Financial Integration and Entrepreneurial Firm ActivityLaura Alfaro and Andrew CharltonNBER Working Paper No. 13118May 2007JEL No. F21,F23,F34,G15,G18,L26,O19
ABSTRACT
We explore the relation between international financial integration and the level of entrepreneurialactivity in a country. We use a unique firm level data set of approximately 24 million firms in nearly100 countries in 2004 and 1999, which enables us to present both cross-country and industry levelevidence. We establish robust cross-country correlations between increased international financialintegration and the activity of entrepreneurs using various proxies for entrepreneurial activity suchas entry, size, and skewness of the firm-size distribution and de jure and de facto measures of internationalcapital integration. We then explore causal channels through which foreign capital may encourageentrepreneurship. We find evidence that entrepreneurial activity in industries which are more relianton external finance is disproportionately affected by international financial integration, suggestingthat foreign capital may improve access to capital either directly or through improved domestic financialintermediation. Second we find that entrepreneurial activity is higher in industries which have a largeshare of foreign firms or in vertically linked industries.
Laura AlfaroHarvard Business SchoolMorgan Hall 263Soldiers FieldBoston, MA 02163and [email protected]
Andrew CharltonLondon School of EconomicsHoughton StreetLondon, WC2A 2AE, [email protected]
1
1 Introduction
In this paper we explore the relation between a country’s level of international financial integration,
that is, its links to international capital, and the level of entrepreneurial activity. Researchers have stressed
the roles of entrepreneurship, new firm activity, and economic dynamism in economic growth.1 The
empirical effects of international capital mobility on firm dynamism and entrepreneurial activity, however,
have received little attention in the literature albeit the intense academic and policy debates. Using different
measures commonly employed in the literature in a new firm level data set in nearly 100 countries in 1999
and 2004, we find higher entrepreneurial activity in more financially integrated countries and countries with
fewer restrictions on international capital flows. We further explore various channels through which
international financial integration can affect entrepreneurship (a foreign direct investment channel and a
capital/credit availability channel) and provide consistent evidence of our results.
The theoretical effects of international financial integration on entrepreneurship are ambiguous.
The rapid rate of global financial integration, perhaps most directly observed in the explosive growth of
foreign direct investment (FDI), has raised concerns in both the public and academic communities about
potential negative effects of international capital on the development of domestic entrepreneurs with
negative consequences to the economy as a whole. It has been argued that foreign enterprises crowd out
local efforts, and thus impart few, if any, benefits to the local economy. Grossman (1984) shows that
international capital, and in particular FDI, can lead to the crowding out of the domestic entrepreneurial
class.2 Hausmann and Rodrik (2003) argue that laissez-faire and in particular openness can lead to too little
investment and entrepreneurship ex-ante. Similar concerns were raised by an earlier development literature.
Hirschman (1958), for example, warned that in the absence of linkages, foreign investments can have
negative effects on an economy (the so called ‘enclave economies’). More generally, researchers have
argued that in the presence of pre-existing distortions and weak institutional settings, international capital
mobility can increase the likelihood of financial crises; higher volatility and risk can reduce
entrepreneurship and innovative efforts in a country. Some scholars have asserted that open capital markets
may be detrimental to economic development (see Bhagwati (1998), Rodrik (1998), and Stiglitz (2002)). As
Eichengreen (2001) notes, “[C]apital account liberalization, it is fair to say, remains one of the most
controversial and least understood policies of our day.”
On the other hand, access to foreign resources can enable developing countries with little domestic
capital to borrow to invest, and resource constrained entrepreneurs to start new firms. Indeed, availability of
funds has been shown to be an important determinant of entrepreneurship.3 International financial
1 Entrepreneurship and firm creation are often described as the keys to economic growth (Schumpeter 1942). See Aghion and Howitt (1998) for an exhaustive survey of Schumpeterian growth models. 2 In addition, if foreign firms borrow heavily from local banks, instead of bringing scare capital from abroad, they may exacerbate domestic firms’ financing constraints by crowding them out of domestic capital markets; see Harrison, Love and McMillian (2004) and Harrison and McMillian (2003). 3 Evans and Jovanovic (1989) show theoretically that wealth constraints negatively affect entrepreneurship. Evans and Leigthon (1989) find evidence that credit constraints are a critical factor in the founding and survival of new firms.
2
integration should also facilitate international risk sharing and thus lower the cost of capital for many
developing countries, and, by fostering increased competition, improve the domestic financial sector with
further benefits to entrepreneurship.4 Furthermore, researchers have stressed the potential positive role of
knowledge spillovers and linkages from foreign firms to domestic firm activity and innovation.5
Whether international capital mobility is fostering or destroying entrepreneurship is a critical
question in academic and policy circles. Yet, empirical analysis of the effects of international capital
mobility on entrepreneurial activity and firm dynamism are all but absent from the literature. This is largely
due to the difficulty of obtaining an international data set sufficiently comprehensive to support studies of
firm dynamism in both developed and developing countries. As Bartelesman, Haltinwanger and Scarpetta
(2005) note, at the firm level, no comprehensive survey exists with data for multiple countries, nor are there
international data sets that contain micro-level data for comprehensive samples of firms.6
We overcome this problem by using a new data set of private firms in 98 countries in 1999 and
2004. Our data set contains more than 24 million observations of both listed and unlisted firms across a
broad range of developed and developing countries at different stages of international financial integration.
Over the last decades, barriers to international capital mobility have fallen in developed countries and
diminished considerably in many developing countries. But despite recent trends, restrictions on
international financial transactions are still quantitatively important for many countries, and de facto flows
remain low relative to those predicted by standard models, in particular, for developing countries.7
Limitations with the data notwithstanding, the coverage of the data enables us to study the differential
effects of restrictions on capital mobility on entrepreneurial activity.
Identifying the effects of international financial integration on entrepreneurial activity is, however,
not an easy task. There is no one definition of entrepreneurship or what it entitles, hence, no one variable to
measure it.8 Therefore, we analyze a variety of measures commonly used in the literature as imperfect
proxies for various aspects of entrepreneurial activity.9 We focus on firm entry, average firm size and
skewness of the firm-size as these measures better capture firm activity but also consider age and vintage (a
size-weighted measure of the average age of the firm). The literature distinguishes between de jure
indicators of financial integration, which are associated with capital account liberalization policies, and de
4 Increased risk sharing opportunities might encourage entrepreneurs to take on more total investments, or shift production activities towards higher-risk, higher-return projects; see Obstfeld (1994), Acemoglu and Zilibotti (1997). 5 Markusen and Venables (1999) propose a model that suggests that FDI will be associated with firm turnover. Although entry of foreign firms increases competition and, initially, forces the exit of domestic firms, in the longer run multinationals might stimulate local activity through linkages with the rest of the economy. See also Rodriguez-Clare (1996) for a formalization of the linkage effects between foreign and domestic firms. 6 Bartelesman, Haltinwanger and Scarpetta (2005) review the measurement and analytical challenges of handling firm level data and attempt to harmonize indicators of firm dynamics for a number of countries. Their harmonized data, however, is available for few countries (mostly industrialized) and for many countries that data is confidential. 7 See Table 3 for stylized facts, and Alfaro, Kalemli-Ozcan, and Volosovych (2006) for a comprehensive analysis of the main trends related to international capital flows in the last thirty years. 8 Different views in the literature have emphasized a broad range of activities including innovation (Schumpeter, 1942), the bearing of risk (Knight 1921), and the organization of the factors of production (Say, 1803). 9 See Desai, Gompers, and Lerner (2003), Klapper, Laeven, and Rajan (2005), and Black and Strahan (2002).
3
facto indicators, which are associated with actual capital flows.10 We use both, as they capture different
aspects of international capital mobility and financial integration. We also control for other determinants
found in the literature to affect the level of entrepreneurship such as local development level, market size,
and institutional constraints.
The richness of our data enables us to study the relationship between international financial
integration and entrepreneurial activity at two levels. First, we study the cross-country properties of our data
between international financial integration and our measures of entrepreneurship. Using data for 1999 and
2004 we find countries with more relaxed capital controls (de jure integration) or receiving a higher volume
of foreign capital (de facto integration) were on average more likely to experience greater entrepreneurship
proxied by increased activity among new and small firms. Our results are both statistically and economically
significant and are robust to different measures and specifications. In addition, we look at industries within
countries using the methodology of Rajan and Zingales (1998) and Klapper, Laeven and Rajan (2005)
which focuses on cross-industry, cross-country interaction effects to determine whether the effect of foreign
capital is higher in industries which have a higher natural level of entrepreneurship using the Unites States
as a proxy for the “natural activity” in an industry. We find that entry and skewness of the firm size
distribution are relatively higher in naturally-high-activity industries when the country has relatively high
international capital mobility. The results confirm our previous findings. While we are reluctant to over-
interpret these simple correlations, they do present to our knowledge the first cross-country evidence of the
effect of foreign capital on entrepreneurship.
The nature of our data further allows us to consider various channels through which foreign capital
might affect entrepreneurship. First, international financial integration might increase capital in the economy
and improve its intermediation (a capital/credit availability channel). Although small firms might not be
able to borrow directly in international markets, improved financial intermediation and other firms’ (and the
government’s) international borrowing might ease financing constraints until some of the additional capital
finds its way to new firms. Second, local firms might benefit from spillovers and linkages from foreign
firms (FDI channel). We test for the former channel by exploring whether entrepreneurial activity is higher
in firms that are more dependent on external finance as defined by Rajan and Zingales (1998). The evidence
does indeed suggest this to be case. In terms of the FDI channel, our data set has the advantage of enabling
us to distinguish between foreign and local firms. We find that entrepreneurial activity is higher in industries
which have a large share of foreign firms or in vertically linked industries. Our results are consistent with
our previous findings.
Important concerns in our analysis are related to sample biases, policy endogeneity and omitted
variables biases in terms of establishing the causality between international financial integration and proxy
variables of entrepreneurial activity. Capital account liberalization and entrepreneurial activity might, for
example, be positively correlated with an omitted third factor. If that factor was a government policy—for
10 See Prasad et al. (2003) for a discussion of the different indices and measures used in the literature.
4
example, a policy-maker anticipating improvements in external conditions liberalizes a country’s capital
account—we would observe capital liberalization and intensified firm activity. We take different steps to
mitigate these concerns. We control for other variables that might affect entrepreneurial activity. We believe
the extensive robustness analyses we perform eases concerns about potential omitted variables. We also
look at different proxies for entrepreneurial activity and capital mobility. We analyze firm/industry
characteristics as opposed to country characteristics, and test effects controlling for the different sectors.
Even if firm dynamism is correlated because of an omitted common factor, it is hard to argue that the latter
affects the relation between capital flows and entrepreneurial activity in a systematic way for firms in
sectors with different characteristics. Although, naturally, it is impossible to control for all possible
variables that might be correlated with international financial integration and firm activity, the results using
two sample periods and the Rajan and Zingales (1998) methodologies further ease concerns that our results
are driven by these biases. Finally, we feel more comfortable in interpreting our correlation as causation in
as much as mechanisms consistent with such an interpretation are supported by the empirical evidence.
However, even after all of these tests, our estimates should be interpreted with caution.
We noted earlier the scarcity of empirical work on the effects of international capital mobility on
entrepreneurial activity. A number of papers have studied how different aspects of capital account
liberalization affect a firm’s financing constraints and the cost of capital. Chari and Herny’s (2004)
examination of the effect of stock market liberalization in 11 emerging markets suggests that publicly-listed
firms that become eligible for foreign ownership experience a significant average stock price revaluation
and significant decline in the average cost of capital. Harrison, Love and McMillian (2004) find FDI inflows
to be associated with a reduction in firms’ financing constraints while restrictions on capital account
transactions negatively affect their financial constraints.11 Gorg and Strobl (2002) find foreign presence to
be associated with higher entry in Ireland. Recent work has studied the role of foreign banks (see
Detragiache, Tressel and Gupta (2006) for survey and empirical finding). These studies, in particular those
examining developing countries, tend not to use firm level data due to availability constraints. Overall, our
results are consistent with their findings.
Our paper also relates to the research on the effects of the external environment on
entrepreneurship. Bertrand and Kamarz (2002) study of the expansion decisions of French retailers
following new zoning regulations in France. Scarpetta et al. (2002), Desai, Gompers, and Lerner (2003),
Klapper, Laeven, and Rajan (2005), and Kumar, Rajan, and Zingales (1999) have studied different aspects
of the external environment on firm creation and entrepreneurship in a cross-section of European
countries.12 Other work on aspects of entrepreneurship include Johnson et al.’s (2002) finding that
11 The authors use large publicly traded firm level data for 38 countries and 7079 firms from the Worldscope data base. In contrast, Harrison and McMillian (2003) find that in the Ivory Coast for the period 1974-1987, borrowing by foreign firms aggravated domestic firms’ credit constraints. 12 Scarpetta et al. (2002) use firm level survey data from OECD to study exit and entry. They find that higher product and labor regulations are negatively correlated with entry for small and medium sized firms in OECD. Using the
5
investment by entrepreneurs is lower in countries with weak property rights; Black and Strahan’s (2002), Di
Patti and Dell’Ariccia (2001) and Guiso, Sapienza, and Zingales’ (2004) finding that competition in the
banking sector and financial development fosters firm entry in the U.S. and Italy respetively; Fisman and
Sarria-Allende’s (2005) study of the effects of regulation of entry on the quantity and average size of firms;
Beck, Demirguc-Kunt, Laeven, and Levine’s (2006) finding that financial development exerts a
disproportionately positive effect on small firms; and Acemoglu, Johnson and Mitton (2005) cross-country
study of concentration and vertical integration. Most of these papers, with the exception of the latter, use
data from the Amadeus dataset (which has data for Western and Eastern Europe only) or the Worldscope
database (which includes information for a large number of countries but covers only relatively large,
publicly trade firms).13 Our paper also contributes to this literature by exploring the determinants of firm
dynamism in a broader sample of developed and developing countries using data for both private and public
firms.14
Finally, by focusing on micro effects, our results contribute to the broader debate on the effects of
international financial integration.15 As argued by Schumpeter, firm entry is a critical part of an economy’s
dynamism. Previous work has documented the important effects of new firm entry and economic dynamism
on economic growth. Obstacles to this process can have severe macroeconomic consequences. International
competition is an important source of creative destruction. Researchers have documented significant
productivity, firm dynamism, and reallocation effects from trade openness with positive effects for specific
countries.16 This paper documents and studies the relation between firm dynamism and international
financial integration. Our results suggest that, contrary to the fears of many, capital mobility has not
hindered entrepreneurship. Instead, international financial integration has been associated with greater firm
activity.
The rest of the paper is organized as follows. Section 2 describes the data. Section 3 presents the
main empirical results. Section 4 discusses potential channels and presents evidence consistent with the
main results. Section 5 concludes.
Amadeus data set for 1999, Desai, Gompers, and Lerner (2003) and Klapper, Laeven, and Rajan (2005) obtain similar findings. Kumar, Rajan and Zingales (1999) use data from Enterprise Europe for either 1991 or 1992. 13 Di Patti and Dell’Ariccia (2001) use data for Italian firms only from the Movimprese database for 1996-1999; Fisman and Sarria-Allende (2005) complement industry data from UNIDO with Worldscope data for a sample of 34 countries; Black and Strahan (2002) use data for the U.S. from D&B, Acemoglu, Johnson, and Mitton (2005) use data for 769,100 firms from the 2002 WorldBase file; Beck et al. (2006) use industry level data complemented by U.S. Census data. Publicly listed firms account for only 25 percent of jobs, even in the United States (Davis, Faberman, and Haltiwanger 2006). Although it is difficult to quantify this number for our broad sample of countries, presumably, publicly traded firms are of much greater importance in the United States than in most other countries. 14 To our knowledge our paper is the first to study different aspects of firm entrepreneurship and the effects of international capital. Most of the literature has not controlled for the role of international financial integration nor study the effects of financial market development using firm level data in a sample that encompasses developing countries. Our results show a positive and significant effect of international capital even after controlling financial market development. We thank Jean Imbs for bringing this to our attention. 15 See Forbes (2004), Henry (2006), and Kose et al. (2006) for recent reviews of the literature. 16 See Caballero (2006) for an overview of empirical evidence.
6
2 Data and Descriptive Statistics
2.1 Firm Level Data
Cross country empirical investigations at the firm level are notoriously difficult because of both a
lack of data and problems with the few datasets which are available. Common problems include a paucity of
data—in particular for developing countries—and selection problems associated with biases and potential
endogeneity of the cross-country sample frame. Among the available sources of international firm data are
Amadeus, Worldscope, UNIDO and Osiris. Of these, most studies have used the Amadeus data because it
includes data on both publicly listed and private firms.17
In this paper, we use data from WorldBase compiled by Dun and Bradstreet, a database of public
and private companies in more than 213 countries and territories. For each firm, WorldBase reports the four-
digit SIC-1987 code of the primary industry in which each firm operates, and for a few countries the SIC
codes of up to five secondary industries, listed in descending order of importance. We exclude
establishments missing primary industry and year started information, and government related firms (SIC
>8999). With these restrictions, our final data set includes more than 24 million observations. The criteria
used to clean the sample are detailed in the Appendix A which also describes data set in further detail. Table
1 lists the countries represented in the data set and main summary statistics at the country level.
In our view, Dun and Bradstreet’s WorldBase, while not without problems, is the best database to
analyze our question. In particular it has four main advantages over most other sources. First it is much
larger, including more than 45 million public and private firms in the total database in 2004. We observe the
data at two time periods 2004 and 1999.
Second, data sources restricted to Europe such as Amadeus are not useful for our purposes because
it does not have broad coverage of countries and in particular of developing countries with different levels
of international financial integration, WorldBase by contrast has data in more than 213 countries and
territories. We excluded territories with fewer than 80 observations, and those for which the World Bank
provides no data—this leaves us with observations in 98 countries—creating significant variation in
international financial integration.
Third, the unit of observation in WorldBase is the establishment. Establishments like firms have
their own addresses, business names, and managers, but might be partly or wholly owned by other firms.
17 See for example Desai, Gompers and Lerner, Klapper, Laeven and Rajan (2005), Giannetti and Onenga (2005), and Ayyagari and Kozová (2006). The Amadeus data is provided by Bureau Van Dijk (BvD), a European electronic publishing firm which gathers the data through information providers of Amadeus data within each country. In some countries these providers gather the national data within each country (e.g., Companies House in the UK) and in other countries (particularly Eastern Europe) they collect it direct from firms. These national companies collect the data from the national public body in charge of collecting the annual accounts in its country. Because of different disclosure requirements, the amount and type of information also varies among countries.

7
We are therefore able to observe new enterprises spawned from existing firms or, by aggregating to the firm
level, we can examine only independent new firms.18
Fourth, Dun & Bradstreet compile their data from a wide range of sources, whereas other databases
collect primarily from national firm registries. Dun & Bradstreet compiles the WorldBase data from a
number of sources with a view to providing its clients contact details and basic operating information about
potential customers, competitors, and suppliers. Sources include partner firms in dozens of countries, from
telephone directory records, websites, and self-registering firms. All information is verified centrally via a
variety of manual and automated checks. Information from local insolvency authorities and merger and
acquisition records are used to track changes in ownership and operations. The variety of sources from
which the data are collected avoids a sample selection problem presented in studies using data from national
firm registries. Because national statistical agency’s reporting requirements differ widely across countries
(for example, small firms are not required to register in some countries) samples drawn from such sources
are not random but determined by the local institutional environment. These reporting requirements may be
correlated with other national characteristics, potentially biasing the results. The wide variety of sources
from which Dun & Bradstreet collects data reduces the likelihood that the sample frame will be determined
by national institutional characteristics. In Appendix A, we compare the Dun & Bradstreet data to the
United States Census data. The comparison illustrates that our data set seem to be well suited for our
analysis.
2.2 Entrepreneurship Measures
How to measure entrepreneurship? Given the different perspectives in the literature on the role of
entrepreneurs in an economy, definitions have emphasized a broad range of activities including the
introduction of innovation (Schumpeter, 1942), bearing of risk (Knight, 1921), bringing together of factors
of production (Say, 1803). In general, entrepreneurs are risk-bearers, coordinators and organizers, gap-
fillers, leaders, and innovators or creative imitators.
If there is no one way to define entrepreneurship, there is certainly no one way to measure it.
Hence, while simple comparisons of different indicators remain difficult to interpret, we use a variety of
proxies commonly used in the literature which should give us an overall picture of entrepreneurial activity
in the country (and mitigate concerns related to any one measure in particular). Following Black and
Strahan (2002), Desai, Gompers, and Lerner (2003), Scarpetta et al. (2002), and Klapper, Laeven, and Rajan
(2005), we calculate for each industry/country pair the rate of entry, average firm size, the skewness of firm
size, age, and vintage.19
18 Our view is that the expansion of activity by existing firms via new plants is an indication of entrepreneurial activity. However, in the robustness section, we also we run our regressions using only wholly owned firms when calculating our entrepreneurship measures obtaining similar results. 19 Because of the 5 year difference in our data sets, we do not calculate exit. As Bartelesman, Haltinwanger and Scarpetta (2005) note, about 20% to 40% of entering firms fail within the first two years of life. The Global

8
i. Firm Entry: Firm entry is defined as the number of new firms (two years of less) divided by the
total number of firms in the country/industry pair.20 Markets that provide an opportunity for more startup
firms are said to be more dynamic and entrepreneurial. Greater access to capital and improvements in a
country’s financial markets associated with international financial integration should ease capital constraints
and positively influence entry decisions in a country.21
ii. Size: We calculate average firm size measured by the log of the average number of employees in
each country/industry pair. Small firms play an important role in the economy as they are often portrayed as
sources of innovation, regeneration, change and employment. Although the prediction is not unambiguous,
we expect lower levels of capital rationing associated with international financial integration to result in
greater numbers of small firms being able to enter and survive in the market.
iii. Firm Size Distribution: We also examine the relation between skewness of the firm-size
distribution and international financial integration. If capital constraints are operative in shaping the nature
of industrial activity, the firm-size distribution should be skewed. Cooley and Quadrini (2003) and Cabral
and Mata (2003) argue that in the presence of capital constraints firm size distribution will be skewed.22
iv. Age: In the robustness section, we use average age in each industry/country pair—an alternative
measure of firm turnover. We expect greater financial integration to be associated with more dynamic
business environments and lower average firm age.
v. Vintage: We also use in the robustness section a weighted average measure of age. Following
Desai, Gompers and Lerner (2003) vintage is the weighted (by numbers of employees) average age of the
firms in each country/industry pair. This measure shows the importance of young firms to the productive
capacity of an industry. Low vintage indicates that young firms dominate the productive capacity. The
predictions with respect to vintage are not unambiguous, although we expect smaller, younger firms to
benefit from greater access to international funds. Appendix A explains all variables in detail.
2.3 Capital Mobility Data
How to measure international financial integration? Assessing a country’s integration with
international financial markets is a complicated task. The process, that is, the change in the degree to which
a country’s government restricts cross-border financial transactions, is complex and involves multiple
phases. Markets can be liberalized gradually and the effects smoothed if the reforms can be anticipated.23
The literature, as we observed earlier, differentiates between de jure financial integration associated with
Entrepreneurship Monitor (GEM) publishes indices of entrepreneurial activity. These data did not seem to be empirically consistent with other measures used in the literature and hence are not used in this paper. 20 Here and henceforth, we use the terms firm and establishment interchangeably when no confusion is caused by doing so. 21 This might depend on whether a country is exporting or importing capital, but there might still be an improvement in intermediation of capital. 22 In Cabral and Mata (2003), for example, firm growth depends upon investment and access to capital. Capital constraints tend also to affect younger firms that are likely to be capital rationed. 23 Anticipation and gradualness should bias our results away from finding an effect.
9
policies on capital account liberalization and de facto measures related to actual capital flows. De jure
liberalization processes might not reflect de facto liberalization processes. If, for example, one part of the
system is liberalized, investors might use it to circumvent other controls. Some reforms might not be
credible, and countries, albeit officially open, might nevertheless not have access to foreign capital. Hence,
we use both measures of financial integration.
Most empirical analyses that require a measure of capital account restrictions use an index
constructed from data in the International Monetary Fund’s (IMF’s) Annual Report on Exchange
Arrangements and Exchange Restrictions (AREAER).24 This is a rule-based indicator in that it focuses on de
jure restrictions imposed by the legal authorities in each country. The index uses data on different
restrictions: capital market securities, money market instruments, collective investment securities,
derivatives and other instruments, commercial credits, financial credits, guarantees, securities, and financial
backup facilities, direct investment, real estate transactions, and personal capital transactions. A
corresponding dummy variable takes the value of 1 if each of the restrictions is present in each country, zero
otherwise. We use the average of the dummies as our measure of restrictions for each country.
Our analysis employs the following de facto measures of capital mobility which are described in
detail in Appendix A: i. Capital Inflows/GDP: which is the sum of flows of FDI, equity portfolio, financial
derivatives, and debt. ii. Inflows of Foreign Direct Investment/GDP, Net: which emphasizes the potential
benefits derived from FDI associated with technological transfers, knowledge spillovers, and linkages that
go beyond the capital foreign firms might bring into a country. iii. Stock of Foreign Liabilities/GDP: which
proxies the thickness of banking and equity relationships (both FDI and portfolio investment) with other
countries. iv. Gross Capital Flows/GDP: which captures a country’s overall foreign capital activity. In the
robustness section we used v. Equity Inflows/GDP to capture the relation between entrepreneurial activity
and equity flows of capital (sum of foreign direct investment and portfolio inflows) and vi. Net Capital
Flows/GDP focusing on the net capital available to the economy.
3 Summary Statistics and Cross-Country Correlations
3.1 Summary Statistics
Table 1 presents summary statistics by country for our main variables for 2004. We have for the
United States, for example, more than 7 million firms. France follows with more than 4 million. At the other
end of the spectrum, we have Zimbabwe with 99 firms and Burkina Faso with 87. There is clearly wide
variation in entrepreneurial activity across countries. Countries such as Denmark, Netherlands, and South
Korea exhibit high firm creation, Papua New Guinea and Yemen relatively low firm creation, in 2004.
Median employment per firm was relatively high for Indonesia, Papua New Guinea, and Thailand and
24 The index is constructed from data on restrictions presented in the survey appendix. In 1997, the IMF changed the way they report the capital controls data. The new classification is a vast improvement over the previous measure, although issues regarding circumvention of controls remain.
10
relatively low for Netherlands, Belgium, and Italy. Table 2 presents summary statistics by industry at the
two-digit SIC code level. The service sector shows, overall, higher entry rates and lower median
employment levels. Table 3 presents summary statistics on de jure and de facto capital mobility. Countries
such as Costa Rica, Netherlands, and Belgium have low levels of de jure restrictions according to the IMF
index, while Zimbabwe, Papua New Guinea and Thailand high levels of restrictions. There is also
widespread variability in de facto flows of capital.25 Table 4 reports summary statistics for our main control
variables. Table 5 presents the correlation matrix of the main variables. Our data seem to be not only
internally consistent, but also consistent with other studies of firm dynamics reported in the literature.26
Figure 1 plots the firm-size distribution measured by the number of employees for countries with
high and low de jure restrictions to capital mobility. The figure shows there to be higher entrepreneurial
activity in countries with lower restrictions. Figure 2, presents for low and high capital controls countries
histograms of firm entry by industry, each industry observation weighted by the number of firms. Similarly,
the figure shows firm activity to be higher in countries with fewer controls.
These figures, however, do not control for industry composition within countries or the level of
development or activity in a country, which might be related to the level of de jure restrictions. We consider
these issues in the following section.
3.2 Cross Country Correlations
Our initial regressions investigate whether there is variation in entrepreneurial activity across
countries and time that is correlated with capital mobility (de jure or de facto). We run the following
specification on our data for 1999 and 2004:
Eict = αKct + βXct + δi + δc + δt + εict (1)
where Eict corresponds to the entrepreneurial activity measure in industry i of country c at time t, Kct
corresponds to the measure of capital account integration, Xct corresponds to country level controls, iδ is a
full set of industry dummies, δc is a full set of country dummies and δt takes the value 1 for 2004 and 0 for
1999, and εic corresponds to the error term. Our analysis is at the two-digit industry level. The industry
dummies control for cross-industry differences in technological level or other determinants of
entrepreneurship.27 Hence, in equation (1), we look at whether, for each industry, firms in a country with
greater capital mobility exhibit more entrepreneurial activity than firms in a country with less capital
mobility. In other words, cross-country comparisons are relative to the mean propensity to “generate
entrepreneurial activity” in an industry relative to the industry and time averages. The estimation procedure 25 Ireland experienced particularly high flows during this period. Results are robust to excluding Ireland from the sample. 26 Bartelsman, Haltiwanger and Scarpetta (2004) provide evidence for the process of creative destruction across 24 countries and two-digit industries. 27 Klepper and Graddy’s (1990) results point to the importance of industry characteristics in firm’s entry and exit patterns. Dunne and Roberts (1991), who describe certain industry characteristics that explain much of inter-industry variation in turnover rates, find the correlation between those industry characteristics and industry turnover pattern to be relatively stable over time.
11
uses White’s correction for heteroskedasticity in the error term. Because the capital mobility variables vary
only at the country level, we present results with standard errors corrected at the country level (clustering).
In terms of our controls, the literature has found the institutional and business environment as well
as industry characteristics to affect the levels of entrepreneurial activity in a country. In the main
specification we use the (logarithm of) GDP per capita to proxy for development. The level of economic
development is likely to affect the attractiveness/success of becoming an entrepreneur. We use the
(logarithm of) GDP to control for scale effects that might affect entrepreneurial activity. We control for the
rate of real GDP growth to capture current economic activity. In addition, we use various controls for
institutional quality. We use data from the International Country Risk Guide (ICRG), a monthly publication
of Political Risk Services.28 We use specifically the variables non-corruption, law and order, and
bureaucratic quality, all of which we expect to be positively related to entrepreneurial activity.29 We use
domestic credit as a percentage of GDP control for financial market development which we expect to have a
positive effect.
In our main regressions, we run specification (1) on the different measures of entrepreneurship:
entry, firm size, and skewness of the firm-size distribution, and on different measures of capital account
integration, namely, the IMF index, capital inflows, FDI inflows, stock of foreign liabilities, and gross
flows. Our main control variables are (log of) GDP, (log of) GDP per capita, GDP growth, domestic credit
to GDP, and indices of bureaucracy, non-corruption, and law and order. We use weights in the regressions
to reflect the different size of each industry/country observation.30 For many industries, the rate of firm entry
is zero or negligible. To account for this large number of zeros and our upper bound at 1, we use a Tobit
estimation model for the firm entry regressions.31 This specification allows us to observe a regression line
that is not heavily weighted by the large number of industries with a wide range of characteristics but which
did not generate any observed new firms in our sample period.
Tables 6a-6c present the main results for our data that suggest a negative and significant relation
between different measures of entrepreneurial activity and restrictions on capital mobility. We performed
additional robustness checks some of which we report on Appendix B.
28 Data for ‘days to start a business’ from World Bank, World Development Indicators is not available for 1999. We used with the 2004 data in a cross section analysis obtaining similar results (available upon request). 29 ICRG presents information on the following variables: investment profile, government stability, internal conflict, external conflict, no-corruption, non-militarized politics, protection from religious tensions, law and order, protection from ethnic tensions, democratic accountability, and bureaucratic quality. We do not use the entire index as we do not have, a priori, a view on how some of these variables might affect entrepreneurial activity, and suspect that some might have opposite effects. 30 We find similar results when unweighted and when weighted by either the number of firms or the total employment in the industry/country. 31 Entry regressions are not clustered. Several clustered entry estimates using Tobit were not significant at standard levels. These results, however, do not contradict our main findings. We believe the loss of robustness in our estimates to be due to computational issues associated with the use of the non-linear estimator Tobit and clustering, another large-sample asymptotic approximation. Together these techniques might be giving us more imprecise estimates. When we run the regression using OLS and clustering, the results are significant.
12
Table 6a presents results for firm entry as the dependent variable. In column (1), the marginal effect
of the IMF index conditional on the dependent variable (rate of firm entry) being uncensored is -1.4.
Consider a movement from the 25th percentile (0.77) to the 75th percentile (0.15) in the distribution of the
index of restrictions. Based on the results shown in column (1), we have, on average, 0.8 percent more entry
in an industry in the country with less restrictive controls. This represents, in industries with average rates of
entry such as textiles and apparel, a 19 percent increase in entry over average entry.32 Columns (2)-(5)
present the main results of controlling for de facto measures of capital account integration. A movement
from the 25th percentile (2.36) to the 75th percentile (14.2) of the Capital Inflows/GDP variable is associated,
based on the results in column (2), with an increase in entry of 0.08, which represents a 21 percent increase
in entry over average entry. In terms of the other control variables, our results are in line with the literature.
The level of development and growth are positively and significantly related to entrepreneurship, and we
find a positive effect of non-corruption and law and order.
In Table 6b, the dependent variable is the log of employment in the industry/country pair. As seen in
Column (1), an inter-quartile reduction in the IMF index (less restrictive controls) is associated with a
decrease in average firm size by 28 percent. Similar increases in the Capital Inflows/GDP variable are
associated with a significant decrease in average firm size of 60 percent. The small FDI coefficient is
expected as FDI is often associated with the entry of large firms.
In Table 6c, the dependent variable is skewness of the firm-size distribution. We believe this
variable to constitute the most complete characterization of firm activity in the economy. Our results are
both economically and statistically significant. Column (1) of the table shows the effect of the IMF index on
the skewness of the firm size distribution in each industry to be negative and significant. To get a sense of
the magnitude of the effect of a reduction in the IMF index on the level of entrepreneurial activity, consider
a movement from the 25th percentile to the 75th percentile in the distribution of the index of restrictions;
based on the results shown in column (1), we see a 4.4 reduction in skewness, which represents 38 percent
of average industry skewness. In terms of the effect of de facto measures of integration on the firm size
distribution, a similar interquantile movement of the Capital Inflows/GDP variable is associated, based on
the results in column (2), with an increase in skewness of 2.31, which represents a 20 percent increase over
the industry average.
3.3 Cross-Industry, Cross Country Interaction Effects
In addition, our data allows us to look at cross-industry, cross-country interaction effects following
the methodology of Rajan and Zingales (1998) and Klapper, Laeven, and Rajan (2005). We run:
icciciic KZ εγδθ +++×=Ε )( (2)
32 Average entry in uncensored industries is 4.5 percent.
13
where icΕ corresponds to the entrepreneurial activity measure in industry i of country c, δi represents
industry dummies, and γc corresponds to country level dummies. The industry indicators correct for
industry-specific effects; country dummies correct for country-specific variables. The focus of analysis is on
the interaction term θ between a country characteristic (Kc) and an industry characteristic, Zi. For country
characteristics, we use the capital mobility measures. For industry characteristics, following these authors,
we use the United States as a proxy for the “natural” entrepreneurial activity in an industry reflecting
technological barriers in that industry like economies of scale. “Of course, there is a degree of heroism in
assuming that entry in the United States does not suffer from artificial barriers,” write Klapper, Laeven, and
Rajan (2005, p.17), but the methodology requires only that rank ordering in the United States correspond to
the rank ordering of natural barriers across industries, and the latter rank ordering correspond to that of other
countries. This methodology, as explained by the authors, enables us to address issues associated with
country effects. We examine the differential effects of country level variables across industries and by
correcting for industry effects we also correct for the fact that average entrepreneurial activity may depend
on the industries’ characteristics.33
Focusing on entry and the skewness of the firm size-distribution, we find the coefficient on the
interaction term θ to be positive and significant for the different proxies of capital integration as seen in
Table 7. Moreover, the magnitude of the relationship is economically significant. For example, a change in
the IMF index equivalent to an increase from the 25th to the 75th percentile in our sample (0.61) reduces the
percentage of new firms in an industry with average levels of entry in the U.S. (textiles, 4.5 percent) by
15%. Similar interquantile changes for the inflows of capital and inflows of foreign investment variables are
associated with increases of 10% and 8% respectively.
3.4 Endogeneity and Sample Intensity: Discussion
Important concerns related to all the previous findings include whether a potential omitted third
factor explains the relation between the different measures of entrepreneurship and international financial
integration and whether reverse causality might be driving our results. The Rajan and Zingales methodology
mitigates some concerns about endogeneity, but we also undertake several additional checks to examine the
robustness of our results, some of which we report in Appendix B.
Table B1 shows the coefficients on the capital mobility measures to be stable across specifications
with different controls. Table B2 shows our results to be robust to controlling for other measures of
regulation and level of domestic financial development as well as other macroeconomic controls. Table B3
uses additional proxies for entrepreneurship and other measures of de facto financial integration. Table B4
33 This is equivalent to de-meaning the variables using their industry and country averages and thus removing some of the sample selection problems. The downside of this methodology is by focusing on relative effects, it does not analyze the overall magnitude of the effect of the characteristics. We have complemented the analysis with cross section regressions. For a detailed description of their methodology, see Rajan and Zingales (1998).
14
shows our results to be robust to using only the manufacturing sector, only developed countries, excluding
the United States from the sample, and adding regional dummies.
In addition there are concerns that our results might be driven by the sample frame if changes in the
sampling intensity of our data in specific countries are correlated with changes foreign capital flows.
Nonetheless while we believe that the WorldBase is the best available data to answer our question, we are
aware of its limitations. In our final sample, the number of observations per country ranges from more than
7 million firms in the United States to fewer than 90 firms in Burkina Faso (see Table 1). This variation
reflects differences in country size, but also differences in the intensity with which Dun & Bradstreet
samples firms in different countries and in the number of firms in the informal sector. This raises concerns
that our measures of entrepreneurship might be affected by cross-country differences in the sample frame.
For example, in countries where coverage is lower or where there are a large number of firms in the
informal sector (which are not captured in our data), more established enterprises—often older and larger
firms—may be overrepresented in the sample. This may bias our results if the country characteristics which
determine the intensity of sampling are correlated with our explanatory variables.
We address this concern in a number of ways. We use summary statistics such as skewness which
are arguably less dependent on the sampling frame. Rather than simply relying on a single measure, we use
different proxies for entrepreneurial activity. We use industry fixed effects in the regression analysis to
ensure that within industry variation is emphasized. We compare our results for 2004 and 1999 and study
how changes in our measures of entrepreneurship between these time periods relate to changes in capital
restrictions and capital mobility. As Bartelesman, Haltinwanger and Scarpetta (2005) note, since much of
the error is country specific, methods that amount to some form of first differencing the data significantly
reduce many of the identified problems in firm level data sets. This gives us more confidence that our
results are not driven by the sample frame, although it is still possible that changes in sampling procedure
are correlated with changes in financial integration over the same period. A comparison of the 2004 and
1999 samples suggested this not to be the case.34 In particular we analyzed the correlation between the
change in the sampling intensity of old firms (defined as percentage change in the number of firms
established before 2000 in the two samples) and the change in the capital mobility measures. The correlation
of these variables was low and in fact negative for most of our measures.35 We also repeat our specifications
for subsamples which include only the rich countries which are the most intensively sampled by Dun &
Bradstreet. Third, we deal with the possibility that our results might be driven by a small number of
observations in country/industry pairs by excluding outliers and weighting country/industry pairs by the
number of observations in the industry. In the robustness section we include a measure of the size of the
informal sector. Fourth, we include a measure of country sampling intensity in our regressions and find that
34 Conversations with Dun & Bradstreet also suggested that this was unlikely to be the case. 35 The correlations between the change in the sampling intensity of old firms in 99-04 (number of firm in the 2004 data set established before 2000 minus the number of firms in the 1999 data set to the total number of firms in the 1999 data set) were -0.12 with the IMF index; 0.12 with Net Capital Flows/GDP; 0.05 with FDI Inflows/GDP; -0.07 with Foreign Liabilities/GDP; 0.07 with Capital Inflows/GDP; 0.02 with GDP Growth; -0.01 with Entry; and -0.07 with Skewness.
15
our results are robust.36 We also use the Rajan and Zingales (1998) methodology and focus on cross-
country, cross-industry interaction effects. By focusing on interactions, we examine the differential effects
of country level variables across industries. Even after all of these tests, our results should be interpreted
with caution. Notwithstanding the remarkable consistency in our results, we are reluctant at this stage to
infer causality. Instead we present these results are strong correlations which motivate the analysis which
follows.
4 The Effect of Foreign Capital on Entrepreneurship through Credit Availability
The Dun & Bradstreet data enable us to go beyond cross country correlations to look at causal
channels through which foreign capital may affect domestic entrepreneurship. In particular we investigate
whether capital mobility affects entrepreneurship through a change in the activity of domestically-owned
firms in contact with foreign firms (an FDI channel) or through the availability of resources (a capital/credit
availability channel).
4.1 Capital/Credit Availability Channel
We first investigate the possibility that capital mobility affects entrepreneurship through the capital
/credit availability channel. There is considerable evidence suggesting that financing constraints are
important determinants of firm dynamics. We investigate whether firm activity in industries which are more
reliant on external finance are positively or negatively affected by our measures of international financial
integration. For each industry we proxy the dependence on external finance with the variable defined by
Rajan and Zingales (1998)—the difference between investment and cash generated from operations.37 In this
specification our interaction term (Zi × Kc) from Equation (2) is (External Financial Dependencei × Capital
Mobilityc). We run this specification across de jure (the IMF index) and three de facto measures of capital
mobility. Table 8 reports our main results.38 We find entrepreneurship in industries more reliant on external
finance to be more sensitive to restrictions on capital mobility and more strongly affected by increased flows
of finance. This result is robust to controlling for financial development proxied by domestic credit to GDP
and stock market capitalization (not shown). Moreover, the magnitude of the relationship is economically
significant. For example, a change in the IMF index equivalent to an increase from the 25th to the 75th
percentile in our sample (0.61) reduces the percentage of new firms in an industry with average levels of
36 We use the ratio of the number of firms in the database to GDP. We attempted to control for employment data at the industry level to get a sense of coverage using data from UNIDO, but these data were not available consistently for our cross-section of countries for 2004 and 1999. 37 The authors identify an industry’s need for external finance (the difference between investment and cash generated from operations) under two assumptions: (a) that U.S. capital markets, especially for the large, listed firms they analyze, are relatively frictionless enabling us to identify an industry’s technological demand for external finance; (b) that such technological demands carry over to other countries. Following their methodology, we constructed similar data for the period 1999-2003 as explained in Appendix A. 38 The lower number of observations in Table 9 relative to Table 6c is due to the lack of external finance measures for some industries.
16
financial dependence (Rubber Products) by 20% over the average proportion of new firms in all industries.
Similar interquantile changes for the inflows of capital and inflows of foreign investment variables are
associated with increases of 26% and 29% respectively.
Our results are also consistent with the findings of Harrison et al. (2004) that incoming FDI has a
significant impact on investment cash flow sensitivities for domestically owned firms and firms with no
foreign assets. The authors argue that their results are in line with the hypothesis that foreign investment is
associated with a greater reduction of credit constraints on firms less likely to have access to international
capital markets. This is plausible because incoming foreign investment provides an additional source of
capital, freeing up scare domestic credit which can then be redirected towards domestic enterprises.
4.2 The Effect of Foreign Capital Through Foreign Direct Investment
We examine the effect of international financial integration on entrepreneurial activity through
foreign firms’ (FDI) influence on the creation of new domestic firms. Our data contain information on the
nationality of each firm’s ownership, which enables us to directly test the FDI channel through the presence
of foreign-owned firms.
We investigate the effects of foreign firms on new domestically-owned firms in the same industry.
Specifically, we run:
Eict = αShare of foreign firmsict + βXct + δi + δc + δt + εict (3)
where Eict refers to the percentage of new domestic firms in sector i in country c in time t. The Share of
Foreign Firmsict in sector i is the number of foreign firms calculated as total firms in industry i in country c
at time t. Xct represents country-level controls.39
In Columns (1) and (4) of Table 9, we find the presence of foreign firms to have a positive effect on
entrepreneurial activity by domestically-owned firms in the same industry. An increase in the share of
foreign firms equivalent to moving from an industry in the 25th percentile of the distribution of foreign
presence to an industry in the 75th percentile is associated with an increase in the percentage of new
domestic firms in the industry by 1.7 points, or a 37 percent increase over an industry with mean levels of
foreign firms. There is a large literature examining horizontal spillovers from FDI. Caves (1974), Blomstrom
and Persson (1983), and Haskel, Pereira, and Slaughter (2002), for instance, find a positive correlation
between foreign presence and sectoral productivity, and Haddad and Harrison (1993) and Aitken and
Harrison (1999) find little evidence of horizontal spillovers to domestic firms. The positive effects of FDI
are often attributed to the replacement effect of productive multinationals forcing domestic firms to exit.
Both the positive and negative effects of FDI are consistent with industrial restructuring and, ultimately, firm
turnover. We find evidence that the existence of multinational firms increases the rate of domestic firm
39 Note that in this case, both our variable of interest and the dependent variable are aggregated at the industry level. Regressions are weighted by number of firms.
17
creation. This might reflect changes in the industry resulting from large new entrants increasing their market
share at the expense of some firms and creating new opportunities for others.
We also test whether our measures of domestic activity are correlated with the presence of
multinational firms in upstream and downstream sectors. Given the difficulty of finding input and output
matrices for all the countries in our data, we use U.S. input and output (IO) matrices from the U.S. Bureau of
Economic Analysis following Acemoglu, Johnson, and Mitton (2005). As the authors explain, IO tables
from the U.S. should be informative about input flows across industries in our different sample of countries
as long as they are determined by technology. For example, in all countries, car makers use tires, steel and
plastic from plants specialized in the production of these intermediate inputs. Hence, for industry i in
country c we calculate the presence of foreign firms in all industries j in country c at time t which are
downstream of industry i i, i.e., foreign firms which may be suppliers to new domestic firms, as:
Down Stream Presenceict = ∑j (Zji_US × Wjct) (4)
where Wjct is the total number of foreign firms in industry j in country c as a percentage of the total number
of firms in industry j in country c. Zji is an input-output coefficient—we use the ratio of the inputs in
industry j sourced from industry i in the United States to the total output of industry i in the United States
according to the BEA 4-digit SIC direct input output tables. Thus, the presence of foreign firms downstream
from industry i is weighted by the volume of goods they purchase from industry j. We estimate the
following relation:
Eict = αDownstream Presenceict + βXct + δi + δc + δt + εict (5)
We estimated as well a similar regression for upstream presence.
In Columns (2)-(3) and (5)-(6) of Table 9, we investigate the effect of forward and backward linkages on the
creation of new domestic firms (domestic entry) and skewness of the firm-size distribution of domestic
firms.40 Columns (2) and (3) show positive and significant the effect of foreign presence on upstream and
downstream sectors. In this case, the interquartile change in foreign ownership in upstream industries is
associated with a 12% increase in entry and downstream is not significant. Columns (4) and (6) suggest the
presence of foreign firms to have a significant and positive effect on the skewness of domestic downstream
activities while the effect on upstream activities was not significant at standard levels. Overall, these results
are broadly consistent with the evidence of vertical spillovers from FDI.41 Overall, although our data do not
40 Note that for the industries upstream and downstream the variable is the number of foreign firms in the up/down industry weighted by the IO coefficient between the industries (which are in the range of 0.001-0.005). Hence, the coefficients between “same” (which is the number of domestic firms in the same sector) and “up” and “down” sectors are not directly comparable. 41 Case study evidence from Hobday (1995) finds that foreign investments in East Asia encouraged hundreds of domestic firms to supply components or assembly services. Gorg and Strobl (2002) find that foreign presence encourages entry by domestic-owned firms in the high-tech sector in Ireland. Ayyagari and Kozová (2006) find that larger presence of FDI to be associated with higher entry in both horizontal and vertical industries in the Czech Republic. Javorcik (2004) finds that FDI fosters spillovers through backward linkages in Lithuania although her work does not analyze firm entry patterns.
18
permit to correct for some of the concerns associated with cross-section analysis, our results are consistent
with our previous findings.
We also find evidence from firm level spatial analysis that foreign owned firms appear to create
opportunities for foreign owned firms rather than crowd them out. Appendix C presents firm-level spatial
analysis (for western European countries due to data limitations) to show that the geographic distribution of
new firms is related to the distribution of foreign direct investments and that this pattern is significantly
different from what we might expect of a random distribution. This effect is particularly strong between
industry pairs where the foreign firms are ‘upstream’ of the new entrepreneurs suggesting that foreign
investment may create opportunities for potential suppliers.
5 Conclusions
Using a new data set of 24 million firms in nearly 100 countries, we found a positive relation
between measures of capital account integration and entrepreneurial activity in a country. Concerns related
to the data set and estimation procedures notwithstanding, there is noteworthy consistency across our
different specifications and robustness tests. We find evidence that entrepreneurial activity in industries
which are more reliant on external finance is disproportionately affected by international financial
integration, suggesting that foreign capital may improve access to capital either directly or through
improved domestic financial intermediation. We also find evidence that FDI may create opportunities for
new firms as potential suppliers to the foreign firms.
Capital market liberalization is unquestionably a controversial policy. Our results do not comment
directly on the welfare issues associated with liberalization policies and are indeed consistent with many of
the findings on capital account liberalization and growth. Our conclusion is strongest for direct investment
and most robust in rich countries. At a minimum, the use of micro data should enhance our general
understanding of the process by which the effects of liberalization are transmitted to the real economy.
Data Appendix A. Data Description
a. The Dun and Bradstreet Data Set: Final Sample
We use data for 2004 and 1999, excluding information lacking primary industry and year started.
Our original data set included 118 countries. We excluded territories with fewer than 80 observations and
those for which the World Bank provides no data (most were in Africa and had fewer than 20 firms). The
final dataset covers all economic sectors (SIC) with the exception of Public Administration (Division J,
group 9) and sector 43 (United States Postal Service). We also dropped all establishments for which year
started preceded 1900. For 2004, the data includes 24,606,036 establishments in 98 countries. When we
estimated mean, median, and skewness, we dropped 6 observations that were clearly outliers: a firm with
sales of 648.7 trillions in Denmark, a firm with sales of 219.3 trillions in Spain, a firm with sales of 219.3
19
billions in Spain, a firm with sales of 32.7 trillions in Germany, a firm with sales of 5,6 trillions in
Lithuania, a firm with sales of 4.9 trillions in United Arab Emirates, a firm with sales of 352 billions in
Nigeria, a firm with sales of 291 billions in Chad, a firm with sales of 291 billions in Angola, a firm with
sales of 121 billions in Congo, and a firm with sales of 99 billions in Haiti. For 1999 the data has close to 6
million observations. We retained data with certain information (e.g., employment) but missing other
information (e.g., sales), which was the case mostly in less developed countries (Africa, in particular), our
objective being to maximize the number of observations for these countries. The creation rate shows the
number of establishments reporting starting year in 2003-2004 over all establishments. We define foreign
firms as having an uppermost parent of a corporate family located in a country different from that in which
the firm operates. In terms of sample biases, we discussed with Dun & Bradstreet the possibility of over-
sampling in countries with lower levels of controls or higher capital mobility (such as foreign direct
investment). The firm did not seem to believe this to be a bias in its sampling strategy. In the case of Czech
Republic, a country with high sampling intensity, Dun & Bradstreet derives the bulk of its information from
official registries.
b. Comparing Dun & Bradstreet Data and U.S. Census Data
To give some sense of the coverage of the Dun & Bradstreet sample used in this study, we compare
our data with that collected by the U.S. Census Bureau, Statistics of U.S. Businesses. The U.S. 2001-2002
business census recorded 24,846,832 establishments.42 Our data include 6,185,542 establishments (from
which we exclude establishments in the total sample without the year started). About three quarters of all
U.S. establishments have no payroll. Most are self-employed persons operating unincorporated businesses
that might or might not be the owner's principal source of income. The U.S. census records 7,200,770
‘employer establishments’ with total sales of $22 trillion. Our data include 4,293,886 establishments with
more than one employee with total sales of $17 trillion. The U.S. census records 3.7 million small employer
establishments (fewer than 10 employees). Our data include 3.2 million U.S. firms with more than one and
fewer than 10 employees. In our data, 6.1 percent of establishments are new.43 The U.S. Census reported
12.4 percent of establishments to be new in 2001-2002, for firms with 1-4 employees this was 15.9 percent,
for firms with more than 500 employees 11 percent.44
c. Variable Description and Sources
Dependent Variables
Firm Level Data: From Worldbase - Dun & Bradstreet. In the analysis, we use 2 digit SIC-1987.
42 The unit of record in the Dun & Bradstreet data is the “establishment” (a single physical location where business is conducted or services or industrial operations are performed) as opposed to a “firm” (one or more domestic establishments under common ownership or control). The U.S. census collects information on establishments as well as firms. 43 We define as new an establishment having a year started date less than two years previous. 44Establishment and Employment Changes from Births, Deaths, Expansions, and Contractions, http://www.census.gov/csd/susb/usst01_02.xls.
20
Skewness: Skewness of the firm employment distribution for each country/industry pair.
Size: (Log) of the average number of employees for each country/industry pair.
Entry: Number new firms (less than two years) divided by the total number of firms in the country/industry
pair. We also calculate domestic new firms (the ration of domestically-owned new firms to total domestic
firms).
Age: Average age of the firms in each country/industry pair.
Vintage: Weighted average of the age of the firms in each industry/country pair, the weights being the total
number of employees.
Independent Variables
IMF’s Capital Account Liberalization Index: From the IMF's Annual Report on Exchange Arrangements
and Exchange Restriction (AREAER). The index considers controls to: capital market securities; money
market instruments; collective investment securities; derivatives and other instruments; commercial credits;
financial credits; guarantees, securities and financial backup facilities; direct investment; real estate
transactions; personal capital transactions. For each indicator, a corresponding dummy variable takes the
value of one if the restrictions is present in the country. The index is the average of the dummies.
Capital Inflows/GDP: From the IMF, International Financial Statistics. Capital Inflows are the sum of FDI,
equity portfolio, debt and derivative flows. FDI: direct investment in reporting economy (line 78bed).
Portfolio equity investment: equity security liabilities (line 78bmd). Derivative flows: financial derivative
liabilities (line 78bxd). Debt flows: debt security liabilities (line 78bnd) and other investment liabilities (line
78bid). Data is calculated as a percentage of GDP in U.S. dollars (taken from the World Bank, World
Development Indicators).
Inflows of Foreign Direct Investment/GDP: From the World Bank, World Development Indicators. FDI to
GDP are inet inflows of investment to acquire a lasting management interest (10 percent or more of voting
stock) in an enterprise operating in an economy other than that of the investor. It is the sum of equity capital,
reinvestment of earnings, other long-term capital, and short-term capital.
Gross Capital Flows/GDP: From the World Bank, World Development Indicators. Gross private capital
flows to GDP are the sum of the absolute values of direct, portfolio, and other investment inflows and
outflows recorded in the balance of payments financial account, excluding changes in the assets and
liabilities of monetary authorities and general government.
Stock of Foreign Liabilities: From Lane and Milesi Ferretti (2006). The authors estimate stocks of portfolio
equity and FDI based on the IMF, IFS flow data. In order to estimate FDI stocks, the authors cumulate flows
and adjust for the effects of exchange rate changes. For portfolio equity stocks, they adjust for changes in
the end of year U.S. dollar value of the domestic stock market. Data is reported as percentage of GDP.
Equity Flows/GDP: From the IMF, International Financial Statistics. Sum of FDI inflows and portfolio
equity investment inflows as a percentage of GDP.
21
Net Capital Flows/GDP: From the IMF, International Financial Statistics. Net capital flows are the sum of
changes in assets and liabilities on FDI, equity portfolio and debt. FDI: direct investment abroad (line
78bdd) and direct investment in reporting economy (line 78bed). Portfolio equity investment: equity
security assets (line 78bkd) and equity security liabilities (line 78bmd). Derivative flows: financial
derivative assets (line 78 bwd) and financial derivative liabilities (line 78bxd). Debt flows: debt security
assets (IFS line 78bld) and debt security liabilities (line 78bnd) and other investment assets (line 78bhd) and
other investment liabilities (line 78bid). Data reported as a percentage of GDP. Coverage for this variable is
more limited and is from the IMF, IFS statistics.
Macroeconomic Data: From the World Bank, World Development Indicators: (Log) GDP, (Log) GDP per
capita, growth real GDP, volatility of growth (standard deviation of gdp growth for 2000-2004 divided by
the period’s mean), inflation (percent growth in the CPI), M3/GDP, domestic credit to GDP, stock market
capitalization to GDP, trade (exports plus imports over GDP). From the Economist Intelligence Unit:
growth forecasts. Size of the informal sector as percentage of GDP in year 2000, from Schneider (2002).
Institutional Quality: From the International Country Risk Guide (ICRG), a monthly publication of Political
Risk Services. Non-corruption (assessment of corruption within the political system; average yearly rating
from 0 to 6, where a higher score means lower risk). Law and order (the law subcomponent is an assessment
of the strength and impartiality of the legal system; the order sub-component is an assessment of popular
observance of the law; average yearly rating from 0 to 6, where a higher score means lower risk).
Bureaucratic quality (institutional strength and quality of the bureaucracy; average yearly rating from 0 to 4,
where a higher score means lower risk.).
Regulation: From the World Bank, World Development Indicators: number of days required to start a
business; business disclosure index (0=less disclosure to 7=more disclosure); legal rights of borrowers and
lenders index (0=less credit access to 10=more access).
Dependence on External Finance: Constructed by authors for 1999-2003 following Rajan and Zingales
(1998). An industry’s external financial dependence is obtained by calculating the external financing of U.S.
companies using data from Compustat calculated as: (Capex-Cashflow)/Capex, where Capex is defined as
capital expenditures and Cashflow is defined as cash flow from operations. Industries with negative external
finance measures have cash flows that are higher than their capital expenditures.
d. Industry Codes: Standard Industrial Classification (SIC) - 1987 Version
A. Agriculture, Forestry, and Fishing: 01: Agricultural Production Crops; 02: Agriculture production
livestock and animal specialties; 07: Agricultural Services; 08: Forestry; 09: Fishing, hunting, and trapping.
B. Mining: 10: Metal Mining; 12: Coal Mining; 13: Oil and Gas Extraction; 14: Mining and Quarrying Of
Nonmetallic Minerals, Except Fuels. C. Construction: 15: Building Construction General Contractors and
Operative Builders; 16: Heavy Construction Other Than Building Construction Contractors; 17:
Construction Special Trade Contractors. D. Manufacturing: 20: Food and Kindred Products; 21: Tobacco
22
Products; 22: Textile Mill Products; 23: Apparel and Other Finished Products Made From Fabrics and
Similar Materials; 24: Lumber and Wood Products, Except Furniture; 25: Furniture and Fixtures; 26: Paper
and Allied Products; 27: Printing, Publishing, and Allied Industries; 28: Chemicals and Allied Products; 29:
Petroleum Refining and Related Industries; 30: Rubber and Miscellaneous Plastics Products; 31: Leather
and Leather Products ; 32: Stone, Clay, Glass, And Concrete Products; 33: Primary Metal Industries; 34:
Fabricated Metal Products, Except Machinery And Transportation Equipment; 35: Industrial And
Commercial Machinery And Computer Equipment; 36: Electronic and Other Electrical Equipment And
Components, Except Computer Equipment; 37: Transportation Equipment; 38: Measuring, Analyzing, and
Controlling Instruments; Photographic, Medical And Optical Goods; Watches and Clocks; 39:
Miscellaneous Manufacturing Industries. E. Transportation, Communications, Electric, Gas, And Sanitary
Services: 40: Railroad Transportation; 41: Local and Suburban Transit and Interurban Highway Passenger
Transportation; 42: Motor Freight Transportation and Warehousing; 44: Water Transportation; 45:
Transportation by Air; 46: Pipelines, Except Natural Gas; 47: Transportation Services; 48:
Communications; 49: Electric, Gas, and Sanitary Services. F. Wholesale Trade: 50: Wholesale Trade-
durable Goods; 51: Wholesale Trade-non-durable Goods. G. Retail Trade: 52: Building Materials,
Hardware, Garden Supply, and Mobile Home Dealers; 53: General Merchandise Stores; 54: Food Stores;
55: Automotive Dealers And Gasoline Service Stations; 56: Apparel And Accessory Stores; 57: Home
Furniture, Furnishings, And Equipment Stores; 58: Eating And Drinking Places; 59: Miscellaneous Retail.
H. Finance, Insurance, and Real Estate: 60: Depository Institutions; 61: Non-depository Credit Institutions;
62: Security and Commodity Brokers, Dealers, Exchanges, and Services; 63: Insurance Carriers; 64:
Insurance Agents, Brokers, and Service; 65: Real Estate; 67: Holding and Other Investment Offices. I.
Services: 70: Hotels, Rooming Houses, Camps, And Other Lodging Places; 72: Personal Services; 73:
Business Services; 75: Automotive Repair, Services, and Parking; 76: Miscellaneous Repair Services; 78:
Motion Pictures; 79: Amusement And Recreation Services; 80: Health Services; 81: Legal Services; 82:
Educational Services; 83: Social Services; 84: Museums, Art Galleries, And Botanical And Zoological
Gardens; 86: Membership Organizations; 87: Engineering, Accounting, Research, Management, and
Related Services; 88: Private Households; 89: Miscellaneous Services.
Appendix B. Robustness Checks
We performed additional robustness checks on the regressions results in (1). Table B1 presents the
results of equation (1) using skewness as proxy for entrepreneurship and the IMF index in columns (1) to (3)
and capital inflows in columns (4) to (6), as measures of international financial integration. The table shows
the coefficient of the capital mobility measures to be relatively stable across specifications which consider
different main controls. We obtain similar results using the other measure of entrepreneurship and proxies
for international financial integration.
23
As Table B2 shows, our main results are robust to controlling for other measures of regulation,
financial development and macro economic conditions. In columns (1)-(3), we control for indices of
borrowers’ and lenders’ rights and business disclosure from the World Bank as additional proxies for
regulation, and stock market capitalization as proxies for financial development. Our results are also robust
to controlling for M3/GDP as another proxy for financial development (not shown). Column (4) controls for
inflation as a measure of macroeconomic instability while column (5) uses GDP volatility. In columns (6)
we use the EIU growth forecasts as an imperfect measure of exogenous growth opportunities.45 As shown in
column (7), our results are robust to the inclusion of the value of the trade openness defined as the sum of
exports and imports as a share of output. Column (8) controls for the share of the informal sector in the
economy obtaining similar results (these data, however, were available for a wide range of countries for
2000 only). Controlling for the (the log) of population (as an alternative proxy for scale) and for education
levels (share of primary school) yielded similar results (not shown).
Columns (1)-(2) in Table B3 show our results to be robust to using as additional proxies for
entrepreneurship: firm age and firm vintage. An additional concern is that our results may be driven by
considering establishments as the unit record. Column (3), however, shows our results robust to using only
wholly owned firms when calculating our entrepreneurship measures (the table shows skewness results).46
Our results are also robust to alternative measures of de facto financial integration such as net flows to GDP
in column (4) and equity flows in column (5). Similar results stocks of foreign equity (non-shown).
Another concern is that our results may be driven by different sampling intensities in different
countries. It might be the case, for example, that countries with higher sampling intensity have
disproportionately more small firms. Column (1) in Table B4, which controls for the number of firms
sampled in each country, suggests this not to be the case. As mentioned, our results are also weighted. In
addition, table B4 shows our results to be robust to using only the manufacturing sector in column (2), only
rich countries in column (3), excluding the United States from the sample in column (4), and adding
regional dummies in column (5).
Appendix C. Firm Level Spatial Analysis
We investigate the relationship between foreign firms and entrepreneurs at the firm level using
spatial analysis. We develop a distance-based test to determine whether foreign firms crowd out or create
opportunities for new firms. Our methodology is based on the fact that domestic and foreign firms have
45 As another imperfect attempt to account for possible endogeneity biases, we used institution-based instruments for financial integration from La Porta et al. (1998) which have been used in the literature for international financial liberalization and domestic financial development, see Imbs (2004), Kalemli-Ozcan, et al. (2003). Criticism of these instruments notwithstanding, overall the IV regression did not contradict the conclusions drawn from the OLS regressions. 46 That is, we exclude from the sample establishments that report to domestic parents. Our results were similar when considering domestic parents and subsidiaries as a single entity and using other the measures of entrepreneurship.
24
different characteristics which may differentially affect other firms in their region and second that the effect
of those characteristics on other firms attenuates with distance.
A considerable literature has established that domestic and foreign firms are different and that they
may exert different externalities on the firms around them.47 Multinational firms may embody more
technology than their domestic counterparts and are more likely introduce new products or processes which
benefit the accelerated diffusion of new technology. If the benefits from foreign ownership are not entirely
internalized then domestic firms stand to gain from the presence of foreign firms. Alternatively the entry of a
multinational firm might simply crowd out national firms competing away their market shares and forcing
them up their cost curves, or by bidding up the prices of inputs. A second literature in regional economics
has recognized that strength of the interaction between firms is not neutral with respect to distance.48
Combining the insight that foreign and domestic firms exert different externalities with the possibility that
these externalities attenuate with distance gives rise to a spatial methodology with which to examine the
effect of foreign firms on domestic entrepreneurship.
a. Construction of Variables and Significance Tests
For each industry s we classify our firms into three types: “foreign” firms if they report a foreign
owner in 2004, “new” if they are less than two years old and do not have a foreign parent, and “domestic” if
they satisfy neither of these criteria. We restrict our attention in this section to data for manufacturing
industries in UK, Spain, France, and Germany due to limitations on our access to geocoded postcode
information for a large number of countries at reasonable cost Western European countries. From the Dun
and Bradstreet data, we have for each establishment a post code address which is the physical address of the
business. We match the postcode information for each establishment49 with latitude/longitude co-ordinates50
enabling us to locate each establishment at the centre of each post code and also to describe the distance
between establishments as the great-circle distance between postcodes.51 Let the number of foreign firms in
the industry be Nf. For new firm, i, in each industry, s, we calculate the bilateral distance dijs to every foreign
firm, j. We calculate an average distance, dis, for each new firm excluding distances over 100km.52 In our
furniture example the average distance between new and foreign firms is 25.6km.
A key requirement of spatial analysis is that we be able to say something about its statistical
significance. We do this by testing how the average distance between new firms and foreign firms differs
47 For a survey see Barba-Navarett and Venables (2004). 48 A number of studies have considered the effect of the geographic distribution of incumbents on the establishment and performance of new firms. Henderson (2003) finds that new firms are more productive when located near concentrations of firms in the same industry, and similarly Rosenthal and Strange (2003) find evidence that firm entry is more likely near concentrations of existing employment in the same industry, see also Ciccone and Hall (1996). 49 Dun and Bradstreet reports the physical location of the establishment rather than a registered address. 50 In the UK this comes from the All Fields Postcode Directory, for other countries it was supplied by MapMechanics. The maximum error is the distance from the centre of the postcode to its extremity, which in the UK is less than 100m for 99% of establishments, and a maximum of a few kilometers for other countries. 51 The formula for the great-circle distances between the two points, i.e. the shortest distance over the earth’s surface, using the ‘Haversine’ formula is distance(1,2) = acos(sin(lat1). sin(lat2) + cos(lat1). cos(lat2). cos(long2−long1)). 52 For computational ease and since the effect of firms is expected to attenuate over distance.

25
from some counterfactual which we construct by considering the properties of a random entry pattern. In a
random counterfactual our entrants would locate no differently whether the firms were foreign or
domestically owned. To mimic this we create a control group of firms which includes all the foreign firms
and a group of matched domestic firms in the industry. We randomly draw, without replacement, Nf firms
from this control group. This is equivalent to randomly re-labelling all the firms as either domestic or
foreign while holding the share of both groups constant.
Determining matching criteria for our control group requires us to consider which qualities of
foreign firms we are analysing. As discussed above, foreign firms are different to domestic firms along
various dimensions including size, productivity, innovation, wage rates, linkages with domestic suppliers,
etc. Our method of constructing a counterfactual from a pool of foreign and domestic firms essentially
involves differencing out the effect of one set of characteristics on which the matching is based, and
identifying across the remainder. Our objective is to understand the aggregate effect of foreign firms so we
use a parsimonious matching criteria which does not control for any firm characteristics except those
required to ensure that our counterfactual pool has the same industry mix, size and age profile. Accordingly
we match our firms only on three characteristics: SIC code (to control for differences across industries), age
(to ensure that our results are not affected by endogenous time varying location characteristics), and size (to
control for scale). We use exact matching techniques to match each domestic firm with one foreign firm. In
order to qualify as a match the domestic firm must be in the same industry as the foreign firm, its year of
establishment (the first date it operated under its current ownership in that location) must be within +/- two
years and its number of employees must be no more than +/- 10 percent of its counterpart. Using these
criteria we find an average of 2.7 domestic firms per foreign firm. This gives us a total pool across all our
industries of 41,921 foreign firms and 155,108 domestic firms. Table C1 indicates that the differences
between our foreign firms and control group are small (by construction).
Using these firms we run 1000 simulations, each time drawing Nf firms in each industry from the
control group and calculating the average distance between new firms and these draws. Our confidence
interval for the mean distance between new and foreign firms is constructed such that only 5% of our
counterfactual mean distances between new firms and randomly selected control firms are above or below
the upper and lower bound.
b. Spatial Results
Our question is whether the location patterns of new firms are essentially a random allocation with
respect to the ownership of existing firms. We dropped 268 industries (out of 956 industries—239
industries in four countries) because they had less than 10 new firms or less than 10 foreign firms in any
country. We find that the average distance from a new firm to a foreign firm in the same industry is 23.3
km. Several conclusions emerge with respect to four-digit industries: (i) our average distance between new
firms and foreign firms in the same industry is 23.3 Kms, (ii) this is greater than the average distance from
our Monte Carlo simulations drawing at random from a pool of foreign and domestic firms (25.2). (iii) The
26
5th percentile of the mean of these counterfactual draws is 24 Kms (the 8th percentile corresponds to 23.3).
Thus for firms in the same industry we conclude that while the average distance between new and foreign
firms is larger than the distance from counterfactuals, we cannot say that it differs from what might be
produced from a random allocation at the 5% level of significance. However our results are stronger when
we consider relationships between industries. Following our methodology in the previous section, for each
industry we use input-output matrices to identify the 5 paired industries for which the input output
coefficient is greatest. For example, SIC 2262 Finishers of Broadwoven Fabrics of Manmade Fiber and Silk
is a key input of 2392 House furnishing, Except Curtains and Draperies. When considering these vertically
industries we find that our mean distance between new firms (26.4) corresponds to the 2nd percentile in the
counterfactual distribution. This is consistent with recent work has considered the positive effects of FDI on
domestic enterprise through backward and forward linkages, showing that foreign firms may foster the
development of domestic firms in the host country (see Javorcik, 2004). We find that the creation of new
firms is particularly responsive to the geographic distribution of foreign firms in downstream industries,
suggesting that foreign firms create opportunities for new firms in their supply chain and consistent with our
previous findings.
References
Acemoglu, Daron, Simon Johnson, and Todd Mitton, 2005. “Determinants of Vertical Integration: Finance,
Contracts and Regulation,” NBER Working Paper 11424.
Acemoglu, Daron and Fabrizio Zilibotti, 1997. “Was Prometheus Unbound by Chance? Risk,
Diversification and Growth,” Journal of Political Economy 105, 709-751.
Aghion, Philippe and Peter Howitt, 1998. Endogenous Growth Theory. MIT Press: Cambridge.
Aitken, Brian J. and Ann E. Harrison, 1999. “Do Domestic Firms Benefit from Direct Foreign Investment?
Evidence from Venezuela,” American Economic Review 89, 605-618.
Alfaro, Laura, Sebnem Kalemli-Ozcan, and Vadym Volosovych, 2006. “Capital Flows in a Globalized
World: The Role of Policies and Institutions,” in Sebastian Edwards, editor, Capital Controls and
Capital Flows in Emerging Economies: Policies, Practices and Consequences. Forthcoming.
Ayyagari, Meghana and Renata Kosová, 2006. “Does FDI facilitate Domestic Entrepreneurship? Evidence
from the Czech Republic” mimeo.
Barba-Navaretti, Giorgio B. And Anthony J.Venables, A. J., 2004. Multinational Firms in the World
Economy . Princeton University Press.
Bartelsman, Eric J., John Haltiwanger, and Stefano Scarpetta, 2004. “Microeconomic Evidence of Creative
Destruction in Industrial and Developing Countries,” mimeo.
Bartlesman, Eric., John Haltiwanger and Stefano Scarpetta, 2005. “Measuring and Analyzing Cross-
Country Differences in Firm Dynamics,” mimeo.
Beck, Thorsten, Asli Demirguc-Kunt, Luc Laeven, and Ross Levine, 2006. “Finance, Firm Size and
Growth,” mimeo.
27
Bertrand, Marienne and Francis Kramarz, 2002. “Does Entry Regulation Hinder Job Creation? Evidence
from the French Retail Industry,” Quarterly Journal of Economics 117, 1369-1413.
Bhagwati, Jagdish, 1998. “The Capital Myth,” Foreign Affairs 77, 3 (May-June): 7-12.
Black, Sandra E. and Philip E. Strahan, 2002. “Entrepreneurship and Bank Credit Availability,” Journal of
Finance 57, 2807-2833.
Blomstrom, Magnus and Hakan Persson, 1983. “Foreign Investment and Spillover Efficiency in an
Underdeveloped Economy: Evidence from the Mexican Manufacturing Industry,” World Development
11, 493-501.
Caballero, Ricardo, 2006. “Creative Destruction,” in The New Palgrave (forthcoming).
Cabral, Luis and Jose Mata, 2003. “On the Evolution of the Firm Size Distribution: Facts and Theory,”
American Economic Review 93, 1075-1090.
Caves, Richard E, 1974. “Multinational Firms, Competition and Productivity in Host-Country Markets,”
Economica 41, 176-193.
Chari, Anusha and Peter B. Henry, 2004. “Risk Sharing and Asset Prices: Evidence from a Natural
Experiment,” Journal of Finance 59, 1295-1324.
Ciccone, Antionio and Robert E. Hall, 1996. “Productivity and the Density of Economic Activity,”
American Economic Review 86, 54-70.
Davis, Steven J., R. Jason Faberman, and John C. Haltiwanger, 2006. “The Flow Approach to Labor
Markets: New Data Sources and Micro-Macro Links,” NBER Working Paper 12167.
Detragiache, Enrica., Thierry Tressel, and Poonam Gupta, 2006. “Foreign Banks in Poor Countries: Theory
and Evidence,” mimeo.
Desai, Mihir, Paul Gompers, and Josh Lerner, 2003. “Institutions, Capital Constraints and Entrepreneurial
Firm Dynamics: Evidence from Europe,” NBER Working Paper 10165.
Di Patti, Emilia B. and Giovanni Dell’Arricia, “Bank Competition and Firm Creation,” mimeo.
Dunne, Timothy and Mark J. Roberts, 1991. “Variation in Producer Turnover across U.S. Manufacturing
Industries,” in P. A. Geroskiand and J. Shwalbach, editors, Entry and Constestability: An International
Comparison, Blackwell, 197-203.
Eichengreen, Barry, 2001. “Capital Account Liberalization: What Do Cross-Country Studies Tell Us?” The
World Bank Economic Review 15, 341-365.
Evans, David S. and Boyan Jovanovic, 1989. “An Estimated Model of Entrepreneurial Choice Under
Liquidity Constraints,” Journal of Political Economy 97, 808-827.
Evans, David S. and Linda S. Leighton, 1989. “Some Empirical Aspects of Entrepreneurship,” American
Economic Review 79, 519-535.
Fisman, Raymond and Virginia Sarria-Allende, 2005. “Regulation of Entry and the Distortion of Industrial
Organization,” mimeo.
Forbes, K., (2004) “Capital Controls: Mud in the Wheels of Market Discipline,” NBER Working Paper
10284.
28
Giannetti, Mariassunta and Steven Ongena, 2005. “Financial Integration and Entrepreneurial Activity:
Evidence From Foreign Bank Entry in Emerging Markets,” mimeo.
Gorg, Horg and Eric Strobl, 2002. “Multinational Companies and Indigenous Development: An Empirical
Analysis,” European Economic Review 46, 1305-1322.
Grossman, Gene, 1984. “International Trade, Foreign Investment, and the Formation of the Entrepreneurial
Class,” American Economic Review 74, 605-614.
Guiso, Luigi, Paola Sapienza, and Luigi Zingales, 2004. “Does Local Financial Development Matter?”
Quarterly Journal of Economics 119, 929-969.
Haddad, Mona and Ann Harrison, 1993. “Are There Positive Spillovers from Direct Foreign Investment?
Evidence from Panel Data for Morocco,” Journal of Development Economics 42, 51-74.
Harrison, Ann, Inessa Love, and Margaret S. McMillian, 2004. “Global Capital Flows and Financing
Constraints,” Journal of Development Economics 75, 269-301.
Harrison, Ann and Margaret S. McMillian, 2003. “Does Foreign Direct Investment Affect Domestic Firms’
Credit Constraints,” Journal of International Economics 61, 73-100.
Haskel, Jonathan E., Sonia C. Pereira, and Matthew J. Slaughter, 2002. “Does Inward Foreign Direct
Investment Boost the Productivity of Domestic Firms?” NBER Working Paper 8724.
Hausman, Ricardo and Dani Rodrik, 2003. “Economic Development as Self-Discovery,” Journal of
Development Economics 72, 603-633.
Henderson, J. Vernon, 2003. “Marshall's Scale Economies,” Journal of Urban Economics 53, 1-28.
Henry, P. B., 2006. “Capital Account Liberalization: Theory, Evidence, and Speculation,” NBER Working
Paper, 12698.
Hirschman, Albert, 1958. The Strategy of Economic Development, New Haven: Yale University Press.
Hobday, Michael, 1995. Innovation in East Asia: The Challenge to Japan. U.K.: Edward Elgar Publishing
Imbs, Jean, 2004. “Trade, Finance, Specialization and Synchronization.” Review of Economics and Statistics
86, 723-734.
International Monetary Fund. Annual Report on Exchange Arrangements and Exchange Restrictions,
various issues. Washington, DC: International Monetary Fund.
Javorcik, Beata S., 2004. “Does Foreign Direct Investment Increase the Productivity of Domestic Firms? In
Search of Spillovers Through Backward Linkages,” American Economic Review 94, 605-627.
Johnson, Simon, John McMillan, and Christopher Woodruff, 2002. “Property Rights and Finance,”
American Economic Review 92, 1335-1356.
Kalemli-Ozcan, Sebnem, Bent Sorensen, and Oved Yosh, 2003. “Risk Sharing and Industrial Specialization:
Regional and International Evidence,” American Economic Review 93, 903-918.
Klapper, Leora, Luc Laeven, and Raghuram Rajan, 2005. “Entry Regulation as a Barrier to
Entrepreneurship,” Journal of Financial Economics, forthcoming.
Klepper, Steven and Elizabeth Graddy, 1990. “The Evolution of New Industries and the Determinants of
Market Structure,” Rand Journal of Economics 21, 27-44.

29
Knight, Frank, 1921. Risk, Uncertainty and Profit. Boston: Houghton Mifflin.
Kose, A. M., E. Prasad, K. Rogoff, S.-J. Wei, and M. Ayhan Kose, 2006. “Financial Globalization: A
Reappraisal,” NBER working paper 128484.
Kumar, Krishna, Raghu Rajan, and Luigi Zingales, 1999. “What Determines Firm Size?” C.E.P.R.
Discussion Paper 2211.
La Porta, Rafael, Florencio Lopez-de-Silanes, Andrei Shleifer, and Robert W. Vishny, 1998. “Law and
Finance,” Journal of Political Economy 106, 1113-1155.
Lane, Philip R. and Gian Maria Milesi-Ferretti, 2006. “The External Wealth of Nations Mark II: Revised
and Extended Estimates of Foreign Assets and Liabilities, 1970-2004,” IMF Working Paper 06/69.
Markusen, James and Anthony J. Venables, 1999. “Foreign Direct Investment as a Catalyst for Industrial
Development,” European Economic Review 43, 335-338.
Obstfeld, Maurice, 1994. “Risk-Taking, Global Diversification and Growth,” American Economic Review
84, 1310-1329.
The Political Risk Services Group, 2005. International Country Risk Guide, The PRS Group, New York.
Prasad Eswar, Kenneth Rogoff, Shang-Jin Wei, and M. Ayhan Kose, 2003. “The Effects of Financial
Globalization on Developing Countries: Some Empirical Evidence,” International Monetary Fund
Occasional Paper 220.
Rajan, Raghuram and Luigi Zingales, 1998.“Financial Dependence and Growth,” American Economic
Review 88, 559-586.
Rodriguez-Clare, Andres, 1996. “Multinationals, Linkages and Economic Development,” American
Economic Review 86, 852-873.
Rodrik, Dani, 1998. “Who Needs Capital Account Convertibility?” Princeton Essays in International
Finance 207: 55-65.
Rosenthal, Stuart S. and William. C. Strange, 2003. “Geography, Industrial Organization, and
Agglomeration,” Review of Economics and Statistics 85, 377-393.
Say, Jean Baptiste, 1803. Treatise on Political Economy: On the Production, Distribution and Consumption
of Wealth, Kelley, New York: 1964 (1st edition: 1827).
Scarptetta, Stefano., Phillip. Hemmings, Thierry. Tresel, and Jaejoo Woo, 2002. “The role of Policy and
Institutions for Productivity and Firm Dynamics: Evidence from Micro and Industry Data,” Working
Paper 329, OECD.
Schneider, Friedrich, 2002. “Size and Measurement of the Informal Economy in 110 Countries Around the
World,” mimeo.
Schumpeter, Joseph A., 1942. Capitalism, Socialism and Democracy. London: Unwin University Books.
Stiglitz, Joseph, 2002. Globalization and Its Discontent. W.W. Norton.
World Bank, 2005, World Development Indicators, Washington D.C.: World Bank.
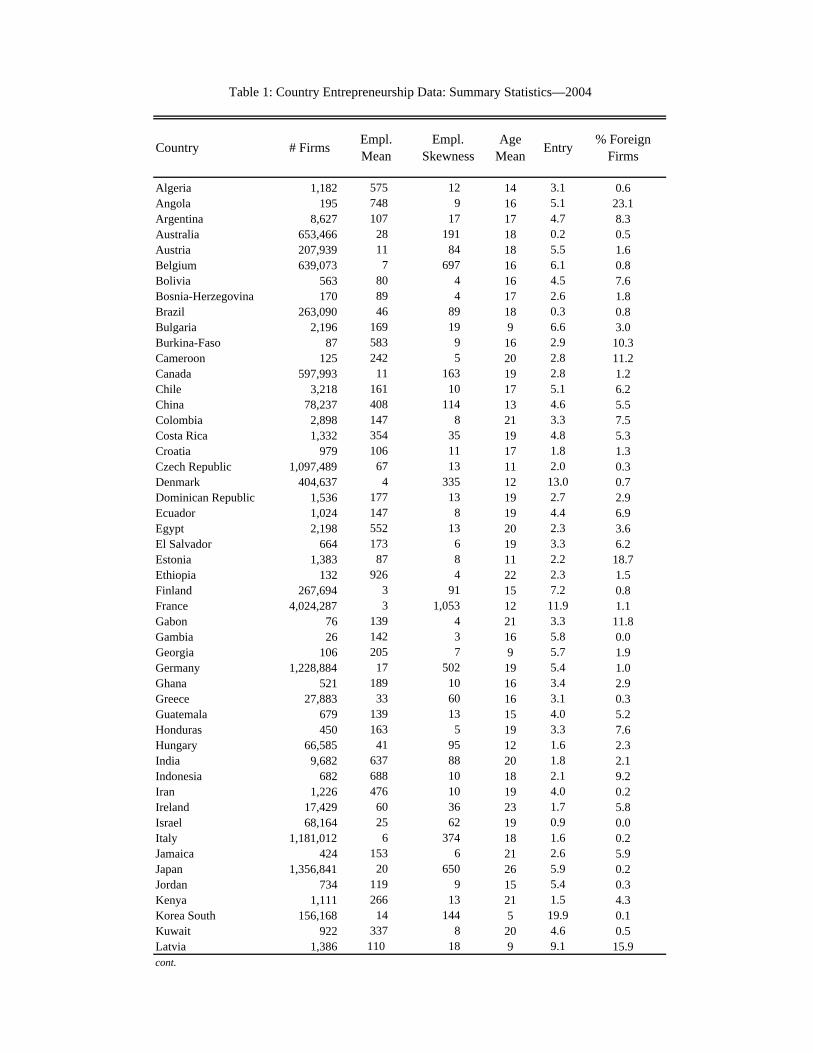
Country # Firms Empl. Mean
Empl. Skewness
Age Mean Entry % Foreign
Firms
Algeria 1,182 575 12 14 3.1 0.6Angola 195 748 9 16 5.1 23.1Argentina 8,627 107 17 17 4.7 8.3Australia 653,466 28 191 18 0.2 0.5Austria 207,939 11 84 18 5.5 1.6Belgium 639,073 7 697 16 6.1 0.8Bolivia 563 80 4 16 4.5 7.6Bosnia-Herzegovina 170 89 4 17 2.6 1.8Brazil 263,090 46 89 18 0.3 0.8Bulgaria 2,196 169 19 9 6.6 3.0Burkina-Faso 87 583 9 16 2.9 10.3Cameroon 125 242 5 20 2.8 11.2Canada 597,993 11 163 19 2.8 1.2Chile 3,218 161 10 17 5.1 6.2China 78,237 408 114 13 4.6 5.5Colombia 2,898 147 8 21 3.3 7.5Costa Rica 1,332 354 35 19 4.8 5.3Croatia 979 106 11 17 1.8 1.3Czech Republic 1,097,489 67 13 11 2.0 0.3Denmark 404,637 4 335 12 13.0 0.7Dominican Republic 1,536 177 13 19 2.7 2.9Ecuador 1,024 147 8 19 4.4 6.9Egypt 2,198 552 13 20 2.3 3.6El Salvador 664 173 6 19 3.3 6.2Estonia 1,383 87 8 11 2.2 18.7Ethiopia 132 926 4 22 2.3 1.5Finland 267,694 3 91 15 7.2 0.8France 4,024,287 3 1,053 12 11.9 1.1Gabon 76 139 4 21 3.3 11.8Gambia 26 142 3 16 5.8 0.0Georgia 106 205 7 9 5.7 1.9Germany 1,228,884 17 502 19 5.4 1.0Ghana 521 189 10 16 3.4 2.9Greece 27,883 33 60 16 3.1 0.3Guatemala 679 139 13 15 4.0 5.2Honduras 450 163 5 19 3.3 7.6Hungary 66,585 41 95 12 1.6 2.3India 9,682 637 88 20 1.8 2.1Indonesia 682 688 10 18 2.1 9.2Iran 1,226 476 10 19 4.0 0.2Ireland 17,429 60 36 23 1.7 5.8Israel 68,164 25 62 19 0.9 0.0Italy 1,181,012 6 374 18 1.6 0.2Jamaica 424 153 6 21 2.6 5.9Japan 1,356,841 20 650 26 5.9 0.2Jordan 734 119 9 15 5.4 0.3Kenya 1,111 266 13 21 1.5 4.3Korea South 156,168 14 144 5 19.9 0.1Kuwait 922 337 8 20 4.6 0.5Latvia 1,386 110 18 9 9.1 15.9cont.
Table 1: Country Entrepreneurship Data: Summary Statistics—2004
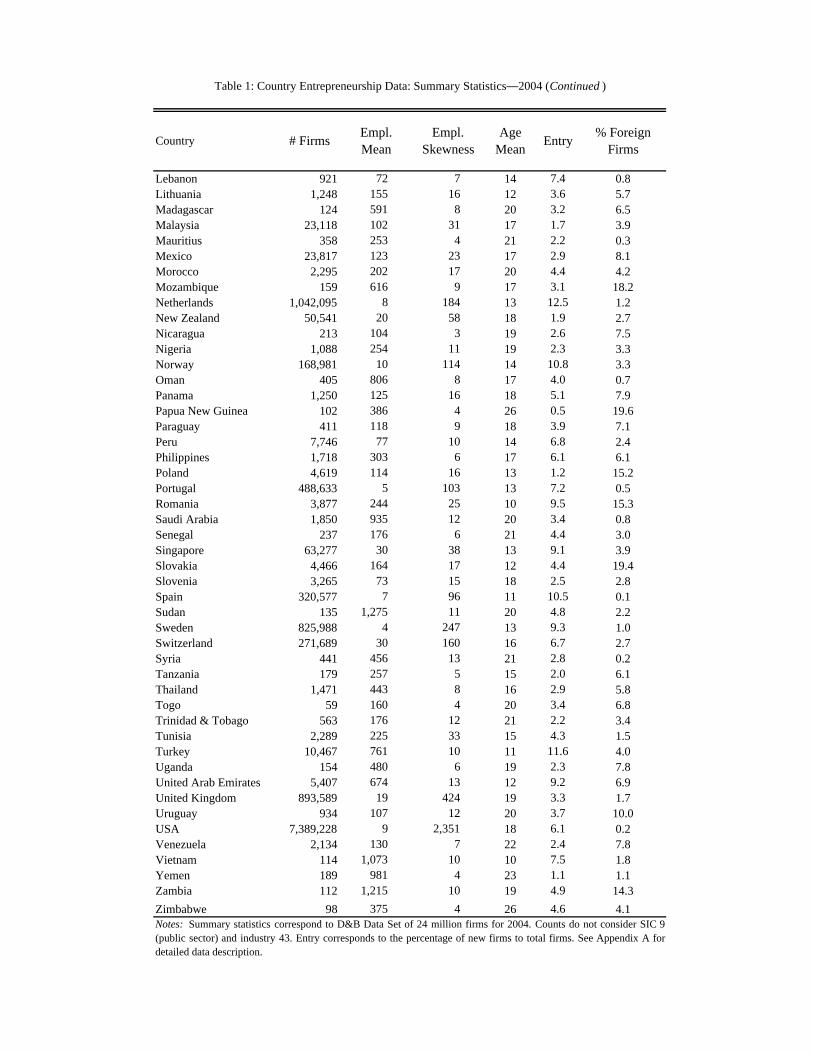
Country # Firms Empl. Mean
Empl. Skewness
Age Mean Entry % Foreign
Firms
Lebanon 921 72 7 14 7.4 0.8Lithuania 1,248 155 16 12 3.6 5.7Madagascar 124 591 8 20 3.2 6.5Malaysia 23,118 102 31 17 1.7 3.9Mauritius 358 253 4 21 2.2 0.3Mexico 23,817 123 23 17 2.9 8.1Morocco 2,295 202 17 20 4.4 4.2Mozambique 159 616 9 17 3.1 18.2Netherlands 1,042,095 8 184 13 12.5 1.2New Zealand 50,541 20 58 18 1.9 2.7Nicaragua 213 104 3 19 2.6 7.5Nigeria 1,088 254 11 19 2.3 3.3Norway 168,981 10 114 14 10.8 3.3Oman 405 806 8 17 4.0 0.7Panama 1,250 125 16 18 5.1 7.9Papua New Guinea 102 386 4 26 0.5 19.6Paraguay 411 118 9 18 3.9 7.1Peru 7,746 77 10 14 6.8 2.4Philippines 1,718 303 6 17 6.1 6.1Poland 4,619 114 16 13 1.2 15.2Portugal 488,633 5 103 13 7.2 0.5Romania 3,877 244 25 10 9.5 15.3Saudi Arabia 1,850 935 12 20 3.4 0.8Senegal 237 176 6 21 4.4 3.0Singapore 63,277 30 38 13 9.1 3.9Slovakia 4,466 164 17 12 4.4 19.4Slovenia 3,265 73 15 18 2.5 2.8Spain 320,577 7 96 11 10.5 0.1Sudan 135 1,275 11 20 4.8 2.2Sweden 825,988 4 247 13 9.3 1.0Switzerland 271,689 30 160 16 6.7 2.7Syria 441 456 13 21 2.8 0.2Tanzania 179 257 5 15 2.0 6.1Thailand 1,471 443 8 16 2.9 5.8Togo 59 160 4 20 3.4 6.8Trinidad & Tobago 563 176 12 21 2.2 3.4Tunisia 2,289 225 33 15 4.3 1.5Turkey 10,467 761 10 11 11.6 4.0Uganda 154 480 6 19 2.3 7.8United Arab Emirates 5,407 674 13 12 9.2 6.9United Kingdom 893,589 19 424 19 3.3 1.7Uruguay 934 107 12 20 3.7 10.0USA 7,389,228 9 2,351 18 6.1 0.2Venezuela 2,134 130 7 22 2.4 7.8Vietnam 114 1,073 10 10 7.5 1.8Yemen 189 981 4 23 1.1 1.1Zambia 112 1,215 10 19 4.9 14.3Zimbabwe 98 375 4 26 4.6 4.1
Table 1: Country Entrepreneurship Data: Summary Statistics—2004 (Continued )
Notes: Summary statistics correspond to D&B Data Set of 24 million firms for 2004. Counts do not consider SIC 9(public sector) and industry 43. Entry corresponds to the percentage of new firms to total firms. See Appendix A fordetailed data description.
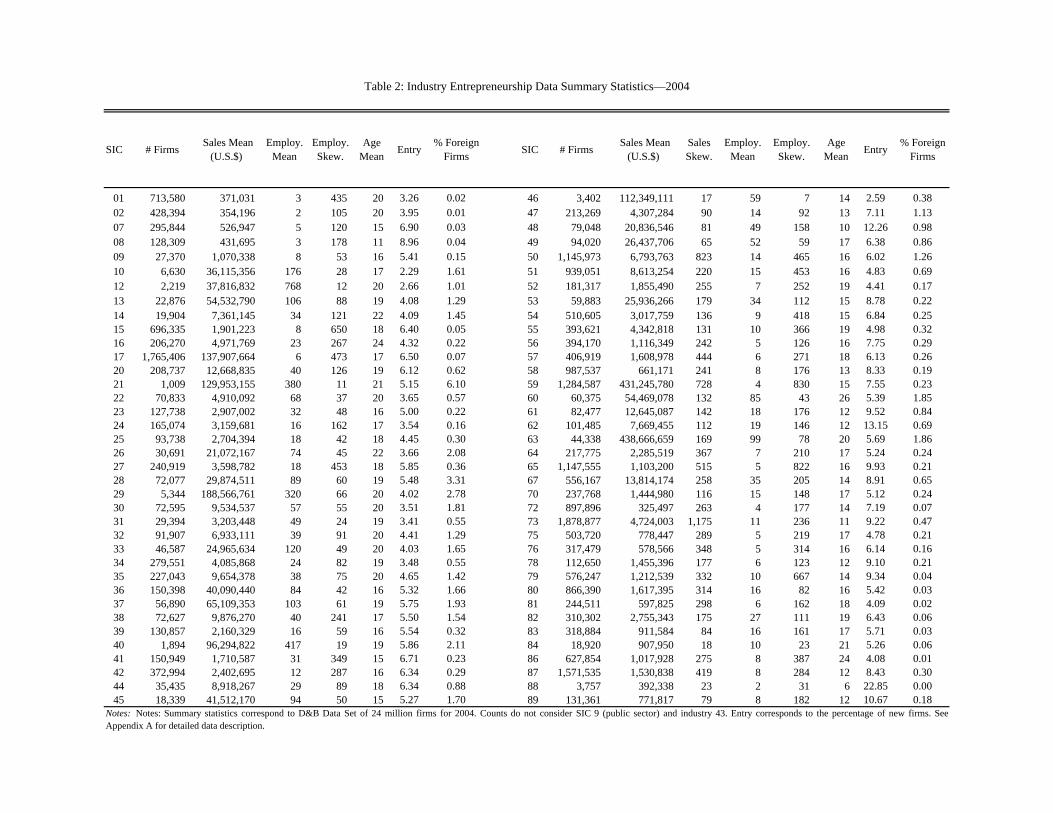
SIC # Firms Sales Mean (U.S.$)
Employ. Mean
Employ. Skew.
Age Mean Entry % Foreign
Firms SIC # Firms Sales Mean (U.S.$)
Sales Skew.
Employ. Mean
Employ. Skew.
Age Mean Entry % Foreign
Firms
01 713,580 371,031 3 435 20 3.26 0.02 46 3,402 112,349,111 17 59 7 14 2.59 0.3802 428,394 354,196 2 105 20 3.95 0.01 47 213,269 4,307,284 90 14 92 13 7.11 1.1307 295,844 526,947 5 120 15 6.90 0.03 48 79,048 20,836,546 81 49 158 10 12.26 0.9808 128,309 431,695 3 178 11 8.96 0.04 49 94,020 26,437,706 65 52 59 17 6.38 0.8609 27,370 1,070,338 8 53 16 5.41 0.15 50 1,145,973 6,793,763 823 14 465 16 6.02 1.2610 6,630 36,115,356 176 28 17 2.29 1.61 51 939,051 8,613,254 220 15 453 16 4.83 0.6912 2,219 37,816,832 768 12 20 2.66 1.01 52 181,317 1,855,490 255 7 252 19 4.41 0.1713 22,876 54,532,790 106 88 19 4.08 1.29 53 59,883 25,936,266 179 34 112 15 8.78 0.2214 19,904 7,361,145 34 121 22 4.09 1.45 54 510,605 3,017,759 136 9 418 15 6.84 0.2515 696,335 1,901,223 8 650 18 6.40 0.05 55 393,621 4,342,818 131 10 366 19 4.98 0.3216 206,270 4,971,769 23 267 24 4.32 0.22 56 394,170 1,116,349 242 5 126 16 7.75 0.2917 1,765,406 137,907,664 6 473 17 6.50 0.07 57 406,919 1,608,978 444 6 271 18 6.13 0.2620 208,737 12,668,835 40 126 19 6.12 0.62 58 987,537 661,171 241 8 176 13 8.33 0.1921 1,009 129,953,155 380 11 21 5.15 6.10 59 1,284,587 431,245,780 728 4 830 15 7.55 0.2322 70,833 4,910,092 68 37 20 3.65 0.57 60 60,375 54,469,078 132 85 43 26 5.39 1.8523 127,738 2,907,002 32 48 16 5.00 0.22 61 82,477 12,645,087 142 18 176 12 9.52 0.8424 165,074 3,159,681 16 162 17 3.54 0.16 62 101,485 7,669,455 112 19 146 12 13.15 0.6925 93,738 2,704,394 18 42 18 4.45 0.30 63 44,338 438,666,659 169 99 78 20 5.69 1.8626 30,691 21,072,167 74 45 22 3.66 2.08 64 217,775 2,285,519 367 7 210 17 5.24 0.2427 240,919 3,598,782 18 453 18 5.85 0.36 65 1,147,555 1,103,200 515 5 822 16 9.93 0.2128 72,077 29,874,511 89 60 19 5.48 3.31 67 556,167 13,814,174 258 35 205 14 8.91 0.6529 5,344 188,566,761 320 66 20 4.02 2.78 70 237,768 1,444,980 116 15 148 17 5.12 0.2430 72,595 9,534,537 57 55 20 3.51 1.81 72 897,896 325,497 263 4 177 14 7.19 0.0731 29,394 3,203,448 49 24 19 3.41 0.55 73 1,878,877 4,724,003 1,175 11 236 11 9.22 0.4732 91,907 6,933,111 39 91 20 4.41 1.29 75 503,720 778,447 289 5 219 17 4.78 0.2133 46,587 24,965,634 120 49 20 4.03 1.65 76 317,479 578,566 348 5 314 16 6.14 0.1634 279,551 4,085,868 24 82 19 3.48 0.55 78 112,650 1,455,396 177 6 123 12 9.10 0.2135 227,043 9,654,378 38 75 20 4.65 1.42 79 576,247 1,212,539 332 10 667 14 9.34 0.0436 150,398 40,090,440 84 42 16 5.32 1.66 80 866,390 1,617,395 314 16 82 16 5.42 0.0337 56,890 65,109,353 103 61 19 5.75 1.93 81 244,511 597,825 298 6 162 18 4.09 0.0238 72,627 9,876,270 40 241 17 5.50 1.54 82 310,302 2,755,343 175 27 111 19 6.43 0.0639 130,857 2,160,329 16 59 16 5.54 0.32 83 318,884 911,584 84 16 161 17 5.71 0.0340 1,894 96,294,822 417 19 19 5.86 2.11 84 18,920 907,950 18 10 23 21 5.26 0.0641 150,949 1,710,587 31 349 15 6.71 0.23 86 627,854 1,017,928 275 8 387 24 4.08 0.0142 372,994 2,402,695 12 287 16 6.34 0.29 87 1,571,535 1,530,838 419 8 284 12 8.43 0.3044 35,435 8,918,267 29 89 18 6.34 0.88 88 3,757 392,338 23 2 31 6 22.85 0.0045 18,339 41,512,170 94 50 15 5.27 1.70 89 131,361 771,817 79 8 182 12 10.67 0.18
Notes: Notes: Summary statistics correspond to D&B Data Set of 24 million firms for 2004. Counts do not consider SIC 9 (public sector) and industry 43. Entry corresponds to the percentage of new firms. SeeAppendix A for detailed data description.
Table 2: Industry Entrepreneurship Data Summary Statistics—2004
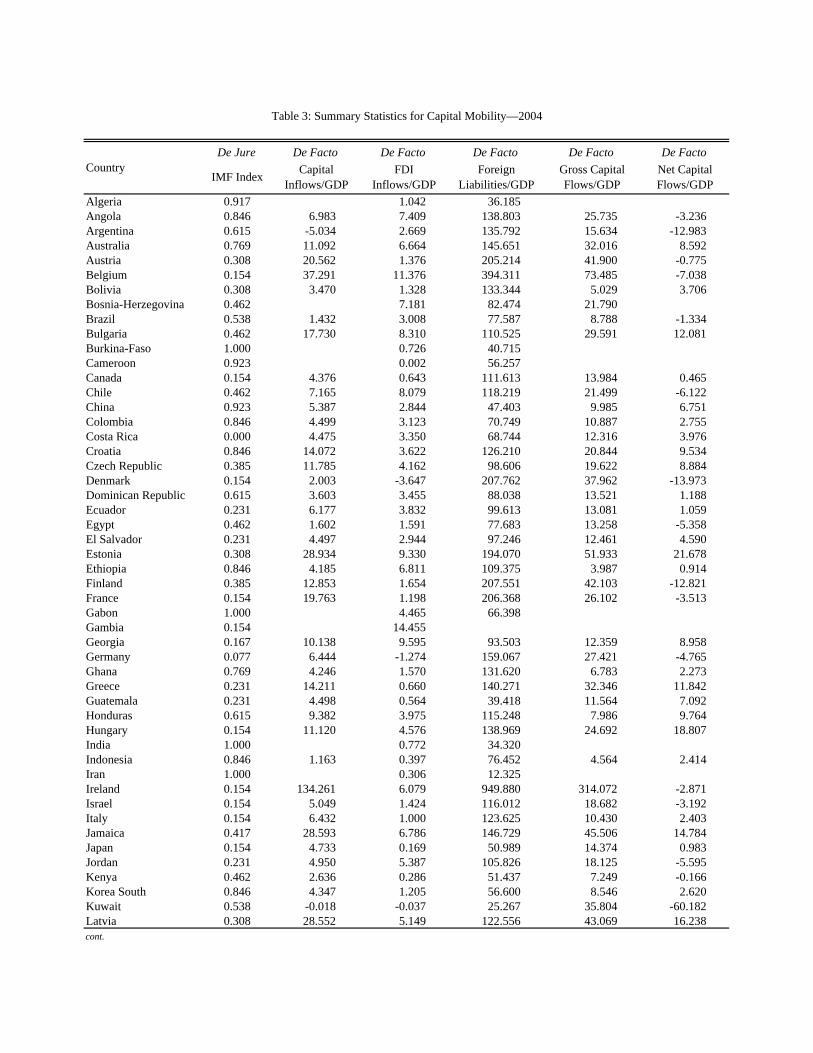
De Jure De Facto De Facto De Facto De Facto De Facto
IMF Index Capital Inflows/GDP
FDI Inflows/GDP
Foreign Liabilities/GDP
Gross Capital Flows/GDP
Net Capital Flows/GDP
Algeria 0.917 1.042 36.185Angola 0.846 6.983 7.409 138.803 25.735 -3.236Argentina 0.615 -5.034 2.669 135.792 15.634 -12.983Australia 0.769 11.092 6.664 145.651 32.016 8.592Austria 0.308 20.562 1.376 205.214 41.900 -0.775Belgium 0.154 37.291 11.376 394.311 73.485 -7.038Bolivia 0.308 3.470 1.328 133.344 5.029 3.706Bosnia-Herzegovina 0.462 7.181 82.474 21.790Brazil 0.538 1.432 3.008 77.587 8.788 -1.334Bulgaria 0.462 17.730 8.310 110.525 29.591 12.081Burkina-Faso 1.000 0.726 40.715Cameroon 0.923 0.002 56.257Canada 0.154 4.376 0.643 111.613 13.984 0.465Chile 0.462 7.165 8.079 118.219 21.499 -6.122China 0.923 5.387 2.844 47.403 9.985 6.751Colombia 0.846 4.499 3.123 70.749 10.887 2.755Costa Rica 0.000 4.475 3.350 68.744 12.316 3.976Croatia 0.846 14.072 3.622 126.210 20.844 9.534Czech Republic 0.385 11.785 4.162 98.606 19.622 8.884Denmark 0.154 2.003 -3.647 207.762 37.962 -13.973Dominican Republic 0.615 3.603 3.455 88.038 13.521 1.188Ecuador 0.231 6.177 3.832 99.613 13.081 1.059Egypt 0.462 1.602 1.591 77.683 13.258 -5.358El Salvador 0.231 4.497 2.944 97.246 12.461 4.590Estonia 0.308 28.934 9.330 194.070 51.933 21.678Ethiopia 0.846 4.185 6.811 109.375 3.987 0.914Finland 0.385 12.853 1.654 207.551 42.103 -12.821France 0.154 19.763 1.198 206.368 26.102 -3.513Gabon 1.000 4.465 66.398Gambia 0.154 14.455Georgia 0.167 10.138 9.595 93.503 12.359 8.958Germany 0.077 6.444 -1.274 159.067 27.421 -4.765Ghana 0.769 4.246 1.570 131.620 6.783 2.273Greece 0.231 14.211 0.660 140.271 32.346 11.842Guatemala 0.231 4.498 0.564 39.418 11.564 7.092Honduras 0.615 9.382 3.975 115.248 7.986 9.764Hungary 0.154 11.120 4.576 138.969 24.692 18.807India 1.000 0.772 34.320Indonesia 0.846 1.163 0.397 76.452 4.564 2.414Iran 1.000 0.306 12.325Ireland 0.154 134.261 6.079 949.880 314.072 -2.871Israel 0.154 5.049 1.424 116.012 18.682 -3.192Italy 0.154 6.432 1.000 123.625 10.430 2.403Jamaica 0.417 28.593 6.786 146.729 45.506 14.784Japan 0.154 4.733 0.169 50.989 14.374 0.983Jordan 0.231 4.950 5.387 105.826 18.125 -5.595Kenya 0.462 2.636 0.286 51.437 7.249 -0.166Korea South 0.846 4.347 1.205 56.600 8.546 2.620Kuwait 0.538 -0.018 -0.037 25.267 35.804 -60.182Latvia 0.308 28.552 5.149 122.556 43.069 16.238cont.
Table 3: Summary Statistics for Capital Mobility—2004
Country
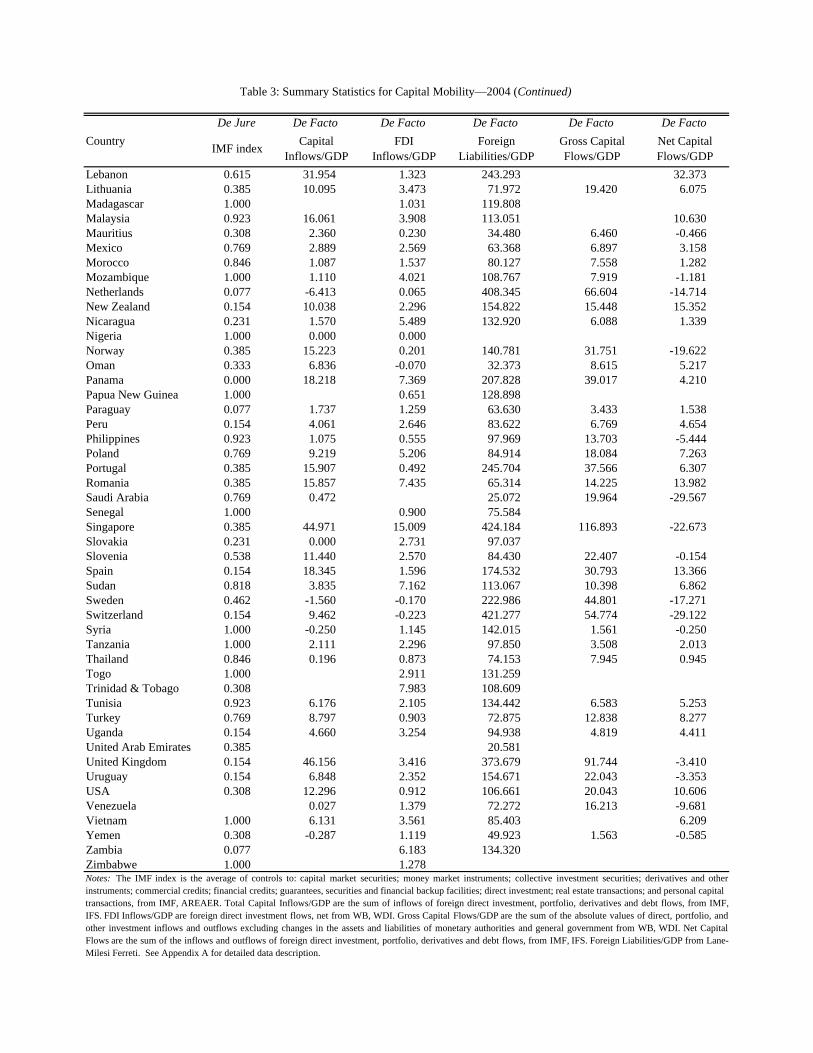
De Jure De Facto De Facto De Facto De Facto De Facto
IMF index Capital Inflows/GDP
FDI Inflows/GDP
Foreign Liabilities/GDP
Gross Capital Flows/GDP
Net Capital Flows/GDP
Lebanon 0.615 31.954 1.323 243.293 32.373Lithuania 0.385 10.095 3.473 71.972 19.420 6.075Madagascar 1.000 1.031 119.808Malaysia 0.923 16.061 3.908 113.051 10.630Mauritius 0.308 2.360 0.230 34.480 6.460 -0.466Mexico 0.769 2.889 2.569 63.368 6.897 3.158Morocco 0.846 1.087 1.537 80.127 7.558 1.282Mozambique 1.000 1.110 4.021 108.767 7.919 -1.181Netherlands 0.077 -6.413 0.065 408.345 66.604 -14.714New Zealand 0.154 10.038 2.296 154.822 15.448 15.352Nicaragua 0.231 1.570 5.489 132.920 6.088 1.339Nigeria 1.000 0.000 0.000Norway 0.385 15.223 0.201 140.781 31.751 -19.622Oman 0.333 6.836 -0.070 32.373 8.615 5.217Panama 0.000 18.218 7.369 207.828 39.017 4.210Papua New Guinea 1.000 0.651 128.898Paraguay 0.077 1.737 1.259 63.630 3.433 1.538Peru 0.154 4.061 2.646 83.622 6.769 4.654Philippines 0.923 1.075 0.555 97.969 13.703 -5.444Poland 0.769 9.219 5.206 84.914 18.084 7.263Portugal 0.385 15.907 0.492 245.704 37.566 6.307Romania 0.385 15.857 7.435 65.314 14.225 13.982Saudi Arabia 0.769 0.472 25.072 19.964 -29.567Senegal 1.000 0.900 75.584Singapore 0.385 44.971 15.009 424.184 116.893 -22.673Slovakia 0.231 0.000 2.731 97.037Slovenia 0.538 11.440 2.570 84.430 22.407 -0.154Spain 0.154 18.345 1.596 174.532 30.793 13.366Sudan 0.818 3.835 7.162 113.067 10.398 6.862Sweden 0.462 -1.560 -0.170 222.986 44.801 -17.271Switzerland 0.154 9.462 -0.223 421.277 54.774 -29.122Syria 1.000 -0.250 1.145 142.015 1.561 -0.250Tanzania 1.000 2.111 2.296 97.850 3.508 2.013Thailand 0.846 0.196 0.873 74.153 7.945 0.945Togo 1.000 2.911 131.259Trinidad & Tobago 0.308 7.983 108.609Tunisia 0.923 6.176 2.105 134.442 6.583 5.253Turkey 0.769 8.797 0.903 72.875 12.838 8.277Uganda 0.154 4.660 3.254 94.938 4.819 4.411United Arab Emirates 0.385 20.581United Kingdom 0.154 46.156 3.416 373.679 91.744 -3.410Uruguay 0.154 6.848 2.352 154.671 22.043 -3.353USA 0.308 12.296 0.912 106.661 20.043 10.606Venezuela 0.027 1.379 72.272 16.213 -9.681Vietnam 1.000 6.131 3.561 85.403 6.209Yemen 0.308 -0.287 1.119 49.923 1.563 -0.585Zambia 0.077 6.183 134.320Zimbabwe 1.000 1.278Notes: The IMF index is the average of controls to: capital market securities; money market instruments; collective investment securities; derivatives and otherinstruments; commercial credits; financial credits; guarantees, securities and financial backup facilities; direct investment; real estate transactions; and personal capital transactions, from IMF, AREAER. Total Capital Inflows/GDP are the sum of inflows of foreign direct investment, portfolio, derivatives and debt flows, from IMF,IFS. FDI Inflows/GDP are foreign direct investment flows, net from WB, WDI. Gross Capital Flows/GDP are the sum of the absolute values of direct, portfolio, andother investment inflows and outflows excluding changes in the assets and liabilities of monetary authorities and general government from WB, WDI. Net CapitalFlows are the sum of the inflows and outflows of foreign direct investment, portfolio, derivatives and debt flows, from IMF, IFS. Foreign Liabilities/GDP from Lane-Milesi Ferreti. See Appendix A for detailed data description.
Table 3: Summary Statistics for Capital Mobility—2004 (Continued)
Country
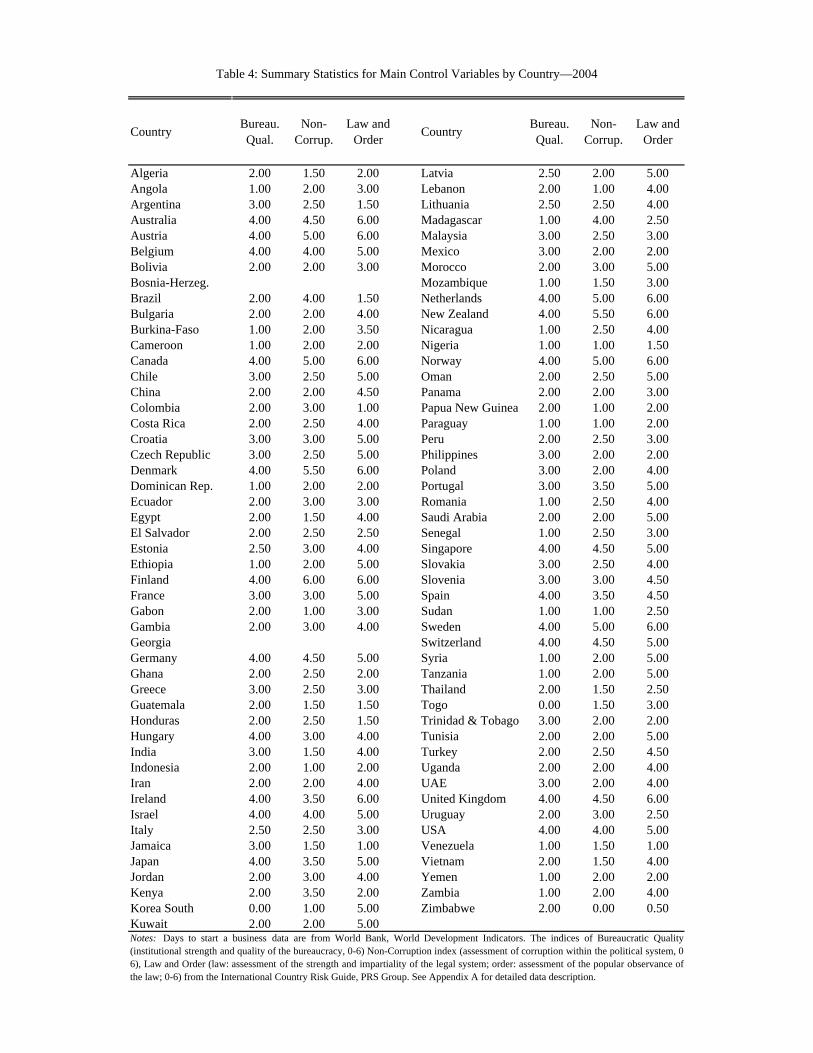
Country Bureau. Qual.
Non-Corrup.
Law and Order Country Bureau.
Qual.Non-
Corrup.Law and
Order
Algeria 2.00 1.50 2.00 Latvia 2.50 2.00 5.00Angola 1.00 2.00 3.00 Lebanon 2.00 1.00 4.00Argentina 3.00 2.50 1.50 Lithuania 2.50 2.50 4.00Australia 4.00 4.50 6.00 Madagascar 1.00 4.00 2.50Austria 4.00 5.00 6.00 Malaysia 3.00 2.50 3.00Belgium 4.00 4.00 5.00 Mexico 3.00 2.00 2.00Bolivia 2.00 2.00 3.00 Morocco 2.00 3.00 5.00Bosnia-Herzeg. Mozambique 1.00 1.50 3.00Brazil 2.00 4.00 1.50 Netherlands 4.00 5.00 6.00Bulgaria 2.00 2.00 4.00 New Zealand 4.00 5.50 6.00Burkina-Faso 1.00 2.00 3.50 Nicaragua 1.00 2.50 4.00Cameroon 1.00 2.00 2.00 Nigeria 1.00 1.00 1.50Canada 4.00 5.00 6.00 Norway 4.00 5.00 6.00Chile 3.00 2.50 5.00 Oman 2.00 2.50 5.00China 2.00 2.00 4.50 Panama 2.00 2.00 3.00Colombia 2.00 3.00 1.00 Papua New Guinea 2.00 1.00 2.00Costa Rica 2.00 2.50 4.00 Paraguay 1.00 1.00 2.00Croatia 3.00 3.00 5.00 Peru 2.00 2.50 3.00Czech Republic 3.00 2.50 5.00 Philippines 3.00 2.00 2.00Denmark 4.00 5.50 6.00 Poland 3.00 2.00 4.00Dominican Rep. 1.00 2.00 2.00 Portugal 3.00 3.50 5.00Ecuador 2.00 3.00 3.00 Romania 1.00 2.50 4.00Egypt 2.00 1.50 4.00 Saudi Arabia 2.00 2.00 5.00El Salvador 2.00 2.50 2.50 Senegal 1.00 2.50 3.00Estonia 2.50 3.00 4.00 Singapore 4.00 4.50 5.00Ethiopia 1.00 2.00 5.00 Slovakia 3.00 2.50 4.00Finland 4.00 6.00 6.00 Slovenia 3.00 3.00 4.50France 3.00 3.00 5.00 Spain 4.00 3.50 4.50Gabon 2.00 1.00 3.00 Sudan 1.00 1.00 2.50Gambia 2.00 3.00 4.00 Sweden 4.00 5.00 6.00Georgia Switzerland 4.00 4.50 5.00Germany 4.00 4.50 5.00 Syria 1.00 2.00 5.00Ghana 2.00 2.50 2.00 Tanzania 1.00 2.00 5.00Greece 3.00 2.50 3.00 Thailand 2.00 1.50 2.50Guatemala 2.00 1.50 1.50 Togo 0.00 1.50 3.00Honduras 2.00 2.50 1.50 Trinidad & Tobago 3.00 2.00 2.00Hungary 4.00 3.00 4.00 Tunisia 2.00 2.00 5.00India 3.00 1.50 4.00 Turkey 2.00 2.50 4.50Indonesia 2.00 1.00 2.00 Uganda 2.00 2.00 4.00Iran 2.00 2.00 4.00 UAE 3.00 2.00 4.00Ireland 4.00 3.50 6.00 United Kingdom 4.00 4.50 6.00Israel 4.00 4.00 5.00 Uruguay 2.00 3.00 2.50Italy 2.50 2.50 3.00 USA 4.00 4.00 5.00Jamaica 3.00 1.50 1.00 Venezuela 1.00 1.50 1.00Japan 4.00 3.50 5.00 Vietnam 2.00 1.50 4.00Jordan 2.00 3.00 4.00 Yemen 1.00 2.00 2.00Kenya 2.00 3.50 2.00 Zambia 1.00 2.00 4.00Korea South 0.00 1.00 5.00 Zimbabwe 2.00 0.00 0.50Kuwait 2.00 2.00 5.00Notes: Days to start a business data are from World Bank, World Development Indicators. The indices of Bureaucratic Quality(institutional strength and quality of the bureaucracy, 0-6) Non-Corruption index (assessment of corruption within the political system, 0-6), Law and Order (law: assessment of the strength and impartiality of the legal system; order: assessment of the popular observance ofthe law; 0-6) from the International Country Risk Guide, PRS Group. See Appendix A for detailed data description.
Table 4: Summary Statistics for Main Control Variables by Country—2004
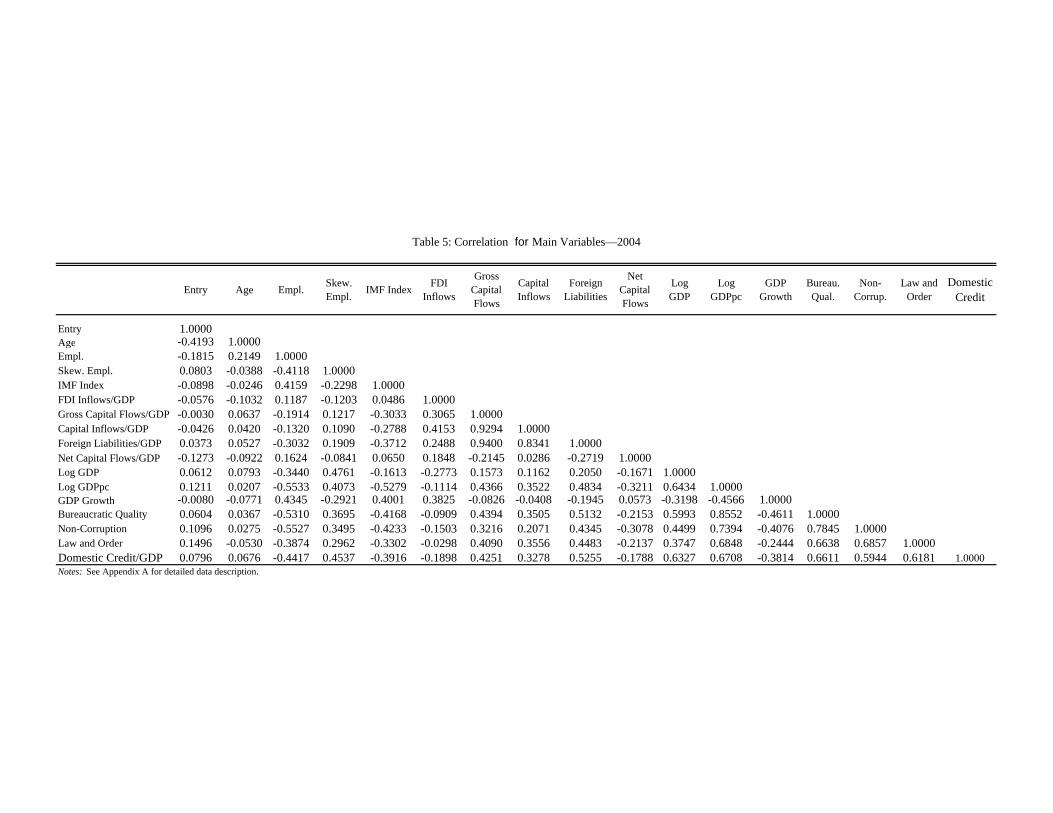
Entry Age Empl. Skew. Empl. IMF Index FDI
Inflows
Gross Capital Flows
Capital Inflows
Foreign Liabilities
Net Capital Flows
Log GDP
Log GDPpc
GDP Growth
Bureau. Qual.
Non-Corrup.
Law and Order
Domestic Credit
Entry 1.0000Age -0.4193 1.0000Empl. -0.1815 0.2149 1.0000Skew. Empl. 0.0803 -0.0388 -0.4118 1.0000IMF Index -0.0898 -0.0246 0.4159 -0.2298 1.0000FDI Inflows/GDP -0.0576 -0.1032 0.1187 -0.1203 0.0486 1.0000Gross Capital Flows/GDP -0.0030 0.0637 -0.1914 0.1217 -0.3033 0.3065 1.0000Capital Inflows/GDP -0.0426 0.0420 -0.1320 0.1090 -0.2788 0.4153 0.9294 1.0000Foreign Liabilities/GDP 0.0373 0.0527 -0.3032 0.1909 -0.3712 0.2488 0.9400 0.8341 1.0000Net Capital Flows/GDP -0.1273 -0.0922 0.1624 -0.0841 0.0650 0.1848 -0.2145 0.0286 -0.2719 1.0000Log GDP 0.0612 0.0793 -0.3440 0.4761 -0.1613 -0.2773 0.1573 0.1162 0.2050 -0.1671 1.0000Log GDPpc 0.1211 0.0207 -0.5533 0.4073 -0.5279 -0.1114 0.4366 0.3522 0.4834 -0.3211 0.6434 1.0000GDP Growth -0.0080 -0.0771 0.4345 -0.2921 0.4001 0.3825 -0.0826 -0.0408 -0.1945 0.0573 -0.3198 -0.4566 1.0000Bureaucratic Quality 0.0604 0.0367 -0.5310 0.3695 -0.4168 -0.0909 0.4394 0.3505 0.5132 -0.2153 0.5993 0.8552 -0.4611 1.0000Non-Corruption 0.1096 0.0275 -0.5527 0.3495 -0.4233 -0.1503 0.3216 0.2071 0.4345 -0.3078 0.4499 0.7394 -0.4076 0.7845 1.0000Law and Order 0.1496 -0.0530 -0.3874 0.2962 -0.3302 -0.0298 0.4090 0.3556 0.4483 -0.2137 0.3747 0.6848 -0.2444 0.6638 0.6857 1.0000Domestic Credit/GDP 0.0796 0.0676 -0.4417 0.4537 -0.3916 -0.1898 0.4251 0.3278 0.5255 -0.1788 0.6327 0.6708 -0.3814 0.6611 0.5944 0.6181 1.0000Notes: See Appendix A for detailed data description.
Table 5: Correlation for Main Variables—2004
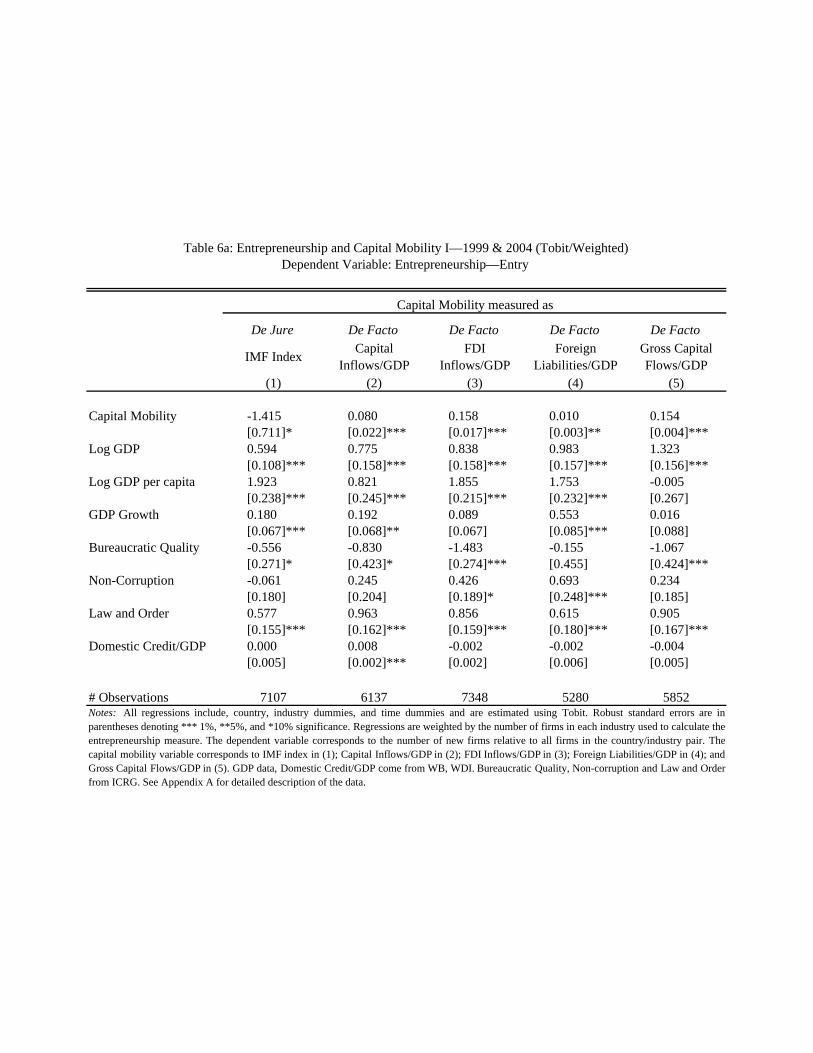
De Jure De Facto De Facto De Facto De Facto
IMF Index Capital Inflows/GDP
FDI Inflows/GDP
Foreign Liabilities/GDP
Gross Capital Flows/GDP
(1) (2) (3) (4) (5)
Capital Mobility -1.415 0.080 0.158 0.010 0.154[0.711]* [0.022]*** [0.017]*** [0.003]** [0.004]***
Log GDP 0.594 0.775 0.838 0.983 1.323[0.108]*** [0.158]*** [0.158]*** [0.157]*** [0.156]***
Log GDP per capita 1.923 0.821 1.855 1.753 -0.005[0.238]*** [0.245]*** [0.215]*** [0.232]*** [0.267]
GDP Growth 0.180 0.192 0.089 0.553 0.016[0.067]*** [0.068]** [0.067] [0.085]*** [0.088]
Bureaucratic Quality -0.556 -0.830 -1.483 -0.155 -1.067[0.271]* [0.423]* [0.274]*** [0.455] [0.424]***
Non-Corruption -0.061 0.245 0.426 0.693 0.234[0.180] [0.204] [0.189]* [0.248]*** [0.185]
Law and Order 0.577 0.963 0.856 0.615 0.905[0.155]*** [0.162]*** [0.159]*** [0.180]*** [0.167]***
Domestic Credit/GDP 0.000 0.008 -0.002 -0.002 -0.004[0.005] [0.002]*** [0.002] [0.006] [0.005]
# Observations 7107 6137 7348 5280 5852
Table 6a: Entrepreneurship and Capital Mobility I—1999 & 2004 (Tobit/Weighted)Dependent Variable: Entrepreneurship—Entry
Capital Mobility measured as
Notes: All regressions include, country, industry dummies, and time dummies and are estimated using Tobit. Robust standard errors are inparentheses denoting *** 1%, **5%, and *10% significance. Regressions are weighted by the number of firms in each industry used to calculate theentrepreneurship measure. The dependent variable corresponds to the number of new firms relative to all firms in the country/industry pair. Thecapital mobility variable corresponds to IMF index in (1); Capital Inflows/GDP in (2); FDI Inflows/GDP in (3); Foreign Liabilities/GDP in (4); andGross Capital Flows/GDP in (5). GDP data, Domestic Credit/GDP come from WB, WDI. Bureaucratic Quality, Non-corruption and Law and Orderfrom ICRG. See Appendix A for detailed description of the data.
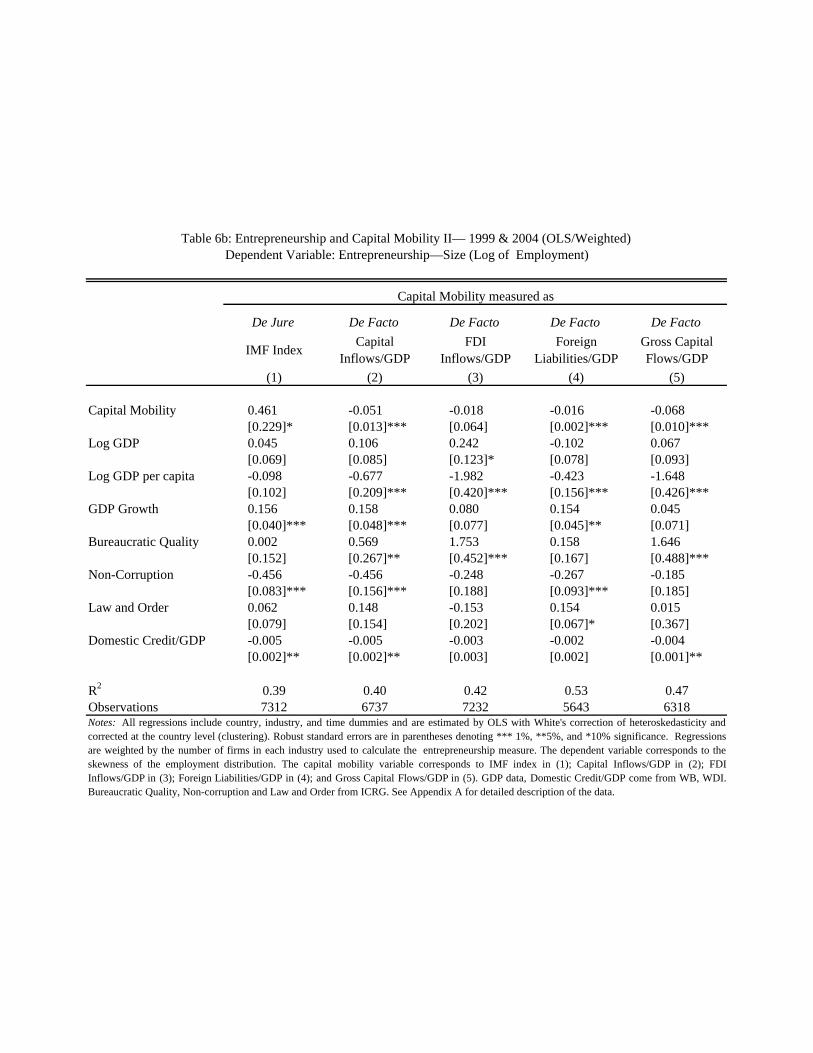
De Jure De Facto De Facto De Facto De Facto
IMF Index Capital Inflows/GDP
FDI Inflows/GDP
Foreign Liabilities/GDP
Gross Capital Flows/GDP
(1) (2) (3) (4) (5)
Capital Mobility 0.461 -0.051 -0.018 -0.016 -0.068[0.229]* [0.013]*** [0.064] [0.002]*** [0.010]***
Log GDP 0.045 0.106 0.242 -0.102 0.067[0.069] [0.085] [0.123]* [0.078] [0.093]
Log GDP per capita -0.098 -0.677 -1.982 -0.423 -1.648[0.102] [0.209]*** [0.420]*** [0.156]*** [0.426]***
GDP Growth 0.156 0.158 0.080 0.154 0.045[0.040]*** [0.048]*** [0.077] [0.045]** [0.071]
Bureaucratic Quality 0.002 0.569 1.753 0.158 1.646[0.152] [0.267]** [0.452]*** [0.167] [0.488]***
Non-Corruption -0.456 -0.456 -0.248 -0.267 -0.185[0.083]*** [0.156]*** [0.188] [0.093]*** [0.185]
Law and Order 0.062 0.148 -0.153 0.154 0.015[0.079] [0.154] [0.202] [0.067]* [0.367]
Domestic Credit/GDP -0.005 -0.005 -0.003 -0.002 -0.004[0.002]** [0.002]** [0.003] [0.002] [0.001]**
R2 0.39 0.40 0.42 0.53 0.47Observations 7312 6737 7232 5643 6318
Table 6b: Entrepreneurship and Capital Mobility II— 1999 & 2004 (OLS/Weighted)Dependent Variable: Entrepreneurship—Size (Log of Employment)
Capital Mobility measured as
Notes: All regressions include country, industry, and time dummies and are estimated by OLS with White's correction of heteroskedasticity andcorrected at the country level (clustering). Robust standard errors are in parentheses denoting *** 1%, **5%, and *10% significance. Regressionsare weighted by the number of firms in each industry used to calculate the entrepreneurship measure. The dependent variable corresponds to theskewness of the employment distribution. The capital mobility variable corresponds to IMF index in (1); Capital Inflows/GDP in (2); FDIInflows/GDP in (3); Foreign Liabilities/GDP in (4); and Gross Capital Flows/GDP in (5). GDP data, Domestic Credit/GDP come from WB, WDI.Bureaucratic Quality, Non-corruption and Law and Order from ICRG. See Appendix A for detailed description of the data.
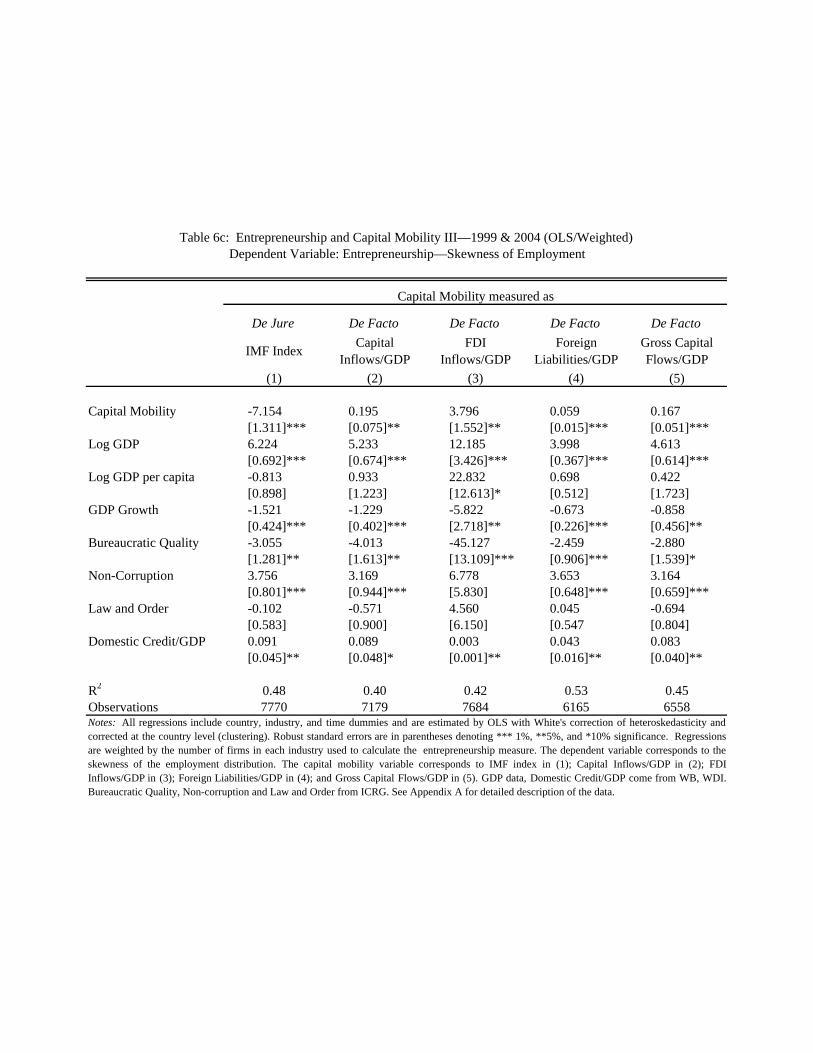
De Jure De Facto De Facto De Facto De Facto
IMF Index Capital Inflows/GDP
FDI Inflows/GDP
Foreign Liabilities/GDP
Gross Capital Flows/GDP
(1) (2) (3) (4) (5)
Capital Mobility -7.154 0.195 3.796 0.059 0.167[1.311]*** [0.075]** [1.552]** [0.015]*** [0.051]***
Log GDP 6.224 5.233 12.185 3.998 4.613[0.692]*** [0.674]*** [3.426]*** [0.367]*** [0.614]***
Log GDP per capita -0.813 0.933 22.832 0.698 0.422[0.898] [1.223] [12.613]* [0.512] [1.723]
GDP Growth -1.521 -1.229 -5.822 -0.673 -0.858[0.424]*** [0.402]*** [2.718]** [0.226]*** [0.456]**
Bureaucratic Quality -3.055 -4.013 -45.127 -2.459 -2.880[1.281]** [1.613]** [13.109]*** [0.906]*** [1.539]*
Non-Corruption 3.756 3.169 6.778 3.653 3.164[0.801]*** [0.944]*** [5.830] [0.648]*** [0.659]***
Law and Order -0.102 -0.571 4.560 0.045 -0.694[0.583] [0.900] [6.150] [0.547 [0.804]
Domestic Credit/GDP 0.091 0.089 0.003 0.043 0.083[0.045]** [0.048]* [0.001]** [0.016]** [0.040]**
R2 0.48 0.40 0.42 0.53 0.45Observations 7770 7179 7684 6165 6558Notes: All regressions include country, industry, and time dummies and are estimated by OLS with White's correction of heteroskedasticity andcorrected at the country level (clustering). Robust standard errors are in parentheses denoting *** 1%, **5%, and *10% significance. Regressionsare weighted by the number of firms in each industry used to calculate the entrepreneurship measure. The dependent variable corresponds to theskewness of the employment distribution. The capital mobility variable corresponds to IMF index in (1); Capital Inflows/GDP in (2); FDIInflows/GDP in (3); Foreign Liabilities/GDP in (4); and Gross Capital Flows/GDP in (5). GDP data, Domestic Credit/GDP come from WB, WDI.Bureaucratic Quality, Non-corruption and Law and Order from ICRG. See Appendix A for detailed description of the data.
Table 6c: Entrepreneurship and Capital Mobility III—1999 & 2004 (OLS/Weighted)Dependent Variable: Entrepreneurship—Skewness of Employment
Capital Mobility measured as
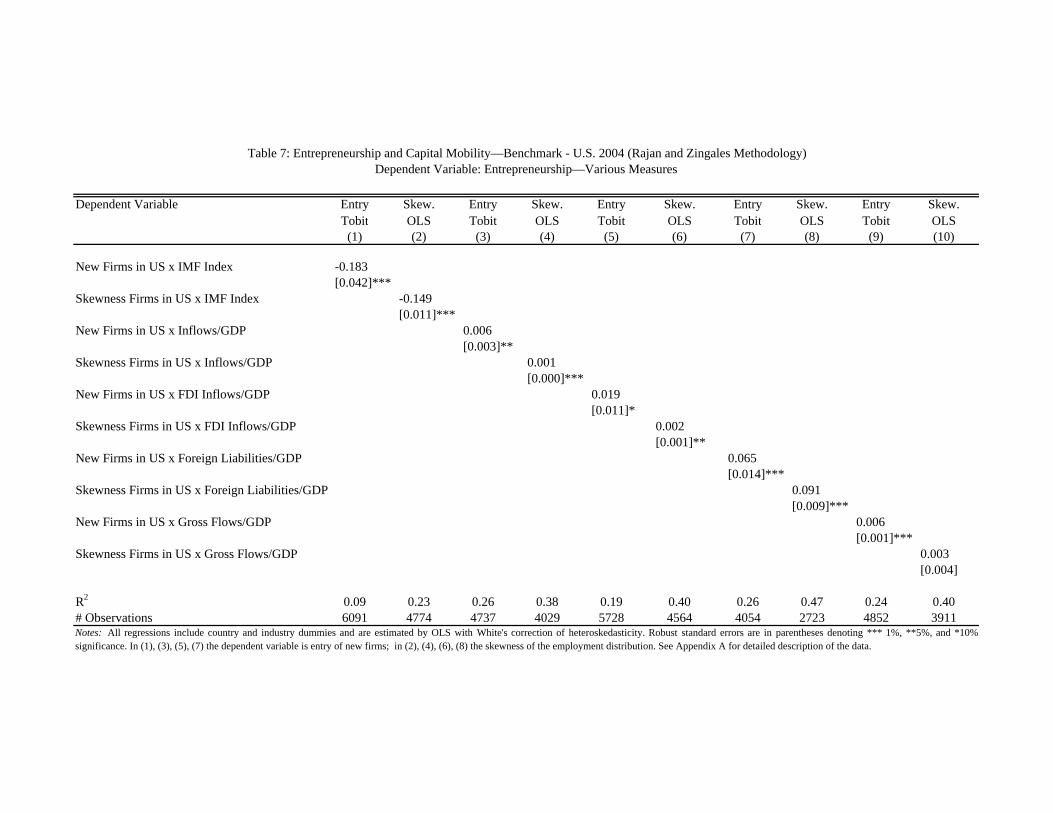
Dependent Variable Entry Skew. Entry Skew. Entry Skew. Entry Skew. Entry Skew.Tobit OLS Tobit OLS Tobit OLS Tobit OLS Tobit OLS(1) (2) (3) (4) (5) (6) (7) (8) (9) (10)
New Firms in US x IMF Index -0.183[0.042]***
Skewness Firms in US x IMF Index -0.149[0.011]***
New Firms in US x Inflows/GDP 0.006[0.003]**
Skewness Firms in US x Inflows/GDP 0.001[0.000]***
New Firms in US x FDI Inflows/GDP 0.019[0.011]*
Skewness Firms in US x FDI Inflows/GDP 0.002[0.001]**
New Firms in US x Foreign Liabilities/GDP 0.065[0.014]***
Skewness Firms in US x Foreign Liabilities/GDP 0.091[0.009]***
New Firms in US x Gross Flows/GDP 0.006[0.001]***
Skewness Firms in US x Gross Flows/GDP 0.003[0.004]
R2 0.09 0.23 0.26 0.38 0.19 0.40 0.26 0.47 0.24 0.40# Observations 6091 4774 4737 4029 5728 4564 4054 2723 4852 3911Notes: All regressions include country and industry dummies and are estimated by OLS with White's correction of heteroskedasticity. Robust standard errors are in parentheses denoting *** 1%, **5%, and *10%significance. In (1), (3), (5), (7) the dependent variable is entry of new firms; in (2), (4), (6), (8) the skewness of the employment distribution. See Appendix A for detailed description of the data.
Table 7: Entrepreneurship and Capital Mobility—Benchmark - U.S. 2004 (Rajan and Zingales Methodology)Dependent Variable: Entrepreneurship—Various Measures
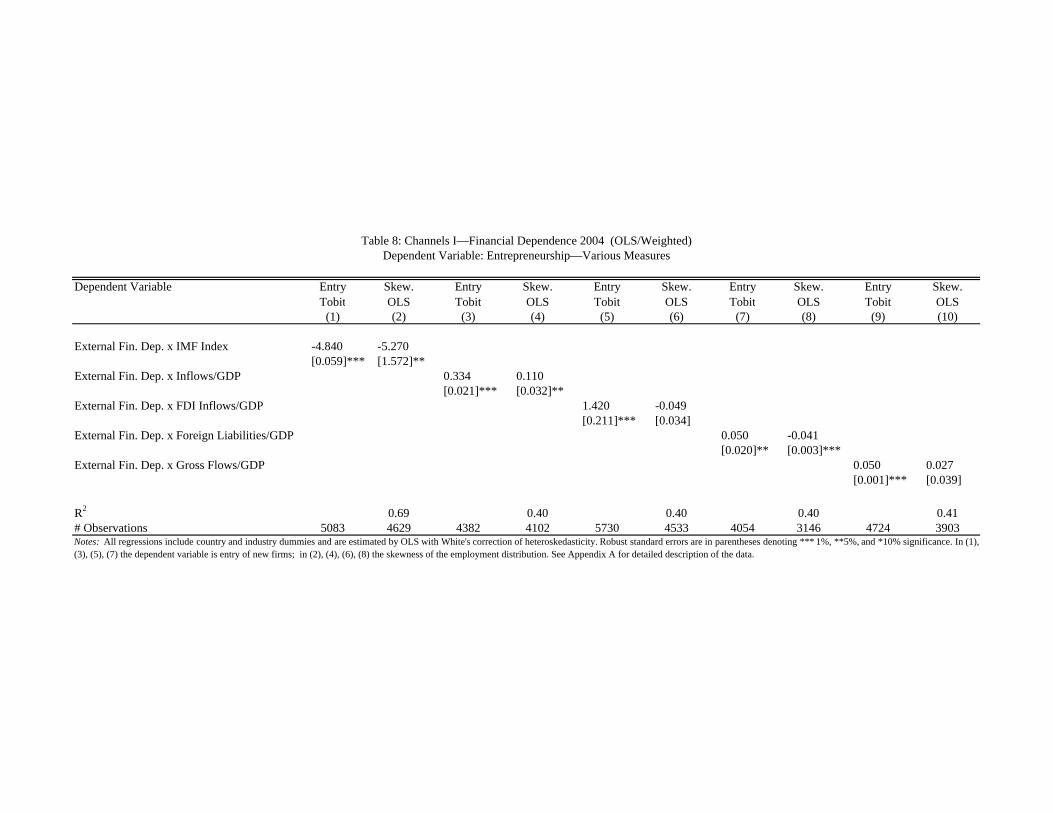
Dependent Variable Entry Skew. Entry Skew. Entry Skew. Entry Skew. Entry Skew.Tobit OLS Tobit OLS Tobit OLS Tobit OLS Tobit OLS
(1) (2) (3) (4) (5) (6) (7) (8) (9) (10)
External Fin. Dep. x IMF Index -4.840 -5.270[0.059]*** [1.572]**
External Fin. Dep. x Inflows/GDP 0.334 0.110[0.021]*** [0.032]**
External Fin. Dep. x FDI Inflows/GDP 1.420 -0.049[0.211]*** [0.034]
External Fin. Dep. x Foreign Liabilities/GDP 0.050 -0.041[0.020]** [0.003]***
External Fin. Dep. x Gross Flows/GDP 0.050 0.027[0.001]*** [0.039]
R2 0.69 0.40 0.40 0.40 0.41# Observations 5083 4629 4382 4102 5730 4533 4054 3146 4724 3903
Table 8: Channels I—Financial Dependence 2004 (OLS/Weighted)Dependent Variable: Entrepreneurship—Various Measures
Notes: All regressions include country and industry dummies and are estimated by OLS with White's correction of heteroskedasticity. Robust standard errors are in parentheses denoting *** 1%, **5%, and *10% significance. In (1),(3), (5), (7) the dependent variable is entry of new firms; in (2), (4), (6), (8) the skewness of the employment distribution. See Appendix A for detailed description of the data.
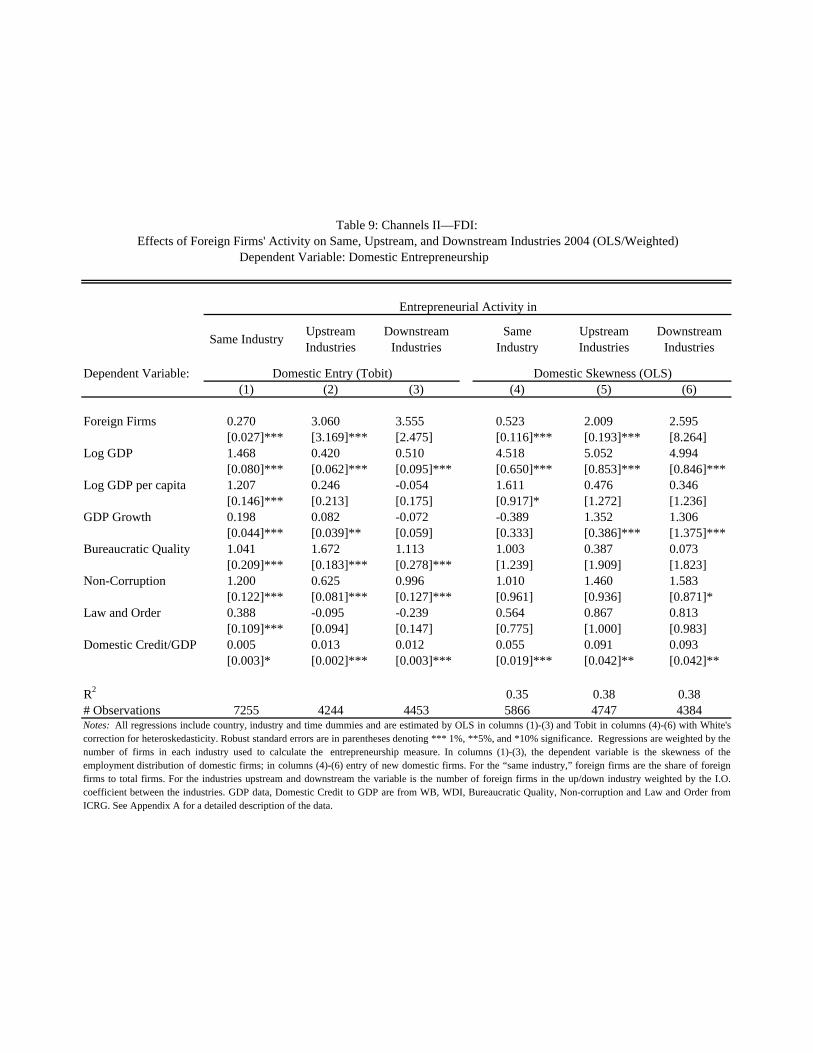
Same Industry Upstream Industries
Downstream Industries
Same Industry
Upstream Industries
Downstream Industries
Dependent Variable:(1) (2) (3) (4) (5) (6)
Foreign Firms 0.270 3.060 3.555 0.523 2.009 2.595
[0.027]*** [3.169]*** [2.475] [0.116]*** [0.193]*** [8.264]Log GDP 1.468 0.420 0.510 4.518 5.052 4.994
[0.080]*** [0.062]*** [0.095]*** [0.650]*** [0.853]*** [0.846]***Log GDP per capita 1.207 0.246 -0.054 1.611 0.476 0.346
[0.146]*** [0.213] [0.175] [0.917]* [1.272] [1.236]GDP Growth 0.198 0.082 -0.072 -0.389 1.352 1.306
[0.044]*** [0.039]** [0.059] [0.333] [0.386]*** [1.375]***Bureaucratic Quality 1.041 1.672 1.113 1.003 0.387 0.073
[0.209]*** [0.183]*** [0.278]*** [1.239] [1.909] [1.823]Non-Corruption 1.200 0.625 0.996 1.010 1.460 1.583
[0.122]*** [0.081]*** [0.127]*** [0.961] [0.936] [0.871]*Law and Order 0.388 -0.095 -0.239 0.564 0.867 0.813
[0.109]*** [0.094] [0.147] [0.775] [1.000] [0.983]Domestic Credit/GDP 0.005 0.013 0.012 0.055 0.091 0.093
[0.003]* [0.002]*** [0.003]*** [0.019]*** [0.042]** [0.042]**
R2 0.35 0.38 0.38# Observations 7255 4244 4453 5866 4747 4384
Domestic Entry (Tobit) Domestic Skewness (OLS)
Notes: All regressions include country, industry and time dummies and are estimated by OLS in columns (1)-(3) and Tobit in columns (4)-(6) with White'scorrection for heteroskedasticity. Robust standard errors are in parentheses denoting *** 1%, **5%, and *10% significance. Regressions are weighted by thenumber of firms in each industry used to calculate the entrepreneurship measure. In columns (1)-(3), the dependent variable is the skewness of theemployment distribution of domestic firms; in columns (4)-(6) entry of new domestic firms. For the “same industry,” foreign firms are the share of foreignfirms to total firms. For the industries upstream and downstream the variable is the number of foreign firms in the up/down industry weighted by the I.O.coefficient between the industries. GDP data, Domestic Credit to GDP are from WB, WDI, Bureaucratic Quality, Non-corruption and Law and Order fromICRG. See Appendix A for a detailed description of the data.
Table 9: Channels II—FDI:Effects of Foreign Firms' Activity on Same, Upstream, and Downstream Industries 2004 (OLS/Weighted)
Dependent Variable: Domestic Entrepreneurship
Entrepreneurial Activity in
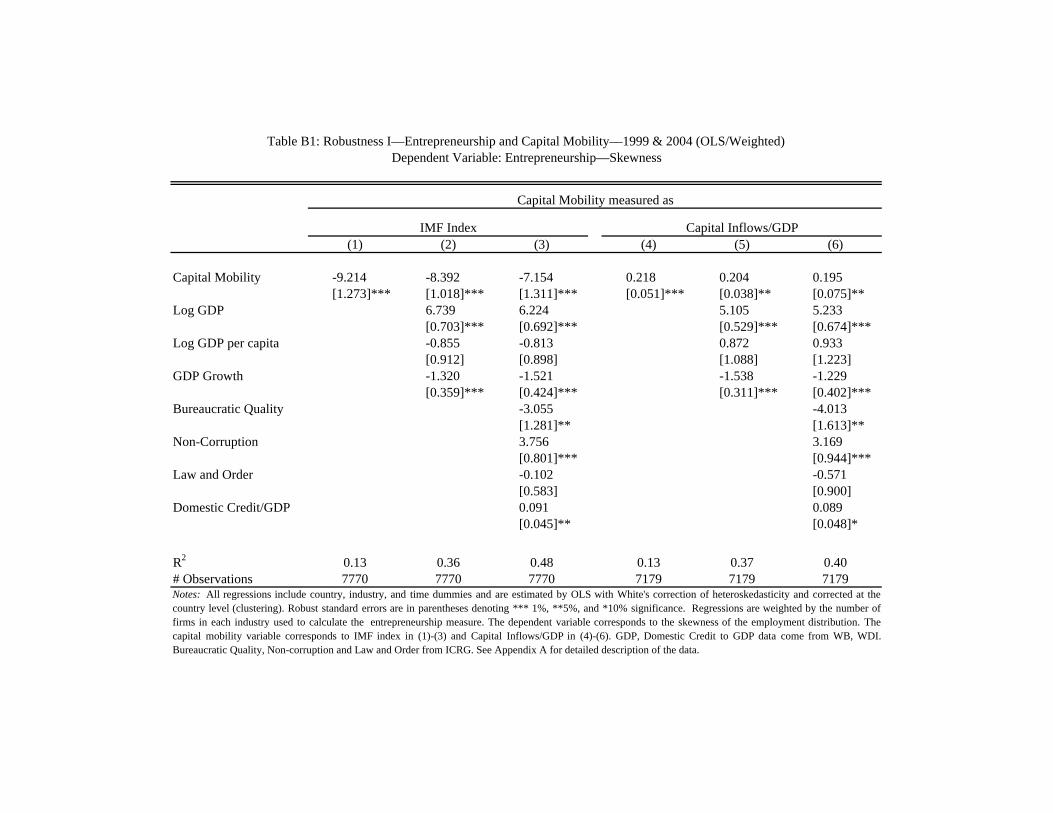
(1) (2) (3) (4) (5) (6)
Capital Mobility -9.214 -8.392 -7.154 0.218 0.204 0.195[1.273]*** [1.018]*** [1.311]*** [0.051]*** [0.038]** [0.075]**
Log GDP 6.739 6.224 5.105 5.233[0.703]*** [0.692]*** [0.529]*** [0.674]***
Log GDP per capita -0.855 -0.813 0.872 0.933[0.912] [0.898] [1.088] [1.223]
GDP Growth -1.320 -1.521 -1.538 -1.229[0.359]*** [0.424]*** [0.311]*** [0.402]***
Bureaucratic Quality -3.055 -4.013[1.281]** [1.613]**
Non-Corruption 3.756 3.169[0.801]*** [0.944]***
Law and Order -0.102 -0.571[0.583] [0.900]
Domestic Credit/GDP 0.091 0.089[0.045]** [0.048]*
R2 0.13 0.36 0.48 0.13 0.37 0.40# Observations 7770 7770 7770 7179 7179 7179Notes: All regressions include country, industry, and time dummies and are estimated by OLS with White's correction of heteroskedasticity and corrected at thecountry level (clustering). Robust standard errors are in parentheses denoting *** 1%, **5%, and *10% significance. Regressions are weighted by the number offirms in each industry used to calculate the entrepreneurship measure. The dependent variable corresponds to the skewness of the employment distribution. Thecapital mobility variable corresponds to IMF index in (1)-(3) and Capital Inflows/GDP in (4)-(6). GDP, Domestic Credit to GDP data come from WB, WDI.Bureaucratic Quality, Non-corruption and Law and Order from ICRG. See Appendix A for detailed description of the data.
Table B1: Robustness I—Entrepreneurship and Capital Mobility—1999 & 2004 (OLS/Weighted)Dependent Variable: Entrepreneurship—Skewness
Capital Mobility measured as
IMF Index Capital Inflows/GDP
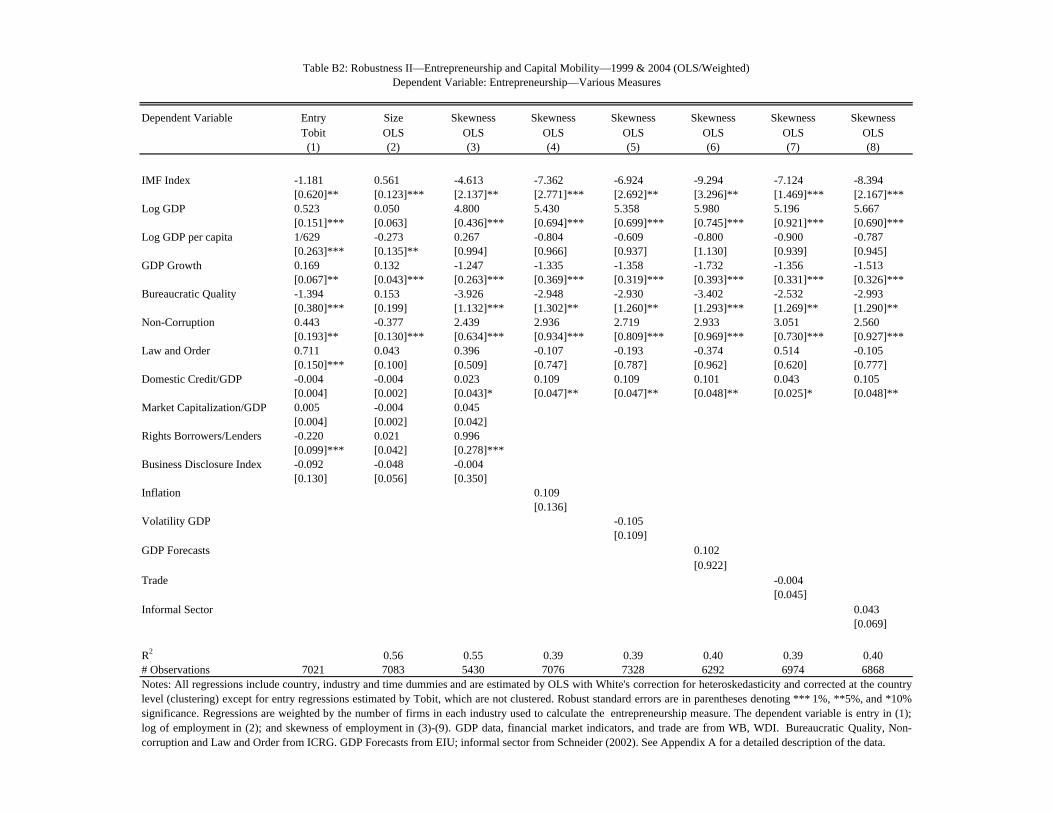
Dependent Variable Entry Size Skewness Skewness Skewness Skewness Skewness SkewnessTobit OLS OLS OLS OLS OLS OLS OLS(1) (2) (3) (4) (5) (6) (7) (8)
IMF Index -1.181 0.561 -4.613 -7.362 -6.924 -9.294 -7.124 -8.394[0.620]** [0.123]*** [2.137]** [2.771]*** [2.692]** [3.296]** [1.469]*** [2.167]***
Log GDP 0.523 0.050 4.800 5.430 5.358 5.980 5.196 5.667[0.151]*** [0.063] [0.436]*** [0.694]*** [0.699]*** [0.745]*** [0.921]*** [0.690]***
Log GDP per capita 1/629 -0.273 0.267 -0.804 -0.609 -0.800 -0.900 -0.787[0.263]*** [0.135]** [0.994] [0.966] [0.937] [1.130] [0.939] [0.945]
GDP Growth 0.169 0.132 -1.247 -1.335 -1.358 -1.732 -1.356 -1.513[0.067]** [0.043]*** [0.263]*** [0.369]*** [0.319]*** [0.393]*** [0.331]*** [0.326]***
Bureaucratic Quality -1.394 0.153 -3.926 -2.948 -2.930 -3.402 -2.532 -2.993[0.380]*** [0.199] [1.132]*** [1.302]** [1.260]** [1.293]*** [1.269]** [1.290]**
Non-Corruption 0.443 -0.377 2.439 2.936 2.719 2.933 3.051 2.560[0.193]** [0.130]*** [0.634]*** [0.934]*** [0.809]*** [0.969]*** [0.730]*** [0.927]***
Law and Order 0.711 0.043 0.396 -0.107 -0.193 -0.374 0.514 -0.105[0.150]*** [0.100] [0.509] [0.747] [0.787] [0.962] [0.620] [0.777]
Domestic Credit/GDP -0.004 -0.004 0.023 0.109 0.109 0.101 0.043 0.105[0.004] [0.002] [0.043]* [0.047]** [0.047]** [0.048]** [0.025]* [0.048]**
Market Capitalization/GDP 0.005 -0.004 0.045[0.004] [0.002] [0.042]
Rights Borrowers/Lenders -0.220 0.021 0.996[0.099]*** [0.042] [0.278]***
Business Disclosure Index -0.092 -0.048 -0.004[0.130] [0.056] [0.350]
Inflation 0.109[0.136]
Volatility GDP -0.105[0.109]
GDP Forecasts 0.102[0.922]
Trade -0.004[0.045]
Informal Sector 0.043[0.069]
R2 0.56 0.55 0.39 0.39 0.40 0.39 0.40# Observations 7021 7083 5430 7076 7328 6292 6974 6868Notes: All regressions include country, industry and time dummies and are estimated by OLS with White's correction for heteroskedasticity and corrected at the countrylevel (clustering) except for entry regressions estimated by Tobit, which are not clustered. Robust standard errors are in parentheses denoting *** 1%, **5%, and *10%significance. Regressions are weighted by the number of firms in each industry used to calculate the entrepreneurship measure. The dependent variable is entry in (1);log of employment in (2); and skewness of employment in (3)-(9). GDP data, financial market indicators, and trade are from WB, WDI. Bureaucratic Quality, Non-corruption and Law and Order from ICRG. GDP Forecasts from EIU; informal sector from Schneider (2002). See Appendix A for a detailed description of the data.
Table B2: Robustness II—Entrepreneurship and Capital Mobility—1999 & 2004 (OLS/Weighted)Dependent Variable: Entrepreneurship—Various Measures
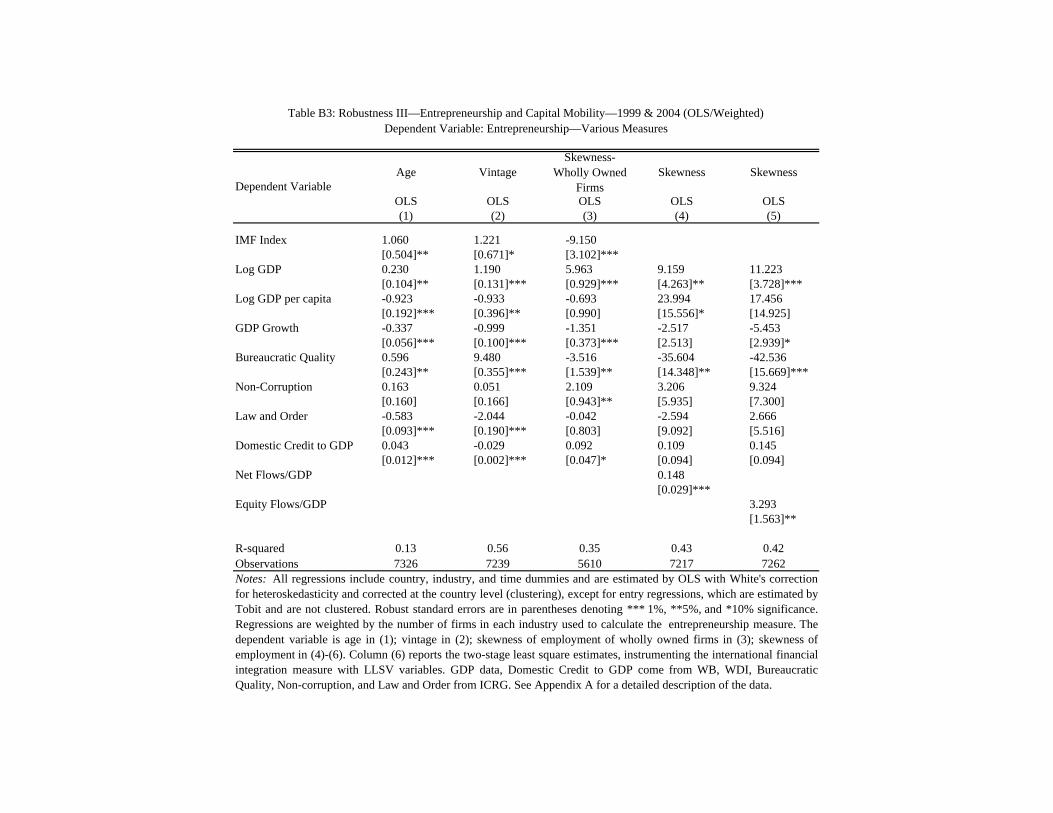
Dependent VariableAge Vintage
Skewness- Wholly Owned
FirmsSkewness Skewness
OLS OLS OLS OLS OLS(1) (2) (3) (4) (5)
IMF Index 1.060 1.221 -9.150[0.504]** [0.671]* [3.102]***
Log GDP 0.230 1.190 5.963 9.159 11.223[0.104]** [0.131]*** [0.929]*** [4.263]** [3.728]***
Log GDP per capita -0.923 -0.933 -0.693 23.994 17.456[0.192]*** [0.396]** [0.990] [15.556]* [14.925]
GDP Growth -0.337 -0.999 -1.351 -2.517 -5.453[0.056]*** [0.100]*** [0.373]*** [2.513] [2.939]*
Bureaucratic Quality 0.596 9.480 -3.516 -35.604 -42.536[0.243]** [0.355]*** [1.539]** [14.348]** [15.669]***
Non-Corruption 0.163 0.051 2.109 3.206 9.324[0.160] [0.166] [0.943]** [5.935] [7.300]
Law and Order -0.583 -2.044 -0.042 -2.594 2.666[0.093]*** [0.190]*** [0.803] [9.092] [5.516]
Domestic Credit to GDP 0.043 -0.029 0.092 0.109 0.145[0.012]*** [0.002]*** [0.047]* [0.094] [0.094]
Net Flows/GDP 0.148[0.029]***
Equity Flows/GDP 3.293[1.563]**
R-squared 0.13 0.56 0.35 0.43 0.42Observations 7326 7239 5610 7217 7262
Table B3: Robustness III—Entrepreneurship and Capital Mobility—1999 & 2004 (OLS/Weighted)Dependent Variable: Entrepreneurship—Various Measures
Notes: All regressions include country, industry, and time dummies and are estimated by OLS with White's correctionfor heteroskedasticity and corrected at the country level (clustering), except for entry regressions, which are estimated byTobit and are not clustered. Robust standard errors are in parentheses denoting *** 1%, **5%, and *10% significance.Regressions are weighted by the number of firms in each industry used to calculate the entrepreneurship measure. Thedependent variable is age in (1); vintage in (2); skewness of employment of wholly owned firms in (3); skewness ofemployment in (4)-(6). Column (6) reports the two-stage least square estimates, instrumenting the international financialintegration measure with LLSV variables. GDP data, Domestic Credit to GDP come from WB, WDI, BureaucraticQuality, Non-corruption, and Law and Order from ICRG. See Appendix A for a detailed description of the data.
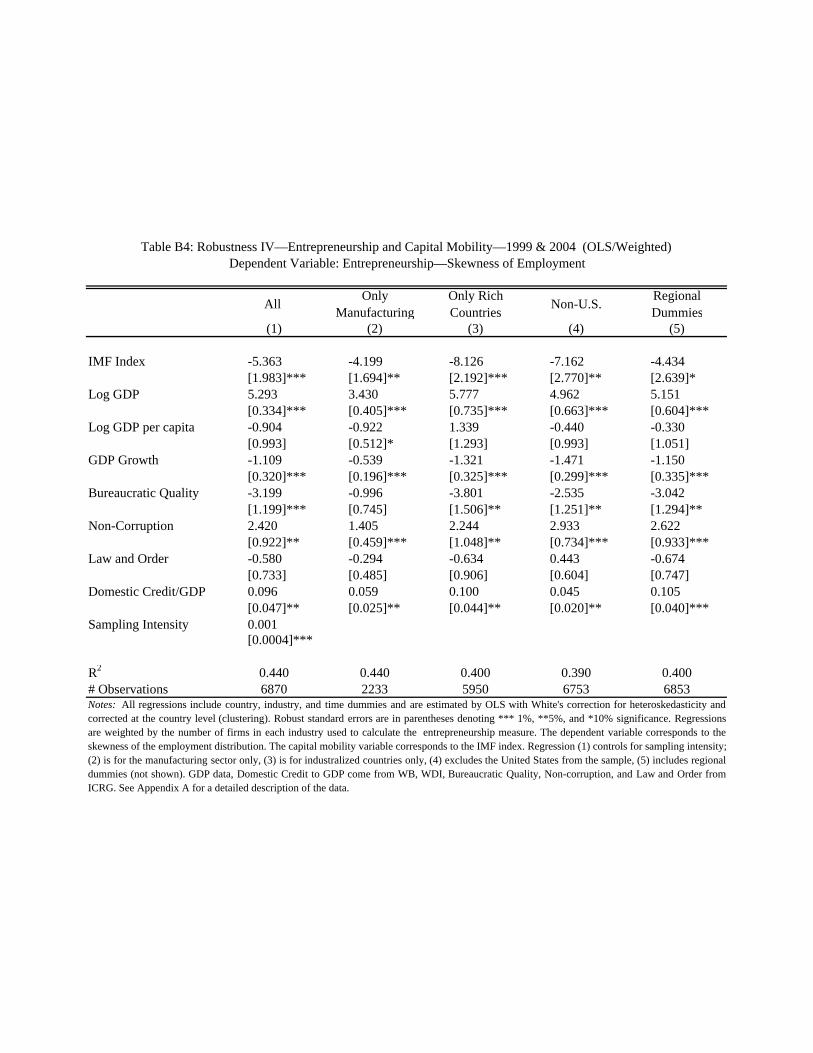
All Only Manufacturing
Only Rich Countries Non-U.S. Regional
Dummies(1) (2) (3) (4) (5)
IMF Index -5.363 -4.199 -8.126 -7.162 -4.434[1.983]*** [1.694]** [2.192]*** [2.770]** [2.639]*
Log GDP 5.293 3.430 5.777 4.962 5.151[0.334]*** [0.405]*** [0.735]*** [0.663]*** [0.604]***
Log GDP per capita -0.904 -0.922 1.339 -0.440 -0.330[0.993] [0.512]* [1.293] [0.993] [1.051]
GDP Growth -1.109 -0.539 -1.321 -1.471 -1.150[0.320]*** [0.196]*** [0.325]*** [0.299]*** [0.335]***
Bureaucratic Quality -3.199 -0.996 -3.801 -2.535 -3.042[1.199]*** [0.745] [1.506]** [1.251]** [1.294]**
Non-Corruption 2.420 1.405 2.244 2.933 2.622[0.922]** [0.459]*** [1.048]** [0.734]*** [0.933]***
Law and Order -0.580 -0.294 -0.634 0.443 -0.674[0.733] [0.485] [0.906] [0.604] [0.747]
Domestic Credit/GDP 0.096 0.059 0.100 0.045 0.105[0.047]** [0.025]** [0.044]** [0.020]** [0.040]***
Sampling Intensity 0.001[0.0004]***
R2 0.440 0.440 0.400 0.390 0.400# Observations 6870 2233 5950 6753 6853Notes: All regressions include country, industry, and time dummies and are estimated by OLS with White's correction for heteroskedasticity andcorrected at the country level (clustering). Robust standard errors are in parentheses denoting *** 1%, **5%, and *10% significance. Regressionsare weighted by the number of firms in each industry used to calculate the entrepreneurship measure. The dependent variable corresponds to theskewness of the employment distribution. The capital mobility variable corresponds to the IMF index. Regression (1) controls for sampling intensity; (2) is for the manufacturing sector only, (3) is for industralized countries only, (4) excludes the United States from the sample, (5) includes regionaldummies (not shown). GDP data, Domestic Credit to GDP come from WB, WDI, Bureaucratic Quality, Non-corruption, and Law and Order fromICRG. See Appendix A for a detailed description of the data.
Table B4: Robustness IV—Entrepreneurship and Capital Mobility—1999 & 2004 (OLS/Weighted)Dependent Variable: Entrepreneurship—Skewness of Employment
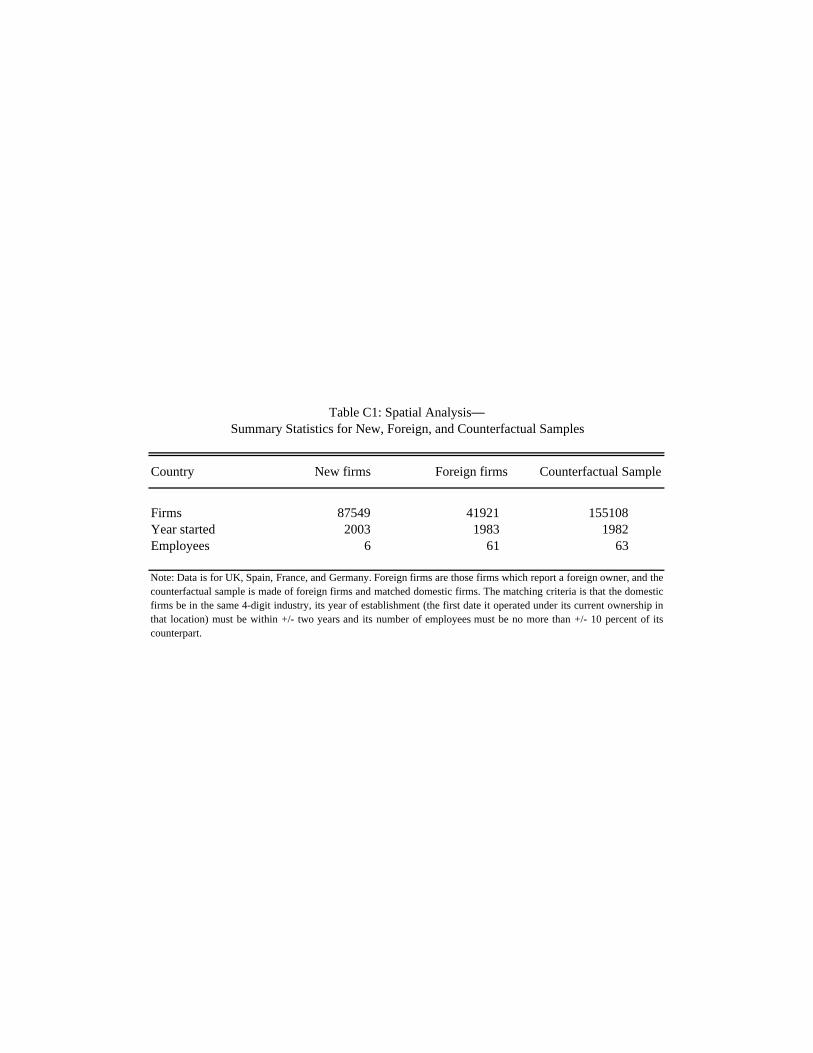
Country New firms Foreign firms Counterfactual Sample
Firms 87549 41921 155108Year started 2003 1983 1982Employees 6 61 63
Table C1: Spatial Analysis—
Note: Data is for UK, Spain, France, and Germany. Foreign firms are those firms which report a foreign owner, and thecounterfactual sample is made of foreign firms and matched domestic firms. The matching criteria is that the domesticfirms be in the same 4-digit industry, its year of establishment (the first date it operated under its current ownership inthat location) must be within +/- two years and its number of employees must be no more than +/- 10 percent of itscounterpart.
Summary Statistics for New, Foreign, and Counterfactual Samples
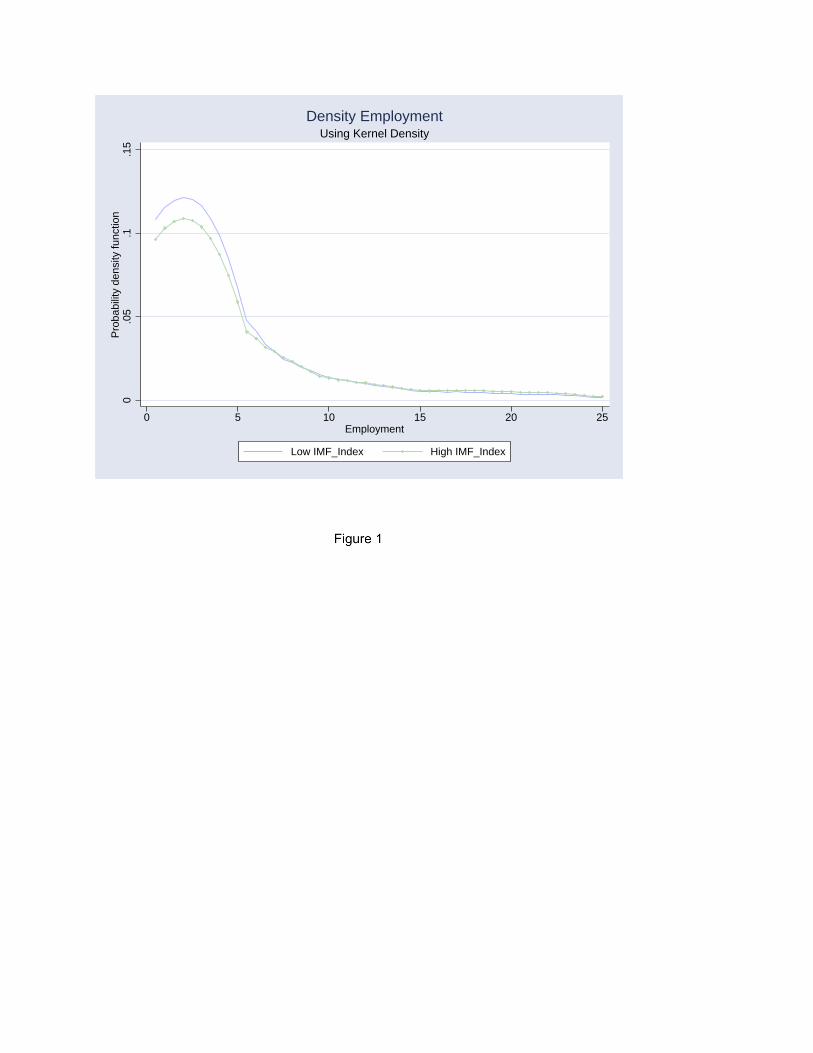
0.0
5.1
.15
Pro
babi
lity
dens
ity fu
nctio
n
0 5 10 15 20 25Employment
Low IMF_Index High IMF_Index
Using Kernel DensityDensity Employment
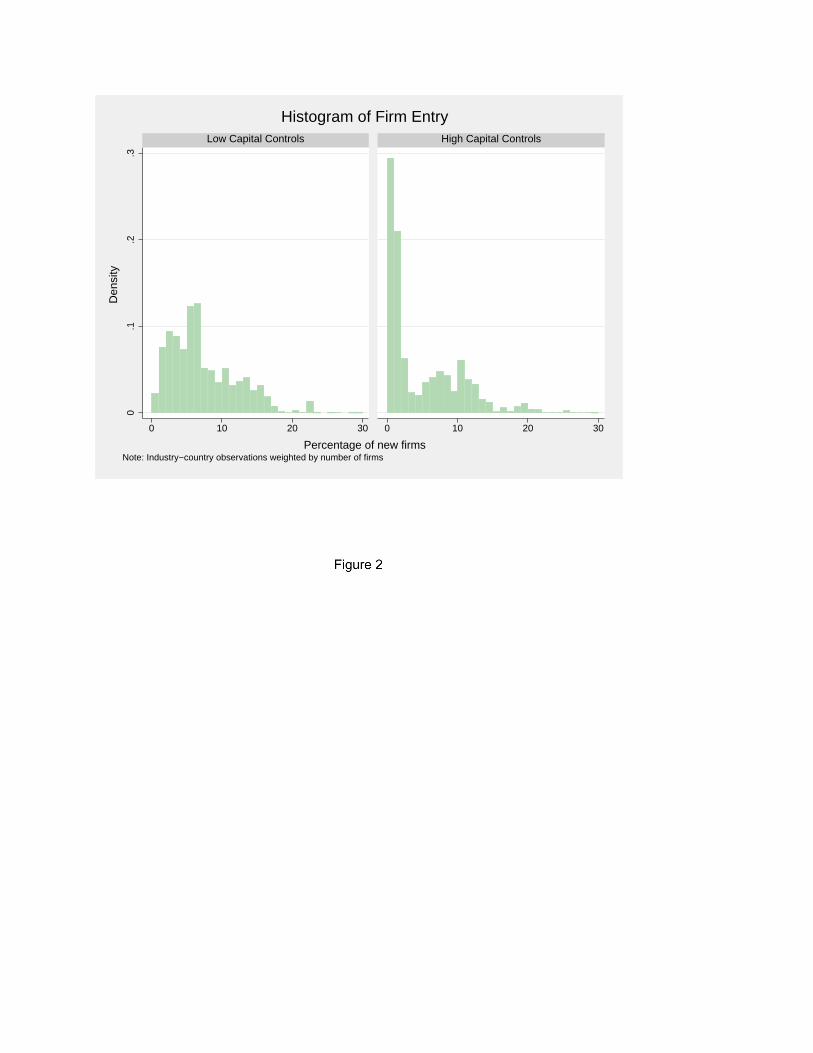
0.1
.2.3
0 10 20 30 0 10 20 30
Low Capital Controls High Capital Controls
Den
sity
Percentage of new firmsNote: Industry−country observations weighted by number of firms
Histogram of Firm Entry