Embed Size (px)
Citation preview
The Information Content of 10-K Narratives:
Comparing MD&A and Footnotes Disclosures
Amir Amel-Zadeh∗ Said Business School University of Oxford
Jonathan Faasse University of Cambridge Judge Business School
September 2016
∗ Corresponding author. University of Oxford, Said Business School, Park End Street, Oxford OX1 1HP, UK. [email protected]. We thank Terrance Blackburne (discussant), Gishan Dissanaike, Ken Peasnell, Geoff Meeks and seminar participants at the 2016 AAA Annual Meeting, and the University of Cambridge for helpful comments.
The Information Content of 10-K Narratives:
Comparing MD&A and Footnotes Disclosures
Abstract
This paper examines the characteristics and variations within firms’ 10-K filings over a 20
year time period. We find that investors’ reaction to textual characteristics of the MD&A in
10-Ks is much stronger and more timely than their reaction to textual characteristics of the
notes to the financial statements. Characteristics of the MD&A and footnotes are also
predictive of future returns, volatility, and firm profitability. Our evidence suggests that
investor pay limited attention to the footnotes compared to the MD&A and that firms exploit
biases in investors’ information processing through their disclosure choices within 10-K
filings.
JEL classification: G02, G12, G14, M41
Keywords: 10-K filing, MD&A, footnotes, disclosure, textual analysis
1
1. Introduction
Are companies’ annual 10-K filings informative to investors? And if so, what parts of a
10-K are informative? By the time 10-K reports are filed most of the key financial
information such as earnings, sales growth etc., is already in the public domain. Not
surprisingly, early evidence fails to find any significant market reaction to 10-K filings
(Easton and Zmijewski, 1993) or only finds a limited reaction to these filings once prior
earnings releases are taken into account (Li and Ramesh, 2009). On the other hand, more
recent evidence from textual analyses of 10-K reports finds incremental information content
in the tone of the text in the 10-K (Feldman, Givindaraj, Livnat, and Segal, 2010; Loughran
and McDonald, 2011), in its readability (Li, 2008; Loughran and McDonald 2014), in year-
on-year changes to the MD&A section (Brown and Tucker, 2011; Cohen, Malloy, and
Nguyen, 2015) and in specific footnote disclosures (Peterson, 2012; Peterson, Schmardebeck,
and Wilks, 2015).1 These findings seem to suggest that there is incremental information
about a firm’s prospects beyond the financial statements in the narrative text of the 10-Ks.
Previous research has focused primarily on the stock market’s reaction to individual
components of 10-K filings, such as the MD&A alone or particular types of footnotes (e.g.
pensions, stock options, significant accounting policies) in isolation, or conversely to the 10-
K filing as a single piece of homogeneous information. Yet, the psychology literature
provides ample evidence that attention diverts depending on the salience of stimuli––their
prominence and contrast with other information in the environment (Fiske and Taylor 1991).
As a result, it matters not only what is disclosed, but also where and in combination with
what else. For example, if salience of the footnotes to the financial statements in the 10-K is
low (or lower than of the Management Discussion and Analysis), investors might fail to
process the information provided in them; or if information is abstract and heavily loaded
1 The practitioner literature also provides ample anecdotal evidence of value in reading companies’ annual reports (e.g., Schilit and Perler 2010).
2
with statistical and quantitative data, people tend to underweight it in their decision making
(Kahneman and Tversky, 1973; Nisbett and Ross, 1980). As a consequence, some
information in 10-Ks might be revealed less completely and less immediately in market
prices because investors under-react to it (Hirshleifer 2001; Bloomfield 2002).
In this paper we examine and compare the information content of several characteristics
of two of the most prominent narrative sections in 10-Ks: the Management’s Discussion &
Analysis of Financial Condition and Results of Operations (commonly known as
Management’s Discussion & Analysis, or the MD&A) and the Notes to the Financial
Statements (footnotes). Unlike previous work, we study 10-K filings in their entirety, while
controlling for correlated information within a filing (i.e., information that is reported in both
the footnotes and the MD&A). Jointly examining MD&A and footnote disclosures allows us
to infer which part of the narrative in a 10-K filing investors pay attention to, controlling for
information characteristics in different parts of a 10-K. We study the cross-sectional variation
in the market reaction to firms’ MD&A and footnote disclosures and their informativeness
about future stock returns and profitability concentrating on textual characteristics of these
sections within industries, within firms, and across time.
Prior evidence suggests that investors have limited attention and suffer from information
processing biases when interpreting company disclosures (Hirshleifer and Teoh, 2003; Peng
and Xiong 2006) and that placement and categorization of accounting information plays an
important role for their interpretation (Libby, Bloomfield, and Nelson, 2002). Limited
attention leads investors to use short cuts, and use information in the way it is displayed or
presented instead of adjusting it if necessary (Slovic, 1972; Payne et al 1993). Information
might thus not be fully processed or only processed with errors by investors.
Investors’ limited rationality then affords managers the opportunity to strategically report
information to their advantage (Schrand and Walther, 2000) and to exploit differences in the
3
visibility of disclosure outlets. For example, managers might strategically shift or omit
pessimistic language from a more visible disclosure outlet to another less salient one (Davis
and Tama-Sweet, 2012) or opportunistically structure annual reports to hide adverse
information from investors (Li, 2008).
Although 10-K filings are legally required, i.e., mandatory, disclosures, managers have
some discretion in content and form of the disclosure (Beyer, Cohen, Lys, & Walther, 2010;
Schipper, 2007; Cole & Jones, 2005), as for example in their choice of words, their
judgement of what is material and requires disclosure, and in their choice of how much
forward-looking information to disclose. There are substantial differences between the two
main narrative sections, however: the MD&A contains more contextual disclosure, with safe
harbour provisions for forward-looking statements and significant discretion for
management; the footnotes tend to be more technical, must comply with accounting
standards, and are audited. It is thus likely that these sections differ in the type of information
they contain and in the way the same information is presented and hence in their
informativeness and ease of interpretation for investors. In this paper we demonstrate that
several characteristics of these disclosures on their own and relative to each other are
predictive of contemporaneous and future stock returns, volatility and profitability.
We build a sample of MD&A and footnote disclosures from 10-K filings for all US firms
that file with the SEC, from 1993 (the start of EDGAR electronic filing) to 2014. From each
10-K we computationally extract the text of two sections, the MD&A and the footnotes. The
MD&A and footnotes provide the vast majority of narrative disclosures in 10-K reports. We
construct a number of variables that measure the characteristics of these disclosures. We
measure their (1) length and (2) the amount of year-on-year changes in the text to capture
information content and new information; (3) the similarity of a particular firm’s MD&A and
footnotes to that of other firms in the same industry reflecting idiosyncratic and industry
4
information; (4) the similarity between the MD&A and footnotes within a given firm-year;
reflecting common information to both sections and (5) the tone in and differences in tone
between the MD&A and footnotes to capture sentiment and strategic disclosure.
Our main findings are as follows. MD&A disclosures are more informative to investors
than footnote disclosures in the immediate days surrounding the 10-K filing, particularly with
respect to firm specific information as opposed to information common to the industry. Our
results suggest that firms’10-K narratives that break from the default choice of simply
repeating last year’s narrative or from being boilerplate disclosures commonly used within
the industry are informative to investors. For example, a one standard deviation of MD&A
year-on-year textual change is associated with a 37 basis point increase in absolute
announcement returns and a one standard deviation increase in MD&A industry similarity is
associated with 13 basis points lower absolute returns. At the same time, investors seem to
pay less attention to footnotes around the filing days, find them less informative or require
more time to process them compared to MD&A disclosures.
More strikingly, we find that the change in the MD&A is strongly negatively associated
with filing abnormal returns as is less congruence between the MD&A and footnotes. A
departure from previous year’s MD&A text and gaps between what managers convey in the
MD&A and what they are required to disclose in the footnotes on average signal negative
information to investors. However, consistent with limited attention or high processing costs,
we also find that investors generally under-react to the negative information as these
characteristics are highly predictive of negative future (one year ahead) stock returns after
controlling for risk factors as well as associated with significantly lower future operating
performance.
We further find evidence that positive tone in the MD&A is predictive of higher future
risk-adjusted returns while positive tone in the footnotes is predictive of negative future risk-
5
adjusted returns as well as negative future accounting performance indicating that
management might be trying to obscure negative information contained in the quantitative
details of the footnotes with a positive tone in their text. Consistent with this interpretation we
document a U-shaped relationship between “sentiment spread” (the difference between
MD&A sentiment and footnote sentiment) and future returns and profitability. For profitable
firms, sentiment spread is predictive of improved future performance. However, for firms in
the bottom quartile of profitability, the further management’s tone in the MD&A diverges
from the footnote tone levels, the worse is future performance.
The findings in this study suggest that investors have difficulties in reading and
processing the complex information contained within a 10-K filing in a timely manner. Our
results are also suggestive of managerial obfuscation in the face of poor results, particularly
in the MD&A section that attracts more attention from investors and which affords
management more discretion in their disclosure.
Our study contributes to the literature that investigates the informativeness of 10-K
filings and their textual characteristics. Event studies on filings of 10-K reports have
produced mixed results, in particular after information that is released in earnings
announcements is taken into account (Easton and Zmijewski, 1993; Li and Ramesh, 2009;
You and Zhang 2009). However, there is a growing literature that uses textual analyses of 10-
K reports to examine the information content of the tone in these reports and finds the tone to
be informative (Feldman, Givindaraj, Livnat, and Segal, 2010; Loughran and McDonald,
2011). Other studies use textual characteristics to measure the readability of 10-K reports
and find that firms with more complex reports have lower future performance (Li, 2008;
Loughran and McDonald 2014). Changes in the text from one reporting period to the next
also seem to reflect negative information and are associated with negative future stock returns
(Brown and Tucker, 2011; Cohen, Malloy, and Nguyen, 2015).
6
Our paper contributes to this line of research by comparing the narratives in MD&A and
footnote disclosures, two of the most prominent narrative sections in 10-K filings, across and
within firms for a large sample over two decades. Prior studies do not allow us to draw
conclusions about which sections in the 10-K contain relatively more valuable information
for investors, which characteristics of these sections are important and whether there is
information content in industry and firm comparisons as well as when comparing different
sections within the same 10-K. We examine several textual characteristics of the narratives in
the MD&A and the footnotes to explore their information content and test their predictive
power for future stock returns and profitability.
The paper proceeds as follows. Section 2 reviews the existing literature and develops our
key hypotheses. Section 3 discusses methodology and data. Section 4 presents summary
statistics and Section 5 follows with the main regression results and their interpretation.
Section 6 concludes.
2. Related literature and hypotheses
2.1. Prior literature
Research on investor reactions to 10-K filings finds that investors react promptly to the
filing of 10-Ks, suggesting that they contain marginal information above what is contained in
the earnings announcement prior to the 10-K disclosure (Griffin, 2003; You and Zhang
2009). You and Zhang (2009) show that abnormal announcement returns around 10-K filing
dates are positively associated with future firm profitability. However, the authors also
document a stock price drift over the following 12 months and interpret this as evidence of
investor underreaction to the information in the 10-K filing. They further find that the under-
reaction is stronger for firms with more complex 10-K filings, as measured by filing length.
These findings stand in contrast to earlier work that finds little support for investors
responding to 10-K and 10-Q report filings (Easton and Zmijewski, 1993). In concurrent
7
research to ours, Cohen, Malloy, and Ngyuen (2015) find that year-on-year changes in the
text of 10-K and 10-Q reports are predictive of future negative stock returns and future risk of
litigation.
Early research on textual analysis of financial reports studies the readability of corporate
annual reports. Schroeder and Gibson (1990), for example, calculate word length, sentence
length, use of passive voice, and Flesch Index for the Management’s Discussion and Analysis
(MD&A), footnotes, and President’s Letter for 40 Fortune 500 companies from 1986. The
authors explicitly acknowledge the inherent differences between the MD&A and footnotes as
disclosure outlets: “Flexibility is allowed in presenting the MD&A while specific guidelines
shape the footnotes. Also, there is a tendency to use boilerplate in footnote disclosure”
(Schroeder & Gibson, 1990, p. 80). The authors find significantly more use of the passive
voice in the MD&A, although there are no other differences in readability, word, or sentence
length between the MD&A and footnotes.2 In more recent research, Li (2008) finds that firms
with easier to read annual reports have more persistent positive earnings, and that poorly
performing firms have harder to read annual reports. Similarly, Loughran and McDonald
(2014) shows that the file size (in megabytes) of a 10-K is a simple and reliable measure of
readability, and is positively associated with abnormal return volatility in the post-filing
trading month, absolute standardised unexpected earnings (SUE), and analyst dispersion.3
Several papers investigate particular footnote disclosures. De Franco, Wong, and Zhou
(2011) use adjustments from Moody’s models as a proxy for financial note information (i.e.,
adjustments that are made after the filing of the 10-K), and find that 10-K filing returns are 2 Schroeder and Gibson (1990) cite papers highlighting the poor readability of footnotes from over 50 years ago, as for example in Soper and Dolphin Jr (1964). Li (2010b) provides a thorough literature review of earlier work on textual analysis of accounting disclosures. 3 The authors also argue that other measures of readability, such as the “fog”-index in Li (2008), which is a function of numbers of words per sentence and proportion of complex words, are not reliable. However, Bonsall IV, Leone, and Miller (2015) show that file size itself might not be a reliable measure of readability. They show that the measure is in fact driven by other exhibits in the 10-K filing (images, HTML, XML, and pdf attachments) and propose other “plain English” measures of readability, although these are not easily calculable. We note that there does not currently seem to be a consensus in the literature on the best (and most parsimonious) way to measure readability of 10-K reports.
8
related to the sign and magnitude of adjustments, as are equity analysts’ target prices and
recommendations. Peterson (2012) uses the length of the revenue recognition policy
disclosure (and the number of methods of recognition) as a proxy for accounting complexity.
This proxy is related to higher incidences of revenue misreporting restatements. Meanwhile,
Peterson, Schmardebeck, and Wilks (2015) measure accounting consistency as the cross-
sectional (within-industry) and year-on-year similarity of firms’ accounting policies footnote.
They find that firms with higher time series consistency have higher quality earnings. Higher
cross-sectional similarity is also related to lower absolute discretionary accruals.4
In their survey and interviews of public company CFOs and standard-setters Dichev,
Graham, Harvey, and Rajgopal (2013) highlight a number of footnote disclosure issues
associated with poor earnings quality, or earnings quality “red flags”. These include levels of
disclosure that differ from industry norms, changes in accounting policies, and complex
footnotes.
Research has also investigated the MD&A section of the 10-K in more detail (Bryan
1997; Feldman, Govindaraj, Livnat and Segal, 2010; Brown and Tucker, 2011). Feldman et
al. (2010) document an association between positive (negative) tone in the MD&A and higher
(lower) contemporaneous returns. Brown and Tucker (2011), on other hand, calculate the
year-on-year change of the text in the MD&A using a vector space model (VSM) cosine
similarity. They find that disclosures change in response to economic changes in the firm, and
that investors react to disclosure changes around the filing date of the 10-K. They find,
however, that this effect has diminished over time and attribute it to an increase in boilerplate
disclosure.
4 There are many other papers that show that individual footnotes contain valuable information about firm profitability and earnings characteristics (e.g. Graham, Raedy, & Shackelford, 2012)
9
2.2. Key hypotheses
We examine the information content of mandatory disclosures in 10-K filings that are
not necessarily driven by managerial incentives and agency considerations as are voluntary
disclosure choices. We are nevertheless mindful of discretion within and differences between
the various disclosure sections of a 10-K report. In particular, we expect the two main
narrative disclosure outlets in a 10-K filing––the Management’s Discussion and Analysis,
and the Notes to the Financial Statements––and differences between them in form and
visibility to determine where and how managers provide mandatory information to investors.
We base our empirical tests on hypotheses that follow from the prior literature. Prior
evidence suggests that the length of disclosures is related to their information content and
also their complexity (Schroeder and Gibson, 1990; You and Zhang, 2009). Consequently,
we expect the total length of the narrative disclosures in the MD&A and footnotes to be
associated with absolute and signed filing returns and test whether one of the outlets is on
average relatively more informative holding the total length constant. On the one hand, the
MD&A is considered one of the most important sections of the 10-K (Rogers and Grant
1997) and contains forward looking information protected by the safe harbour provisions of
the Private Securities Litigation Reform Act 1995, which should make it more informative
than footnotes. On the other hand, the MD&A is not audited like footnotes and there are
concerns that is contains mainly boilerplate and generic disclosures (SEC, 2003).
As disclosure length has also been used as proxy for the complexity (or readability) of
disclosures (Li, 2008), we further try to distinguish between the informativeness of the
MD&A and footnotes and their complexity by examining the association of the length of the
two outlets with future return volatility. If market participants are less easily able to extract
information from complex reports we expect more uncertainty to remain about the firm after
the filing of the 10-K leading to higher return volatility.
10
Moreover Bloomfield (2003) argues that information that is more costly to extract from
public data is less likely to be completely revealed in market prices. Such “incomplete
revelation” might arise due to the complexity and extraction costs of the information or due
to limited attention of investors as in Hirshleifer and Teoh (2003). If investors do not react
fully to the disclosed information we expect the characteristics of the narrative disclosures to
be associated with future stock returns and volatility. Moreover, managers might have
incentives to exploit investors’ limited attention by increasing the complexity in their
disclosures or choosing a particular form or outlet of the disclosure when the information is
negative (Schrand and Walther, 2000; Bloomfield, 2002). We then expect market participant
to only slowly adjust to the new (negative) information leading to a negative association of
characteristics of the disclosures with long-term stock returns and profitability.
The notion that managers are likely biased against disclosing negative information
(Kothari, Shu, and Wysocki, 2009) might not only affect the complexity of the disclosure, but
also the location and disclosure outlet. For example, managers strategically shift or omit
pessimistic language from earnings press releases to the MD&A in 10-Q and 10-K filings
(Davis and Tama-Sweet, 2012). This shifting behaviour is predictive of low future firm
profitability. Similarly, Li (2008) argues that “managers may be opportunistically structuring
annual reports to hide adverse information from investors” (p. 245). Meanwhile, experimental
evidence suggests that the placement and categorization of information plays an important
role for how investors interpret the information (Libby, Bloomfield, and Nelson, 2002) and
early evidence in psychology has shown that people tend to underweight abstract and
statistical information (Kahneman and Tversky, 1973; Nisbett and Ross, 1980). Accordingly,
we expect the characteristics of the footnotes to be more likely associated with negative
11
future stock returns as investors tend to under-react to the information contained in them
around the filing date.5
Firms are generally reluctant to deviate from default choices in the language and
structure of their annual reports unless absolutely necessary. There is a tendency to use
boilerplate language and to include too much information in order to satisfy compliance with
standards (Hoogervorst, 2013). That is, it is natural to expect firms to simply repeat content
and sentence structures in the MD&A and footnotes from one year to the next if there is no
new material information to be presented to investors. Similarly, these disclosures should be
similar across firms within the same industry reflecting wider economic and industry trends
unless idiosyncratic events have affected the individual firm. In other words, a disclosure that
changes provides information both through the new content, and through the fact that a
decision was made to change the disclosure. We therefore further test informational content
of the narrative disclosures by examining changes and similarities across industry peers,
within firms and disclosure outlets over time.
We expect changes over time and differences across industry peers to reveal information
to investors. Firms would not deviate from the default choice if there was no news and are
likely to contain previous statements in the disclosure to obfuscate additional sentences that
signal negative information. We expect negative information signals in particular in relation
to changes that occur in the MD&A, where management has more discretion over disclosures
compared to the footnotes. Moreover, we expect opportunistic shifting behaviour between the
narrative disclosures––reflected in low similarities between the MD&A and footnotes within
the same firm––also to be associated with negative information.
In a similar vein, it is suggested that managers engage in “impression management” by
using discretion in the tone of narrative disclosures opportunistically to influence investor 5 Prior empirical evidence shows that accounting information that is recognized on the face of the financial statements features more heavily in investors’ decision making than when it is disclosed in the footnotes (Amir 1993, Aboody 1996; Davis-Friday et al. 1999).
12
beliefs (Merkl-Davies and Brennan (2007). Typical behaviour includes “concealment by
obfuscating negative organisational outcomes and introducing positive bias” (Merkl-Davies
and Brennan, 2007, p. 182) and by attributing good news to managers and bad news to
external factors. Consequently, we expect the tone in the narratives, whether positive or
negative, to influence the investor reaction to the information disclosed. However, we expect
under the “impression management”-hypothesis that positive tone is negatively associated
with future returns. Moreover, if management’s intent is to obfuscate negative information,
we expect this negative news to be ‘buried’ in the footnotes and covered up with positive
language, given their higher complexity and investors’ limited attention to them compared to
the MD&A as outlined above. We now turn to empirically test these hypotheses.
3. Sample Selection and Variables
3.1. Sample Selection
We obtain 10-K filings filed electronically with the SEC on EDGAR from 1993 to 2014.
This yields 58,203 10-K filings from which we were able to parse the Management’s
Discussion and Analysis and the Notes to the Financial Statements. We eliminate disclosures
that contain fewer than 1000 characters. This is done to remove any filings that incorporate
the MD&A or Footnotes by reference to the annual report. We remove all numerical tables,
keeping only the text.
Although there are other written or narrative sections in 10-K filings, the MD&A and
Footnotes comprise the majority of these disclosures. Figure 1 shows the page length of
Procter & Gamble’s 2014 10-K by section as an example. The MD&A and Footnotes are by
far the longest disclosures, at 24 and 28 pages respectively, out of a total of approximately 75
pages. This is a fairly typical pattern for public company 10-Ks, and is suggestive that the
13
MD&A and footnotes (jointly and separately) are of prime importance when studying the
information content of narrative disclosures in 10-K filings.
For each firm, we match the 10-K filings with stock return data on CRSP and accounting
data on Compustat.6 Table 1 provides a summary of the sample construction and matching
process. The sample size is further reduced in the analysis through the use of lagged variables
and year-on-year changes, and exclusion of financial firms and late filers (where the 10-K is
filed over 100 days after the accounting period date). Our final usable sample consist of
28,712 10-K-years with extracted MD&A and footnote sections.
3.2. MD&A and footnote characteristics
We calculate a number of measures that are intended to capture important characteristics
of the MD&A and footnote, which we expect to reflect the information content of these
disclosures: length, year-on-year change, within-industry similarity, within-filing similarity
between MD&A and footnotes, and sentiment.
Disclosure length is a count of the number of words in the MD&A text, and the footnote
text. In regressions we use total length (MD&A plus footnotes) and footnote length because it
is easier to interpret: we can observe the effect of footnote length, holding constant the total
length of disclosures. Hence for a given quantity of disclosure, we can see the effect of
changing the composition of the disclosure (i.e. MD&A narrative discussion, or footnotes).
Disclosure length provides us with a simple measure of information content. All other things
being equal, a longer disclosure should contain more information, which will in turn affect
how investors react to this information.7
6 We match the CIKs from the 10-K filings to GVKEYs using (a) CRSP/Compustat Merged Company Header History, (b) Compustat NAMES file, and (c) WRDS SEC Analytics Suite GVKEY-CIK link table. If these three sources are inconsistent, we use (a) first, then (b), then (c). For the full sample, there are GVKEY matches for approximately 82% of firm-years. With these GVKEY matches, we merge with Compustat and CRSP. 7 We also use the log of word count, instead of the raw number, in further analyses. Other approaches of using the number of characters, or the number of words after removing stop words and words less than three characters long do not yield materially different results.
14
Year-on-year change is a measure of how much a firm-year’s MD&A and footnotes
change compared to the previous fiscal year. Change is calculated as one minus the vector
cosine similarity between this year’s MD&A (or footnote) text and the previous year’s
MD&A (or footnote) text as a bag-of-words model.8 This results in a variable between zero
and one, where zero indicates that the two bag-of-words vectors (e.g. this year’s MD&A and
last year’s MD&A) have exactly the same proportion of words and one indicates that the two
vectors are orthogonal and contain no shared content. 9
A disclosure that contains more change is presumed to contain more information––a
footnote that does not change compared to the previous year presumably contains very little
new information to investors. By comparison, a disclosure that changes a lot provides
information both through the new content itself, and through the fact that a decision was
made to add, delete, or amend a part of the footnote.10
Within-industry similarity measures how similar a firm’s MD&A (or footnotes) are
compared to other firms in the same industry in the same year. Firms that have the same
three-digit SIC code are considered to be in the same industry. For each firm-year, we
calculate the vector cosine similarity between the disclosure (MD&A or footnote) and all
other disclosures of the same type, in the same industry, in the same fiscal year. This results
in a number of pairwise similarity metrics, which are averaged to provide the within-industry
similarity for that firm-year, for both the MD&A and the footnotes. Within-industry 8 The bag-of-words model represents a document as a vector in which each element corresponds to the term frequency of a particular word. This means that the defining feature of a document in this model is the frequency of each word – word order is lost. We have experimented with using Levenshtein (1966) distance (essentially the minimum number of single character edits required to get from one document to another) as a measure of change but it is overly sensitive to changes in paragraph ordering, absent any change in content. Furthermore our measure does not consider numbers – if the textual structure of a disclosure stays the same but the numbers change, this measure will show no change. 9 Vector cosine similarity measures are calculated after we force all words to lowercase, remove any remaining tags, punctuation, multiple whitespaces, stop words (generic, names, dates and numbers, geographic, currencies and any other words fewer than three characters in length). We use stop word lists available on Bill McDonald’s website: http://www3.nd.edu/~mcdonald/Word_Lists.html 10 Our discussions with practising accountants suggest that company accountants prefer the path of least resistance and will avoid changing disclosures too much unless completely necessary. This is consistent with ample evidence in behavioural economics that documents the importance of inertia and default choices in decision making.
15
similarity is intended to measure how similar a firm’s disclosures look to its peers, in the
cross-section: if similarity is high, a firm’s MD&A or footnotes contain a lot of similar
content to its peers (i.e. boilerplate, which may possibly be easier for investors to process, but
may also possibly contain less information); if similarity is low, the disclosure content
substantially differs from peers (i.e. more idiosyncratic disclosures, with potentially more
information, but also possibly harder for investors to process).
MD&A-Footnote similarity is a within-filing measure of how similar the MD&A text
and footnote text are to each other, for a particular firm-year filing. It is calculated as the
vector cosine similarity between a firm’s MD&A text and footnote text, for the same firm in
the same year. Hence it is a measure of how much information is common to both parts of the
disclosure within a firm-year filing. As this variable tends towards one, the MD&A and
footnotes share more and more of the same words in the same proportion (proxying the
amount of information that is common to both sections). For a given length of disclosure, as
this variable decreases, the filing arguably contains more information, as there is less
commonality between the MD&A and footnotes. However, within-filing differences may also
suggest that management is presenting different information in their narrative discussion
compared to the audited footnotes.
Disclosure sentiment is measured as the proportion of negative and positive words as
defined by Loughran and McDonald (2011). We count the number of words in each firm-year
disclosure (MD&A and footnotes separately) and divide this by the total number of words in
the text. Negative words are subtracted from positive words to yield a proportion of net
positive words. To exploit the within-filing variation between MD&A disclosure and footnote
disclosures, we also calculate the difference between MD&A net positive and footnote net
positive proportions (MD&A-Footnote net positive). This variable, which we call Sentiment
Spread, is intended to capture the difference in sentiment between a firm’s MD&A narrative
16
disclosure and its audited notes to the financial statements. A positive spread indicates
positive sentiment in the MD&A section, which is in part forward-looking, that is not
reflected or has not yet been incorporated into footnote disclosures (which one could argue
are more backwards looking, as accounting by its nature captures past transactions).
Alternatively, management’s narrative and discussion about the past fiscal year might be
more positive than justified by the audited footnote disclosures.
3.3. Dependent Variables and Other Controls
We measure the information content of 10-K narrative disclosures based on a number of
market-based variables: signed (CAR) and absolute (|CAR|) filing returns; 4-factor adjusted
returns over the year following the 10-K filing (RET250); and 4-factor residual volatility
(RMSE250) during the year following the 10-K filing. Filing returns are an estimate of how
investors react at the time of the filing, assuming they read (and process) the disclosures
immediately. If the narrative characteristics we measure in the 10-K filings matter, firms’
filing 10-Ks with certain narrative characteristics will experience statistically significant
returns around the filing date. Returns and volatility over the subsequent year give us an
estimate of whether these narrative characteristics have any predictive power for long-term
effects.
The filing return (CAR) is a firm’s stock return minus the value-weighted CRSP return,
summed over the four-day window [-1, +2] surrounding the filing date of the firm’s 10-K.
The absolute filing return (|CAR|) is the absolute value of CAR. The return window starts at
one day before filing and finishes two days after to allow for information leakage, and filings
being made after the close of market (Berkman and Truong, 2009).
The 4-factor adjusted returns over the year (RET250) following the filing date are
calculated as follows: for each firm-year, we regress daily stock returns on the excess market
returns (MKT-RF), a size factor (small-minus-big), a value factor (high-minus-low) and a
17
momentum factor (up-minus-down) over the estimation window [-250, -21] relative to the
10-K filing date, in order to estimate factor loadings. For each of the event windows [+3,
+250] we compound the firm’s actual daily stock return, and expected daily stock return
based on estimated factor loadings over the window. Adjusted return is then calculated as
compounded raw return minus compounded expected return (i.e. the actual buy-and-hold
return, minus the expected risk-adjusted buy-and-hold return).
RMSE250 is the root-mean-squared-error from a 4-factor model of returns over the
window [+3, +250] relative to the 10-K filing date. This variable represents how much, on
average, a firm’s daily return deviates from its expected return over the course of the year
based on a 4-factor model. We also calculate the RMSE for the year prior to the filing date to
use as control variable.
To explore in more detail what fundamental information 10-K disclosure characteristics
may contain about current or future earnings we examine the variation between disclosures
and contemporaneous and future changes in ROA. This may tell us whether the narratives in
the MD&A and footnotes (both, or individually) contain information about future accounting
profitability.
The SEC requires certain forward-looking statements in the MD&A concerning “known
material trends and uncertainties” and off-balance sheet arrangements while other forward-
looking disclosures, generally speaking, are optional (SEC, 2003). It is less clear, however,
whether the footnotes contain relevant information about the firm’s prospects. Unlike the
MD&A management is not protected by “safe harbour" provisions and thus is less likely to
explicitly disclose any forward-looking information in the footnotes.11
11 Safe harbour was originally introduced by the Securities Act of 1933 and the Securities Exchange Act of 1934, and strengthened by the Private Securities Litigation Reform Act of 1995, which intended to reduce frivolous securities litigation.
18
We calculate the change in return on assets (ΔROA) for the current and next fiscal year.
Return on assets (ROA) is operating income after depreciation (OIADP) divided by total
assets (AT) at the end of the fiscal year.
We further use following firm control variables: Log(market value) is the natural
logarithm of the share price at the end of the fiscal year (PRCC_F) times number of shares
outstanding (CSHPRI). Book-to-market is shareholders' equity (SEQ) divided by market
value at the end of the fiscal year. Leverage is the sum of short term (DLC) and long term
debt (DLTT) divided by total assets (AT) at the end of the fiscal year. Log(number of
business segments) is the natural logarithm of the number of business (“BUSSEG”) or
operating segments (“OPSEG”) reported for each firm-year in the Compustat Segments
dataset, excluding segments with negative sales or a missing SIC code, as these usually relate
to corporate costs or eliminations. Any firm-year with missing segment data in Compustat is
assigned a value of one segment. All variables are winsorised at the 1% tails by fiscal year.
4. Summary Statistics
Table 2 Panel A provides summary statistics for our disclosure variables. Footnotes are
on average 18% longer than the MD&A section. They have a mean (median) length of 8,832
(7,640) words, compared to a mean (median) length of 7,470 (6,459) words for the MD&A.
Year-on-year change is higher for the MD&A than the footnotes, although the difference is
not substantial. Mean (median) change for footnotes is 6.0% (4.1%) versus 8.4% (6.3%) for
the MD&A.
Within-industry similarity is higher for footnotes, with a mean (median) value of 0.67
(0.69) compared to 0.55 (0.55) for the MD&A. This suggests that within an industry,
footnotes have more in common with each other, whereas the MD&A differs more between
firms. The higher similarity for footnotes may be caused by the stricter requirements of the
19
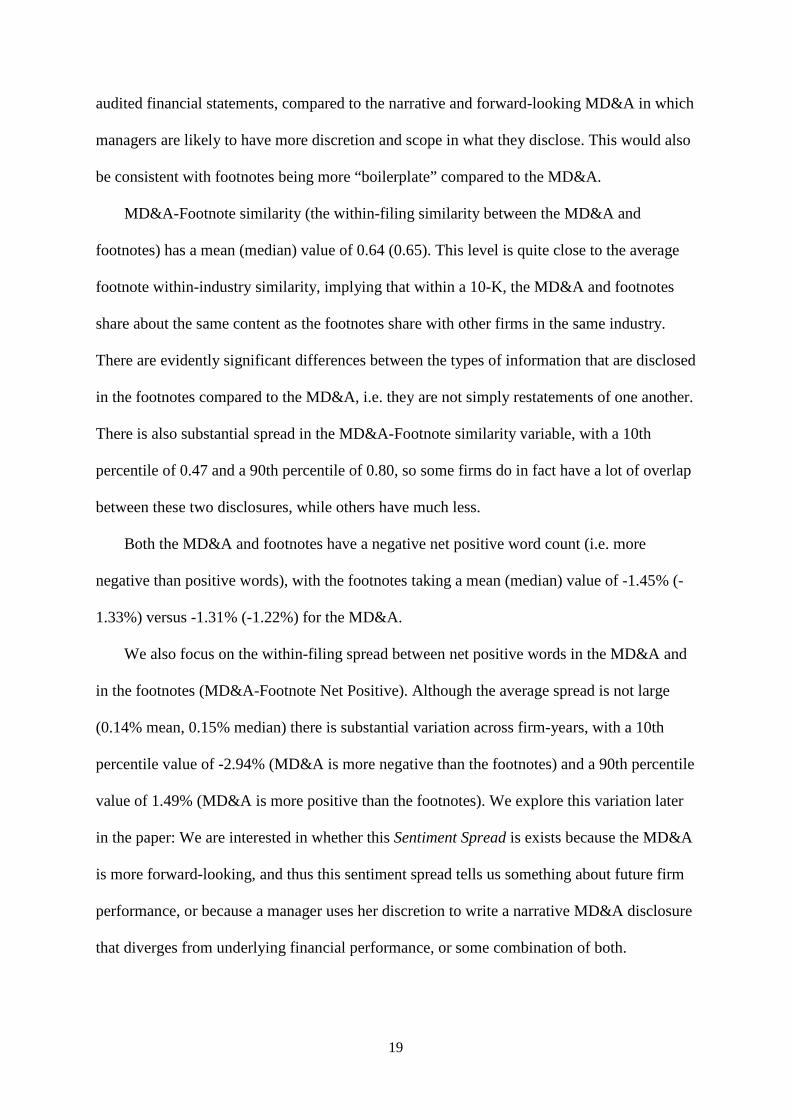
audited financial statements, compared to the narrative and forward-looking MD&A in which
managers are likely to have more discretion and scope in what they disclose. This would also
be consistent with footnotes being more “boilerplate” compared to the MD&A.
MD&A-Footnote similarity (the within-filing similarity between the MD&A and
footnotes) has a mean (median) value of 0.64 (0.65). This level is quite close to the average
footnote within-industry similarity, implying that within a 10-K, the MD&A and footnotes
share about the same content as the footnotes share with other firms in the same industry.
There are evidently significant differences between the types of information that are disclosed
in the footnotes compared to the MD&A, i.e. they are not simply restatements of one another.
There is also substantial spread in the MD&A-Footnote similarity variable, with a 10th
percentile of 0.47 and a 90th percentile of 0.80, so some firms do in fact have a lot of overlap
between these two disclosures, while others have much less.
Both the MD&A and footnotes have a negative net positive word count (i.e. more
negative than positive words), with the footnotes taking a mean (median) value of -1.45% (-
1.33%) versus -1.31% (-1.22%) for the MD&A.
We also focus on the within-filing spread between net positive words in the MD&A and
in the footnotes (MD&A-Footnote Net Positive). Although the average spread is not large
(0.14% mean, 0.15% median) there is substantial variation across firm-years, with a 10th
percentile value of -2.94% (MD&A is more negative than the footnotes) and a 90th percentile
value of 1.49% (MD&A is more positive than the footnotes). We explore this variation later
in the paper: We are interested in whether this Sentiment Spread is exists because the MD&A
is more forward-looking, and thus this sentiment spread tells us something about future firm
performance, or because a manager uses her discretion to write a narrative MD&A disclosure
that diverges from underlying financial performance, or some combination of both.
20
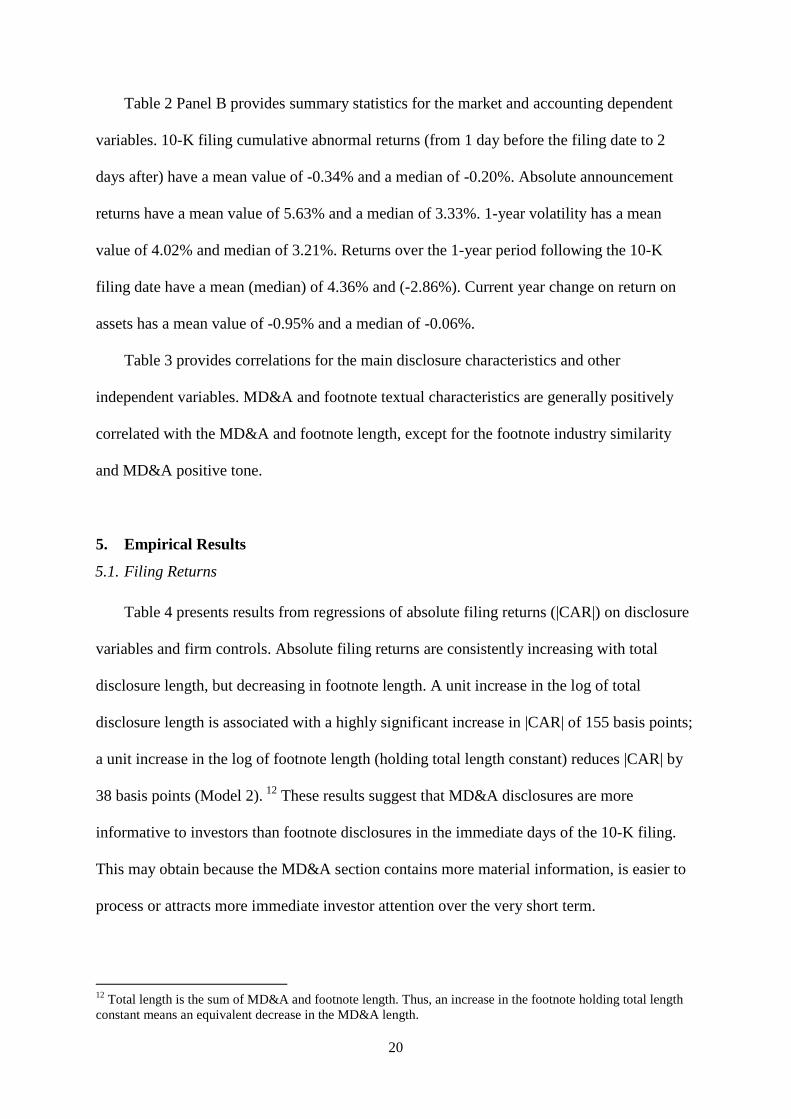
Table 2 Panel B provides summary statistics for the market and accounting dependent
variables. 10-K filing cumulative abnormal returns (from 1 day before the filing date to 2
days after) have a mean value of -0.34% and a median of -0.20%. Absolute announcement
returns have a mean value of 5.63% and a median of 3.33%. 1-year volatility has a mean
value of 4.02% and median of 3.21%. Returns over the 1-year period following the 10-K
filing date have a mean (median) of 4.36% and (-2.86%). Current year change on return on
assets has a mean value of -0.95% and a median of -0.06%.
Table 3 provides correlations for the main disclosure characteristics and other
independent variables. MD&A and footnote textual characteristics are generally positively
correlated with the MD&A and footnote length, except for the footnote industry similarity
and MD&A positive tone.
5. Empirical Results
5.1. Filing Returns
Table 4 presents results from regressions of absolute filing returns (|CAR|) on disclosure
variables and firm controls. Absolute filing returns are consistently increasing with total
disclosure length, but decreasing in footnote length. A unit increase in the log of total
disclosure length is associated with a highly significant increase in |CAR| of 155 basis points;
a unit increase in the log of footnote length (holding total length constant) reduces |CAR| by
38 basis points (Model 2). 12 These results suggest that MD&A disclosures are more
informative to investors than footnote disclosures in the immediate days of the 10-K filing.
This may obtain because the MD&A section contains more material information, is easier to
process or attracts more immediate investor attention over the very short term.
12 Total length is the sum of MD&A and footnote length. Thus, an increase in the footnote holding total length constant means an equivalent decrease in the MD&A length.
21
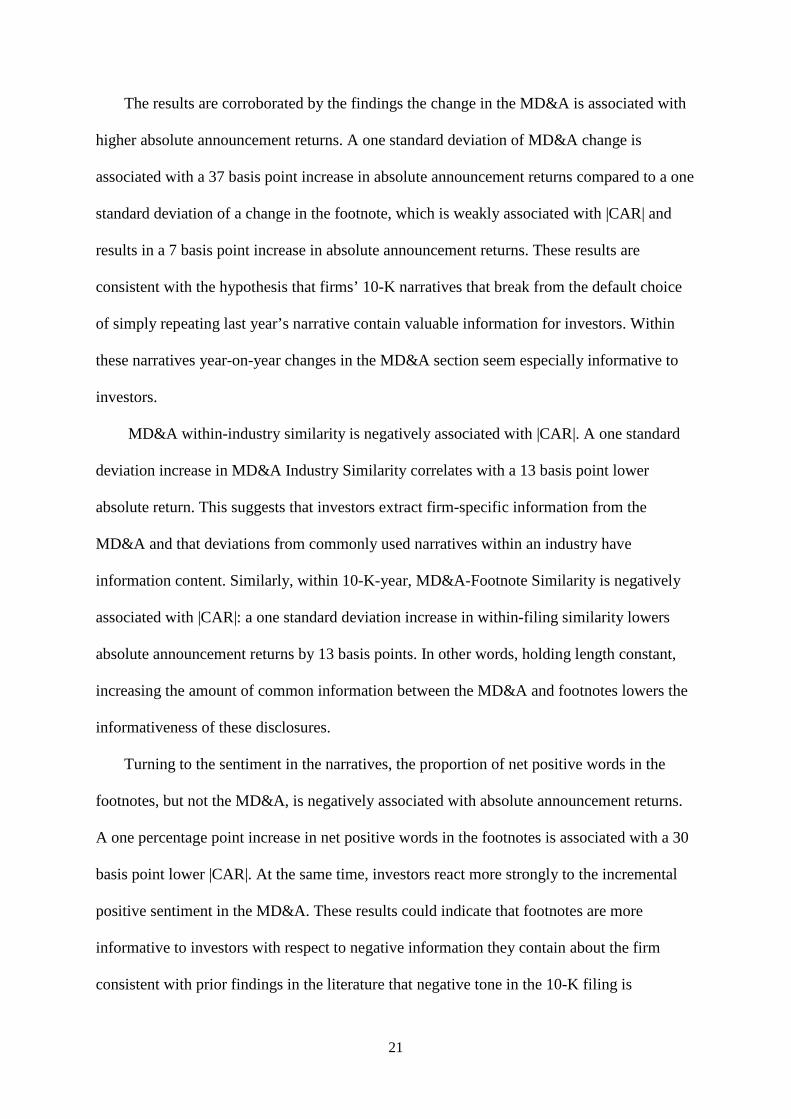
The results are corroborated by the findings the change in the MD&A is associated with
higher absolute announcement returns. A one standard deviation of MD&A change is
associated with a 37 basis point increase in absolute announcement returns compared to a one
standard deviation of a change in the footnote, which is weakly associated with |CAR| and
results in a 7 basis point increase in absolute announcement returns. These results are
consistent with the hypothesis that firms’ 10-K narratives that break from the default choice
of simply repeating last year’s narrative contain valuable information for investors. Within
these narratives year-on-year changes in the MD&A section seem especially informative to
investors.
MD&A within-industry similarity is negatively associated with |CAR|. A one standard
deviation increase in MD&A Industry Similarity correlates with a 13 basis point lower
absolute return. This suggests that investors extract firm-specific information from the
MD&A and that deviations from commonly used narratives within an industry have
information content. Similarly, within 10-K-year, MD&A-Footnote Similarity is negatively
associated with |CAR|: a one standard deviation increase in within-filing similarity lowers
absolute announcement returns by 13 basis points. In other words, holding length constant,
increasing the amount of common information between the MD&A and footnotes lowers the
informativeness of these disclosures.
Turning to the sentiment in the narratives, the proportion of net positive words in the
footnotes, but not the MD&A, is negatively associated with absolute announcement returns.
A one percentage point increase in net positive words in the footnotes is associated with a 30
basis point lower |CAR|. At the same time, investors react more strongly to the incremental
positive sentiment in the MD&A. These results could indicate that footnotes are more
informative to investors with respect to negative information they contain about the firm
consistent with prior findings in the literature that negative tone in the 10-K filing is
22
associated negatively with excess returns (e.g., Loughran and McDonald 2011), but this
remains speculative at this point.
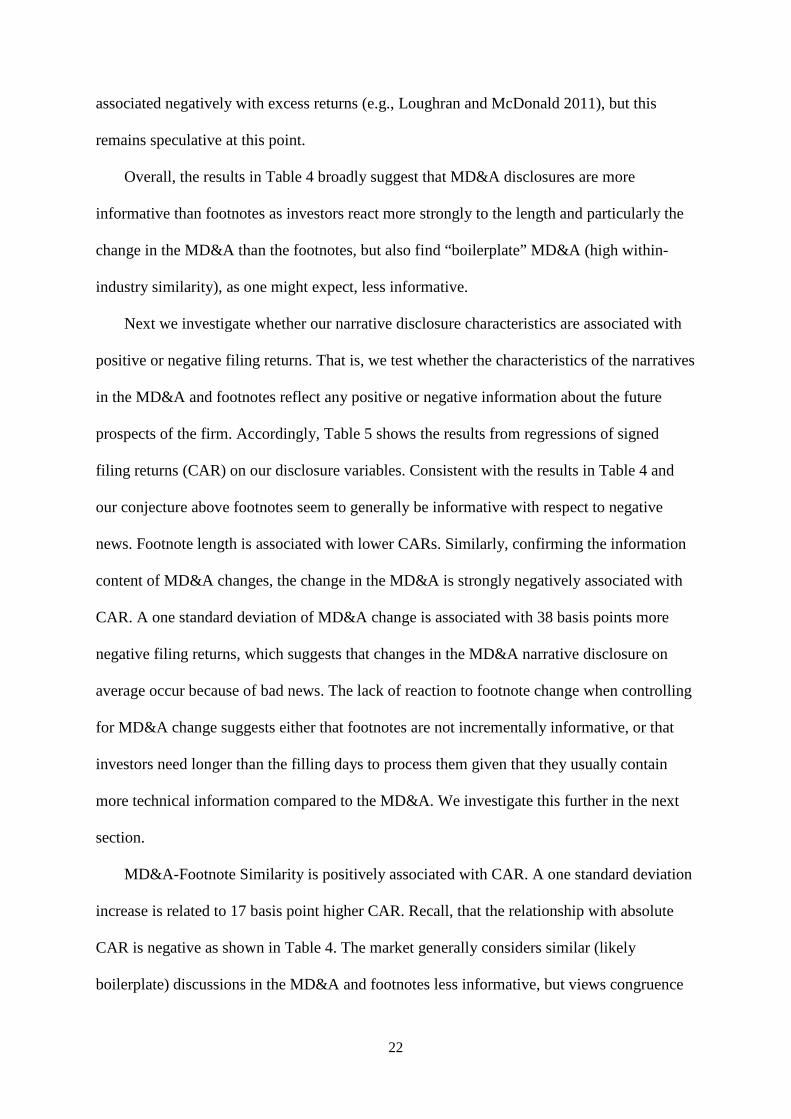
Overall, the results in Table 4 broadly suggest that MD&A disclosures are more
informative than footnotes as investors react more strongly to the length and particularly the
change in the MD&A than the footnotes, but also find “boilerplate” MD&A (high within-
industry similarity), as one might expect, less informative.
Next we investigate whether our narrative disclosure characteristics are associated with
positive or negative filing returns. That is, we test whether the characteristics of the narratives
in the MD&A and footnotes reflect any positive or negative information about the future
prospects of the firm. Accordingly, Table 5 shows the results from regressions of signed
filing returns (CAR) on our disclosure variables. Consistent with the results in Table 4 and
our conjecture above footnotes seem to generally be informative with respect to negative
news. Footnote length is associated with lower CARs. Similarly, confirming the information
content of MD&A changes, the change in the MD&A is strongly negatively associated with
CAR. A one standard deviation of MD&A change is associated with 38 basis points more
negative filing returns, which suggests that changes in the MD&A narrative disclosure on
average occur because of bad news. The lack of reaction to footnote change when controlling
for MD&A change suggests either that footnotes are not incrementally informative, or that
investors need longer than the filling days to process them given that they usually contain
more technical information compared to the MD&A. We investigate this further in the next
section.
MD&A-Footnote Similarity is positively associated with CAR. A one standard deviation
increase is related to 17 basis point higher CAR. Recall, that the relationship with absolute
CAR is negative as shown in Table 4. The market generally considers similar (likely
boilerplate) discussions in the MD&A and footnotes less informative, but views congruence
23
between the information in the MD&A and the footnotes as a positive signal. Significant
differences between the two narratives signal negative news. They might, for example, be
viewed negatively if they suggest that management may be trying to present a different
business outlook in one of the narratives, e.g. emphasise certain business aspects in the
MD&A, while stressing others in the footnotes or downplay negative information in the
footnotes (for which disclosure is regulated and audited) with a relatively more positive tone
in the MD&A section.
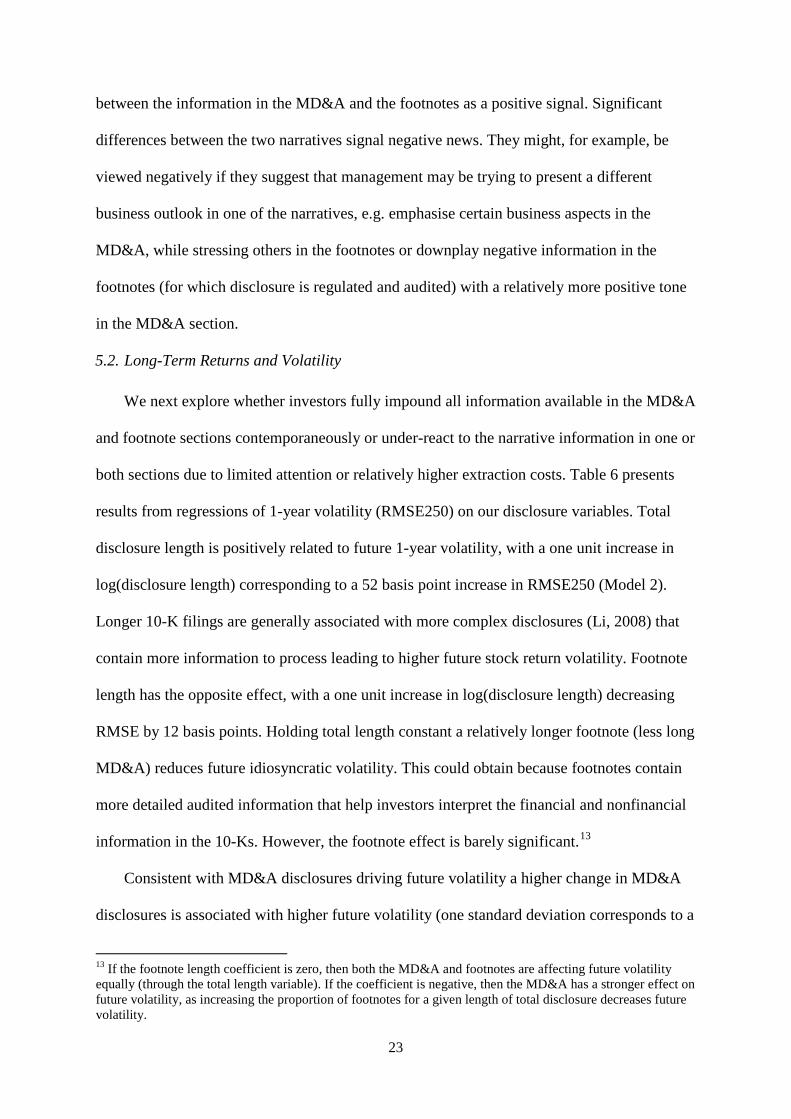
5.2. Long-Term Returns and Volatility
We next explore whether investors fully impound all information available in the MD&A
and footnote sections contemporaneously or under-react to the narrative information in one or
both sections due to limited attention or relatively higher extraction costs. Table 6 presents
results from regressions of 1-year volatility (RMSE250) on our disclosure variables. Total
disclosure length is positively related to future 1-year volatility, with a one unit increase in
log(disclosure length) corresponding to a 52 basis point increase in RMSE250 (Model 2).
Longer 10-K filings are generally associated with more complex disclosures (Li, 2008) that
contain more information to process leading to higher future stock return volatility. Footnote
length has the opposite effect, with a one unit increase in log(disclosure length) decreasing
RMSE by 12 basis points. Holding total length constant a relatively longer footnote (less long
MD&A) reduces future idiosyncratic volatility. This could obtain because footnotes contain
more detailed audited information that help investors interpret the financial and nonfinancial
information in the 10-Ks. However, the footnote effect is barely significant.13
Consistent with MD&A disclosures driving future volatility a higher change in MD&A
disclosures is associated with higher future volatility (one standard deviation corresponds to a
13 If the footnote length coefficient is zero, then both the MD&A and footnotes are affecting future volatility equally (through the total length variable). If the coefficient is negative, then the MD&A has a stronger effect on future volatility, as increasing the proportion of footnotes for a given length of total disclosure decreases future volatility.
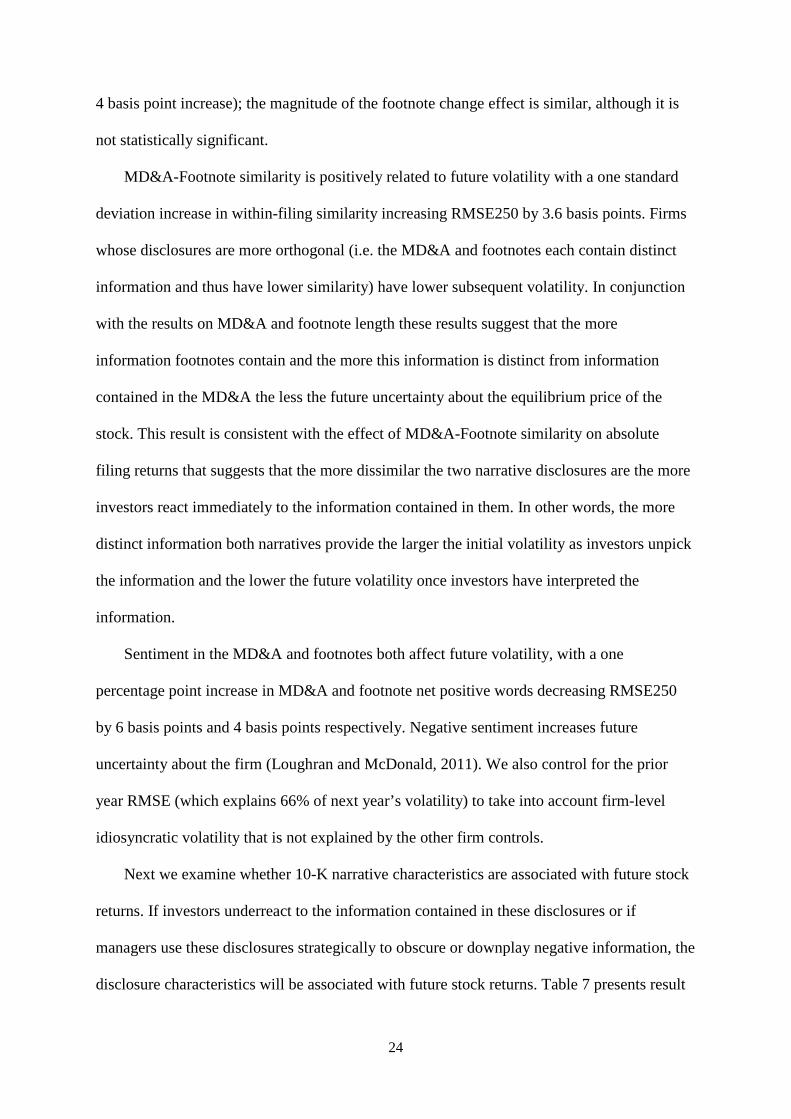
24
4 basis point increase); the magnitude of the footnote change effect is similar, although it is
not statistically significant.
MD&A-Footnote similarity is positively related to future volatility with a one standard
deviation increase in within-filing similarity increasing RMSE250 by 3.6 basis points. Firms
whose disclosures are more orthogonal (i.e. the MD&A and footnotes each contain distinct
information and thus have lower similarity) have lower subsequent volatility. In conjunction
with the results on MD&A and footnote length these results suggest that the more
information footnotes contain and the more this information is distinct from information
contained in the MD&A the less the future uncertainty about the equilibrium price of the
stock. This result is consistent with the effect of MD&A-Footnote similarity on absolute
filing returns that suggests that the more dissimilar the two narrative disclosures are the more
investors react immediately to the information contained in them. In other words, the more
distinct information both narratives provide the larger the initial volatility as investors unpick
the information and the lower the future volatility once investors have interpreted the
information.
Sentiment in the MD&A and footnotes both affect future volatility, with a one
percentage point increase in MD&A and footnote net positive words decreasing RMSE250
by 6 basis points and 4 basis points respectively. Negative sentiment increases future
uncertainty about the firm (Loughran and McDonald, 2011). We also control for the prior
year RMSE (which explains 66% of next year’s volatility) to take into account firm-level
idiosyncratic volatility that is not explained by the other firm controls.
Next we examine whether 10-K narrative characteristics are associated with future stock
returns. If investors underreact to the information contained in these disclosures or if
managers use these disclosures strategically to obscure or downplay negative information, the
disclosure characteristics will be associated with future stock returns. Table 7 presents result
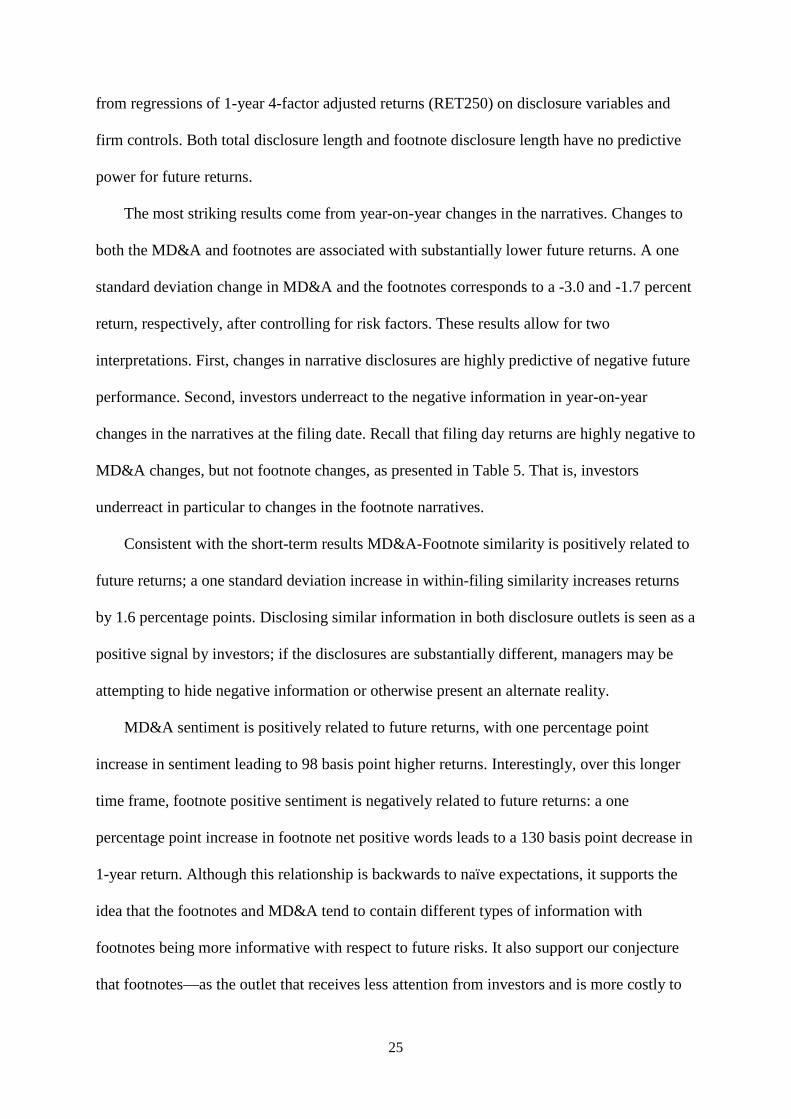
25
from regressions of 1-year 4-factor adjusted returns (RET250) on disclosure variables and
firm controls. Both total disclosure length and footnote disclosure length have no predictive
power for future returns.
The most striking results come from year-on-year changes in the narratives. Changes to
both the MD&A and footnotes are associated with substantially lower future returns. A one
standard deviation change in MD&A and the footnotes corresponds to a -3.0 and -1.7 percent
return, respectively, after controlling for risk factors. These results allow for two
interpretations. First, changes in narrative disclosures are highly predictive of negative future
performance. Second, investors underreact to the negative information in year-on-year
changes in the narratives at the filing date. Recall that filing day returns are highly negative to
MD&A changes, but not footnote changes, as presented in Table 5. That is, investors
underreact in particular to changes in the footnote narratives.
Consistent with the short-term results MD&A-Footnote similarity is positively related to
future returns; a one standard deviation increase in within-filing similarity increases returns
by 1.6 percentage points. Disclosing similar information in both disclosure outlets is seen as a
positive signal by investors; if the disclosures are substantially different, managers may be
attempting to hide negative information or otherwise present an alternate reality.
MD&A sentiment is positively related to future returns, with one percentage point
increase in sentiment leading to 98 basis point higher returns. Interestingly, over this longer
time frame, footnote positive sentiment is negatively related to future returns: a one
percentage point increase in footnote net positive words leads to a 130 basis point decrease in
1-year return. Although this relationship is backwards to naïve expectations, it supports the
idea that the footnotes and MD&A tend to contain different types of information with
footnotes being more informative with respect to future risks. It also support our conjecture
that footnotes––as the outlet that receives less attention from investors and is more costly to
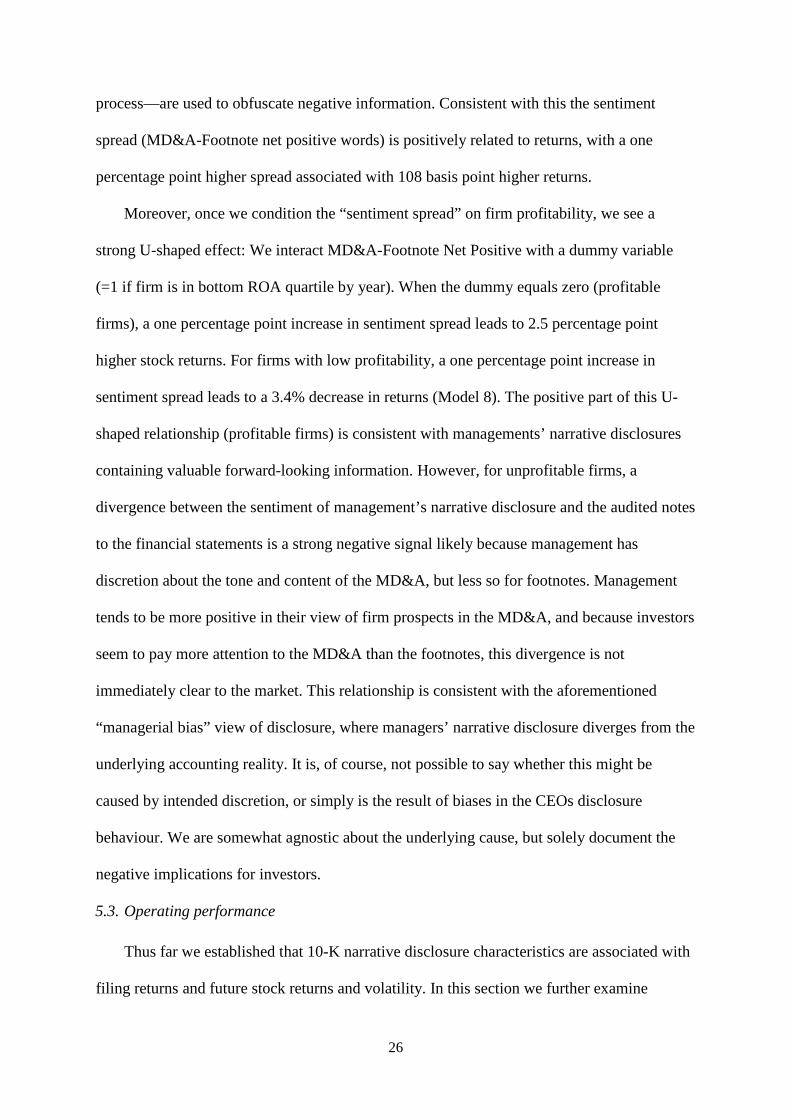
26
process––are used to obfuscate negative information. Consistent with this the sentiment
spread (MD&A-Footnote net positive words) is positively related to returns, with a one
percentage point higher spread associated with 108 basis point higher returns.
Moreover, once we condition the “sentiment spread” on firm profitability, we see a
strong U-shaped effect: We interact MD&A-Footnote Net Positive with a dummy variable
(=1 if firm is in bottom ROA quartile by year). When the dummy equals zero (profitable
firms), a one percentage point increase in sentiment spread leads to 2.5 percentage point
higher stock returns. For firms with low profitability, a one percentage point increase in
sentiment spread leads to a 3.4% decrease in returns (Model 8). The positive part of this U-
shaped relationship (profitable firms) is consistent with managements’ narrative disclosures
containing valuable forward-looking information. However, for unprofitable firms, a
divergence between the sentiment of management’s narrative disclosure and the audited notes
to the financial statements is a strong negative signal likely because management has
discretion about the tone and content of the MD&A, but less so for footnotes. Management
tends to be more positive in their view of firm prospects in the MD&A, and because investors
seem to pay more attention to the MD&A than the footnotes, this divergence is not
immediately clear to the market. This relationship is consistent with the aforementioned
“managerial bias” view of disclosure, where managers’ narrative disclosure diverges from the
underlying accounting reality. It is, of course, not possible to say whether this might be
caused by intended discretion, or simply is the result of biases in the CEOs disclosure
behaviour. We are somewhat agnostic about the underlying cause, but solely document the
negative implications for investors.
5.3. Operating performance
Thus far we established that 10-K narrative disclosure characteristics are associated with
filing returns and future stock returns and volatility. In this section we further examine
27
whether the 10-K narrative disclosures correlate with contemporaneously recognised (i.e. on
the main financial statements) accounting performance and whether they are predictive of the
future accounting performance of the firm mirroring the stock market performance.
Table 8 shows results from regressions of contemporaneous change in return on assets
(ΔROA(t)) on disclosure variables and firm controls. Length is negatively associated with
contemporaneous change in profitability; a one unit increase in log(total disclosure length)
correlates to a 323 basis point decrease in current ΔROA. This relationship is not affected by
footnote length, so both MD&A and footnotes tend to be longer when a firm has a larger
decrease in profitability. This could either be caused by losses requiring more disclosure than
profitable results, or might be consistent with the conjecture of managerial obfuscation in the
face of poor results. The two interpretations are difficult to distinguish based on these results
on their own, but in conjunction with our findings above the latter seems likely.
Change in the MD&A is correlated with a negative current year change in profitability: a
one standard deviation increase in MD&A change accompanies a 64 basis point lower ΔROA
whereas footnote change is not related to ΔROA, which is consistent with the results on stock
returns. A one percentage point increase in MD&A sentiment accompanies a 61 basis point
higher ΔROA. For sentiment spread the effect is 39 basis points. Again both results mirror
the findings on the market reaction. We do not see a U-shaped effect in sentiment spread and
(prior year) profitability in this case; in fact the relationship between sentiment spread and
current ΔROA is twice as strong for low profitability firms, so MD&A language does
correspond to current performance in all cases here.
Turning to future change in profitability, both MD&A and footnotes have a strong
relationship with future firm performance. Table 9 shows results from regressions of one-
year-ahead change in return on assets (ΔROA(t+1)) on disclosure variables and firm controls.
28
Total disclosure length has a weak negative relationship with future profitability, but this
disappears after controlling for footnote disclosure length. We also see a relationship between
MD&A change and future profitability that we see with future returns: a one standard
deviation change in MD&A predicts a 56 basis point lower ΔROA. Footnote change does not
have predictive power on future profitability. Firms with higher MD&A-Footnote similarity
(within-filing) have moderately higher future changes in profitability, with a one standard
deviation increase in within-filing similarity leading to 21 basis point higher ΔROA(t+1).
This is a similar relationship to the one we observe for future one-year returns, and is
consistent with high common disclosures between footnotes and MD&A being a positive
signal. Footnote sentiment is negatively related to ΔROA, with a one percentage point
increase predicting a 27 basis point decrease in future profitability. Although this negative
relationship between positive sentiment and future performance is counterintuitive, it is
consistent with the pattern we see in 1-year future returns and confirms our conjecture about
managerial obfuscation of bad underlying financial results using positive sounding narratives.
Although sentiment spread is not significant by itself, when it is interacted with a “low
profitability” dummy variable, the U-shaped relationship we found with stock returns is
corroborated. For “high profitability” firms (not in lowest quartile by year), sentiment spread
(MD&A-Footnote net positive) is strongly related to future ΔROA, with a one percentage
point increase in spread related to a 37 basis point increase in next year’s profitability. For
“low profitability” firms (bottom quartile of ROA), a one percentage point increase in
sentiment spread predicts a 92 basis point lower ΔROA. Firms with reasonable profitability
seem to use the MD&A to signal future performance; for low profitability firms, it seems that
a manager’s optimism is inversely related to the reality of future performance.
5.4. Interpretation of results and further tests
29
The analyses in this paper show a number of results in which MD&A and footnote
disclosure characteristics are predictive of contemporaneous and long-term stock returns,
volatility and future changes in firms’ profitability. We find that investors’ reaction to the
MD&A narrative in 10-Ks is much stronger and more timely than their reaction to the notes
to the financial statements. Textual characteristics of 10-K filings are predictive of future
returns, volatility, and firm profitability. This predictive power suggests that investors do not
fully process 10-K written disclosures when they are filed, perhaps due to limited attention or
information processing biases. Investors muted short-term reaction to the footnotes could be
because there is no marginal information of value compared to the MD&A, or because the
footnotes are more difficult or costly to process. Our evidence suggests the latter, as footnote
characteristics are related to long-term returns, volatility and profitability.
We also find some evidence of managers’ attempts to obfuscate negative information in
the MD&A narrative and particularly the footnotes through tone. Both are associated with
negative subsequent stock returns, particularly for underperforming firms. It is of course
difficult to distinguish intentional reporting choices from unintentional biases in reporting
behavior. We investigate this further by examining the relationship of the narrative
characteristics with future discretionary accruals. The untabulated results are consistent with
the prior patterns of associations of MD&A and footnote characteristics with future stock
returns and profitability. Longer footnote disclosures (holding total length constant) predict
higher discretionary accruals and MD&A within-industry similarity and footnote within-
industry similarity have statistically significant and opposite effects on discretionary accruals.
Firms with higher footnote similarity (i.e. more boilerplate disclosure, less idiosyncratic
disclosure) show evidence of subsequently higher earnings management, while firms with
higher MD&A similarity show signs of lower subsequent earnings management.
30
From the perspective of management, the MD&A is the more visible disclosure (given
its relationship with signed and absolute announcement returns), and also allows greater
discretion due to safe harbour laws and the fact that it is not (strictly) audited.14 By making
the MD&A less comparable to other companies, it will be more difficult for investors to
process this information and assess the firm’s situation in context. In contrast, higher
similarity in the footnotes may be a result of managers in turn trying to avoid disclosures that
indicate to outsiders that something is wrong or different. One possible explanation could be
that managers actively choose what information to put into the MD&A, where they have
greater discretion, and then simply try to structure the footnotes to minimise informative
disclosures, in efforts to maximise obfuscation. Admittedly, this argument is speculative and
very difficult to test. Nevertheless, the overall consistent patterns in the results suggest that
this is a likely possibility. Our results also show consistent patterns in the relationship
between the narrative sections within 10-K filings. The MD&A and the footnotes have
differing, and sometimes opposite effects on stock returns and profitability. The fact that the
signs of the association of the tone in the two narratives differ supports the notion that the
MD&A and footnotes are fundamentally different disclosure outlets.
Our results also suggest limited attention of investors and biases in information
processing, that is the marginal investor’s inability to read and process the complex
information contained within a 10-K filing in a timely manner. It is conceivable, for example,
that the marginal investors make decisions partly based on stale information that is disclosed
in the most recent, and previous, 10-Ks. For these investors, the information may be “new”,
because they have not taken it upon themselves to read (in detail) years of prior 10-Ks for
companies that were not previously on their “investment radar”. Given the time constraints
14 Auditors can be engaged to review the MD&A, even though it is not subject to accounting standards in the same way as the notes to the financial statements. Nevertheless, auditors will typically check that the MD&A is consistent with the figures presented in the audited statements (AICPA, 2001).
31
and portfolio size of even institutional investors, and the limited availability of machine-
readable 10-K narrative sections up to recently this is at least a possibility.
On the other hand, the relationships we observe on long-term stock returns might be
driven by compensation for some type of information risk that is captured by disclosure
characteristics. Easley and O’Hara (2004) produce an asset pricing model in which a firm’s
information environment affects the cost of capital, whereby cost of capital is decreasing in
information quality (i.e. less private information) and information precision. Increasing the
difficulty of testing theoretical predictions, Lambert et al. (2007) and Gao (2010) show that
the direction of the relationship between cost of capital and disclosure quality is very much
ambiguous and Kothari et al. (2009) show empirically that measures of disclosure quality and
disclosure content are often conflated. Yet, although, risk-based explanations of our findings
are possible, many of the relationships that we observe in the data are more consistent with
managers exploiting limited investor attention.
There are a range of other mandatory and voluntary disclosures that are ignored in this
study: quarterly 10-Q filings, management forecasts, earnings announcements and pre-
announcements, and so on. If characteristics of these disclosures are correlated with 10-K
disclosures, there is a possibility that we are capturing some unobserved effects. However,
the 10-K is arguably the most difficult to process piece of information disclosed by US firms;
other disclosures are shorter and easier to digest.
6. Conclusion
This paper examines the characteristics and variations within firms’ 10-K filings over a
20 year sample period. We find that MD&A disclosures are more informative to investors
than footnote disclosures in the immediate days of the 10-K filing. Our results further suggest
that firms’10-K narratives that break from the default choice of simply repeating last year’s
32
narrative or from being boilerplate disclosures commonly used within the industry are
informative to investors. However, consistent with limited attention or high processing costs,
we also find that investors generally under-react to negative information contained in the 10-
K narratives as their characteristics are highly predictive of negative future stock returns after
controlling for risk factors as well as associated with significantly lower future operating
performance. Our results are also suggestive of managers’ incentives to exploit investors’
limited attention through disclosure tone and through the disclosure of information that is
different in nature and content in the MD&A section compared to the footnotes.
The findings in this paper have implications for regulators, accounting standard-setters,
and preparers of financial statements. For regulators and standard-setters, the differential
between investors’ reactions to the MD&A narrative and their reaction to the Notes to the
Financial Statements may be concerning. The current Chairwoman of the SEC has expressed
the need for disclosure reform to tackle the “information overload” (White, 2013) that
investors face as a result of excessive, boilerplate, or complex disclosures. Big Four firms are
currently proposing changes to MD&A and footnote disclosures to improve presentation to
investors (EY, 2014). Our research adds to this debate by highlighting areas of disclosure that
investors seem to have greater difficulty processing. For the preparers of financial statements,
this research has obvious implications about how to structure disclosures to provide more
effective and digestible disclosures to the market, or conversely how to enhance earnings
management and obscure information from investors. For investors the message is clear:
there is value in reading companies’ annual reports, and especially understanding the cause of
changes to narrative disclosures and footnotes.
Further research could study the relative characteristics of within-firm voluntary and
mandatory disclosures to produce a comprehensive picture of how managers vary disclosure
by outlet, and the effects on investor reaction and information content. This is beyond the

33
scope of this study. Nonetheless, this research details significant information content in
accounting disclosures and differences in the impact of characteristics of the MD&A and
footnotes.
34
REFERENCES
Aboody, D., (1996). Recognition versus disclosure in the oil and gas industry. Journal of Accounting
Research 34, 21–32.
AICPA (2001) Statement on Standards for Attestation Engagements No. 10 AT Section 701. American
Institute of Certified Public Accountants. Retrieved from
http://www.aicpa.org/Research/Standards/AuditAttest/DownloadableDocuments/AT-00701.pdf
Amir, E. (1993). The market valuation of accounting information: the case of postretirement benefits
other than pensions. The Accounting Review 68, 703–724.
Berkman, H., & Truong, C. (2009). Event Day 0? After-Hours Earnings Announcements. Journal of
Accounting Research, 47(1), 71-103.
Beyer, A., Cohen, D. A., Lys, T. Z., & Walther, B. R. (2010). The financial reporting environment:
Review of the recent literature. Journal of Accounting and Economics, 50(2-3), 296-343.
Bloomfield, R.J. (2002). The ‘‘incomplete revelation hypothesis’’ and financial reporting. Accounting
Horizons 16, 233–243.
Bonsall IV, S. B., Leone, A. J., & Miller, B. P. (2015). A Plain English Measure of Financial
Reporting Readability (SSRN Working Paper). Retrieved from
http://papers.ssrn.com/sol3/papers.cfm?abstract_id=2560644
Brown, S. V., & Tucker, J. W. (2011). Large-Sample Evidence on Firms’ Year-over-Year MD&A
Modifications. Journal of Accounting Research, 49(2), 309-346.
Bryan, S. H. (1997). Incremental Information Content of Required Disclosures Contained in
Management Discussion and Analysis. The Accounting Review, 72(2), 285-301.
Cohen, L., Malloy C., & Ngyuen, Q. (2015). Lazy Prices. Harvard Business School, working paper.
Cole, C. J., & Jones, C. L. (2005). Management Discussion and Analysis: A Review and Implications
for Future Research. Journal of Accounting Literature, 24, 135-174.
Davis, A. K., & Tama-Sweet, I. (2012). Managers’ Use of Language Across Alternative Disclosure
Outlets: Earnings Press Releases versus MD&A. Contemporary Accounting Research, 29(3),
804-837.
Davis-Friday, P.Y., Folami, L.B., Liu, C.-S., & Mittelstaedt, H.F. (1999). The value relevance of
financial statement recognition vs. disclosure: evidence from SFAS No. 106. The Accounting
Review 74, 403–423.
De Franco, G., Wong, M. H. F., & Zhou, Y. (2011). Accounting Adjustments and the Valuation of
Financial Statement Note Information in 10-K Filings. The Accounting Review, 86(5), 1577-
1604.
Dichev, I. D., Graham, J. R., Harvey, C. R., & Rajgopal, S. (2013). Earnings quality: Evidence from
the field. Journal of Accounting and Economics, 56(2-3), 1-33.
Easley, D., & O’Hara, M. (2004). Information at the Cost of Capital. The Journal of Finance, 59(4),
1553-1583.
35
Easton, Peter D. & Zmijewski, Mark E. (1993). SEC Form 10K/10Q Reports and Annual Reports to
Shareholders: Reporting Lags and Squared Market Model Prediction Errors. Journal of
Accounting Research 31 (1): 113-129
EY (2014) Disclosure effectiveness: What companies can do now. Retrieved from
http://www.ey.com/Publication/vwLUAssets/EY-disclosure-effectiveness-what-companies-can-
do-now/$FILE/EY-disclosure-effectiveness-what-companies-can-do-now.pdf
Feldman, R., Govindaraj, S., Livnat, J., & Segel, B. (2010). Management’s tone change, post earnings
announcement drift and accruals. Review of Accounting Studies, 15(4), 915-953.
Fiske, S., & Taylor, S. (1991). Social Cognition, 2nd Edition. McGraw-Hill, New York.
Gao, P. (2010). Disclosure Quality, Cost of Capital, and Investor Welfare. The Accounting Review,
85(1), 1-29.
Graham, J. R., Raedy, J. S., & Shackelford, D. A. (2012). Research in accounting for income taxes.
Journal of Accounting and Economics, 53(1-2), 412-434.
Griffin, P. A. (2003). Got Information? Investor Response to Form 10-K and Form 10-Q EDGAR
Filings. Review of Accounting Studies, 8(4), 433-460.
Hirshleifer, D., & Teoh, S. H. (2003). Limited attention, information disclosure, and financial
reporting. Journal of Accounting and Economics, 36(1-3), 337-386.
Hirshleifer, D., 2001. Investor psychology and asset pricing. Journal of Finance 64, 1533–1597.
Hoogervorst, H. (2013). Breaking the boilerplate. Speech given at IFRS Foundation conference,
Amsterdam, 27th June 2013. Available at
http://www.ifrs.org/Alerts/Conference/Documents/2013/HH-Amsterdam-June-2013.pdf
Kahneman, D., Tversky, A., 1973. On the psychology of prediction. Psychological Review 80, 237–
251.
Kothari, S. P., Li, X., & Short, J. E. (2009). The Effect of Disclosures by Management, Analysts, and
Business Press on Cost of Capital, Return Volatility, and Analyst Forecasts: A Study Using
Content Analysis. The Accounting Review, 84(5), 1639-1670.
Kothari, S.P., Shu, S. & Wysocki, P. (2009). Do Managers Withhold Bad News? Journal of
Accounting Research 47, 241–276.
Lambert, R., Leuz, C., & Verrecchia, R. E. (2007). Accounting Information, Disclosure, and the Cost
of Capital. Journal of Accounting Research, 45(2): 385-420.
Levenshtein, V. I. (1966). Binary codes capable of correcting deletions, insertions and reversals.
Soviet Physics - Doklady, 10(8), 707-710.
Li, E., & Ramesh, K. (2009). Market Reaction Surrounding the Filing of Periodic SEC Reports. The
Accounting Review 84: 171-208.
Li, F. (2008). Annual report readability, current earnings, and earnings persistence. Journal of
Accounting and Economics, 45(2-3), 221-247.
36
Li, F. (2010a). The Information Content of Forward-Looking Statements in Corporate Filings—A
Naïve Bayesian Machine Learning Approach. Journal of Accounting Research, 48(5), 1049-
1102.
Li, F. (2010b). Textual Analysis of Corporate Disclosures: A Survey of the Literature. Journal of
Accounting Literature, 29, 143-165.
Libby, R, Bloomfield, R., & M. W. Nelson (2002). Experimental Research in Financial Accounting.
Accounting, Organizations and Society 27, 775–810.
Loughran, T., & McDonald, B. (2011). When Is a Liability Not a Liability? Textual Analysis,
Dictionaries, and 10-Ks. The Journal of Finance, 66(1), 35-65.
Loughran, T., & McDonald, B. (2014). Measuring Readability in Financial Disclosures. The Journal
of Finance, 69(4), 1643-1671.
Merkl-Davies, D. M., & Brennan, N. M. (2007). Discretionary Disclosure Strategies in Corporate
Narratives: Incremental Information or Impression Management? Journal of Accounting
Literature, 26, 116-194.
Nisbett, R., Ross, L., (1980). Human Inference: Strategies and Shortcomings of Social Judgment.
Prentice-Hall, Englewood Cliffs, NJ.
Payne, J.W., Bettman, J.R., Johnson, E.J. (1993). The Adaptive Decision-Maker. Pergamon, Oxford.
Peng, L., & Xiong, W. (2006). Investor attention, overconfidence and category learning. Journal of
Financial Economics, 80(3), 563-602.
Peterson, K. (2012). Accounting complexity, misreporting, and the consequences of misreporting.
Review of Accounting Studies, 17(1), 72-95.
Peterson, K., Schmardebeck, R., & Wilks, T. J. (2015). The earnings quality and information
processing effects of accounting consistency. The Accounting Review, 90 (6): 2483-2514.
Rogers, R. K., & Grant, J. (1997). Content Analysis of Information Cited in Reports of Sell-Side
Financial Analysts. Journal of Financial Statement Analysis 3: 17-30.
Schilit, H., & Perler, J. (2010). Financial Shenanigans: How to Detect Accounting Gimmicks and
Fraud in Financial Reports (3rd edition). New York, NY: McGraw-Hill.
Schipper, K. (2007). Required Disclosures in Financial Reports. The Accounting Review, 82(2), 301-
326.
Schrand, C. M., & Zechman, S. L. C. (2012). Executive overconfidence and the slippery slope to
financial misreporting. Journal of Accounting and Economics, 53(1-2), 311-329.
Schrand, C.M., & Walther, B.R. (2000). Strategic benchmarks in earnings announcement: the
selective disclosure of prior-period earnings components. The Accounting Review 75, 151–177.
Schroeder, N., & Gibson, C. (1990). Readability of Management's Discussion and Analysis.
Accounting Horizons, 4(4), 78-87.
37
SEC (2003). Interpretation: Commission Guidance Regarding Management’s Discussion and
Analysis of Financial Condition and Results of Operations. Retrieved from
https://www.sec.gov/rules/interp/33-8350.htm
Slovic, P., 1972. From Shakespeare to Simon: speculations—and some evidence about man’s ability
to process information. Oregon Research Institute Monograph, Vol. 12, No. 2.
Soper, F. J., & Dolphin, R., Jr. (1964). Readability and Corporate Annual Reports. The Accounting
Review, 39(2), 358-362.
White, M. J. (2013, October 15). The Path Forward on Disclosure [Speech]. Securities and Exchange
Commission. Retrieved from http://www.sec.gov/News/Speech/Detail/Speech/1370539878806
You, H., & Zhang, X. (2009). Financial reporting complexity and investor underreaction to 10-K
information. Review of Accounting Studies, 14(4), 559-586.
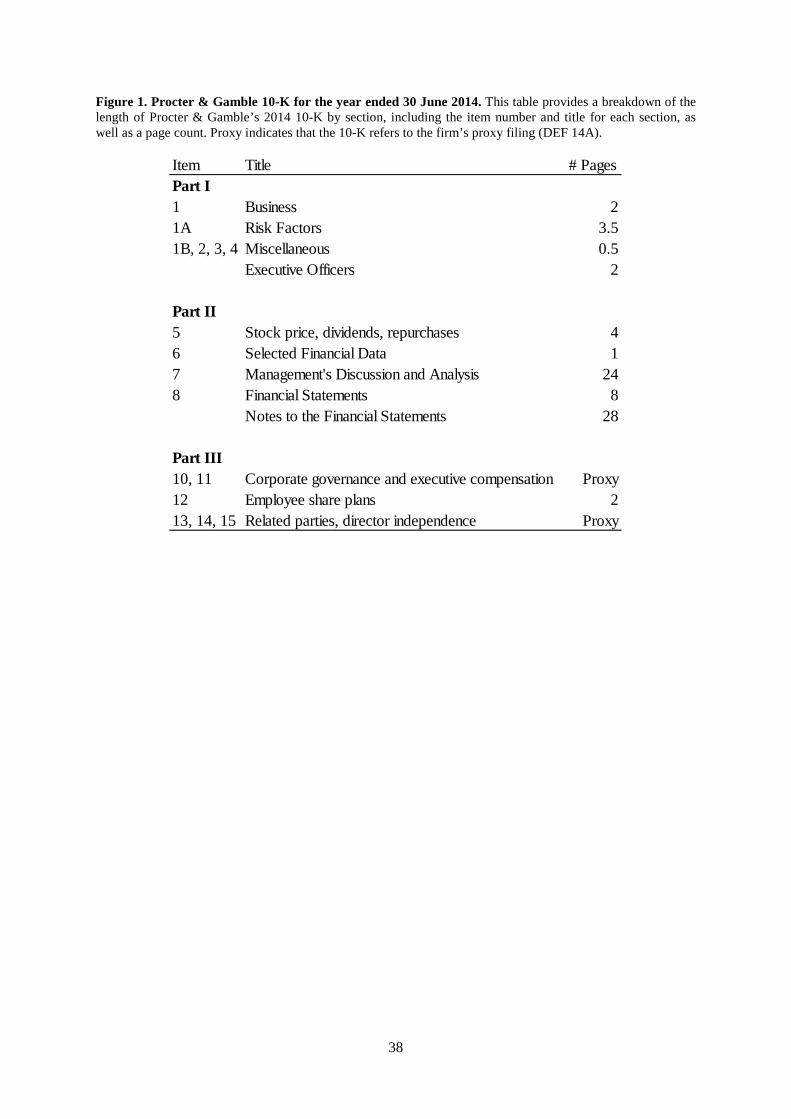
38
Figure 1. Procter & Gamble 10-K for the year ended 30 June 2014. This table provides a breakdown of the length of Procter & Gamble’s 2014 10-K by section, including the item number and title for each section, as well as a page count. Proxy indicates that the 10-K refers to the firm’s proxy filing (DEF 14A).
Item Title # PagesPart I1 Business 21A Risk Factors 3.51B, 2, 3, 4 Miscellaneous 0.5
Executive Officers 2
Part II5 Stock price, dividends, repurchases 46 Selected Financial Data 17 Management's Discussion and Analysis 248 Financial Statements 8
Notes to the Financial Statements 28
Part III10, 11 Corporate governance and executive compensation Proxy12 Employee share plans 213, 14, 15 Related parties, director independence Proxy
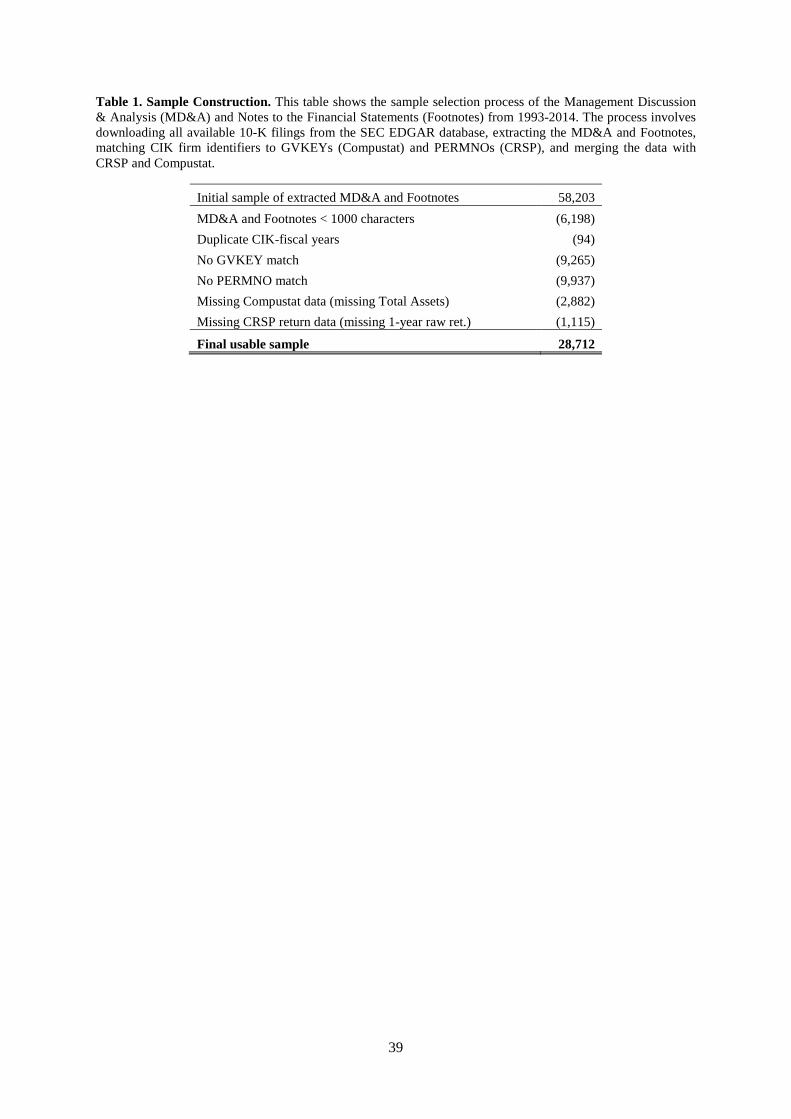
39
Table 1. Sample Construction. This table shows the sample selection process of the Management Discussion & Analysis (MD&A) and Notes to the Financial Statements (Footnotes) from 1993-2014. The process involves downloading all available 10-K filings from the SEC EDGAR database, extracting the MD&A and Footnotes, matching CIK firm identifiers to GVKEYs (Compustat) and PERMNOs (CRSP), and merging the data with CRSP and Compustat.
Initial sample of extracted MD&A and Footnotes 58,203 MD&A and Footnotes < 1000 characters (6,198) Duplicate CIK-fiscal years (94) No GVKEY match (9,265) No PERMNO match (9,937) Missing Compustat data (missing Total Assets) (2,882) Missing CRSP return data (missing 1-year raw ret.) (1,115)
Final usable sample 28,712
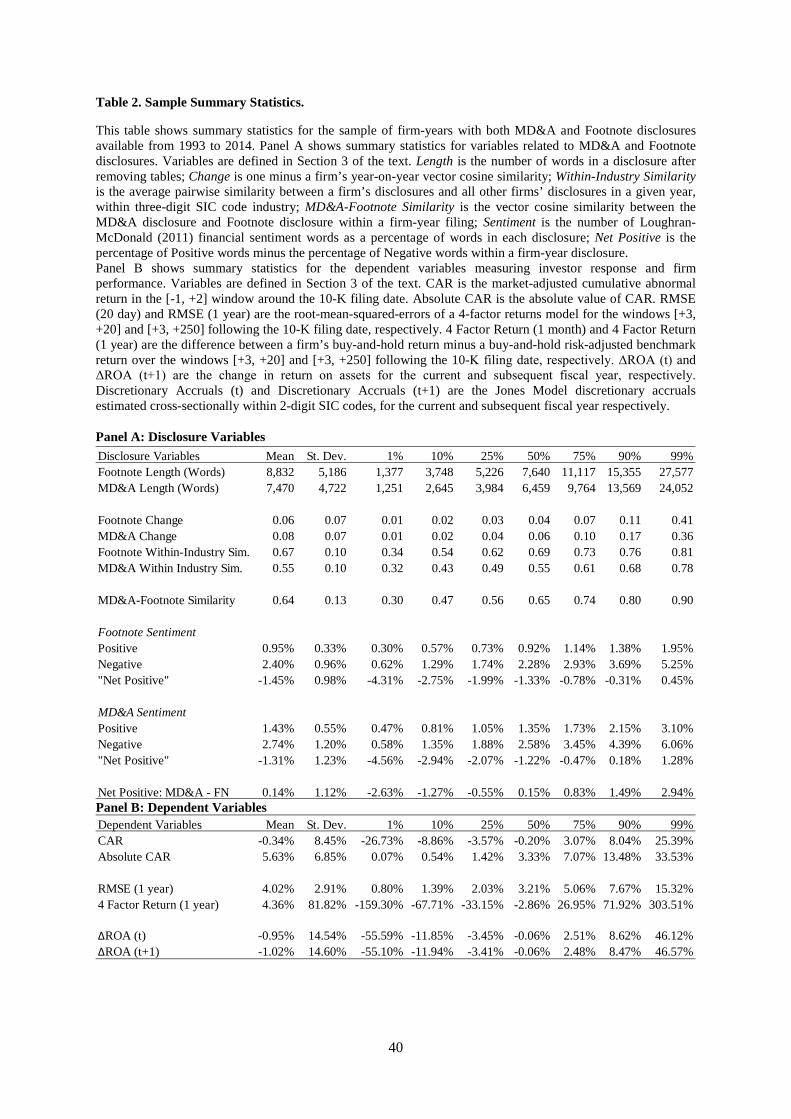
40
Table 2. Sample Summary Statistics.
This table shows summary statistics for the sample of firm-years with both MD&A and Footnote disclosures available from 1993 to 2014. Panel A shows summary statistics for variables related to MD&A and Footnote disclosures. Variables are defined in Section 3 of the text. Length is the number of words in a disclosure after removing tables; Change is one minus a firm’s year-on-year vector cosine similarity; Within-Industry Similarity is the average pairwise similarity between a firm’s disclosures and all other firms’ disclosures in a given year, within three-digit SIC code industry; MD&A-Footnote Similarity is the vector cosine similarity between the MD&A disclosure and Footnote disclosure within a firm-year filing; Sentiment is the number of Loughran-McDonald (2011) financial sentiment words as a percentage of words in each disclosure; Net Positive is the percentage of Positive words minus the percentage of Negative words within a firm-year disclosure. Panel B shows summary statistics for the dependent variables measuring investor response and firm performance. Variables are defined in Section 3 of the text. CAR is the market-adjusted cumulative abnormal return in the [-1, +2] window around the 10-K filing date. Absolute CAR is the absolute value of CAR. RMSE (20 day) and RMSE (1 year) are the root-mean-squared-errors of a 4-factor returns model for the windows [+3, +20] and [+3, +250] following the 10-K filing date, respectively. 4 Factor Return (1 month) and 4 Factor Return (1 year) are the difference between a firm’s buy-and-hold return minus a buy-and-hold risk-adjusted benchmark return over the windows [+3, +20] and [+3, +250] following the 10-K filing date, respectively. ΔROA (t) and ΔROA (t+1) are the change in return on assets for the current and subsequent fiscal year, respectively. Discretionary Accruals (t) and Discretionary Accruals (t+1) are the Jones Model discretionary accruals estimated cross-sectionally within 2-digit SIC codes, for the current and subsequent fiscal year respectively. Panel A: Disclosure Variables
Panel B: Dependent Variables
Disclosure Variables Mean St. Dev. 1% 10% 25% 50% 75% 90% 99%Footnote Length (Words) 8,832 5,186 1,377 3,748 5,226 7,640 11,117 15,355 27,577MD&A Length (Words) 7,470 4,722 1,251 2,645 3,984 6,459 9,764 13,569 24,052
Footnote Change 0.06 0.07 0.01 0.02 0.03 0.04 0.07 0.11 0.41MD&A Change 0.08 0.07 0.01 0.02 0.04 0.06 0.10 0.17 0.36Footnote Within-Industry Sim. 0.67 0.10 0.34 0.54 0.62 0.69 0.73 0.76 0.81MD&A Within Industry Sim. 0.55 0.10 0.32 0.43 0.49 0.55 0.61 0.68 0.78
MD&A-Footnote Similarity 0.64 0.13 0.30 0.47 0.56 0.65 0.74 0.80 0.90
Footnote SentimentPositive 0.95% 0.33% 0.30% 0.57% 0.73% 0.92% 1.14% 1.38% 1.95%Negative 2.40% 0.96% 0.62% 1.29% 1.74% 2.28% 2.93% 3.69% 5.25%"Net Positive" -1.45% 0.98% -4.31% -2.75% -1.99% -1.33% -0.78% -0.31% 0.45%
MD&A SentimentPositive 1.43% 0.55% 0.47% 0.81% 1.05% 1.35% 1.73% 2.15% 3.10%Negative 2.74% 1.20% 0.58% 1.35% 1.88% 2.58% 3.45% 4.39% 6.06%"Net Positive" -1.31% 1.23% -4.56% -2.94% -2.07% -1.22% -0.47% 0.18% 1.28%
Net Positive: MD&A - FN 0.14% 1.12% -2.63% -1.27% -0.55% 0.15% 0.83% 1.49% 2.94%
Dependent Variables Mean St. Dev. 1% 10% 25% 50% 75% 90% 99%CAR -0.34% 8.45% -26.73% -8.86% -3.57% -0.20% 3.07% 8.04% 25.39%Absolute CAR 5.63% 6.85% 0.07% 0.54% 1.42% 3.33% 7.07% 13.48% 33.53%
RMSE (1 year) 4.02% 2.91% 0.80% 1.39% 2.03% 3.21% 5.06% 7.67% 15.32%4 Factor Return (1 year) 4.36% 81.82% -159.30% -67.71% -33.15% -2.86% 26.95% 71.92% 303.51%
ΔROA (t) -0.95% 14.54% -55.59% -11.85% -3.45% -0.06% 2.51% 8.62% 46.12%ΔROA (t+1) -1.02% 14.60% -55.10% -11.94% -3.41% -0.06% 2.48% 8.47% 46.57%
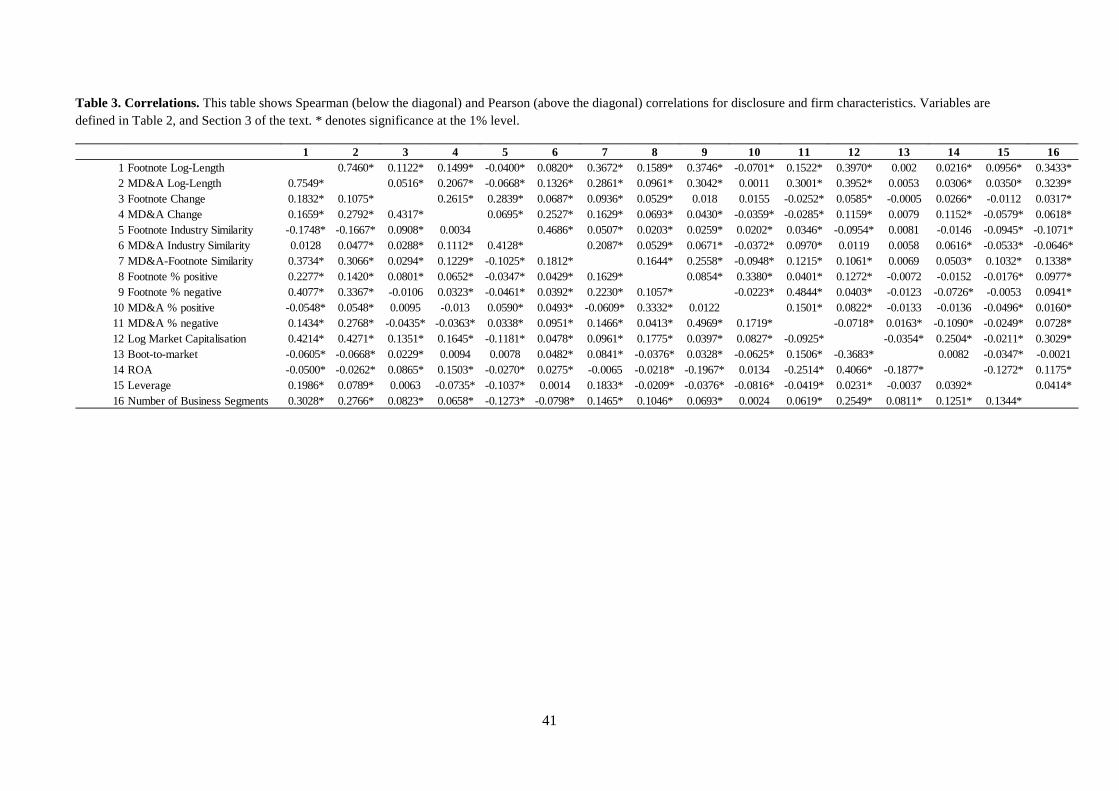
41
Table 3. Correlations. This table shows Spearman (below the diagonal) and Pearson (above the diagonal) correlations for disclosure and firm characteristics. Variables are defined in Table 2, and Section 3 of the text. * denotes significance at the 1% level.
1 2 3 4 5 6 7 8 9 10 11 12 13 14 15 161 Footnote Log-Length 0.7460* 0.1122* 0.1499* -0.0400* 0.0820* 0.3672* 0.1589* 0.3746* -0.0701* 0.1522* 0.3970* 0.002 0.0216* 0.0956* 0.3433*2 MD&A Log-Length 0.7549* 0.0516* 0.2067* -0.0668* 0.1326* 0.2861* 0.0961* 0.3042* 0.0011 0.3001* 0.3952* 0.0053 0.0306* 0.0350* 0.3239*3 Footnote Change 0.1832* 0.1075* 0.2615* 0.2839* 0.0687* 0.0936* 0.0529* 0.018 0.0155 -0.0252* 0.0585* -0.0005 0.0266* -0.0112 0.0317*4 MD&A Change 0.1659* 0.2792* 0.4317* 0.0695* 0.2527* 0.1629* 0.0693* 0.0430* -0.0359* -0.0285* 0.1159* 0.0079 0.1152* -0.0579* 0.0618*5 Footnote Industry Similarity -0.1748* -0.1667* 0.0908* 0.0034 0.4686* 0.0507* 0.0203* 0.0259* 0.0202* 0.0346* -0.0954* 0.0081 -0.0146 -0.0945* -0.1071*6 MD&A Industry Similarity 0.0128 0.0477* 0.0288* 0.1112* 0.4128* 0.2087* 0.0529* 0.0671* -0.0372* 0.0970* 0.0119 0.0058 0.0616* -0.0533* -0.0646*7 MD&A-Footnote Similarity 0.3734* 0.3066* 0.0294* 0.1229* -0.1025* 0.1812* 0.1644* 0.2558* -0.0948* 0.1215* 0.1061* 0.0069 0.0503* 0.1032* 0.1338*8 Footnote % positive 0.2277* 0.1420* 0.0801* 0.0652* -0.0347* 0.0429* 0.1629* 0.0854* 0.3380* 0.0401* 0.1272* -0.0072 -0.0152 -0.0176* 0.0977*9 Footnote % negative 0.4077* 0.3367* -0.0106 0.0323* -0.0461* 0.0392* 0.2230* 0.1057* -0.0223* 0.4844* 0.0403* -0.0123 -0.0726* -0.0053 0.0941*
10 MD&A % positive -0.0548* 0.0548* 0.0095 -0.013 0.0590* 0.0493* -0.0609* 0.3332* 0.0122 0.1501* 0.0822* -0.0133 -0.0136 -0.0496* 0.0160*11 MD&A % negative 0.1434* 0.2768* -0.0435* -0.0363* 0.0338* 0.0951* 0.1466* 0.0413* 0.4969* 0.1719* -0.0718* 0.0163* -0.1090* -0.0249* 0.0728*12 Log Market Capitalisation 0.4214* 0.4271* 0.1351* 0.1645* -0.1181* 0.0478* 0.0961* 0.1775* 0.0397* 0.0827* -0.0925* -0.0354* 0.2504* -0.0211* 0.3029*13 Boot-to-market -0.0605* -0.0668* 0.0229* 0.0094 0.0078 0.0482* 0.0841* -0.0376* 0.0328* -0.0625* 0.1506* -0.3683* 0.0082 -0.0347* -0.002114 ROA -0.0500* -0.0262* 0.0865* 0.1503* -0.0270* 0.0275* -0.0065 -0.0218* -0.1967* 0.0134 -0.2514* 0.4066* -0.1877* -0.1272* 0.1175*15 Leverage 0.1986* 0.0789* 0.0063 -0.0735* -0.1037* 0.0014 0.1833* -0.0209* -0.0376* -0.0816* -0.0419* 0.0231* -0.0037 0.0392* 0.0414*16 Number of Business Segments 0.3028* 0.2766* 0.0823* 0.0658* -0.1273* -0.0798* 0.1465* 0.1046* 0.0693* 0.0024 0.0619* 0.2549* 0.0811* 0.1251* 0.1344*
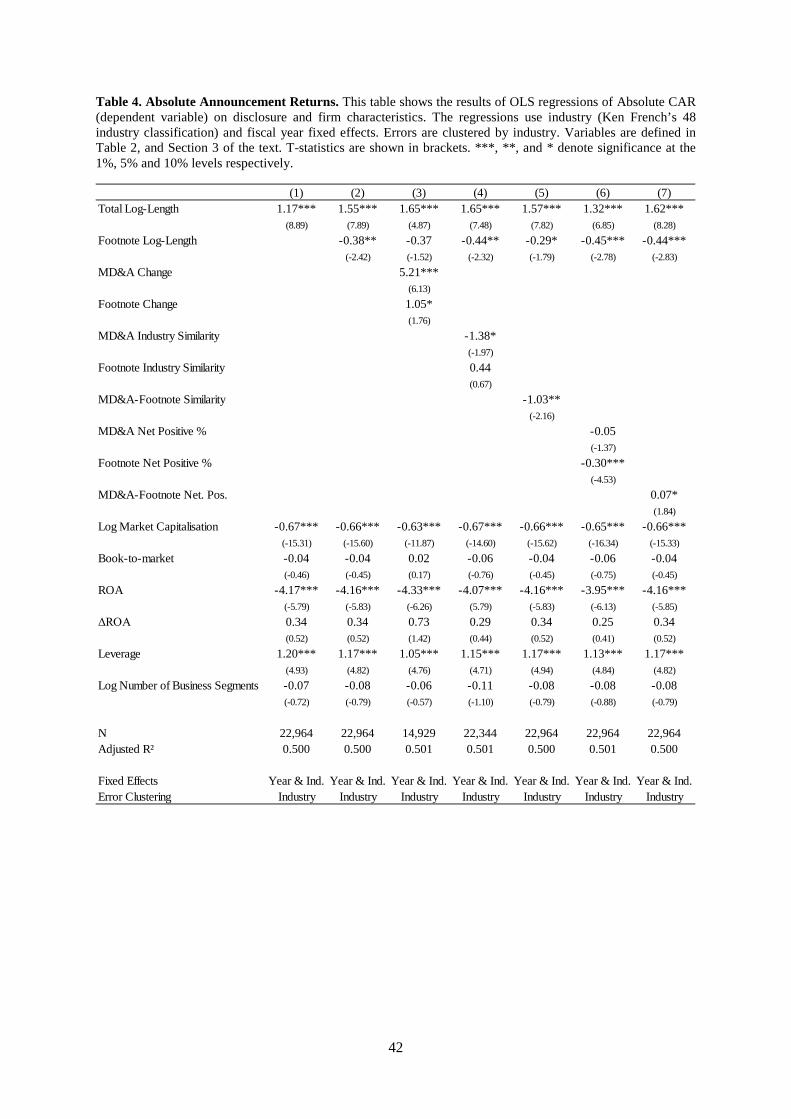
42
Table 4. Absolute Announcement Returns. This table shows the results of OLS regressions of Absolute CAR (dependent variable) on disclosure and firm characteristics. The regressions use industry (Ken French’s 48 industry classification) and fiscal year fixed effects. Errors are clustered by industry. Variables are defined in Table 2, and Section 3 of the text. T-statistics are shown in brackets. ***, **, and * denote significance at the 1%, 5% and 10% levels respectively.
(1) (2) (3) (4) (5) (6) (7)Total Log-Length 1.17*** 1.55*** 1.65*** 1.65*** 1.57*** 1.32*** 1.62***
(8.89) (7.89) (4.87) (7.48) (7.82) (6.85) (8.28)Footnote Log-Length -0.38** -0.37 -0.44** -0.29* -0.45*** -0.44***
(-2.42) (-1.52) (-2.32) (-1.79) (-2.78) (-2.83)MD&A Change 5.21***
(6.13)Footnote Change 1.05*
(1.76)MD&A Industry Similarity -1.38*
(-1.97)Footnote Industry Similarity 0.44
(0.67)MD&A-Footnote Similarity -1.03**
(-2.16)MD&A Net Positive % -0.05
(-1.37)Footnote Net Positive % -0.30***
(-4.53)MD&A-Footnote Net. Pos. 0.07*
(1.84)Log Market Capitalisation -0.67*** -0.66*** -0.63*** -0.67*** -0.66*** -0.65*** -0.66***
(-15.31) (-15.60) (-11.87) (-14.60) (-15.62) (-16.34) (-15.33)Book-to-market -0.04 -0.04 0.02 -0.06 -0.04 -0.06 -0.04
(-0.46) (-0.45) (0.17) (-0.76) (-0.45) (-0.75) (-0.45)ROA -4.17*** -4.16*** -4.33*** -4.07*** -4.16*** -3.95*** -4.16***
(-5.79) (-5.83) (-6.26) (5.79) (-5.83) (-6.13) (-5.85)ΔROA 0.34 0.34 0.73 0.29 0.34 0.25 0.34
(0.52) (0.52) (1.42) (0.44) (0.52) (0.41) (0.52)Leverage 1.20*** 1.17*** 1.05*** 1.15*** 1.17*** 1.13*** 1.17***
(4.93) (4.82) (4.76) (4.71) (4.94) (4.84) (4.82)Log Number of Business Segments -0.07 -0.08 -0.06 -0.11 -0.08 -0.08 -0.08
(-0.72) (-0.79) (-0.57) (-1.10) (-0.79) (-0.88) (-0.79)
N 22,964 22,964 14,929 22,344 22,964 22,964 22,964Adjusted R² 0.500 0.500 0.501 0.501 0.500 0.501 0.500
Fixed Effects Year & Ind. Year & Ind. Year & Ind. Year & Ind. Year & Ind. Year & Ind. Year & Ind.Error Clustering Industry Industry Industry Industry Industry Industry Industry
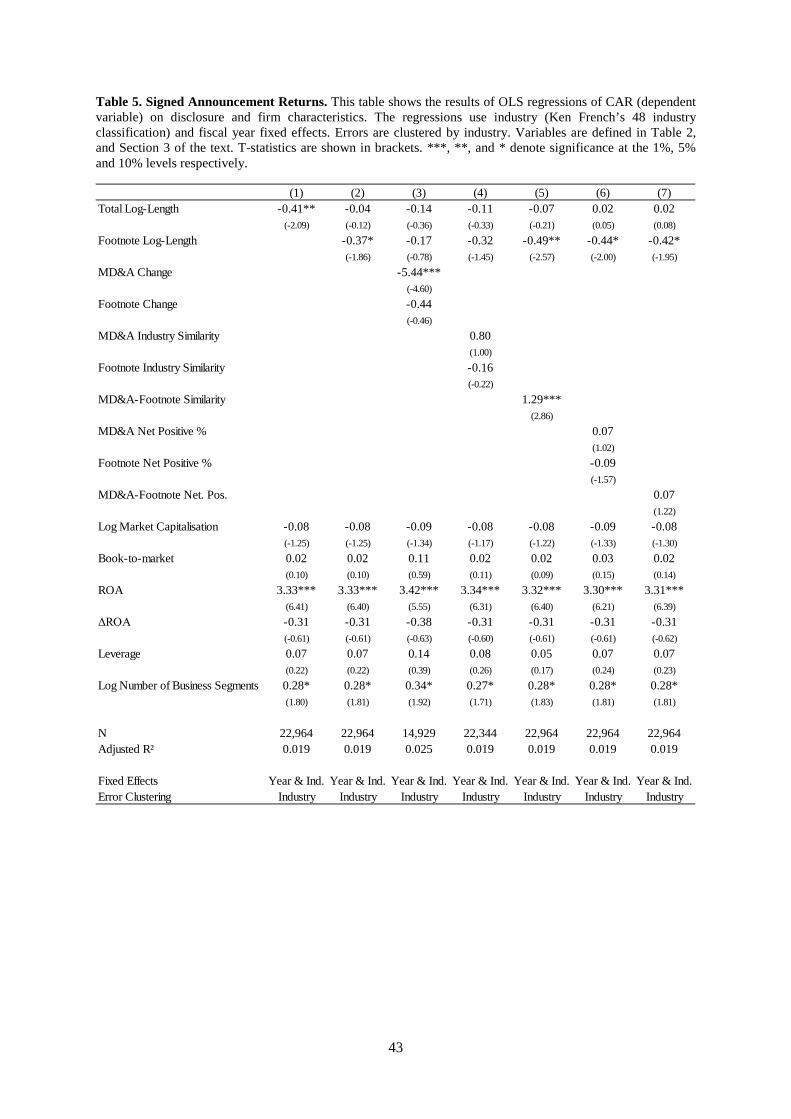
43
Table 5. Signed Announcement Returns. This table shows the results of OLS regressions of CAR (dependent variable) on disclosure and firm characteristics. The regressions use industry (Ken French’s 48 industry classification) and fiscal year fixed effects. Errors are clustered by industry. Variables are defined in Table 2, and Section 3 of the text. T-statistics are shown in brackets. ***, **, and * denote significance at the 1%, 5% and 10% levels respectively.
(1) (2) (3) (4) (5) (6) (7)Total Log-Length -0.41** -0.04 -0.14 -0.11 -0.07 0.02 0.02
(-2.09) (-0.12) (-0.36) (-0.33) (-0.21) (0.05) (0.08)Footnote Log-Length -0.37* -0.17 -0.32 -0.49** -0.44* -0.42*
(-1.86) (-0.78) (-1.45) (-2.57) (-2.00) (-1.95)MD&A Change -5.44***
(-4.60)Footnote Change -0.44
(-0.46)MD&A Industry Similarity 0.80
(1.00)Footnote Industry Similarity -0.16
(-0.22)MD&A-Footnote Similarity 1.29***
(2.86)MD&A Net Positive % 0.07
(1.02)Footnote Net Positive % -0.09
(-1.57)MD&A-Footnote Net. Pos. 0.07
(1.22)Log Market Capitalisation -0.08 -0.08 -0.09 -0.08 -0.08 -0.09 -0.08
(-1.25) (-1.25) (-1.34) (-1.17) (-1.22) (-1.33) (-1.30)Book-to-market 0.02 0.02 0.11 0.02 0.02 0.03 0.02
(0.10) (0.10) (0.59) (0.11) (0.09) (0.15) (0.14)ROA 3.33*** 3.33*** 3.42*** 3.34*** 3.32*** 3.30*** 3.31***
(6.41) (6.40) (5.55) (6.31) (6.40) (6.21) (6.39)ΔROA -0.31 -0.31 -0.38 -0.31 -0.31 -0.31 -0.31
(-0.61) (-0.61) (-0.63) (-0.60) (-0.61) (-0.61) (-0.62)Leverage 0.07 0.07 0.14 0.08 0.05 0.07 0.07
(0.22) (0.22) (0.39) (0.26) (0.17) (0.24) (0.23)Log Number of Business Segments 0.28* 0.28* 0.34* 0.27* 0.28* 0.28* 0.28*
(1.80) (1.81) (1.92) (1.71) (1.83) (1.81) (1.81)
N 22,964 22,964 14,929 22,344 22,964 22,964 22,964Adjusted R² 0.019 0.019 0.025 0.019 0.019 0.019 0.019
Fixed Effects Year & Ind. Year & Ind. Year & Ind. Year & Ind. Year & Ind. Year & Ind. Year & Ind.Error Clustering Industry Industry Industry Industry Industry Industry Industry
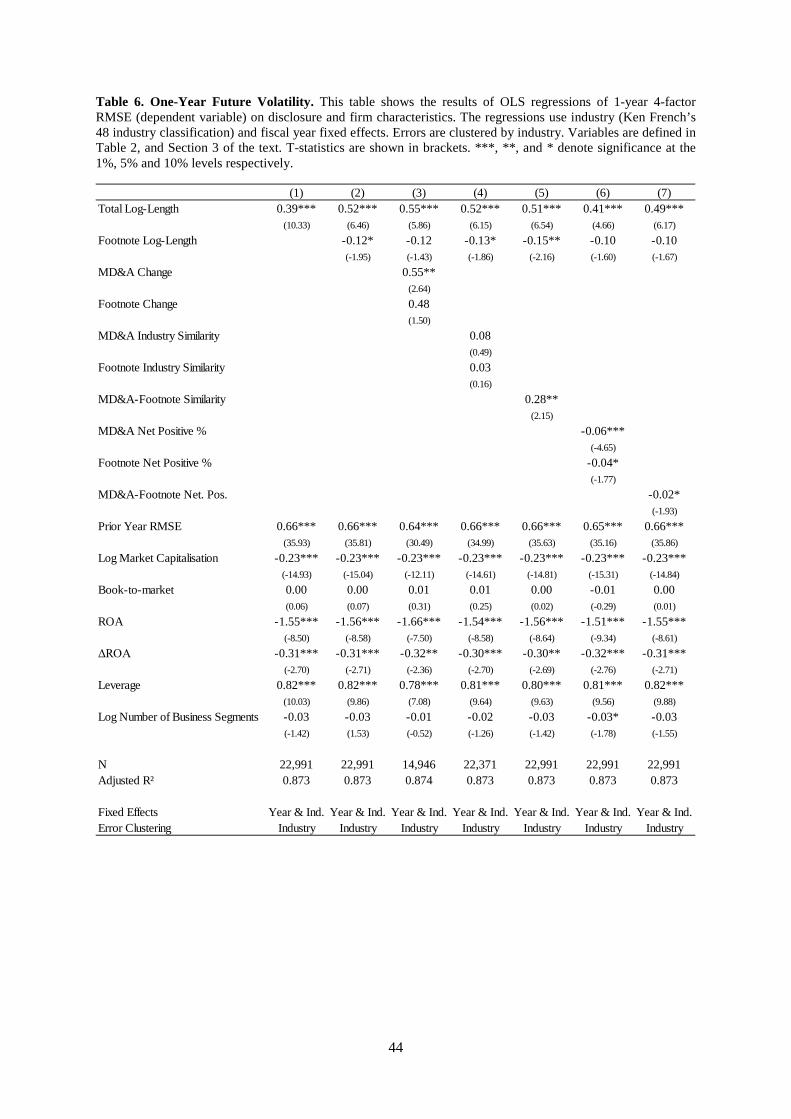
44
Table 6. One-Year Future Volatility. This table shows the results of OLS regressions of 1-year 4-factor RMSE (dependent variable) on disclosure and firm characteristics. The regressions use industry (Ken French’s 48 industry classification) and fiscal year fixed effects. Errors are clustered by industry. Variables are defined in Table 2, and Section 3 of the text. T-statistics are shown in brackets. ***, **, and * denote significance at the 1%, 5% and 10% levels respectively.
(1) (2) (3) (4) (5) (6) (7)Total Log-Length 0.39*** 0.52*** 0.55*** 0.52*** 0.51*** 0.41*** 0.49***
(10.33) (6.46) (5.86) (6.15) (6.54) (4.66) (6.17)Footnote Log-Length -0.12* -0.12 -0.13* -0.15** -0.10 -0.10
(-1.95) (-1.43) (-1.86) (-2.16) (-1.60) (-1.67)MD&A Change 0.55**
(2.64)Footnote Change 0.48
(1.50)MD&A Industry Similarity 0.08
(0.49)Footnote Industry Similarity 0.03
(0.16)MD&A-Footnote Similarity 0.28**
(2.15)MD&A Net Positive % -0.06***
(-4.65)Footnote Net Positive % -0.04*
(-1.77)MD&A-Footnote Net. Pos. -0.02*
(-1.93)Prior Year RMSE 0.66*** 0.66*** 0.64*** 0.66*** 0.66*** 0.65*** 0.66***
(35.93) (35.81) (30.49) (34.99) (35.63) (35.16) (35.86)Log Market Capitalisation -0.23*** -0.23*** -0.23*** -0.23*** -0.23*** -0.23*** -0.23***
(-14.93) (-15.04) (-12.11) (-14.61) (-14.81) (-15.31) (-14.84)Book-to-market 0.00 0.00 0.01 0.01 0.00 -0.01 0.00
(0.06) (0.07) (0.31) (0.25) (0.02) (-0.29) (0.01)ROA -1.55*** -1.56*** -1.66*** -1.54*** -1.56*** -1.51*** -1.55***
(-8.50) (-8.58) (-7.50) (-8.58) (-8.64) (-9.34) (-8.61)ΔROA -0.31*** -0.31*** -0.32** -0.30*** -0.30** -0.32*** -0.31***
(-2.70) (-2.71) (-2.36) (-2.70) (-2.69) (-2.76) (-2.71)Leverage 0.82*** 0.82*** 0.78*** 0.81*** 0.80*** 0.81*** 0.82***
(10.03) (9.86) (7.08) (9.64) (9.63) (9.56) (9.88)Log Number of Business Segments -0.03 -0.03 -0.01 -0.02 -0.03 -0.03* -0.03
(-1.42) (1.53) (-0.52) (-1.26) (-1.42) (-1.78) (-1.55)
N 22,991 22,991 14,946 22,371 22,991 22,991 22,991Adjusted R² 0.873 0.873 0.874 0.873 0.873 0.873 0.873
Fixed Effects Year & Ind. Year & Ind. Year & Ind. Year & Ind. Year & Ind. Year & Ind. Year & Ind.Error Clustering Industry Industry Industry Industry Industry Industry Industry
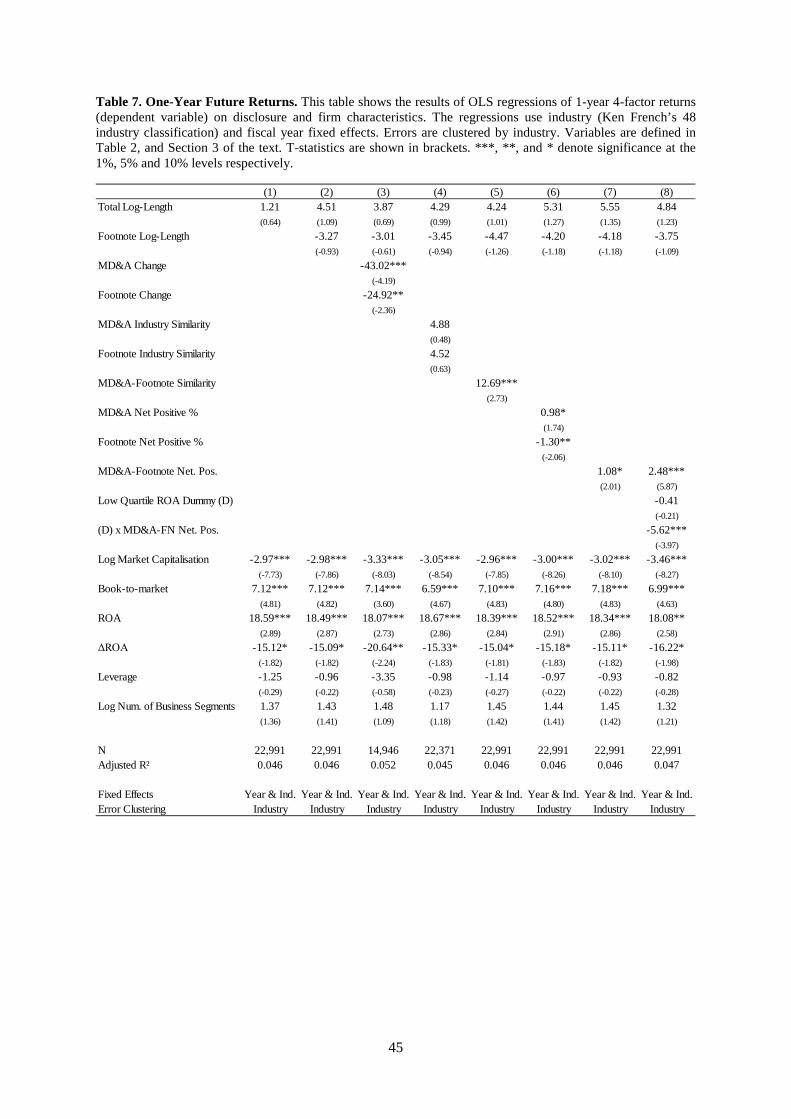
45
Table 7. One-Year Future Returns. This table shows the results of OLS regressions of 1-year 4-factor returns (dependent variable) on disclosure and firm characteristics. The regressions use industry (Ken French’s 48 industry classification) and fiscal year fixed effects. Errors are clustered by industry. Variables are defined in Table 2, and Section 3 of the text. T-statistics are shown in brackets. ***, **, and * denote significance at the 1%, 5% and 10% levels respectively.
(1) (2) (3) (4) (5) (6) (7) (8)Total Log-Length 1.21 4.51 3.87 4.29 4.24 5.31 5.55 4.84
(0.64) (1.09) (0.69) (0.99) (1.01) (1.27) (1.35) (1.23)Footnote Log-Length -3.27 -3.01 -3.45 -4.47 -4.20 -4.18 -3.75
(-0.93) (-0.61) (-0.94) (-1.26) (-1.18) (-1.18) (-1.09)MD&A Change -43.02***
(-4.19)Footnote Change -24.92**
(-2.36)MD&A Industry Similarity 4.88
(0.48)Footnote Industry Similarity 4.52
(0.63)MD&A-Footnote Similarity 12.69***
(2.73)MD&A Net Positive % 0.98*
(1.74)Footnote Net Positive % -1.30**
(-2.06)MD&A-Footnote Net. Pos. 1.08* 2.48***
(2.01) (5.87)Low Quartile ROA Dummy (D) -0.41
(-0.21)(D) x MD&A-FN Net. Pos. -5.62***
(-3.97)Log Market Capitalisation -2.97*** -2.98*** -3.33*** -3.05*** -2.96*** -3.00*** -3.02*** -3.46***
(-7.73) (-7.86) (-8.03) (-8.54) (-7.85) (-8.26) (-8.10) (-8.27)Book-to-market 7.12*** 7.12*** 7.14*** 6.59*** 7.10*** 7.16*** 7.18*** 6.99***
(4.81) (4.82) (3.60) (4.67) (4.83) (4.80) (4.83) (4.63)ROA 18.59*** 18.49*** 18.07*** 18.67*** 18.39*** 18.52*** 18.34*** 18.08**
(2.89) (2.87) (2.73) (2.86) (2.84) (2.91) (2.86) (2.58)ΔROA -15.12* -15.09* -20.64** -15.33* -15.04* -15.18* -15.11* -16.22*
(-1.82) (-1.82) (-2.24) (-1.83) (-1.81) (-1.83) (-1.82) (-1.98)Leverage -1.25 -0.96 -3.35 -0.98 -1.14 -0.97 -0.93 -0.82
(-0.29) (-0.22) (-0.58) (-0.23) (-0.27) (-0.22) (-0.22) (-0.28)Log Num. of Business Segments 1.37 1.43 1.48 1.17 1.45 1.44 1.45 1.32
(1.36) (1.41) (1.09) (1.18) (1.42) (1.41) (1.42) (1.21)
N 22,991 22,991 14,946 22,371 22,991 22,991 22,991 22,991Adjusted R² 0.046 0.046 0.052 0.045 0.046 0.046 0.046 0.047
Fixed Effects Year & Ind. Year & Ind. Year & Ind. Year & Ind. Year & Ind. Year & Ind. Year & Ind. Year & Ind.Error Clustering Industry Industry Industry Industry Industry Industry Industry Industry
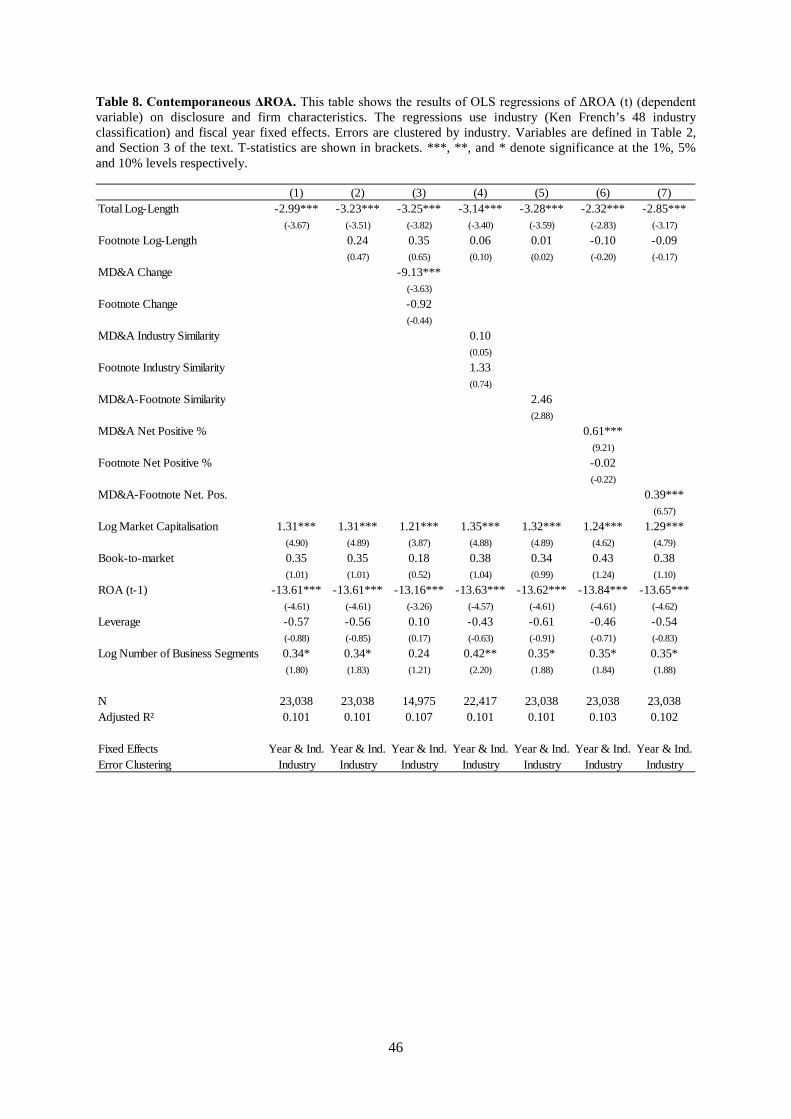
46
Table 8. Contemporaneous ΔROA. This table shows the results of OLS regressions of ΔROA (t) (dependent variable) on disclosure and firm characteristics. The regressions use industry (Ken French’s 48 industry classification) and fiscal year fixed effects. Errors are clustered by industry. Variables are defined in Table 2, and Section 3 of the text. T-statistics are shown in brackets. ***, **, and * denote significance at the 1%, 5% and 10% levels respectively.
(1) (2) (3) (4) (5) (6) (7)Total Log-Length -2.99*** -3.23*** -3.25*** -3.14*** -3.28*** -2.32*** -2.85***
(-3.67) (-3.51) (-3.82) (-3.40) (-3.59) (-2.83) (-3.17)Footnote Log-Length 0.24 0.35 0.06 0.01 -0.10 -0.09
(0.47) (0.65) (0.10) (0.02) (-0.20) (-0.17)MD&A Change -9.13***
(-3.63)Footnote Change -0.92
(-0.44)MD&A Industry Similarity 0.10
(0.05)Footnote Industry Similarity 1.33
(0.74)MD&A-Footnote Similarity 2.46
(2.88)MD&A Net Positive % 0.61***
(9.21)Footnote Net Positive % -0.02
(-0.22)MD&A-Footnote Net. Pos. 0.39***
(6.57)Log Market Capitalisation 1.31*** 1.31*** 1.21*** 1.35*** 1.32*** 1.24*** 1.29***
(4.90) (4.89) (3.87) (4.88) (4.89) (4.62) (4.79)Book-to-market 0.35 0.35 0.18 0.38 0.34 0.43 0.38
(1.01) (1.01) (0.52) (1.04) (0.99) (1.24) (1.10)ROA (t-1) -13.61*** -13.61*** -13.16*** -13.63*** -13.62*** -13.84*** -13.65***
(-4.61) (-4.61) (-3.26) (-4.57) (-4.61) (-4.61) (-4.62)Leverage -0.57 -0.56 0.10 -0.43 -0.61 -0.46 -0.54
(-0.88) (-0.85) (0.17) (-0.63) (-0.91) (-0.71) (-0.83)Log Number of Business Segments 0.34* 0.34* 0.24 0.42** 0.35* 0.35* 0.35*
(1.80) (1.83) (1.21) (2.20) (1.88) (1.84) (1.88)
N 23,038 23,038 14,975 22,417 23,038 23,038 23,038Adjusted R² 0.101 0.101 0.107 0.101 0.101 0.103 0.102
Fixed Effects Year & Ind. Year & Ind. Year & Ind. Year & Ind. Year & Ind. Year & Ind. Year & Ind.Error Clustering Industry Industry Industry Industry Industry Industry Industry
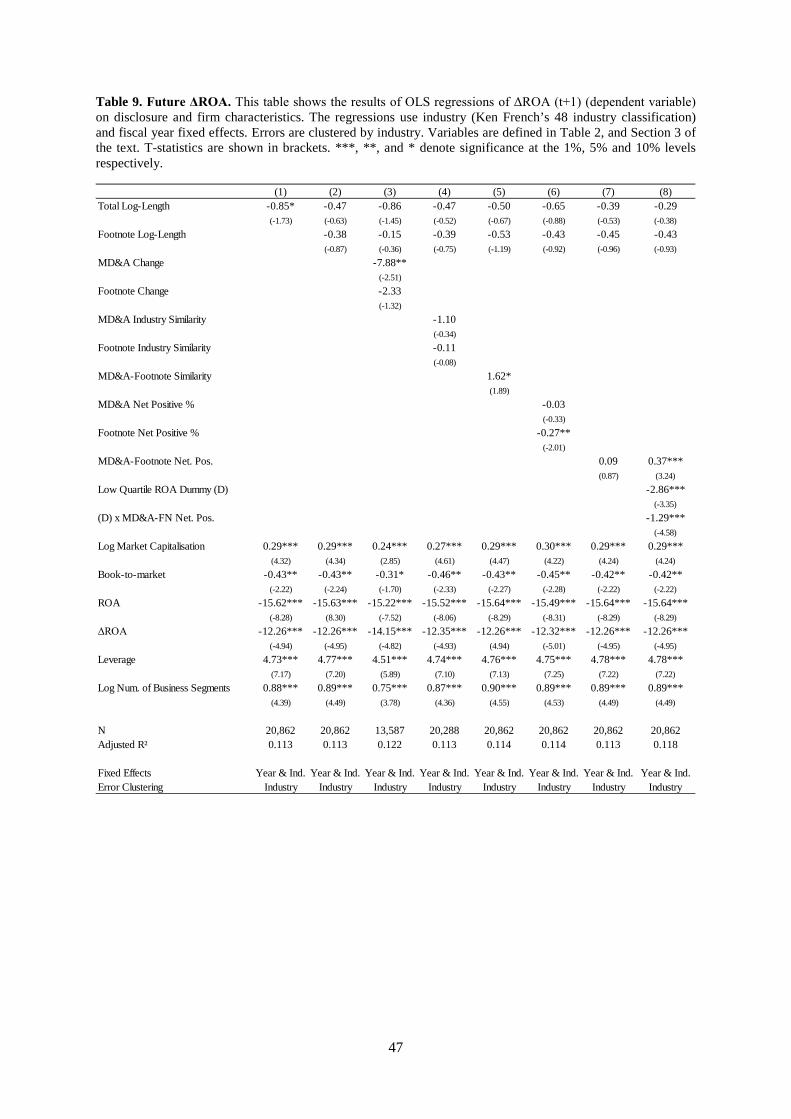
47
Table 9. Future ΔROA. This table shows the results of OLS regressions of ΔROA (t+1) (dependent variable) on disclosure and firm characteristics. The regressions use industry (Ken French’s 48 industry classification) and fiscal year fixed effects. Errors are clustered by industry. Variables are defined in Table 2, and Section 3 of the text. T-statistics are shown in brackets. ***, **, and * denote significance at the 1%, 5% and 10% levels respectively.
(1) (2) (3) (4) (5) (6) (7) (8)Total Log-Length -0.85* -0.47 -0.86 -0.47 -0.50 -0.65 -0.39 -0.29
(-1.73) (-0.63) (-1.45) (-0.52) (-0.67) (-0.88) (-0.53) (-0.38)Footnote Log-Length -0.38 -0.15 -0.39 -0.53 -0.43 -0.45 -0.43
(-0.87) (-0.36) (-0.75) (-1.19) (-0.92) (-0.96) (-0.93)MD&A Change -7.88**
(-2.51)Footnote Change -2.33
(-1.32)MD&A Industry Similarity -1.10
(-0.34)Footnote Industry Similarity -0.11
(-0.08)MD&A-Footnote Similarity 1.62*
(1.89)MD&A Net Positive % -0.03
(-0.33)Footnote Net Positive % -0.27**
(-2.01)MD&A-Footnote Net. Pos. 0.09 0.37***
(0.87) (3.24)Low Quartile ROA Dummy (D) -2.86***
(-3.35)(D) x MD&A-FN Net. Pos. -1.29***
(-4.58)Log Market Capitalisation 0.29*** 0.29*** 0.24*** 0.27*** 0.29*** 0.30*** 0.29*** 0.29***
(4.32) (4.34) (2.85) (4.61) (4.47) (4.22) (4.24) (4.24)Book-to-market -0.43** -0.43** -0.31* -0.46** -0.43** -0.45** -0.42** -0.42**
(-2.22) (-2.24) (-1.70) (-2.33) (-2.27) (-2.28) (-2.22) (-2.22)ROA -15.62*** -15.63*** -15.22*** -15.52*** -15.64*** -15.49*** -15.64*** -15.64***
(-8.28) (8.30) (-7.52) (-8.06) (-8.29) (-8.31) (-8.29) (-8.29)ΔROA -12.26*** -12.26*** -14.15*** -12.35*** -12.26*** -12.32*** -12.26*** -12.26***
(-4.94) (-4.95) (-4.82) (-4.93) (4.94) (-5.01) (-4.95) (-4.95)Leverage 4.73*** 4.77*** 4.51*** 4.74*** 4.76*** 4.75*** 4.78*** 4.78***
(7.17) (7.20) (5.89) (7.10) (7.13) (7.25) (7.22) (7.22)Log Num. of Business Segments 0.88*** 0.89*** 0.75*** 0.87*** 0.90*** 0.89*** 0.89*** 0.89***
(4.39) (4.49) (3.78) (4.36) (4.55) (4.53) (4.49) (4.49)
N 20,862 20,862 13,587 20,288 20,862 20,862 20,862 20,862Adjusted R² 0.113 0.113 0.122 0.113 0.114 0.114 0.113 0.118
Fixed Effects Year & Ind. Year & Ind. Year & Ind. Year & Ind. Year & Ind. Year & Ind. Year & Ind. Year & Ind.Error Clustering Industry Industry Industry Industry Industry Industry Industry Industry