Embed Size (px)
Citation preview
THE INFLUENCE OF PROMOTION AND AFTER-SALES
SERVICE, TOWARD CUSTOMER SATISFACTION THAT
IMPACT RE-PURCHASE INTENTION OF HONDA
MOTORCYLCE
(case study on PAMULANG society)
By:
Erbby Danastian
111008110021
DEPARTMENT OF MANAGEMENT INTERNATIONAL CLASS
PROGRAM FACULTY OF ECONOMICS AND BUSINESS
SYARIF HIDAYATULLAH STATE ISLAMIC
UNIVERSITY JAKARTA
1438 AH/ 2016 AD
THE INFLUENCE OF PROMOTION AND AFTER-SALES SERVICE,
TOWARD CUSTOMER SATISFACTION THAT IMPACT RE-PIRCHASE
INTENTION OF HONDA MOTORCYCLE ( Case Study on Pamulang
Society)
Undergraduate Thesis
Submitted to Faculty of Economics and Business
In Partial Requirements
For Acquiring the Bachelor degree of Economics
By:
Erbby Danastian
1110081100021
UnDerd Supervision of
Supervisor
MANAGEMENT DEPARTEMENT
INTERNATIONAL CLASS PROGRAM
THE FACULTY OF ECONOMICS AND BUSINESS
SYARIF HIDAYATULLAH STATE ISLAMIC UNIVERSITY
JAKARTA
1437 H/2017


6
CURRICULUM VITAE
CONTACT INFORMATION
Name : Erbby Danastian
Home Address : JL. Swadaya IV RT 007/005 Pondok Benda Pamulang
Cell Phone : 0812 5459 5911
Email Address : [email protected]
PERSONAL INFORMATION
Place/ Date of Birth : Jakarta, January 6th, 1993
Citizenship : Indonesia
Sex : Male
Religion : islam
EDUCATION
1998 – 1999 : Tk Atikan
1999 – 2004 : SDN 3 Purwodadi
2004 – 2007 : SMP Hang Tuah 2 Jakarta
2007 – 2010 : SMAN 8 Tangerang Selatan
2010 – 2017 : UIN Syarif Hidayatullah Jakarta
ORGANIZATIONAL EXPERIENCE
2010-2014 : Consultant Performance in Basiru of Shuffle

7
ABSTRACT
The purpose of this research is to analyze the influence of promotion and
after-sales services, toward customer satisfaction that impact re-purchase
intention Honda motorcycle. The data that have been used for this research are
primary data and it has been collected from 100 respondents who have been using
Honda motorcycle. The technique sampling used in this research is convenience
sampling with users spread to 100 respondent of Honda motorcycle in pamulang
society. The method of this research is path analysis. (1) promotion significantly
influence on customer satisfaction directly (2)after-sales services significantly
influence on customer satisfaction directly (3) promotion significantly influence
on re-purchase intention directly (4) after-sales service significantly influence on
re-purchase intention directly (5) customer satisfaction significantly influence on
re-purchase intention directly. Based on the result of F test variable promotion,
after-sales service, customer satisfaction have significant influence
simultaneously on purchase re-purchase intention. The most dominant variable is
the variable promotion where t test is the highest among other variable.
Keyword: Promotion, After-sales Service, Customer Satisfaction, Re-purchase
Intention
8
ABSTRAK
Tujuan dari penelitian ini untuk menganalisi pengaruh promosi dan
layanan purna jual terhadap kepuasan pelanggan dan dampaknya terhadap niat
pembelian ulang pada sepeda motor Honda. Jenis penelitian ini adalah data
primer dengan cara sampling pengguna sepeda motor Honda di Pamulang. Data
di kumpulkan dengan menggunakan convenience sampling dengan menyebar
hingga 100 responden pengguna sepeda motor Honda di pamulang. Metode
penelitian ini adalah analisi jalur. Hasil penelitian menunjukan bahwa: (1)
promosi berpengaruh secara signifikan terhadap kepuasan pelanggan (2) layanan
purna jual berpengaruh secara signifikan terhadap kepuasan pelanggan (3)
promosi berpengaruh secara signifikan terhadap niat pembelian ulang (4)
layanan purna jual berpengaruh secara langsung terhadap niat pembelian ulang
(5) kepuasan pelanggan berpengaruh secara langsung terhadap niat pembelian
ulang. Berdasarkan hasil uji F variable promosi, layanan purna jual, kepuasan
pelanggan berpengaruh secara simultan pada niat pembelian ulang. Varable
yang paling dominan adalah variable promosi dimana hasil uji t teringgi diantara
variabel lainnya.
Kata kunci: promosi, layanan purna jual, kepuasan pelanggan, niat pembelian
ulang

9
FOREWORD
Assalamualaikum Wr. Wb
Alhamdulillahhirabil alamin, I would say thanks to ALLAH SWT for all
his gift and favor. Best regards also to prophet Muhammad SAW for being role
model to me. So that I can complete this thesis to attain a Bachelor of Economy
Degree in UIN Syarid Hidayatullah Jakarta.
In the process of drafting and preparation of this thesis author realized that
thesis is far from perfect, because the perfection just only ALLAH SWT, but with
effort, hard work, prayers, and never ending support given by families, friends,
and faculty supervisor. I say thanks to the people who have helped me in the
preparation of thesis :
1. God almighty Allah SWT because without his guidance, I will be nothing
and misguided.
2. Thank you so much to my mother mulyati, my father pardi and my
brothers Rifky Deby and Bregas Abinara that always give me support and
prayers that never stop during this time. Thanks for remind me, helping
me, caring me, and teach me how to patient. Without prayers and support
you are, I was nothing in this world. Thanks for everything. I always love
you all.
3. Mr. Dr. M. Arief Mufraini, Lc., MSi as Dean of the Faculty of Economics
and Business of UIN Syarif Hidayatullah Jakarta.
4. Mr. Ade Suherlan, SE, MBA. as my supervisor, thank you so much for
your recommendation, advice, time, and knowledge during guiding to
finish my thesis.
5. All the Lecturers and Employees of Faculty Economics and Business UIN
Syarif Hidayatullah Jakarta to teach me all of subjet about economy and
business.

10
6. All the staffs in Economic and Business Faculty. Especially to Mr. Bonyx
who always helps me to provide me all the procedures I need in making
this thesis
7. My best friend Mr. Dio Putra Wibowo, Mr. Indra laidin and Mr. Matius
Dwi thanks for your big support.
8. Adit, Afif, Aisya, Ali, Andro, Annisa, Aufa, Diena, Elfa, Futri,Ghilman,
Monica, Rahim, Rizma, Satriya, Sayyid, Sutan, Yuda as my friends in
Management International Program 2010. I will missed every we spent
together and I will missed you guys. We can achieve our dreams and our
friendship will continue forever.
9. Thanks to Ms. Niwiarti for always give me an advice and support to finish
my thesis.
10. Special thanks to Ms. Fildzah. You are one of the reasons and
encouragement for me to finish this thesis because you are so special and
will always be a very special person for me.
11. Thanks to Anita rahma, Raninta Cahyaanisa, Adhitya Ramadhan and
Himam Addaelami for the lesson of life, experience, adventure, friendship
and fraternity.
12. Thanks to Ali Akbar , Rahim Tampubolon, Aditya Darmawan, Aditya
Yuda, Aldi Anugerah, Fajar Sugiarto, Hariandsyah aji and Rizqo
Yanuananda who always helped me when i found the difficulties in my
research
13. Basis Bank Mini thanks for every moment you given to me guys, I will
never forget every joke we have. Success for all of you guys.
14. Senior and Junior of International Program that I have missed the moment
when we were spent together and all the memories ever undertaken when
it became a class mate.
15. Thanks to everyone that I didn’t mention above, who included during
finish my thesis
11
Finally, the author expect for any critics and suggestion that could improve
the content of this thesis, the author hopes to that the thought provoking
contributions can give benefit to the reader, hopefully this thesis could be
worthwhile for all of us. Amin
Jakarta, May 2017
Erbby Danastian

12
LIST OF CONTAINS
COVER
ACCEPTANCE LETTER ............................................................................ i
CERTIFICATION OF COMPREHENSIVE EXAM SHEET ................. ii
STATEMENT OF AUTHENTICITY SCIENTIFIC WORK .................. iii
CURICULUM VITAE .................................................................................. iv
ABSTRACT .................................................................................................... v
ABSTRAK ..................................................................................................... vi
FOREWORD ................................................................................................. vii
CONTENT ..................................................................................................... x
LIST OF TABLE .......................................................................................... xii
LIST OF FIGURE ........................................................................................ xiv
CHAPTER I INTRODUCTION
A. Research Background ........................................................ 1
B. Problem Formulation ......................................................... 11
C. Objectives and Benefit Research ...................................... 12
1. Research Objectives .................................................... 12
2. Research Benefit ......................................................... 13
CHAPTER II LITERATUR REVIEW
A. Theory Development .......................................................... 14
1. Promotion ..................................................................... 14
2. After-Sales Service ...................................................... 17
3. Customer Satisfaction ................................................. 19
4. Re-purchase Intention ................................................. 24
B. Conceptual Framework ..................................................... 26
C. Hypothesis ......................................................................... 28
D. Previous Research ............................................................. 30
E. Relationship Between Variable .......................................... 32
13
CHAPTER III RESEARCH METHODOLOGY
A. Scope Of Research ............................................................ 36
B. Determine of Sample Method ........................................... 36
1. Population ................................................................... 37
2. Sampling Technique .................................................... 38
C. Data Collection Methods ................................................... 38
1. Types of Data .............................................................. 38
D. Data Analysis Methods ..................................................... 41
1. Descriptive Analysis ................................................... 44
2. The Coefficient of Correlation .................................... 45
3. The Coefficient of Determination ............................... 45
4. Simultaneous Test (F test) ............................................ 46
5. Partial Test (t test) ....................................................... 46
E. Operational Variable ......................................................... 47
CHAPTER IV FINDING AND ANALYSIS
A. Overview Research Object ................................................ 50
B. Chacaracteristic Of Profile respondent ............................. 53
C. Descriptive Analysis ......................................................... 57
D. Intstrumet Test Result ........................................................ 62
E. Sobel test ............................................................................ 79
CHAPTER V CONCLUSION AND SUGGESTIONS
A. Conclusions ....................................................................... 82
B. Suggestions ....................................................................... 83
REFERENCES .............................................................................................. 84

14
CHAPTER I
INTRODUCTION
A. Research Background
The developments in world trade are increased rapidly. That is why
the competition in world trade becomes very tight, and every company
always growing and also trying to win the competition in the trade sector.
Beside trying to get profit, the company is also trying to survive and do
not undergo bankruptcy. Mature thinking and innovation is crucial for a
company to continue to compete and survive among other companies.
Innovation and creativity is the cornerstone of the survival of a company,
because with always creative in innovating it will have a positive impact
for the company. With that way, the company will get the attention of
consumers. it is in line with what is expressed by Kotler (2002:34) which
states that the increasing competition of each company should have to win
the competition by displaying the best products that can make consumers
feel satisfy.
Globalization is also one of the factors that make trade competition is
becoming very tight, because with globalization every company become
more flexible for creativity and innovation. Globalization makes the world
seemed limitless, so companies can reach every corner of the world with
ease. Moreover, globalization also creates a new system that is free trade
to enhancement product. With a system of free trade, every company can
develop freely and without limit. However, each company must be smarter

15
in making the strategy to make consumers feel interest, due to the free
trade system of the company is not only competing with regional and
national scale, but the scale of trade competition also increased to
competition on an international scale. If a company posses a good trading
strategy and can win the trade on an international scale, the company will
get a huge profit and has a very good reputation. The strategy is the most
important factor for a company in order to win the competition on an
international scale is trade marketing. Rangkuti (2009: 38) said Marketing
is the process of planning and running concept, price, promotion and
distribution of goods and services to create exchanges that can satisfy
individual and organizational goals. With an extensive marketing network,
then automatically the greater the company's revenue, which is why
marketing is very important factors and most influential in the survival of
a company.
One interesting listening trade competition today is trade competition
in the automotive industry sector. Developments in the automotive world
is very fast, so that the company engaged in the automotive industry sector
is required to always quick in making a breakthrough and innovation. This
was done so that the company is not left behind by the other company is
also engaged in the automotive industry sector. The companies that
engaged in the automotive industry sector are also quite a lot, so as to
create an intense competition in the automotive industry sector. To win the
competition in the automotive sector, a company must be able to form a

16
perception to the consumer that the goods offered by the company is the
best stuff. This is in accordance with what is expressed by Machfoedz
(2005: 41) that perception is the process of selecting, preparing, and
interpretation of information to get a sense. If the consumer has a good
perception of an automotive company, the consumer eating will make the
company as the top choice in the search for something related to
automotive. Conversely, if the consumer has had a bad perception of the
products of a company, then the consumer will be very reluctant to choose
a product from the company as a choice.
It is very powerful, because consumers who are in the automotive
segment are very large, especially in the motorcycle sector. Currently
motorcycle is not only as an item to be collected or a hobby, because at
this time with the passing of time and the times, the motorcycle became an
item that is a necessity. Certainly needs a lot of people so that the
consumer segmentation in the motorcycle sector is very large. Therefore
any company or motorcycle manufacturers are trying to better understand
the needs of consumers, in order not to lose competitiveness with the
company or other motorcycle manufacturers. In the motorcycle sector this
happens with very tight competition. There are many manufacturers of
motorcycles from different countries with different specifications and
characteristics. Of any motorcycle manufacturer has the characteristics and
uniqueness of each, besides any motorcycle manufacturer also offers
different advantages. It is a form of strategy of each motorcycle

17
manufacturers to attract consumers to buy a motorcycle that is offered.
The motor manufacturers are trying to meet the needs of consumers by
producing motorcycles are specified in accordance with the needs of
consumers, but consumers have different needs. Therefore motorcycle
manufacturers must know what is needed by consumers and study the
behavior of consumers as those expressed by Mangkunegara (2009:3)
stating that consumer behavior as the actions of individuals who are
directly involved in the business of acquiring and using goods economical
services including making process decisions that precede and determine
such actions. By knowing the wants, needs and behavior of consumers
who become the target market of motorcycle sales, motorcycle products of
the company will be the first choice for consumers assume that the product
is suitable products and the most efficient for them, because today's
consumers tend to prefer a product which is considered the most efficient
and appropriate to himself. In addition, the needs and desires of consumers
are factors that influence consumer decision making as expressed by
Amirullah (2002 : 61) which defines that the decision-making is a process
of assessment and selection of the various alternatives according to
specific interests by setting an option that is considered to be the most
profitable.
Motorcycle is favored by the people in Indonesia, and therefore
companies are engaged in the automotive field, especially companies that
manufacture the motorcycle assume that Indonesia is a potential market. It
18
is based on more increase motorcycle sales in Indonesia. Although car
sales in Indonesia is also quite high, but overall sales of every types of
motor vehicles in Indonesia is still dominated by a motorcycle which has
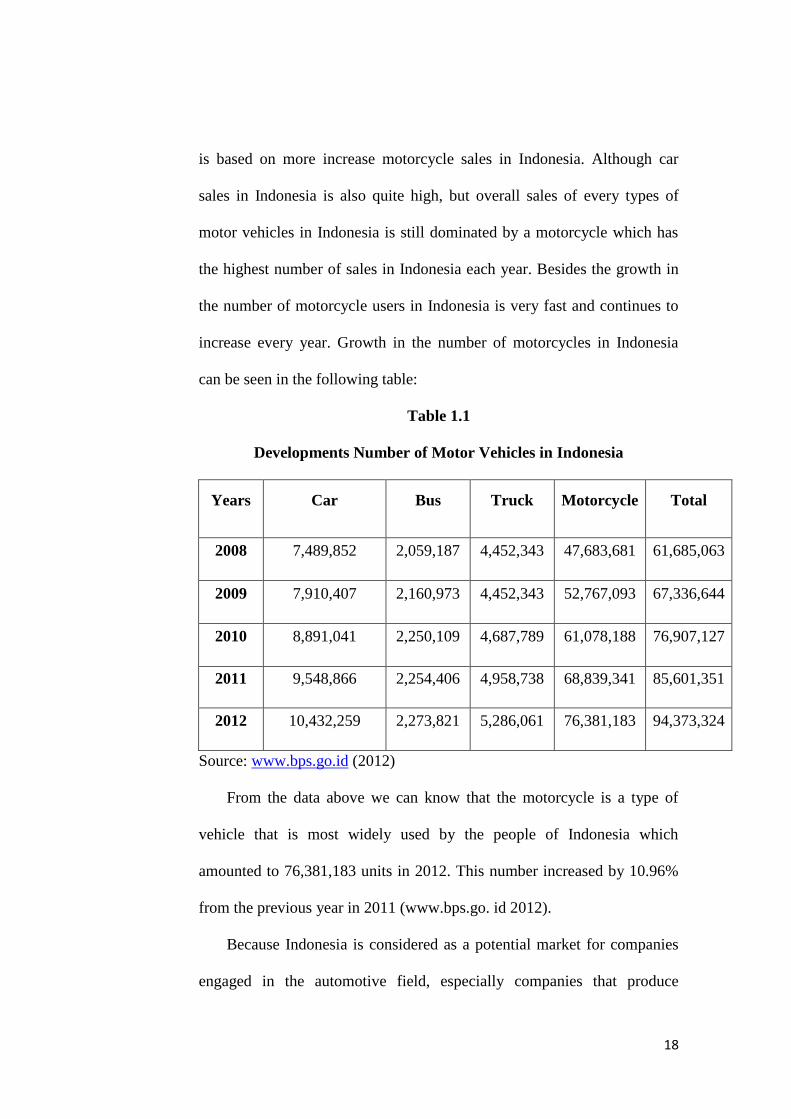
the highest number of sales in Indonesia each year. Besides the growth in
the number of motorcycle users in Indonesia is very fast and continues to
increase every year. Growth in the number of motorcycles in Indonesia
can be seen in the following table:
Table 1.1
Developments Number of Motor Vehicles in Indonesia
Years Car Bus Truck Motorcycle Total
2008 7,489,852 2,059,187 4,452,343 47,683,681 61,685,063
2009 7,910,407 2,160,973 4,452,343 52,767,093 67,336,644
2010 8,891,041 2,250,109 4,687,789 61,078,188 76,907,127
2011 9,548,866 2,254,406 4,958,738 68,839,341 85,601,351
2012 10,432,259 2,273,821 5,286,061 76,381,183 94,373,324
Source: www.bps.go.id (2012)
From the data above we can know that the motorcycle is a type of
vehicle that is most widely used by the people of Indonesia which
amounted to 76,381,183 units in 2012. This number increased by 10.96%
from the previous year in 2011 (www.bps.go. id 2012).
Because Indonesia is considered as a potential market for companies
engaged in the automotive field, especially companies that produce
19
motorcycles, many motorcycle manufacturers who offer their products in
Indonesia. Some motorcycle manufacturer that currently has control of the
market in Indonesia, among others, AHM (Honda), YIMM (Yamaha), SIS
(Suzuki), KMI (Kawasaki), and TVS. Here is a comparison of data
motorcycle sales in December 2013 and January 2014:
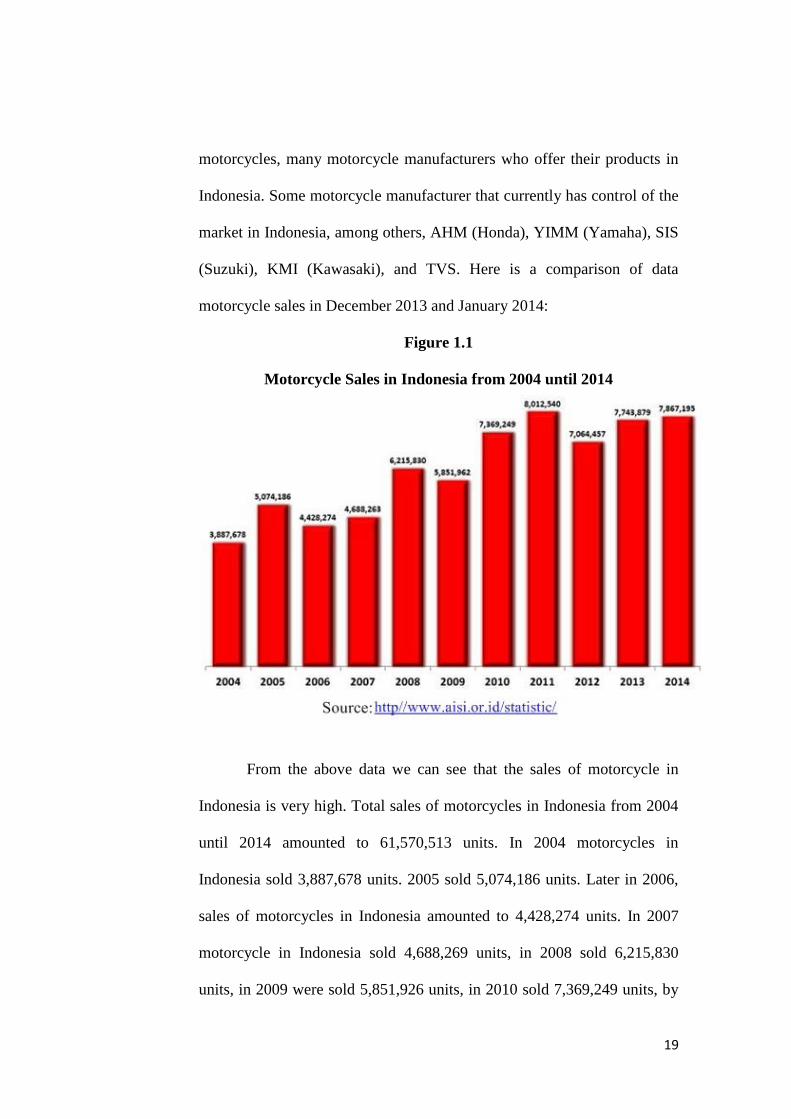
Figure 1.1
Motorcycle Sales in Indonesia from 2004 until 2014
From the above data we can see that the sales of motorcycle in
Indonesia is very high. Total sales of motorcycles in Indonesia from 2004
until 2014 amounted to 61,570,513 units. In 2004 motorcycles in
Indonesia sold 3,887,678 units. 2005 sold 5,074,186 units. Later in 2006,
sales of motorcycles in Indonesia amounted to 4,428,274 units. In 2007
motorcycle in Indonesia sold 4,688,269 units, in 2008 sold 6,215,830
units, in 2009 were sold 5,851,926 units, in 2010 sold 7,369,249 units, by
20
2011 sold 8,012,540 units, in 2012 sold 7064. 475 units, in 2013 sold
7,743,879 units, and in 2014 sales of motorcycles in Indonesia amounted
to 7,867,195 units. From these data we can also see that the biggest sales
occurred in 2011. The next year was not as large as the total sales in 2011,
but sales of motorcycle in Indonesia is quite high. And here is a data
details motorcycle sales in 2013 and 2014:
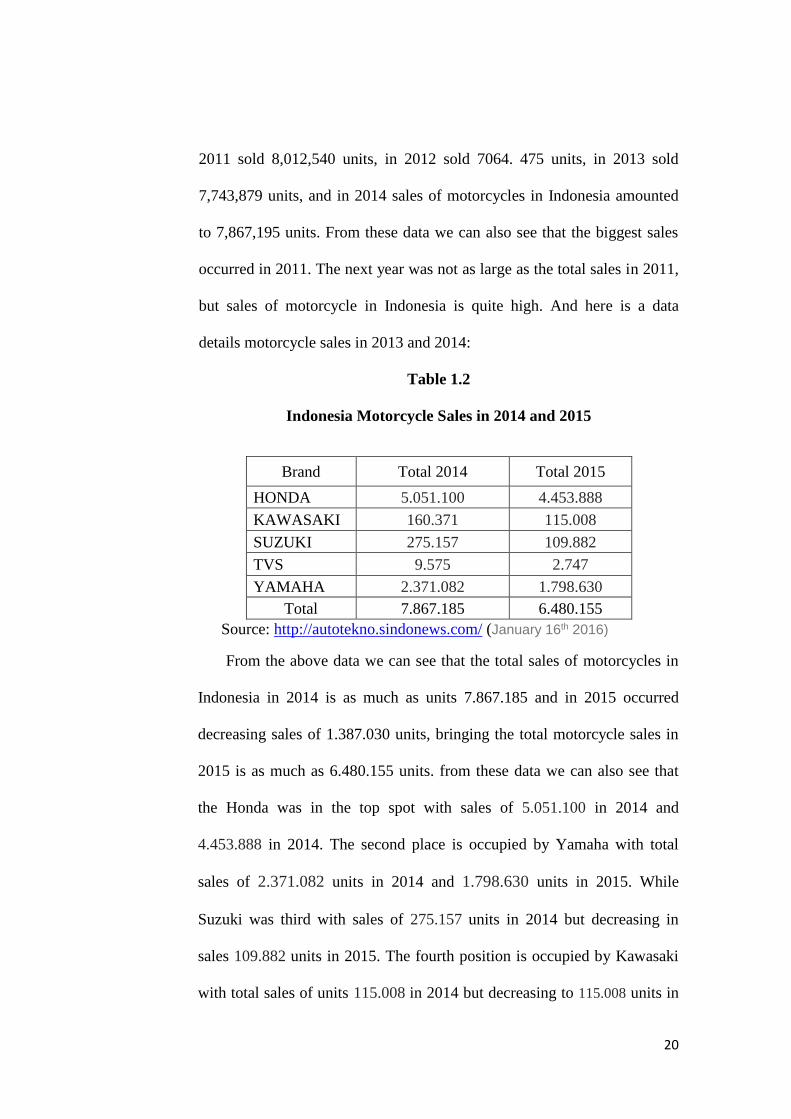
Table 1.2
Indonesia Motorcycle Sales in 2014 and 2015
Brand Total 2014 Total 2015
HONDA 5.051.100 4.453.888
KAWASAKI 160.371 115.008
SUZUKI 275.157 109.882
TVS 9.575 2.747
YAMAHA 2.371.082 1.798.630
Total 7.867.185 6.480.155
Source: http://autotekno.sindonews.com/ (January 16th 2016)
From the above data we can see that the total sales of motorcycles in
Indonesia in 2014 is as much as units 7.867.185 and in 2015 occurred
decreasing sales of 1.387.030 units, bringing the total motorcycle sales in
2015 is as much as 6.480.155 units. from these data we can also see that
the Honda was in the top spot with sales of 5.051.100 in 2014 and
4.453.888 in 2014. The second place is occupied by Yamaha with total
sales of 2.371.082 units in 2014 and 1.798.630 units in 2015. While
Suzuki was third with sales of 275.157 units in 2014 but decreasing in
sales 109.882 units in 2015. The fourth position is occupied by Kawasaki
with total sales of units 115.008 in 2014 but decreasing to 115.008 units in

21
2015. And the bottom is occupied by TVS with total sales of 9.575 units in
2014 and 2.747 units in 2015.
PT Astra Honda Motor (AHM) is the pioneer of the motorcycle
industry in Indonesia. Since it was founded on June 11, 1971 until now the
company has created a range of motorcycles under the brand Honda. No
wonder if Honda has become the "Top of Mind" in Indonesian society. For
promotional activities, PT Astra Honda Motor (AHM) on the theme "One
Heart" which has now become one of the company's slogan, as well as to
strengthen the corporate brand image campaign and also introduce more
corporate values reflected in the products and technologies. In addition,
the product quality is also one of the factors that are considered by
consumers before buying a product, for the quality of the product itself
Honda is known as efficient motors, engines stubborn and durable parts.
And for after-sales service, Honda is known to have pretty good service. It
can be seen from the many workshops AHASS is authorized workshops
owned by Honda. In addition to official workshops, Honda also known as
Parts are pretty easy to come by. Factors what makes AHM (Honda) can
be called as the best motorcycle manufacturers also have the highest total
motorcycle sales in Indonesia.
In Indonesia, the type of motorcycle that most enjoy doing is
motorcycle matic. Matic type motorcycle is considered more practical and
easier, so that sales of high-matic is as shown in the table following data:
22
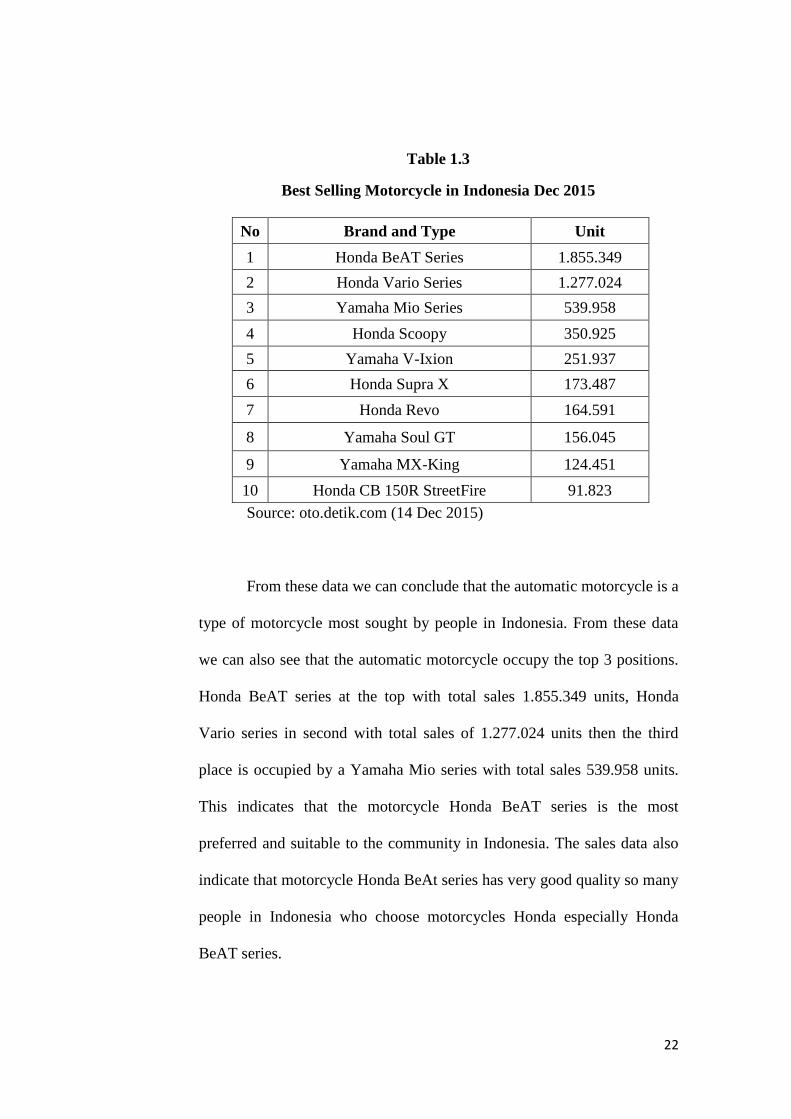
Table 1.3
Best Selling Motorcycle in Indonesia Dec 2015
No Brand and Type Unit
1 Honda BeAT Series 1.855.349
2 Honda Vario Series 1.277.024
3 Yamaha Mio Series 539.958
4 Honda Scoopy 350.925
5 Yamaha V-Ixion 251.937
6 Honda Supra X 173.487
7 Honda Revo 164.591
8 Yamaha Soul GT 156.045
9 Yamaha MX-King 124.451
10 Honda CB 150R StreetFire 91.823
Source: oto.detik.com (14 Dec 2015)
From these data we can conclude that the automatic motorcycle is a
type of motorcycle most sought by people in Indonesia. From these data
we can also see that the automatic motorcycle occupy the top 3 positions.
Honda BeAT series at the top with total sales 1.855.349 units, Honda
Vario series in second with total sales of 1.277.024 units then the third
place is occupied by a Yamaha Mio series with total sales 539.958 units.
This indicates that the motorcycle Honda BeAT series is the most
preferred and suitable to the community in Indonesia. The sales data also
indicate that motorcycle Honda BeAt series has very good quality so many
people in Indonesia who choose motorcycles Honda especially Honda
BeAT series.

23
Table 1.4
Best Selling Matic Motorcycle in Indonesia in 2014
No Brand and Type Unit
1 Honda BeAT Series 2.062.745
2 Honda Vario Series 1.454.914
3 Yamaha Mio Series 639.775
4 Yamaha V-Ixion 417.859
5 Honda Revo Series 324.343
6 Honda Scoopy 285.906
7 Yamaha Soul GT 229.722
8 Yamaha GT 125 227.037
9 Honda Supra X injeksi 222.497
10 Yamaha Jupiter MX 210.088
Source: oto.detik.com (1 Dec 2015)
From the above table we can see that the sales of motorcycles
matic type is very large. From the table, we can also see that Honda Beat
at the top with a total sales of 2.062.745 units, followed by Honda Vario
Series with 1.454.914 total sales of units and ranked third is occupied by
Yamaha Mio Series with total 639.775 sales of units. Shown in the table
that Honda and Yamaha dominate the motorcycle sales matic type.
Honda's success in selling the bike does not just happen. there are two
important factors that are key to the success of Honda in sales, especially
in selling Honda Beat. The first factor is promotion. Kotler and Armstrong
(2004:79) said Promotion is an activity that communicates product
advantages and persuade target customers to buy it. And honda doing
promotion with very well so that attract people to buy. The second factor is

24
product quality.. The second factor is After Sales Service. Based on Kotler
and Keller (2005:133), After Sales Service is to provide the best support,
the company provides after sales service such as warranty, repair service,
parts, and continued consultation. It is done by the Honda to provide
consumer convenience after making a purchase honda motorcycle and
aims to build consumer trust to the Honda motor.
Based on this background, this research seeks to know and analyze the
factors that influence the purchase decision on Honda motorcycles.
Therefore made research with title THE INFLUENCE OF
PROMOTION AND AFTER-SALES SERVICE, TOWARD
CUSTOMER SATISFACTION THAT IMPACT RE-PURCHASE
INTENTION OF HONDA MOTORCYCLE (case study on pamulang
society)
B. Problem Formulation
Problem formulations in this research are:
1. Does promotion have influence to customer satisfaction partially?
2. Does after-sales have influence to customer satisfaction partially?
3. Do promotion and after-sales service have effect customer
satisfaction simultaneously?
4. Does Promotion have influence to Re-purchase intention partially?
5. Does After-sales have influence to the repurchase intention
partially?

25
6. Does Customer satisfaction have influence to Re-purchase
intention partially?
7. Do Promotion, After-sales, and Customer satisfaction have
influence to Re-purchase intention simultaneously?
C. Objectives and Benefits of Research
1. Objectives Research
Purpose of the research are:
a. To analyze the influence of promotion on customer satisfaction .
b. To analyze the influence of after-sales services on customer
satisfaction.
c. To analyze the influence of promotion and after-sales on customer
satisfaction simultaneously.
d. To analyze then influence of promotion on re-purchase intention
partially.
e. To analyze the influence of after-sales service on re-purchase
intention partially.
f. To analyze the influence of customer satisfaction on re-purchase
intention partially.
g. To analyze the influence of promotion, after-sales, and customer
satisfaction on re-purchase intention simultaneously.

26
2. Benefit of Research
a. For The Company
Benefit for the company is as a material consideration in
determining the strategic decision-making and determine the
factors that most influence consumer repurchasing intention.
b. For The Researcher
To get more knowledge and experience in conducting research,
train the ability that have been learned in lecture or in class into
scientific forms and compare between the theory obtained by the
fact that happen in the field.
c. For The Reader
This study is expected to provide a reference for all students and
academics who want to study the problem related to marketing,
especially repurchasing. And as a work that can be used as a
discourse and library for students or academics who have in interest
examined in the same field.

27
CHAPTER II
LITERATURE REVIEW
A. Theory Development
1. Promotion
a. Definition of Promotion
According Swastha and Irawan (2001:349) promotion is one
element of the marketing mix which pursued the company through
advertising, sales promotion, personal selling, or publicity.
This is supported by the understanding and promotion by
Saladin Djaslim & Yevis Oesman (2002:123) said "Promotion is a
seller and buyer information communication that aims to change
the attitudes and behavior of buyers, who previously did not know
be familiar with so that buyers be given the product ".
Meanwhile, according Buchari Alma (2006:179) Promotion is
a kind of communication which gives explanations and convince
potential customers of the goods and services in order to gain
attention, educate, remind and reassure potential customers.
According to Kotler and Armstrong (2004:79) Promotion is an
activity that communicates product advantages and persuade target
customers to buy it. While Tandjung (2004:83) argues that the role
of the promotion is done to communicate and influence potential
customers in order to receive the products produced by the

28
company. Promotion is essentially an art of wooing customers and
prospective customers to buy more products company.
Babin (2011:27) states that the promotion of the
communication functions of the company responsible for informing
and persuading / invite buyers.
This is supported by Sunyoto (2013:19) who said that the
promotion is one of the variables in the marketing mix that is very
important carried out by the company in marketing the product.
While Alma (2005:110) says that the promotion is a type of
communication that gives a convincing explanation of prospective
consumers of goods and services. It aims to attention, educate,
remind and reassure potential customers.
b. Promotion Mix
Promotion is a means of communication and delivery of
messages is done either by companies or intermediaries with the
purpose of providing information about the product, price and
place. That information is inform, persuade, remind returned to the
consumer, the intermediary or a combination of both. In the
promotion, there are some elements that support the operations of a
campaign that is commonly called the promotion mix.
Marketing promotion mix is a particular mix of advertising,
personal selling, sales promotion, public relations, and direct

29
marketing tools used by the company to achieve the goals of
advertising and marketing (Kotler and Armstrong 2004:600)
The promotion mix according to Kotler et al (2009:23) are as
follows:
1) Advertising
Any paid form of non-personal presentation and
promotion of ideas, goods, or services by an identified sponsor.
Kotler et al (2009:529)
2) Public Relation
A variety of programs designed to promote or protect a
company’s image or its individual products. Kotler et al
(2009:529)
3) Direct Marketing
Use of mail, telephone, fax, email, or internet to
communicate directly with or solicit response or dialogue from
specific customers and prospect. Kotler et al(2009:529)
4) Sales Force
Face-to-face interaction with one or more prospective
purchasers for the purpose of making presentations, answering
questions, and procuring orders. Kotler et al (2009:529)
5) Sales Promotion
A variety of short-term incentive to encourage trial or
purchase of a product or service. Kotler et al (2009:529)

30
2. After Sales Service
a. Care and Services
Kotler (2005:213) describes the service as follows: "Service to
customers is one of the products or services of the company
strategy usually includes a variety of services, services that are part
of a small or large part of the whole product or service". Service
(Service) is an activity, benefit or usefulness that is offered for sale
to the buyer.
Moekijat (2000:493) explains that the services in marketing
management are activities, benefits or satisfactions are given for
sale (eg rebates, improvements).
Definition of services proposed by Stanton in Alma
(2007:243), "Service is something that can be separately identified
intangible, offered to meet the needs". Services can be produced by
using tangible objects or not.
Meanwhile, according Tjiptono (2008:6), "service is any action
or activity that can be offered by one party to another, which in
essence is intangible (not a physical shape) and does not generate
ownership of something". Production services can be associated
with the physical and non-physical products.
31
b. After-Sales Service
According to Kotler and Keller (2005:133) after-sales service
is to provide the best support, the company provides after-sales
service, most companies move through several stages.
According Tjiptono (2008:136), there are several alternative
strategies can companies do to reduce the chances of uncertainty is
the provision of after-sales service is the provision of guarantees to
reduce consumers' perception of the risk of purchasing, repair
services, and the provision of replacement parts.
According Tjiptono (2008:7) said that the more advanced the
technology of generic products, for example cars, machines,
photocopiers, computers then sales will depend on the quality and
provision of customer service that accompanies such a long space
(showroom), delivery facilities, repair and maintenance, application
support, operator training, consulting installation and
administration of warranty.
Based on Barata (2003:290), the provision of after-sales
service to customers is usually given as a responsibility of the seller
for the quality of the goods it sells. This service is given in the form
of warranty, replacement of damaged goods, maintenance and
supply of spare parts.

32
3. Customer Satisfaction
a. Definition Customer Satisfaction
Everyone knows what satisfaction is, until asked to give a definition.
Then seems nobody knows. In less technical terms we interpret this
definition to mean that satisfaction is the customer’s evaluation of a
product or service in terms of whether that product or service has met the
customer’s needs and expectations. Failure to meet needs and expectations
is assumed to result in dissatisfaction with the product or service.
(Zeithaml., et al 2006:110)
Customers have experience different levels of satisfaction or
dissatisfaction after they consume product or service which was suitable
with their expectation. Because satisfaction is the emotional condition,
reaction after bought something could be anger, dissatisfaction,
aggravation, neutrality, excitement, or enjoyment. (Lovelock and Wirght,
2005:102).
Customer satisfaction can be achieved only with giving high quality
service to the consumer. Good service and quality had been judged by
consumers directly from employee as a person who serve a service or also
called producer services. Because it takes some effort to improve service
quality system that had given to fulfill the desire and increasing customer
satisfaction. So, service quality was the first thing to measure
improvement customer loyalty to become something important that we
have to be considered by company in order to achieve customer
33
satisfaction.
According to Kotler et al (2009:136) satisfaction is a person’s feelings
of pleasure or disappointment resulting from comparing a products
perceived performance (out-come) in relation to his or her expectations. If
the performance falls short of expectations, the customer is satisfied. If the
performance exceeds expectations, the customer is highly satisfied or
delighted.
Service quality has a close relationship with customer satisfaction.
Quality gives a push to consumers for establish a strong relationship with
the company. In the long term, this relationship enable companies to
understand consumer expectations and needs carefully. Thus, companies
can increasing customer satisfaction and at the end its satisfaction can
create loyalty or customer loyalty.
In order to get customer satisfaction, companies can give an excellent
service quality. Because that things can fulfill the consumer needs and
expectations. Satisfaction is the fulfill response of customer about the
service and product. It is also a finding about the product and service
feature or the product and services itself; satisfaction is conceptualized as
an overall, customer attitude towards a service provider. Thakur and Singh
(2012)
From the definition above customer satisfaction that have been
explained by expert, the author can make conclusion that customer
satisfaction is the expectation based on what customer perceives.

34
b. Factor of Customer Satisfaction
According to Rangkuti (2003:30) customer satisfaction defined as the
response of consumer to mismatch between previous importance level and
the actual performance after used. The factors that affect customer
satisfaction as follows :
a. Customer value, namely :
1) Accept customer complaint.
2) Responses customer complaint.
3) Have many types of services.
4) Give a good information to customer.
b. Customer Response, namely :
1) Keep loyal for a long time.
2) Buy more when company introduce new product and renew
existing product.
3) Talk a good thing about the company product.
4) Give a little attention to brand and advertising competitor.
5) Offering the service or product ideas to company.
c. Customer perception, namely :
1) Customer feel satisfied with process and services provided.
2) Customers feel safe and comfortable when have a deal to company.
3) Give a advice to customer complaint either through the suggestion
box or e-mail.
35
c. Method of measuring Customer Satisfaction
Kotler and Amstrong (2003:148) discuss several methods to measure
customer satisfaction, which are :
a. Complaint and Suggestion system
Each customer oriented service organization should provide the
widest opportunity to its customers to submit suggestion, criticism,
opinions, and their complaints. Information obtained through this
method can provide new ideas and input are valuable to the company
making it possible to react quickly and respond in overcome the
problems that arise.
b. Customer satisfaction survey
Like in this research, company can do a survey to measure customer
satisfaction using such as questioner or by phone calls to a random
sample of their customers. Through the survey, companies will get
responses and feedback directly from customers and give a positive
sign that companies pay attention to them. Customer satisfaction survey
is divided into four categories, which are :
1) Directly report satisfaction
The respondents are being asked directly with question in order to
know if they are very satisfied, satisfied, neutral, dissatisfied, or
very dissatisfied. This survey is to used to collect the customer
opinion and needs which can give the result called the customer
36
satisfaction index. This customer satisfaction index’s the standard
of company needs to maintain.
2) Derived dissatisfaction
The question that being asked included two aspect, how high is the
customer expectation in the certain attribute, and how high is the
performance that customer’s feel of this attribute.
3) Problem analysis
The respondents are being asked to describe two things; the
problem which related with the company offer and suggestion for
improvement.
4) Importance performance analysis
The respondents are asked to rate the services according to the
customer importance and company performance in each attributes.
c. Ghost shopping
This method use a person to pose as potential buyer to report their
findings on strong and weakness points when experience buying the
company’s and competitor’s product. Ghost shoppers also can observe
how the company and its competitors in serving customer demands,
answering customer question, and solve any problems or customer
complaints.

37
d. Lost customer analysis
The company contact customers who have stopped buying or
switched to another supplier to learn why this condition happened and
in order to understand and take the police to further improve or refine.
e. Some caution in measuring customer satisfaction
The company must make a well-structured questionnaire;
otherwise the customer would face a huge questionnaire. The company
must also be able to recognize that two customers can report being
highly satisfied for two reasons. One person maybe easily satisfied
most of the time, and the other one might be hard to please but was
pleased on this occasion.
4. Repurchase Intention
Repurchase intention is defined by Hellier, Geursen, Carr, and
Rickard in Chinomona and Dubihlela (2014: 25) as the individual’s
decision about repeatedly buying the product/service from the same
company, taking into account his/her current situation and
circumstances. First-time purchase is often used as a predictive
measure of repurchase behavior. The decision to repurchase represents
the customer’s decision to engage in continuous consumption of the
product. Consumer buying behaviour can be understood in two stages,
thus encouraging people to purchase and enhancing them to
repurchase (Zhang, Fang, Wei, Ramsey, McCole and Chen in
Chinomona and Dubihlela, 2014: 25).

38
According to Ferdinand in Saidani and Arifin (2012: 7)
repurchase intention can be identified through several indicators, as
follows:
a. Transactional interest
Is tendency of someone to always repurchase the product that has
been consumed.
b. Referential interest
Is tendency of someone to reference the product that has been
bought in order to be purchased by the others, with reference to his
or her personal experience.
c. Preferential interest
Is the interest that depicts the behavior of someone which always
has the main preference on the product that has been consumed.
This preference can only be changed if something happens to its
preference product.
d. Explorative interest
This interest depicts the behavior of someone that always finds the
information regarding the product which is interesting for him or
her and finding the information to support the positive natures of
the product.

39
B. Conceptual Framework
According to Sugiyono (2009:89) defines that the conceptual
framework is a synthesis about relationship between variables which
compiled from a variety of theories that have been described, next analyzed
critically and systematically, so that creating the synthesis about the
relationship between variable that studied.
In this conceptual framework, there are two variables exogenous such
as service quality and promotion. Two variables endogenous such as purchase
intention and customer decision. The purpose of this research is to analyze the
influence of Promotion and After-sales services toward Customer satisfaction
that impacts on Repurchase intention of Honda Motorcycle.

40
Here for the picture of conceptual framework:
Figure 2.1
Conceptual Framework
After-sales Service
X2
Promotion
X1
Customer
Satisfaction
Y1
Re-purchase
Intention
Y2
Data Test:
1. Validity test
2. Reability Test
Analisis Jalur (Path Analysis)
1. Persamaan Analisis Jalur Struktur 1
2. Persamaan Analisis Jalur Struktur 2
3. Pengujian Hipotesis (Uji F dan Uji t)
4. Sobel Test
Conclusion and Suggestion
41
C. Hypothesis
According Malhotra (2009:78), hypothesis is an unproven statement
or proposition about factor or phenomenon that is interest to the
researcher. The hypothesis can also be stated as a possible answer to the
researcher question. A useful hypothesis is a predictable statement that
may include a prediction explanation.
According to Sugiyono (2009:93) hypothesis is a temporary answer to
the research formulation problems. The author has generated hypotheses
associated with the model. These hypotheses focus on the relationship
among promotion, product quality, after sales service, and repurchase
intention. The hypotheses are as follows :
1. The Relationship between Promotion and Customer
Satisfaction
Thus the Hypothesis can be drawn as follows:
Ho1 : Promotion Doesn’t have influence on repurchase intention
Ha1 : Promotion has influence on repurchase intention
2. The Relationship between After-sales Services and
Customers satisfaction
Thus the Hypothesis can be drawn as follows:
Ho2 : After sales Doesn’t have influence on Customers
Satisfaction
Ha2 : After-sales service has influence on Customers
satisfaction

42
3. The Relationship between Promotion and After-Sales
Service Towards Repurchase Intention
Thus the Hypothesis can be drawn as follows:
Ho3 : Promotion and After-sales service Doesn’t have influence
on Customers Satisfaction
Ha3 : Promotion and After-sales service has influence on
Customers Satisfaction
4. The Relationship between Promotion and Customer
Satisfaction
Thus the Hypothesis can be drawn as follows:
Ho4 : Promotion Doesn’t have influence on Customers
Satisfaction
Ha4 : Promotion Has influence on Customers Satisfaction
5. Relationship between After-Sales and Repurchase Intention
Thus the Hypothesis can be drawn as follows:
Ho5 : Promotion and After-sales service Doesn’t have influence
on Repurchase Intention
Ha5 : Promotion and After-sales service has influence on
Repurchase intention
6. Relationship Between Customer satisfaction and
repurchase intention
Thus the Hypothesis can be drawn as follows:

43
Ho6 : Customers satisfaction Doesn’t have influence on
Repurchase Intention
Ha6 : Customers satisfaction has influence on Repurchase
intention
7. Relationship between Promotion, After-sales, and
Customers Satisfaction towards Repurchase Intention
Thus Hypothesis can be drawn as follows
Ho7 : Promotion, After-sales, and Customers Satisfaction
Doesn’t have influence on Repurchase Intention
Ha7 : Promotion, After-sales, and Customers Satisfaction has
influence on Repurchase intention
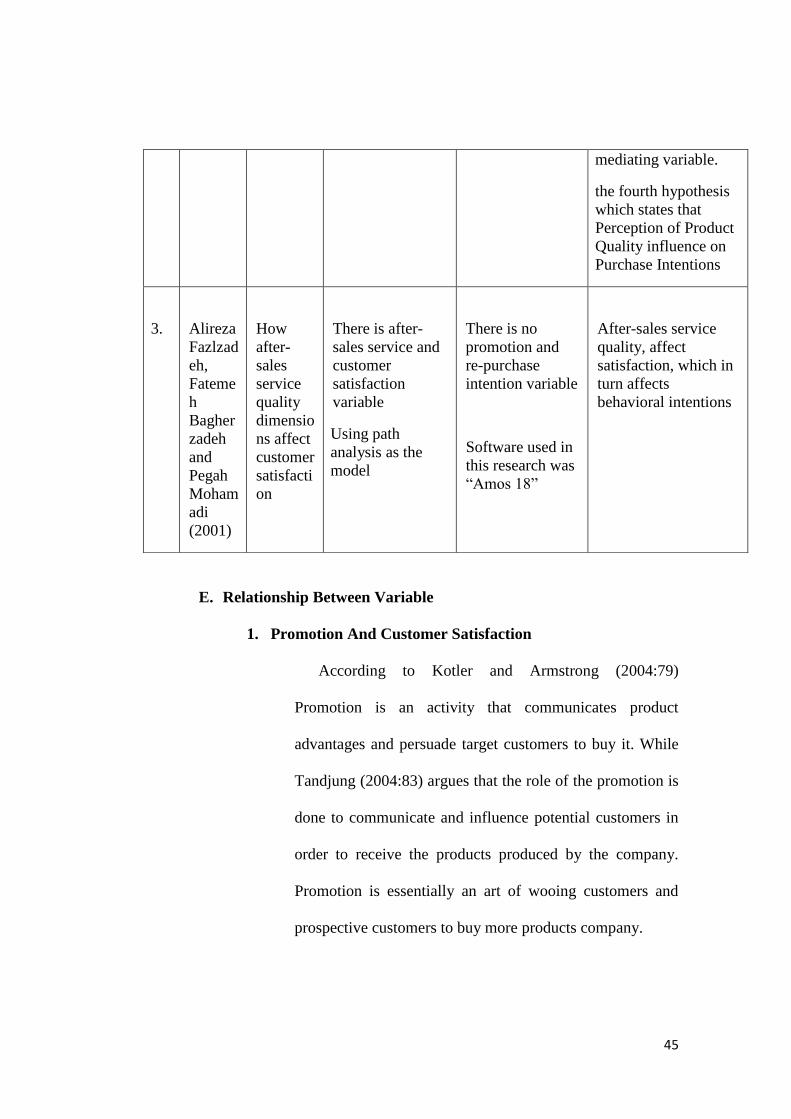
D. Previous Research
No Author Title Research Method
Result equation difference
1.
Keum
Chung
and
Myung
-moo
(2003)
A Study
Influenci
ng
Factors
for
Repurch
ase
Intention
in
internet
Shoppin
g Mall.
There are
Promotion
variable and
customer service
Variable.
There is no
variable Re-
purchase
Intention.
Perceived consumer
risk shows a negative
relationship with the
repurchase intention,
and all the other
variables – product
perceptions, customer
service, perceived
ease of use, site
image, promotion,
communications
environments are
positively related with

44
the repurchase
intention. Also, the
overall satisfaction
level of customers for
the Internet shopping
malls positively
influences repurchase
intention
2.
Vina
Herawa
ti
(2011)
Pengaru
h
persepsi
kualitas
produk
terhadap
niat
pembelia
n ulang
pada
private
label
“Carrefo
ur” di
carrfour
melalui
kepuasan
konsume
n sebagai
variable
mediasi.
There is Re-
purchase
Intention variable
and customer
satisfaction
variable.
Using path
analysis as the
model.
There is no after-
sales service
variable and
promotion
variable.
The sampling
technique use in
this study is
purposive
sampling .
The First hypothesis
which states that
perception of product
quality affect the
repeat purchase
intentions accepted.
Perception of product
quality positive effect
on customer
satisfaction in private
label “carrefour” in
carrefour.
The second hypothesis
which states that
affect the perception
of product quality to
customer satisfaction
received. Customer
Satisfaction effect on
Repeat Purchase
Intentions in Private
Label "Carrefour" in
Carrefour.
The third hypothesis
which states that the
effect on the customer
satisfaction to Repeat
Purchase Intentions
accepted. Perceptions
of Product Quality
effect on Repeat
Purchase Intentions
through Customer
Satisfaction as a
45
E. Relationship Between Variable
1. Promotion And Customer Satisfaction
According to Kotler and Armstrong (2004:79)
Promotion is an activity that communicates product
advantages and persuade target customers to buy it. While
Tandjung (2004:83) argues that the role of the promotion is
done to communicate and influence potential customers in
order to receive the products produced by the company.
Promotion is essentially an art of wooing customers and
prospective customers to buy more products company.
mediating variable.
the fourth hypothesis
which states that
Perception of Product
Quality influence on
Purchase Intentions
3.
Alireza
Fazlzad
eh,
Fateme
h
Bagher
zadeh
and
Pegah
Moham
adi
(2001)
How
after-
sales
service
quality
dimensio
ns affect
customer
satisfacti
on
There is after-
sales service and
customer
satisfaction
variable
Using path
analysis as the
model
There is no
promotion and
re-purchase
intention variable
Software used in
this research was
“Amos 18”
After-sales service
quality, affect
satisfaction, which in
turn affects
behavioral intentions

46
Khan et. Al (2012) describes promotion as a different
form of activities to attract and get customer attention to
buy the product or services through personal selling, public
relations, sales promotion and advertising. Promotion of
product or services helps in the best way to build
relationships with customers, because everyone is looking
for the best deal for them. The result of research khan et al,
(2012) gives a positive result between promotion and
customer satisfaction. So, higher promotion is be excepted
to give a positive impact on customer satisfaction.
2. After-sales Service and Customer Satisfaction
After sales service has been directly linked to customer
satisfaction by a number of researchers (Bitner 1990;
Bolton & Drew 1991). (McDougall & Levesque 1994;
Cronin et al. 2000) have also established perceived service
value as a fundamental predictor of customer satisfaction
for a company. They noted that customer satisfaction can
be increased in two ways. The company may either try to
set low customer expectations for service so that the
delivered service quality meets these low expectations
easily. Alternatively, the company may improve its service
quality and customers’ perception of the same so that
customers’ expectation level can be met. (Bhave 2002)

47
stated in this regard that a satisfied customer is a valuable
asset to a company and directly works as a reliable and
credible advertisement. For this, it is important that
customers are able to experience quality service
conveniently.
(Ko & Pastore 2005) have noted that for a service to be
convenient, it must be an appropriate service and must be
provided at a time most convenient for the customer. Good
after sales service has been known to result in lasting
relationships with customers who came back many times
and are usually the most profitable ones for a company
(Cohen et al. 2006; Alexander et al. 2002).
3. Customer Satisfaction and Repurchase Intention
Mittal and Kamakura (2001) stated that the satisfaction
repurchase relationship can display variability due to three
main reasons. The first includes satisfaction thresholds,
which consist of satisfied consumers who have different
levels of repurchase due to their different characteristics.
The second includes response bias, which means that
ratings obtained from the survey may not represent a true
picture due to the different characteristics of consumers.
The third includes nonlinearity, which means that the
satisfaction-repurchase function may be nonlinear and vary

48
for different consumers. In contrast, Olsen (2002) stated
that despite the common view that satisfaction is linked to
repurchase, few empirical studies can be found that relate
satisfaction to actual repurchase behavior. Kamakura
(2001) indicated that establishing a direct link between
repurchase and satisfaction ratings has not been easy for
many organizations. In addition, the satisfaction-repurchase
relationship can be affected by consumers’ characteristics.
Despite the identical ratings on satisfaction, a significant
difference was observed in repurchase behavior, which was
attributed to differences in consumer age, education, marital
status, sex, and area of residency (Mittal and Kamakura
2001).

49
CHAPTER III
RESEARCH METHODOLOGY
A. Scope of Research
This research aims to test hypothesis about variable promotion, after-
sales service, customer satisfaction and re-purchase intention of Honda
motorcycle. Scope of research for this studies are follows:
1. The focus of the author in this study is the influence variables promotion
and after-sales services toward customer satisfaction that impact re-
purchase intention
2. The location and the object to be examined are the users of Honda
motorcycle in pamulang society
3. In this study consisted used two variables are exogenous variables and
endogenous variable. Exogenous variable in this research is promotion
(X1) and after-sales services (X2). Endogeneous variable int this research
is customer satisfaction (Y1) and Re-purchase intention (Y2).
B. Determine of Sample Method
1. Population
Malhotra (2009:369) defines population as the aggregate of all
elements, sharing some common set of characteristics that comprises
the universe for the purpose of the marketing research problem.
Population is the generalization, which consists of object and subject of
a certain quantity and characteristics applied by researchers to learn and
then drawn the conclusion (Sugiyono, 2008:57). In this research the
50
population is defined as the consumers of Honda in Pamulang society
that will be used for research.
2. Sampling Technique
According to Sugiyono (2009:116) sample is a part of total number
and characteristic that owned by its population. According to Malhotra
(2004:314) sample is a subgroup of the elements of the population selected
for participation in the study. Element is the object about which or from
which the information is desired (Malhotra, 2004:315).
The sample technique will be used is convenience sampling.
According to Malhotra (2004:321) convenience sampling is a non
probability sampling technique that attempts to obtain a sample of
convenient elements. Because, non probability sampling relies on the
personal judgment of the researcher rather than chance to select the sample
elements. The researcher can arbitrarily or consciously decide what
elements to include the sample (Malhotra 2004:320)
The researcher takes 100 samples respondent, because according to
Sugiyono (2010:74) guidelines to determining sample are as follows :
a. Sample size should be between 30-500 elements.
b. If the sample is broken down further into sub-sample (Male/Female,
Elementary/Junior/High School, etc.) must be a minimum number of
sub until 30.
c. In the multivariate research (multiple linear regressions) the sample
size should be several times larger (10 times) than the number of
variables to be analyzed.

51
d. A simple experiment for research, with strict controls, sample size
between 10-20 elements.
C. Data Collection Methods
Types of data used by the researcher in this research are primary and
secondary data
primary data according to According to Cooper and Schindler (2006:89),
primary data is the data the researcher collects to address the specific
problem at hand the research question. In this research, primary data used
is distributing questionnaires to the respondents. Primary data are original
data collected by researchers to answer research specifically (Istijanto,
2009:44).
Secondary data is the data that are indirectly obtained from the
research. According to Cooper and Schindler (2006:89), secondary data is
the result of studies done by others and for different purpose than the one
for which the data are being reviewed According to Istijanto (2009:38)
secondary data is the data that has been collected by others not by their
own researchers to other purpose. Secondary data in this research were
obtained from other parties relating to the issues, such as library research,
the researcher collecting the data and required information by
readingliterature, books, articles, scientific journals, data from the internet,
magazines and a thesis or a previous thesis.
52
a. Questionnaire (Primary Data)
Questioner is a formalized set of questions for
obtaininginformation for respondents. It has three specific objectives
(Malhotra,2009:330). In the primary data collection with
questionnaires, researcher used a closed-ended question which is the
form of a question with a range of alternative options or answers to the
respondent to know the characteristics of the respondents
(Malhotra,2009:124). To gauge the level of interest in the elements of
celebrity endorser, brand image, and purchase decision this research
using Likert scale.
Likert scale used to measure attitudes, opinions and the perception
of a person or group of people about social phenomena (Riduwan
2008:20). By using a Likert scale, the variables to be measured
translated into sub variables then translated again into sub variables
indicators that can be measured. Measurement scale used is the Likert
scale with the following criteria:

53
Table 3.1
Likert Scale
Likert Scale Score
Strongly Disagree
Disagree
Neutral
Agree
Strongly Agree
1
2
3
4
5
Source: Naresh K. Malhotra, marketing research an applied orientation,
Pearson;Prentice Hall, 2004, p. 256
Likert scale ordinal because the statement is said to have Strongly
Agree levels or preferences are "higher" than Agree, and Agree "higher
of Hesitates (Ghozali, 2012:47).
2. Literature Study (Secondary Data)
A secondary data collection technique is the study of literature,which
is studying how factors that affect consumer preferences for products in
various literature, including search data from Internet sites (electronic
library) and books relating to completed research data. Malhotra
(2009:124) defines secondary data is data that refer to external sources. In
the support the data obtained from books, journals, research reports,
theses, internet and other media information.

54
D. Data Analysis Method
1. Descriptive Analysis
According to Istijanto (2009) descriptive study was conducted where
the research is done to provide wider exposure which has a purpose to
change the raw data become easy to comprehend in the form of short time.
The descriptive analysis used to explain general description about the
respondent. This way is done by distributing the 100 questioners to
respondent and then processed with statistical methods using SPPS 17 and
Microsoft Excel.
2. Validity Test
According to Malhotra (2004:269) validity of a scale may be defined
as the extent to which differences in observed scale scores reflect true
differences among objects on the characteristic being measured, rather
than systematic or random error.
According to Ghozali (2005:45) the validity of this research is used to
measure the legality of a questionnaire. Test validity used to measure the
legal valid or un-valid of a questionnaire. In order to determine whether an
items that are to be used or not, usually done on the significance
correlation coefficients test on minimum correlation 0.30, means that an
item is considered valid if the total score is greater that 0.30 (Priyatno,
2010:90)
55
3. Reliability
According to Malhotra (2004:267) reliability refers to extent which
has a scale produces consistent results if repeated measurements are made
on the characteristic.
According to Sugiyono (2009:456) reliability is often defined as the
consistency and stability of data findings. From a positivistic perspective,
reliability typically is considered to be synonymous with consistency of
data produced by observation made by different researcher at different
times.
Reliability test conducted by researcher is to measure the consistency
of the questions that include in the questionnaire on the variables.
According to Malhotra (2004:268) a questionnaire is considered reliable
when cronbach's alpha test reached 0.6 or more. Cronbach’s alpha is the
average of all possible split half coefficients resulting from different ways
of splitting the scale items (Malhotra, 2004:268).
4. Path Analysis
According to Riduwan and Engkos (2008:2) path analysis model was
used to analyze the patterns of relationships between variables with the aim
to find out directly or indirectly influence the set of independent variables
(exogenous) against the dependent variable (endogenous). There are some
benefits using path analysis based on Riduwan and Engkos (2008:2) are as
follows :

56
a. Description of the phenomenon studied or researched the problem.
b. The prediction variable (Y) based on the value of the variable (X) and
predictions with path analysis is qualitative.
c. Determination of the determinant factor variable (X) where the
dominant influence of the related variables (Y), can be used to search
for the mechanism (line) the influence of the free variable (X) against
variables bound (Y).
d. Use model theory test trimming good test reliability and test new
concepts of development. Application of method of trimming is used
to correct a structural path analysis model by way of removing the
exogenous variables the coefficient of the coaster is not significant.
Figure 3.1
Path Analysis
ρX1Y2 ɛ1 ɛ2
ρX1Y1
RX1X2 ρY1Y2
ρX2Y1
ρX2Y2
Source: Primary data Processed 2014
Promotion
(X1)
Re-purchase
intention
(Y2)
Customer
Satisfaction (Y1)
After-sales
services (X2)
(X2)

57
Y1 = ρx1y1X1 + ρx2y1X2 + ρy1ɛ1y1
Y2 = ρx1y2X1 + ρx2y2X2 +ρy1y2Y1 + ρɛ1ɛ2
Description : (a) X1 = Promotion
(b) X2 = After-sales Services
(c) Y1 = Customer Satisfaction
(d) Y2 = Re-purchase intention
(e) ɛ1 = Error 1
(f) ɛ2 = Error 2
5. The Coefficient of Correlation
According to Sarwono (2007:22) correlation of coefficient is used to
see how strong relationship and direction between one or more variable.
Coefficient of correlation can be shown by the number of pearson
correlation. Pearson correlation ranged from zero until one. If pearson
correlation is close to the number one, it means the relationship is getting
strong. Otherwise, if pearson correlation is close to zero then the
relationship is getting weak.
Table 3.2
The Level of Coefficient Correlation
(Sarwono,2007:108)
Internal Coefficient Level of Relationship
0.0 - 0.25 Very Weak
>0.25 – 0.5 Weak
>0.5 – 0.75 Strong
>0.75 -1 Very Strong
6. The Coefficient of Determination
58
According to Ghozali (2006:202) the coefficient of determination
(𝑟2) essentially measure how far the ability of models to explain variation
in the dependent variable. The value determination of coefficient is
between zero and one. The small means that the ability of independent
variables in explaining variations in the dependent variable is very limited.
Basic weaknesses use the coefficient of determination is based on the
number of independent variables entered into the model. Each additional
one independent variable, then R2 would increase, no matter whether these
variables affect the dependent variable is not. Therefore, in this research
used is the R square that have been adapted or adjusted R2 as adjusted for
the variables used in this research. Adjusted R2 value can rise or fail if an
independent variable added into the model.
7. Simultaneous Test (F test)
According to Sarwono (2007:29) Ftest is used to see the influence
exogenous variable to endogenous variable simultaneously. According to
Sarwono (2007:30) the criteria for testing the significant level is 5% or
0.05. Step to examine the hypothesis with Ftest are as follow (Sarwono,
2007:17) :
a. Calculate Ftest by SPSS
b. Calculate the Ftable with the criteria significant level is 0.05
c. Determine the criteria of hypothesis test as follows :
1) If Ftest > Ftable , H0 is rejected and H1 is accepted, it means

59
exogenous variable has significant influence to endogenous
variable simultaneously
2) If Ftest < Ftable , H0 is accepted and H1 is rejected, it means
exogenous variable doesn’t have significant influence to
endogenous variable simultaneously.
8. Partial test (Ttest)
According to Sarwono (2007:31) Ttest is used to see how big influence
the exogenous variable to endogenous variable partially. Step to examine
the hypothesis with T test are as follow (Sarwono, 2007:32) :
a. Determine the hypotheses :
H0 : Exogenous variable doesn’t have influence endogenous variable
H1 : Exogenous variable has influence endogenous variable
b. Calculate the number of Ttest by SPSS
c. Calculate the number of Ttable with the criteria significant level 0.05
and degree of freedom (df) = n – k (number of respondent – exogenous
variable)
d. Determine the criteria of hypothesis test as follows :
1) If Ttest > Ttable , H0 is rejected and H1 is accepted, it means
exogenous variable has significant influence to endogenous
variable partially.
2) If Ttest < Ttable , H0 is accepted and H1 is rejected, it means

60
exogenous variable doesn’t have significant influence to
endogenous variable partially.
E. Operational Variable
According to Sugiyono (2009:58) research operational are everything that
shaped whatever things which determined by researcher to learn and get the
information about those things, next make a conclusion. Here are the table of
operational variable :
Table 3.2
Operational Variable
No. Variable Sub Variable Indicator Scale
1. Promotion
(X1)
Kotler et al
(2009:23)
1) Advertising • Media campaign Likert
2) Public relation • Publication through
articles
3) Direct marketing • Direct selling
through
demonstration
4) Sales force • Skills of sales force
5) Sales promotion • Persuade people of
offering something
2. After-Sales
Services (X2)
Barata
(2003:290)
1) Warranty • Provide Warranty
replacement of
goods damaged
Likert
2) maintenance • Ease of getting a
motorcycle
maintenance
services
• Good handling
consumer
complaints
3) Provision of • Providing a
61
No. Variable Sub Variable Indicator Scale
Spare parts complete spare
parts
• Motorcycle parts
easily obtained
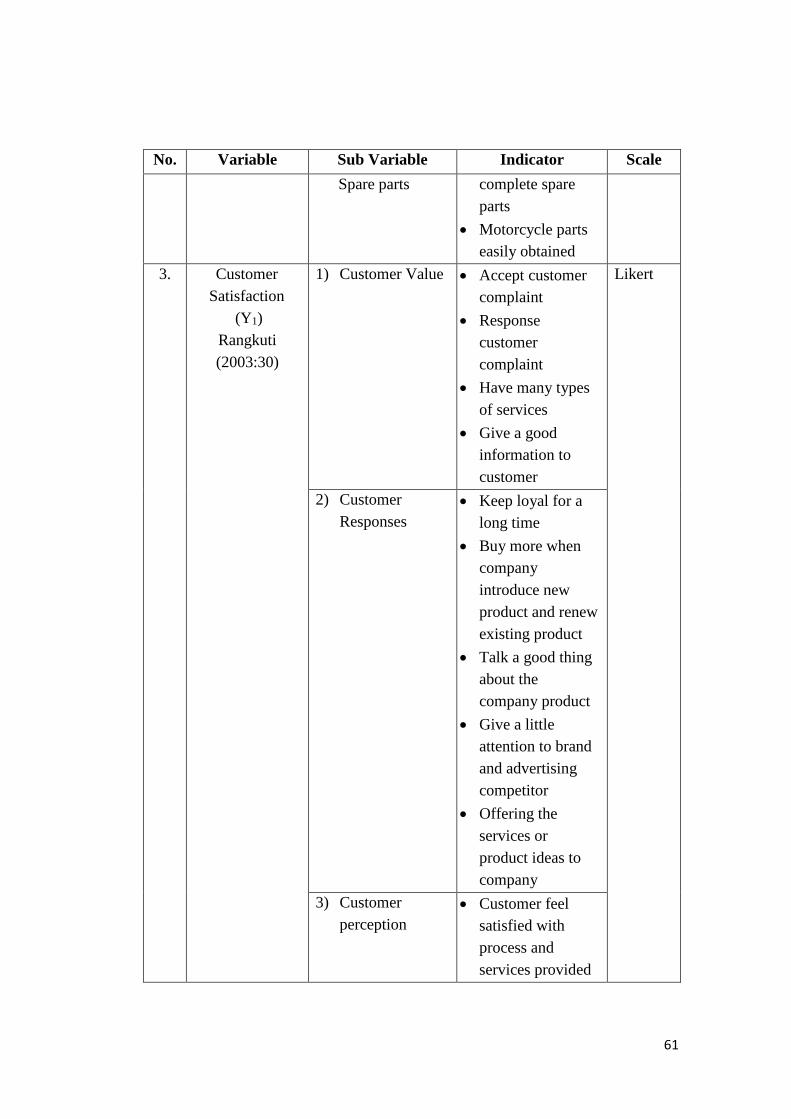
3. Customer
Satisfaction
(Y1)
Rangkuti
(2003:30)
1) Customer Value • Accept customer
complaint
• Response
customer
complaint
• Have many types
of services
• Give a good
information to
customer
Likert
2) Customer
Responses
• Keep loyal for a
long time
• Buy more when
company
introduce new
product and renew
existing product
• Talk a good thing
about the
company product
• Give a little
attention to brand
and advertising
competitor
• Offering the
services or
product ideas to
company
3) Customer
perception
• Customer feel
satisfied with
process and
services provided

62
No. Variable Sub Variable Indicator Scale
• Customers feel
safe and
comfortable when
have a deal to
company
• Give advice to
customers
complaint either
through the
suggestion box or
4. Repurchase
Intention (Y2)
Ferdinand in
Saidani and
Arifin (2012:7)
1) Transactional
interest
• Willingness of
customers to
repurchase the
products
Likert
2) Referential
interest
• Giving the
information about
products to the
others
3) Preferential
interest
• The products have
become the main
preference
4) Explorative
interest
• The interest of
finding product
information
63
CHAPTER IV
FINDING AND ANALYSIS
A. General Description of Research Object
1. History of Astra Honda Motor
PT Astra Honda Motor (AHM) is the pioneer of the motorcycle
industry in Indonesia. Established on June 11, 1971 with the initial
name of PT Federal Motor. At that time, PT Federal Motor only
assemble, whereas components imported from Japan in the form of
CKD (completely knocked down).
Type the first motorcycle manufactured Honda is the type of
business. Total production in the first year for one year only 1500 units,
but jumped to about 30 thousand in the year and continues to grow
today. Motorcycles continued to grow and become one of the mainstay
mode of transportation in Indonesia.
The government policy in terms of localization of automotive
components encourages PT Federal Motor manufacture various
components for Honda motorcycles in 2001 in the country through a
number of subsidiaries, including PT Honda Federal (1974), which
produce the basic components for Honda motorcycles such as the
frame, wheels, exhaust and etc., PT Showa Manufacturing Indonesia
(1979), which is specialized in producing shock absorbers, PT Astra
Honda engine Manufacturing (1984) which produces motorcycle engine

64
and PT Federal Izumi Mfg. (1990) which specialized in producing
piston.
Along with the development of economic conditions and the
growth of the motorcycle market changes in ownership composition
motorcycle manufacturer Honda. In 2001 PT Federal Motor and several
subsidiaries merged into one under the name of PT Astra Honda Motor,
the composition of its ownership to 50% owned by PT Astra
International Tbk and 50% owned by Honda Motor Co. Japan.
Currently, PT Astra Honda Motor has four assembly plant facility,
the first plant is located Sunter, North Jakarta which also serves as the
headquarters. Plant two located in Pegangsaan Dua, Kelapa Gading.
Plant 3 is located in the MM 2100 West Cikarang, Bekasi. Plant 4 is
located in Karawang. Plant 4 is the latest assembly plant facility has
been operating since 2014.
Overall this facility with PT Astra Honda Motor currently has a
production capacity of 5.3 million units of motorcycles per year, to
request the motorcycle market in Indonesia continues to increase. One
of the highlight accomplishments that were achieved by PT Astra
Honda Motor is the achievement of production to 40 million in 2013.
This achievement is a feat first achieved by the motorcycle industry in
Indonesia, even to the level of ASEAN.
To support the needs and customer satisfaction of Honda
motorcycles, PT Astra Honda Motor is supported by 1,800 sales

65
showroom, 3,600 service or repair shop AHASS (Astra Honda
Authorized Service Station), and 7,550 stores of spare parts, which are
ready to serve millions of the use of motorcycles Honda in Indonesia.
The motorcycle industry today is a huge industry in Indonesia.
Employees of PT Astra Honda Motor alone now number around 20,000
people, plus hundreds of vendors and suppliers as well as thousands of
other networks, all of which provide economic impacts remarkable
chain.
ba Vision and Mission of the company
Vision of the company is to be the leader of the motorcycle
market in Indonesia by way of realizing dreams and creating
excitement customers and contribute to society Indonesia.
Mission of the company is creating mobility solutions for the
people of Indonesia with the best products and services.
bb Awards
1) Gold Champion of Indonesia Wow Brand 2014
2) Top award Exhaust Emission Vehicle Category Motorcycles. In
2013, the Ministry of Environment set the All New Honda Beat-
FI winner.
3) Digital Marketing Award 2014
4) The event Hai Youth Brand Awards 2014.
Category of “Otomotif Roda Dua” : Honda
Category of “Motor Bebek” : Supra
66
Category of “Oli” : AHM Oil
5) Motorcycles Honda has been named as the most preferred brand
of Internet users in the Indonesia's Most Favorite Netizen Brand
2014 organized by the marketing research institute MarkPlus
Insight and Marketers Magazine.
6) WOMM Award 2014
Category of “Sepeda motor bebek” : Honda Supra
Category of “Sepeda motor matik” : Honda Vario
Category of “Sepeda motor sport” : Honda Tiger
7) The Company with The Best in Building and Managing
Corporate Image 2014
8) Indonesia's Most Favorite Youth Brand 2014
9) Otomotiv Award 2014
10) TOP Brand 2015
11) Excellent Service Experience Award 2015
12) MOTOR plus award 2014
B. Characteristics of profile respondents
The respondents in this study are the Honda motorcycle users in
pamulang. The following description is the amount of data and the identity
of respondents that consist of gender, age, occupation and monthly salary.
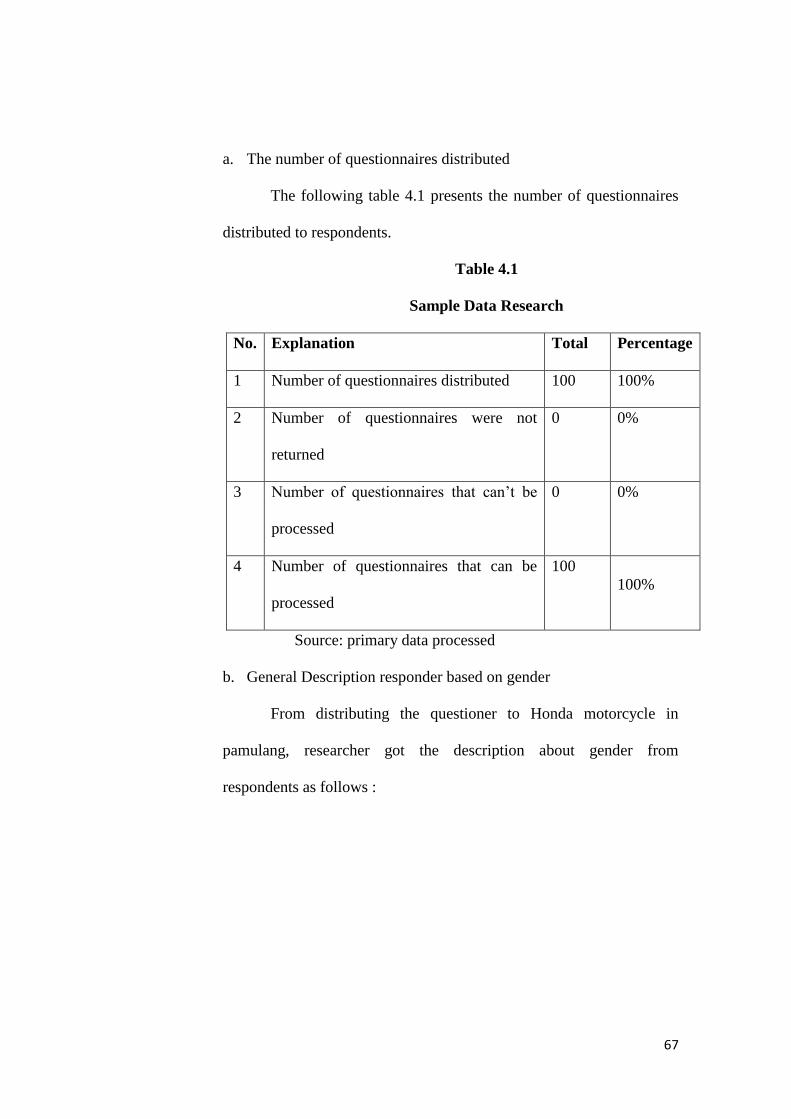
67
a. The number of questionnaires distributed
The following table 4.1 presents the number of questionnaires
distributed to respondents.
Table 4.1
Sample Data Research
No. Explanation Total Percentage
1 Number of questionnaires distributed 100 100%
2 Number of questionnaires were not
returned
0 0%
3 Number of questionnaires that can’t be
processed
0 0%
4 Number of questionnaires that can be
processed
100
100%
Source: primary data processed
b. General Description responder based on gender
From distributing the questioner to Honda motorcycle in
pamulang, researcher got the description about gender from
respondents as follows :
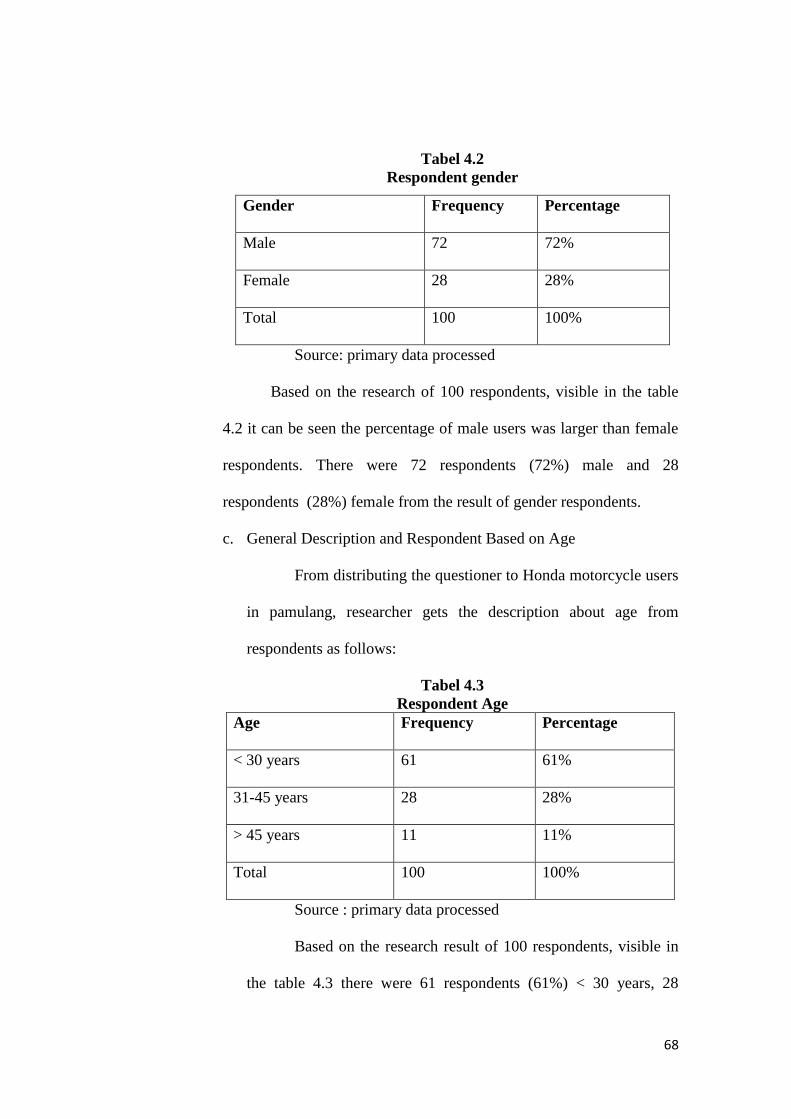
68
Tabel 4.2
Respondent gender
Gender Frequency Percentage
Male 72 72%
Female 28 28%
Total 100 100%
Source: primary data processed
Based on the research of 100 respondents, visible in the table
4.2 it can be seen the percentage of male users was larger than female
respondents. There were 72 respondents (72%) male and 28
respondents (28%) female from the result of gender respondents.
c. General Description and Respondent Based on Age
From distributing the questioner to Honda motorcycle users
in pamulang, researcher gets the description about age from
respondents as follows:
Tabel 4.3
Respondent Age
Age Frequency Percentage
< 30 years 61 61%
31-45 years 28 28%
> 45 years 11 11%
Total 100 100%
Source : primary data processed
Based on the research result of 100 respondents, visible in
the table 4.3 there were 61 respondents (61%) < 30 years, 28
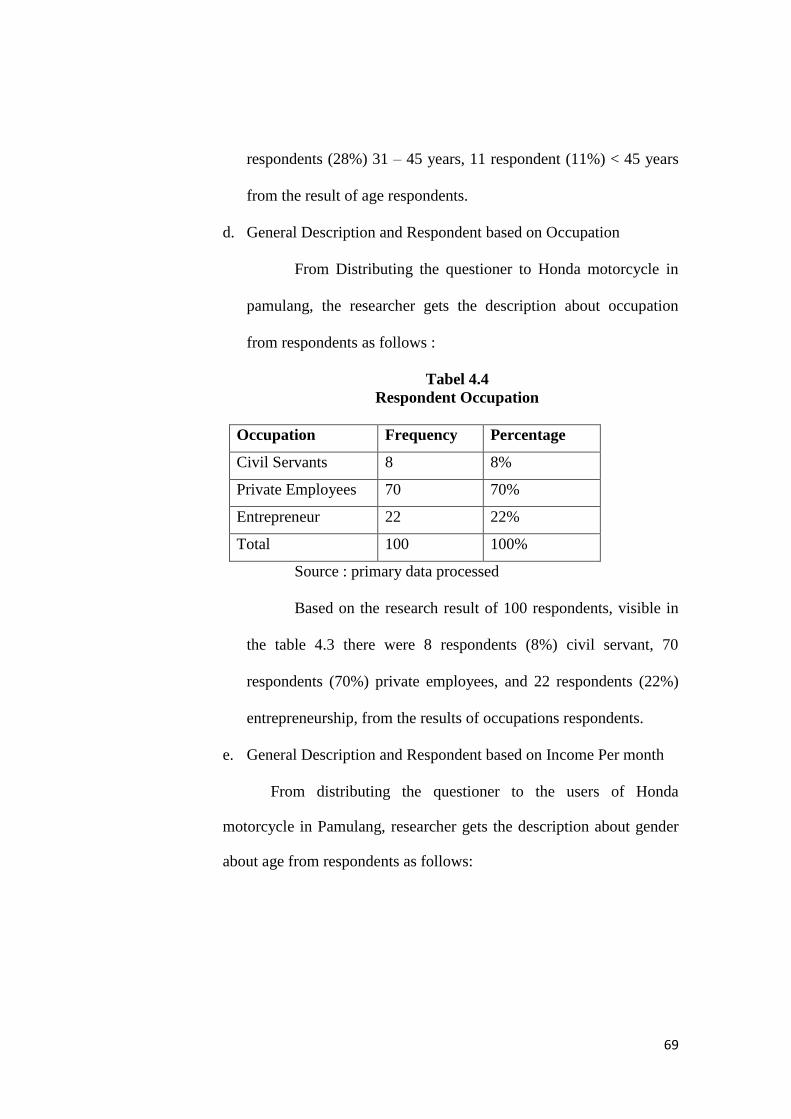
69
respondents (28%) 31 – 45 years, 11 respondent (11%) < 45 years
from the result of age respondents.
d. General Description and Respondent based on Occupation
From Distributing the questioner to Honda motorcycle in
pamulang, the researcher gets the description about occupation
from respondents as follows :
Tabel 4.4
Respondent Occupation
Occupation Frequency Percentage
Civil Servants 8 8%
Private Employees 70 70%
Entrepreneur 22 22%
Total 100 100%
Source : primary data processed
Based on the research result of 100 respondents, visible in
the table 4.3 there were 8 respondents (8%) civil servant, 70
respondents (70%) private employees, and 22 respondents (22%)
entrepreneurship, from the results of occupations respondents.
e. General Description and Respondent based on Income Per month
From distributing the questioner to the users of Honda
motorcycle in Pamulang, researcher gets the description about gender
about age from respondents as follows:
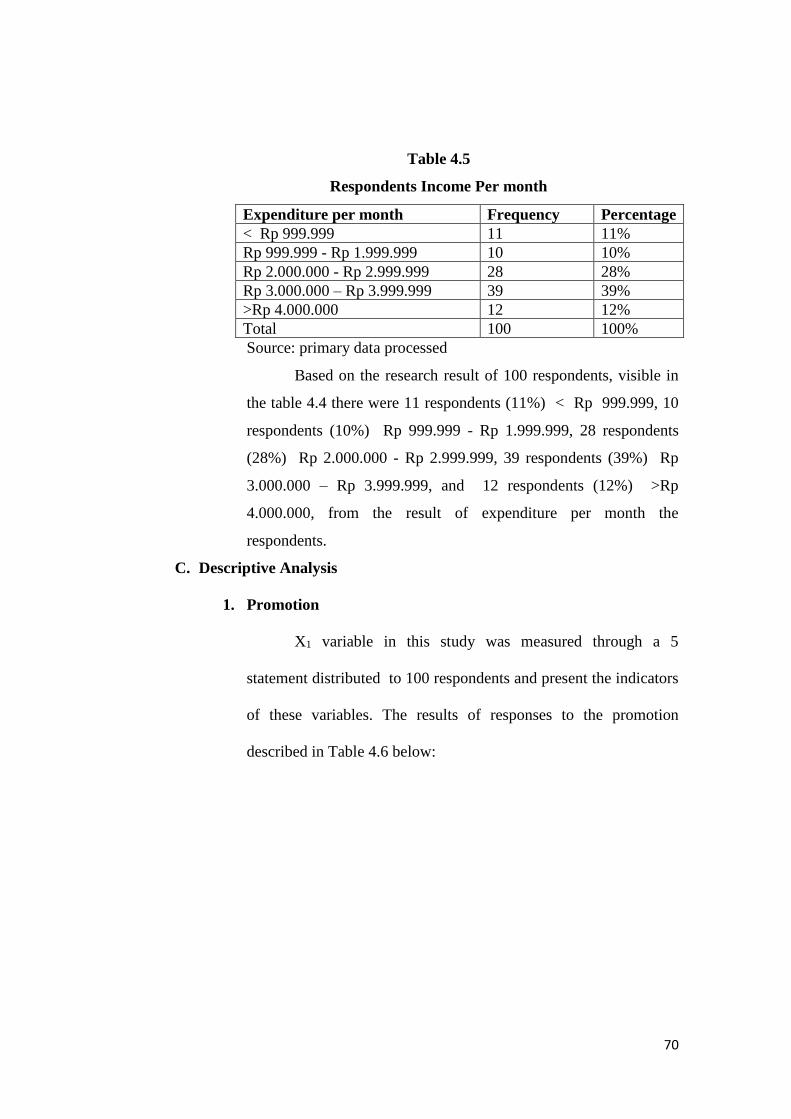
70
Table 4.5
Respondents Income Per month
Expenditure per month Frequency Percentage
< Rp 999.999 11 11%
Rp 999.999 - Rp 1.999.999 10 10%
Rp 2.000.000 - Rp 2.999.999 28 28%
Rp 3.000.000 – Rp 3.999.999 39 39%
>Rp 4.000.000 12 12%
Total 100 100%
Source: primary data processed
Based on the research result of 100 respondents, visible in
the table 4.4 there were 11 respondents (11%) < Rp 999.999, 10
respondents (10%) Rp 999.999 - Rp 1.999.999, 28 respondents
(28%) Rp 2.000.000 - Rp 2.999.999, 39 respondents (39%) Rp
3.000.000 – Rp 3.999.999, and 12 respondents (12%) >Rp
4.000.000, from the result of expenditure per month the
respondents.
C. Descriptive Analysis
1. Promotion
X1 variable in this study was measured through a 5
statement distributed to 100 respondents and present the indicators
of these variables. The results of responses to the promotion
described in Table 4.6 below:

71
Table 4.6
Respondents answer Regarding promotions
No. Question STS
%
TS
%
N
%
S
%
SS
%
Total
%
1 Advertising of Honda motorcycle
in various media created interesting 0 0 7 54 39 100
2
Articles in print and electronic
media of Honda get a positive
response from the community
0 8 6 45 41 100
3
Activities and events sponsored by Honda get a positive response in the community
0 3 9 49 39 100
4 Salesman who sell Honda motorcycle directly to costumer is very reliable to captivate customers
0 0
11` 49 40 100
5
Free gift helmets and jacket in the
purchase of Honda motorcycle into
consideration before buying a
product return
0 0 10 54 36 100
Mean % 0 2.2 8.6 50.2 39 100
Source: primary data processed
Table 4.9 shows that the majority respondents of
promotion variables explain : "agree" amounted to 50.2%. And the
most influential statement is a statement no. 1 and 5, it can be seen
by the majority of respondents to the statement no. 1 and 5
answered "agree" by 54%. This shows that the indicators
Advertising of Honda motorcycle in various media created
interesting, and free gift helmets and jacket in the purchase of
Honda motorcycle into consideration before buying a product
return have an influence on the large number of buyers of Honda.

72
2. After-sales Service
X2 variable in this study was measured through a 5
statement distributed to 100 respondents and present the indicators
of these variables. The results of responses to the promotion
described in Table 4.7 below:
Tabel 4.7
Respondents answer Regarding After-sales Services
No. Question STS
%
TS
%
N
%
S
%
SS
%
Total
%
1
Honda has a good warranty service
authorized for replacement of the
faulty component
0 0 1 59 40 100
2 Honda provides ease of service and maintenance of motorcycles to consumers
0 0 1 56 43 100
3
Honda handling customer complaints
properly so as to provide a sense of
comfort for users
0 0 5 49 46 100
4
Honda supply for each component of
a motorcycle with a complete and
well
0 0 1 49 50 100
5 Original spare parts for Honda
motorcycles are easy to obtain 0 0 3 51 46 100
Mean % 0 0 2.25 52.8 45 100
Table 4.7 shows that the majority respondents of After-
sales Services variables explain : "agree" amounted to 52.8%. And
the most influential statement is a statement no. 1 , it can be seen
by the majority of respondents to the statement no. 1answered
"agree" by 59%. This shows that the indicator Honda has a good
warranty service authorized for replacement of the faulty
component have an influence on the large number of buyers of
Honda.

73
3. Customer Satisfaction
Y1 variable in this study was measured through a 13
statement distributed to 100 respondents and present the indicators
of these variables. The results of responses to the Costumers
Satisfaction described in Table 4.8 below:
Table 4.8
Respondents answer Regarding Customers Satisfaction
No. Question STS
%
TS
%
N
%
S
%
SS
%
Total
%
1 Honda received customers complaint
properly 0 0 9 52 39 100
2 Honda responded well to customer
complaints 0 3 14 54 29 100
3 Honda motorcycle dealers have
more than one type of service 0 0 10 66 24 100
4 Honda motorcycle dealers provide
good information to the customers 0 1 14 47 38 100
5
Honda motorcycle dealers have
good quality thus creating loyalty
from consumers
0 0 14 53 33 100
6
Honda has always released its
newest product well so that you are
interested in buying more products
0 0 9 52 39 100
7
Services provided Honda motorcycle
dealership creates a good Word of
Mouth
0 3 14 54 29 100
8 Customers ignore besides Honda
motorcycle brand 0 0 10 66 24 100
9
Honda motorcycle dealers provide
space for consumers to give the idea
of tau opinions
0 1 14 47 38 100
10
Consumers are satisfied with the
services provided in the Honda
motorcycle dealer
0 0 14 53 33 100
11 Consumers feel safe when making a
transaction at the dealership Honda 0 0 9 52 39 100
12 Consumers feel comfortable when
doing deals at Honda motor dealers 0 3 14 54 29 100
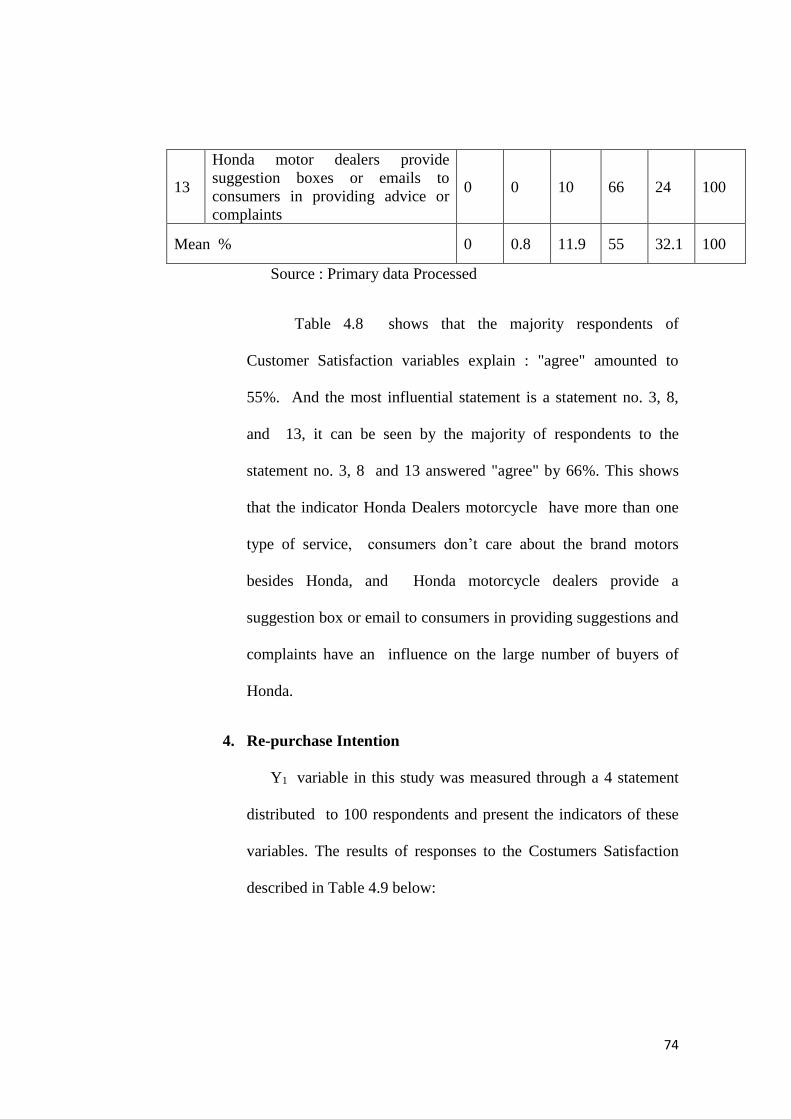
74
13
Honda motor dealers provide
suggestion boxes or emails to
consumers in providing advice or
complaints
0 0 10 66 24 100
Mean % 0 0.8 11.9 55 32.1 100
Source : Primary data Processed
Table 4.8 shows that the majority respondents of
Customer Satisfaction variables explain : "agree" amounted to
55%. And the most influential statement is a statement no. 3, 8,
and 13, it can be seen by the majority of respondents to the
statement no. 3, 8 and 13 answered "agree" by 66%. This shows
that the indicator Honda Dealers motorcycle have more than one
type of service, consumers don’t care about the brand motors
besides Honda, and Honda motorcycle dealers provide a
suggestion box or email to consumers in providing suggestions and
complaints have an influence on the large number of buyers of
Honda.
4. Re-purchase Intention
Y1 variable in this study was measured through a 4 statement
distributed to 100 respondents and present the indicators of these
variables. The results of responses to the Costumers Satisfaction
described in Table 4.9 below:
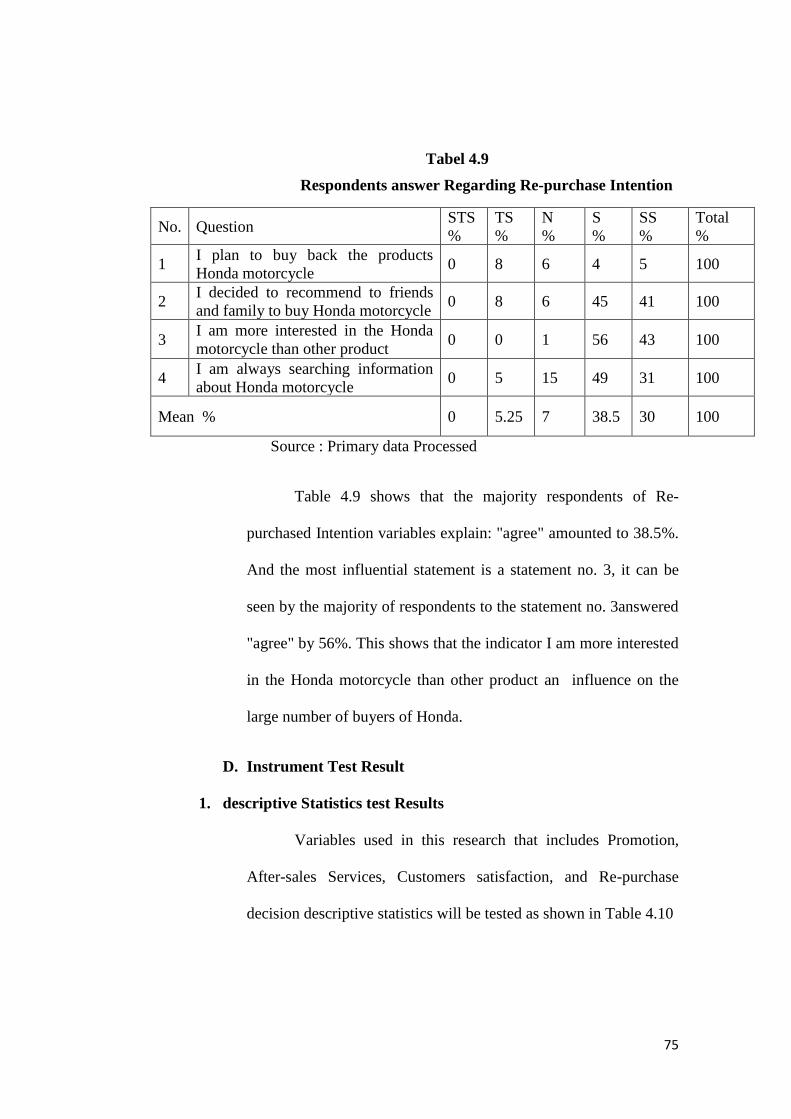
75
Tabel 4.9
Respondents answer Regarding Re-purchase Intention
No. Question STS
%
TS
%
N
%
S
%
SS
%
Total
%
1 I plan to buy back the products
Honda motorcycle 0 8 6 4 5 100
2 I decided to recommend to friends
and family to buy Honda motorcycle 0 8 6 45 41 100
3 I am more interested in the Honda
motorcycle than other product 0 0 1 56 43 100
4 I am always searching information
about Honda motorcycle 0 5 15 49 31 100
Mean % 0 5.25 7 38.5 30 100
Source : Primary data Processed
Table 4.9 shows that the majority respondents of Re-
purchased Intention variables explain: "agree" amounted to 38.5%.
And the most influential statement is a statement no. 3, it can be
seen by the majority of respondents to the statement no. 3answered
"agree" by 56%. This shows that the indicator I am more interested
in the Honda motorcycle than other product an influence on the
large number of buyers of Honda.
D. Instrument Test Result
1. descriptive Statistics test Results
Variables used in this research that includes Promotion,
After-sales Services, Customers satisfaction, and Re-purchase
decision descriptive statistics will be tested as shown in Table 4.10
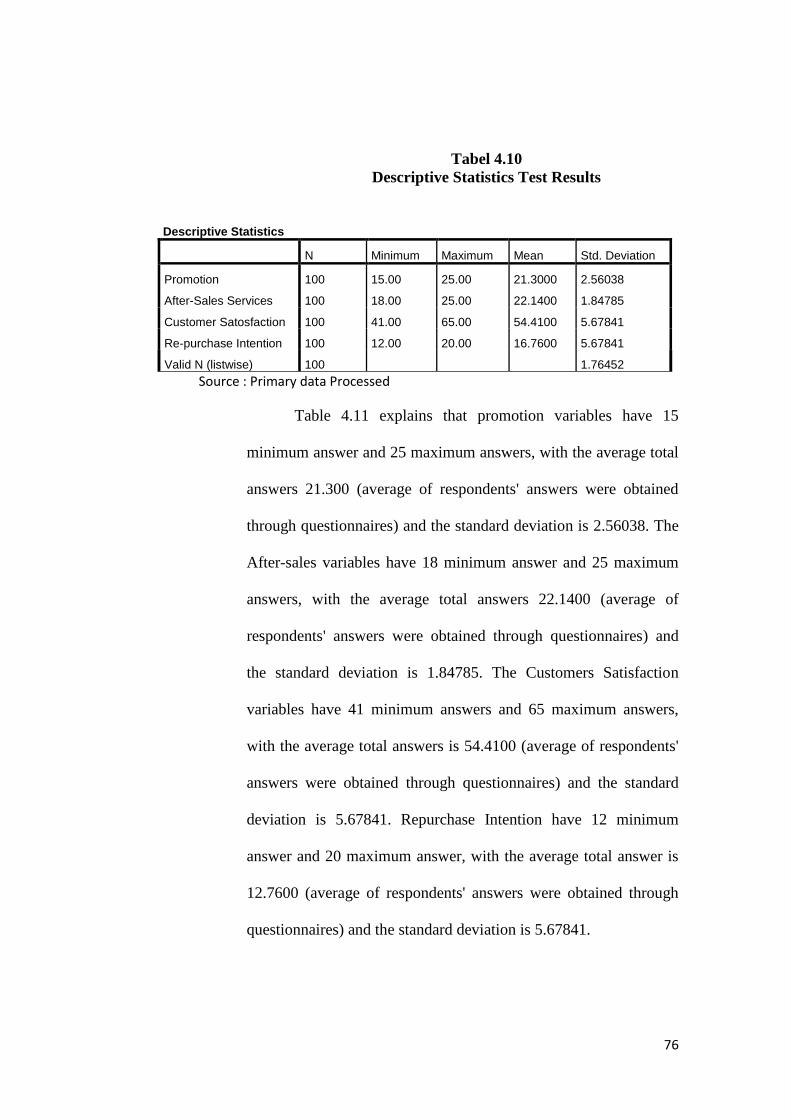
76
Tabel 4.10
Descriptive Statistics Test Results
Source : Primary data Processed
Table 4.11 explains that promotion variables have 15
minimum answer and 25 maximum answers, with the average total
answers 21.300 (average of respondents' answers were obtained
through questionnaires) and the standard deviation is 2.56038. The
After-sales variables have 18 minimum answer and 25 maximum
answers, with the average total answers 22.1400 (average of
respondents' answers were obtained through questionnaires) and
the standard deviation is 1.84785. The Customers Satisfaction
variables have 41 minimum answers and 65 maximum answers,
with the average total answers is 54.4100 (average of respondents'
answers were obtained through questionnaires) and the standard
deviation is 5.67841. Repurchase Intention have 12 minimum
answer and 20 maximum answer, with the average total answer is
12.7600 (average of respondents' answers were obtained through
questionnaires) and the standard deviation is 5.67841.
Descriptive Statistics
N Minimum Maximum Mean Std. Deviation
Promotion 100 15.00 25.00 21.3000 2.56038
After-Sales Services 100 18.00 25.00 22.1400 1.84785
Customer Satosfaction 100 41.00 65.00 54.4100 5.67841
Re-purchase Intention 100 12.00 20.00 16.7600 5.67841
Valid N (listwise) 100 1.76452
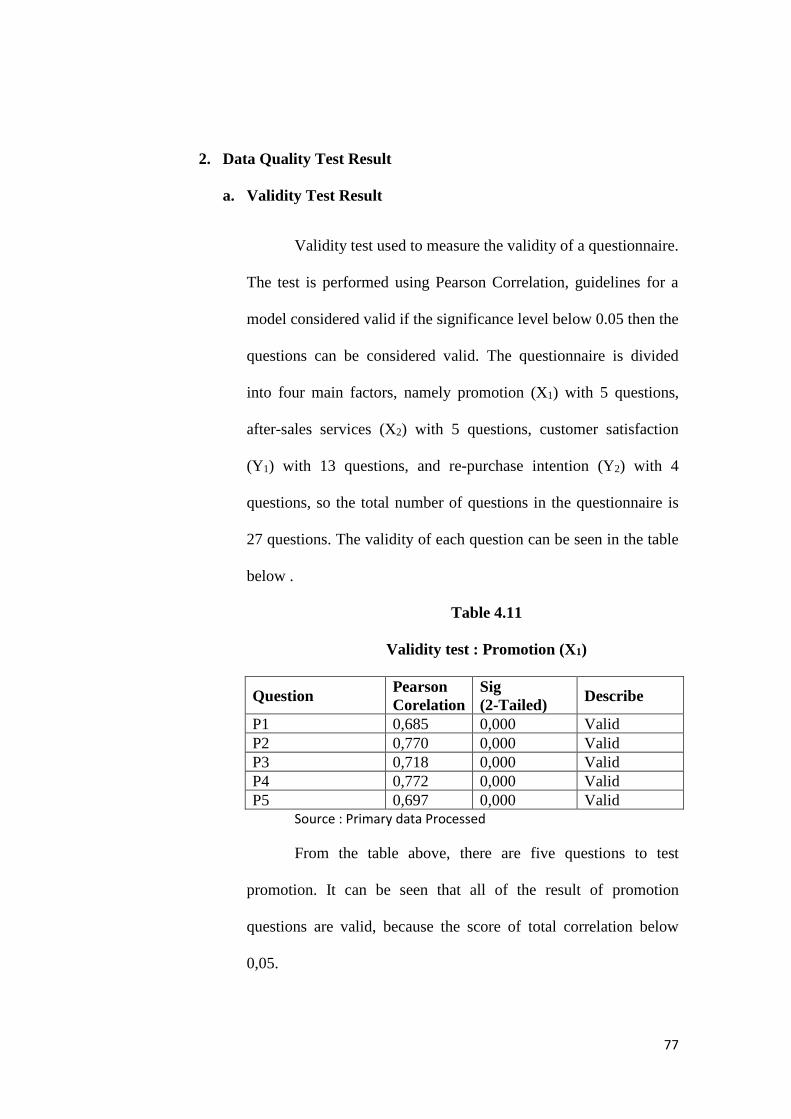
77
2. Data Quality Test Result
a. Validity Test Result
Validity test used to measure the validity of a questionnaire.
The test is performed using Pearson Correlation, guidelines for a
model considered valid if the significance level below 0.05 then the
questions can be considered valid. The questionnaire is divided
into four main factors, namely promotion (X1) with 5 questions,
after-sales services (X2) with 5 questions, customer satisfaction
(Y1) with 13 questions, and re-purchase intention (Y2) with 4
questions, so the total number of questions in the questionnaire is
27 questions. The validity of each question can be seen in the table
below .
Table 4.11
Validity test : Promotion (X1)
Question Pearson
Corelation
Sig
(2-Tailed) Describe
P1 0,685 0,000 Valid
P2 0,770 0,000 Valid
P3 0,718 0,000 Valid
P4 0,772 0,000 Valid
P5 0,697 0,000 Valid
Source : Primary data Processed
From the table above, there are five questions to test
promotion. It can be seen that all of the result of promotion
questions are valid, because the score of total correlation below
0,05.

78
Table 4.12
Validity Test : after-sales services (X2)
Question Pearson
Corelation
Sig
(2-Tailed) Describe
As1 0,627 0,000 Valid
As2 0,700 0,000 Valid
As3 0,737 0,000 Valid
As4 0,713 0,000 Valid
As5 0,650 0,000 Valid
Source : Primary data Processed
From the table above, there are five questions to test after-
sales services. It can be seen that all of the result of after-sales
services questions are valid, because the score of total correlation
below 0,05.
Table 4.13
Validity test : customer satisfaction (Y1)
Quesion Pearson
Corelation
Sig
(2-Tailed) Describe
CS1 0,730 0,000 Valid
CS2 0,717 0,000 Valid
CS3 0,679 0,000 Valid
CS4 0,549 0,000 Valid
CS5 0,576 0,000 Valid
CS6 0,730 0,000 Valid
CS7 0,717 0,000 Valid
CS8 0,679 0,000 Valid
CS9 0,549 0,000 Valid
CS10 0,576 0,000 Valid
CS11 0,730 0,000 Valid
CS12 0,717 0,000 Valid
CS13 0,679 0,000 Valid
Source : Primary data Processed
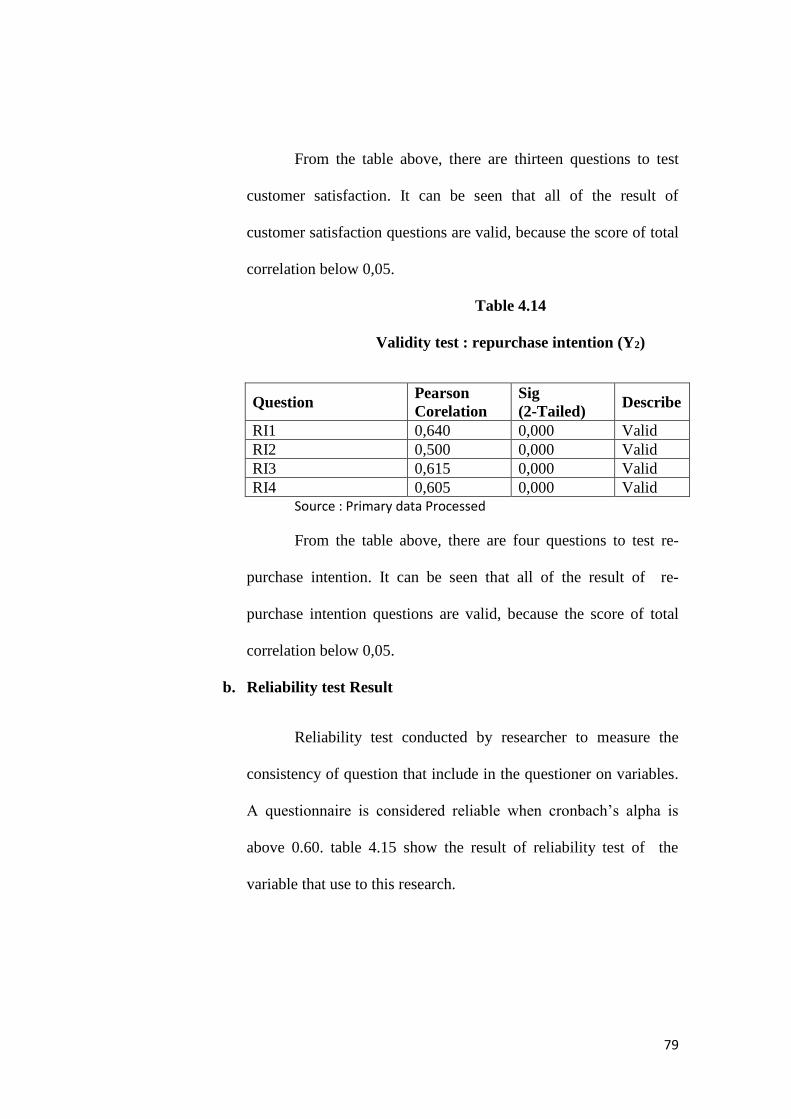
79
From the table above, there are thirteen questions to test
customer satisfaction. It can be seen that all of the result of
customer satisfaction questions are valid, because the score of total
correlation below 0,05.
Table 4.14
Validity test : repurchase intention (Y2)
Question Pearson
Corelation
Sig
(2-Tailed) Describe
RI1 0,640 0,000 Valid
RI2 0,500 0,000 Valid
RI3 0,615 0,000 Valid
RI4 0,605 0,000 Valid
Source : Primary data Processed
From the table above, there are four questions to test re-
purchase intention. It can be seen that all of the result of re-
purchase intention questions are valid, because the score of total
correlation below 0,05.
b. Reliability test Result
Reliability test conducted by researcher to measure the
consistency of question that include in the questioner on variables.
A questionnaire is considered reliable when cronbach’s alpha is
above 0.60. table 4.15 show the result of reliability test of the
variable that use to this research.

80
Table 4.15
Reliability test Result
Variable Cronbach’s
Alpha Describe
Promotion 0,774 Reliabel
After-Sales Services 0.718 Reliabel
Customer Satisfaction 0.892 Reliabel
Re-purchase Intention 0.675 Reliabel
Source : Primary data Processed
Table 4.15 show the result of cronbach’s alpha of
promotion is 0,774, after-sales services is 0,718, customer
satisfaction 0.892, and re-purchase intention is 0.675
3. Path Analysis
Data processing techniques in resolving the research by
using path analysis. Path analysis model was used to analyze the
patterns of relationship between variable with the aim to find out
directly or indirectly influence of a set variables with each other.
Here are the result of path analysis :
a. Testing Relationship Between Sub Variable
In the method of path analysis, for finding causal
relationship or effect of the research variables, first calculated the
correlation matrix of the research variables.

81
Table 4.16
Correlation Coeficient
Correlations
Promotion AftersalesServices
CustomerSatisfaction
RepurchaseIntention
Promotion
Pearson Correlation
1 .301** .414** .660**
Sig. (2-tailed)
.002 .000 .000
N 100 100 100 100
AftersalesServices
Pearson Correlation
.301** 1 .427** .522**
Sig. (2-tailed)
.002 .000 .000
N 100 100 100 100
CustomerSatisfaction
Pearson Correlation
.414** .427** 1 .641**
Sig. (2-tailed)
.000 .000 .000
N 100 100 100 100
RepurchaseIntention
Pearson Correlation
.660** .522** .641** 1
Sig. (2-tailed)
.000 .000 .000
N 100 100 100 100
**. Correlation is significant at the 0.01 level (2-tailed).
Source : primary data processed
from the result of data in the table 6.16 can be seen that
three categorized relationship is strong and the three other
relationship categorized weak. The significant value of all
relationship is 0,000 less than the specified tolerance value than the
figure of 0.05 means all significant correlations. It can be
concluded SPSS data result in table 4.17 as follows:

82
Table 4.17
Testing Interpersonal Variable
Correlation Correlation
coefficient
Category Probability Conclusion
Promotion (X1) with
After-sales Services (X2)
0.301** Weak 0,002 Significant
Promotion (X1) with
Customer Satisfaction
(Y1)
0.414** Weak 0,000 Significant
Promotion (X1) with Re-
purchase Intention (Y2)
0.650** Strong 0,000 Significant
After-sales Services (X2)
with Customer
Satisfaction (Y1)
0.427** Weak 0,000 Significant
After-sales Services (X2)
with Re-purchase
Intention (Y2)
0.513** Strong 0,000 Significant
Customer Satisfaction
(Y1) with Re-purchase
Intention (Y2)
0.623** Strong 0,000 Significant
b. Coefficient of determination
1) Structure determination coefficient
Table 4.18
Correlation Coefficient Substructure I Model Summary
Model Summary
Model R R Square Adjusted R
Square
Std. Error of the
Estimate
1 .521a .272 .257 4.89553
a. Predictors: (Constant), AftersalesServices, Promotion
Source : primary data processed
In table 4.18 obtained path analysis model with
determination coefficient (R Square) of 0,272 (27,2%).
Adjusted R-square of 25,7% indicates that the effect of
Promotion, after sales services and promotion on customer
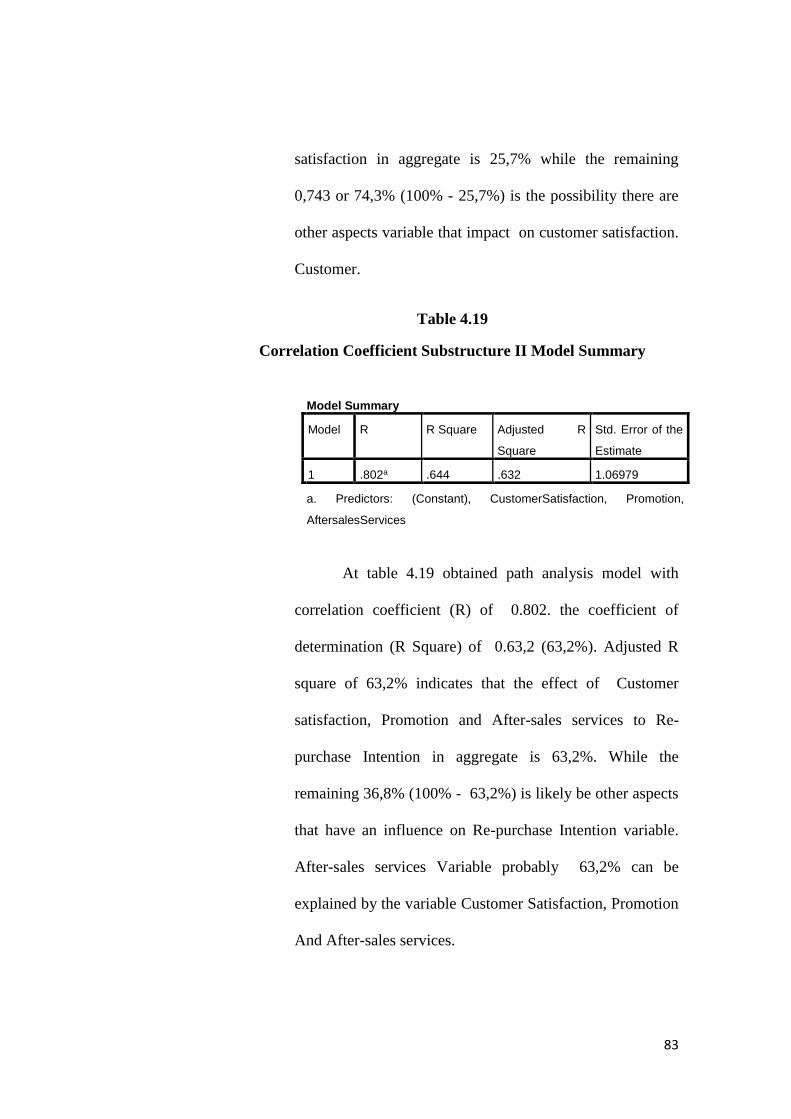
83
satisfaction in aggregate is 25,7% while the remaining
0,743 or 74,3% (100% - 25,7%) is the possibility there are
other aspects variable that impact on customer satisfaction.
Customer.
Table 4.19
Correlation Coefficient Substructure II Model Summary
Model Summary
Model R R Square Adjusted R
Square
Std. Error of the
Estimate
1 .802a .644 .632 1.06979
a. Predictors: (Constant), CustomerSatisfaction, Promotion,
AftersalesServices
At table 4.19 obtained path analysis model with
correlation coefficient (R) of 0.802. the coefficient of
determination (R Square) of 0.63,2 (63,2%). Adjusted R
square of 63,2% indicates that the effect of Customer
satisfaction, Promotion and After-sales services to Re-
purchase Intention in aggregate is 63,2%. While the
remaining 36,8% (100% - 63,2%) is likely be other aspects
that have an influence on Re-purchase Intention variable.
After-sales services Variable probably 63,2% can be
explained by the variable Customer Satisfaction, Promotion
And After-sales services.
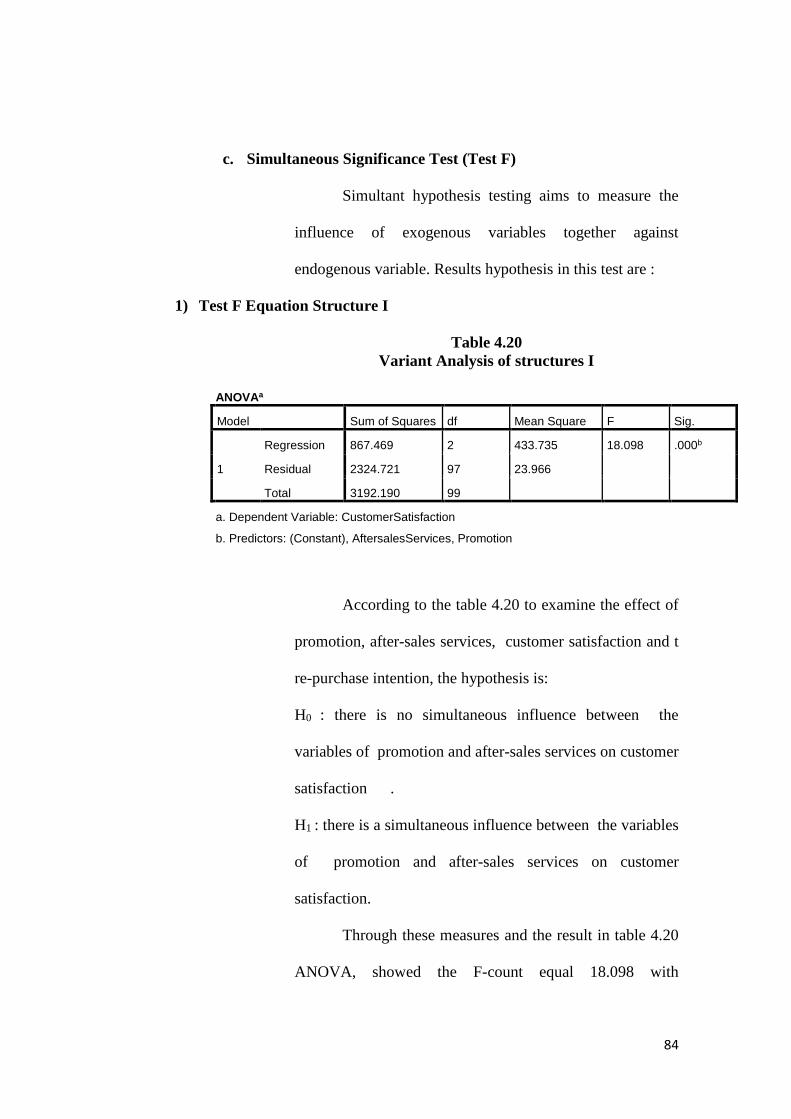
84
c. Simultaneous Significance Test (Test F)
Simultant hypothesis testing aims to measure the
influence of exogenous variables together against
endogenous variable. Results hypothesis in this test are :
1) Test F Equation Structure I
Table 4.20
Variant Analysis of structures I
ANOVAa
Model Sum of Squares df Mean Square F Sig.
1
Regression 867.469 2 433.735 18.098 .000b
Residual 2324.721 97 23.966
Total 3192.190 99
a. Dependent Variable: CustomerSatisfaction
b. Predictors: (Constant), AftersalesServices, Promotion
According to the table 4.20 to examine the effect of
promotion, after-sales services, customer satisfaction and t
re-purchase intention, the hypothesis is:
H0 : there is no simultaneous influence between the
variables of promotion and after-sales services on customer
satisfaction .
H1 : there is a simultaneous influence between the variables
of promotion and after-sales services on customer
satisfaction.
Through these measures and the result in table 4.20
ANOVA, showed the F-count equal 18.098 with

85
probability 0,000. F-table with significance level of 0,05,
degree of freedom (df) for df1 = 2, df2= 97, then the F
table = 3,09. The result is F-count (18.098) > F table
(3,09) and with this result, then H0 is rejected and Ha is
accepted.
2) Test F Equation Structure II
Table 4.21
Variant Analysis of Structure II
ANOVAa
Model Sum of Squares df Mean Square F Sig.
1
Regression 197.296 3 65.765 51.773 .000b
Residual 121.944 96 1.270
Total 319.240 99
a. Dependent Variable: RepurchaseIntention
b. Predictors: (Constant), CustomerSatisfaction, Promotion, AfterSales
According to the table 4.21 to examine the effect of
customer satisfaction, promotion, and after-sales services to
Repurchase intention, the hypothesis is :
H0 : there is no simultaneous influence between the
variables of customer satisfaction , promotion, and after-
sales services on repurchase intention
H1 : there is a simultaneous influence between the variables
of customer satisfaction , promotion, and after-sales
services on repurchase intention

86
Through these measures and the result in table 4.21
ANOVA, showed F-count equal to 51.773 with probability
0,000. F-table with significance level of 0,05. Degree of
freedom (df) for df1 = 3, df2 = 96, the F-table = 2,70. The
result is the F-count (51,773) > F-table (2,70) with the
results then H0 is rejected and Ha accepted. This means that
the variable promotion, after-sales service, and customer
satisfaction simultaneously significant effect on Repurchase
Intention.
d. Individual Significance Test (t Test)
Partial hypothesis testing aims to measure the
influence of exogenous variables partially on endogenous
variables. need to be notified for each hypothesis test
criteria are as follows:
H0 is accepted and Ha is rejected if t <t table for α = 0.05
Ha rejected and Ha accepted if t> table for α = 0.05.
Results hypothesis are :

87
1) T-Test Eq Structures 1
Table 4.22
Structure I t-test Result
Coefficientsa
Model Unstandardized Coefficients Standardized
Coefficients
T Sig.
B Std. Error Beta
1
(Constant) 16.968 6.396 2.653 .009
Promotion .696 .201 .314 3.456 .001
AfterSales 1.021 .279 .332 3.658 .000
a. Dependent Variable: CustomerSatisfaction
a. Relationship between promotion and customer satisfaction
The Hypothesis is:
H0 : there is no partial influence between the variables of
promotion to customer satisfaction
H1 : there is a partial influence between the variables of promotion
to customer satisfaction
According to the table 4.22, t-count table is 3.456 with
probability 0,001. T-table with significance level of 0,05 and
degree of freedom (df) for df = n-3 or 100-3 = 97 then the t-table
is 1,66071. The result is a test (3.456)> t-table (1,66071). It can be
concluded, H0 is rejected and Ha accepted. This means that a
significant influence between the variable perceived promotion to
customer satisfaction.

88
b. Relationship between after-sales services in customer satisfaction
H0 : There is no partial influence between the variables of
repurchase intention to customer satisfaction
Ha : There is a partial influence between the variables of
repurchase intention to customer satisfaction
According to the table 4.22, t-count table is 3.658 wit
probability 0,001. T-table probability 0,001. T-table with
significance level of 0,05 and degree of freedom (df) for df = n-3
or 100-3 = 97 then the t-tables is 1,66071. The result is a t-test
(3.658)> t-table (1,66071). It can be conclude, H0 is rejected and
Ha accepted. This means that a significant influence between the
variable after-sales services to customer satisfaction.
Table 4.23
Structure I Equation t-Test
Promotion and After-sales Services
No Hypothesis Path
analysis
T-count t-table Result
1 ρx1y1≠ 0 ρx1y1=
0.696
3.456 1,66071 Ha
accepted
2 ρx2y1 ≠0 ρx2y1=
1.021
3.658 1,66071 Ha
accepted
Source : primary data processed
Based on the result in Table 4.21, the partial test perceived
promotion and after-sales services on customer satisfaction. Thus
the equations of the first structural path analysis are:

89
Y1 = ρx1y1 + ρx2y1
Y1 = 0.696X1 + 1.021X2
Figures residue obtained from 1- adjusted –R square that is 1 –
1,717 = - 0,717
Table 4.24
Structure II t-Test Results
Coefficientsa
Model Unstandardized Coefficients Standardized
Coefficients
t Sig.
B Std. Error Beta
1
(Constant) -.748 1.525 -.491 .625
Promotion .307 .049 .438 6.246 .000
AfterSales .230 .069 .236 3.350 .001
CustomerSatisfaction .108 .023 .341 4.609 .000
a. Dependent Variable: RepurchaseIntention
a. Relationship between Promotion with Repurchase intention
H₀: There is no partial influence between the variables of
Promotion to Repurchase Intention
Ha: There is a partial influence between the variables of
Promotion to Repurchase Intention
According to table 4.22, t-count table is 6.246 with
probability 0,000. T-table with significance level of 0,05 and a
degree of freedom (df) for df = n-4 or 100-4 = 96 then the t-table is
1,66088. The result is a t-test (6.246) > t-table (1,66088). It can be
concluded, Ho is rejected and Ha accepted. This means that a
90
significant difference between the variable Promotion to
Repurchase Intention.
b. Relationship between after-sales wit repurchase intention
H₀: There is no partial influence between the variables of After-
sales Services to customer satisfaction
Ha: There is a partial influence between the variables of After-sales
Services to customer satisfaction.
According to table 4.22, t-count table is 3,350 with
probability 0,000. T-table with significance level 0,05 and a degree
of freedom (df) for df= n-4 or 100-4 =96 then the t-table is
1,66088. The result is a t-test (3,350) > t-table (1,66088). It can be
concluded, Ho is rejected and Ha accepted. This means that
significant difference between the variable After-sales Services to
Repurchase Intention.
c. Relationship between Customer satisfaction with Repurchase
Intention
H₀: There is no partial effect between the variables of Customer
satisfaction to Repurchase Intention
Ha: There is a partial influence between the variables of Customer
satisfaction to Repurchase Intention
According to table 4.22, t-count table is 4.609 with
probability 0,000. T- table with significance level 0,05 and a
degree of freedom (df) fro df= n-4 or 100-4= 96 then the table is
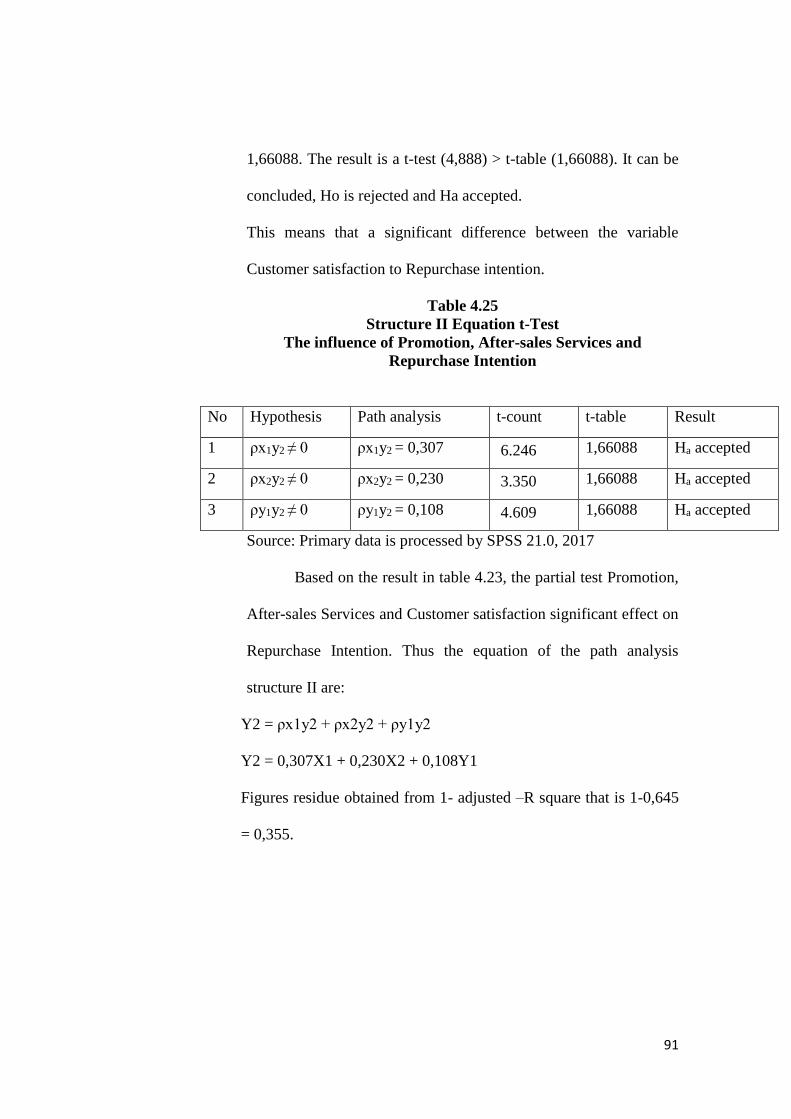
91
1,66088. The result is a t-test (4,888) > t-table (1,66088). It can be
concluded, Ho is rejected and Ha accepted.
This means that a significant difference between the variable
Customer satisfaction to Repurchase intention.
Table 4.25
Structure II Equation t-Test
The influence of Promotion, After-sales Services and
Repurchase Intention
No Hypothesis Path analysis t-count t-table Result
1 ρx1y2 ≠ 0 ρx1y2 = 0,307 6.246 1,66088 Ha accepted
2 ρx2y2 ≠ 0 ρx2y2 = 0,230 3.350 1,66088 Ha accepted
3 ρy1y2 ≠ 0 ρy1y2 = 0,108 4.609 1,66088 Ha accepted
Source: Primary data is processed by SPSS 21.0, 2017
Based on the result in table 4.23, the partial test Promotion,
After-sales Services and Customer satisfaction significant effect on
Repurchase Intention. Thus the equation of the path analysis
structure II are:
Y2 = ρx1y2 + ρx2y2 + ρy1y2
Y2 = 0,307X1 + 0,230X2 + 0,108Y1
Figures residue obtained from 1- adjusted –R square that is 1-0,645
= 0,355.

92
4. Sobel Test
The sobel test is intended to test the significance of indirect effect, by
computing the t value of the exogenous variable coefficients and the
mediation variable, the t-value compared to the t-table. If the value of t-
count is greater than the value of t-table then it can be concluded the
influence of mediation. Sobel testing conducted in this study is as
follows:
a. Promotion toward Re-purchase Intention through Customer Satisfaction
The result of path analysis show that promotion directly affects re-
purchase intention and also directly affects the customer satisfaction. To
determine the effect of promotion on re-purchase intention through the
customer satisfaction can be tested with the test of sobel test as follows:
Calculate standard error from indirect effect of Coefficient (Sx1y1)
Sx1y1 = √ y12sx1
2 + x12sy1
2 + sx12sy1
2
Where: x1 = 0,696
sx1 = 0,201
y1 = 0,108
sy1 = 0,023
Sx1y1 = √(0,696) 2(0,201) 2 + (0,108) 2 (0,023) 2 + (0,201) 2 (0,023) 2
Sx1y1 = 0.019776
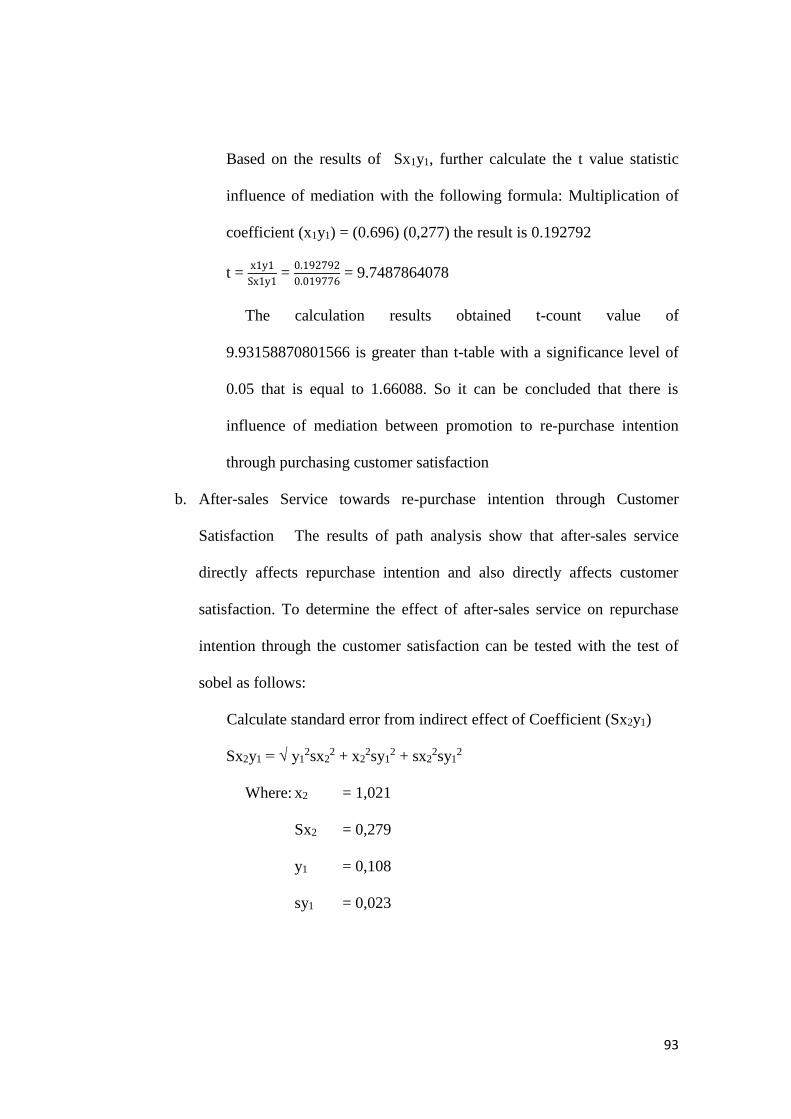
93
Based on the results of Sx1y1, further calculate the t value statistic
influence of mediation with the following formula: Multiplication of
coefficient (x1y1) = (0.696) (0,277) the result is 0.192792
t = x1y1
Sx1y1 =
0.192792
0.019776 = 9.7487864078
The calculation results obtained t-count value of
9.93158870801566 is greater than t-table with a significance level of
0.05 that is equal to 1.66088. So it can be concluded that there is
influence of mediation between promotion to re-purchase intention
through purchasing customer satisfaction
b. After-sales Service towards re-purchase intention through Customer
Satisfaction The results of path analysis show that after-sales service
directly affects repurchase intention and also directly affects customer
satisfaction. To determine the effect of after-sales service on repurchase
intention through the customer satisfaction can be tested with the test of
sobel as follows:
Calculate standard error from indirect effect of Coefficient (Sx2y1)
Sx2y1 = √ y12sx2
2 + x22sy1
2 + sx22sy1
2
Where: x2 = 1,021
Sx2 = 0,279
y1 = 0,108
sy1 = 0,023

94
Sx2y1 = √(1,021)2(0,279)2 + (0,108)2(0,023)2 + (0,279)2(0,023)2
Sx2y1 = 0.285247212
Based on the results of Sx₂y1, further calculate the t value
statistic influence of mediation with the following formula:
Multiplication of Coefficient (x2y1) = (0,021) (0.108) the result is
0.110268
t = x2y1
Sx2y1 =
0,110268
0,285247212 = 0,3865699483
The calculation results obtained t-count value of 0,3865699483
is greater than t-table with a significance level of 0.05 that is equal to
1.66088. It can be concluded that there is an effect of mediation
between after-sales service against repurchase intention through
customer satisfaction.
95
CHAPTER V
CONCLUSIONS AND SUGGESTIONS
A. Conclusion
Based on the analysis and discussion of data on respondents'
assessment of the effect of The influence of promotion and after-sales
service, toward customer satisfaction that impact re-purchase intention
(study case on pamulang society), it can be concluded:
1. There is partial influence between the variables of promotion to
customer satisfaction (study case on pamulang society).
2. There is a partial influence between variables of After-Sales
Services to Customer Satisfaction (study case on pamulang
society).
3. Based on the test result of the F variable Promotion and After-
Sales Services had a significant effect simultaneously to Customer
Satisfaction (study case on pamulang society).
4. There is a partial influence between the variables of Promotion to
Re-purchase Intention (study case on pamulang society).
5. There is partial influence between the variables of After-Sales
Services to Re-purchase Intention (study case on pamulang
society).
6. There is a partial influence between the variables of Customer
Satisfaction to Re-purchase Decision (study case on pamulang
society).
96
7. Based on the test result of the F variable Promotion, After-Sales
Services and Customer Satisfaction had a significant effect
simultaneously to Re-purchase Decision (study case on pamulang
society).
B. Suggestion
Based on the result of the analysis and conclusion above, then there are
some suggestions as follows:
1. For Company
a. Promotion
According to the results of research that has been
conducted by researchers, it can be concluded that the
Honda is good enough in the promotion. But Honda must
continue to innovate in the promotion. in addition to
promotion through print media and television, Honda also
need promotion through activity in education. For example,
Honda may undertake promotional activities carried out in
conjunction with the extension to drive properly and safely.
Thus shows that Honda is also concerned with the bikers,
not only concerned with sales and profits.
b. After-sales Services
One of elements that are also fairly crucial is the
after sales services. Thus the researcher suggest Honda for
more attention to after-sales services sector. Although so

97
far after sales service that made Honda also need to further
improve end develop the after sales service. It can be done
by Honda is in a way more concerned about consumer
complaints. Honda should me more alert in handling
consumer complaints, and Honda also have to pay attention
and customer comfort t at a time when consumer were
damaged products. Then other thing can also be done by
Honda to improve the quality in after sales service is to
provide a longer warranty period and ensure the
availability, authenticity, and ease of getting spare parts
Honda products. Then the researcher also suggest that
Honda undertake activities related to the maintenance of
product such as doing free service and related consulting
Honda product for free in order to improve after-sales
service.
c. Customer Satisfaction
Satisfaction is a factor to make the consumer buy
more product and also as one factor makes customer loyal
to the brand or product. In this research, satisfaction of
customer Honda motorcycle gives influence significantly to
re-purchase intention. Here, costumer value , and customer
perception are the main factor. But Honda has to keep the
98
customer perception because the all customer like to give
the complain to the Honda dealer
d. Repurchase Intention
Re-purchase intention can be interpreted as
consumers who repurchase a product that has been
purchase previously, influenced by individual evaluations
or experiences of buying behavior. Therefore, re-purchase
intention can be used as a predictor of buying behavior.
improvement that needs to be done by Honda motorcycle is
add sales services such as providing free insurance to
consumer.
2. For the next researcher
it is necessary to do the research by deepening or
developing the research variables with the sample and the
larger population. This assessment is expected find new
findings that can be useful for the development of science,
especially in the field of marketing management.
99
REFERENCES
Alma, Buchari. “Manajemen Pemasaran & Pemasaran Jasa”. Edisi Revisi,
Alfabeta, Bandung, 2005.
Amirullah. “Perilaku Konsumen”. edisi pertama, cetakan pertama, Graha Ilmu,
Yogyakarta, 2002.
Amstrong, Gary & Philip, Kotler. “Dasar-dasar Pemasaran”. Edisi Kesembilan.
Jilid I, PT. Indeks Gramedia, Jakarta, 2004.
Babin, Zikmund. “Menjelajahi Riset Pemasaran”. Edisi Kesepuluh, Salemba
empat, Jakarta, 2011.
Barata, Atep Adya. “Dasar-dasar Pelayanan Prima”. Cetakan Pertama,
PT.Gramedia, Jakarta, 2003.
Cooper, Donald, & Pamela S, Schindler. “Marketing Research”. McGraw-Hill,
United State, 2006.
Ghozali, Imam. “Aplikasi Analisis Multivariate Dengan Program SPSS”, Badan
Penerbit Universitas Diponegoro, Semarang. 2006.
Istijanto. “Aplikasi Praktis Riset Pemasaran”. PT Gramedia Pustaka Utama,
Jakarta, 2009.
Kotler, Phillip and Kevin Lane Keller. “Marketing Management”. 13 Edition.
Pearson. USA, 2009.
Kotler, Philip & Kevin Lane Keller. “Manajemen Pemasaran”. Erlangga, Jakarta,
2009.
Kotler, Philip. “Manajemen Pemasaran”. Edisi Milenium, PT.Prenhallindo,
Jakarta, 2005.
Kotler, Philip & Kevin Lane Keller. “Manajemen Pemasaran”. Penerjemah :Bob
Sabran, M.M Airlangga, 2005.
Lovelock, Christopher and Jochen Wirtz. “Services Marketing”. Global Edition.
Pearson, England, 2011.
Machfoedz, Mahmud. “Pengantar Pemasaran Modern”. cetakan pertama, UPP
AMP YKPN, Yogyakarta, 2005.
Riduwan, and Engkos A.K. “Cara Menggunakan dan Memakai Analisis Jalur
atau Path Analysis”. Alfabeta. Bandung, 2007.
100
Sarwono, Jonathan. “Analisa Jalur untuk Riset Bisnis dengan SPSS”, CV ANDI
OFFSET, Yogyakarta, 2007.
Saladin, Djaslim & Oesman, Yevis Marty. “Perilaku Konsumen dan Pemasaran
Strategik”. Balai Pustaka, Jakarta, 2002.
Swasta, Basu & Irawan. “Manajemen Pemasaran Modern”. Liberty Offet,
Yogyakarta, 2001.
Sunyoto, Danang. “Teori, Kuesioner, & Analisis Data”. Cetakan Pertama, Graha
Ilmu, Yogyakarta, 2013.
Sugiyono. “Metode Penelitian Bisnis (Pendekatan Kualitatif, Kuantitatif dan
R&D)”. Cetakan kedua belas. Alphabet, Jakarta, 2008
Sugiyono. “Metedologi Penelitian Bisnis: Pendekatan Kuantitatif, Kualitatif dan
R&D”, CV Alfabeta, Bandung, 2007.
Thakur, Satendra, and DR. A. P Singh. “Brand Image, Customer Satisfaction and
Loyalty Intention: A Study in the Context of Cosmetic Product among
the People of Central India”. International Journal, Vol.2, 2012.
Zeithaml, Valarie A, Mary Jo Bitner and Dwayne D Gremler. “Services
Marketing Integrating Customer Focus Across the Firm”. Fourth
Edition. McGraw-Hill, New York, 2006.
www.bps.go.id
www.aisi.or.id
www.pertamax7.com
www.autotekno.sindonews.com
101
Dalam rangka menyelesaikan Program Strata Satu Fakultas Ekonomi dan
Bisnis Universitas Islam Negeri Syarif Hidayatullah Jakarta, yang sedang
menyusun skripsi sebagai syarat memperoleh gelar Sarjana Ekonomi.
Nama : Erbby danastian
NIM : 1110081100021
Jurusan : Menejemen
Fakultas : Ekonomi dan Bisnis
Saya hendak melakukan penelitian dengan judul “PENGARUH P
ROMOSI DAN SERVICE PASCA PEMBELIAN TERHADAP
KEPUASAN PELANGGAN YANG BERDAMPAK PADA PEMBELIAN
ULANG (Studi Kasus pada pengguna motor Honda di daerah pamulang)”.
Untuk itu saya mohon bantuan Bapak/Ibu/Saudara/i agar sudi kiranya mengisi
angket ini.
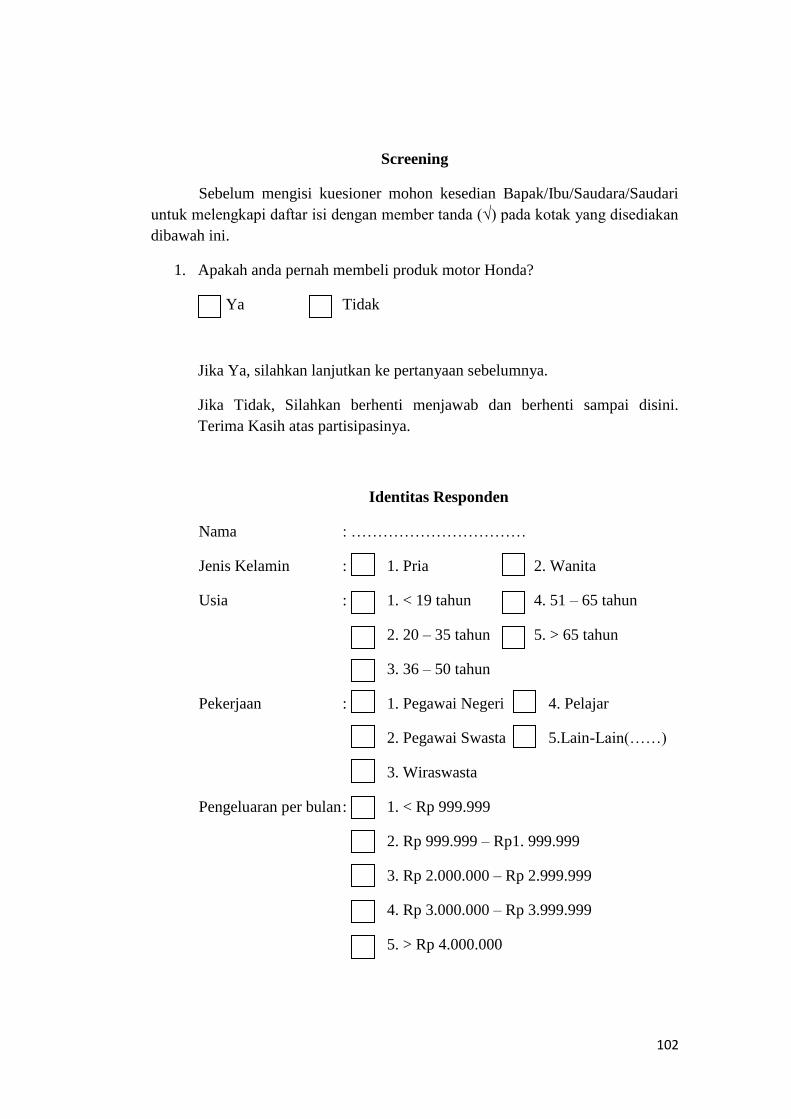
102
Screening
Sebelum mengisi kuesioner mohon kesedian Bapak/Ibu/Saudara/Saudari
untuk melengkapi daftar isi dengan member tanda (√) pada kotak yang disediakan
dibawah ini.
1. Apakah anda pernah membeli produk motor Honda?
Ya Tidak
Jika Ya, silahkan lanjutkan ke pertanyaan sebelumnya.
Jika Tidak, Silahkan berhenti menjawab dan berhenti sampai disini.
Terima Kasih atas partisipasinya.
Identitas Responden
Nama : ……………………………
Jenis Kelamin : 1. Pria 2. Wanita
Usia : 1. < 19 tahun 4. 51 – 65 tahun
2. 20 – 35 tahun 5. > 65 tahun
3. 36 – 50 tahun
Pekerjaan : 1. Pegawai Negeri 4. Pelajar
2. Pegawai Swasta 5.Lain-Lain(……)
3. Wiraswasta
Pengeluaran per bulan : 1. < Rp 999.999
2. Rp 999.999 – Rp1. 999.999
3. Rp 2.000.000 – Rp 2.999.999
4. Rp 3.000.000 – Rp 3.999.999
5. > Rp 4.000.000

103
Petunjuk Pengisian
Jawablah masing-masing pertanyaan di bawah ini sesuai dengan penilaian
saudara/saudari mengenai “PENGARUH P ROMOSI DAN SERVICE
PASCA PEMBELIAN TERHADAP KEPUASAN PELANGGAN YANG
BERDAMPAK PADA PEMBELIAN ULANG (Studi Kasus pada pengguna
motor Honda di daerah pamulang)”.
Pilihlah salah satu jawaban dari kelima alternative jawaban yang sesuai
dengan memberikan tanda centang ( √ ) pada salah satu kolom jawaban yang
tersedia.
1 2 3 4 5
STS TS RR S SS
Keterangan : 1. Sangat Tidak Setuju 4. Setuju
2. Tidak Setuju 5. Sangat Setuju
3. Ragu-ragu
1. Promotion (X1)
NO Pertanyaan SS S RR TS STS
1. Iklan sepeda motor Honda di berbagai macam media
dibuat secara menarik
2. Artikel di media cetak dan elektronik tentang sepeda
motor Honda mendapatkan tanggapan yang positif di
masyarakat
3. Kegiatan dan acara yang disponsori oleh Honda
mendapatkan tanggapan yang positif di masyarakat
4. Salesman yang menjual langsung sepeda motor Honda
ke pelanggan sangat handal menarik hati pelanggan
5. Hadiah yang ditawarkan seperti gratis helm dan jaket
dalam pembelian sepeda motor Honda menjadi
pertimbangan sebelum membeli kembali produk
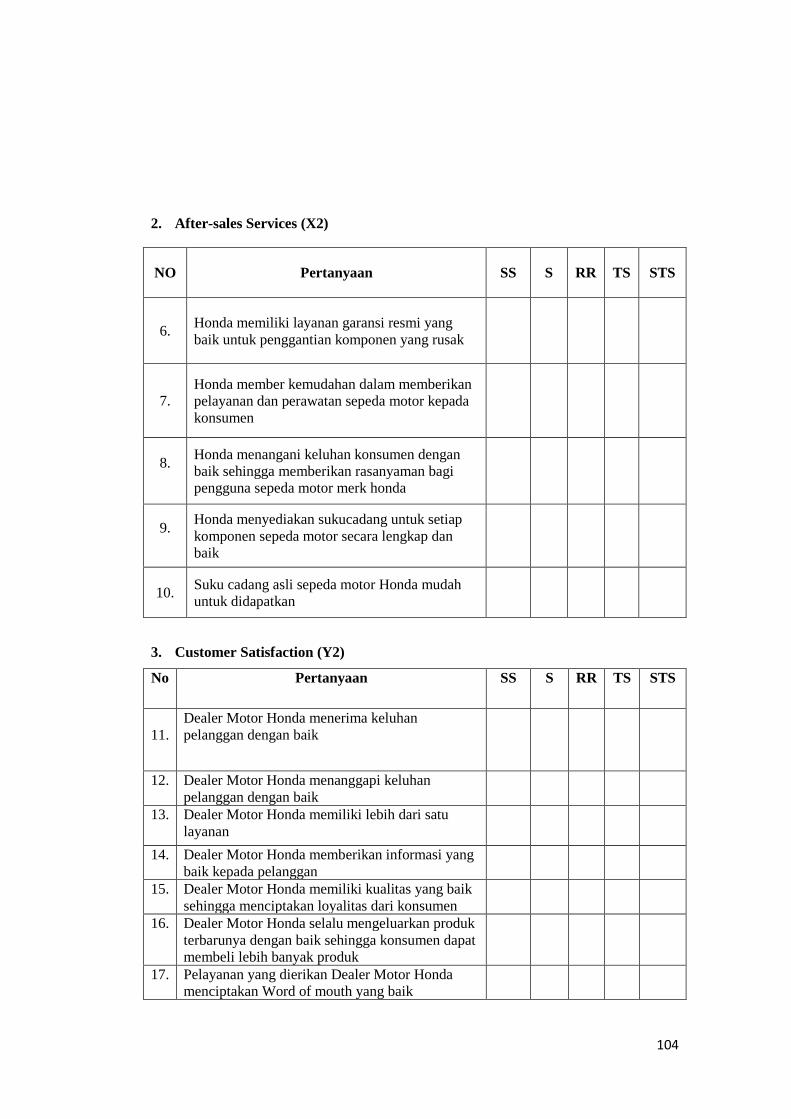
104
2. After-sales Services (X2)
NO Pertanyaan SS S RR TS STS
6. Honda memiliki layanan garansi resmi yang
baik untuk penggantian komponen yang rusak
7. Honda member kemudahan dalam memberikan
pelayanan dan perawatan sepeda motor kepada
konsumen
8. Honda menangani keluhan konsumen dengan
baik sehingga memberikan rasanyaman bagi
pengguna sepeda motor merk honda
9. Honda menyediakan sukucadang untuk setiap
komponen sepeda motor secara lengkap dan
baik
10. Suku cadang asli sepeda motor Honda mudah
untuk didapatkan
3. Customer Satisfaction (Y2)
No Pertanyaan SS S RR TS STS
11.
Dealer Motor Honda menerima keluhan
pelanggan dengan baik
12. Dealer Motor Honda menanggapi keluhan
pelanggan dengan baik
13. Dealer Motor Honda memiliki lebih dari satu
layanan
14. Dealer Motor Honda memberikan informasi yang
baik kepada pelanggan
15. Dealer Motor Honda memiliki kualitas yang baik
sehingga menciptakan loyalitas dari konsumen
16. Dealer Motor Honda selalu mengeluarkan produk
terbarunya dengan baik sehingga konsumen dapat
membeli lebih banyak produk
17. Pelayanan yang dierikan Dealer Motor Honda
menciptakan Word of mouth yang baik
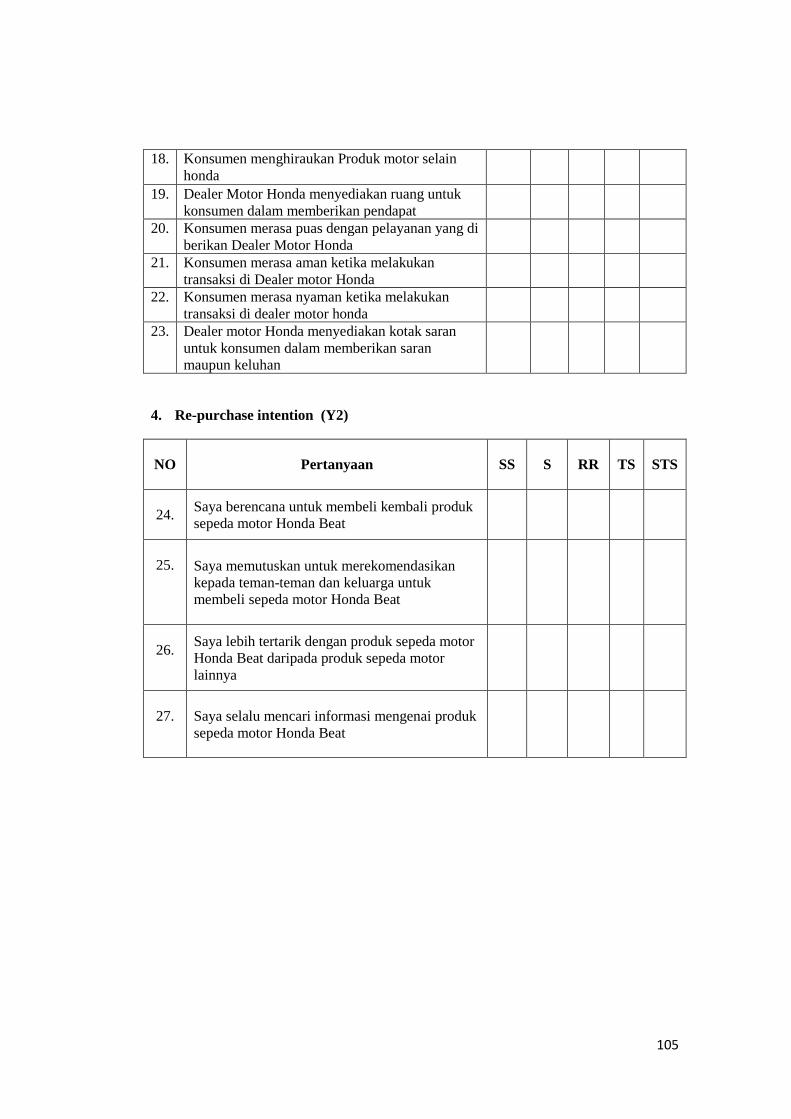
105
18. Konsumen menghiraukan Produk motor selain
honda
19. Dealer Motor Honda menyediakan ruang untuk
konsumen dalam memberikan pendapat
20. Konsumen merasa puas dengan pelayanan yang di
berikan Dealer Motor Honda
21. Konsumen merasa aman ketika melakukan
transaksi di Dealer motor Honda
22. Konsumen merasa nyaman ketika melakukan
transaksi di dealer motor honda
23. Dealer motor Honda menyediakan kotak saran
untuk konsumen dalam memberikan saran
maupun keluhan
4. Re-purchase intention (Y2)
NO Pertanyaan SS S RR TS STS
24. Saya berencana untuk membeli kembali produk
sepeda motor Honda Beat
25. Saya memutuskan untuk merekomendasikan
kepada teman-teman dan keluarga untuk
membeli sepeda motor Honda Beat
26. Saya lebih tertarik dengan produk sepeda motor
Honda Beat daripada produk sepeda motor
lainnya
27. Saya selalu mencari informasi mengenai produk
sepeda motor Honda Beat

106
Attachments II : Result of Output SPSS 17 for Windows
A. Distribution Answer of Respondents
Promotion X1
5 5 5 5 5
3 2 3 3 4
4 4 4 4 4
4 4 4 3 4
4 4 4 3 3
5 5 5 5 3
3 3 4 4 3
4 4 4 4 4
5 5 5 3 4
3 4 3 4 3
4 4 4 4 4
5 5 5 5 5
5 5 5 5 5
4 4 4 4 4
4 4 4 4 4
5 5 5 4 4
5 5 5 5 5
4 4 4 5 5
4 4 4 4 4
5 5 4 5 4
4 4 4 4 4
4 4 5 5 5
4 4 4 4 4
5 5 4 4 5
5 4 5 5 4
3 2 4 4 4
5 5 5 5 4
4 4 4 5 5
4 4 4 5 4
5 5 5 5 5
5 5 4 4 5
4 2 3 3 4

107
4 4 4 4 4
4 4 4 3 4
4 2 4 3 3
3 2 4 3 3
3 3 4 4 3
4 4 4 4 4
5 5 5 3 4
3 4 3 4 3
4 4 4 5 4
5 5 5 5 5
5 5 5 5 5
4 4 4 4 4
4 5 5 4 4
4 4 4 4 4
5 5 5 5 5
5 5 5 5 5
5 5 5 5 5
4 4 4 4 4
5 5 5 5 5
4 4 4 4 4
4 4 4 4 4
4 4 4 4 4
4 4 4 4 4
4 2 4 4 4
4 4 4 4 4
5 5 5 4 4
5 4 4 4 4
4 4 4 5 5
5 5 5 5 5
4 5 5 5 5
4 4 4 4 4
4 5 5 5 4
5 5 4 4 4
4 3 5 5 5
5 5 4 4 4
4 5 5 5 5
5 4 4 4 4
4 4 4 5 5
4 4 5 5 5
4 5 5 5 5
5 5 5 4 4
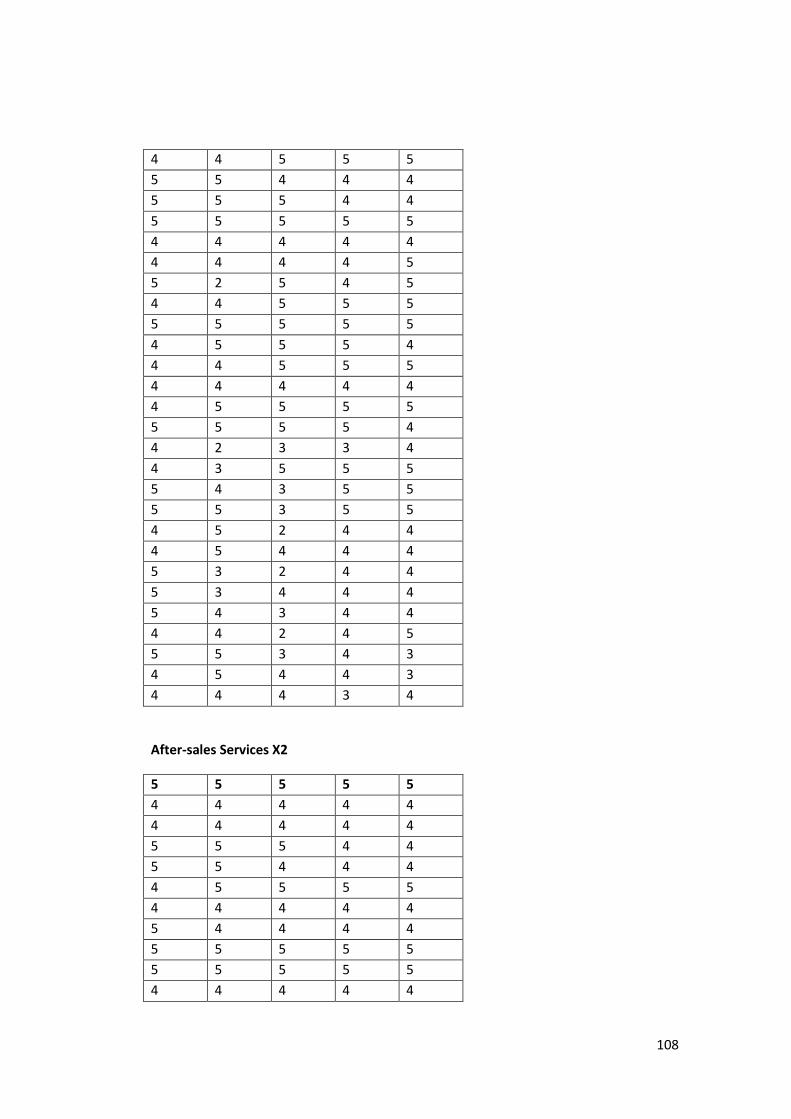
108
4 4 5 5 5
5 5 4 4 4
5 5 5 4 4
5 5 5 5 5
4 4 4 4 4
4 4 4 4 5
5 2 5 4 5
4 4 5 5 5
5 5 5 5 5
4 5 5 5 4
4 4 5 5 5
4 4 4 4 4
4 5 5 5 5
5 5 5 5 4
4 2 3 3 4
4 3 5 5 5
5 4 3 5 5
5 5 3 5 5
4 5 2 4 4
4 5 4 4 4
5 3 2 4 4
5 3 4 4 4
5 4 3 4 4
4 4 2 4 5
5 5 3 4 3
4 5 4 4 3
4 4 4 3 4
After-sales Services X2
5 5 5 5 5
4 4 4 4 4
4 4 4 4 4
5 5 5 4 4
5 5 4 4 4
4 5 5 5 5
4 4 4 4 4
5 4 4 4 4
5 5 5 5 5
5 5 5 5 5
4 4 4 4 4

109
5 5 5 4 4
5 5 5 5 5
4 4 4 4 3
4 4 4 4 4
5 4 5 5 4
5 5 5 5 5
5 5 5 5 5
4 4 5 4 4
5 5 3 5 5
4 4 4 5 5
4 4 4 4 4
4 4 4 4 4
4 4 3 4 3
4 4 4 4 4
4 4 4 4 4
4 4 5 5 4
5 5 4 4 4
4 4 4 4 4
5 5 5 5 5
5 5 5 5 5
4 4 4 4 4
4 4 4 4 4
4 4 5 4 4
5 4 4 4 4
4 5 5 5 4
5 3 4 4 4
3 4 4 4 4
5 5 3 3 3
4 4 4 4 5
4 4 4 4 4
4 5 5 4 4
5 5 5 4 5
4 4 4 4 4
4 4 4 5 5
5 5 5 5 5
5 5 5 5 5
5 5 5 5 5
4 4 5 4 5
5 5 5 5 5
4 4 4 4 4
4 4 4 4 4
110
4 4 4 4 4
4 4 4 4 4
5 4 4 4 4
4 5 5 5 4
5 5 5 5 4
5 5 4 4 4
4 4 4 4 5
5 5 5 5 5
4 4 5 5 5
4 4 4 5 5
4 4 5 5 5
5 5 5 4 4
4 4 3 5 5
5 5 5 4 4
4 4 5 5 5
5 5 4 4 4
4 4 4 4 5
4 4 4 5 5
4 4 5 5 5
5 5 5 5 4
4 4 4 5 5
5 5 5 4 4
5 5 5 5 4
4 5 5 5 5
4 4 4 4 4
4 5 5 4 4
4 4 5 5 4
4 4 4 5 5
5 5 5 5 5
4 4 4 4 4
4 4 4 5 5
4 4 4 4 4
4 4 5 5 5
5 5 5 5 5
4 4 4 5 5
4 4 3 5 5
5 5 5 5 5
4 4 5 5 5
4 4 4 5 5
4 5 4 5 4
5 5 5 4 4
111
5 5 5 5 5
5 5 4 4 4
4 4 4 5 5
4 4 4 5 5
4 5 4 4 4
4 4 5 5 5
5 5 4 5 5
CUSTOMER SATISFACTION Y1
5 5 5 5 5 5 5
3 3 3 3 4 3 3
4 4 4 4 4 4 4
4 4 4 3 3 4 4
4 4 4 3 3 4 4
5 5 5 5 5 5 5
3 3 4 4 4 3 3
4 4 4 4 4 4 4
4 4 4 3 4 4 4
3 4 3 4 3 3 4
4 4 4 4 4 4 4
5 4 5 4 4 5 4
5 5 5 5 5 5 5
4 4 4 4 4 4 4
4 4 4 4 4 4 4
5 5 5 4 4 5 5
5 5 5 5 5 5 5
4 4 4 5 5 4 4
4 4 4 4 4 4 4
5 5 4 5 5 5 5
4 4 4 4 4 4 4
4 4 5 5 4 4 4
4 4 4 5 4 4 4
3 4 3 4 4 3 4
4 4 4 4 3 4 4
4 4 4 4 4 4 4
4 5 5 5 4 4 5
4 4 4 5 5 4 4
4 4 4 3 4 4 4
5 5 5 5 5 5 5
5 5 4 4 5 5 5

112
4 5 4 4 4 4 5
4 3 3 4 3 4 3
5 5 4 5 4 5 5
4 4 4 3 4 4 4
5 4 4 5 5 5 4
3 3 4 4 4 3 3
4 3 3 4 3 4 3
5 5 5 3 3 5 5
4 4 4 4 4 4 4
4 4 4 5 4 4 4
4 5 5 4 4 4 5
5 5 5 5 4 5 5
4 4 4 4 4 4 4
3 4 5 4 4 3 4
5 5 5 4 4 5 5
5 5 5 5 5 5 5
5 4 4 5 5 5 4
4 4 5 4 5 4 4
5 5 4 5 5 5 5
4 4 4 4 4 4 4
4 4 5 5 4 4 4
5 4 4 5 4 5 4
5 5 4 5 4 5 5
5 4 5 5 5 5 4
5 5 4 4 5 5 5
3 3 4 3 3 3 3
4 4 4 5 5 4 4
4 4 4 5 5 4 4
5 5 5 5 5 5 5
4 4 4 5 4 4 4
5 5 5 4 3 5 5
5 5 4 5 4 5 5
4 4 4 4 5 4 4
4 5 4 4 5 4 5
5 5 4 4 4 5 5
4 4 4 2 4 4 4
4 4 4 5 4 4 4
4 4 3 4 5 4 4
5 5 5 4 5 5 5
5 4 3 5 5 5 4
4 5 4 4 4 4 5

113
5 4 4 4 4 5 4
5 4 4 5 5 5 4
4 4 4 5 4 4 4
4 4 4 4 4 4 4
4 3 4 4 3 4 3
4 5 4 3 4 4 5
4 5 4 3 5 4 5
5 5 4 3 5 5 5
4 4 4 4 5 4 4
5 3 4 4 5 5 3
5 3 4 4 3 5 3
4 4 3 4 3 4 4
4 4 3 3 3 4 4
4 4 3 5 4 4 4
5 4 4 4 4 5 4
5 3 4 5 3 5 3
4 4 4 5 4 4 4
4 4 5 5 4 4 4
4 3 5 5 4 4 3
5 3 5 5 4 5 3
5 2 4 4 5 5 2
5 4 4 4 5 5 4
3 2 4 4 5 3 2
3 4 4 4 5 3 4
4 3 4 4 4 4 3
4 2 4 5 4 4 2
5 3 4 3 4 5 3
5 4 4 3 4 5 4
5 5 5 5 5 5
3 3 4 3 3 3
4 4 4 4 4 4
4 3 3 4 4 4
4 3 3 4 4 4
5 5 5 5 5 5
4 4 4 3 3 4
4 4 4 4 4 4
4 3 4 4 4 4
3 4 3 3 4 3

114
4 4 4 4 4 4
5 4 4 5 4 5
5 5 5 5 5 5
4 4 4 4 4 4
4 4 4 4 4 4
5 4 4 5 5 5
5 5 5 5 5 5
4 5 5 4 4 4
4 4 4 4 4 4
4 5 5 5 5 4
4 4 4 4 4 4
5 5 4 4 4 5
4 5 4 4 4 4
3 4 4 3 4 3
4 4 3 4 4 4
4 4 4 4 4 4
5 5 4 4 5 5
4 5 5 4 4 4
4 3 4 4 4 4
5 5 5 5 5 5
4 4 5 5 5 4
4 4 4 4 5 4
3 4 3 4 3 3
4 5 4 5 5 4
4 3 4 4 4 4
4 5 5 5 4 4
4 4 4 3 3 4
3 4 3 4 3 3
5 3 3 5 5 5
4 4 4 4 4 4
4 5 4 4 4 4
5 4 4 4 5 5
5 5 4 5 5 5
4 4 4 4 4 4
5 4 4 3 4 5
5 4 4 5 5 5
5 5 5 5 5 5
4 5 5 5 4 4
5 4 5 4 4 5
4 5 5 5 5 4
4 4 4 4 4 4
115
5 5 4 4 4 5
4 5 4 5 4 4
4 5 4 5 5 4
5 5 5 5 4 5
4 4 5 5 5 4
4 3 3 3 3 4
4 5 5 4 4 4
4 5 5 4 4 4
5 5 5 5 5 5
4 5 4 4 4 4
5 4 3 5 5 5
4 5 4 5 5 4
4 4 5 4 4 4
4 4 5 4 5 4
4 4 4 5 5 4
4 2 4 4 4 4
4 5 4 4 4 4
3 4 5 4 4 3
5 4 5 5 5 5
3 5 5 5 4 3
4 4 4 4 5 4
4 4 4 5 4 4
4 5 5 5 4 4
4 5 4 4 4 4
4 4 4 4 4 4
4 4 3 4 3 4
4 3 4 4 5 4
4 3 5 4 5 4
4 3 5 5 5 4
4 4 5 4 4 4
4 4 5 5 3 4
4 4 3 5 3 4
3 4 3 4 4 3
3 3 3 4 4 3
3 5 4 4 4 3
4 4 4 5 4 4
4 5 3 5 3 4
4 5 4 4 4 4
5 5 4 4 4 5
5 5 4 4 3 5
5 5 4 5 3 5

116
4 4 5 5 2 4
4 4 5 5 4 4
4 4 5 3 2 4
4 4 5 3 4 4
4 4 4 4 3 4
4 5 4 4 2 4
4 3 4 5 3 4
4 3 4 5 4 4
Re-Purchase Intention Y2
5 5 4 5
2 4 3 3
4 4 5 4
4 5 3 4
4 5 5 4
5 5 4 5
3 4 4 3
4 4 4 4
5 5 4 4
4 5 2 4
4 4 4 4
5 5 4 4
5 5 5 5
4 4 5 4
4 4 5 4
5 4 4 5
5 5 5 5
4 5 3 4
4 4 4 4
5 5 5 5
4 4 4 4
4 4 4 4
4 4 4 4
5 4 3 4
4 4 4 4
2 4 4 4
5 4 5 5
4 5 5 4
4 4 4 4
5 5 5 5
117
5 5 4 5
2 4 3 5
4 4 4 3
4 4 3 5
2 4 5 4
2 5 3 4
3 3 4 3
4 4 4 3
5 5 2 5
4 4 3 4
4 4 4 4
5 5 4 5
5 5 5 5
4 4 5 4
5 4 5 4
4 5 4 5
5 5 5 5
5 5 3 4
5 4 4 4
4 5 5 5
5 4 4 4
4 4 4 4
4 4 4 4
4 4 3 5
4 4 4 4
2 5 4 5
4 5 2 3
5 5 5 4
4 4 4 4
4 5 5 5
5 4 4 4
5 4 4 5
4 4 5 5
5 5 5 4
5 4 5 5
3 5 4 5
5 4 2 4
5 5 4 4
4 4 4 4
4 4 4 5
4 4 5 4

118
5 5 4 5
5 4 5 4
4 5 4 4
5 5 5 4
5 5 4 4
5 4 5 3
4 5 4 5
4 4 4 5
2 4 4 5
4 5 5 4
5 4 2 3
5 4 3 3
4 4 3 4
4 4 4 4
5 5 5 4
5 4 5 4
2 4 4 3
3 5 4 4
4 4 4 4
5 4 3 3
5 5 4 3
5 5 5 2
3 5 5 4
3 5 4 2
4 4 5 4
4 4 4 3
5 5 3 2
5 4 4 3
4 5 3 4
Descriptive Statistics
N Minimum Maximum Mean Std. Deviation
Promotion 100 15.00 25.00 21.3000 2.56038
After-Sales Services 100 18.00 25.00 22.1400 1.84785
Customer Satosfaction 100 41.00 65.00 54.4100 5.67841
Re-purchase Intention 100 12.00 20.00 16.7600 5.67841
Valid N (listwise) 100 1.76452

119
Validity test : customer satisfaction (Y1)
Quesion Pearson
Corelation
Sig
(2-Tailed) Describe
CS1 0,730 0,000 Valid
CS2 0,717 0,000 Valid
CS3 0,679 0,000 Valid
CS4 0,549 0,000 Valid
CS5 0,576 0,000 Valid
CS6 0,730 0,000 Valid
CS7 0,717 0,000 Valid
CS8 0,679 0,000 Valid
CS9 0,549 0,000 Valid
CS10 0,576 0,000 Valid
CS11 0,730 0,000 Valid
CS12 0,717 0,000 Valid
CS13 0,679 0,000 Valid
Validity test : repurchase intention (Y2)
Question Pearson
Corelation
Sig
(2-Tailed) Describe
RI1 0,640 0,000 Valid
RI2 0,500 0,000 Valid
RI3 0,615 0,000 Valid
RI4 0,605 0,000 Valid
Reliability test Result
Variable Cronbach’s
Alpha Describe
Promotion 0,774 Reliabel
After-Sales Services 0.718 Reliabel
Customer Satisfaction 0.892 Reliabel
Re-purchase Intention 0.675 Reliabel
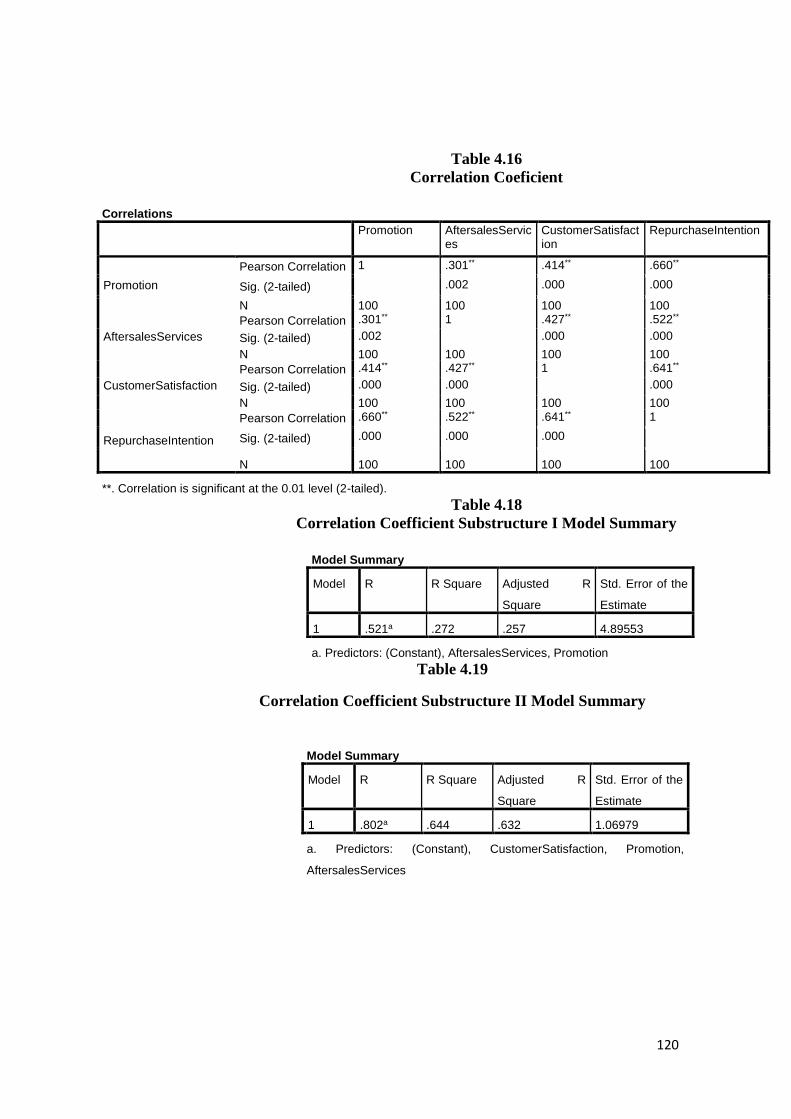
120
Table 4.16
Correlation Coeficient
Correlations
Promotion AftersalesServices
CustomerSatisfaction
RepurchaseIntention
Promotion
Pearson Correlation 1 .301** .414** .660**
Sig. (2-tailed) .002 .000 .000
N 100 100 100 100
AftersalesServices
Pearson Correlation .301** 1 .427** .522**
Sig. (2-tailed) .002 .000 .000
N 100 100 100 100
CustomerSatisfaction
Pearson Correlation .414** .427** 1 .641**
Sig. (2-tailed) .000 .000 .000
N 100 100 100 100
RepurchaseIntention
Pearson Correlation .660** .522** .641** 1
Sig. (2-tailed) .000 .000 .000
N 100 100 100 100
**. Correlation is significant at the 0.01 level (2-tailed).
Table 4.18
Correlation Coefficient Substructure I Model Summary
Model Summary
Model R R Square Adjusted R
Square
Std. Error of the
Estimate
1 .521a .272 .257 4.89553
a. Predictors: (Constant), AftersalesServices, Promotion
Table 4.19
Correlation Coefficient Substructure II Model Summary
Model Summary
Model R R Square Adjusted R
Square
Std. Error of the
Estimate
1 .802a .644 .632 1.06979
a. Predictors: (Constant), CustomerSatisfaction, Promotion,
AftersalesServices
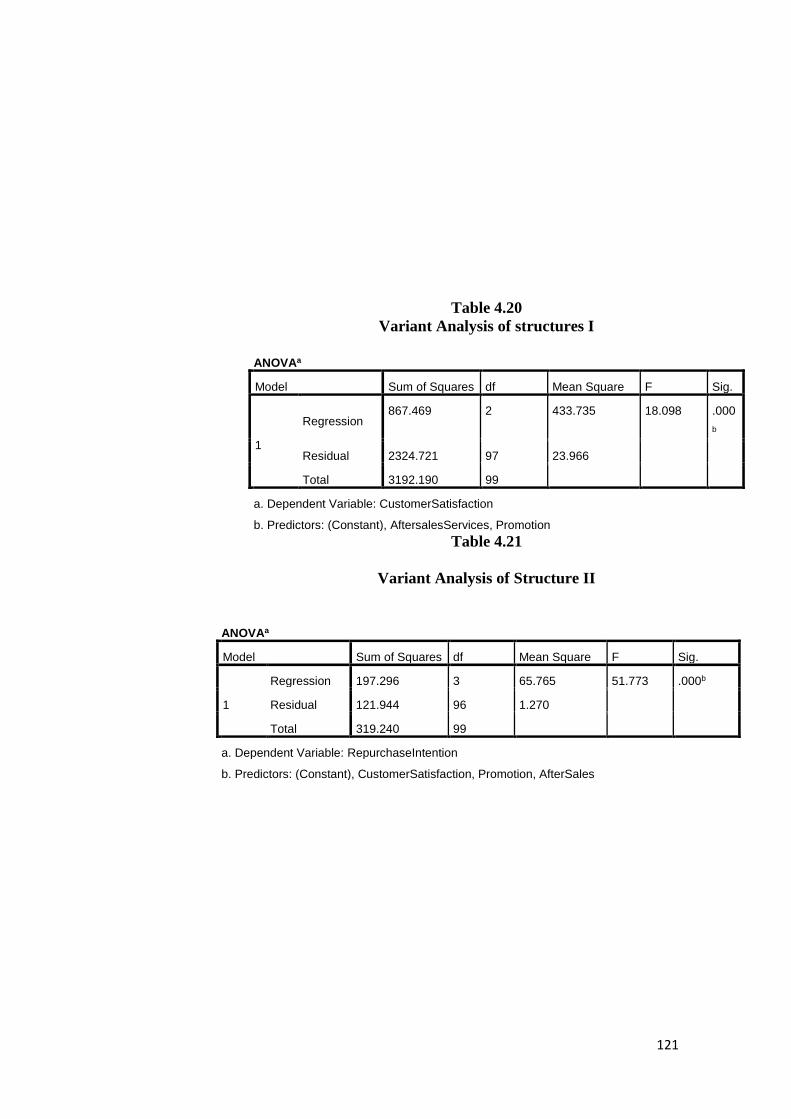
121
Table 4.20
Variant Analysis of structures I
ANOVAa
Model Sum of Squares df Mean Square F Sig.
1
Regression 867.469 2 433.735 18.098 .000
b
Residual 2324.721 97 23.966
Total 3192.190 99
a. Dependent Variable: CustomerSatisfaction
b. Predictors: (Constant), AftersalesServices, Promotion
Table 4.21
Variant Analysis of Structure II
ANOVAa
Model Sum of Squares df Mean Square F Sig.
1
Regression 197.296 3 65.765 51.773 .000b
Residual 121.944 96 1.270
Total 319.240 99
a. Dependent Variable: RepurchaseIntention
b. Predictors: (Constant), CustomerSatisfaction, Promotion, AfterSales

122
Table 4.22
Structure I t-test Result
Coefficientsa
Model Unstandardized Coefficients Standardized
Coefficients
T Sig.
B Std. Error Beta
1
(Constant) 16.968 6.396 2.653 .009
Promotion .696 .201 .314 3.456 .001
AfterSales 1.021 .279 .332 3.658 .000
a. Dependent Variable: CustomerSatisfaction
Table 4.22
Structure II t-Test Results
Coefficientsa
Model Unstandardized Coefficients Standardized
Coefficients
t Sig.
B Std. Error Beta
1
(Constant) -.748 1.525 -.491 .625
Promotion .307 .049 .438 6.246 .000
AfterSales .230 .069 .236 3.350 .001
CustomerSatisfaction .108 .023 .341 4.609 .000
a. Dependent Variable: RepurchaseIntention
Table 4.23
Structure II Equation t-Test
The influence of Promotion, After-sales Services and
Repurchase Intention
No Hypothesis Path analysis t-count t-table Result
1 ρx1y2 ≠ 0 ρx1y2 = 0,307 6.246 1,66088 Ha
accepted
2 ρx2y2 ≠ 0 ρx2y2 = 0,230 3.350 1,66088 Ha
accepted
3 ρy1y2 ≠ 0 ρy1y2 = 0,108 4.609 1,66088 Ha
accepted
Source: Primary data is processed by SPSS 21.0, 2017

123