Embed Size (px)
Citation preview

Physics of the Solid State, Vol. 45, No. 7, 2003, pp. 1242–1250. Translated from Fizika Tverdogo Tela, Vol. 45, No. 7, 2003, pp. 1185–1192.Original Russian Text Copyright © 2003 by Gusev, Valeeva.
SEMICONDUCTORS AND DIELECTRICS
The Influence of Imperfection of the Crystal Lattice on the Electrokinetic and Magnetic Properties
of Disordered Titanium MonoxideA. I. Gusev and A. A. Valeeva
Institute of Solid-State Chemistry, Ural Division, Russian Academy of Sciences,ul. Pervomaœskaya 91, Yekaterinburg, 620219 Russia
e-mail: [email protected] November 5, 2002
Abstract—The conductivity and magnetic susceptibility of disordered titanium monoxide TiOy (0.920 ≤ y ≤1.262) containing vacancies in titanium and oxygen sublattices are investigated. For TiOy monoxides with anoxygen content y ≤ 1.069, the temperature dependences of the conductivity are described by the Bloch–Grü-neisen function at a Debye temperature ranging from 400 to 480 K and the temperature dependences of themagnetic susceptibility are characterized by the contribution from the Pauli paramagnetism due to conductionelectrons. The behavior of the conductivity and magnetic susceptibility of TiOy monoxides with an oxygen con-tent y ≥ 1.087 is characteristic of narrow-gap semiconductors with nondegenerate charge carriers governed bythe Boltzmann statistics. The band gap ∆E between the valence and conduction bands of TiOy monoxides withy ≥ 1.087 falls in the range 0.06–0.17 eV. © 2003 MAIK “Nauka/Interperiodica”.
1. INTRODUCTION
Disordered nonstoichiometric titanium monoxideTiOy has a B1-type cubic crystal structure, is homoge-neous over a wide range from TiO0.70 to TiO1.25, andcontains 10–15 at. % structural vacancies simulta-neously in each of the titanium and oxygen sublattices[1]. Since the formulation of the composition of tita-nium monoxide as TiOy does not carry information onthe concentration of structural vacancies in the metallicand nonmetallic sublattices, it is more correct to repre-sent the titanium monoxide composition taking intoaccount the content of structural vacancies in each ofthe sublattices, i.e., as TixOz ≡ Tixj1 – xOzh1 – z ≡ TiOy(where y = z/x and j and h stand for the structuralvacancies in the titanium and oxygen sublattices,respectively). This formula accounts for both the realcomposition and the structure of the titanium monox-ide. For example, titanium monoxide of formal stoichi-ometry TiO1.00 contains 16.7 at. % vacancies in bothtitanium and oxygen sublattices and, hence, its realcomposition is ~Ti0.833O0.833.
At present, the properties of TiOy have not been ade-quately investigated. This can be explained as follows.Titanium monoxide TiOy is difficult to synthesize,because its composition is unstable at temperatures inthe range 700–800 K and, even at a controlled partialpressure of oxygen, this compound itself can undergodisproportionation to form Ti2O (TiO0.50) or Ti3O2(TiO0.67) and cubic oxide or cubic oxide and Ti2O3(TiO1.50) and other phases of the homologous seriesTinO2n – 1, where n is an integer (n = 2–10). The disor-
1063-7834/03/4507- $24.00 © 21242
dered state of titanium monoxide is thermodynamicallystable at temperatures T > 1500 K. At temperaturesbelow 1500 K, a few ordered phases of different typesand symmetries form in several concentration and tem-perature ranges. However, the disordered state of tita-nium monoxide TiOy can easily be stabilized byquenching from T > 1500 K, whereupon it can exist asa metastable state at room temperature for any length oftime. At temperatures of ~700, ~1000, and ~1100 K,TiOy undergoes phase transformations associated withthe formation of superstructures. The type and symme-try of the superstructures depend on the real initial com-position of titanium monoxide TiOy. The monoclinic[space group C2/m (A12m/1)] superstructure Ti5jO5h
[2–6] has been firmly established and repeatedly con-firmed experimentally. The structure of the ordered tet-ragonal phase Ti4jO5 that corresponds to titaniummonoxide of nominal composition TiO1.25 is also satis-factorily described in [2, 4]. As regards the otherordered phases [orthorhombic TiO0.7–0.9, TiO1.19, andTi2.5O3 (Ti5jO6) and cubic Ti22.5O22.5 (Ti5jO5h)], theavailable information amounts to determining theirsymmetry from electron microscopy and diffractiondata and to speculating about their possible belonging toone of three or four space groups [4, 7]. Watanabe et al.[4] and Hilti [7] considered these phases transient fromthe disordered cubic phase TiOy to the ordered mono-clinic phase Ti5O5. The possible existence of theordered orthorhombic (space group Immm) phasesTi3O2h and Ti2jO3 was predicted theoretically in [8]. Itwas shown that oxygen atoms and nonmetallic struc-
003 MAIK “Nauka/Interperiodica”

THE INFLUENCE OF IMPERFECTION OF THE CRYSTAL LATTICE 1243
tural vacancies are ordered in the Ti3O2h phase,whereas the ordering of titanium atoms and metallicstructural vacancies in the Ti2jO3 phase occurs in thetitanium sublattice with a random distribution of non-metallic vacancies.
Almost without exception, all the titanium monox-ide samples synthesized using traditional methods arein a two-phase state and contain both disordered andordered phases simultaneously. The preparation of sin-gle-phase disordered samples of TiOy requires a specialquenching procedure. In the 1960s–1970s, the temper-ature measurements performed for kinetic and mag-netic properties of TiOy titanium monoxides revealedthat the same samples prior to and after the measure-ments had different chemical and phase compositions.This circumstance inevitably led to contradictoryresults. For example, the temperature coefficient dρ/dTof the resistivity ρ measured for disordered monoxidesTiOy at y ~ 1 had positive sign in [9–11] and negativesign in [12]. At the same time, all the authors of exper-imental investigations drew the same conclusion thatthe thermopower and the Hall coefficient of TiOy mon-oxides at y > 0.85 are negative in sign [9–12].
The unreliability and discrepancy in the availableexperimental data gave impetus to a large number oftheoretical investigations into the electronic structure ofTiOy monoxides. However, the results of calculations,including ab initio calculations, also proved to be con-tradictory. In particular, it was shown in [13–17] that, inthe energy spectrum of cubic titanium monoxide, theO 2p and Ti 3d electron energy bands are separated bya wide gap of several electron-volts. Huisman et al. [17]believed that structural vacancies are responsible forthe appearance of local peaks in the electron density(vacancy peaks) in the p–d gap. This is in agreementwith the results of theoretical calculations carried outby Gubanov et al. [18] and Ivanovsky et al. [19],according to which the energy spectrum of TiOy is char-acterized by vacancy states in unoccupied regionsbelow the Fermi level. The calculations performed byBarman and Sarma [20] also demonstrated that theband gap in the energy spectrum for a hypotheticaldefect-free titanium monoxide TiO1.0 is approximatelyequal to 2.0 eV; however, in this case, the formation ofvacancies is attended by the appearance of vacancystates only in the vicinity of the conduction band bot-tom and does not lead to the disappearance of the p–dgap. According to the calculations carried out by Leunget al. [21], the energy gap between the O 2p and Ti 3delectron energy bands is approximately equal to 1.8 eVfor a defect-free titanium monoxide TiO and 1.2 eV foran ordered monoclinic titanium monoxide Ti5O5. Theexistence of the band gap in disordered titanium mon-oxides TiOy has been confirmed by experimental inves-tigations of x-ray photoemission spectra [20, 22], UVphotoemission and bremsstrahlung spectra [20], andoptical conductivity [23].
PHYSICS OF THE SOLID STATE Vol. 45 No. 7 200
As follows from the results of another series of the-oretical works [24–26], the electron energy spectrum ofTiOy does not contain the p–d gap. The theoreticalinferences regarding the absence of the p–d gap in theenergy spectrum of titanium monoxide has been sup-ported by experimental investigations of the x-rayemission spectra of TiOy monoxides with different oxy-gen contents [27] and also the x-ray photoelectron andx-ray emission spectra of the monoclinic ordered tita-nium monoxide Ti5O5 and defect-free cubic titaniummonoxide TiO1.0 prepared under high pressure [28].
Thus, the available experimental and theoreticaldata are rather contradictory. It remains unclearwhether titanium monoxide is a metal or a semiconduc-tor.
In this work, we experimentally investigated theelectrical conductivity (resistivity) and the magneticsusceptibility of titanium monoxide TiOy over the entirehomogeneity region of the cubic phase.
2. SAMPLE PREPARATION AND EXPERIMENTAL TECHNIQUE
Samples of nonstoichiometric cubic titanium mon-oxide TiOy with different oxygen contents (0.920 ≤ y ≤1.262) were synthesized through solid-phase sinteringfrom powder mixtures of metallic titanium and titaniumdioxide TiO2 at a temperature of 1770 K for 70 h undervacuum at a residual pressure of 0.001 Pa. In the courseof the synthesis, the sintering products were ground at20-h intervals. All the diffraction experiments were per-formed on Siemens D-500 and STADI-P (STOE) auto-mated diffractometers (Cu radiation). In order toprepare titanium monoxide in a disordered state, thesynthesized samples were placed in quartz ampulesevacuated to a residual pressure of 0.0001 Pa and werethen annealed at a temperature of 1330 K for 3 h. Afterannealing, the samples in the ampules were quenchedin water. The quenching rate was approximately equalto 200 K s–1. The x-ray diffraction patterns of thequenched samples contain either reflections of the dis-ordered phase TiOy with a B1-type structure (sampleswith an oxygen content y ≥ 1.112) or reflections of thedisordered TiOy and monoclinic ordered Ti5O5 [5]phases (samples with an oxygen content y ≤ 1.087). Theoxygen content in the TiOy quenched samples proved tobe higher than the oxygen content predicted from thestarting mixture. This means that, during the synthesisand annealing, the samples were partially depleted intitanium and enriched in oxygen.
The resistivities ρ of the samples prepared weremeasured by the four-point probe method in the tem-perature range 77–300 K. The resistivities of TiO1.262,TiO1.087, and TiO0.920 monoxides were also measured at4.2 K. In order to ensure electric contact, the contactsurfaces of the samples were coated with an In–Gapaste.
Kα1 2,
3

1244 GUSEV, VALEEVA
0.05
0.04
0.03
0.02
0.01
0
M, c
m3 g
–1
0
0.01
0.02
0.03
0.04
0.05
0.06
0.07
0 5
TiO0.920TiO0.985TiO1.069TiO1.087TiO1.112TiO1.153TiO1.233TiO1.262
T = 4 K
T = 300 K
10 15 20 25 30H, kOe
Fig. 1. Dependences of the magnetization M on the mag-netic field strength H for titanium monoxides TiOy with dif-ferent oxygen contents at T = 4 and 300 K. The absence ofremanent magnetization implies that the TiOy samples con-tain no ferromagnetic impurities.
Fig. 2. Temperature dependences of the electrical resistivityρ(T) for disordered cubic titanium monoxides TiOy withdifferent oxygen contents. Solid lines represent the experi-mental results approximated by function (3) for TiOy mon-oxides at y ≤ 1.069 and by function (13) for TiOy monoxidesat y ≥ 1.087.
6
5
4
3
2
50 100 150 200 250 300T, K
ρ, µ
Ω m
TiO0.920TiO0.946TiO0.985TiO1.069TiO1.087TiO1.112TiO1.153TiO1.201TiO1.227TiO1.233TiO1.262
P
The magnetic susceptibility χ of TiOy monoxides(0.920 ≤ y ≤ 1.262) was measured on an MPMS-XL-5Quantum Design vibrating-coil magnetometer at tem-peratures ranging from 4.0 to 400 K in magnetic fieldsof 8.8, 25, 30, and 50 kOe. The magnetic susceptibili-ties of TiO0.946, TiO1.069, TiO1.087, and TiO1.262 monox-ides were also measured using the Faraday method ona Domenicalli pendulum magnetic balance in the rangefrom 300 K to the temperature of the onset of the disor-der order transition (at approximately 1000 K).
The chemical and phase compositions of the sam-ples were checked prior to and after the measurements.
3. RESULTS AND DISCUSSION
The results of measurements of the magnetization Min magnetic fields with a strength H up to 50 kOe and attemperatures of 4, 130, and 300 K demonstrate that thestudied samples of TiOy monoxides do not possessremanent magnetization, because the dependencesM(H) measured at different temperatures pass throughthe origin of the coordinates (Fig. 1). The absence ofremanent magnetization implies that the TiOy samplescontain no ferromagnetic impurities.
The temperature dependences of the electrical resis-tivity ρ(T) for TiOy titanium monoxides of differentcompositions are shown in Fig. 2. In the temperaturerange covered, the electrical resistivity ρ increaseswhen changing over from TiO0.920 to TiO1.262.
The electrical resistivity of TiO1.069, TiO0.985,TiO0.946, and TiO0.920 monoxides increases with anincrease in the temperature, even though the tempera-ture coefficient of resistivity remains small. For materi-als with n-type conductivity, the temperature depen-dence of the mean free time associated with scatter-ing by phonons at T < 300 K is adequately described bythe Bloch–Grüneisen semiempirical function
(1)
where λ is the electron–phonon coupling constant andθD is the Debye characteristic temperature. In the gen-
eral case, the integral can be cal-
culated as follows:
(2)
Since the resistivity is defined by the formula ρ =m/ne2 (where m and n are the mass and the concentra-tion of carriers, respectively), the temperature depen-dence of the resistivity with allowance made for rela-tionship (2) and the residual resistivity ρ(0) can be writ-ten in the form
τ
1τ---
4πλkBθD
"---------------------- 2T
θD------
5 x5
xd
xsinh2
---------------,
0
θD/2T
∫=
x5/ xsinh
2( ) xd0
θD/2T∫
x5
xd
xsinh2
---------------
0
θD/2T
∫ x5
xcoth– 0
θD/2T5 x
4x x.dcoth
0
θD/2T
∫+=
τ
HYSICS OF THE SOLID STATE Vol. 45 No. 7 2003

THE INFLUENCE OF IMPERFECTION OF THE CRYSTAL LATTICE 1245
(3)
In different temperature ranges, the integral
takes different forms. For T < 80 K
and θD ~ 400–500 K, we have the ratio θD/2T > 3.14. In
this case, the integral can be rep-
resented in the following form:
(4)
After the appropriate transformation with due regardfor the limits of integration, expression (4) takes theform
(5)
Here, x = θD/2T (where θD/2T > 3.14).
ρ T( ) ρ 0( )4πmλkBθD
ne2"
--------------------------- 2TθD------
5 x5
xd
xsinh2
---------------
0
θD/2T
∫+=
≡ ρ 0( )4πmλkBθD
ne2"
--------------------------- 2TθD------
5
+
×θD
2T------
5 θD
2T------
coth– 5 x4
x xdcoth
0
θD/2T
∫+ .
x5/ xsinh
2( ) xd0
θD/2T∫x
5/ xsinh
2( ) xd0
θD/2T∫
x5
xd
xsinh2
---------------
0
θD/2T
∫ x5
1 xcoth–( ) 0
θD/2T=
+ 10 x4
2x–( )exp 4x–( )exp …+ +[0
θD/2T
∫+ 2nx–( )exp ]dx.
x5
xd
xsinh2
---------------
0
θD/2T
∫ x5
1 xcoth–( )=
+ 10 34--- 3
128--------- 1
324--------- 3
4096------------ … 24
a5
------+ + + + +
– 2x–( ) x4
2----- x
3 3x2
2-------- 3x
2------ 3
4---+ + + +exp
– 4x–( ) x4
4----- x
3
4----- 3x
2
16-------- 3x
32------ 3
128---------+ + + +exp
– 6x–( ) x4
6----- x
3
9----- x
2
18------ x
54------ 1
324---------+ + + +exp
– 8x–( ) x4
8----- x
3
16------ 3x
2
128--------- 3x
512--------- 3
4096------------+ + + +exp …–
– 2nx–( ) x4
2n------ 4x
3
2n( )2------------- 12x
2
2n( )3------------- 24x
2n( )4------------- 24
2n( )5-------------+ + + +exp
.
PHYSICS OF THE SOLID STATE Vol. 45 No. 7 2003
For T > 80 K and θD ~ 400–500 K, we have the ratio
θD/2T < 3.14. Hence, the integral can
be represented as the series =
/[(4 + 2k)(2k)!], where B2k are theBernoulli numbers. As a result, we obtain
(6)
Substitution of formula (6) into expression (2) gives
(7)
Here, x = θD/2T (where θD/2T < 3.14). After substitut-ing formula (7) into relationship (3) and performingsimple manipulations, we obtain the expansion of theBloch–Grüneisen formula into a series at θD/2T < 3.14;that is,
(8)
For θD/2T > 3.14, the temperature dependences ofthe resistivity of TiO1.069, TiO0.985, TiO0.946, and TiO0.920monoxides were approximated by formulas (3) and (5);in this case, series (5) was limited by the term with theexponential factor exp(–8x). For θD/2T < 3.14, the tem-perature dependences of the resistivity of the samemonoxides were approximated by function (8) takinginto account only the terms with factors up to x13.
The experimental dependences ρ(T) for TiO1.069,TiO0.985, TiO0.946, and TiO0.920 monoxides (Fig. 2) arewell approximated by function (3). The calculatedparameters ρ(0) and θD are presented in Table 1. TheDebye characteristic temperature θD for TiOy monox-ides (0.920 ≤ y ≤ 1.069) falls in the range 400–480 K,which is in good agreement with the data available inthe literature. According to Denker [10], the character-istic temperature θD for an equiatomic monoxideTiO1.00 varies from 350 to 410 K and increases with adecrease in the annealing temperature. Leung et al. [21]established that the characteristic temperature θD for anordered monoclinic monoxide Ti5O5 is equal to 500 K.
x4
x xdcoth0
θD/2T∫x
4x xdcoth
0
θD/2T∫2
2kB2kx
4 2k+
k 0=∞∑
x4
x xdcoth
0
x
∫ x4
4----- x
6
18------ x
8
360---------–
x10
4725------------+ +=
–x
12
56 700--------------- x
14
654 885------------------ ….–+
x5
xd
xsinh2
---------------
0
x
∫ x5
+ 5 x4
4----- x
6
18------
x8
360---------–+
coth–=
+x
10
4725------------ x
12
56 700---------------– x
14
654 885------------------ …–+
.
ρ T( ) ρ 0( )=
+4πmλkBθD
ne2"
--------------------------- xcoth– 5 14x------ x
18------
x3
360---------–+
+
+x
5
4725------------ x
7
56 700---------------– x
9
654 885------------------ …–+
x θD/2T=
.
1246 GUSEV, VALEEVA
Table 1. Parameters of functions (3) and (13) for the electrical conductivity σ (resistivity ρ) of cubic titanium monoxidesTiOy ≡ TixOz (y = z/x) in the temperature range 4.2–300 K
Chemical composition
of TiOy
Composition of TixOz with due
regard for imper-fection of the
sublattices
Latticeconstant aB1,
nmFunction
Parameters of the functions
ρ(0), µΩm σ(0), µΩ–1m–1 ∆E, eV θD, K
TiO0.920 Ti0.887O0.816 0.41867 3 2.01 0.4969 – 471
TiO0.946 Ti0.877O0.829 0.41840 3 2.10 0.4773 – 470
TiO0.985 Ti0.868O0.855 0.41834 3 2.02 0.4952 – 400
TiO1.069 Ti0.837O0.895 0.41808 3 2.56 0.3911 – 481
TiO1.087 Ti0.833O0.906 0.41738 13 3.81 0.2626 0.028 –
TiO1.112 Ti0.816O0.907 0.41711 13 4.17 0.2397 0.025 –
TiO1.153 Ti0.804O0.927 0.41704 13 6.16 0.1623 0.006 –
TiO1.201 Ti0.792O0.952 0.41688 13 7.99 0.1251 0.006 –
TiO1.227 Ti0.787O0.965 0.41674 13 5.47 0.1828 0.021 –
TiO1.233 Ti0.780O0.961 0.41665 13 5.99 0.1668 0.034 –
TiO1.262 Ti0.771O0.973 0.41662 13 6.54 0.1528 0.032 –
The resistivity of TiOy monoxides with an oxygencontent y ≥ 1.087 decreases rapidly as the temperatureincreases from 4.2 to 300 K. The low resistivity(~10−6 Ω m) obtained for all the titanium monoxidesstudied is characteristic of metals. However, the nega-tive temperature coefficient of resistivity dρ/dT for TiOymonoxides with y ≥ 1.087 is a basic indication of dielec-tric behavior. In the temperature range 4.2–300 K, thechange ∆ρ in the resistivity due to this factor reaches20–50%. Therefore, ∆ρ cannot be treated as a smallcorrection within the relaxation time approximation.
The electrical conductivity σ is proportional to thecarrier concentration n multiplied by the carrier mobil-ity u; that is,
(9)
Under the conditions where carriers are governed bythe Boltzmann statistics and the energy bands are para-bolic (this virtually always holds true in the vicinity ofthe band edges [29]), the carrier concentration can bewritten in the form
(10)
where m* is the effective mass of charge carriers and∆E is the energy parameter, which has the meaning ofan activation energy and, in the case of intrinsic con-ductivity, is equal to the energy gap Eg between thevalence and conduction bands. For a Boltzmann distri-bution, the carrier mobility is inversely proportional tothe temperature; that is,
(11)
Since all the titanium monoxide samples are character-ized by a nonzero residual resistivity, the conductivity of
σ T( ) ehe h, ue uh+( ).=
ne 2 m*( )3/2 kBT /2π"2( )3/2 ∆E/2kBT–( ),exp=
u AT q– .∼
P
TiOy monoxides (y ≥ 1.087), according to formulas (10)and (11), can be represented in the form
(12)
The constant component σ(0) has the meaning of anextrinsic conductivity of the system and implies that theconductivity at T = 0 K is nonzero.
The experimental dependences σ(T) for TiOy mon-oxides (y ≥ 1.087) were described by function (12) andthe relationship σ(T) = σ(0) + Bexp(T–1/4), which ischaracteristic of Mott semiconductors at low tempera-tures [30]. The numerical approximation demonstratedthat the dependences σ(T) are more closely approxi-mated by function (12); in this case, the parameter qfalls in the range 0.9–1.1. Therefore, with due regardfor the experimental error, we can assume that q ≈ 1;hence, the conductivity can be written as
(13)
The parameter q = 1 is observed for many polyatomicsemiconductors in which scattering occurs throughacoustic and optical phonons. The numerical parametersof function (13) used to describe the dependences σ(T)for TiOy monoxides (y ≥ 1.087) are listed in Table 1.
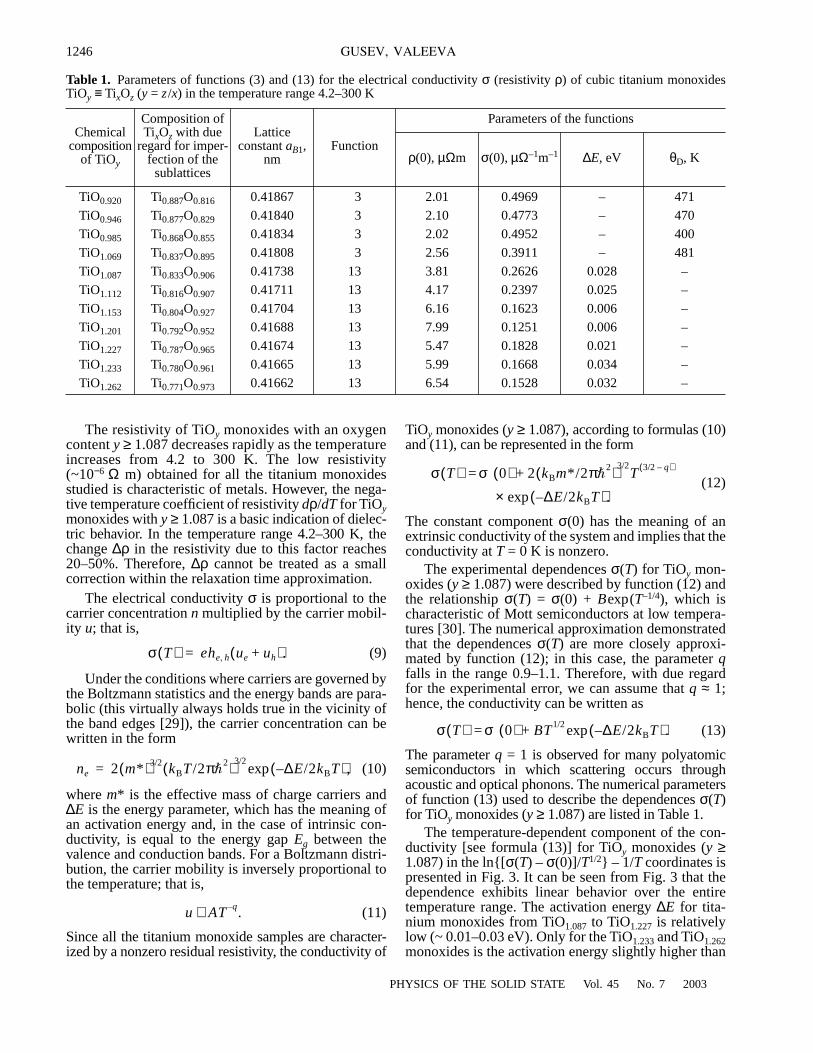
The temperature-dependent component of the con-ductivity [see formula (13)] for TiOy monoxides (y ≥1.087) in the ln[σ(T) – σ(0)]/T1/2 – 1/T coordinates ispresented in Fig. 3. It can be seen from Fig. 3 that thedependence exhibits linear behavior over the entiretemperature range. The activation energy ∆E for tita-nium monoxides from TiO1.087 to TiO1.227 is relativelylow (~ 0.01–0.03 eV). Only for the TiO1.233 and TiO1.262monoxides is the activation energy slightly higher than
σ T( ) σ 0( ) 2 kBm*/2π"2( )3/2
T 3/2 q–( )+=
× ∆E/2kBT–( ).exp
σ T( ) σ 0( ) BT1/2 ∆E/2kBT–( ).exp+=
HYSICS OF THE SOLID STATE Vol. 45 No. 7 2003
THE INFLUENCE OF IMPERFECTION OF THE CRYSTAL LATTICE 1247
0.03 eV [calculation with the more exact formula (12)for the TiO1.262 monoxide gives the activation energy∆E = 0.043 eV). If the intrinsic conductivity manifestsitself at temperatures of approximately 300 K andabove, we cannot state with confidence that the deter-mined quantity ∆E is the band gap of an intrinsic semi-conductor or that it is the activation energy of an impu-rity level. The correct answer to this question can beobtained from analyzing the magnetic susceptibility.
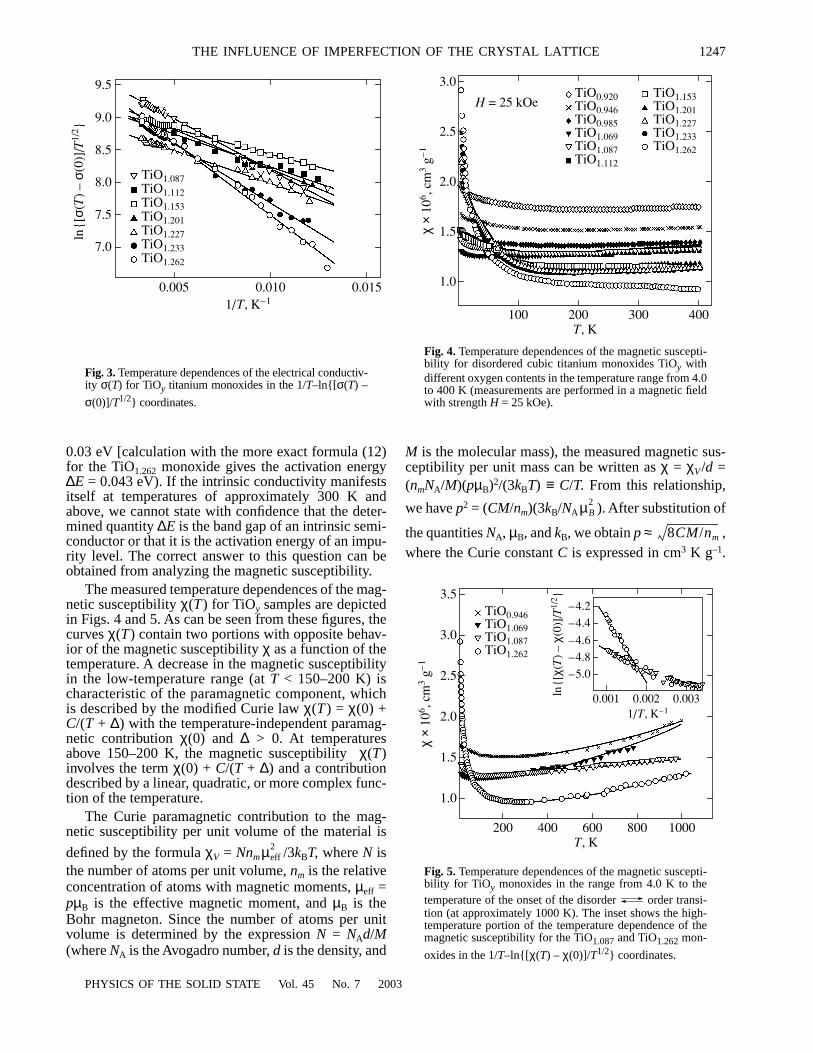
The measured temperature dependences of the mag-netic susceptibility χ(T) for TiOy samples are depictedin Figs. 4 and 5. As can be seen from these figures, thecurves χ(T) contain two portions with opposite behav-ior of the magnetic susceptibility χ as a function of thetemperature. A decrease in the magnetic susceptibilityin the low-temperature range (at T < 150–200 K) ischaracteristic of the paramagnetic component, whichis described by the modified Curie law χ(T ) = χ(0) +C/(T + ∆) with the temperature-independent paramag-netic contribution χ(0) and ∆ > 0. At temperaturesabove 150–200 K, the magnetic susceptibility χ(T)involves the term χ(0) + C/(T + ∆) and a contributiondescribed by a linear, quadratic, or more complex func-tion of the temperature.
The Curie paramagnetic contribution to the mag-netic susceptibility per unit volume of the material is
defined by the formula χV = Nnm /3kBT, where N isthe number of atoms per unit volume, nm is the relativeconcentration of atoms with magnetic moments, µeff =pµB is the effective magnetic moment, and µB is theBohr magneton. Since the number of atoms per unitvolume is determined by the expression N = NAd/M(where NA is the Avogadro number, d is the density, and
µeff2
9.5
9.0
8.5
8.0
7.5
7.0
ln[
σ(T)
– σ
(0)]
/T1/
2
0.005 0.010 0.0151/T, K–1
TiO1.087TiO1.112TiO1.153TiO1.201TiO1.227TiO1.233TiO1.262
Fig. 3. Temperature dependences of the electrical conductiv-ity σ(T) for TiOy titanium monoxides in the 1/T–ln[σ(T) –
σ(0)]/T1/2 coordinates.
PHYSICS OF THE SOLID STATE Vol. 45 No. 7 200
M is the molecular mass), the measured magnetic sus-ceptibility per unit mass can be written as χ = χV/d =(nmNA/M)(pµB)2/(3kBT) ≡ C/T. From this relationship,
we have p2 = (CM/nm)(3kB/NA ). After substitution of
the quantities NA, µB, and kB, we obtain p ≈ ,where the Curie constant C is expressed in cm3 K g–1.
µB2
8CM/nm
3.0
2.5
2.0
1.5
1.0
χ ×
106 , c
m3 g
–1
100 200 300 400T, K
H = 25 kOeTiO0.920TiO0.946TiO0.985TiO1.069TiO1.087TiO1.112
TiO1.153TiO1.201TiO1.227TiO1.233TiO1.262
Fig. 4. Temperature dependences of the magnetic suscepti-bility for disordered cubic titanium monoxides TiOy withdifferent oxygen contents in the temperature range from 4.0to 400 K (measurements are performed in a magnetic fieldwith strength H = 25 kOe).
3.5
3.0
2.5
2.0
1.5
1.0
χ ×
106 , c
m3 g
–1
200 400 600 800 1000T, K
0.001 0.002 0.0031/T, K–1
ln[
χ(T)
– χ
(0)]
/T1/
2
–5.0
–4.8
–4.6
–4.4
–4.2TiO0.946TiO1.069TiO1.087TiO1.262
Fig. 5. Temperature dependences of the magnetic suscepti-bility for TiOy monoxides in the range from 4.0 K to thetemperature of the onset of the disorder order transi-tion (at approximately 1000 K). The inset shows the high-temperature portion of the temperature dependence of themagnetic susceptibility for the TiO1.087 and TiO1.262 mon-
oxides in the 1/T–ln[χ(T) – χ(0)]/T1/2 coordinates.
3

1248 GUSEV, VALEEVA
Table 2. Parameters of functions (14) and (16) for the magnetic susceptibility χ and the magnetic characteristics of cubic tita-nium monoxides TiOy
TiOy FunctionTempera-
turerange, K
Parameters of the functions
χ(0) × 106,cm3 g–1
C × 106,cm3 K g–1 ∆, K b × 1012,
cm3 K–2 g–1a × 109,
cm3 K g–1 ∆E, eV pav, µB
TiO0.920 14 4.0–400 1.629 17.9 55.0 0.501 – – 0.089
TiO0.946 14 4.0–1000 1.410 22.9 88.6 0.493 – – 0.100
TiO0.985 14 4.0–400 1.290 10.7 55.4 0.469 – – 0.069
TiO1.069 14 4.0–1000 1.237 0.54 8.5 0.659 – – 0.015
TiO1.087 16 4.0–1000 1.196 14.9 71.8 – – 0.061 0.081
TiO1.112 17 4.0–400 1.059 44.9 96.0 – 0.889 – 0.225
TiO1.153 17 4.0–400 0.909 56.4 89.7 – 0.898 – 0.224
TiO1.201 17 4.0–400 0.798 58.3 39.5 – 1.243 – 0.195
TiO1.227 17 4.0–400 0.806 51.7 34.6 – 1.025 – 0.178
TiO1.233 17 4.0–400 0.917 28.1 14.5 – 0.578 – 0.118
TiO1.262 16 4.0–1000 0.847 24.1 7.8 – – 0.173 0.101
In the case when the concentration nm of atoms withmagnetic moments is unknown, the magnetic momentaveraged over all atoms can be determined from the
expression pav ≈ . It should be noted that, inorder to estimate the quantities p or pav correctly, it isnecessary to use the molecular mass M correspondingto the real composition of the titanium monoxide withallowance made for the vacancy content in each sublat-tice, i.e., TixOz.
As follows from the calculations with the use of thedetermined constants C, the effective magnetic momentµeff, which was obtained by averaging over all atoms,amounts to 0.015–0.225 µB (Table 2). The low value ofµeff indicates that the Curie contribution to the magneticsusceptibility can be associated with impurities. Itseems likely that, in the TiOy monoxide, the majority ofTi2+ ions have paired electrons or there occurs anexchange cation–cation interaction. The EPR measure-ments of the TiOy monoxide failed to reveal ions withuncompensated magnetic moments because of the highconcentration of delocalized electrons. Since the TiOysamples are free of ferromagnetic impurities, the smalleffective magnetic moment can be due to the presenceof Ti2+ and Ti3+ impurity ions in TiOy monoxides. Judg-ing from the values of p, the content of the above impu-rity ions varies from 2 to 8 at. %. The Curie paramag-netic contribution is most pronounced for TiOy titaniummonoxides with a relatively high oxygen content y >1.2 (Fig. 5).
The dependence χ(T) for TiOy titanium monoxideswith an oxygen content y ≤ 1.069 (Figs. 4, 5) over theentire temperature range (4.2–400 or 4.2–1000 K) iswell described by the function
(14)
8CM
χ T( ) χ 0( ) C/ T ∆+( ) bT2.+ +=
PH
In relationship (14), the quadratic term bT2 is character-istic of the Pauli paramagnetism due to conductionelectrons. This agrees with the metallic conductivityobserved in these monoxides.
The temperature dependences of the magnetic sus-ceptibility for TiOy monoxides with an oxygen contenty ≥ 1.087 exhibit a more complex behavior, especiallyin the high-temperature range (Fig. 5). Let us considerthe situation where the concentration of charge carriersin TiOy monoxides with y ≥ 1.087 at temperatures T >300 K is described by relationship (10). According tothe Curie formula χp(T) = ne(µB)2/kBT, the temperature-dependent component of the magnetic susceptibilityinvolves the paramagnetic contribution
(15)
where A = 2(m0/2π"2)3/2(kB)1/2(µB)2(m*/m0)3/2 = 3.008 ×10⁻⁹(m*/m0)3/2 [K–1/2] and m0 is the electron mass. Notethat expression (15) describes the dimensionless sus-ceptibility per unit volume. Making allowance for theaforementioned features of the dependences χ(T) andintroducing the designation Am = A/d, the measuredmass susceptibilities of TiOy monoxides (y ≥ 1.087) inthe temperature range from 4.2 to 1000 K can beapproximated by the function
(16)
which includes the temperature-independent contribu-tion χ(0), the Pauli paramagnetic contribution of theelectronic system with an energy gap, and the Curieparamagnetic contribution. At T < 400 K, the secondterm in relationship (16) can be replaced by the term aT,which is linear in temperature. Hence, the susceptibility
χ p T( ) 2 m*/2π"2( )3/2
kB( )1/2 µB( )2T1/2=
× ∆E/2kBT–( )exp AT2 ∆E/2kBT–( ),exp≡
χ T( ) = χ 0( ) AmT1/2 ∆E/2kBT–( )exp C/ T ∆+( ),++
YSICS OF THE SOLID STATE Vol. 45 No. 7 2003

THE INFLUENCE OF IMPERFECTION OF THE CRYSTAL LATTICE 1249
of TiOy monoxides (y ≥ 1.087) in the temperature range4.0–400 K can be described by the relationship
(17)
The numerical parameters of functions (14), (16), and(17), which were used to approximate the depen-dences χ(T ) for the TiOy monoxides studied, aregiven in Table 2.
In expression (16), the coefficients Am for theTiO1.087 and TiO1.262 monoxides are equal to 0.012 × 10⁻⁶
and 0.034 × 10⁻⁶ cm3 g–1 K–1/2, respectively. The densi-ties of the TiO1.087 and TiO1.262 monoxides are 4.97 and4.82 g cm–3, respectively. The effective mass of chargecarriers in terms of m0 can be written in the form m* =4.799 × 10⁵(Amd)2/3m0. The calculations of the effectivemasses of charge carriers from this formula give ~7m0for TiO1.087 and ~14m0 for TiO1.262. The sufficientlylarge effective mass of charge carriers confirms thevalidity of the Boltzmann distribution used in thedescription of the carrier concentration in TiOy monox-ides with y ≥ 1.087.
The values of ∆E determined from the dependencesχ(T) [formula (16)] for the TiO1.087 and TiO1.262 monox-ides are equal to 0.061 and 0.173 eV, respectively. Thevalues of ∆E calculated from the temperature depen-dences of the conductivity for the same monoxides are0.028 and 0.032 eV, respectively. It can be assumed thatthe values of ∆E obtained from the low-temperaturedependences of the conductivity correspond to the acti-vation energy of impurity levels, whereas the values of∆E derived from the dependences of the magnetic sus-ceptibility over a wider temperature range are associ-ated with the band gap in the case of intrinsic conduc-tivity. The low value of the band gap makes it possibleto assign the TiOy monoxides (y ≥ 1.087) to narrow-gapsemiconductors.
Thus, the kinetic and magnetic data obtained allowus to draw the inference that an increase in the oxygencontent leads to the formation of a narrow energy gapbetween the valence and conduction bands in the elec-tronic structure of the disordered cubic titanium mon-oxide TiOy. Consequently, the TiOy monoxide canbehave either like a d metal or like a semiconductor,depending on the oxygen content. Therefore, themetal–semiconductor transition is experimentallyobserved with an increase in the oxygen content in thedisordered titanium monoxide TiOy, i.e., with adecrease in the concentration of oxygen vacancies anda simultaneous increase in the concentration of tita-nium vacancies. The question now arises as to whetherthis concentration transition is a Mott transition. Inactual fact, according to [30–32], heavily doped semi-conductors (with an impurity-atom concentration of upto tenths of a percent) have disordered structures. Thesematerials undergo a metal–insulator concentration tran-sition at a temperature of 0 K and a metal–semiconduc-tor transition due to correlations at T > 0 K. Examplesof these semiconductors are provided by transition-
χ T( ) χ 0( ) C/ T ∆+( )+ aT .= =
PHYSICS OF THE SOLID STATE Vol. 45 No. 7 2003
metal oxides of the NiO type [30]. Upon the metal–insulator transition, the electrical conductivity can bemeasured depending on a certain external parameterwhose variation leads to a change in the lattice constant.This parameter can be either the composition, the pres-sure, or the magnetic field strength. The material canpossess n-type conductivity at a smaller lattice constantand can become an insulator with an increase in the lat-tice constant [29, 33, 34]. In the case of the TiOy tita-nium monoxide, an increase in the lattice constant aB1with an increase in the oxygen content is accompaniedby a crossover from metallic conductivity to semicon-ductor conductivity. However, the temperature depen-dence of the conductivity for Mott semiconductors inthe low-temperature range is described by the relation-ship σ(T) ~ exp(T–1/4) [30], whereas our numerical anal-ysis demonstrates that the temperature dependences ofthe conductivity for TiOy monoxides at y > 1 obey thelaw σ(T) ~ T1/2exp(T–1). Moreover, the concentration ofstructural vacancies in titanium monoxide is severalorders of magnitude (by a factor of thousands and eventens of thousands) higher than the concentration of ran-domly distributed impurity atoms in Mott semiconduc-tors. On this basis, we can infer that the metal–semicon-ductor concentration transition in the disordered tita-nium monoxide TiOy is not a Mott transition.
The high concentration of structural vacancies in thetitanium and oxygen sublattices of the TiOy monoxideis a prerequisite to ordering. In our recent work [35], wedemonstrated experimentally and theoretically that amonoclinic superstructure of the Ti5O5 type involvescontinuous vacancy channels along particular crystallo-graphic directions (the Ti5O5 structure was describedand analyzed in detail in monograph [36]). In thisrespect, it is of considerable interest to investigate theelectrokinetic and magnetic properties of an orderednonstoichiometric titanium monoxide.
ACKNOWLEDGMENTS
We would like to thank R. Henes for his assistancein measuring the resistivity of TiO1.262, TiO1.087, andTiO0.920 monoxide samples at 4.2 K.
This work was supported by the Russian Foundationfor Basic Research, project no. 03-03-32033a.
REFERENCES
1. A. I. Gusev and A. A. Rempel’, Nonstoichiometry, Dis-order, and Order in Solids (Ural. Otd. Ross. Akad. Nauk,Yekaterinburg, 2001).
2. D. Watanabe, J. R. Castles, A. Jostsons, and A. S. Malin,Nature 210 (5039), 934 (1966); Acta Crystallogr. 23 (2),307 (1967).
3. E. Hilti and F. Laves, Naturwissenschaften 55 (3), 131(1968).
4. D. Watanabe, O. Terasaki, A. Jostsons, and J. R. Castles,in The Chemistry of Extended Defects in Non-Metallic

1250 GUSEV, VALEEVA
Solids, Ed. by L. Eyring and M. O. Keeffe (North-Hol-land, Amsterdam, 1970), p. 238.
5. A. A. Valeeva, A. A. Rempel’, and A. I. Gusev, Pis’maZh. Éksp. Teor. Fiz. 71 (11), 675 (2000) [JETP Lett. 71,460 (2000)].
6. A. A. Valeeva, A. A. Rempel’, and A. I. Gusev, Neorg.Mater. 37 (6), 716 (2001).
7. E. Hilti, Naturwissenschaften 55 (3), 130 (1968).8. A. I. Gusev, Pis’ma Zh. Éksp. Teor. Fiz. 74 (2), 96 (2001)
[JETP Lett. 74, 91 (2001)].9. A. D. Pearson, J. Phys. Chem. Solids 5 (4), 316 (1958).
10. S. P. Denker, J. Appl. Phys. 37 (1), 142 (1966).11. M. I. Aœvazov, I. A. Domashnev, A. G. Sarkisyan, and
T. V. Rezchikova, Izv. Akad. Nauk SSSR, Neorg. Mater.6 (4), 745 (1970).
12. M. D. Banus, T. B. Reed, and A. J. Strauss, Phys. Rev. B5 (8), 2775 (1972).
13. M. Schoen and S. P. Denker, Phys. Rev. 184 (3), 864(1969).
14. L. F. Mattheis, Phys. Rev. B 5 (2), 290 (1972).15. A. Neckel, P. Rastl, R. Eibler, et al., J. Phys. C: Solid
State Phys. 9 (4), 579 (1976).16. A. Neckel, Int. J. Quantum Chem. 23 (4), 1317 (1983).17. L. M. Huisman, A. E. Carlsson, C. D. Gellat, and
H. Ehrenreich, Phys. Rev. B 22 (2), 991 (1980).18. V. A. Gubanov, A. L. Ivanovsky, G. P. Shvelkin, and
D. E. Ellis, J. Phys. Chem. Solids 45 (7), 719 (1984).19. A. L. Ivanovsky, V. I. Anisimov, D. L. Novikov, et al.,
J. Phys. Chem. Solids 49 (5), 465 (1988).20. S. R. Barman and D. D. Sarma, Phys. Rev. B 49 (23),
16141 (1994).21. C. Leung, M. Weinert, P. B. Allen, and R. M. Wentzco-
vitch, Phys. Rev. B 54 (11), 7857 (1996).22. G. K. Wertheim and D. N. E. Buchanan, Phys. Rev. B 17
(6), 2780 (1978).
P
23. S. Gokhale, S. R. Barman, and D. D. Sarma, Phys. Rev.B 52 (20), 14526 (1995).
24. D. R. Jennison and A. B. Kunz, Phys. Rev. Lett. 39 (7),418 (1977).
25. J. K. Burdett and T. Hughbanks, J. Am. Chem. Soc. 106(11), 3101 (1984).
26. G. Hobiger, P. Herzig, F. Schlapansky, and A. Neckel, J.Phys.: Condens. Matter 2 (20), 4595 (1990).
27. K. Tsutsumi, O. Aita, and K. Ichikawa, Phys. Rev. B 15(10), 4638 (1977).
28. S. Bartkowski, M. Neumann, E. Z. Kurmaev, et al., Phys.Rev. B 56 (16), 10656 (1977).
29. I. M. Tsidilkovski, Gapless Semiconductors—A NewClass of Materials (Nauka, Moscow, 1986).
30. N. F. Mott and E. A. Davis, Electronic Processes in Non-Crystalline Materials, 1st ed. (Clarendon, Oxford, 1971;Mir, Moscow, 1974).
31. N. F. Mott, Electrons in Disordered Structures (Cam-bridge, 1967; Mir, Moscow, 1969), Adv. Phys. 16 (61),49 (1967).
32. N. F. Mott, Metal–Insulator Transitions (Taylor andFransic, London, 1974; Nauka, Moscow, 1979).
33. C. Kittel, Introduction to Solid State Physics, 7th ed.(Nauka, Moscow, 1978; Wiley, New York, 1996), p. 284.
34. I. M. Tsidilkovski, Electron Spectrum of Gapless Semi-conductors (Akad. Nauk SSSR, Sverdlovsk, 1991;Springer-Verlag, Berlin, 1997), Springer Series in Solid-State Sciences, Vol. 116.
35. A. A. Valeeva, G. Tang, A. I. Gusev, and A. A. Rempel’,Fiz. Tverd. Tela (St. Petersburg) 45 (1), 84 (2003) [Phys.Solid State 45, 87 (2003)].
36. A. I. Gusev, A. A. Rempel, and A. A. Magerl, Disorderand Order in Strongly Nonstoichiometric Compounds:Transition Metal Carbides, Nitrides, and Oxides(Springer, Berlin, 2001).
Translated by O. Borovik-Romanova
HYSICS OF THE SOLID STATE Vol. 45 No. 7 2003