Embed Size (px)
Citation preview
The Influence of High and Low Pressure Systems on Hurricane Movement as
Seen over North America
Lawrence R. Handley
Dr. Handley is Assistant Professor of Geography at The University of Arkansas. He serves GTU as The Chairman of The Alumni Chapter.
This study is an attempt to illustrate one of the many atmospheric controls that influence the trajectories, speed , and intensity of hurricanes. The article developed as an exercise aimed at viewing the impact of well developed high pressure cells on well-developed low pressure systems. The hurricane is used as the model of the well-developed low pressure system, because it is compact, mobile, and well-defined. Thus, the relationships between low pressure and high pressure systems can best be documented, isolated, and studied using hurricanes as the model.
It is important that the reader understand that past research has identified many controls affecting the movements and velocities of hurricanes, e.g. the jet stream, temperatures of ocean water, upperlevel disturbances, etc. There are several good sources the reader might consult for further indentification of these guidance systems, for example: G.W. Cry, Tropical Cyclones of the North Atlantic, Tracks and Frequencies of Hurricanes and Tropical Storms, 1871·1963 Technical Paper No. 55, U.S. Weather Bureau, 1965, and J.R. Hope, and C.J. Neilmann, "An Operational Tecnique for Relating the Movement of Existing Tropical Cyclones to Past Tracks, " Monthly Weather Review, Vol. 98, 1970.
The effect of high pressure cells is one of the controls that has been studied for their influence on hurricane movement. This study has isolated this one control for that purpose, and as a result provides a very good illustration of the relationships between high pressure and low pressure systems.
15
The methodology pursued was to examine the weather maps for 18 hurricanes and identify the relationship between the hurricane, its barometric pressure and track, and the occurance and storm track of high pressure cells migrating across the continental U.S. and Canada. Five of the 18 are selected for use here. The series of weather maps of each hurricane provides a scenario for the observation of the relationships between the hurricane in the Gulf of Mexico or Caribbean and high pressure systems over the continental U.S. Those observations follow.
Introduction
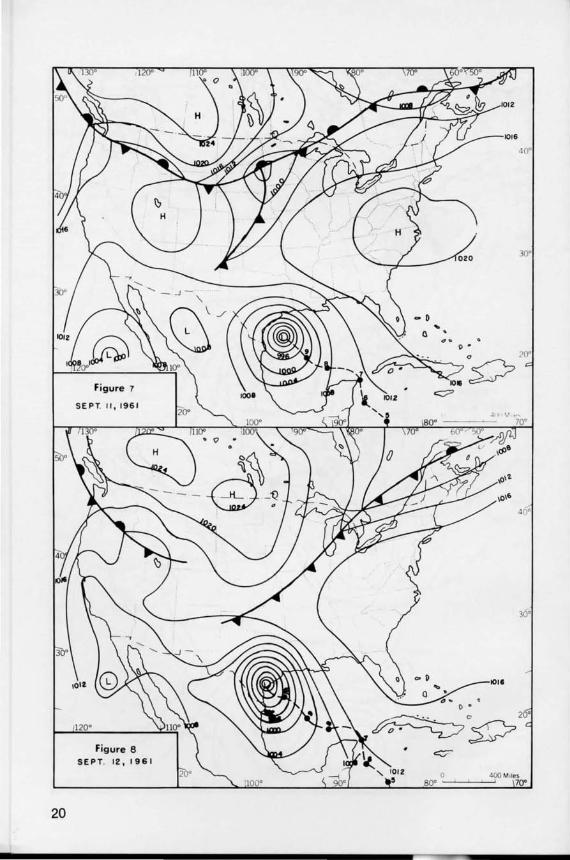
On September 11, 1961 Hurricane Carla crossed the Texas coast as the largest and most intense Gulf Coast hurricane in many years. For nine days Carla had primped herself, as she crossed the Caribbean Sea and the Gulf of Mexico, into a great storm of 175 miles per hour winds ,1 and eye pressure of 931 mb (27.49 in.),' and 45 miles per hour winds extending 350 miles from her center.3
Even though Hurricane Carla killed 46 people,' caused 400 million dollars damage in Texas,' and is considered as one of the greatest hurricanes ever to hit a U.S. coast, she reacted like a toy rubber ball tossed against a brick wall as she encountered a gigantic high pressure cell existing over the central U.S. She was forced to veer to the left, then to the right, and again back to the left, finally being forced to make a loop, before coming almost to a standstill.
With this particular case in mind the influence will be examined of the traveling middle latitude
16
cyclones and anticyclones upon hurricane movement, and then the application of this effect to the tracks of several hurricanes will be studied.
The Hurricane versus The High and Low
The hurricane technically is defined as a tropical storm that has a cyclonic wind circulation above 74 miles per hour.6 Until a tropical disturbance reaches the wind velocity to make it of hurricane strength, or after a hurricane has dissipated to below hurricane strength, the National Oceanic and Atmospheric Administration lists is as a tropical storm.
Extratropical disturbances are divided into "cyclones" and anti· cyclones. " The cyclone is a low· pressure storm with a converging surface wind system of moderate velocity.7 The anticyclone is a high· pressure storm with a diverging surface wind system of moderate velocity.
Both the hurricane and the extratropical storms are non· periodic and are traveling disturbances. The hurricane, although intense, does not affect as large a surface area as the cycone or anticyclone. The largest of the hurricanes may affect an area of 400 miles in diameter with moderate winds, but having only an area of hurricane force winds 100 miles in diameter." Anticyclones are even larger in size than the cyclones. In fact , it has been known at various times for one high pressure system to cover the whole continental U.S.
The "intensity" of these storms refers only to the measured minimum or maximum central pressure, maximum winds, or

40"
120"
40"
3 0
I
f ~\\ cr,
'i \\1) j -0- _ If \)
f - ' - ' - ' - ' - . - - -,._'Q ! ··i "
\
~\\ C>.
~~ -- - ' - - - .-- --'Q
4 0
-I~, 0 ".0'
~'r_".~p2 1200
Figure 2
T"ACK OF HUR"ICANE
CARLA SEPT. 3-15,1"1 100"
<:?
o 400 Miles 80" I I I 70"
17

18
1120"
Figure 4 SEPT. 1 ,1 961
... I> •
1016
1110
1016
400 MIles ! 70"
/ 10 12
Figure 5
SEPT. 9 . 1961
l~· -
r. L \
Figure 6
196 1 SEPT. 1 0 .
80·
19
20
120·
Figure 8 SEPT. 12,1961
" .
o 800
I> •
1012
1016
40·
3D·
40·
400 M,les , 700
10 12 120"
Figure 9
SEPTI3 , I961
130' 120" I..
~\\ co. ~lJ -
- - - - - - - - -i2
H)
Figure 10 T RACK OF HURRICANE
C I NDY SEPT 16 -19, 1963 20·
4 •
30·
40·
Co » o
o •
~p2
o 80" ' '
400Mlle$ 70"
21
both.'O Intensity is irrespective of the areal extent of a storm." The great intensity that a hurricane can attain can be verified by Hurricane Camille of August 1969. It had a corrected surface pressure of 901 mb (26.61 in.) and a wind velocity of 210 miles per hour recorded at 30,000 feet. " The intensity of extratropical storms is not great compared with hurricane intensity. Cyclones and anticyclones hardly vary more than 20 millibars from normal pressure at the most, and their wind velocities are only moderate in strength.
The relationships of cyclones and anticyclones, hereafter referred to as lows and highs, to hurricanes and other tropical storms brings many variables into account. The relationship will depend upon the strength of a high or the weakness of a low (a weak low pressure system can act toward a lower pressure system, such as a hurricane or tropical storm, much as a high pressure cell would), on how fast these high and low cells are moving, and on the succession of high and low pressure cells as they travel across the conti nent. Although most of the high pressure air masses will be cooler at higher latitudes than the warm moist tropical air of the hurricanes, the colder and more moist the high pressure air is the more dense and impenetrable the high will be. The relationship depends, to a small degree, upon the hurricane: its intensity, possibly its size, the speed of movement, if it is building or dissipating, and upon its ability to maintain itself.
High pressure and weak low pressure systems play a very prominent role in directing the tracks of hurricanes and tropical
22
storms. They act as a solid rock wall forbidding the passage of the hurricane. These cells are hardly dentable if they are flowing outward, or if the hurricane approaches the High along a line directed toward the center. They are only vulnerable across their rear as they are subsiding or moving away, if they are over extended (elongated), and if approached along a line that will cut across the high pressure away from the center.
Since hurricanes or tropical storms cannot move through areas of higher pressure they are forced to move toward and into areas of lower or equal pressure. Due to this, hurricanes move into troughs between highs, into lows or lower pressure, or they move within areas of equal pressure.
In relation to high pressure systems, it is imperative that one ment ion a high pressure area that is not related to the traveling disturbances of the middle latitudes. That is the large cell of the Subtropical High that exists permanently over the North Atlantic from approximately 25° to 35°. N. Latitude.13 This high pressure cell is often referred to as the Bermuda· Azores High. " Hurricanes originating to the south of this Subtropical High cell are forced to skirt the southern edge of the High. As they reach the western edge of the cell they have a tendency to turn north and north· eastward around it. Figure 1 shows the average path of 130 hurricanes and the normal distibution of atmospheric pressure around this Subtropical High cell. Ivan Tannehill states:
" .. . in the case of a single area of high pressure, fixed in position and magnitude, there is reason to
be lieve that the course of the hurricane will follow the outer isobars with the speed of the wind system then prevalent. " ls
Where do Hurricanes Originate?
Hurricanes originate in areas where ocean temperatures are relatively warm. '6 They occur with greatest frequency during the months of August, September, and October. '7 Hurricane formation in June and July tends to be concentrated in the western portions of the Atlantic, the western Caribbean, and in the Gulf of Mexico. During these same months disturbances in the central and eastern Atlantic are relatively rare. This lack of disturbance could be a result of the relatively high and constant wind, says C. L. Jordan. 18 It might not be due so much to the wind as it is to the migration lag of the Subtropical High cell to the north . Thus dominance by the high pressure, which would also account for the high and constant winds, would prevent the formation of any hurricanes. Ivan Tannehill believes that hurricanes develop in the doldrums, '9 and because there is no belt of doldrums in the eastern two thirds of the Caribbean Sea there have never been any hurricanes known to have originated in that region .20
In August and September the belt of the doldrums is farthest north in the eastern Atlantic and the Subtropical High has migrated to the north, giving rise to the hurricanes of the Cape Verde region. There has been only one case in which a hurricane turned north immediately after leaving the Cape Verde region , wh ich indicates
the control that the Subtropical High cell has in keeping hurricanes to the south of it. In SeptemberNovember the most hurricane activity begins in the western Caribbean, and in the Gulf of Campeche area of the Gulf of Mexico. The Atlantic is out of the picture at this time of the year due again to the migration back toward the south of the Subtropical High ceiL"
I am not trying to develop new theories about hurricane origination nor to tear old ones completely apart , because along with everyone else, I don't know what causes hurricanes. I am only attempt ing to add to old ideas that hurricanes' origination is to some extent controlled by the Subtropical High in so far as dictating where they cannot develop. Hurricanes cannot and do no originate in regions dominated by high pressure.
What are the Paths Hurricanes Follow?
Hurricane paths, or tracks, have little apparent rhyme or reason . No two hurricanes follow the same or parallel tracks from origination to dissipation. Tracks cross and recross in all areas without seeming to obey any physical law. Some tracks recurve, some do not, some loop, some slow to almost a standstill , and some have been known to accelerate 1,500 per cent in twenty-four hours. "
In order to explain this inconsistency in hurricane movement let us take a look at five hurricane tracks and explore each track singularly as to its inconsistencies.
23
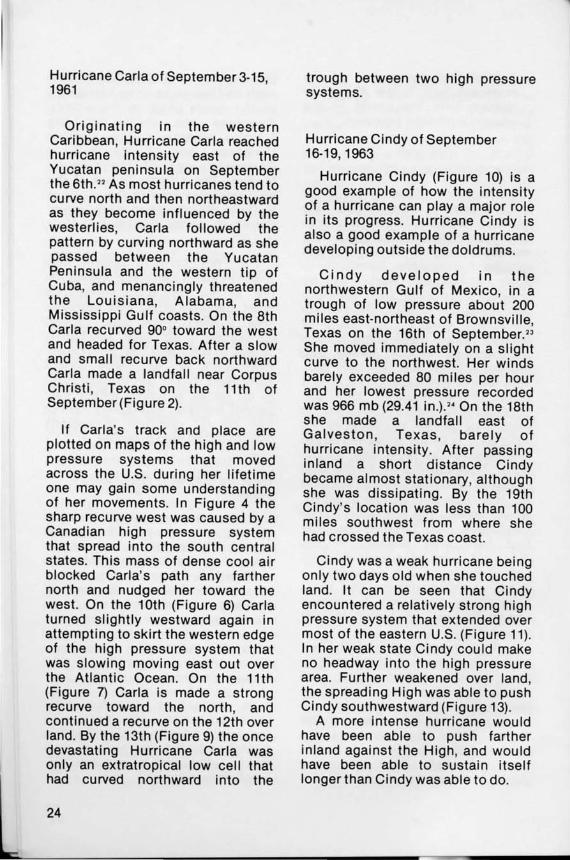
Hurricane Carla of September 3-15, 1961
Originating in the western Caribbean, Hurricane Carla reached hurricane intensity east of the Yucatan peninsula on September the 6th.22 As most hurricanes tend to curve north and then northeastward as they become influenced by the westerlies, Carla followed the pattern by curving northward as she passed between the Yucatan Peninsula and the western tip of Cuba, and menancingly threatened the Louisiana, Alabama, and Mississippi Gulf coasts. On the 8th Carla recurved 90° toward the west and headed for Texas. After a slow and small recurve back northward Carla made a landfall near Corpus Christ i, Texas on the 11 th of September(Figure 2).
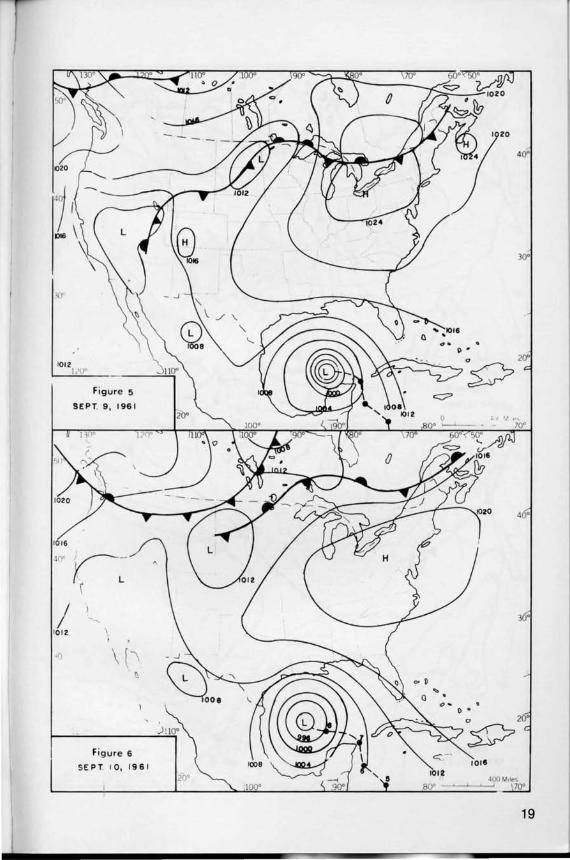
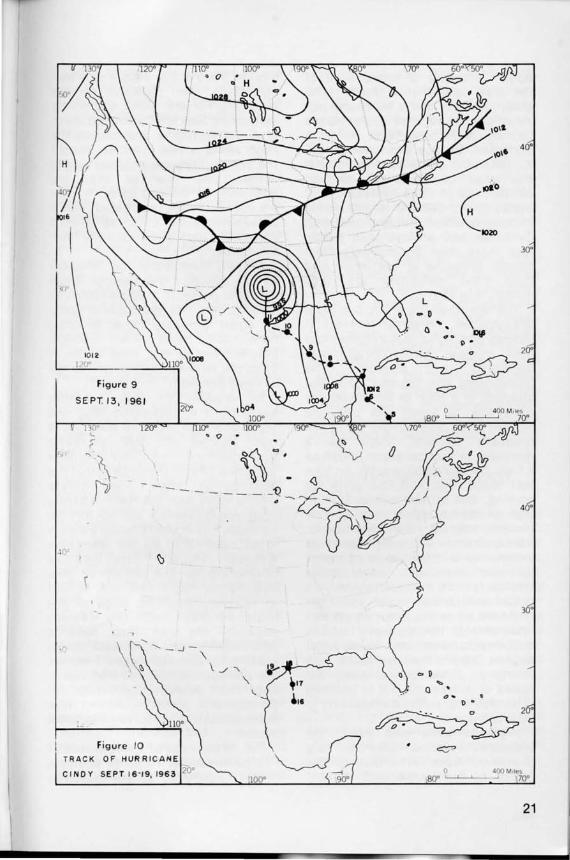
If Carla's track and place are plotted on maps of the high and low pressure systems that moved across the U.S. during her lifetime one may gain some understanding of her movements. In Figure 4 the sharp recurve west was caused by a Canadian high pressure system that spread into the south central states. This mass of dense cool air blocked Carla's path any farther north and nudged her toward the west. On the 10th (Figure 6) Carla turned Slightly westward again in attempting to skirt the western edge of the high pressure system that was slowing moving east out over the Atlantic Ocean. On the 11th (Figure 7) Carla is made a strong recurve toward the north, and continued a recurve on the 12th over land. By the 13th (Figure 9) the once devastating Hurricane Carla was only an extratropical low cell that had cu rved northward into the
24
trough between two high pressure systems.
Hurricane Cindy of September 16-19,1963
Hurricane Cindy (Figure 10) is a good example of how the intensity of a hurricane can playa major role in its progress. Hurricane Cindy is also a good example of a hurricane developing outside the doldrums.
Cindy developed in the northwestern Gulf of Mexico, in a trough of low pressure about 200 miles east-northeast of Brownsville, Texas on the 16th of September. 23
She moved immediately on a slight curve to the northwest. Her winds barely exceeded 80 miles per hour and her lowest pressure recorded was 966 mb (29.41 inV· On the 18th she made a landfall east of Galveston , Texas , barely of hurricane intenSity. After passing inland a short distance Cindy became almost stat ionary, although she was dissipating. By the 19th Cindy's location was less than 100 miles southwest from where she had crossed the Texas coast.
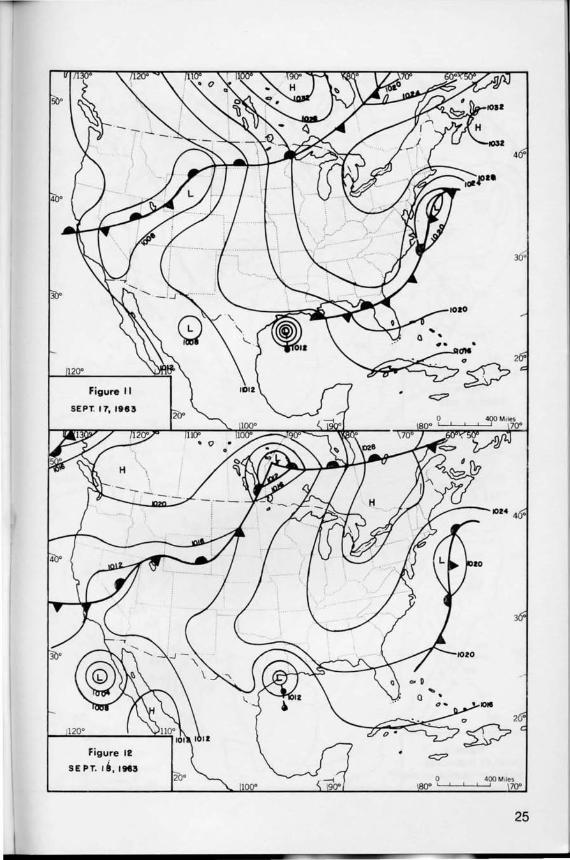
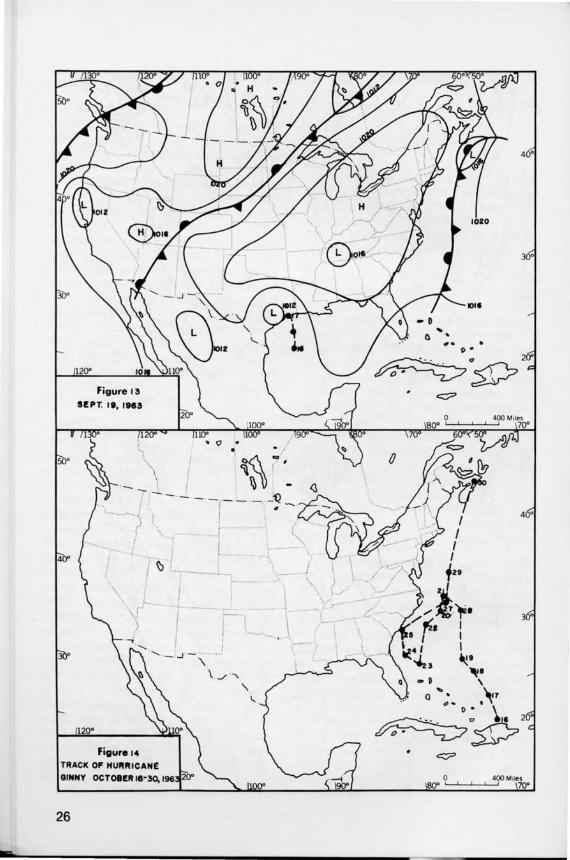
Cindy was a weak hurricane being only two days old when she touched land. It can be seen that Cindy encountered a relatively strong high pressure system that extended over most of the eastern U.S. (Figure 11). In her weak state Cindy could make no headway into the high pressure area. Further weakened over land , the spreading High was able to push Cindy southwestward (Figure 13).
A more intense hurricane would have been able to push farther inland against the High, and would have been able to sustain itself longer than Cindy was able to do.
~ .......... - .. l... , .•.
...... J...
120·
Figure I. TRACK 0 .. HURRICANE
GINNY OCTOI!lt 18-30, 196
26
; ,. \ ~
...
1020
.,. o·
I I I I
in
z 1' ...
" " j . /f I • I
5 I ~41 ~. "u ~ .
.. p \.,
3 •
4 •
o .... ~1' Q •
.... "·0· \ 2
o~ ~~
? I
27
28
Figure 1 B
OCTOBER 22, 1963 o
80" ! !
4 0
4 0
3 0
400 M I1es ! 70"

120"
Figure 19
OCTOBER
Figure 20
OCTOBER 24,1963
4 0
.\" ~: A £?2
4 0
3
400 Miles , 70"
29
30
120·
Figure 12
OCTOBER 26, 1963
I ~ ~ .• () ";. ~7 ~: 2
Vo· ~
4 •
_----1020
.,.1 3
400 MIles ! 700
400
\ ...... . ..... _ ............... :,
1
.......... ; ...................... .
. -J....... i · ......... ·- f .... f-:···· ..... .
120"
1200
Figure 24
OCTOBER 28, 1963
"-\ . ./
. ...... - .....
-D Q
... ,
4 0
4 0
2
400 Miles , 70"
31
32
120·
Figure 26
OCTOBER 30,1963
4 •
3
--'""--1012
... Q ';. ~11 \) .
~O 2
4 •
3
400 MIles ! 70·
1200
Figure 28
SEPT. 2 . 1965
~-..... ' ..
............. ; .................... -
i"" I
4 0
3 0
6~.5
/. ' 7 "-
- O. " , L' .. , ..... _ 'a__ ,, ' ..... ....-"0 "' . • ,- ---~ --..... - 0'-
~p200 c::::?
400 Miles , 700
33
34
Figure 30
SEPT. 4, 196~ o
80" ! !
1011 3
400 MItes ! 70"
120"
120·
Figure 32
SEPT. 7, 196e
35
36
120"
I '" 120·
Figure 34 SEPT, 9, 19615
o 400 Miles 80'" , , 70"
120"
120·
Figure 36
SE PT. II , 19615
3 •
400 Miles I 70"
37
120"
40"
...... · _ L..! -,
Figure
38
\ ",/ ".
"
. _ .... 1 \'"
.-
4 0
... o ". o •
~p2
o 400 Miles 80'" , , 70"
Hurricane Ginny of October 16-30, 1963
Hurricane Ginny developed in the southeastern Bahamas (Figure 14). On the 20th Ginny was reported as a full fledged hurricane. Her highest winds recorded were 105 miles per hour, and her lowest pressure was 981 mb. (28.97 i n.). 25 She didn't strike land until the 30th in Nova Scotia.
Ginny's path was unusual , but not unique. She looped herself twice and had a very long trajectory to the southwest at one point. She had a very erratic track that was often uncomfortably close to land.
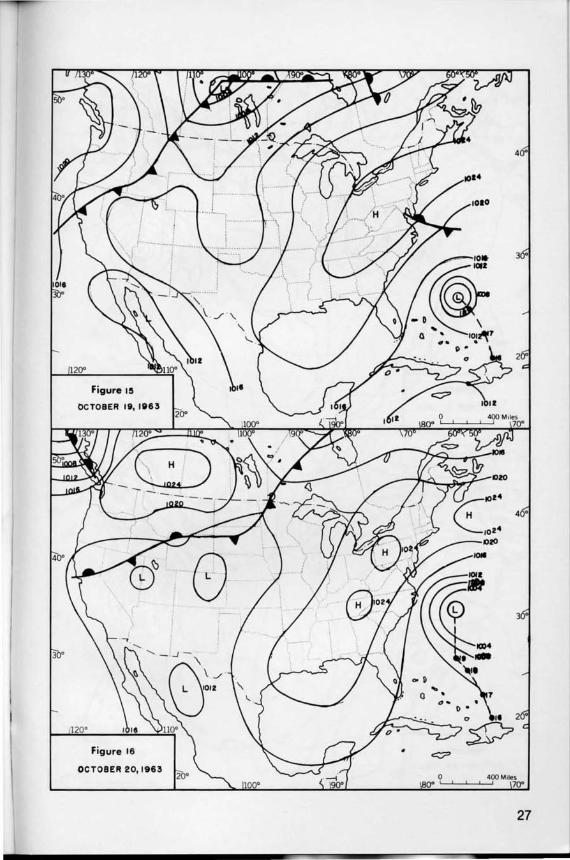
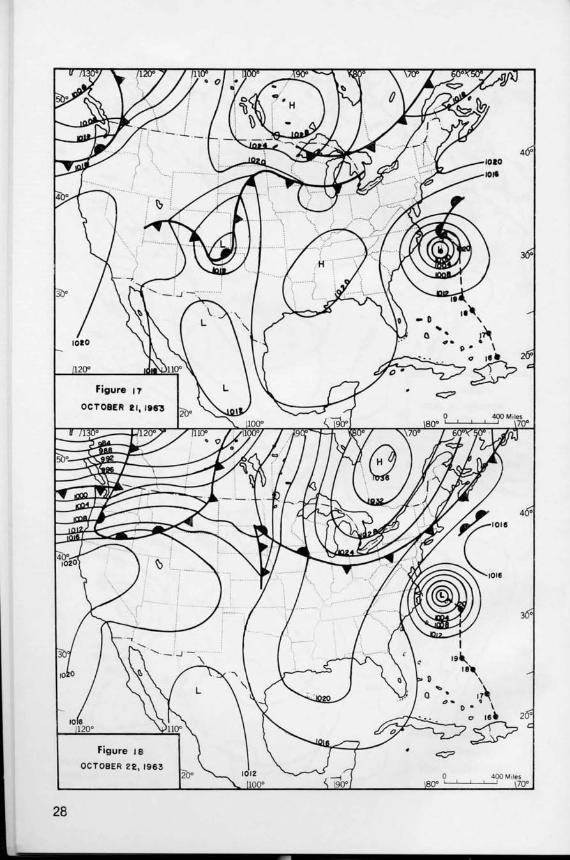
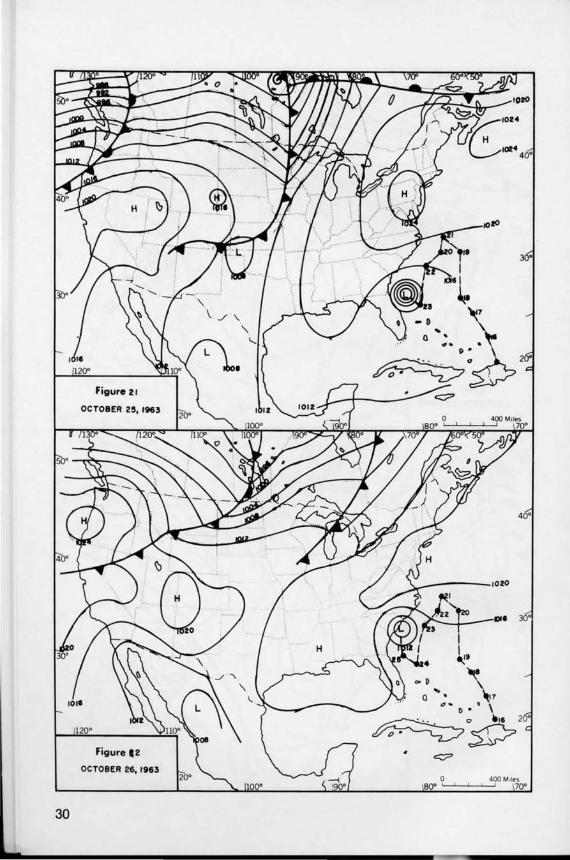
Ginny's initial movement was north from the Bahamas. East of the North Carolina coast she encountered a high pressure north and west of her on the 20th of October (Figure 6). Cut off from any further progress in either of these directions Ginny looped on the 21 st and turned southwestward (Figure 18). On the 23rd she diminished to below hurricane force. With a weakening in intensity she was possible more susceptible to the overflow of the westerlies, and she was turned again toward the north. Passing along the Florida-South Carolina coast Ginny built back up to hurricane intensity on the 24th (Figure 20-22). On the 25th a high pressure cell over the southeastern states pushed Ginny out to sea where on the 27th she began to diminish in intensity for the second time.a By the 28th the high pressure system that had always been north of her was gone and Ginny, picking up intensity, turned northward into the third time (Figure 24). A new high pressure system moving into the central U.S. prevented Ginny from making a landfall anywhere
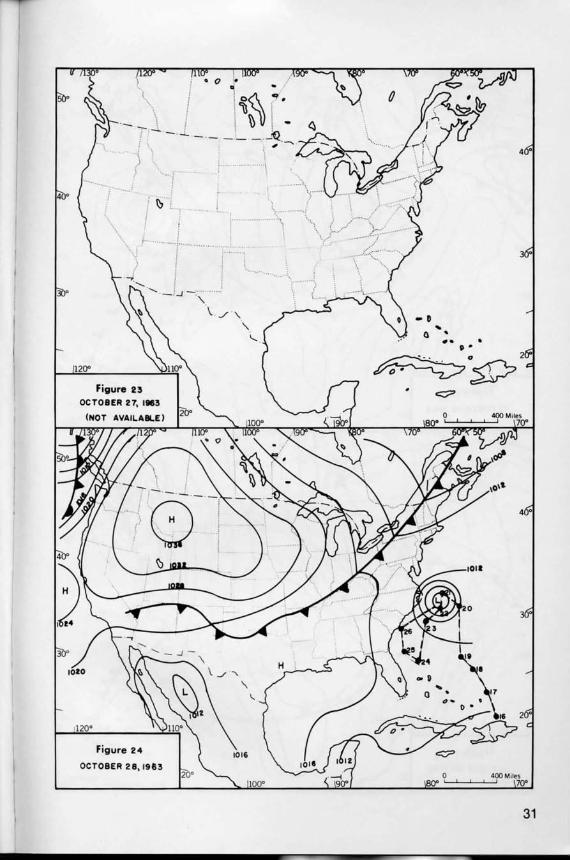
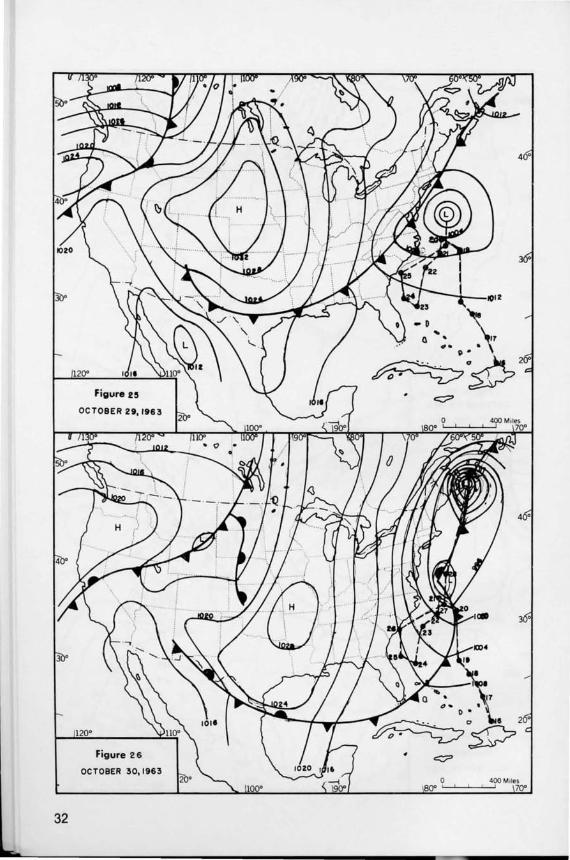
along the northeastern seaboard (Figure 25). On the 29th and 30th Ginny merged with a low pressure trough and moved northward through Nova Scotia (Figure 26).
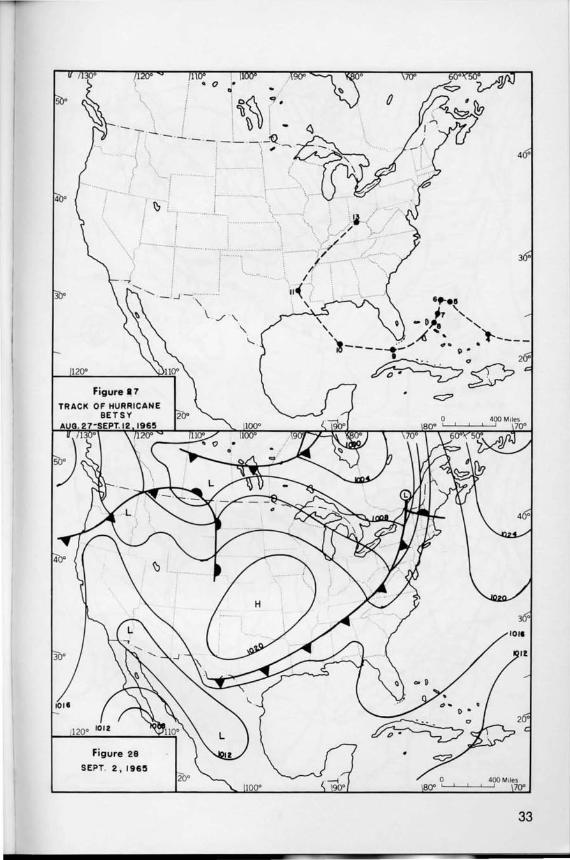
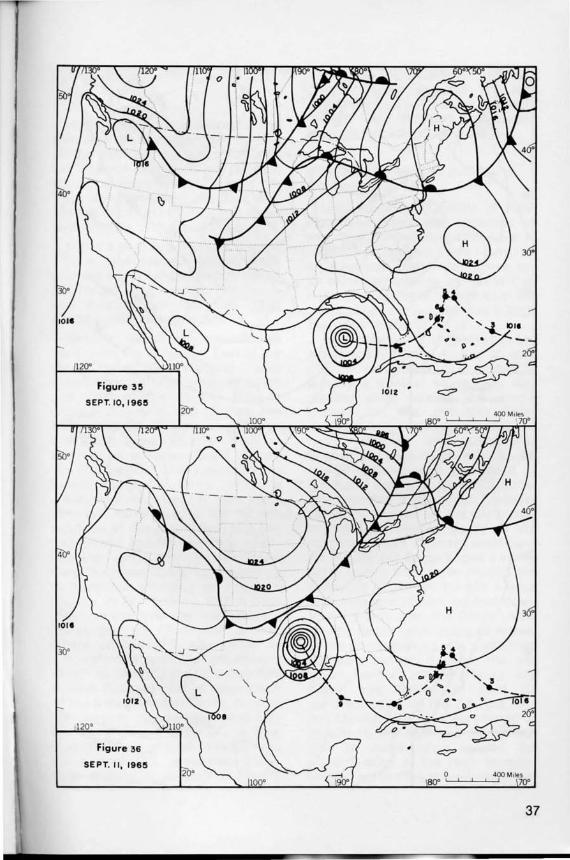
Hurricane Betsy of August 27-September 12, 1965
Until Hurricane Camille of 1969, Hurricane Betsy was regarded as the most devastating hurricane in terms of dollars and cents to ever hit an American coast. Betsy was not an extremely intense hurricane, (her highest winds were measured at 136 miles per hour), but she was a large hurricane in size.27
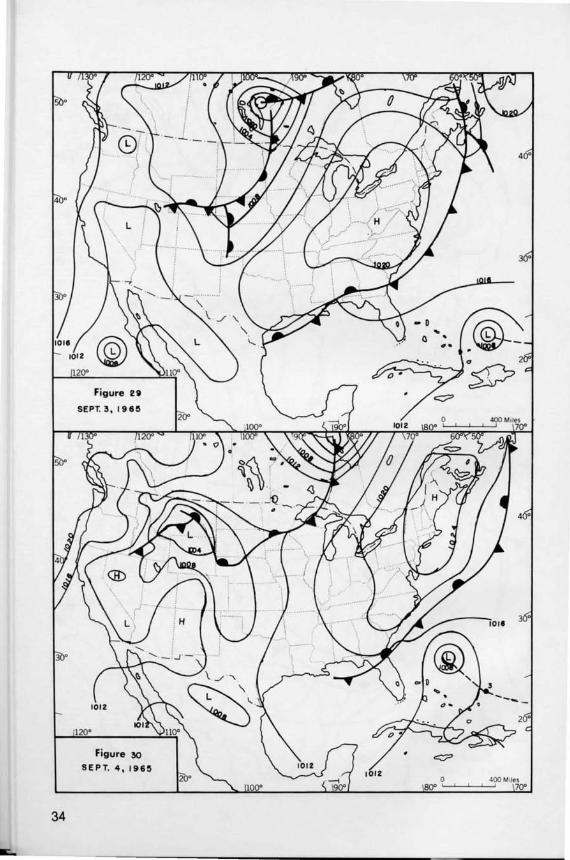
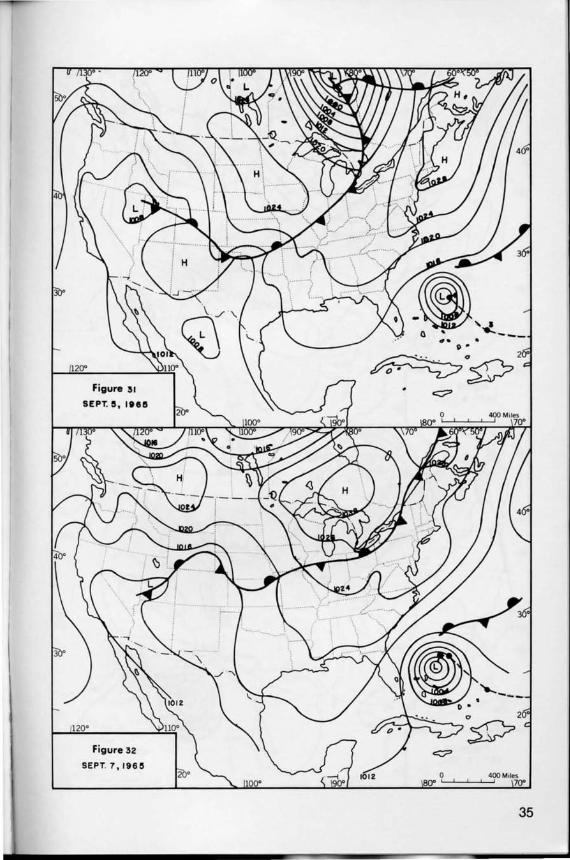
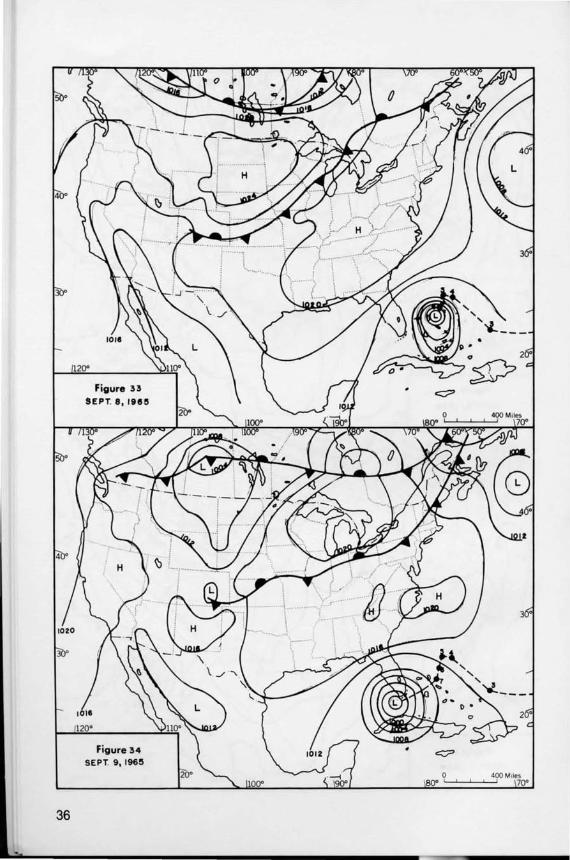
Hurricane Betsy originated in the western Atlantic on August 26 as a tropical disturbance. On the 27th, already a tropical storm, she was moving west toward the Virgin Islands. On the 28th-30th Betsy started a long slow curve toward the north skirting the permanent Subtropical High of the Atlantic. By the 30th Betsy was developed to hurricane intensity. On the 30th-1st of September a large high pressure center developed off the east coast of the U.S., forcing Betsy to dip south and then to move westward. On the 2nd-5th Betsy began a swing north again, moving in behind the retreating High. On the 5th a large high pressure system pushed down from Canada over the Great Lakes forcing Betsy once again to retreat to the southwest.As this same high pressure system spread into the south central states (Figure 32), Betsy was forced to skirt its southern edge on the 7th, 8th, and 9th. On the 9th the High started to recede to the east and Betsy was able to curve north around the western edge of the High to make landfall across the Mississippi River
39

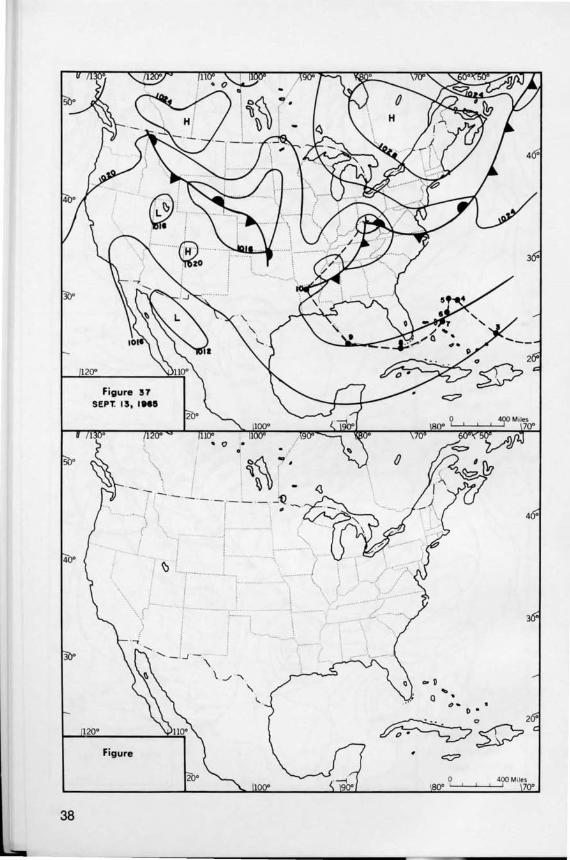
Delta on the 10th (Figure 35). On the 11th, 12th, and 13th Betsy, now overland and extratropical, moved farther north and then curved northeast into a trough between two high pressure systems (Figures 36 and 37) .
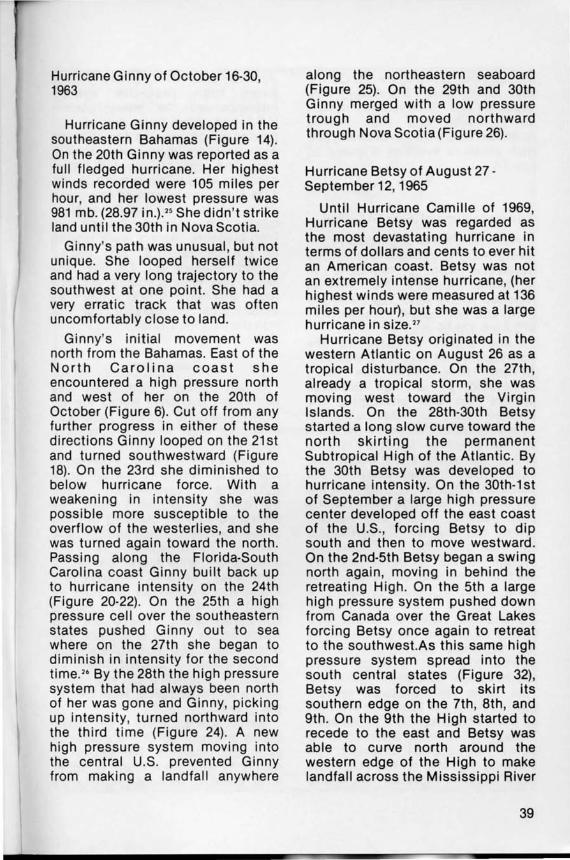
Hurricane Alma of June 5-15, 1966
Hurricane Alma originated in the western Caribbean Sea and quickly developed into a hurricane of moderate intensity. Her highest reported winds were 125 miles per hour, and her lowest pressure was 970.2 mb. (28.65 in.). 28
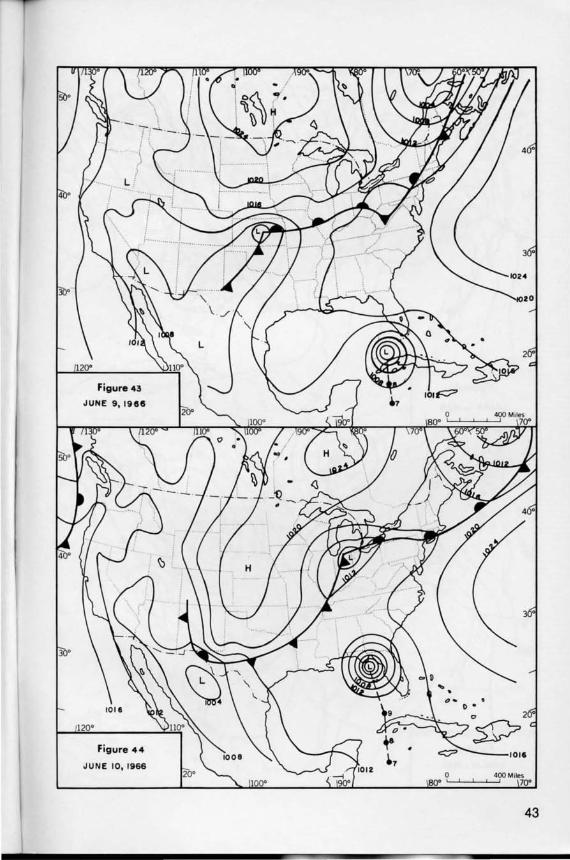
Alma began a curve to the northeast in the western Caribbean. At this time Alma was being dominated by a high pressure system that was enveloping the western Gulf of Mexico. 29 The development of a weak low pressure system over the Mexican interior and its spreading effect might also have gently nudged Alma to the northeast (Figures 41 & 42) . On the 9th of June Hurricane Alma passed over Havana, Cuba, and headed toward the southern tip of Florida. By this time the high pressure system to the north of her was starting to subside to the east, and Alma moved in behind it making a slight recurve to the north (Figure 43) . The 10th found Alma making a strong recurve to the northeast, in the meantime cutting across the panhandle of Florida and southeastern Georgia (Figure 44). This same high pressure system pushed Alma out to sea on the 11 th as it continued to move to the east. Though Alma had diminished to below hurricane strength in crossing the land, on the 11th Alma once again regained hurricane
40
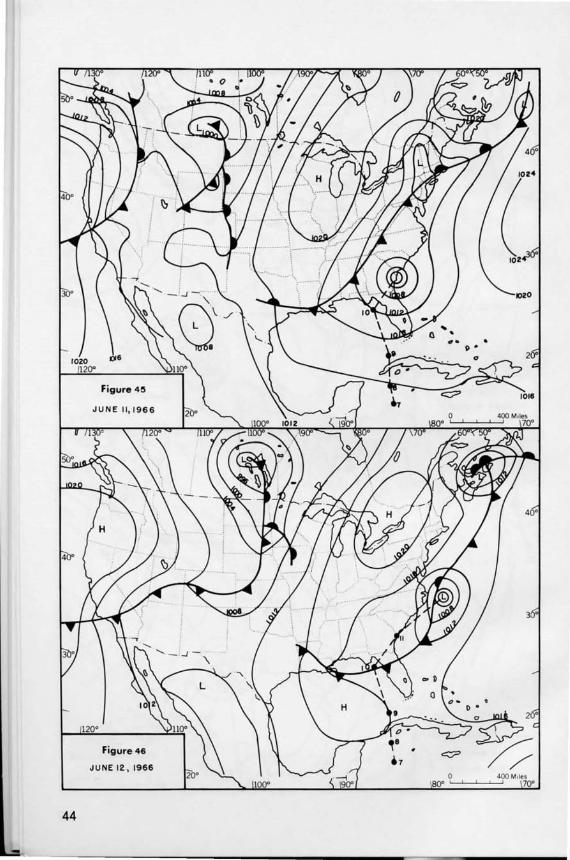
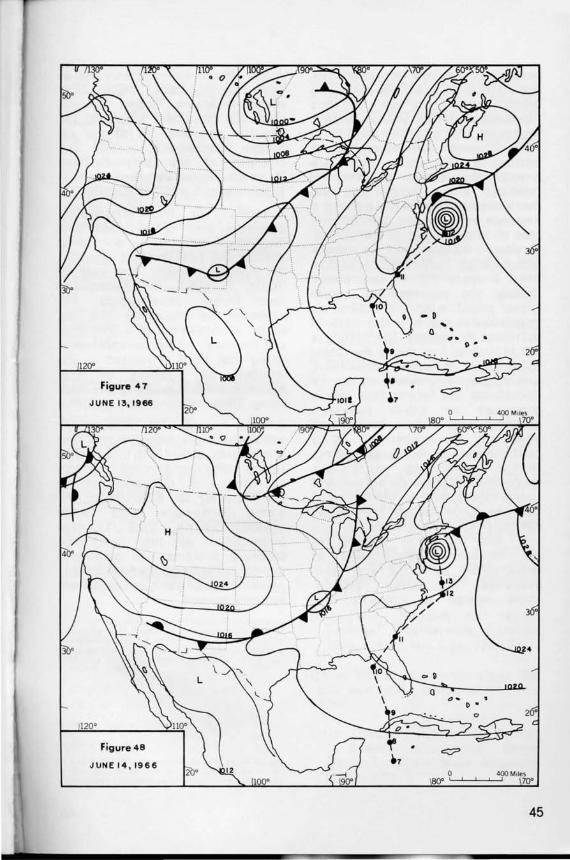
intensity over water. On the 12th the same high pressure system encompassed the entire eastern U.S., and Alma was forced still farther out to sea. On the 13th the high pressure center was moving east and out of the U.S., thus enabling Alma to move north. By the 14th Alma was beginning to weaken again, her northward path began to curve to the northeast as two new high pressure centers were moving to the central U.S. and central Canada (Figure 48). On the 15th these two high pressure systems had pushed Alma, now an extratropical depression, far out into the Atlantic Ocean.
Conclusion
It can be seen from these five hurricanes that their tracks are far from consistent, and that there is an effect of high and low pressure upon hurricane movement. It is not the intent of this paper to disregard the other effects borne upon hurricane movement. Some hurricane movement can be attributed to the "steering device" of the hurricane, which as Dunn and Miller hypothesize is the
atmospheric wind systems in which hurricanes become embedded. 30
These winds obviously can have an effect of pushing and pulling hurricanes along. These are the winds of the Highs and Lows that often direct the hurricane's path around them, or toward them, as Tannehill suggests of the large permanent Subtropical High cell of the Atlantic.
Nevertheless, there are many quirks within a hurricane's general path that cannot be explained readily by wind movement, or upper level steering devices. Hurricanes
' ~\\ I ~\) - - .- .- .- -- - -~' -"
40"
120"
Figure
40"
3 •
120·
Figure 40 TRACK OF HUR"'CANE
ALMA 20. UNE II-III It'6 100·
-0 Q
... , .,.
4 •
I) •
~p2
4 •
o 400 Miles 80'" I I 70"
41
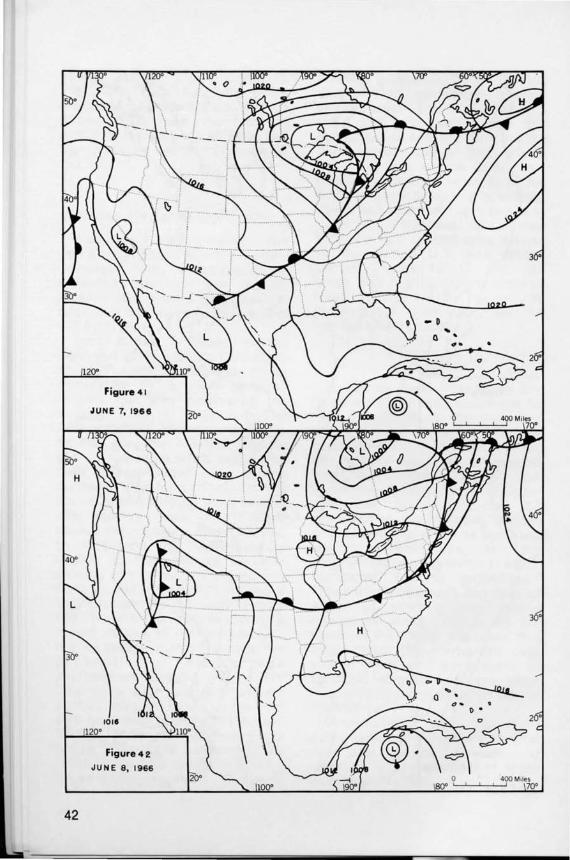
Figure42
JUNE~ 8.~~19_6_6 ______ r: ______ ~~1~O~~ ____ _
42
120·
Figure 44
JUNE 10, 1966 o
80" I
43
44
120·
Figure 46
JUNE 12,1966 o
80" I I
20"
lOIS
400 MIles I 70"
1200
120·
Figure 48
JUNE 14,1966 o
800 ' , 400 MIles
, 700
45

have also moved in directions opposite to that of the prevailing wind movement , or of the predominant Highs and Lows, thus indicating that possible something else influences the movements of hurricanes. Possible there are several other factors, including the intensity and strength of the hurricane itself, since it is a storm, a separate entity of the atmosphere, that at times is not to be denied. Another factor, and a major influence on hurricane tracks has been brought out in this paper, namely the presence of cooler higher pressure air, that acts as an impenetrable block in the path of hurricane movement. The author is not proposing that this is the factor influencing hurricane movement, just as prevailing winds cannot be considered the factor. This article proposes as other research confirms, that it is a factor with which to be concerned. As a controlling, and often overriding , factor affecting hurricane movement the presence of High and Low pressure systems can be one of the long-range factors involved in casting of hurricane tracks.
If this model is applied to the movements and paths of extratropical cyclones and anticyclones, the same relationships related to pressure and
winds must apply. However, as with the hurricane predictability there are several factors that will influence movement whuch as the position and strength of the Jet Stream, permanent location and strength of the Bermuda and Hawaiian Highs, and the incursion of tropical and arctic air masses.
Applied to the extratropical cyclones and anticyclones this illustration provides a method of sharing the relationships affecting the speed, intensity, and path of fronts, of pressure systems and their frontal development. For example, we recognize that the speed of movement of a cold front and the resulting frontal uplift of air along that front is related to the intensity of pressure of high pressure system pushing the front along. These relationships are often
difficult to visualize because the extratropical pressure systems have a large areal extent with interactions taking place along fronts hundreds of miles long. Utilization of the hurricane as an example of the same pressure and wind relationships and frontal interactions as high and low pressure systems can provide a more understandable and enjoyable presentation of basic concepts, and systems models.
46
Jose A. Colon, " Some Aspects of Hurricane Carla (1961 ," In Hurricane Symposium, Publication No. 1 of the American Society for Oceanography, (n.d., n.p.), edited by Sidney A. Stubbs, Table 2, p. 6. The Symposium was hetd October 10·11 , 1966, Houston Texas.
Ibid., Table 1, p. 3
3 Ibid., p. 19.
U.S. Department of Commerce, National Ocean ic and Almospheric Adm inistration, Some Devastating North AI/anile Hurricanes of the 20th Century, (Washington, D.C.: Government Printing Service, 1971), p. 9.
5 Jose A.Colon, op. cll., Table 3, p. 7.
6 Gordon E. Dunn and Banner I. Miller, Allantic Hurri. canes, (Baton Rouge: Louisiana State University Press, 1964), p. 9.
Glenn T. Trewartha, An Introduction to Climate, (4th ed.; New Vorl<: McGraw HIli, Inc. 1968), p. 196.
8 Ibid., p. 223.
9 Ibid., p. 197.
10 Jose A. Colon, op. cit. , p. 2.
11 Ibid.
12 Richard M. DeAngelis, " Enter Camille," Weatherwise, (Boston: American Meteorological Society, 1969), Vol. 22, No. 5, p. 174.
13 Glenn T. Trewartha, op. cit. , p. 69.
14 William L. Donn, Meteorology, (3rd ed.; New Vorl<: McGraw·HIII, Inc., 1965), p. 196.
t5 Ivan Ray Tannehill , B.S., Hurricanes, (Princeton: Princeton University Press, 1938), p. 58
a) Taken from Figure 28, p. 59. Ivan Ray Tannehill , B.S., Hurricanes.
All maps in this paper are of the Polar Stereographic Proiecllon, at a scale of 1 :50.000,000 as used in the Daily Weather Maps.
All maps in this paper are of the Polar Stereographic Projection, at a scale of 1 :50 ,000,000 as used in the Daily Weather Maps.
16 C. L. Jordan, " Climatological Features of the Formation and Tracks of Hurricanes," In Hurricane Symposium, Publication No. 1 of the American SOCiety for Oceanography, (n.p., n.d.), edited by Sidney A. Stubbs, p. 83. The Symposium was held October 10·11 , 1966, Houston, Texas.
17 IbId., p. 85
19 Ibid., p. 85.
19 Ivan Ray Tanneh ill, op. c i t. , p. 46.
20 Ibid .. p. 47.
21 Ivan Tanoehille in Hurricanes skirts the area of the Gulf of Mexico as an area of hurricane orig ination. His hypotheSis of hurricane origination says that hurricanes
originate in the doldrums, and since there are not doldrums In the Gulf of Mexico at any season, to recognize these hurricanes would have destroyed his hypotheSis. Dunn in his book, Allantic Hurricanes, has plotted where all hurricanes between 1901 and 1957 reached hurricane Intensity, but th is does not tell one where these disturbances originated. Some tropical storms have been known to travel hundreds and even thousands of miles before developing to hurricane intensity.
22 Gordon E. Dunn and Banner I. Miller, op. cit. , p. 53.
23 Ibid .. p. 344.
24 Ibid., p. 352.
25 Ibid., p.361 .
26 Weather maps were not available for what should be Figure 23 (October 27) and Figures 38 and 39. Blank maps are included here should readers care to fill in appropriate information from their own files.
27 U.S. Department of Commerce, National Ocean ic and Atmospheric Administration, op. cll. , p. 10.
28 Paul J. Herbert . " The Hurricane Season of 1966," Weatherwise, Vol. 20, No. 1, (Boston: American Meteorological Society, 1967), p. 18.
29 See Footnote 26
30 Gordon E. Dunn and Banner I. Miller, op. cit., p. 182.
Selected References
Colon, Jose A, " Some Aspects of Hurricane Carla (1961) ," Hurricane Symposium , Publication No, 1 of the American Society for Oceanography, N,p" n,d, Edited by Sidney A, Stubbs, The Symposium was held October 10-11, 1966, Houston, Texas,
DeAngelis, Richard M, " Enter Camille," Weatherwise, October, 1969, Vol. 22, No. 5, pp. 173-179.
Donn, William L. Meteorology. 3rd ed. New york: McGraw-Hili , Inc., 1965.
Dunn, Gordon E. and Miller, Banner I. Atlantic Hurricanes. Baton Rouge; LouiSiana State University Press, 1964.
47
Flohn, Hermann. Climate and Weather. Translated by B. V. de G. Walden. New York: McGraw-Hili , Company, 1969.
Herbert, Paul J. " The Hurricane Season of 1966." Weatherwise. February, 1967, Vol. 20, No.1 , pp. 17-20.
Herndon, R. L. " Celia at Aransas Pass. " Weatherwise. August, 1970, Vol. 23, p. 186.
Jordan, C. L. " Climatological Features of the Formation and Tracks of Hurricanes." Hurricane Symposium. Publication No.1 of the American Society of Oceanography. N.p., n.d. Ed ited by Sidney A. Stubbs. The Symposium was held October 10-11, 1966, Houston, Texas.
LaSeur, N.E. " On the Description and Understanding of Hurricane Structure. " Hurricane Symposium. Publication No. 1 of the American Society for Oceanography. N.p., n.d. Edited by Sidney A. Stubbs. The Symposium was held October 10-11 , 1966, Houston, Texas.
Moore, Harry Estill. " . . . and the winds blew." Austin: The Hogg Foundation for Mental Health, University of Texas, 1964.
Moore, Paul L. " Forecasting and Warning Systems." Hurricane Symposium. Publication No. 1 of the American Society for Oceanography. N.p. , n.d. Edited by Sidney A. Stubbs. The
48
Symposium was held October 10-11 , 1966, Houston, Texas.
Niddrie, David L. " Hurricanes." The Geographical Magazine. July, 1964, Vol. 37, No.3, pp. 228-234.
Riehl , Herbert. " On the Origin and Possible Modification of Hurricanes ." Science . September, 1963, Vol. 141 , No. 3585, pp. 1001-1010.
Simpson, R. H. " The Tracking and Observation of Hurricanes. " Hurricane Symposium. Publication No.1 in American Society for Oceanography. N.p. , n.d. Edited by Sidney A. Stubbs. The Symposium was held October 10-11 , 1966, Houston, Texas.
Tannehill , Ivan Ray. Hurricanes. Princeton: Princeton University Press, 1938.
Treadwell , Mattie E. Hurricane Carla. Published in cooperation with The Department of Defense, U.S. Office of Civil Defense. Washington D .C.: U . S Government Printing Office, 1962.
Trewartha, Glenn T. An Introduction to Climate. 4th ed. New York: McGraw-Hili , Inc., 1968.
U.S. Department of Commerce. National Oceanic and Atmospheric Administration. Some Devastating North Atlantic Hurricanes of the 20th Century. Washington , D.C. : U.S . Government Printing Office, 1971.