Embed Size (px)
Citation preview

i
The Influence of Energy Efficient Cultivation
on the Chemical Composition of Algae Biomass
for Biodiesel Production Master’s Thesis in Innovative and Sustainable Chemical Engineering
MIKAEL ÖBERG
Department of Chemical and Biological Engineering
Division of Life Science
CHALMERS UNIVERSITY OF TECHNOLOGY
Gothenburg, Sweden, 2013
Master’s thesis 2013

ii

iii
MASTER’S THESIS IN INNOVATIVE AND SUSTAINABLE CHEMICAL ENGINEERING
The Influence of Energy Efficient Cultivation
on the Chemical Composition of Algae Biomass
for Biodiesel Production
MIKAEL ÖBERG
Department of Chemical and Biological Engineering
Division of Life Science
CHALMERS UNIVERSITY OF TECHNOLOGY
Gothenburg, Sweden 2013

iv
The Influence of Energy Efficient Cultivation on the Chemical Composition of Algae
Biomass for Biodiesel Production
© MIKAEL ÖBERG, 2013
Master’s Thesis 2013
Department of Chemical and Biological Engineering
Division of Life Science
Chalmers University of Technology
SE-412 96 Gothenburg
Sweden
Telephone: + 46 (0)31-772 1000
Chalmers Reproservice
Gothenburg, Sweden 2013

i
The Influence of Energy Efficient Cultivation on the Chemical Composition of Algae
Biomass for Biodiesel Production
Master’s Thesis in Innovative and Sustainable Chemical Engineering
Department of Chemical and Biological Engineering
Division of Life Science
Chalmers University of Technology
Declaration
The research was conducted at SP Technical Research Institute of Sweden, Borås (SP) under
main supervision by the principal investigator Niklas Strömberg and co-supervision by Johan
Engelbrektsson. The research is a part of SP’s Algae Research Program and the SP Biofuel
Competence Platform. All measurements and data processing presented in this report are
made under supervision by senior scientists or performed by qualified technical staff at SP.
The reactor design and principles of operation has been gradually developed SP scientists
since 2011. Algae biomass in this study was cultivated during the period 2011-2013. More
information regarding SP’s Algae Research Program can be found at www.sp.se.
Abstract
The interest in finding renewable alternative to petroleum-based fuel has increased
significantly during the last decades due to global warming and depletion of fossil oil sources.
One of the most promising renewable alternatives to petroleum is microalgal biodiesel.
Microalgae are advantageous because of significantly higher areal productivity compared to
terrestrial plants. However, the main drawback that has hindered the microalgal biodiesel to
establish a rigid market position is the energy consumption in the processing steps, which
currently is larger than the potential output energy. Life cycle analyses show that the
harvesting step may contribute up to 20-30 % of the biomass cost. The overall objective of
this research was to investigate efficient ways of harvesting microalgae as well as growing
them. The primary aim was to study how the chemical composition of microalgae changes in
situation where they are partially degraded and have sedimented to the bottom of the
cultivation pond compared with microalgae harvested in the water column. If the sedimented
material marginally differs in energy content compared to fresh biomass, there is a great
potential in energy savings by harvesting less frequently.
This research project included the determination of the microalgal productivity as well as
characterization of two batches of the microalgal strain Scenedesmus simris002 that were
cultivated in circular, open ponds at SP Technical Research Institute of Sweden, Borås. The
characteristics that were of main interest was to study how the lipid content as well as the
composition of fatty acid methyl esters (FAME) differed between samples harvested at the
bottom and in the water column. In addition to these tests, analyses of the elemental
composition, concentration of chlorophyll and calorific heating values were also examined.
As a complement to the experimental data, theoretical models were constructed to find ways
of supplying carbon dioxide, ensure appropriate mixing and harvesting in order to increase the
annual productivity at the same time as the energy consumption was minimised.
Without any nutrient and pH control, the biomass productivity in cultures was at least 24 % of
the theoretical maximum considering the environmental conditions during the cultivation. The
lipid content ranged between 16-32 wt. %. From the characterization of fatty acid methyl
ester, it was concluded that palmitic acid methyl esters (C16:0-Me) and oleic acid methyl
ester (C18:1-Me) were the most abundant fatty acids in the algae investigated in the first and
second batch, respectively.

ii
The calorific heating value was at most 24.5 MJ kg-1
for the sedimented algae, i.e. comparable
with the energy content of fossil coal (17-27 MJ kg-1
). The experimental study also confirmed
that chlorophyll is the first component that is degraded, but did not have a significant effect on
the energy content of the microalgae.
The theoretical models emphasized the importance of injecting higher concentration of carbon
dioxide in order to improve the productivity as well as decreasing the energy consumption.
Despite somewhat lower amounts of lipids in the samples harvested at the bottom, it would be
advantageous to harvest less frequent by only transferring the sediment to drying ponds.
Key words: Scenedesmus, FAME, sediment, cultivation, harvesting, energy efficiency

ii
Acknowledgement
This research would not have been possible without the support of many people. I would like
to express my gratitude to my supervisors, Niklas Strömberg and Johan Engelbrektsson, who
have enthusiastically guided me through this project and offered invaluable assistance,
experience and support. I would also like to convey thanks to the staff of the Chemistry
department at SP Technical Research Institute of Sweden for all the help during these months.

iii
iv
Table of content
1 Introduction ........................................................................................................................... 1 1.1 Background.................................................................................................................................. 1 1.2 Aims .............................................................................................................................................. 2 1.3 Delimitations ................................................................................................................................ 2
2 Theoretical framework ......................................................................................................... 3 2.1 Algae ............................................................................................................................................. 3
2.1.1 Physical properties ................................................................................................................. 4 2.1.2 Photosynthesis ....................................................................................................................... 4
2.2 Cultivating microalgae ............................................................................................................... 6 2.2.1 Nutrients ................................................................................................................................ 6 2.2.2 Temperature ........................................................................................................................... 6 2.2.3 Mixing systems ...................................................................................................................... 7 2.2.4 Cultivation systems ................................................................................................................ 7
2.2.4.1 Open pond systems ....................................................................................................................... 8 2.2.4.2 Photobioreactors ........................................................................................................................... 9
2.3 Harvesting microalgae ................................................................................................................ 9 2.3.1 Harvesting systems ................................................................................................................ 9
2.3.1.1 Flocculation ................................................................................................................................ 10 2.3.1.2 Filtration ..................................................................................................................................... 10 2.3.1.3 Centrifugation ............................................................................................................................. 11
2.3.2 Dehydration ......................................................................................................................... 11 2.4 Biodiesel production ................................................................................................................. 12
2.4.1 Lipid extraction .................................................................................................................... 12 2.4.2 Transesterification ............................................................................................................... 12 2.4.3 Biodiesel properties ............................................................................................................. 14
2.5 Current situation ....................................................................................................................... 15
3 Materials and methods ........................................................................................................ 16 3.1 Cultivation setup ....................................................................................................................... 16 3.2 Lipid extraction and characterization ..................................................................................... 17 3.3 CHN-analysis ............................................................................................................................. 18 3.4 Chlorophyll ................................................................................................................................ 18 3.5 Heat value and ash content ...................................................................................................... 19 3.6 Energy-efficient cultivation systems ........................................................................................ 19
3.6.1 Aeration ............................................................................................................................... 19 3.6.2 Mixing ................................................................................................................................. 20 3.6.3 Harvesting ............................................................................................................................ 20
4 Results .................................................................................................................................. 21 4.1 Cultivation ................................................................................................................................. 21 4.2 Lipid extraction ......................................................................................................................... 21 4.3 Characterization of fatty acid methyl esters ........................................................................... 22 4.4 CHN-analysis ............................................................................................................................. 24 4.5 Heat value and ash content ...................................................................................................... 25 4.6 Chlorophyll ................................................................................................................................ 26 4.7 Energy-efficient cultivation systems ........................................................................................ 27
4.7.1 Aeration ............................................................................................................................... 27 4.7.2 Paddlewheel ......................................................................................................................... 28 4.7.3 Harvesting ............................................................................................................................ 29 4.7.4 Uncertainty assessment ........................................................................................................ 30
5 Discussion ............................................................................................................................. 32 5.1. Cultivation ................................................................................................................................ 32 5.2 Processing microalgae ............................................................................................................... 33

v
5.3 Energy-efficient cultivation systems ........................................................................................ 34
6 Conclusions .......................................................................................................................... 37
7 Future recommendations .................................................................................................... 37
References ............................................................................................................................... 39
Appendix A. Aeration ............................................................................................................... I
Appendix B. Paddlewheel ....................................................................................................... II
Appendix C. Sensitivity analysis .......................................................................................... III

1
1 Introduction
The energy demanding process of deriving biodiesel from microalgae has halted the break-
through of an environmental friendly alternative to petroleum-based fuels. Critics claim that
until new, less-energy demanding technologies have been developed, microalgal biodiesel
will have a hard time establishing a competitive position on the petroleum market. The goal of
the research is, therefore, to find and develop a sustainable method of culturing and harvesting
microalgae for the production of biodiesel. The research was divided into an experimental
study, where the impact of chemical composition on the quality of biodiesel was studied and a
theoretical part, where new or modified culturing techniques were evaluated in order to
improve energy efficiency.
1.1 Background
Today’s limited supply of fossil fuels together with increasing levels of greenhouse gas
emissions are two major problems around the globe. It has been projected that the energy
demand will increase with 49% by the year 2035, leading to even higher levels of greenhouse
gas emissions.1
Therefore, there has been a growing interest to find and develop alternatives to petroleum-
based fuels. Much of the attention has been directed towards liquid biofuels, especially from
terrestrial plants.1 Currently, there are two generations of bioethanol and one generation of
biodiesel on the market. The first generation of bioethanol and biodiesel uses starch and
sugars (e.g. from corn and sugar cane) and oil (e.g. from palm tree and oilseed rape),
respectively. However, these two fuels have been questioned, mainly due to their competition
with arable land for food crops. Regarding the second generation of bio-ethanol in which
lignocellulosic material is processed into ethanol, the problem with competing land area is
reduced.2 However, the fermentation of lignocellulosic material requires large amount of
enzymes and has been shown to produce undesired byproducts, which interfere with the
fermentation and thus, reduces the yield.3
These drawbacks for the first two generations of biofuels have led attention to production of
biodiesel from algae. An advantage with algae as source of biodiesel is that algae have a high
content of lipids from which FAME biodiesel can be produced and together with a rapid
biomass production, this gives algal biofuel an interesting potential for the future.2 Another
advantage is that algae have a remarkable ability to fix CO2. In comparison with terrestrial
plants, algal CO2-fixability are 10-30 times more efficient due to rapid productivity, which
makes cultivation of algae nearby large emission sites an application of high potential.4,5
The research field of microalgal biodiesel started, however, already in the 1970s as a possible
solution to solve the energy crisis by initiative from the administration of American president
Jimmy Carter. The Aquatic Species Program (ASP), a sub-group to the National Renewable
Energy Laboratory (NREL), investigated the technological and economic potential of deriving
biodiesel from microalgae during an 18-year period (1978-1996). Due to diminishing funding
from the U.S government, ASP decided to close the program in 1996. Nevertheless, ASP
developed a large number of cultivation systems and techniques during this working period
leading to an extensive database of information. During the beginning of the 21st century the
interest of microalgal biodiesel once again started to bloom due to the desire to find new
alternatives within the field of renewable fuels.6
2
Even with the promising potential of microalgae, there are several obstacles that need to be
tackled before there will be an algal biodiesel that can contribute to customers’ demand on a
large scale.2 One major concern is the energy consumption in the processing steps, which is
larger than the energy output. This makes the sustainability concept of this biofuel
questionable. Life cycle analyses have shown that the harvesting step may contribute up to
20-30% of the total biomass cost.7 This is mainly due to removal of large quantities of water,
handling of algal biomass and frequent, energy demanding harvesting methods (e.g. filtration
and centrifugation).8
The overall objective of this research project was to investigate efficient ways of harvesting
microalgae as wells as growing them. The primary aim was to investigate how the chemical
composition of microalgae changes in a situation where they are allowed to sediment to the
bottom of the cultivation pond, subjecting them to partial degradation compared to microalgae
harvested in the water column. There is a potential in energy savings by harvesting less
frequently.
1.2 Aims
The project aims to find differences in lipid content, fatty acid composition and chlorophyll as
well as the chemical composition and calorific heat values between algae harvested at the
bottom and at the surface. Extra focus will be set on finding an efficient method for the lipid
extraction from algal biomass concerning mass and extraction time.
In addition to the experimental part, this project also aims to find energy effective methods of
culturing (e.g. nutrition supply and mixing) as well as harvesting. In combination with the
experimental part, the overall aim is to find an economically feasible method of producing
biodiesel from microalgae.
1.3 Delimitations
The report concerns evaluation of algae grown in energy efficient batch reactors designed
2011 at SP. For this project, only one species within the algal strain Scenedesmus was studied.
The research did not focus on finding an optimal algal growth. The cultivation systems were
not monitored to obtain information about fluctuations in temperature, light, pH and nutrition.
Analyses were performed on two batches with different supply of nutrients. Due to this,
comparison between the samples collected from the bottom and from the surface in the ponds
was only possible within each batch.
Economic consideration, in its monetary value, will not be taken into account regarding
calculations concerning the energy efficiency. Additionally, variables as aeration, supply of
CO2 and harvestings are only considered in the theoretical models calculating the energy
efficiency.

3
2 Theoretical framework
The theoretical framework provided in this report emphasis mainly on algal cultivation and
harvesting as well as applications related to the production of algal biodiesel.
2.1 Algae
Algae were previously regarded as any organism that contained chlorophyll a and a vegetative
body (a thallus) that is not separated into organs. These organisms had also no differentiated
roots, stem and leaves. This broad definition includes cyanobacteria as well, although they are
defined as a prokaryotic organism nowadays. To be a bit more specific, phycologists choose
to refer the term microalgae to the microscopic algae sensu stricto and the photosynthetic
bacteria.9
Microalgae are found all over the world. Most of them are found in marine, brackish and fresh
waters, but they are also able to grow on land on the surface of soils.9 They are characterized
by being greatly adapted to live in a broad variety of environmental conditions.10
The energy
process of microalgae is represented by photosynthesis in which inorganic matter and energy
in the form of light is converted into organic compounds.10,11
The chemical composition of algae (Table 1) varies greatly, not only between different algal
groups but also within specific species and depending on environmental conditions (i.e.
temperature, nutrition, light, pH etc.).12
Table 1. General chemical composition of different algae (% of dry matter).
12
Alga Protein Carbohydrates Lipids
Chlorella pyrenoidosa 48 26 2
Chlorella vulgaris 51-58 12-17 14-22
Dunaliella salina 57 32 6
Scenedesmus obliquus 50-56 10-17 12-14
Scenedesmus dimorphus 8-18 21-52 16-40
Spirulina platensis 46-63 8-14 4-9
There is at present some disagreement about the total number of algal species. However,
scientists estimate the number of species to approximately 50 000.10
For this project, one species within the algal strain
Scenedesmus was used; simris002. This species was
isolated by Simris Alg AB and have close similarities
with Scenedesmus dimorphus. Scenedesmus is a small
(ranging from 5-40 μm in length), autotrophic and non-
motile strain of microalgae. It can easily be recognized
from its oval shape and its tendency to form colonies
consisting of approximately 4 to 32 cells. Within the
strain of Scenedesmus, approximately 200 different
species have been identified making it one of the most
diverse algal species. They are also known to be
cosmopolitan meaning that can be found all over the
globe as long as the conditions are acceptable.13
Figure 1. Colony formation of a
Scenedesmus-strain

4
2.1.1 Physical properties
As described in previous section, microalgal species may include both prokaryotic
(Cyanobacteria) and eukaryotic (green algae) microorganisms.9 However, this report will
focus on green algae and thereby the properties of eukaryotic organisms.
The cell organization of microalgae may be different between species. The most common
types of organization include unicellular, colonial and filamentous structures in which the
unicellular is the most common one when it comes to green algae.9 The motility of microalgae
depends of the presence of flagella. Lacking of flagella, the microalgal cells are non-
motile.9,14
The eukaryotic microalgae possess a membrane-bound nucleus in which the genome is
distributed on chromosomes and nucleolus. For microalgae, the cell contains several
membrane-bound organelles (i.e. chloroplasts, endoplasmic reticulum and Golgi body) that
are dedicated to execute specific functions.9,14
Chloroplast is one of the most important organelle for the survival of an alga. It contains a
series of flattened vesicles. These vesicles, also called thylakoids, contain chlorophyll and
other pigments. Chloroplasts execute the photosynthesis during daylight. Here, the cells use
NADPH and ATP, products of the photosynthesis, to produce organic molecules. These
products include sugars that are transported to non-photosynthetic cells of the organisms to
meet the metabolic needs.9,15
This process will be further described in the next section.
The growth of microalgae depends on several chemical and physical factors. Generally, as
long as there is a presence of nutrients and no inhibitory influences, the organism remains
viable (further described in Section 2.2.). With declining amounts of substrate and energy, or
toxic inhibition, the cell declines and finally dies.9 Sometimes there is also a formation of
spores that may survive and thereby giving rise to new individuals. Regarding the
reproduction, microalgae are most common reproduced asexually, which involves interphase
and mitosis. During the latter, the microalgal cell grows and all cellular components increase
in number. This process will ensure that each daughter cell will receive necessary intracellular
components and DNA. During the mitosis, the mother cell divides into two daughter cells.9,16
2.1.2 Photosynthesis
The photosynthesis, equation (1) is a redox reaction in which terrestrial and aqueous plants
convert carbon dioxide and water into carbohydrates and oxygen, supported by light energy.
This process not only provides sugars for energy production, but is also the major path in
which carbon dioxide returns to the biosphere.16
6CO2 6H2O hv→ C6H12O6 6O2 1
Light energy, however, cannot directly drive this reaction. The reaction seen in equation (1)
can be divided into two sub-processes that occur in all photosynthetic organisms. The first
sub-process is called the light reaction, the light energy is used to a photochemical oxidation
of the water molecule. In this oxidation, two things are accomplished. Firstly, the oxidizing
agent NADP+
is reduced to NADPH and an oxygen molecule is released. Secondly, the light
energy is used to phosphorylate ADP to ATP via a proton gradient. In the second sub-process,
also called the dark reaction, NADPH and ATP produced in the first sub-process reduces
carbon dioxide into carbohydrates.11,16
5
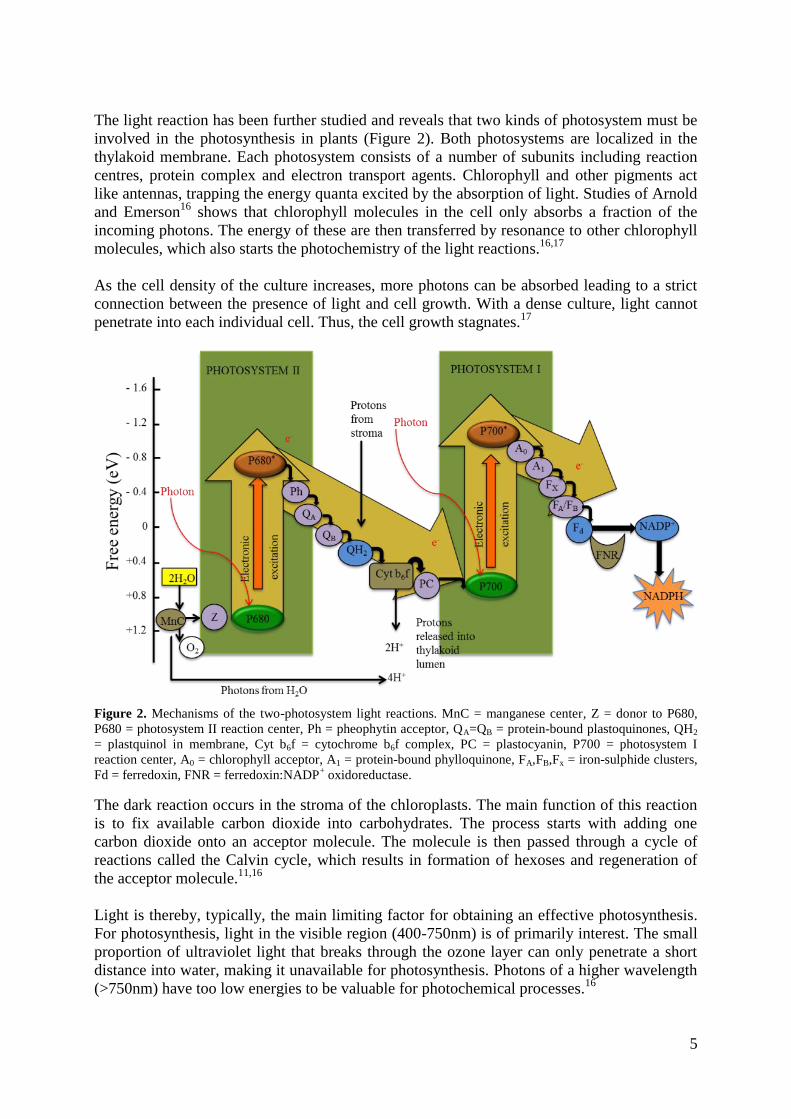
The light reaction has been further studied and reveals that two kinds of photosystem must be
involved in the photosynthesis in plants (Figure 2). Both photosystems are localized in the
thylakoid membrane. Each photosystem consists of a number of subunits including reaction
centres, protein complex and electron transport agents. Chlorophyll and other pigments act
like antennas, trapping the energy quanta excited by the absorption of light. Studies of Arnold
and Emerson16
shows that chlorophyll molecules in the cell only absorbs a fraction of the
incoming photons. The energy of these are then transferred by resonance to other chlorophyll
molecules, which also starts the photochemistry of the light reactions.16,17
As the cell density of the culture increases, more photons can be absorbed leading to a strict
connection between the presence of light and cell growth. With a dense culture, light cannot
penetrate into each individual cell. Thus, the cell growth stagnates.17
Figure 2. Mechanisms of the two-photosystem light reactions. MnC = manganese center, Z = donor to P680,
P680 = photosystem II reaction center, Ph = pheophytin acceptor, QA=QB = protein-bound plastoquinones, QH2
= plastquinol in membrane, Cyt b6f = cytochrome b6f complex, PC = plastocyanin, P700 = photosystem I
reaction center, A0 = chlorophyll acceptor, A1 = protein-bound phylloquinone, FA,FB,Fx = iron-sulphide clusters,
Fd = ferredoxin, FNR = ferredoxin:NADP+ oxidoreductase.
The dark reaction occurs in the stroma of the chloroplasts. The main function of this reaction
is to fix available carbon dioxide into carbohydrates. The process starts with adding one
carbon dioxide onto an acceptor molecule. The molecule is then passed through a cycle of
reactions called the Calvin cycle, which results in formation of hexoses and regeneration of
the acceptor molecule.11,16
Light is thereby, typically, the main limiting factor for obtaining an effective photosynthesis.
For photosynthesis, light in the visible region (400-750nm) is of primarily interest. The small
proportion of ultraviolet light that breaks through the ozone layer can only penetrate a short
distance into water, making it unavailable for photosynthesis. Photons of a higher wavelength
(>750nm) have too low energies to be valuable for photochemical processes.16
6
2.2 Cultivating microalgae
Cultivating microalgae is commonly more expensive than growing terrestrial plants. Except
for the presence of light, there are several other important factors influencing the growth of
microalgae including supply of nutrients, temperature and mixing.19,20
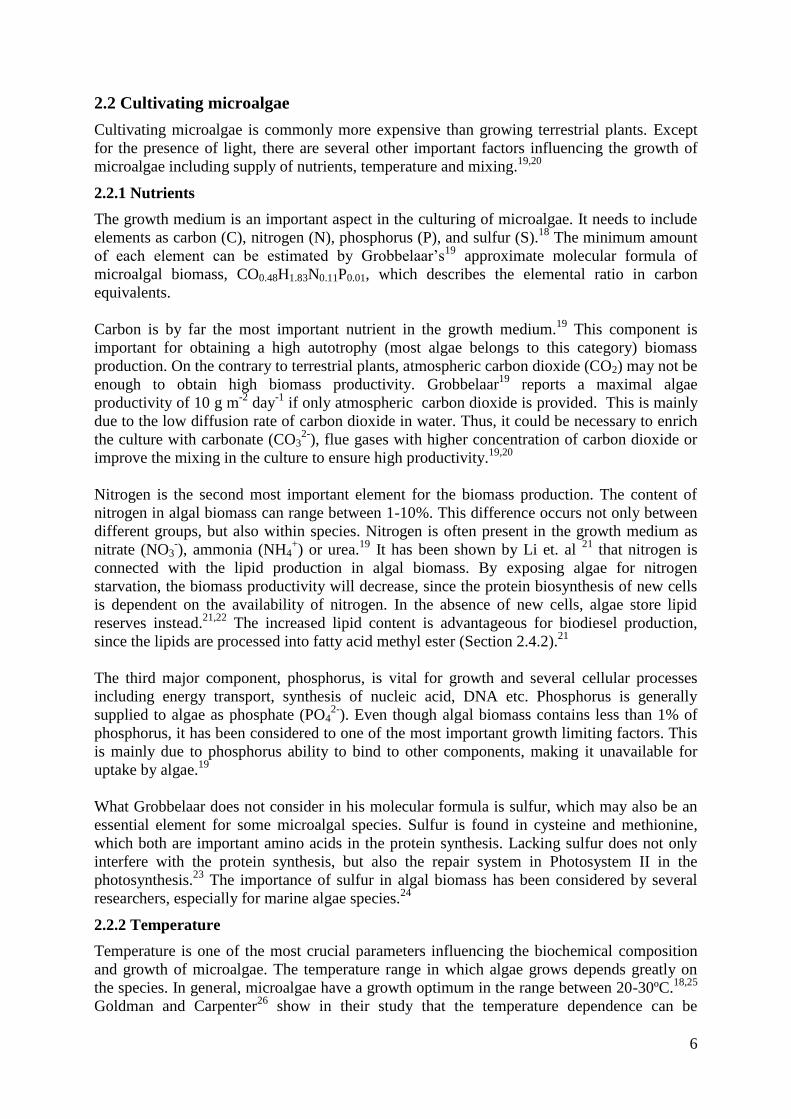
2.2.1 Nutrients
The growth medium is an important aspect in the culturing of microalgae. It needs to include
elements as carbon (C), nitrogen (N), phosphorus (P), and sulfur (S).18
The minimum amount
of each element can be estimated by Grobbelaar’s19
approximate molecular formula of
microalgal biomass, CO0.48H1.83N0.11P0.01, which describes the elemental ratio in carbon
equivalents.
Carbon is by far the most important nutrient in the growth medium.19
This component is
important for obtaining a high autotrophy (most algae belongs to this category) biomass
production. On the contrary to terrestrial plants, atmospheric carbon dioxide (CO2) may not be
enough to obtain high biomass productivity. Grobbelaar19
reports a maximal algae
productivity of 10 g m-2
day-1
if only atmospheric carbon dioxide is provided. This is mainly
due to the low diffusion rate of carbon dioxide in water. Thus, it could be necessary to enrich
the culture with carbonate (CO32-
), flue gases with higher concentration of carbon dioxide or
improve the mixing in the culture to ensure high productivity.19,20
Nitrogen is the second most important element for the biomass production. The content of
nitrogen in algal biomass can range between 1-10%. This difference occurs not only between
different groups, but also within species. Nitrogen is often present in the growth medium as
nitrate (NO3-), ammonia (NH4
+) or urea.
19 It has been shown by Li et. al
21 that nitrogen is
connected with the lipid production in algal biomass. By exposing algae for nitrogen
starvation, the biomass productivity will decrease, since the protein biosynthesis of new cells
is dependent on the availability of nitrogen. In the absence of new cells, algae store lipid
reserves instead.21,22
The increased lipid content is advantageous for biodiesel production,
since the lipids are processed into fatty acid methyl ester (Section 2.4.2).21
The third major component, phosphorus, is vital for growth and several cellular processes
including energy transport, synthesis of nucleic acid, DNA etc. Phosphorus is generally
supplied to algae as phosphate (PO42-
). Even though algal biomass contains less than 1% of
phosphorus, it has been considered to one of the most important growth limiting factors. This
is mainly due to phosphorus ability to bind to other components, making it unavailable for
uptake by algae.19
What Grobbelaar does not consider in his molecular formula is sulfur, which may also be an
essential element for some microalgal species. Sulfur is found in cysteine and methionine,
which both are important amino acids in the protein synthesis. Lacking sulfur does not only
interfere with the protein synthesis, but also the repair system in Photosystem II in the
photosynthesis.23
The importance of sulfur in algal biomass has been considered by several
researchers, especially for marine algae species.24
2.2.2 Temperature
Temperature is one of the most crucial parameters influencing the biochemical composition
and growth of microalgae. The temperature range in which algae grows depends greatly on
the species. In general, microalgae have a growth optimum in the range between 20-30ºC.18,25
Goldman and Carpenter26
show in their study that the temperature dependence can be
7
described with the Arrhenius-equation in which the doubling rate is doubled for every 10 °C,
in the temperature range 5-35 °C.
Studies have also shown that the temperature especially affects the lipid composition in the
algal cell. Temperatures below growth optimum stimulate the production of unsaturated
lipids. This is probably, according to Hu 25
, due to enhance the stability and fluidity of cellular
membranes and thereby protecting the photosynthetic machinery from photoinhibition at low
temperatures. As the temperature increases, saturated lipids starts to dominate the lipid
composition.25,27
The growth temperature has also been assumed to affect the cellular carbon and nitrogen
ratios together with the volume of the cell, which is characterized by an U-shaped response
curve. At an optimal growth temperature, the algal cell has not only the minimum cell size,
but also the lowest content of carbon and nitrogen. For temperature above or below the
optimal level, the cell increases its volume as well as increasing the cellular content of
nitrogen and carbon.25
2.2.3 Mixing systems
In order to ensure high productivity, it is of great importance that each microalgal cell has the
possibility to consume nutrition and light. As the cell density increases, the microalgal cells
prevent each other from the uptake of light energy leading to a decreased photosynthetic
efficiency and thereby also stagnation in cell growth. To overcome this problem, mixing
systems are installed in the cultivations.28
Depending on cultivation system (Section 2.2.4.), different mixing systems can be applied
including paddle wheel and airlift systems. A paddle wheel is a simple mechanical device
providing a force to cause turbulence and thereby ensure sufficient mixing. Such system also
gives a gentle mixing, with low shear forces, which is advantageous for not damaging
flocculated algae. However, a paddlewheel system is fairly large compared to other systems
making it more suitable for large cultivation systems.28
An airlift system is generally much smaller in comparison to paddle wheels. It is
advantageous in smaller cultivation systems due to the potential of combining the supply of
carbon dioxide and mixing. On the other hand, airlift systems generally produce higher shear
forces, which may interfere with autoflocculation.28
2.2.4 Cultivation systems
Microalgae are mainly cultivated in two different ways: open (ponds) or closed
(photobioreactor, PBR) systems. Both these systems have their advantages and disadvantages.
Open pond cultivations are less expensive to operate and maintain in comparison to photo-
bioreactors. On the other hand, photobioreactors are easier to control to obtain better
cultivation conditions.8
Although there are many advantages with PBR listed in Table 2, there is only a small chance
that these will have an impact in the nearest future when it comes to algal cultivation. This is
mainly due to the difficulty in scaling up PBRs as well as high investment and operating
costs.8
8
Table 2. Comparison between open and closed systems.8
Culturing aspects Open systems (pond) Closed systems (PBR)
Contamination risks High Low
Process control Difficult Easy
Species control Difficult Easy
Mixing Very poor Uniform
Population density Low High
Investment cost Low High
Operating cost Low High
Productivity Low High
Scale up Difficult Difficult
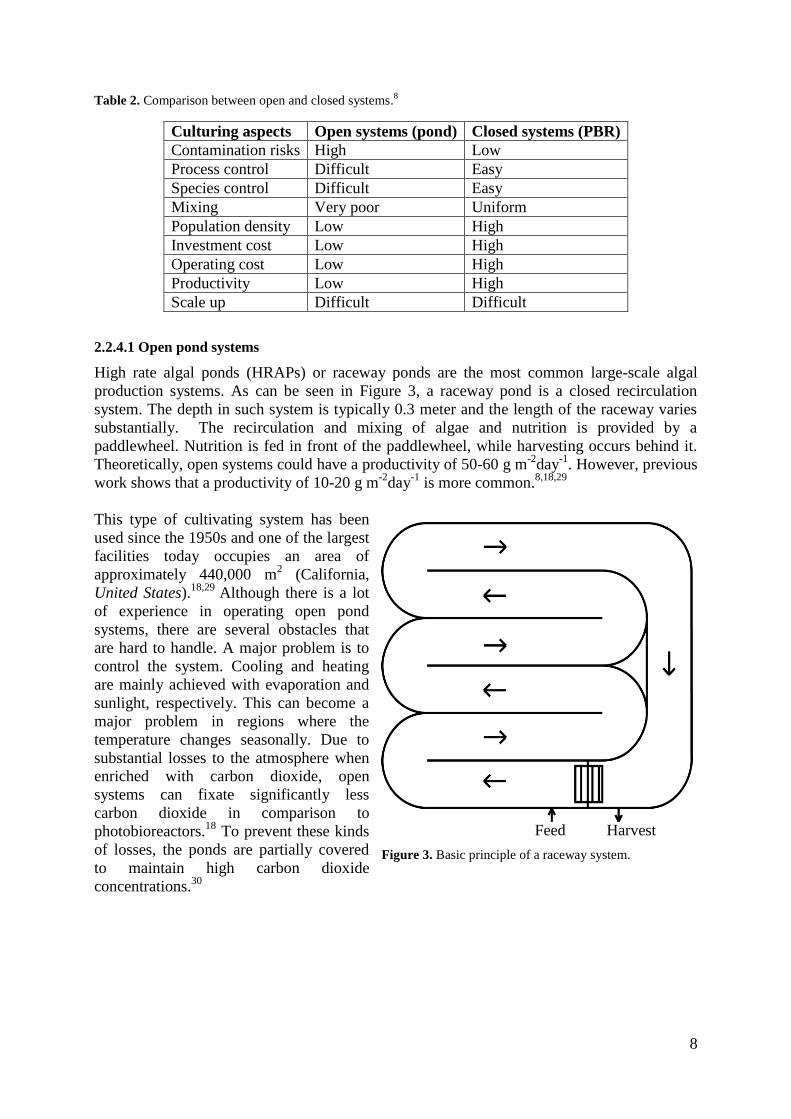
2.2.4.1 Open pond systems
High rate algal ponds (HRAPs) or raceway ponds are the most common large-scale algal
production systems. As can be seen in Figure 3, a raceway pond is a closed recirculation
system. The depth in such system is typically 0.3 meter and the length of the raceway varies
substantially. The recirculation and mixing of algae and nutrition is provided by a
paddlewheel. Nutrition is fed in front of the paddlewheel, while harvesting occurs behind it.
Theoretically, open systems could have a productivity of 50-60 g m-2
day-1
. However, previous
work shows that a productivity of 10-20 g m-2
day-1
is more common.8,18,29
This type of cultivating system has been
used since the 1950s and one of the largest
facilities today occupies an area of
approximately 440,000 m2 (California,
United States).18,29
Although there is a lot
of experience in operating open pond
systems, there are several obstacles that
are hard to handle. A major problem is to
control the system. Cooling and heating
are mainly achieved with evaporation and
sunlight, respectively. This can become a
major problem in regions where the
temperature changes seasonally. Due to
substantial losses to the atmosphere when
enriched with carbon dioxide, open
systems can fixate significantly less
carbon dioxide in comparison to
photobioreactors.18
To prevent these kinds
of losses, the ponds are partially covered
to maintain high carbon dioxide
concentrations.30
Harvest Feed
Figure 3. Basic principle of a raceway system.

9
2.2.4.2 Photobioreactors
Photobioreactors are closed cultivating systems in which solar light is transferred through the
transparent reactor’s walls to the algal cells. Thus, photobioreactors greatly limit the direct
exchange between the environment (gases and contaminants) and the reactor.31
Figure 4. Principle of a photobioreactor construction.
The most common type of photobioreactors is the tubular-shaped reactor. These, typically,
consists in a network of tubes (Figure 4) that is directed horizontally or vertically.
Recirculation within these systems can either be done mechanically or with an airlift system.
The latter allow exchange between the algal culture and needed gaseous nutrients as well as
proper mixing, which is essential to obtain high productivity.32
Another important aspect of obtaining high productivity is the tube diameter. A consequence
of a too wide diameter is that light cannot penetrate through the culture. Thus, the tubes are
generally not wider than 0.1m, which on the other hand may cause high temperatures within
the tubes.18
In comparison to open systems, the productivity in a PBR could be more than 13
times greater. Together with the possibility of having a denser algal culture in the system (~
30 times the concentration obtained in raceways), gives the photobioreactor an interesting
position for future applications. However, the production and operating costs are still too large
to make this system economically feasible.18,32
2.3 Harvesting microalgae
To be able to use the cultivated algae for biodiesel production, the harvesting step is of major
importance. It, generally, consists of one or more solid-liquid separations. The number of
separation steps depends mainly on the cell density in the cultivation and harvesting
technique. Regarding the former, the algal culture is rather diluted (0.5-4 kg m-3
) and
therefore large volumes need to be processed to obtain a proper amount of algal biomass.7,32
2.3.1 Harvesting systems
Currently, there is no universal method for harvesting algal biomass. Depending on the
characteristics of microalgae, e.g. species, size, culture density and the purpose of the final
products, an appropriate harvesting method needs to be chosen.7,29,32
In general, harvesting of
microalgae can be divided into two steps: bulk harvesting and thickening. The former has the
aim of concentrating the broth from the cultivation by a factor of 100-800, resulting in a slurry
that contains 2-7% of algal biomass (dry weight). Common technologies for the bulk
harvesting involve flocculation, floatation or sedimentation. The second step, thickening,
concentrates the slurry and involves technologies such as filtration, centrifugation and
10
ultrasonic aggregation. Thickening is generally more energy demanding compared to bulk
harvesting.3,32
2.3.1.1 Flocculation
As mentioned in previous section, flocculation is typically a preparatory step before the
thickening procedure. Since the algal culture has a low cell density, it is of economic and
technical importance to increase the effective particle size. Thereby, it will be easier to
achieve an efficient harvesting.7,32
Most microalgae carry a negative charge, which prevents them from autoflocculation. Thus, it
is necessary to add ions or polymers with a positive charge to reduce or neutralize the
negative surface charge and induce flocculation. These flocculants should be nontoxic,
inexpensive and effective in low concentration. It is also of importance to choose a flocculant
that does not affect the downstream processing and the final product. Brennan et al.32
and
Molina Grima et al.7 reports ferric chloride (FeCl3), aluminum sulphate (Al2(SO4)3) and ferric
sulphate (Fe2(SO4)3) as suitable flocculants. In addition to these metal salts, there is also a
possibility to use cationic polymers. Positively charged polymers have not only the ability to
neutralize the cell surface, but also linking particles together in a process called bridging. The
efficiency of polymers depends mainly on the ionic strength, size of particle, polymer and
mixing conditions. An influence or a combination of low ionic strength, small particles and
low mixing tends to result in an efficient flocculation.7
For some algal species (e.g. Chlorella), effective flocculation has been achieved by increasing
the pH in the culture. This method is advantageous as there is no need of adding other
flocculants. However, there is a risk that cells lyse and release their intracellular components
for extreme pH values.7
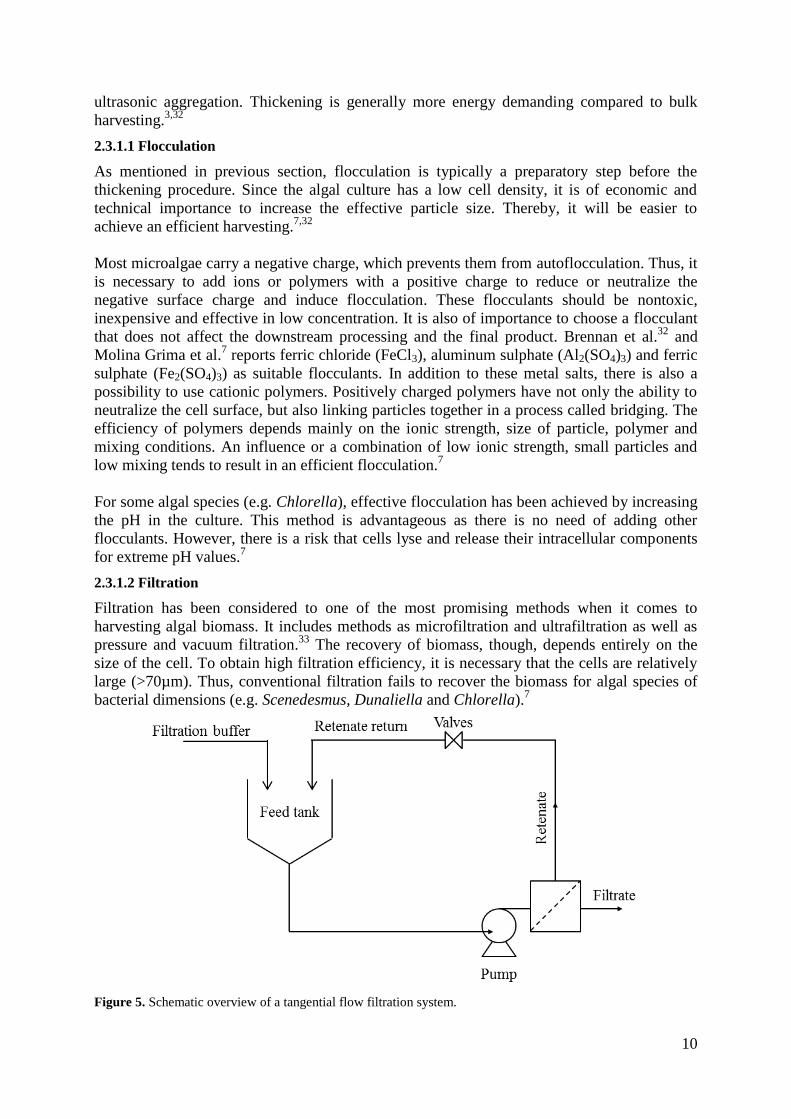
2.3.1.2 Filtration
Filtration has been considered to one of the most promising methods when it comes to
harvesting algal biomass. It includes methods as microfiltration and ultrafiltration as well as
pressure and vacuum filtration.33
The recovery of biomass, though, depends entirely on the
size of the cell. To obtain high filtration efficiency, it is necessary that the cells are relatively
large (>70µm). Thus, conventional filtration fails to recover the biomass for algal species of
bacterial dimensions (e.g. Scenedesmus, Dunaliella and Chlorella).7
Figure 5. Schematic overview of a tangential flow filtration system.

11
The general principle of filtration is to allow the culture broth pass through a filter on which
the solid matter accumulates while the liquid phase passes through. This process proceeds
until the broth is concentrated to an algal paste.33
The pressure applied across the filter and
the pore size are two crucial parameters. The pressure is necessary to maintain a driving force,
while the pore size determines separation efficiency. For larger-sized algae, larger openings in
the filter can be used and thereby allow higher flow rates and lower costs.34
One particular method of filtering that has been shown to be promising, according to Uduman
et al.34
, is tangential flow filtration (TFF). Here, the culture broth flows tangentially across the
membrane (Figure 5). Unlike conventional filtration, the retentate is recirculated across the
membrane. This keeps the algal cells in suspension and minimizes fouling.34
2.3.1.3 Centrifugation
Centrifugation is a common and the most preferred method for harvesting algal biomass. It is
advantageous since most algal species can be concentrated from the culture using this
technique. The separation of solid matter and the liquid phase occurs by applying centrifugal
forces. The efficiency of the separation depends on aspects as particle size, density differences
of the medium and centrifugal speed. Small particles for instance, which need a high
centrifugal speed, have a large impact on separation efficiency.7,33,34
Even if centrifugation is an efficient method for algae harvesting, a main drawback is the
operating cost due to its high energy demand.34
Molina Grima et al.7 investigated different
centrifugal speeds and found a rapid decrease of algal recovery with declining speeds. Due to
high gravitational and shear forces, there is also a risk that the algal cells can be damaged and
thereby releasing their intracellular content.34
2.3.2 Dehydration
The final concentration of the slurry after harvesting contains generally 5-15% of dry solids.
To be able to process the biomass further, it is necessary to dehydrate the slurry into solid
matter. This is of high interest for extracting intracellular components. The type of
dehydration or post harvesting process that should be used depends mainly on the final
product.32,34
For algal biomass in which the oil is the desired end product, there are mainly two available
methods: sun drying and lyophilization. The former is definitely the cheapest dehydration
method. However, it requires large areas and demands long drying time. The second
alternative, lyophilisation, is more expensive but the method is faster and enables a more
efficient extraction of intracellular components compared to sun-drying.32
12
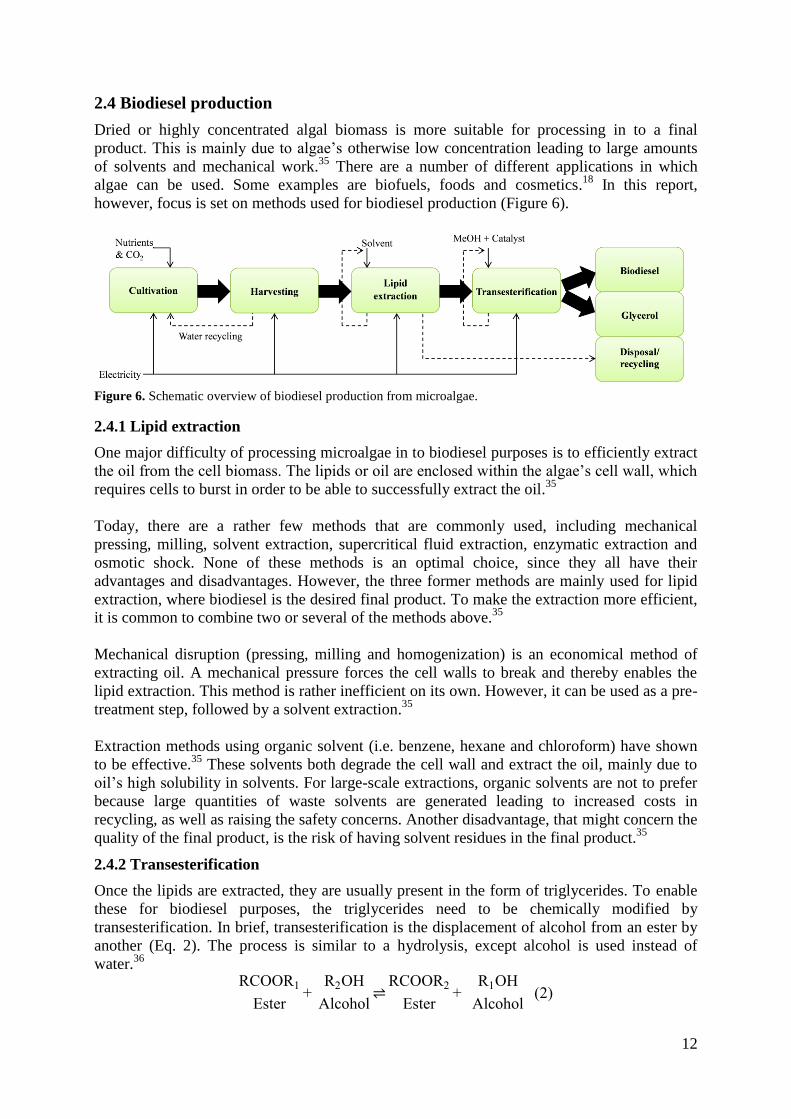
2.4 Biodiesel production
Dried or highly concentrated algal biomass is more suitable for processing in to a final
product. This is mainly due to algae’s otherwise low concentration leading to large amounts
of solvents and mechanical work.35
There are a number of different applications in which
algae can be used. Some examples are biofuels, foods and cosmetics.18
In this report,
however, focus is set on methods used for biodiesel production (Figure 6).
Figure 6. Schematic overview of biodiesel production from microalgae.
2.4.1 Lipid extraction
One major difficulty of processing microalgae in to biodiesel purposes is to efficiently extract
the oil from the cell biomass. The lipids or oil are enclosed within the algae’s cell wall, which
requires cells to burst in order to be able to successfully extract the oil.35
Today, there are a rather few methods that are commonly used, including mechanical
pressing, milling, solvent extraction, supercritical fluid extraction, enzymatic extraction and
osmotic shock. None of these methods is an optimal choice, since they all have their
advantages and disadvantages. However, the three former methods are mainly used for lipid
extraction, where biodiesel is the desired final product. To make the extraction more efficient,
it is common to combine two or several of the methods above.35
Mechanical disruption (pressing, milling and homogenization) is an economical method of
extracting oil. A mechanical pressure forces the cell walls to break and thereby enables the
lipid extraction. This method is rather inefficient on its own. However, it can be used as a pre-
treatment step, followed by a solvent extraction.35
Extraction methods using organic solvent (i.e. benzene, hexane and chloroform) have shown
to be effective.35
These solvents both degrade the cell wall and extract the oil, mainly due to
oil’s high solubility in solvents. For large-scale extractions, organic solvents are not to prefer
because large quantities of waste solvents are generated leading to increased costs in
recycling, as well as raising the safety concerns. Another disadvantage, that might concern the
quality of the final product, is the risk of having solvent residues in the final product.35
2.4.2 Transesterification
Once the lipids are extracted, they are usually present in the form of triglycerides. To enable
these for biodiesel purposes, the triglycerides need to be chemically modified by
transesterification. In brief, transesterification is the displacement of alcohol from an ester by
another (Eq. 2). The process is similar to a hydrolysis, except alcohol is used instead of
water.36
RCOOR1
Ester
R2OH
Alcohol
RCOOR2
Ester
R1OH
Alcohol 2

13
During the transesterification of triglycerides (Figure 7 & 8), the triglycerides are stepwise
broken into diglycerides and monoglycerides. The final products after such transesterification
are fatty acid alkyl esters and glycerol, where the latter is separated.36
As can be seen in Eq. 2, the reaction is reversible. To move the equilibrium towards and
accelerate the formation of esters, an excess of alcohol and presence of a catalyst are used.
There are several different ways of catalyzing the transesterification including acid, alkaline
and enzymatic catalysts, where especially the two former have shown high yields.36
Figure 7. Mechanism for alkaline transesterification. R1, R2 and R3 represent fatty acid carbon chains, while R4
denotes the alkyl group of the alcohol.
For alkaline transesterification (Figure 7), catalysts such as sodium hydroxide (NaOH),
sodium metoxide (NaOMe) and potassium hydroxide (KOH) are typically used.36
The
reaction starts with forming the alkoxide, which in turn makes an attack on the carbonyl
carbon of the triglyceride, resulting in a tetrahedral intermediate. The intermediate reacts with
an alcohol in which an alkoxide ion is formed. The reaction ends with a rearrangement of the
tetrahedral intermediate forming an ester and a diglyceride. Alkaline transesterifications are
usually preformed at 60ºC, a catalyst concentration of 1% to the oil content and an alcohol/oil
molar ratio of 6:1.36
Figure 8. Mechanism for acid transesterification. R1, R2 and R3 represent fatty acid carbon chains, while R4
denotes the alkyl group of the alcohol

14
The reaction of acid transesterifications can be catalyzed by Brownsted acids (e.g.
hydrochloric and sulfuric acids). The mechanism for the acid transesterification can be seen in
Figure 8. In brief, the reaction starts with protonation of the carbonyl group of the ester
resulting in a carbocation. A tetrahedral intermediate is formed after a nucleophilic attack of
the alcohol. Glycerol is eliminated from the intermediate and a new ester is formed at the
same time as the catalyst is regenerated. In this type of transesterification, higher reaction
temperature and higher alcohol/oil molar ratio is needed (normally around 80-100ºC and 30:1,
respectively).36
There are several variables that can affect the efficiency of the transesterification. Two
examples are the content of free fatty acid (FFA) and moisture.37
These factors are
particularly crucial for alkaline transesterification. For high content of FFA (>1%), the
alkaline catalyst will be used for neutralizing the acids instead of shifting the equilibrium
towards formation of fatty acid methyl esters. Presence of water causes soap formation, which
also consumes the catalyst. It has also been shown by Ma et al.37
that a combination of FFA
and water has a synergetic negative effect on the reaction.36-38
2.4.3 Biodiesel properties
The transesterification reaction, described above, converts triglycerides into fatty acid methyl
esters (FAME), which is a core element in biodiesel. The composition of the FAME varies
significantly between different algal species.39
One major concern that affects biodiesel
derived from all algal species is that algae are quite rich in polyunsaturated FAME, in contrast
to other vegetable oils.40
The unsaturated state of FAME affects the stability of the fuel. A
biodiesel with high amount of polyunsaturated FAME is less resistant to oxidation, leading to
complications during storage.18,39,40
Viscosity is another crucial parameter for the performance of the microalgal biodiesel. In
general, the viscosity increases with the chain length and with increasing degree of
saturation.36
The viscosity affects the injection of the fuel into combustion chamber. With
high viscosity there is a great risk of stoppage in the fuel injection system. Thus, it is of great
importance to keep the kinematic viscosity in the same range as for conventional diesel fuel
(1.6-6.0 mm2s
-1).
36,40 On the other hand, biodiesel from all feedstocks is considered to have
excellent lubricity, which can act contrary to the viscosity.41
For biodiesel users, the low-temperature performance is of importance. As with conventional
diesel, operability in cold climates needs to be considered. At low temperatures, there is a risk
of solid formation in the biodiesel causing filter plugging. This leads to engine starvation due
to reduced fuel flow. Poor cold flow properties occur in biodiesel mixtures with long,
saturated FAME. Generally, FAME longer than C12 impairs the cold flow properties.41
Due to the various impacts of the FAME composition, it is hard to define an optimum
composition. However, of these factors mentioned above, the cold flow properties and the
oxidative stability are considered as most important. From this perspective it is possible to say
that microalgal biodiesel should contain low proportions of saturated FAME (minimizing cold
flow problems), low proportions of polyunsaturated FAME (increasing the oxidative stability)
and high proportions of mono-unsaturated FAME.41
For ensuring the customer of a good
quality of biodiesel derived from microalgae, both European and American standards (Table
3) have been constructed.18

15
Table 3. A selection of American and European standards for biodiesel (B100).18
Property U.S (ATSM D6751-08) Europe (EN 14214)
Water and sediment (vol.%, max) 0.05 0.05
Kinematic viscosity, 40°C (mm2
s-1
) 1.9-6.0 3.5-5.0
Polyunsaturated FAME (wt.%, max) - 1.0
Oxidation stability (hours at 110°C, min) 3.0 6.0
Density (kg m-3
) - 860-900
Total contamination (mg kg-1
, max) - 24
Methanol (wt.%, max) 0.20 0.20
2.5 Current situation
Since the first initiative taken by the NREL, United States in the 1970s, microalgal biodiesel
have started to generate interest around the globe. Singh and Gu reports that, in 2010, there
were over 150 companies of ranging size connected to the production of biodiesel from algae.
Many of these are located in Europe and the United States (Figure 9) and possess cultivation
systems that can produce 25-50 m3 biodiesel hectare
-1year
-1. This market drive is much due to
involvement of large companies, such as ExxonMobil Corp and BP Amoco plc. These
companies has contributed with over $600 M to influence the research and production within
the field of microalgal biodiesel.42
These fairly large sums, on the other hand, can be
compared with the approximately 50 billion dollars that were spent in 2006 for oil and gas
explorations around the globe.43
Figure 9. Percentage of region distribution of companies connected to microalgal biodiesel.
42
Market analysts have outlined a bright future of the usage of microalgae. For the biodiesel
production alone, however, current technologies and knowledge are not able to compensate
for the high production costs. Therefore, according to Singh and Gu42
, development of high-
value co-products, such as pigments and polymers are needed to be extracted and sold to
make up for some of the production costs.
USA
78%
Europe
13%
Other
9%

16
3 Materials and methods
The project consisted of the characterization of the microalgal strain Scenedesmus simris002,
which were harvested both at the surface and at the bottom of the cultivation site. The main
focus of the characterization was to determine the amount of lipids and the composition of
fatty acid methyl esters within each sample. In addition, elemental analysis, heat value and
chlorophyll measurements as well as calculations for obtaining energy efficient systems were
examined.
3.1 Cultivation setup
The cultivation site, located at SP Technical Research Institute of Sweden in Borås (N 57°
72’, E 12° 89’ , consisted of two circular, open ponds Figure 10). The ponds had a constant
diameter of 2.1 meter and the water depth was kept at 0.5 meter. Due to the seasonal weather
variations, the ponds were kept in a greenhouse in which the temperature was set to maintain
at least 20 °C.
Figure 10. Illustrative sketch representing the cultivation site at SP Technical Research Institute of Sweden.
To prevent contamination, evaporation and temperature losses, the ponds were covered with
plastic films. The plastic film also prevented the exchange between air and the water surface
meaning that gases were provided by pumping air into the ponds. In order to increase the algal
productivity, lamps and airlift systems were installed, which ran for 16 hours per day. During

17
the remaining eight hours, the algae had sufficient time for photorespiration and auto
flocculation, leading to an automatic thinning of culture density at the surface.
For the two batches in which Scenedesmus simris002 was cultivated, the water height was
kept at 0.5 m. Mixing and the supply of air were provided by a 5 W pump, with a specified
flow rate of 2000 dm3
h-1
air, for each pond. The nutrition was provided batch-wise into the
ponds. For the first batch, 1.75 kg of chicken manure (undefined composition) was spread into
each pond, while in the second batch the same amount of chicken manure was collected in a
fine-mesh bag. Leaching then provided the nutrition in the second case.
The method of harvesting also differed between the batches. For the first batch, the pump and
growth lamps were turned off on February 7th
, 2012. Algae at the surface of the pond were
collected first, and algae located at the bottom after the ponds were drained. The slurry from
the bottom and the samples from the surface was then allowed to dry using the solar heat
within the greenhouse. Once the biomass was dried, it was collected (August 30, 2012) and
stored at room temperature. For the second batch, the pumping system and growth lamps were
turned off on January 13th
, 2013. As for the first batch, algae at the surface were collected.
The algae were allowed to settle and the ponds were thereafter drained. Microalgal slurry
located at the bottom was collected at February 6, 2013. This time, though, it was not
possible, due to time restrictions, to use available heat from the sun. Instead, the microalgae
were filtered and then further dried in ovens at 80-100 °C. The harvestings from the batches
resulted in a total of four samples of which two of each was collected at the surface and the
bottom, respectively.
3.2 Lipid extraction and characterization
The procedure of lipid extraction and its characterization was influenced by the work of
Laurens et al.44
. Dried algal biomass was thoroughly ground using a pestle and mortar to
obtain a meal-like powder. To remove residual moisture, samples were placed in an oven at
105 °C for 80 minutes. Once dried, samples of 2 gram per analysis were weighed into a cotton
cellulose thimble. The thimbles were covered with glass fibre to ensure that the biomass
remained within the thimble.
The thimbles were placed in a regular Soxhlet apparatus in which 210 ml
chloroform/methanol (2:1, v/v) solvent was refluxed at a rate of 5-7 times per hour for
approximately 72 hours, which ensured complete extraction of the algal biomass. The extract
was diluted with chloroform/methanol and transferred to a separation funnel. The extract, at
that time, contained lipids, carbohydrates and protein. Thus, a 0.75% NaCl (aq) was added to
separate lipids from the other components. The biphasic mixture was let to settle overnight.
After settling, the organic phase (the lower phase in the funnel) was emptied into a pre-
weighed round bottom flask. The solvent was removed by using a vacuum rotary evaporator
in a 35 °C water bath. The flasks were then placed in a 40 °C oven for further drying. The
lipid content was determined gravimetrically.
The characterization of the fatty acid composition in the microalgal biomass started with
transferring 20 mg, for each sample, of the extracted lipids into vials and 400 μl of
HCl/methanol (5%, wt/v) was added to start the transesterification. The transesterification was
executed at 80 °C for 80-90 minutes in the presence of 0.1935 g tridecanoic acid (C13:0).
Since it is unlikely to find fatty acids with uneven number of carbon atoms, the tridecanoic
acid is used as an internal standard to determine the concentration of the other fatty acid
methyl esters. To remove unwanted particles and the hydrochloric acid in the sample, n-

18
heptane was added to each sample to obtain a biphasic mixture. 100 μl of the upper phase
(containing the fatty acids) was transferred to a new vial. The characterization then followed
SP Technical Research Institute of Sweden’s protocol for determining fatty acid composition
(originally derived from European Standards EN14103:2003 and EN14105:2009). The
samples were analysed by gas chromatography-mass spectrometer/flame ionization detector
(GC-MS/FID) (Agilent 5975C, VF5HT-column: 30 m x 0.32 mm x 0.10 µm) from which the
total concentration of FAME and the concentration for specific FAME could be expressed in
mass percentage by the equations below
CTotal FAME ∑A AInteral standard
AInternal standard
Internal standard
100 2
CSpecfic FAME ASpecific FAME AInternal standard
AInternal standard
Internal standard
100 3
where A represents the area for the total amount or the specific FAME as well as the area for
the internal standards. W and WInternal standard is the weight (mg sample-1
) for the lipids analysed
and internal standard, respectively.
Due to poor results in a pre-study using alkaline transesterification, suspicions of the presence
of free fatty acids arose. Thus, the samples were also characterized without transesterification.
20 mg of extracted lipids were transferred to vials to which 80 μl of trifluoroacetic acid (TFA)
was added. A biphasic mixture was obtained by adding n-heptane to the samples. 100 μl of
the upper phase was transferred to a new vial and each sample was then processed in the same
way described in the last paragraph.
3.3 CHN-analysis
Dried algal biomass was ground thoroughly and placed in a 105 °C oven to ensure complete
removal of moisture. 100-150 mg of algal biomass was weighed into tin foil cups, which were
vacuum-packed into a pellet. Without the presence of air, moisture and by using tin cups,
there was no development of CO2, H2O or NO when the pellet was combusted. The samples
were analysed in LECO CHN Elemental Analyzer. From the CHN-analysis it was also
possible to estimate the protein content in each sample by multiplying the fraction of nitrogen
with a factor of 6.25.45
3.4 Chlorophyll
The method for the determination of the chlorophyll content in the algal biomass followed the
work of Porra46
. Ground and dried algal biomass was diluted in 80% aqueous acetone to
obtain biomass concentrations ranging from 0.5-0.75 mg ml-1
. Samples covered with
aluminium foil and were kept in a -20 °C freezer for 70-80 hours before analysis. A UV-VIS
absorbance spectrophotometer (Varian Cary 50 Bio) was used for the measurements and
concentrations (μg ml-1
) of chlorophyll a, b and a+b, was calculated from the following three
equations. 46
[Chlorophyll a] 12.22 A663.6- 2.55 A
646.6 4 [Chlorophyll b] 20.31 A646.6
4.91 A663.6 5
[Chlorophyll a b] 17.76 A646.6 7.34 A
663.6 6

19
In equation (4)-(6), Ax represents the absorbance at the x
th wavelength. From these three
equations it was possible to calculate the weight percentage of chlorophyll a, b and a+b in
each sample.
3.5 Heat value and ash content
Dried algal biomass was thoroughly ground using a pestle and a mortar. The samples were
placed in a 105 °C to remove residual moisture. Once dried, samples in the range of 0.5-0.6 g
were tightly packed into a pellet, which was then placed in a steel container. During
combustion, heat is released through the container into a water bath where a calorimeter is
located. The analyses were performed in IKA 5003C.
For measuring the amount of ash in the samples, approximately 25 grams of dried algal
biomass was ground roughly into 1 mm particles. The ground biomass was transferred into a
crucible, weighted and placed in a muffle furnace (Nabertherm N41/H) with following
temperature ramp: 20-250 °C (210 min), 250-550 °C (120 min), 550 °C (360 min) and 550-20
°C. The mass percentage of ash was then determined gravimetrically.
3.6 Energy-efficient cultivation systems
In addition to the data collected from the cultivations, calculations were also made with
variables affecting the energy consumption at the cultivation site at SP Technical Research
Institute of Sweden, Borås. The calculations are based on a system of equal measurements
compared to the ones described in Section 3.1, with the exception of the water depth, which
was set to 0.3 m. Due to malfunction of the pumping system after the second cultivation, new
pumps were acquired with a specified flow rate of 720 dm3 h
-1 and an energy consumption of
8 W, which also will constitute the basis for the energy calculations. The plastic films that
covered the previous cultivations were swapped to a plastic film dome in order to accumulate
more air.
3.6.1 Aeration
To obtain a high productivity, CO2 has already been declared to be an important factor. The
amount of CO2 needed to obtain certain productivity was estimated from the approximate
molecular formula of algae derived by Grobbelaar19
, C100O48H183N11P and from the work of
Tredici 47
in which he outlined possible productivity rates around the globe. From
Grobbelaar’s equation it was possible to determine a ratio between the CO2 needed and the
algal biomass produced equal to 1.88 meaning that approximately 15 kg m-2
year-1
CO2 was
required to ensure an algal biomass productivity of 8 kg m-2
year-1
, theoretically.
From the statement in the paragraph above, calculations were based on two scenarios: (i)
continuous pumping with atmospheric carbon dioxide, (ii) continuous pumping with CO2
concentration ranging from 0.0396 to 25 vol. %. For these scenarios, the ponds were covered,
the pumping system ran for maximum 16 hours per day and ideal mixing was assumed. The
volumetric airflow (dm3
h-1
) needed to supply the algal culture with sufficient amount of CO2
to ensure choosen productivity was calculated with the equation below.
Palgae Malgae nCO2
m,CO2⁄
CCO2 365 16
Apond 7
In equation (7), Palgae represents annual productivity (g m-2
), Malgae the molar mass of
microalgae, obtained from Grobbelaar19
(g mol-1
), nCO2 the number of C in microalgae, Vm,CO2
the molar volume of CO2 (dm3 mol
-1), CCO2 the concentration of CO2 in the supplied air (v/v)

20
and Apond the surface area of the pond. The annual energy consumption (MJ year-1
) of the
pumping system is estimated with following equation.
p
pumpQ
pump air 365 16 3.6⁄
1000 8
in which ppump represents the energy consumption of the pump (W), Qpump the volumetric
airflow (dm3 h
-1) of the pump and Vair the volumetric air flow (dm
3 h
-1) derived from
equation (7).
3.6.2 Mixing
Except from the existing airlift-system (Section 3.6.1.), a paddlewheel system was also
examined. To be able to calculate the energy consumption from the paddlewheel, the
following equation derived from the work of Green 48
was used
9.80
Q H2O(v2n2L
R43
2Kv2
2g)
e 9
in which Q represents the channel flow (m3
s-1
), H2O
the density of water (kg m-3
), v the
velocity of water (m s-1
), n the Manning’s number, L the channel length (m), R the channel
hydraulic radius, K the kinetic loss coefficient for 180° bends, e the efficiency of the paddle
wheel and g the acceleration of gravity (m s-2 . Assumptions were made that Manning’s
number was equal to 0.008, representing a friction coefficient equal to a plastic film and the
kinetic loss coefficient was close the theoretical value of 2.
From equation (9) it was also possible to study how the energy consumption of the paddle
wheel changed due to altered length and mixing velocity.
3.6.3 Harvesting
In order to decrease the energy consumption in the harvesting step for future cultivations,
calculations were made considering the usage of a pond vacuum cleaner. The vacuum cleaner
would be able to pump up the sediment in which most of the algae are located. The algal
slurry will be transferred from the cultivation ponds into empty ponds in which they are
allowed to dry using solar energy. The annual energy consumption of such harvesting system
is described in equation (10)
water Q
v.c ⁄ Pv.c nbatches 3.6
1000 10
in which Vwater represents the amount of water (containing the algal slurry) that is transferred
from the cultivation pond (m3), Qv.c the pumping capacity of the pond vacuum cleaner (m
3 h
-
1), Pv.c the energy consumption of the vacuum cleaner (W) and nbatches is the number of
harvestings per year. The result from equation (10) is based on the assumption that further
drying, in form of solar energy, is free of charge.
21
4 Results
In the section below, the results obtained from this project will be presented. In order to prove
the differences, if any, between the bottom and the surface samples, independent t-tests were
calculated for most of the results using the analytical software tool Statistical Package for the
Social Sciences (SPSS). In the statistical analysis, unless otherwise noted, the null-hypothesis
(H0) stated μMean,surface > μMean,bottom for all analysed samples at a significance level of p=0.05.
The results are presented in their summarized form. For specific results, see proposed
Appendices.
4.1 Cultivation
During the research, the two first cultivations (Scenedesmus simris002) described in Section
3.1 were harvested. The first batch, cultivated between 2011-11-07 and 2012-02-07, yielded
in a total mass of 2400 grams, while the second batch, cultivated during the period 2012-09-
26 and 2013-01-13, gave 670 grams of biomass. The harvested biomass for the first and
second cultivation represents a productivity of 1308 g m-2
year-1
and 308 g m-2
year-1
,
respectively.
4.2 Lipid extraction
In order to obtain enough lipids for the characterization of fatty acids (see Section 4.3), pre-
experiments showed that 2 grams of algal biomass would be needed in the lipid extraction.
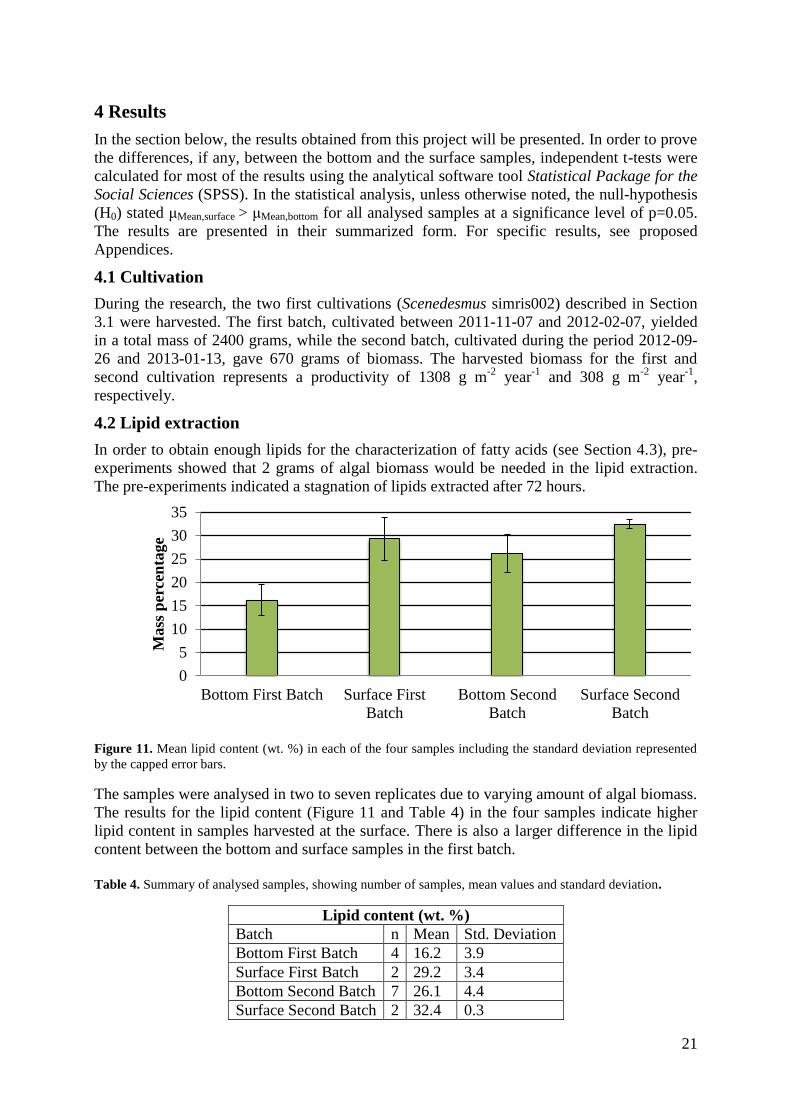
The pre-experiments indicated a stagnation of lipids extracted after 72 hours.
Figure 11. Mean lipid content (wt. %) in each of the four samples including the standard deviation represented
by the capped error bars.
The samples were analysed in two to seven replicates due to varying amount of algal biomass.
The results for the lipid content (Figure 11 and Table 4) in the four samples indicate higher
lipid content in samples harvested at the surface. There is also a larger difference in the lipid
content between the bottom and surface samples in the first batch.
Table 4. Summary of analysed samples, showing number of samples, mean values and standard deviation.
Lipid content (wt. %)
Batch n Mean Std. Deviation
Bottom First Batch 4 16.2 3.9
Surface First Batch 2 29.2 3.4
Bottom Second Batch 7 26.1 4.4
Surface Second Batch 2 32.4 0.3
0
5
10
15
20
25
30
35
Bottom First Batch Surface First
Batch
Bottom Second
Batch
Surface Second
Batch
Mass
per
cen
tage

22
However, due to high values of the standard deviation and few replicates (see Table 4 & 5) in
the first batch, it is not possible to state higher lipid content in the samples of the surface, with
set confidence level. For the second batch, on the other hand, the statistical analysis reveals
that the samples from the surface contain more lipids compared to the bottom samples.
Table 5. Parameters from the statistical analysis using SSPS. Results are based on unequal variances. The
significance level is set to p=0.05.
Lipid content
Batch t df p-value (One-tailed) Mean diff. Std. Error diff.
Bottom First Batch vs.
Surface First Batch 2.7 1.4 0.1 13.1 4.9
Bottom Second Batch vs.
Surface Second Batch 3.8 6.2 0.005 6.3 1.7
4.3 Characterization of fatty acid methyl esters
Due to suspicions of relatively high amounts of free fatty acids in the lipid fraction, the
transesterification was performed using an acid catalyst, hydrochloric acid. The
characterization of fatty acid methyl esters (Figure 12) revealed that palmitic acid methyl ester
(C16:0-Me) dominated for samples in the first batch, while oleic acid methyl esters (C18:1-
Me) dominated in the second batch.
From the statistical analysis (Table 6), it can be confirmed that the surface sample in the
second batch has a significantly higher amount of oleic acid methyl ester. For the first batch
on the other hand, the null hypothesis was modified since the composition in Figure 12
indicates higher content of the palmitic acid methyl ester. Therefore, the null hypothesis for
the first batch is set to H0:μMean,bottom > μMean,surface. By testing the null hypothesis, it is
concluded that there is a significantly higher amount of C16:0 in the bottom samples.
Table 6. Parameters from the statistical analysis using SSPS. Results are based on unequal variances. The
significance level is set to p=0.05.
C16:0-Me
Batch t df p-value (One-tailed) Mean diff. Std. Error diff.
Bottom First Batch vs.
Surface First Batch 4.1 4.6 0.006 18.5 4.6
C18:1-Me
Bottom Second Batch vs.
Surface Second Batch 2.7 6.4 0.017 3.0 1.1
During the characterization, two internal standards (tridecanoic acid and heptadecanoic acid
methyl ester) were used. By adding a known amount of tridecanoic acid (C13:0) before the
transesterification, the fatty acid could be used as an indicator of the recovery was in the
separation steps. After the transesterification and gas chromatography analysis, the amount of
tridecanoic acid was calculated by using the intensity from the heptadecanoic acid methyl
ester (C17:0-Me), which was added after the transesterification. By comparing the theoretical
ratio and the measured ratio between the two internal standards, the combined recovery for
fatty acids through the several separation steps could be estimated to 90 %.

22
Figure 12. Composition of fatty acid methyl esters presented in percentage of total fatty acid methyl esters including the standard deviation represented by the capped error
bars. In addition to the obtained FAME from the microalgae samples, a sample of commercial rapeseed methyl esters (RME) was analysed for comparison.
0
10
20
30
40
50
60
70
80P
erce
nta
ge
of
tota
l fa
tty a
cid
met
hyl
este
rs
Fatty acid methyl ester
Bottom First Batch
Surface First Batch
Bottom Second Batch
Surface Second Batch
RME
23

24
In order to investigate the amount of free fatty acid present in the algal lipids (Table 7),
samples without the transesterification were analysed in duplicates. As for the transesterified
samples above, the first and the second batch have high amounts of palmitic acid methyl
esters and oleic acid methyl esters, respectively. The higher content of free fatty acids in the
bottom samples indicate a degradation of the lipids.
Table 7. Mean amount of free fatty acids present in the algal lipids for each sample.
Sample name
Amount of free fatty
acids (wt. %)
Bottom First Batch 11.5
Surface First Batch 4.2
Bottom Second Batch 9.5
Surface Second Batch 3.1
4.4 CHN-analysis
The CHN-analysis (Figure 13) was performed in duplicates for the four samples. The largest
percentage difference between the samples is in the amount of nitrogen, which stretches
between 4.51 to 8.61 wt. %.
Figure 13. Mean content (wt. %) of carbon, hydrogen and nitrogen for the four samples including the standard
deviation represented by the capped error bars.
The result from the analysis indicates a larger amount of carbon, hydrogen and nitrogen in
samples from the second batch. There is a difficulty, however, to state general trends between
the samples. In the first batch, samples from the surface shows a larger amount of the
elements, while the opposite is present for the second batch.
The nitrogen concentration also reveals a relatively high content of protein in the samples. In
order to obtain the mass percentage of protein in the sample (Table 8), the nitrogen
concentration was multiplied with 6.25 from Kjeldahl’s test .
0
10
20
30
40
50
60
Carbon Hydrogen Nitrogen
Mass
per
cen
tage
Bottom First batch
Surface First Batch
Bottom Second Batch
Surface Second Batch
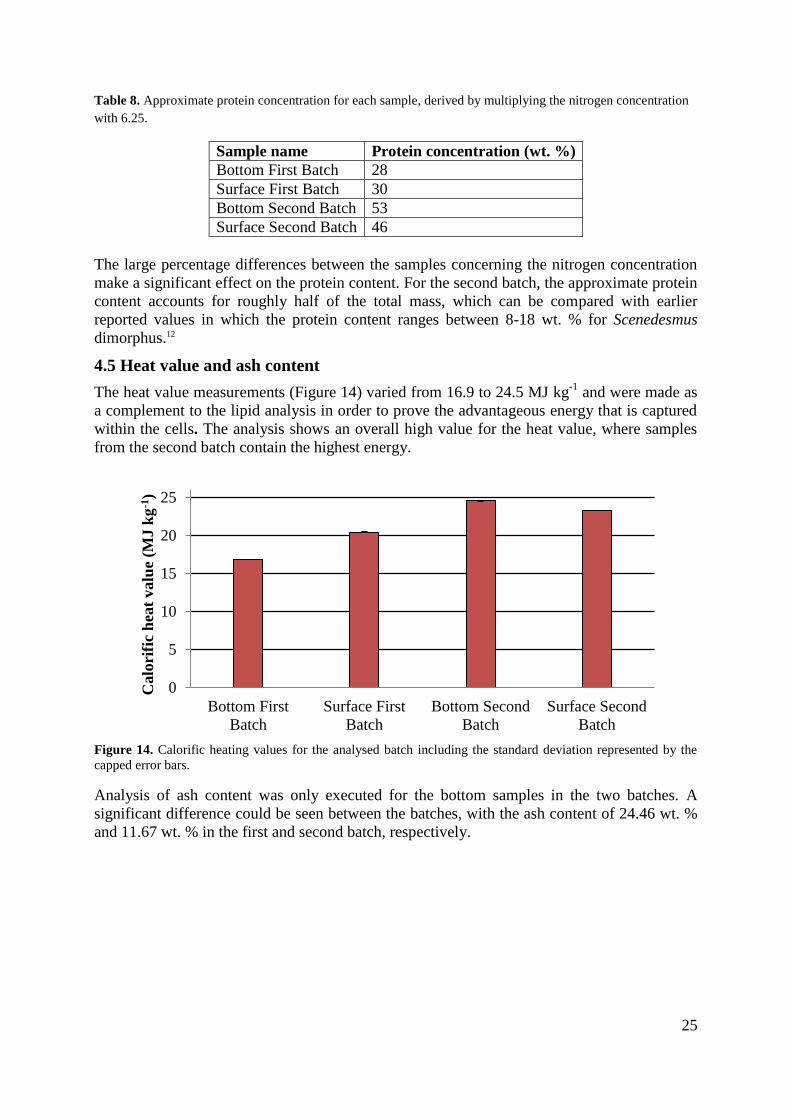
25
Table 8. Approximate protein concentration for each sample, derived by multiplying the nitrogen concentration
with 6.25.
Sample name Protein concentration (wt. %)
Bottom First Batch 28
Surface First Batch 30
Bottom Second Batch 53
Surface Second Batch 46
The large percentage differences between the samples concerning the nitrogen concentration
make a significant effect on the protein content. For the second batch, the approximate protein
content accounts for roughly half of the total mass, which can be compared with earlier
reported values in which the protein content ranges between 8-18 wt. % for Scenedesmus
dimorphus.12
4.5 Heat value and ash content
The heat value measurements (Figure 14) varied from 16.9 to 24.5 MJ kg-1
and were made as
a complement to the lipid analysis in order to prove the advantageous energy that is captured
within the cells. The analysis shows an overall high value for the heat value, where samples
from the second batch contain the highest energy.
Figure 14. Calorific heating values for the analysed batch including the standard deviation represented by the
capped error bars.
Analysis of ash content was only executed for the bottom samples in the two batches. A
significant difference could be seen between the batches, with the ash content of 24.46 wt. %
and 11.67 wt. % in the first and second batch, respectively.
0
5
10
15
20
25
Bottom First
Batch
Surface First
Batch
Bottom Second
Batch
Surface Second
Batch
Calo
rifi
c h
eat
valu
e (M
J k
g-1
)

26
4.6 Chlorophyll
The chlorophyll measurements (Figure 15 & Table 9) indicates a low concentration of
chlorophyll overall, and especially in samples from the first batch in which samples from the
bottom only constitutes 0.05 wt. % of chlorophyll a. The low concentration can be compared
with earlier reported values stretching between 1-2 wt. % chlorophyll a in algae.49
Figure 15. The amount of chlorophyll a, b and a+b expressed in wt. %. The samples were analysed in
quadruples.
Due to very low concentrations of chlorophyll b in the samples, statistical analyses were only
calculated for chlorophyll a (Table 10).
Table 9. Summary of analysed samples showing number of samples, mean values and standard deviation.
Chlorophyll a (wt. %)
Batch N Mean Std. Deviation
Bottom First Batch 4 0.05 0.003
Surface First Batch 4 0.7 0.008
Bottom Second Batch 4 0.3 0.02
Surface Second Batch 4 0.8 0.02
High obtained t-values combined with low standard deviations make it possible to state that
the surface samples in both batches have significantly more chlorophyll compared to the
bottom samples.
Table 10. Parameters from the statistical analysis using SSPS. Results are based on unequal variances. The
significance level is set to p=0.05.
Chlorophyll a
Batch t df p-value (One-tailed) Mean diff. Std. Error diff.
Bottom First Batch vs.
Surface First Batch 153 3.6 0.000 0.7 0.004
Bottom Second Batch vs.
Surface Second Batch 28.8 6 0.000 0.4 0.02
0
0.1
0.2
0.3
0.4
0.5
0.6
0.7
0.8
0.9
1
Chlorophyll a Chlorophyll b Chlorophyll a+b
Mass
per
cen
tage
Bottom First Batch
Surface First Batch
Bottom Second Batch
Surface Second Batch

27
4.7 Energy-efficient cultivation systems
The calculations for the energy efficiency are based on equation (7)-(10) and only concerns
applications related to the cultivation of microalgae. Considerations regarding heating,
nutrients (e.g. nitrogen and phosphorus) and downstream processing of microalgae into a final
product are not taken into account. Unless otherwise noted, the annual productivity is
assumed to be 8 kg g m-2
where the microalgal biomass has a calorific heating value of 24.5
MJ kg-1
and the pond measures an area of 3.64 m2.
4.7.1 Aeration
The variables concerning the aeration (i.e. energy consumption and volumetric airflow) to the
pond are obtained from existing pumping equipment (8 W and 720 dm3 h
-1). Additionally, by
introducing the plastic film dome, the mass transport at surface will increase due to the
continuous presence of CO2. As noted in Section 3.6.1, two scenarios were to be examined. In
the first scenario (Table 11), the cultivation had continuous pumping with atmospheric carbon
dioxide (0.0396 %).
Table 11. The aeration provided by continuous pumping with atmospheric carbon dioxide in order to obtain a
productivity of 8 kg g m-2
year-1
.
Variables
Volumetric airflow (dm3 h
-1) 11470
Annual input energy (MJ) 2680
Annual output energy (MJ) 679
Input energy/output energy (%) 394.9
Table 10 states that a continuous pumping system with atmospheric carbon dioxide would not
be economical feasible since the annual input energy is approximately four times larger than
the output energy. It would not either be possible to operate such scenario, since the
volumetric airflow needed, would imply the usage of more than 15 pumps with the described
pumping characteristics.
Figure 16. Relationship between altered concentration of CO2 and the annual net energy. Theoretical values of
CO2 concentration in flue gases from combustion of natural gas, fuel oil, coal and wood are also noted along the
curve.
-2000
-1750
-1500
-1250
-1000
-750
-500
-250
0
250
500
750
0 5 10 15 20 25
Net
en
ergy (
MJ)
CO2 concentration (vol. %)
Wood Coal Fuel oil Natural gas

28
In order to decrease the annual output energy without risking declined productivity, air with
higher concentrations of CO2 could be injected (second scenario). By increasing the
concentration of carbon dioxide, less volume of air needs to be pumped into the system and
thereby declining the energy consumption. The relation between the concentration of carbon
dioxide and annual net energy (Input-Output) is presented in Figure 16.
A break-even in which the annual input energy is equal to the output energy is obtained when
a carbon dioxide concentration of approximately 0.2 vol. % is injected into the cultivation.
However, to increase the annual net energy higher concentrations of CO2 are necessary for the
described pumping system.
From Figure 16 it is clearly stated that the annual energy consumption, for described aeration
system, decreases as the concentration of CO2 increases. In order to distinguish differences in
pump characteristics and energy consumption due to altered concentration, CO2
concentrations of 1, 5, 10, 15, 20 and 25 vol. % are highlighted in Table 12.
Table 12. Energy consumption for the second scenario using 1, 5, 10, 15, 20 and 25 vol. % CO2 injected
continuously. The annual output energy is based on a productivity of 8 kg m-2
year-1
and calorific heating value
of the biomass equal to 24.5 MJ kg-1
Variables
CO2 concentration (vol. %) 1 5 10 15 20 25
Volumetric airflow (dm3 h
-1) 454 91 45 30 23 18
Annual input energy (MJ) 106 21 11 7 5 4
Input energy/output energy (%) 15.6 3.1 1.6 1 0.8 0.6
By using higher concentrations of CO2 (> 5 vol. %), the annual net energy decreases
significantly. The data provided in Table 11 also reveals advantages in using flue gases from
e.g. fuel oils and wood, as the energy consumption from the aeration system becomes a
negligible part of the potential energy consumption. For specific characteristics, see Appendix
A
What is worth noticing from Figure 16 and Table 12 is that a higher concentration of CO2
leading to a lower flow rate, could imply with the mixing and thereby risking a declined
productivity.
4.7.2 Paddlewheel
The replacement of the existing airlift system with the paddlewheel system described in
Section 3.6.2 could be considered as a potential investment for future cultivations. The model
described in equation (9) estimates the energy consumption needed to maintain a given
velocity around the track due to variables as friction, viscosity, width and length. For a system
of the same measurements as the cultivation ponds in Section 3.1, the energy consumption
(Table 13) is large for current cultivation ponds. Green48
reports a rather low paddlewheel
efficiency (e=0.1), but even with an efficiency equal to 0.3, the energy consumption of the
paddlewheel alone would account for approximately 45 % of the possible output energy.

29
Table 13. Mixing characteristics for the energy consumption of the paddlewheel.
Variables Selected values
Pond area (m2) 3.46
Water depth (m) 0.3
Mixing velocity (m s-1
) 0.2
Paddlewheel efficiency 0.1
Annual input energy (MJ) 1085
Annual output energy (MJ) 679
Input energy/output energy (%) 159.8
Even if the paddlewheel increases the mass transport at the surface, it would still be necessary
to install an aeration system for the supply of carbon dioxide in order to increase the
productivity.
In order to determine a suitable process design in which a paddlewheel can be relevant, the
length of the raceway as well as the mixing velocity was altered (Figure 17). Increased
lengths of the raceway will give rise to increased cultivation area and thereby also increased
annual production of microalgae.
Figure 17. Altered raceway length and mixing velocity in relation to annual net energy. The channel width of
the pond is fixed to 1.2 m.
As can be seen in Figure 17, increased length leads to increased annual net energy, while an
increasing mixing velocity affects the annual net energy negatively. In a process design with
50-meter raceways in which the mixing (v = 0.20 m s-1
) is provided by a paddlewheel, the
energy consumption would still account for approximately 8 % of the potential output energy.
For specific values, see Appendix B.
4.7.3 Harvesting
The usage of the pond vacuum cleaner in Section 3.6.3 is independent on the concentration of
biomass in the cultivation. This is advantageous in comparison to other harvesting methods
(e.g. filtration and centrifugation), which are strictly dependent on the amount of biomass
harvested as well of the culture volume. Thus, the energy consumption of a pond vacuum
cleaner is considered to be constant for every harvest occasion.
However, the energy consumption derived from equation (10) increases linearly with the
number of harvestings. In investigated scenario, 200 dm3 is transferred from the cultivation
-5000
0
5000
10000
15000
20000
25000
0 10 20 30 40 50
Net
en
ergy (
MJ)
Raceway length (m)
0.05 m/s0.10 m/s0.15 m/s0.20 m/s0.25 m/s0.30 m/s
v

30
pond to a drying pond with a flow rate of 3.5 m3 h
-1 by a pond vacuum cleaner (360 W). The
energy consumption for such system increases with approximately 0.075 MJ per harvesting
Based on data provided in the paragraph above combined with an annual production of
approximately 38 kg algal biomass per pond and five harvestings per year, the energy
consumption of the harvesting process would account for approximately 0.01 MJ kg-1
DW
biomass, which can be compared with 1.4 MJ kg-1
and 5.3 MJ kg-1
50,51
for filtration and
centrifugation, respectively.
4.7.4 Uncertainty assessment
Since the obtained data from this research show rather varying results, it was of great interest
to investigate in which range the theoretical models would be applicable due to altered
characteristics.
Based on a continuous aeration system (second scenario in Section 3.6.1) with 10 vol. % CO2
and harvesting performed with the pond vacuum cleaner (five harvestings per year), the
annual net energy from the algae cultivation was examined with altered productivities and
obtained heat values from this research (Figure 18).
Figure 18. The annual net energy’s variation due to altered production. The energy output considers obtained
calorific heat value from this research.
The result in Figure 18 indicates an energy efficient cultivation system, covering 3.46 m2,
even at lower production rates for all analysed heat values. The cultivation system could
handle production rates low as 0.75 kg per year, with a heat value of 24.5 MJ kg-1
, without
risking a negative net energy.
If the algal biomass only is used for biodiesel purposes, the system is more sensitive to lower
production rates since only the lipid content can be used. With a lipid content ranging
between 15-30 wt. % and an assumption of a calorific heating value of 43 MJ kg-1
, equal to
biodiesel 52
, the variation of the annual net energy in relation to altered productivity rates is
shown in Figure 19.
0100200300400500600700800900
1000
0 10 20 30 40
Net
en
ergy (
MJ)
Production (kg/year)
16.9 MJ/kg
20.5 MJ/kg
23.2 MJ/kg
24.5 MJ/kg
Heat value

31
Figure 19. The annual net energy’s variation due to altered productivity rates and lipid content. The energy
output considers a calorific heating value of 43 MJ kg-1
and a lipid content of 15-30 wt. %.
A scenario where only the lipids are used for further process leads to a significantly smaller
value of the annual output energy and thus, a lowered annual net energy. The cultivation
needs to produce at least 2.8 kg biomass (15 wt. % lipids) to remain efficient from an
operational point of view. For specific values, see Appendix C.
-100
0
100
200
300
400
500
0 5 10 15 20 25 30 35
Net
en
ergy (
MJ)
Production (kg/year)
15%
20%
25%
30%
Lipid content

32
5 Discussion
The main purpose of this research was to study the differences, if any, in chemical
composition and physical properties between algal samples harvested from the bottom and
from the surface in the cultivation ponds. From a cultivation point of view, the analysis could
have been further improved by monitoring fluctuations in water temperature, pH and nutrient
consumption. On the other hand, this research gives a good indication how to improve current
technologies in the field of microalgal biodiesel in order to make it more energy-efficient.
5.1. Cultivation
The two cultivations that were harvested for this project yielded in a significantly lower
productivity compared to the 8 kg m-2
year-1
that Tredici47
purposed in his work. By observing
the cultivation setup, it can be stated that light is definitely not the limiting factor since growth
lamps were installed at the cultivation site. The supply of nutrients (nitrogen, potassium,
phosphorus and trace elements) was probably not the cause for the low productivity either.
The amount of nutrients supplied to each pond was based on the statement from Tredici. It
can be questioned, though, how a batch-wise addition of all nutrients affects the algal growth.
Temperature and the supply of CO2, on the other hand, are probably two of the most crucial
factors that have affected the slow growth in the ponds. For the former, temperature was
shown by Goldman and Carpenter26
to be strictly connected with the doubling rate of algae.
The doubling rate was halved for every 10 °C decrease in the range between 10-35 °C. The
temperature in the greenhouse was set to maintain at least 20 °C. However, during the winter
season the heat pump was not able to maintain this temperature. It would be possible to
assume that the average temperature in the greenhouse during the cultivations was around 5-
10 °C leading to a decrease in growth by a factor of 6. Assuming this, a maximum
productivity would then rather be around 1300 g m-2
year-1
.
The pumping system for the analysed batches provided 2000 dm3 h
-1 of air 16 hours per day
for each pond. Since atmospheric carbon dioxide was used, the maximum annual amount of
CO2 that could be provided for uptake by the microalgae was around 9000 grams leading to a
maximal algal productivity of 1328 g m-2
year-1
.
Finally, the maximal productivity is based on a theoretical value meaning that the microalgae
would need to consume all of the supplied CO2 with no losses to the atmosphere. Although
ponds were covered, losses to the atmosphere are probably present. Thus, the reported
productivities from this research, considering these aspects, are at least 24 % of the theoretical
maximum without nutrient control.
Both of the batches were cultivated during the same seasonal time and still differ significantly
in the amount of harvested biomass. A reasonable explanation to this difference is the
different ways of supplying the nutrients. As described in Section 3.1, chicken manure were
spread into the first batch leading to residues at the bottom. Due to slow growth, most of the
nutrients were unused and mixed with the sedimented algae. The measured ash content for the
two bottom samples can be used as an indication for this impurity. The bottom sample in the
first batch had more than twice the amount of ash compared to the second batch. Thus, the
purity of the bottom sample in the first batch can be questioned, which will be further
discussed in the section below.
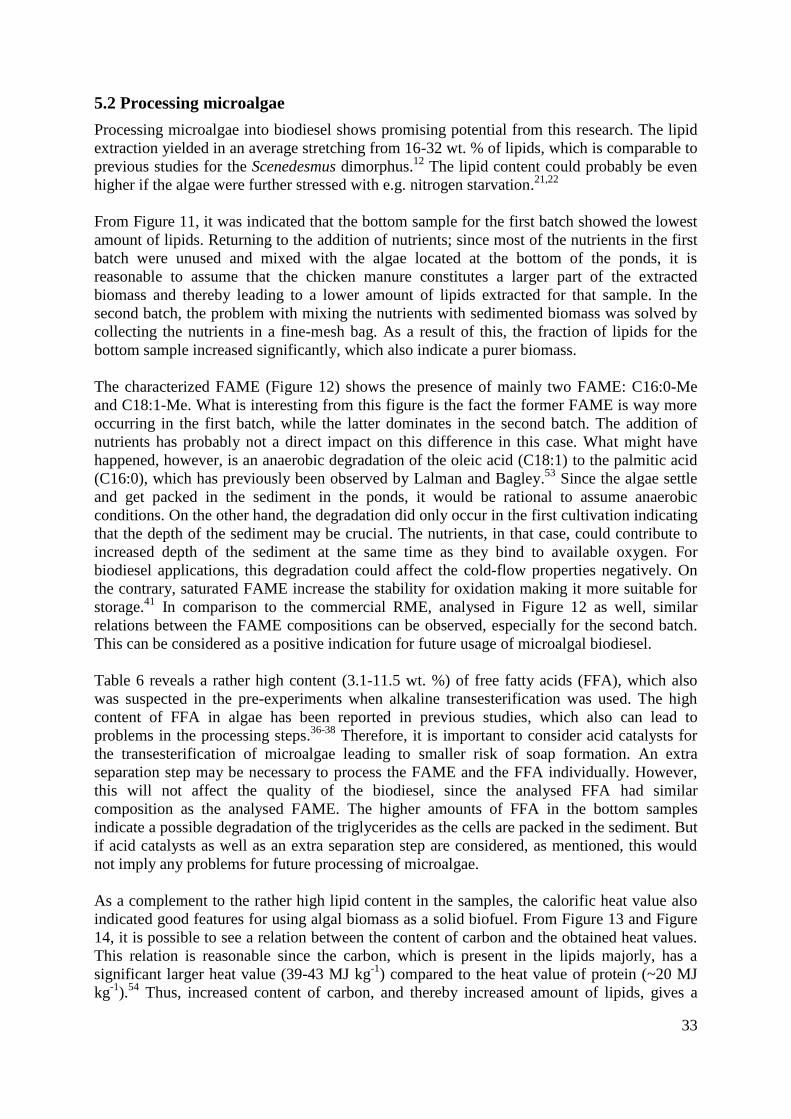
33
5.2 Processing microalgae
Processing microalgae into biodiesel shows promising potential from this research. The lipid
extraction yielded in an average stretching from 16-32 wt. % of lipids, which is comparable to
previous studies for the Scenedesmus dimorphus.12
The lipid content could probably be even
higher if the algae were further stressed with e.g. nitrogen starvation.21,22
From Figure 11, it was indicated that the bottom sample for the first batch showed the lowest
amount of lipids. Returning to the addition of nutrients; since most of the nutrients in the first
batch were unused and mixed with the algae located at the bottom of the ponds, it is
reasonable to assume that the chicken manure constitutes a larger part of the extracted
biomass and thereby leading to a lower amount of lipids extracted for that sample. In the
second batch, the problem with mixing the nutrients with sedimented biomass was solved by
collecting the nutrients in a fine-mesh bag. As a result of this, the fraction of lipids for the
bottom sample increased significantly, which also indicate a purer biomass.
The characterized FAME (Figure 12) shows the presence of mainly two FAME: C16:0-Me
and C18:1-Me. What is interesting from this figure is the fact the former FAME is way more
occurring in the first batch, while the latter dominates in the second batch. The addition of
nutrients has probably not a direct impact on this difference in this case. What might have
happened, however, is an anaerobic degradation of the oleic acid (C18:1) to the palmitic acid
(C16:0), which has previously been observed by Lalman and Bagley.53
Since the algae settle
and get packed in the sediment in the ponds, it would be rational to assume anaerobic
conditions. On the other hand, the degradation did only occur in the first cultivation indicating
that the depth of the sediment may be crucial. The nutrients, in that case, could contribute to
increased depth of the sediment at the same time as they bind to available oxygen. For
biodiesel applications, this degradation could affect the cold-flow properties negatively. On
the contrary, saturated FAME increase the stability for oxidation making it more suitable for
storage.41
In comparison to the commercial RME, analysed in Figure 12 as well, similar
relations between the FAME compositions can be observed, especially for the second batch.
This can be considered as a positive indication for future usage of microalgal biodiesel.
Table 6 reveals a rather high content (3.1-11.5 wt. %) of free fatty acids (FFA), which also
was suspected in the pre-experiments when alkaline transesterification was used. The high
content of FFA in algae has been reported in previous studies, which also can lead to
problems in the processing steps.36-38
Therefore, it is important to consider acid catalysts for
the transesterification of microalgae leading to smaller risk of soap formation. An extra
separation step may be necessary to process the FAME and the FFA individually. However,
this will not affect the quality of the biodiesel, since the analysed FFA had similar
composition as the analysed FAME. The higher amounts of FFA in the bottom samples
indicate a possible degradation of the triglycerides as the cells are packed in the sediment. But
if acid catalysts as well as an extra separation step are considered, as mentioned, this would
not imply any problems for future processing of microalgae.
As a complement to the rather high lipid content in the samples, the calorific heat value also
indicated good features for using algal biomass as a solid biofuel. From Figure 13 and Figure
14, it is possible to see a relation between the content of carbon and the obtained heat values.
This relation is reasonable since the carbon, which is present in the lipids majorly, has a
significant larger heat value (39-43 MJ kg-1
) compared to the heat value of protein (~20 MJ
kg-1
).54
Thus, increased content of carbon, and thereby increased amount of lipids, gives a

34
larger heat value. A maximum measured heat value of 24.5 MJ kg-1
, compared to 19 MJ kg-1
for wooden material55
, also enables the possibility of using algal biomass for combustion
purposes. In such case, the biomass only needs to be dried after cultivation instead of
including several processing steps in order to obtain biodiesel.
The CHN-analysis reveals rather high content of carbon, especially in the second batch, which
correlates well to the measured heat values (Figure 14). Surprisingly, samples from the first
batch show low content of nitrogen. Since it is assumed that the chicken manure constitutes a
major part of the dried biomass in the first batch, it would have been more reasonable to
observe a rather high content of nitrogen in those samples. A possible explanation of this
deviation could be that the nitrogen in the form of nitrate and ammonium has been dissolved
in the water. As the ponds were drained, the nitrogen was withdrawn as well and thus, only
organic matter from the chicken manure is mixed with the algal biomass.
Since the reproduction of algal cells is strictly dependent on nitrogen for the protein
biosynthesis, it is realistic to believe that either too low temperature or the lack of other
nutrients (e.g. sulphur) limits the growth.18,21,23
The approximate protein content (Table 7)
derived from the nitrogen concentration is also rather high compared to previous reported
values.12
Measurements of the chlorophyll content (Figure 15) gives a good indication of the vitality of
the algal cell, which shows extensive degradation of the chlorophyll molecules has occurred
in the first batch. The large difference between the two batches, except from the supply of
nutrients, is the method of dewatering. For the first batch, the biomass was kept outside for
over six months leading to a possible degradation, which is also proven by the low
concentration of chlorophyll. For the samples of the second batch, the dewatering process was
rapid, which seems to retain the chlorophyll molecules within the cell and keeping them from
degradation. What is of importance from this analysis is that even if chlorophyll shows
tendencies of major degradation, it has not affected the lipid content at large.
5.3 Energy-efficient cultivation systems
In order to obtain productivities in the range nearby values of Tredici47
, CO2 needs to be
added. This was clearly shown in Figure 16, where the concentration of CO2 was altered in
relation to the annual net energy of the cultivation system. For this system in particular, a
rapid increase in the annual net energy was obtained for even small changes in the
concentration of CO2. However, to keep increasing the concentration of CO2 would probably
not ensure a more energy-efficient cultivation system. As the supply of CO2, in this case, is a
part of the airflow going into the ponds, an increase of CO2 would decrease the airflow and
thereby risking a proper mixing, which can have just as bad effects as with too low CO2
concentrations.28
There are several variables (e.g. solubility of CO2, pH changes and mixing properties) that are
crucial to consider before choosing one of the aeration system presented in Section 4.7.1.
Previous studies, concerning the aeration systems for algae cultivations, state problems of
having a sufficient water depth in the cultivation pond in order to ensure that most of CO2 is
dissolved. Stepan et al.56
claims that at least 1.5 m in water depth is needed to ensure a
transfer efficiency of 95 % for 15 vol. % CO2 injected at a velocity of 0.2 m s-1
. A cultivation
pond of this depth would both be expensive to build as well as inefficient due to large
volumes in which the solar radiation is unable to reach. By having the plastic film dome,
described in Section 3.6, there will not be any problems of having shallower ponds. The CO2

35
that has not dissolved in the water will accumulate within the dome and will thereby be
available for microalgal uptake. Thus, pH changes and mixing properties are considered to be
more important for the described cultivation system.
Injecting atmospheric carbon dioxide (first scenario in Section 4.7.1) into the cultivation
ponds was clearly unfavourable both from a technical and an economic perspective. The low
concentration of CO2 in atmospheric was discussed in Section 5.1 to be a major problem for
ensuring a high algal productivity. Thus, it seems reasonable to believe that higher
concentrations of CO2 need to be supplied for future cultivations.
From Figure 16 and Table 11, representing the second scenario for the modelling of aeration
systems, it could be confirmed that the concentration of CO2 has a substantial impact on the
energy consumption of the pumping system. From an energy saving perspective, it would be
rational to inject as high concentration of CO2 as possible, which leads to decreased energy
consumption. However, it is important to consider mixing and pH changes. Regarding the
former, Weissman28
emphasises the importance of having rigorous mixing system as the cell
density increases and thus, larger airflow from pump is to prefer. On the other hand, due to
auto-thinning during night time it is possible to assume relatively low cell densities in the
water column making lower airflow a better choice from an energy-saving point of view.
By supplying high concentrations of CO2, there might be a of risk of acidification in the ponds
leading to significant loss in productivity or even cell death.57
Therefore, it would be of great
importance for future cultivations to find a balance between the choice of concentration of
CO2 and mixing.
A further improvement of the aeration system, not presented in this research, would be to
combine one stream of air and one stream of pure CO2 or one of the flue gases presented in
Figure 16. In this way, controlling the streams individually can ensure the supply of CO2 and
proper mixing. The potential risk of inhibition due to too high oxygen concentrations,
mentioned in 5.1, is avoided by pumping the airstream within the pond. A potential drawback
of this idea is the need of having two pumping systems leading to higher investment and
operational costs.
An investment of a paddlewheel (Section 4.7.2) to improve the mixing properties in the
purposed cultivation system would not be advantageous neither from an energy saving nor an
operational point of view. This is mainly due to a low efficiency of the paddlewheel.48
From
equation (10), it was clearly stated that the mixing velocity (Figure 17) also had a large impact
on the energy consumption. But a lower mixing velocity in order to save energy is likely to
impair the mixing properties in the end of the track. However, for prospective upscaling of
pond sizes, the paddle wheel becomes more lucrative. As the pond size increases, kinetic head
losses contribute less to the energy consumption compared to the existing system.
The energy consumption for the harvesting step has for a long time been the bottleneck for
establishing microalgal biodiesel on the fuel market.7 But since this research shows promising
potential for algae that have been partly degraded, there would not be necessary to have
continuous harvesting anymore. Even with a 20 % lower lipid content (Figure 11, second
batch) in the bottom samples, it would still be advantageous from an energy perspective to
harvest few times per year. This is mainly due to the usage of the pond vacuum cleaner,
presented in Section 4.7.3. The vacuum cleaner only withdraws small volumes of water that
contains the majority of the algae in the pond and it is not dependent on the harvested mass as

36
well as it only consumes a fraction of the energy compared to conventional harvesting
methods (e.g. filtration and centrifugation).

37
6 Conclusions
Without any nutrient and pH control the biomass productivity in cultures was at least 24 % of
the theoretical maximum considering the environmental conditions during the cultivation.47
From this research it can be concluded that there are differences between the biomass
harvested at the bottom and in the water column. The differences, however, are varying
among the analysed characteristics. For the lipid content, which was of greatest interest in this
research, samples collected in the water column showed 1.8 and 1.2 times higher lipid content
in the first and second batch, respectively. The significant difference in lipid content for the
first batch could be explained large amount of nutrients mixed with the biomass. However,
the energy content in the sediment compared to biomass in the water column indicated no or
marginal energy losses, thus indicating chemical transformation rather than biomass
degradation.
The composition of fatty acid methyl esters shows a possible anaerobic degradation of the
oleic acid methyl esters into palmitic acid methyl esters in the first batch, which indicates that
the depth of the sediment, supply of nutrients and time of dewatering are critical parameter for
the quality of biodiesel. In the second batch there is no clear sign of degradation of the fatty
acid methyl esters. The composition of this batch is similar to commercial biodiesel from
rapeseeds (RME).
This research also concludes the importance of supplying CO2 and maintaining optimal
cultivation temperature in order to ensure a high productivity. By supplying carbon dioxide
into the cultivation ponds higher productivity rates as well as lowered energy consumption
could be obtained. From an energy saving perspective, carbon dioxide concentration higher
than 10 % should be supplied by a continuous pumping system. Such aeration system would
supply sufficient amount of the carbon source to ensure higher productivities and account for
less than 2 % of the potential output energy.
Although lower amounts of lipids in the samples harvested from the bottom, a cultivation
setup in which microalgae are allowed to settle would still be advantageous from an energy
saving perspective. Fewer harvestings per year leads directly to decreased energy
consumption and by using a pond vacuum cleaner less water needs to be evaporated as well as
this harvesting method is not dependent on the algal productivity. Compared to filtration and
centrifugation, the pond vacuum cleaner consumes 140-530 times less energy.
7 Future recommendations
The results from this research shows promising potential for a future use of microalgae as a
source to renewable fuels. In order to verify and improve purposed cultivation method, more
cultivations and analyses needs to be done. Tests of main interest should focus on supplying
the cultivation ponds with carbon dioxide in order to examine the productivity rates. In
connection with this, monitoring of nutrient consumption should be further examined to be
able to determine an appropriate method of nutrition supply.
Future research should also focus on finding more algal strains with auto flocculation
characteristics. Additionally, in order to find smart and energy efficient aeration systems,
settling characteristics (i.e. settling time) should be further examined.

38
From a cultivation setup perspective, upscaling in pond size and possible improvements in the
dehydration process by using waste heat is of great interest as well as analysing potential
drawbacks in covering the ponds (e.g. oxygen inhibition).

39
References
1 Foley, P. M., Beach, E. S. & Zimmerman, J. B. Algae as a source of renewable
chemicals: opportunities and challenges. Green Chemistry 13, 1399-1405
(2011).
2 Scott, S. A. et al. Biodiesel from algae: challenges and prospects. Current
Opinion in Biotechnology 21, 277-286 (2010).
3 Sun, Y. & Cheng, J. Hydrolysis of lignocellulosic materials for ethanol
production: a review. Bioresource technology 83, 1-11 (2002).
4 Ho, S.-H. et al. Characterization of photosynthetic carbon dioxide fixation
ability of indigenous< i> Scenedesmus obliquus</i> isolates. Biochemical
Engineering Journal 53, 57-62 (2010).
5 Usui, N. & Ikenouchi, M. The biological CO< sub> 2</sub> fixation and
utilization project by RITE (1)—Highly-effective photobioreactor system—.
Energy conversion and management 38, S487-S492 (1997).
6 Sheehan, J., Dunahay, T., Benemann, J. & Roessler, P. A look back at the US
Department of Energy's Aquatic Species Program: Biodiesel from algae. Vol.
328 (National Renewable Energy Laboratory Golden, 1998).
7 Molina Grima, E., Belarbi, E.-H., Acien Fernandez, F., Robles Medina, A. &
Chisti, Y. Recovery of microalgal biomass and metabolites: process options and
economics. Biotechnology Advances 20, 491-515 (2003).
8 Mata, T. M., Martins, A. A. & Caetano, N. S. Microalgae for biodiesel
production and other applications: A review. Renewable and Sustainable
Energy Reviews 14, 217-232 (2010).
9 Tomaselli, L. in Handbook of Microalgal Culture 1-19 (Blackwell
Publishing Ltd, 2007).
10 Frac, M., Jezierska-Tys, S. & Tys, J. Microalgae for biofuels production and
environmental applications: A review. African Journal of Biotechnology 9,
9227-9236 (2010).
11 Masojídek, J., Koblížek, M. & Torzillo, G. in Handbook of Microalgal Culture
20-39 (Blackwell Publishing Ltd, 2007).
12 Becker, E. Micro-algae as a source of protein. Biotechnology Advances 25, 207-
210 (2007).
13 John, D. M., Whitton, B. A. & Brook, A. J. The freshwater algal flora of the
British Isles: An identification guide to freshwater and terrestrial algae.
(Cambridge University Press, 2002).
14 Madigan, M. T. & Brock, T. D. Brock biology of microorganisms. 12th edn,
516-547 (Pearson/Benjamin Cummings, 2009).
15 Alberts, B. Molecular Biology of the Cell: Reference Edition. 5th edn, 840-855
(Taylor & Francis, 2008).
16 Mathews, C. K., Van Holde, K. E. & Ahern, K. G. Biochemistry. 3rd edn,
(Benjamin Cummings, 2000).
17 Richmond, A. in Handbook of Microalgal Culture 125-177 (Blackwell
Publishing Ltd, 2007).
18 Chisti, Y. Biodiesel from microalgae. Biotechnology advances 25, 294-306
(2007).

40
19 Grobbelaar, J. U. in Handbook of Microalgal Culture 95-115 (Blackwell
Publishing Ltd, 2007).
20 Zeng, X., Danquah, M. K., Chen, X. D. & Lu, Y. Microalgae bioengineering:
From CO< sub> 2</sub> fixation to biofuel production. Renewable and
Sustainable Energy Reviews 15, 3252-3260 (2011).
21 Li, Y., Horsman, M., Wang, B., Wu, N. & Lan, C. Q. Effects of nitrogen
sources on cell growth and lipid accumulation of green alga Neochloris
oleoabundans. Applied microbiology and biotechnology 81, 629-636 (2008).
22 Packer, M. Algal capture of carbon dioxide; biomass generation as a tool for
greenhouse gas mitigation with reference to New Zealand energy strategy and
policy. Energy Policy 37, 3428-3437 (2009).
23 Wang, B., Li, Y., Wu, N. & Lan, C. CO2 bio-mitigation using microalgae.
Applied Microbiology and Biotechnology 79, 707-718, doi:10.1007/s00253-
008-1518-y (2008).
24 Chen, C.-T. A., Lin, C.-M., Huang, B.-T. & Chang, L.-F. Stoichiometry of
carbon, hydrogen, nitrogen, sulfur and oxygen in the particulate matter of the
western North Pacific marginal seas. Marine Chemistry 54, 179-190 (1996).
25 Hu, Q. in Handbook of Microalgal Culture 83-94 (Blackwell Publishing Ltd,
2007).
26 Goldman, J. C. & Carpenter, E. J. A kinetic approach to the effect of
temperature on algal growth. Limnology and Oceanography 19, 756-766
(1974).
27 Verma, N. M., Mehrotra, S., Shukla, A. & Mishra, B. N. Prospective of
biodiesel production utilizing microalgae as the cell factories: A comprehensive
discussion. African Journal of Biotechnology 9, 1402-1411 (2012).
28 Weissman, J. C. & Goebel, R. Design and analysis of microalgal open pond
systems for the purpose of producing fuels: a subcontract report. (Solar Energy
Research Inst., Golden, CO (USA), 1987).
29 Christenson, L. & Sims, R. Production and harvesting of microalgae for
wastewater treatment, biofuels, and bioproducts. Biotechnology advances 29,
686-702 (2011).
30 Gao, Y., Gregor, C., Liang, Y., Tang, D. & Tweed, C. Algae biodiesel-a
feasibility report. Chemistry Central Journal 6, 1-16 (2012).
31 Tredici, M. R. in Handbook of Microalgal Culture 178-214 (Blackwell
Publishing Ltd, 2007).
32 Brennan, L. & Owende, P. Biofuels from microalgae—A review of
technologies for production, processing, and extractions of biofuels and co-
products. Renewable and Sustainable Energy Reviews 14, 557-577,
doi:http://dx.doi.org/10.1016/j.rser.2009.10.009 (2010).
33 Harun, R., Singh, M., Forde, G. M. & Danquah, M. K. Bioprocess engineering
of microalgae to produce a variety of consumer products. Renewable and
Sustainable Energy Reviews 14, 1037-1047 (2010).
34 Uduman, N., Qi, Y., Danquah, M. K., Forde, G. M. & Hoadley, A. Dewatering
of microalgal cultures: A major bottleneck to algae-based fuels. Journal of
renewable and sustainable Energy 2, 012701 (2010).

41
35 Mercer, P. & Armenta, R. E. Developments in oil extraction from microalgae.
European journal of lipid science and technology 113, 539-547 (2011).
36 Meher, L., Vidya Sagar, D. & Naik, S. Technical aspects of biodiesel
production by transesterification—a review. Renewable and sustainable energy
reviews 10, 248-268 (2006).
37 Ma, F., Clements, L. & Hanna, M. The Effects of Catalyst, Free Fatty Acids,
and Water on Transecterification of Beef Tallow. (1998).
38 Mathiyazhagan, M. & Ganapathi, A. Factors affecting biodiesel production.
Research in Plant Biology 1, 1-5 (2011).
39 Knothe, G. Analyzing biodiesel: standards and other methods. Journal of the
American Oil Chemists' Society 83, 823-833 (2006).
40 Knothe, G. Dependence of biodiesel fuel properties on the structure of fatty
acid alkyl esters. Fuel processing technology 86, 1059-1070 (2005).
41 Hoekman, S. K., Broch, A., Robbins, C., Ceniceros, E. & Natarajan, M. Review
of biodiesel composition, properties, and specifications. Renewable and
Sustainable Energy Reviews (2011).
42 Singh, J. & Gu, S. Commercialization potential of microalgae for biofuels
production. Renewable and Sustainable Energy Reviews 14, 2596-2610 (2010).
43 Gagnon, N., Hall, C. & Brinker, L. A Preliminary Investigation of Energy
Return on Energy Investment for Global Oil and Gas Production. Energies 2,
490-503 (2009).
44 Laurens, L. M. L. et al. Algal Biomass Constituent Analysis: Method
Uncertainties and Investigation of the Underlying Measuring Chemistries.
Analytical Chemistry 84, 1879-1887, doi:10.1021/ac202668c (2012).
45 González López, C. V. et al. Protein measurements of microalgal and
cyanobacterial biomass. Bioresource technology 101, 7587-7591 (2010).
46 Porra, R. The chequered history of the development and use of simultaneous
equations for the accurate determination of chlorophylls a and b. Photosynthesis
Research 73, 149-156, doi:10.1023/A:1020470224740 (2002).
47 Tredici, M. R. Photobiology of microalgae mass cultures: understanding the
tools for the next green revolution. Biofuels 1, 143-162 (2010).
48 Green, F. B., Lundquist, T. & Oswald, W. Energetics of advanced integrated
wastewater pond systems. Water Science & Technology 31, 9-20 (1995).
49 Poelman, E., De Pauw, N. & Jeurissen, B. Potential of electrolytic flocculation
for recovery of micro-algae. Resources, conservation and recycling 19, 1-10
(1997).
50 Baerdemaeker, T. D. et al. Benchmark study on algae harvesting with
backwashable submerged flat panel membranes. Bioresource Technology 129,
582-591, doi:http://dx.doi.org/10.1016/j.biortech.2012.10.153 (2013).
51 Bilad, M. R., Vandamme, D., Foubert, I., Muylaert, K. & Vankelecom, I. F. J.
Harvesting microalgal biomass using submerged microfiltration membranes.
Bioresource Technology 111, 343-352,
doi:http://dx.doi.org/10.1016/j.biortech.2012.02.009 (2012).
52 Williams, P. J. l. B. & Laurens, L. M. Microalgae as biodiesel & biomass
feedstocks: Review & analysis of the biochemistry, energetics & economics.
Energy & Environmental Science 3, 554-590 (2010).
42
53 Lalman, J. A. & Bagley, D. M. Anaerobic degradation and methanogenic
inhibitory effects of oleic and stearic acids. Water Research 35, 2975-2983,
doi:http://dx.doi.org/10.1016/S0043-1354(00)00593-5 (2001).
54 Paladines, O., Reid, J., Bensadoun, A. & Van Niekerk, B. Heat of combustion
values of the protein and fat in the body and wool of sheep. The Journal of
Nutrition 82, 145-149 (1964).
55 McKendry, P. Energy production from biomass (part 1): overview of biomass.
Bioresource Technology 83, 37-46, doi:http://dx.doi.org/10.1016/S0960-
8524(01)00118-3 (2002).
56 Stepan, D. J., Shockey, R. E., Moe, T. A. & Dorn, R. Carbon Dioxide
Sequestering Using Microalgal Systems. Medium: ED (2002).
57 Dubinsky, Z. & Rotem, J. Relations between algal populations and the pH of
their media. Oecologia 16, 53-60, doi:10.1007/BF00345087 (1974).

I
Appendix A. Aeration
Table 14. Altered concentration of carbon dioxide in relation to annual net energy for a cultivation pond measuring 3.46 m
2.
Sensitivity analysis
Continous pumping. Mixing provided by airlift system
Altering CO2 concentration. Heat value from algal biomass
CO2 conc
(v/v) Production (g m-2
year-1
) Production (g year-1
)
Energy Output
(MJ)
Energy Input
(MJ)
Net energy
(MJ)
Input energy/output energy
(%)
0.0396 8000 27694.8 678.5226 2679.649209 -2001.126609 394.9240908
0.05 8000 27694.8 678.5226 2122.297577 -1443.774977 312.7821501
0.1 8000 27694.8 678.5226 1061.185817 -382.6632171 156.3965323
0.15 8000 27694.8 678.5226 707.4818971 -28.95929714 104.267993
0.2 8000 27694.8 678.5226 530.6299371 147.8926629 78.20372337
0.25 8000 27694.8 678.5226 424.5187611 254.0038389 62.56516159
0.3 8000 27694.8 678.5226 353.7779771 324.7446229 52.13945374
0.35 8000 27694.8 678.5226 303.2488457 375.2737543 44.69251956
0.4 8000 27694.8 678.5226 265.3519971 413.1706029 39.10731892
0.45 8000 27694.8 678.5226 235.8766705 442.6459295 34.76327398
0.5 8000 27694.8 678.5226 212.2964091 466.2261909 31.28803803
1 8000 27694.8 678.5226 106.1852331 572.3373669 15.64947625
1.5 8000 27694.8 678.5226 70.81484114 607.7077589 10.43662232
2 8000 27694.8 678.5226 53.12964514 625.3929549 7.83019536
2.5 8000 27694.8 678.5226 42.51852754 636.0040725 6.266339182
3 8000 27694.8 678.5226 35.44444914 643.0781509 5.223768397
4 8000 27694.8 678.5226 26.60185114 651.9207489 3.920554915
5 8000 27694.8 678.5226 21.29629234 657.2263077 3.138626826
10 8000 27694.8 678.5226 10.68517474 667.8374253 1.574770648
15 8000 27694.8 678.5226 7.148135543 671.3744645 1.053485255
20 8000 27694.8 678.5226 5.379615943 673.1429841 0.792842559
25 8000 27694.8 678.5226 4.318504183 674.2040958 0.636456941
I
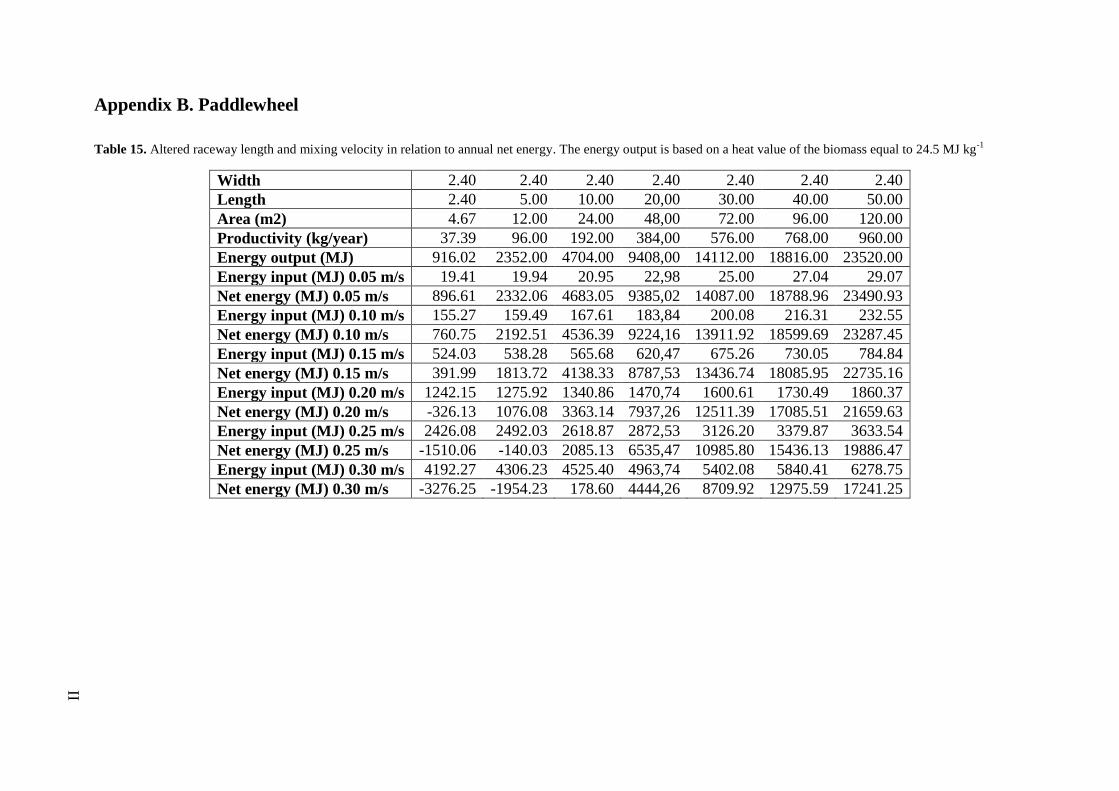
II
Appendix B. Paddlewheel
Table 15. Altered raceway length and mixing velocity in relation to annual net energy. The energy output is based on a heat value of the biomass equal to 24.5 MJ kg
-1
Width 2.40 2.40 2.40 2.40 2.40 2.40 2.40
Length 2.40 5.00 10.00 20,00 30.00 40.00 50.00
Area (m2) 4.67 12.00 24.00 48,00 72.00 96.00 120.00
Productivity (kg/year) 37.39 96.00 192.00 384,00 576.00 768.00 960.00
Energy output (MJ) 916.02 2352.00 4704.00 9408,00 14112.00 18816.00 23520.00
Energy input (MJ) 0.05 m/s 19.41 19.94 20.95 22,98 25.00 27.04 29.07
Net energy (MJ) 0.05 m/s 896.61 2332.06 4683.05 9385,02 14087.00 18788.96 23490.93
Energy input (MJ) 0.10 m/s 155.27 159.49 167.61 183,84 200.08 216.31 232.55
Net energy (MJ) 0.10 m/s 760.75 2192.51 4536.39 9224,16 13911.92 18599.69 23287.45
Energy input (MJ) 0.15 m/s 524.03 538.28 565.68 620,47 675.26 730.05 784.84
Net energy (MJ) 0.15 m/s 391.99 1813.72 4138.33 8787,53 13436.74 18085.95 22735.16
Energy input (MJ) 0.20 m/s 1242.15 1275.92 1340.86 1470,74 1600.61 1730.49 1860.37
Net energy (MJ) 0.20 m/s -326.13 1076.08 3363.14 7937,26 12511.39 17085.51 21659.63
Energy input (MJ) 0.25 m/s 2426.08 2492.03 2618.87 2872,53 3126.20 3379.87 3633.54
Net energy (MJ) 0.25 m/s -1510.06 -140.03 2085.13 6535,47 10985.80 15436.13 19886.47
Energy input (MJ) 0.30 m/s 4192.27 4306.23 4525.40 4963,74 5402.08 5840.41 6278.75
Net energy (MJ) 0.30 m/s -3276.25 -1954.23 178.60 4444,26 8709.92 12975.59 17241.25
II

III
Appendix C. Sensitivity analysis
Table 16. Altered annual production at different concentration of lipids in relation to annual net energy. The energy output is based on a heat value of 43 MJ kg
-1, equal to
biodiesel.
Production
(g/year)
Energy
input
(MJ)
Energy
output
(MJ) 15 %
lipids
Net energy
(MJ) 15 %
lipids
Energy
output
(MJ) 20 %
lipids
Net energy
(MJ) 20 %
lipids
Energy
output
(MJ) 25 %
lipids
Net energy
(MJ) 25 %
lipids
Energy
output
(MJ) 30 %
lipids
Net energy
(MJ) 30 %
lipids
2000 29.021 12.9 -16.12 17.20 -11.82 21.50 -7.52 25.80 -3.22
4000 29.021 25.8 -3.22 34.40 5.38 43.00 13.98 51.60 22.58
6000 29.021 38.7 9.68 51.60 22.58 64.50 35.48 77.40 48.38
8000 29.021 51.6 22.58 68.80 39.78 86.00 56.98 103.20 74.18
10000 29.021 64.5 35.48 86.00 56.98 107.50 78.48 129.00 99.98
12000 29.021 77.4 48.38 103.20 74.18 129.00 99.98 154.80 125.78
14000 29.021 90.3 61.28 120.40 91.38 150.50 121.48 180.60 151.58
16000 29.021 103.2 74.18 137.60 108.58 172.00 142.98 206.40 177.38
18000 29.021 116.1 87.08 154.80 125.78 193.50 164.48 232.20 203.18
20000 29.021 129 99.98 172.00 142.98 215.00 185.98 258.00 228.98
22000 29.021 141.9 112.88 189.20 160.18 236.50 207.48 283.80 254.78
24000 29.021 154.8 125.78 206.40 177.38 258.00 228.98 309.60 280.58
26000 29.021 167.7 138.68 223.60 194.58 279.50 250.48 335.40 306.38
28000 29.021 180.6 151.58 240.80 211.78 301.00 271.98 361.20 332.18
30000 29.021 193.5 164.48 258.00 228.98 322.50 293.48 387.00 357.98
32000 29.021 206.4 177.38 275.20 246.18 344.00 314.98 412.80 383.78
34000 29.021 219.3 190.28 292.40 263.38 365.50 336.48 438.60 409.58
36000 29.021 232.2 203.18 309.60 280.58 387.00 357.98 464.40 435.38
38000 29.021 245.1 216.08 326.80 297.78 408.50 379.48 490.20 461.18
III