Embed Size (px)
Citation preview

THE INFLUENCE OF ATMOSPHERIC DYNAMICS ON THE INFRARED SPECTRAAND LIGHT CURVES OF HOT JUPITERS
J. J. Fortney,1,2,3 C. S. Cooper,4 A. P. Showman,4 M. S. Marley,1 and R. S. Freedman1,3
Received 2006 May 4; accepted 2006 August 10
ABSTRACT
We explore the infrared spectrum of a three-dimensional dynamical model of planet HD 209458b as a function oforbital phase. The dynamical model predicts dayside atmospheric pressure-temperature profiles that are much moreisothermal at pressures less than 1 bar than one-dimensional radiative-convective models have found. The resultingdayside thermal spectra are very similar to a blackbody, and only weak water absorption features are seen at shortwavelengths. The dayside emission is consequently in better agreement with ground-based and space-based second-ary eclipse data than any previous models, which predict strong flux peaks and deep absorption features. At otherorbital phases, absorption due to carbon monoxide and methane is also predicted. We compute the spectra under twotreatments of atmospheric chemistry: one uses the predictions of equilibrium chemistry, and the other uses non-equilibrium chemistry, which ties the timescales of methane and carbon monoxide chemistry to dynamical time-scales. As a function of orbital phase, we predict planet-to-star flux ratios for standard infrared bands and all SpitzerSpace Telescope bands. In Spitzer bands, we predict two- to fifteenfold variation in planetary flux as a function oforbital phase with equilibrium chemistry, and two- to fourfold variation with nonequilibrium chemistry. Variation isgenerally more pronounced in bands from 3 to 10 !m than at longer wavelengths. The orbital phase of maximumthermal emission in infrared bands is 15Y45 orbital degrees before the time of secondary eclipse. Changes in flux as afunction of orbital phase for HD 209458b should be observable with Spitzer, given the previously achieved obser-vational error bars.
Subject headinggs: binaries: eclipsing — planetary systems — radiative transfer —stars: individual (HD 209458)
1. INTRODUCTION
Astronomers and planetary scientists are just beginning to un-derstand the atmospheres of the short-period giant planets knownas ‘‘hot Jupiters’’ or ‘‘Pegasi planets.’’ A key subset of these planetsare those that transit the disk of their parent stars, which makethem well suited for follow-up studies. The most well studied ofthese transiting hot Jupiters is the first to be discovered, HD209458b (Charbonneau et al. 2000; Henry et al. 2000), a 0.69MJ
planet that orbits its Sun-like parent star at a distance of 0.045AU.Currently, considerable work on hot Jupiters is occurring on
both the observational and theoretical fronts. In the past few years,several groups have computed dynamical atmosphere models forHD 209458b in an effort to understand the structure, winds, andtemperature contrasts of the planet’s atmosphere (Showman &Guillot 2002; Cho et al. 2003; Cooper & Showman 2005, 2006;Burkert et al. 2005). If the planet has been tidally de-spun and hasbecome locked to its parent star, dynamical models are surelyneeded to understand the extent to which absorbed stellar energyis transported onto the planet’s permanent night side. With thelaunch of the Spitzer Space Telescope , there is now a platformthat is well suited for observations of the thermal emission fromhot Jupiter planets.
Spitzer observations spanning the time of the planet’s second-ary eclipse (when the planet passes behind its parent star) have
been published for HD 209458b at 24 !m (Deming et al. 2005),TrES-1 at 4.5 and 8.0 !m (Charbonneau et al. 2005), and HD189733b at 16!m (Deming et al. 2006a). In all cases, the observedquantity is the planet-to-star flux ratio in Spitzer Infared ArrayCamera ( IRAC), Infrared Spectrograph ( IRS), or MultibandImaging Photometer for Spitzer (MIPS) bands. The dual TrES-1observations are especially interesting because they allow for adetermination of the planet’s mid-infrared spectral slope. Severalefforts have also been made from the ground to observe the sec-ondary eclipse of HD209458b.Although no detections have beenmade, some important, occasionally overlooked upper limits at Kand L band have been obtained. These include Richardson et al.(2003a) around 2.3 !m, Snellen (2005) in K band, and Deminget al. (2006b) at L band. These ground-based observations con-strain the flux emitted by the planet in spectral bands where watervapor opacity is expected to be minimal; therefore, emitted fluxshould be high.This influx of data has spurred a new generation of radiative-
convective equilibrium models, whose resulting infrared spectracan be compared with data (Fortney et al. 2005, 2006; Burrowset al. 2005, 2006; Seager et al. 2005; Barman et al. 2005; ). SeeMarley et al. (2006) and Charbonneau et al. (2006) for reviews.Themajority of thesemodels are one-dimensional. Authorsweightthe incident stellar flux by 1
4, to simulate planetwide average con-ditions, or by 1
2, to simulate dayside average conditions (with a coldnight side). Barman et al. (2005) have investigated two-dimensionalmodelswith axial symmetry around the planet’s substellar-antistellaraxis and computed infrared spectra as a function of orbital phase.Iro et al. (2005) have extended one-dimensional models by add-ing heat transport due to a simple parameterization of winds togenerate longitude-dependent temperature maps, but they did notcompute disk-averaged spectra for these models. Very recentlyBurrows et al. (2006) have also investigated spectra and light
1 Space Science and Astrobiology Division, NASA Ames Research Center,MS 245-3, Moffett Field, CA 94035; [email protected], [email protected], [email protected].
2 Spitzer Fellow.3 SETI Institute, 515 North Whisman Road, Mountain View, CA 94043.4 Lunar and Planetary Laboratory and Department of Planetary Sciences,
University of Arizona, Tucson, AZ, 85721; [email protected], [email protected].
746
The Astrophysical Journal, 652:746Y757, 2006 November 20# 2006. The American Astronomical Society. All rights reserved. Printed in U.S.A.

curves of planets with various day-night effective temperature dif-ferences, assuming one-dimensional profiles for each hemisphere.These one- and two-dimensional radiative-convective equilibriummodels have had some success in matching Spitzer observations,but Seager et al. (2005) and Deming et al. (2006b) have shownthat ground-based data for HD209458b do not indicate prominentflux peaks at 2.3 and 3.8 !m, which solar composition modelspredict.
The various dynamical models for HD 209458b (Showman &Guillot 2002; Cho et al. 2003; Cooper & Showman 2005, 2006;Burkert et al. 2005) are quite varied in their treatment of the planet’satmosphere.Wewill not review them here, as that is not the focusof this paper. In general, temperature contrasts in the visible atmo-sphere are expected to be somewhere between 300 and 1000 K.What has been somewhat lacking for these dynamical models areclear observational signatures, which would in principle be test-able with Spitzer or other telescopes. The purpose of this paper isto remedy that situation. Here we generate infrared spectra andlight curves as a function of orbital phase for the Cooper &Showman (2006, hereafter, CS06) dynamical simulation. We pre-sent the first spectra generated for three-dimensionalmodels of theatmosphere of HD 209458b.
2. METHODS
Here we take the first step toward understanding the effectsof atmospheric dynamics on the infrared spectra of hot Jupiters.A consistent treatment of coupled atmospheric dynamics, non-equilibrium chemistry, and radiative transfer would be a consider-able task. In a coupled scheme, given a three-dimensional P-Tgrid at a given time step, with corresponding chemical mixingratios, the radiative transfer scheme would solve for the upwardand downward fluxes in each layer. These fluxes would be wave-length dependent andwould differ from layer to layer. The thermo-dynamical heating/cooling rate, which is the vertical divergenceof the net flux, would then be calculated. The dynamics schemewould then use this heating rate, together with the velocities andP-T profiles in the grid at the previous time step, to a calculate thechemical abundances, velocities, and P-T profiles on the grid atthe new time step. The process steps forward in time, as the radia-tive transfer solver again finds the new heating/cooling rates.The emergent spectrum of the planet could be found at any stage.In our work presented here, we performed a simplified calcula-tion that contains some aspects of whatwill eventually be includedin a fully consistent treatment.
2.1. Dynamical Model
Our input pressure-temperature (P-T ) map is from CS06. Asthe dynamical simulations are described in depth in Cooper &Showman (2005) and CS06, we will only give an overview here.The CS06 model employs the ARIES/GEOS Dynamical Core,version 2 (AGDC2; Suarez & Takacs 1995). The AGDC2 solvesthe primitive equations of dynamical meteorology, which are thefoundation of numerous climate and numerical weather predic-tion models (Holton 1992; Kalnay 2002). The primitive equa-tions simplify the Navier-Stokes equations of fluidmechanics byassuming hydrostatic balance of each vertical column of atmo-sphere. Forcing is due to incident flux from the parent star, throughaNewtonian radiative process described in CS06. TheCS06modelis forced from the one-dimensional radiative-convective equilib-rium profile of Iro et al. (2005), which assumes globally aver-aged planetary conditions.
For their simulations, CS06 take the top layer of the model tobe 1mbar. Themodel atmosphere spans!15 pressure scale heightsbetween the input top layer and the bottom boundary at 3 kbar.
CS06 use 40 layers evenly spaced in log pressure. A P-T profileis generated at locations evenly spaced in longitude (in 5" incre-ments) and latitude (in 4" increments). The 72 longitude and 44latitude points create 3168 P-T profiles. In Figure 1 we show theCS06 grid at three pressure levels, near !2, 20, and 200 mbar.Previous work has shown these levels likely bracket the pressuresof interest for formingmid-infrared spectra (Fortney et al. 2005).All three panels of Figure 1 use the same brightness scale for easycomparison between pressure levels.
At the 2 mbar level, where radiative time constants are short( Iro et al. 2005; Seager et al. 2005), the atmosphere respondsquickly to incident radiation. Winds, although reaching a speedof up to 8 km s#1, are not fast enough to lead to significant de-viations from a static atmosphere, which implies that the hottestregions remain at the substellar point. The arrows indicate a windpattern that attempts to carry energy radially away from the hotspot.At this pressure, the atmosphere somewhat resembles the two-dimensional radially symmetric static atmosphere of Barman et al.(2005), who found a hot spot at the substellar point and a uni-formly decreasing temperature as radial distance from this pointincreased. The night side appears nearly uniform, and colder.
Fig. 1.—Global temperature map at 2 mbar (top panel ), 25 mbar (middlepanel ), and 220mbar (bottom panel ) for the CS06 dynamical simulation. Arrowsshow the direction and relative magnitudes of winds. Each longitude minor tickmark is 18", and each latitude minor tick mark is 9". Each panel uses the sametemperature shading scheme.
ATMOSPHERIC DYNAMICS AND HOT JUPITER SPECTRA 747

At the 25 mbar level, it is clear that a west-to-east circulationpattern has emerged at the equator, and the center of the planet’swarm region has been blown downstream by!35". Thewind fromthe west dominates over the predominantly radially outward windseen at the 2 mbar level. Day-night temperature contrasts are notas large at this pressure as they are at 2 mbar.
At the 220 mbar level, the center of the hot spot has beenblown downstream by!60". This jet extends from the equator tothe midlatitudes; the gas in the jet is warmer than gas to the northor south. The radiative time constants become longer the deeperone goes into the atmosphere ( Iro et al. 2005). Hence, winds arebetter able to redistribute energy, leading to weaker temperaturecontrasts, which cannot simply be characterized as ‘‘day-night.’’
2.2. Logistics and Radiative Transfer
Unlike other published models, we stress that the spectra gen-erated here are from a dynamical atmosphere model that is not inradiative-convective equilibrium. Each of the 3168 P-T profilesfrom CS06 have, without modification (aside from interpolationonto a different pressure grid), been run through our radiative trans-fer solver. No iteration is done to achieve radiative equilibrium.The equation of radiative transfer is solved with the two-streamsource function technique described inToon et al. (1989). This is thesame infrared radiative transfer scheme used in Fortney et al. (2005,2006) and M. S. Marley et al. (2006, in preparation). We ignorecontributions due to scattered stellar photons, as discussed below.
At a given orbital position, the CS06 map in longitude is re-mapped into an apparent longitude (as seen from Earth), whilethe latitude remains unchanged. See Figure 2 for a diagram. Herewe ignore the 3N4 that the orbit differs from being exactly edge-on(Brown et al. 2001). At a given orbital angle’—for each patch ofthe planet—the cosine of the angle " from the subobserver point,!, is calculated. This ! is consistently included when solving theradiative transfer, which means that the effects of limb darkening(or brightening) are automatically incorporated. We interpolate ina pressure-temperature-abundance grid (Lodders&Fegley 2002),such that any given point in the three-dimensional model has theatomic and molecular abundances that are consistent with thatpoint’s pressure and temperature.
At any given time, the one-half of the planet that is not visibleis not included in the radiative transfer. The 1584 visible points,at which the emergent specific intensity (ergs s#1 cm#2 Hz#1 sr#1)is calculated, are then weighted by the apparent visible area oftheir respective patches. These intensities are summed up to givethe total emergent flux density (ergs s#1 cm#2 Hz#1) from theplanet. The spectra generated by the patch-by-patch version ofthe code were tested against spectra from one-dimensional grayatmospheres and our previously published hot Jupiter profiles.
Emergent spectra are calculated from 0.26 to 325 !m, but sincewe ignore the contribution due to scattered stellar flux, the spectraat the very shortest wavelengths have little meaning. However,for the radiative-equilibrium HD 209458b model published inFortney et al. (2005) they found that scattered stellar flux is greaterthan thermal emission only at wavelengths less than !0.68 !m.We expect that a considerable amount of ‘‘visible’’ light that mayeventually be seen from hot Jupiters is due to thermal emission.We note that by 1 !m thermal emission is 100 times greater thanscattered flux. Here wewill present spectra for wavelengths from1 to 30 !m.
We note that the radiative transfer at every point is solved in theplane-parallel approximation.While this treatment is sufficient forour purposes, wewish to point out two drawbacks. The first is that,near the limb of the planet, we will tend to overestimate the pathlengths of photons emerging from the atmosphere, as the curvature
of the atmosphere is neglected. The second issue also occurs nearthe limb. We cannot treat photons whose path, in a completelycorrect treatment, would start in one column but emerge from anadjoining column. However, atmospheric properties in any twoadjoining columns are in general quite similar. The former issue,that of the plane-parallel approximation, is likely more impor-tant, and should be addressed at a later time, when data precisionwarrants it. Here we note that in our tests 95% of planetary fluxemerges fromwithin 75" of the subobserver point, such that theselimb effects will have little effect on the disk-summed spectra andlight curves that we present.When generating ourmodel spectra, we use the elemental abun-
dance data of Lodders (2003) and chemical equilibrium compo-sitions computed with the CONDOR code, as described in Fegley&Lodders (1994), Lodders&Fegley (2002), andLodders (2002).In x 2.3 we discuss deviations from equilibrium chemistry in theatmosphere of HD 209458b, as calculated by CS06. At this time,we ignore photochemistry, which has been shown by Visscher &Fegley (2006) to be reasonable at P > 10 mbar. For the mostpart, the infrared spectra of hot Jupiters are sensitive to opacity at10PPP 200 mbar (Fortney et al. 2005), so equilibrium chemis-try calculations are probably sufficient. As discussed in Fortneyet al. (2006), we maintain a large and constantly updated opacitydatabase, which is described in detail in R. S. Freedman &K. Lodders (2006, in preparation). The pressure, temperature, com-position, and wavelength-dependent opacity is tabulated before-hand using the correlated-k method (Goody et al. 1989) in 196wavelength interval bins. The resulting spectra are therefore oflow resolution. However, low resolution is suitable for the task athand, as we are interested in band-integrated fluxes and the radia-tive transfer must be solved at 1584 locations on the planet atmany (here, 36) orbital phases.In Williams et al. (2006), which focused on examining asym-
metrical secondary eclipse light curves caused by dynamical
Fig. 2.—Top-view diagram of the planetary orbit. The CS06 latitude/ longitudegrid covers the entire planet. The planet’s night side is shaded gray. At everyangle in the orbit (’), the longitude is remapped to give the apparent longitudeand latitude, as viewed by the distant observer. The cosine of the angle " madebetween a patch of the planet and the subobserver point is !.
FORTNEY ET AL.748 Vol. 652
redistribution of flux, we investigated the effects of limb darken-ing for HD 209458b for the CS06 map. These effects are hard todisentangle from general brightness variations due to temperaturedifferences generated by dynamics. Limb darkening in a particularwavelength would be manifested as a brightness temperature thatdecreases toward the limb relative to a brightness temperaturemapcomputed assuming normal incidence at every point.On the planet’sday side, where the P-T profiles are somewhat isothermal, limbdarkening is not expected to be significant. Indeed, only at anglesgreater than!80" from the subsolar point was dayside limb dark-ening as large as 100Y200 K calculated. As noted, due to ourplane-parallel approximation, this is likely to be somewhat of anoverestimation.
2.3. Clouds and Chemistry
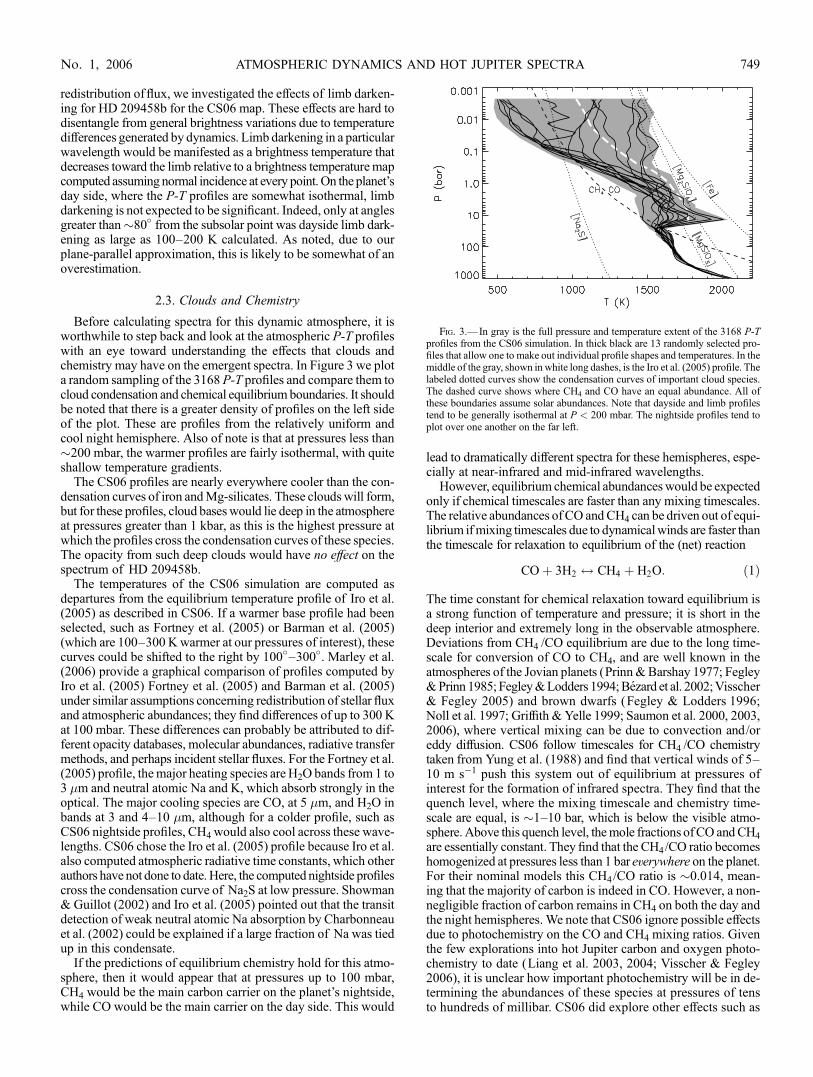
Before calculating spectra for this dynamic atmosphere, it isworthwhile to step back and look at the atmospheric P-T profileswith an eye toward understanding the effects that clouds andchemistry may have on the emergent spectra. In Figure 3 we plota random sampling of the 3168 P-T profiles and compare them tocloud condensation and chemical equilibriumboundaries. It shouldbe noted that there is a greater density of profiles on the left sideof the plot. These are profiles from the relatively uniform andcool night hemisphere. Also of note is that at pressures less than!200 mbar, the warmer profiles are fairly isothermal, with quiteshallow temperature gradients.
The CS06 profiles are nearly everywhere cooler than the con-densation curves of iron andMg-silicates. These clouds will form,but for these profiles, cloud baseswould lie deep in the atmosphereat pressures greater than 1 kbar, as this is the highest pressure atwhich the profiles cross the condensation curves of these species.The opacity from such deep clouds would have no effect on thespectrum of HD 209458b.
The temperatures of the CS06 simulation are computed asdepartures from the equilibrium temperature profile of Iro et al.(2005) as described in CS06. If a warmer base profile had beenselected, such as Fortney et al. (2005) or Barman et al. (2005)(which are 100Y300 Kwarmer at our pressures of interest), thesecurves could be shifted to the right by 100"Y300". Marley et al.(2006) provide a graphical comparison of profiles computed byIro et al. (2005) Fortney et al. (2005) and Barman et al. (2005)under similar assumptions concerning redistribution of stellar fluxand atmospheric abundances; they find differences of up to 300 Kat 100 mbar. These differences can probably be attributed to dif-ferent opacity databases, molecular abundances, radiative transfermethods, and perhaps incident stellar fluxes. For the Fortney et al.(2005) profile, themajor heating species are H2O bands from 1 to3 !m and neutral atomic Na and K, which absorb strongly in theoptical. The major cooling species are CO, at 5 !m, and H2O inbands at 3 and 4Y10 !m, although for a colder profile, such asCS06 nightside profiles, CH4 would also cool across these wave-lengths. CS06 chose the Iro et al. (2005) profile because Iro et al.also computed atmospheric radiative time constants, which otherauthors have not done to date.Here, the computed nightside profilescross the condensation curve of Na2S at low pressure. Showman& Guillot (2002) and Iro et al. (2005) pointed out that the transitdetection of weak neutral atomic Na absorption by Charbonneauet al. (2002) could be explained if a large fraction of Na was tiedup in this condensate.
If the predictions of equilibrium chemistry hold for this atmo-sphere, then it would appear that at pressures up to 100 mbar,CH4 would be the main carbon carrier on the planet’s nightside,while CO would be the main carrier on the day side. This would
lead to dramatically different spectra for these hemispheres, espe-cially at near-infrared and mid-infrared wavelengths.
However, equilibrium chemical abundanceswould be expectedonly if chemical timescales are faster than any mixing timescales.The relative abundances of CO andCH4 can be driven out of equi-librium ifmixing timescales due to dynamicalwinds are faster thanthe timescale for relaxation to equilibrium of the (net) reaction
CO$ 3H2 $ CH4 $ H2O: %1&
The time constant for chemical relaxation toward equilibrium isa strong function of temperature and pressure; it is short in thedeep interior and extremely long in the observable atmosphere.Deviations from CH4 /CO equilibrium are due to the long time-scale for conversion of CO to CH4, and are well known in theatmospheres of the Jovian planets (Prinn&Barshay 1977; Fegley&Prinn 1985; Fegley&Lodders 1994;Bezard et al. 2002;Visscher& Fegley 2005) and brown dwarfs (Fegley & Lodders 1996;Noll et al. 1997; Griffith & Yelle 1999; Saumon et al. 2000, 2003,2006), where vertical mixing can be due to convection and/oreddy diffusion. CS06 follow timescales for CH4 /CO chemistrytaken from Yung et al. (1988) and find that vertical winds of 5Y10 m s#1 push this system out of equilibrium at pressures ofinterest for the formation of infrared spectra. They find that thequench level, where the mixing timescale and chemistry time-scale are equal, is !1Y10 bar, which is below the visible atmo-sphere. Above this quench level, themole fractions ofCO andCH4
are essentially constant. They find that the CH4/CO ratio becomeshomogenized at pressures less than 1 bar everywhere on the planet.For their nominal models this CH4/CO ratio is !0.014, mean-ing that the majority of carbon is indeed in CO. However, a non-negligible fraction of carbon remains in CH4 on both the day andthe night hemispheres. We note that CS06 ignore possible effectsdue to photochemistry on the CO and CH4 mixing ratios. Giventhe few explorations into hot Jupiter carbon and oxygen photo-chemistry to date (Liang et al. 2003, 2004; Visscher & Fegley2006), it is unclear how important photochemistry will be in de-termining the abundances of these species at pressures of tensto hundreds of millibar. CS06 did explore other effects such as
Fig. 3.—In gray is the full pressure and temperature extent of the 3168 P-Tprofiles from the CS06 simulation. In thick black are 13 randomly selected pro-files that allow one to make out individual profile shapes and temperatures. In themiddle of the gray, shown in white long dashes, is the Iro et al. (2005) profile. Thelabeled dotted curves show the condensation curves of important cloud species.The dashed curve shows where CH4 and CO have an equal abundance. All ofthese boundaries assume solar abundances. Note that dayside and limb profilestend to be generally isothermal at P < 200 mbar. The nightside profiles tend toplot over one another on the far left.
ATMOSPHERIC DYNAMICS AND HOT JUPITER SPECTRA 749No. 1, 2006

atmosphericmetallicity and temperature. If the atmosphere is greaterthan 'M/H ( ) 0:0, or if the atmosphere is hotter, the CH4/COratio would be even smaller. See CS06 for additional discussion.
In our spectral calculations, we find that significant differencesarise depending on our treatment of chemistry. We will thereforeinvestigate the effects of a few chemistry cases, as explained be-low, and shown in Table 1. We label our equilibrium chemistrytrial ‘‘case 0,’’ as it is the standard case. For ‘‘case 1,’’ we fix theCH4 /CO ratio at 0.014 (as found by CS06) at all temperatures andpressures along the profiles. Consistently incorporating the in-creasing CH4 /CO ratio at depth (P >1 bar) would be difficultwith previously tabulated opacities, and would have little to noeffect on the emergent spectra. Recall that 23%of available oxygenis lost to the formation of Mg-silicate clouds (Lodders 2003),which in this model have cloud bases near 1 kbar. The remainingoxygen is almost entirely found in CO and H2O. As the CH4 andCOabundances are fixed, for case 1wewill also fix the abundanceof H2O; the mixing ratios of CH4, CO, and H2O are consistentwith the amount of available oxygen at T ! 1200K and pressuresof tens of millibars.We also briefly consider a ‘‘case 2,’’ in whichthe CH4 /CO ratio has been further reduced, in an ad hoc manner,which could be due to quenching of the abundances at a hotter tem-perature or the photochemical destruction of CH4. The CH4/COratio is reduced by nearly a factor of 500, to 3 ; 10#5. Themixingratios of CO and H2O are nearly the same as in case 1, althoughthe slightly increased CO abundance (due to the drop in the abun-dance of CH4 and conservation of carbon atoms) uses up someoxygen at the expense of H2O. This case is valuable for compar-ison purposes because it shows the spectral effects of a negligibleCH4 abundance. In all cases, the mixing ratios of all other chem-ical species are given by equilibrium values. However, only CH4,CO, and H2O have a discernible impact on the spectra.
In Figure 4 we plot mixing ratios of CH4, CO, and H2O pre-dicted from equilibrium chemistry along three P-T profiles in theatmosphere of HD 209458b. In gray are the mixing ratios for theone-dimensional profile of Fortney et al. (2005). The abundanceof CH4 is negligible. In thin black and thick black are the mixingratios at the substellar point and the antistellar point, respectively,of the CS06 simulation. The dominant carbon carrier is clearlyCO, rather than CH4, except at P<100 mbar for the antistellarpoint. Most of the night side has a chemistry profile similar to theantistellar point, and hence, strong CH4 absorption will be seen.At the top of the plot, arrows indicate the assigned mixing ratiosof cases 1 and 2 for these three molecules.
In x 3 we make quantitative comparisons to current ground-based and space-based infrared data. While we find that theagreement is good for themodel presented here, wewish to stressthat this study is exploratory. This is the first study that quantita-tively explores the influence of atmospheric dynamics on the emer-gent spectra of a hot Jupiter atmosphere. The greatest uncertaintylikely lies in the calculation of heating/cooling rates with a simpleNewtonian cooling scheme in the dynamical model, as discussed
in Cooper & Showman (2005) and CS06. Another issue is thatCS06 calculate temperature deviations from a one-dimensionalradiative-convective profile published in Iro et al. (2005). How-ever, our emergent spectrum is calculated using our radiative trans-fer solver,which is a different code, andwe use different abundances(Lodders 2003) than these authors (Anders & Grevesse 1989).However, we find that when solving the radiative transfer for theIro et al. profile we obtain a Teff that differs by only 1% from theirvalue.In their nonequilibrium chemistry work, CS06 chose the abun-
dances of Lodders & Fegley (1998), while here we use (Lodders2003), in order for the most natural comparison with our previouswork (Fortney et al. 2005, 2006). Obviously no choice would befully self consistent. However, the choice of elemental abundancesis certainly a smaller concern than the current debate concerningthe correct chemical timescale for conversion of CO to CH4 inplanetary atmospheres (see Yung et al. 1988; Fegley & Lodders1994; Griffith&Yelle 1999; Bezard et al. 2002; Visscher&Fegley2005). In addition, CS06 have shown that a 300K decrease in tem-perature, for instance, leads to a twentyfold increase in CH4/CO(see x 5.3), so temperature uncertainties likely swamp any abun-dance issues. We stress that our focus in the following sections ison highlighting the spectral differences between a model that ac-counts for dynamical redistribution of energy around the planetand one that does not. Indeed the magnitude of the spectral effectsuggests that additional, more internally self consistent work, isclearly appropriate.
3. INFRARED SPECTRA
3.1. Spectra as a Function of Orbital Phase
We now turn to the predicted infrared spectrum of our dynam-ical model atmosphere. As has been shown bymany authors sinceSeager & Sasselov (1998) the infrared spectra of hot Jupiters arebelieved to be carved predominantly by absorption by H2O, CO,and, if temperatures are cool enough, CH4. In general, absorp-tion features of hot Jupiters are predicted to be shallower thanbrown dwarfs of similar effective temperature and abundances.This is predicated on hot Jupiters having a significantly shallower
TABLE 1
Chemistry Cases
Case XCH4XCO XH2O CH4 /CO Ratio
0................. Equilibrium Equilibrium Equilibrium Equilibrium
1................. 6.60E-6 4.81E-4 2.75E-4 0.014
2................. 1.50E-8 4.88E-4 2.69E-4 3.0E-5
Note.—Mixing ratios are given for each chemistry case. Abundances fromequilibrium chemistry calculations are used when specified.
Fig. 4.—Mixing ratios of CH4, CO, and H2O, as function of pressure, alongthree P-T profiles in the atmosphere of HD 209458b. These profiles are the one-dimensional profile from Fortney et al. (2005) in gray, the subsolar point of theCS06 simulation, in thin black, and the antistellar point of the CS06 simulation, inthick black. Arrows at the top of the plot indicate the fixedmixing ratios of cases 1and 2 chemistry, given in Table 1.
FORTNEY ET AL.750 Vol. 652
atmospheric temperature gradient, which is due to the intenseexternal irradiation by the parent star. Figure 5 shows absorptioncross sections permolecule forCH4,CO, andH2O from1 to 30!m.To avoid clutter on our spectral plots, we will not label absorptionfeatures, so referring to Figure 5 will be helpful.
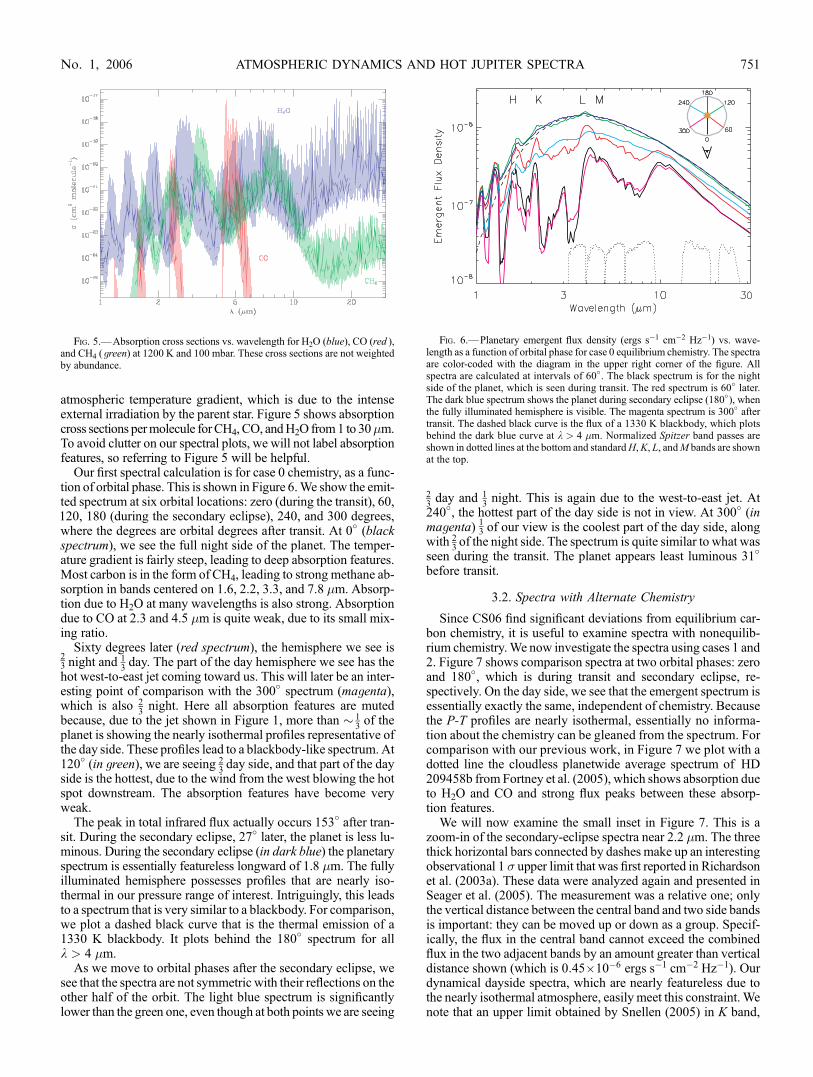
Our first spectral calculation is for case 0 chemistry, as a func-tion of orbital phase. This is shown in Figure 6.We show the emit-ted spectrum at six orbital locations: zero (during the transit), 60,120, 180 (during the secondary eclipse), 240, and 300 degrees,where the degrees are orbital degrees after transit. At 0" (blackspectrum), we see the full night side of the planet. The temper-ature gradient is fairly steep, leading to deep absorption features.Most carbon is in the form of CH4, leading to strong methane ab-sorption in bands centered on 1.6, 2.2, 3.3, and 7.8 !m. Absorp-tion due to H2O at many wavelengths is also strong. Absorptiondue to CO at 2.3 and 4.5 !m is quite weak, due to its small mix-ing ratio.
Sixty degrees later (red spectrum), the hemisphere we see is23 night and
13 day. The part of the day hemisphere we see has the
hot west-to-east jet coming toward us. This will later be an inter-esting point of comparison with the 300" spectrum (magenta),which is also 2
3 night. Here all absorption features are mutedbecause, due to the jet shown in Figure 1, more than ! 1
3 of theplanet is showing the nearly isothermal profiles representative ofthe day side. These profiles lead to a blackbody-like spectrum. At120" (in green), we are seeing 2
3 day side, and that part of the dayside is the hottest, due to the wind from the west blowing the hotspot downstream. The absorption features have become veryweak.
The peak in total infrared flux actually occurs 153" after tran-sit. During the secondary eclipse, 27" later, the planet is less lu-minous. During the secondary eclipse (in dark blue) the planetaryspectrum is essentially featureless longward of 1.8 !m. The fullyilluminated hemisphere possesses profiles that are nearly iso-thermal in our pressure range of interest. Intriguingly, this leadsto a spectrum that is very similar to a blackbody. For comparison,we plot a dashed black curve that is the thermal emission of a1330 K blackbody. It plots behind the 180" spectrum for allk > 4 !m.
As we move to orbital phases after the secondary eclipse, wesee that the spectra are not symmetric with their reflections on theother half of the orbit. The light blue spectrum is significantlylower than the green one, even though at both points we are seeing
23 day and 1
3 night. This is again due to the west-to-east jet. At240", the hottest part of the day side is not in view. At 300" (inmagenta) 1
3 of our view is the coolest part of the day side, alongwith 2
3 of the night side. The spectrum is quite similar to what wasseen during the transit. The planet appears least luminous 31"
before transit.
3.2. Spectra with Alternate Chemistry
Since CS06 find significant deviations from equilibrium car-bon chemistry, it is useful to examine spectra with nonequilib-rium chemistry.We now investigate the spectra using cases 1 and2. Figure 7 shows comparison spectra at two orbital phases: zeroand 180", which is during transit and secondary eclipse, re-spectively. On the day side, we see that the emergent spectrum isessentially exactly the same, independent of chemistry. Becausethe P-T profiles are nearly isothermal, essentially no informa-tion about the chemistry can be gleaned from the spectrum. Forcomparison with our previous work, in Figure 7 we plot with adotted line the cloudless planetwide average spectrum of HD209458b from Fortney et al. (2005), which shows absorption dueto H2O and CO and strong flux peaks between these absorp-tion features.
We will now examine the small inset in Figure 7. This is azoom-in of the secondary-eclipse spectra near 2.2 !m. The threethick horizontal bars connected by dashes make up an interestingobservational 1 # upper limit that was first reported in Richardsonet al. (2003a). These data were analyzed again and presented inSeager et al. (2005). The measurement was a relative one; onlythe vertical distance between the central band and two side bandsis important: they can be moved up or down as a group. Specif-ically, the flux in the central band cannot exceed the combinedflux in the two adjacent bands by an amount greater than verticaldistance shown (which is 0:45 ; 10#6 ergs s#1 cm#2 Hz#1). Ourdynamical dayside spectra, which are nearly featureless due tothe nearly isothermal atmosphere, easily meet this constraint.Wenote that an upper limit obtained by Snellen (2005) in K band,
Fig. 5.—Absorption cross sections vs. wavelength for H2O (blue), CO (red ),and CH4 (green) at 1200 K and 100 mbar. These cross sections are not weightedby abundance.
Fig. 6.—Planetary emergent flux density (ergs s#1 cm#2 Hz#1) vs. wave-length as a function of orbital phase for case 0 equilibrium chemistry. The spectraare color-coded with the diagram in the upper right corner of the figure. Allspectra are calculated at intervals of 60". The black spectrum is for the nightside of the planet, which is seen during transit. The red spectrum is 60" later.The dark blue spectrum shows the planet during secondary eclipse (180"), whenthe fully illuminated hemisphere is visible. The magenta spectrum is 300" aftertransit. The dashed black curve is the flux of a 1330 K blackbody, which plotsbehind the dark blue curve at k > 4 !m. Normalized Spitzer band passes areshown in dotted lines at the bottom and standardH,K, L, andM bands are shownat the top.
ATMOSPHERIC DYNAMICS AND HOT JUPITER SPECTRA 751No. 1, 2006

which covers a similar wavelength range, has an error bar that istoo large to distinguish among published models.
In contrast to the models presented here that include dynamics,published one-dimensional models to date all predict large fluxdifferences between 2.2 !m and the surrounding spectral regionswhen abundances are solar. The one-dimensional models withsolar abundances presented in Seager et al. (2005), for example,were not able to meet the 2.2 !m flux-difference constraint, be-cause the H2O bands adjoining the 2.2 !m flux peak were toodeep. Seager et al. (2005) suggested that if C/O>1, then littleH2O would exist in the atmosphere, and the observational con-straint could be met. Here, we propose instead that dynamics pro-duce a relatively isothermal dayside temperature, in which casethe constraint can easily be met even with solar C/O.
Nevertheless, the observational constraint is not yet firm enoughto fully rule out the one-dimensional radiative-equilibrium modelsat solar abundances. The Fortney et al. (2005) solar-abundancemodels, for example, marginally meet the current observationalflux-difference constraint. (Fortney et al. 2005 find a flux differ-ence of 0:43 ; 10#6 ergs s#1 cm#2 Hz#1.) The cause for the dis-crepancy between the one-dimensional models in Fortney et al.(2005) and Seager et al. (2005) remains unclear but could occurif the P-T profiles in Seager et al. were steeper than those inFortney et al., leading to deeper bands in the former study. Moreprecise flux-difference observations like that of Richardson et al.(2003a) during secondary eclipse would help confirm or rule outthe one-dimensional solar-abundance models. Even a factor of2 decrease in the observational upper limit between the ‘‘in’’ and‘‘out’’ bands could rule out the solar-abundance Fortney et al.(2005) model, while supporting the isothermal-dayside models(e.g., CS06) and the C/O>1 models with weak water bands.Alternatively, the detection of a small flux peak at 2.2 !mwouldlend support to the one-dimensional models with C/O< 1, whileconstraining the temperature gradient on the planet’s dayside.
The fact that both the solar-abundanceCS06models ( presentedhere) and the radiative-equilibrium one-dimensional models withC/O>1 produce almost no flux difference between 2.2 !m and
the surrounding continuum implies that the 2.2 !m band can-not be used to distinguish between these alternatives. Instead,additional constraints at other wavelengths will be necessary todiscriminate between them.Measurements of flux differences sur-rounding CO (rather than H2O) bands could provide such a test.The radiative-equilibriumC/O>1models, although lackingwaterbands, would presumably have strongCO bands andwould hencepredict a strong flux difference between the center of a CO bandand the surrounding continuum. On the other hand, because thedayside atmosphere is nearly isothermal in the CS06 models,these circulation-alteredmodels would predict little flux differencebetween the CO band and the surrounding regions even in thepresence of large quantities of CO. An observation of minimalflux difference across CO bands as well as H2O bandswould sup-port isothermal-dayside models like CS06 while arguing againstthe radiative-equilibrium one-dimensional modelswith steep tem-perature gradients.Although observations of TrES-1 may not be directly appli-
cable to HD 209458b, as TrES-1 may have a Teff 300 K cooler,there is an important issue to note for our discussion here. Themodels of Fortney et al. (2005), Seager et al. (2005), and Barmanet al. (2005) show a mid-infrared spectral slope that is bluer thanobserved from 4.5 to 8.0 !m by Charbonneau et al. (2005) forTrES-1, although the model of Burrows et al. (2005) appears tobe consistent with this slope. Showman & Cooper (2006) andFortney et al. (2006) have discussed that models with an atmo-spheric temperature inversion would give infrared spectra with aredder spectral slope, due tomolecular emission features, in betteragreement with observations. The CS06 model of the day side ofHD 209458b, which lacks the strong negative temperature gra-dient of these radiative equilibrium models, also leads to a reddermid-infrared spectral slope.On the planet’s night side, we see significant spectral differ-
ences between the three chemistry cases. In cases 1 and 2, the CH4
mixing ratio is constrained to a small abundance, weakening theseabsorption features. Absorption due to CH4, CO, and H2O isreadily seen in case 1. Case 2 shows essentially the same CO andH2O absorption, but CH4 absorption is no longer seen. The tran-sition, as a function of orbital phase from deep to essentially non-existent absorption features in cases 1 and 2, are similar to whatwas seen in case 0. In the interest of conciseness, and becausecase 2 is ad hoc, hereafter we concentrate on cases 0 and 1. Thespectra for cases 1 and 2 are essentially the same, except in re-gions of CH4 absorption; wewill highlight these differences whennecessary. It is important to remember that in case 1 and case 2chemistry, themixing ratios of our principal absorbers, CH4, CO,and H2O are fixed. Therefore, changes in the spectra with orbitalphase are only due to changes in the planetary P-T profiles on thevisible disk, due to the rotation of the planet through its orbit.One can integrate the spectrum of the planet’s visible hemi-
sphere over all wavelengths, as a function of orbital phase, to de-termine the apparent luminosity of the planet at all phases. Herewe divide out 4$R2# to calculate the apparent effective temper-ature (Teff) of the visible hemisphere. This is plotted in Figure 8 forcases 0 and 1. We can clearly see that in both cases, the time ofmaximum flux precedes the time of secondary eclipse by !27",or 6.3 hr. Since the spectra of the two cases overlap around thetime of secondary eclipse, so do the plots of Teff. At other orbitalphases, the case 0 curve always plots lower. The largest effect isbefore the time of transit. The effect is tied to the CH4 abundance.If CH4 is able to attain a large mixing ratio, it leads to an atmo-sphere that has a higher opacity, meaning one cannot see as deeplyinto the atmosphere.One then reaches an optical depth of!1 higherin the atmosphere, which is significantly cooler for nightside P-T
Fig. 7.—Planetary emergent flux density (ergs s#1 cm#2 Hz#1) vs. wave-length at two orbital phases for all three of our chemistry cases. The spectrum at180", during the secondary eclipse, is essentially the same for all three cases. At0", during the transit, CH4 is very abundant in the case 0 trial, leading to deepabsorption features centered at 1.6, 2.2, 3.3, and 7.8 !m. Absorption due to CO ismuted in case 0, but is strong in cases 1 and 2. Water vapor absorption is strongin all cases. Inset: Zoom near 2.2 !m. The three thick horizontal lines con-nected by dashes are a constraint on the maximum relative height of the flux peakat 2.2 !m (middle band), compared to the average of the flux in the two adjacentbands, from Seager et al. (2005). The bars can be shifted together vertically. (Seetext.)
FORTNEY ET AL.752 Vol. 652

profiles, leading to a lower Teff . The point of minimum planetaryflux precedes the transit by 31"Y37", depending on the chemistry.
In their (very similar) previous dynamical model, Cooper &Showman (2005) predicted a time of maximum planetary flux of60" (or 14 hr) before secondary eclipse. The large timing differ-ence between that work and this one is due almost entirely to thechoice of ‘‘photospheric pressure’’ made in Cooper & Showman(2005). They chose a pressure of 220 mbar in their work, whichis deeper than the ‘‘mean’’ photosphere that we findhere.At higherpressure, the radiative timescales are longer, such that winds areable to blow the atmosphere’s hottest point farther downstream.Cooper & Showman (2005) and CS06 previously discussed howtheir prediction varied as a function of the chosen photosphericpressure.
4. INFRARED LIGHT CURVES
4.1. Spitzer Bands
For the foreseeable future, themost precise data for understand-ing the atmospheres of hot Jupiters will come from the SpitzerSpace Telescope. For HD 209458b, only an observation at 24 !m(the shortestwavelengthMIPS band), has been published. It seemslikely that observations in all four IRAC bands (3.6, 4.5, 5.8, and8.0 !m), as well as IRS at 16!m,will be obtainedwithin the nextyear or two. As such, we have integrated the spectra of our planetmodels and a Kurucz (1993) model of star HD 209458 over theSpitzer bands in order to generate planet-to-star flux ratios as a func-tion of orbital phase. These are plotted for cases 0 and 1 in Figure 9.The stellar model fits the stellar parameters derived in Brown et al.(2001) and is the same model used in Fortney et al. (2005).
The behavior of the planet-to-star flux ratios is quite interest-ing. While the Teff of the planet was found to reach a maximum27" before secondary eclipse, the behavior in individual bands ismore varied. For instance, in both chemistry cases, the planetaryflux in the 24 !m band peaks only 15" before secondary eclipse.This is because the ‘‘photospheric pressure’’ is at a lower pressurein this band than the planet’s ‘‘mean photospheric pressure.’’As pre-viously discussed, at lower pressures, the radiative time constantsare shorter, and the atmosphere is able to more quickly adjust tochanges in incident flux. At higher pressure, winds are better ableto blow the planet’s hot spot downstream. One should keep inmind that the light curves generated are a function of the dynam-ical calculation and the radiative transfer. It is the radiative trans-fer calculation that determines how deeply into the atmosphere(and therefore, to what temperature) we see.
The 3.6 !m band peaks earliest,!27" before transit, as the Teffdoes as well. This band shows a fifteenfold variation in flux( peak to trough) as a function of orbital phase for case 0 becauseit encompasses a significant CH4 absorption feature that waxesand wanes. Since the abundances of CH4 and CO are not free tovary in case 1, the flux ratios in this case do not show the largeamplitudes found in some bands in case 0. The dotted lines inthe case 1 panels are for case 2 in the 3.6 and 8.0 !m bands,where CH4 absorption occurs. The flux variation in these bandsis even further reduced as CH4 absorption is not seen (see Fig. 7.)At 24 !m, our model is 1.6 # higher than the secondary eclipsedata point published by Deming et al. (2005) indicating that theplanet may be dimmer at 180" than we predict. In all bands,differences in chemistry between the two cases have essentiallyno effect on the timing of themaxima in planetary flux. However,since the night side is much more sensitive to chemistry, theminima can vary by as much as 20" in bands that are sensitive toCH4 absorption.
4.2. Standard Infrared Bands
The results of ground-basedobservations of flux fromhot Jupitershave been mixed. All searches for visible light have yielded onlyupper limits (Charbonneau et al. 1999; Collier Cameron et al. 2002;Leigh et al. 2003), which have ruled out somemodels with brightreflecting clouds. In the near infrared, specifically for HD 209458b,Richardson et al. (2003a, 2003b) have constrainedmolecular bandsof CH4 and H2O. The constraint on emission at 2.3 !m betweenH2O absorption features was shown in Figure 7. The predictedplanet-to-star flux ratio really does not become favorable untilwavelengths longer than 3 !m, which may continue to challengeobservers.
Fig. 8.—Effective temperature of the visible hemisphere of HD 209458b as afunction of orbital phase for two chemistry cases.
Fig. 9.—Planetary flux in Spitzer bands as a function of planetary orbitalphase. The left panels are case 0 and right panels case 1. The bottom panels showthe HD 209458b planet-to-star flux ratios. The top panels show the planetaryflux at every phase divided by the planetary flux seen during the transit (at 0").The dotted lines indicate predictions for case 2 chemistry. At 180" is theDeming et al. (2005) secondary eclipse observation at 24 !m, with 1 # error bars(0:00260 * 0:00046). This is shown in magenta, which is the color used for the24 !m curve.
ATMOSPHERIC DYNAMICS AND HOT JUPITER SPECTRA 753No. 1, 2006

In Figure 10 we plot planet-to-star flux ratios in theMauna KeaObservatory (MKO) H (!1.6 !m), K (!2.2 !m), L0 (!3.8 !m),and M0 (!4.7 !m) bands. Since the wavelength ranges of the L0
and M0 bands have significant overlap with the IRAC 3.6 and4.5!mbands, the predicted ratios are quite similar. In dark blue, weshow the L0-band upper limit of#0:0007 * 0:0014fromDeminget al. (2006b). The model is just above the 1 # error bar.5 This is abetter match than is attained with one-dimensional radiative equi-librium models (Deming et al. 2006b), which predict a flux peakjust short of 4!m, as shown in Figure 7. The Fortney et al. (2005)HD 209458b radiative equilibrium model, which has somewhatmuted flux peaks compared with similar models by other authors,has a planet-to-star flux ratio of 0.00114 in L0 band. In dotted bluein the case 1 panels is ourL0 band (which encompassesCH4 absorp-tion) prediction for case 2 chemistry. Looking at shorter wave-lengths, in the H and K bands, the planet is predicted to bedimmer, while the star is brighter, leading to low flux ratios. Thepeak emission in these bands does occur earlier than in the Spitzerbands. For instance, the H-band peak is 42" before secondaryeclipse.
5. DISCUSSION
5.1. Effective Temperature
For the CS06 dynamical model of the atmosphere of HD209458b, we find that the apparent Teff of the visible hemisphere
is strongly variable, with a maximum of 1390 K and a minimumof 915 K for equilibrium chemistry and 1025 K for (the probablymore realistic case of ) disequilibrium chemistry. This leads to aluminosity of the visible planetary hemisphere that varies by fac-tors of 5.3 and 3.4, respectively for these two cases. For the one-dimensional Iro et al. (2005) planetwide profile, we derive aTeA ) 1325 K, 1% less than found by the authors. The daysideTeff for the dynamical model is not significantly larger than thisplanetwide Teff . As an additional comparison, we calculate themean of the planetary luminosity over the entire orbit and then con-vert toTeff to find ameanTeff for cases 0 and 1. This givesTeff valuesof 1195 and 1227 K, respectively, showing that the CS06 model,at the pressures levels that radiate to space, is as a whole some-what colder than the one-dimensional profile of Iro et al. (2005).This is likely a consequence of the radiative forcing scheme em-ployed in CS06, which will be reinvestigated when models thatconsistently couple radiative transfer and dynamics are developed.The !400 K Teff contrasts found are predominantly due to
changes in the temperature structure of the hemisphere that is vis-ible as function of orbital phase. In addition, atmospheric opacitymakes an important contributionwhen the CH4/CO ratio is free tovarywith pressure and temperature.When the CH4mixing ratio isbelow that predicted by equilibrium chemistry, this leads to alower opacity atmosphere, for a given P-T profile. While the fewindividual bands of CO are somewhat stronger than those of CH4,CH4 absorption across the planet’s broad the 2Y10 !m flux peakdominates over the two bands of CO. One is able to see moredeeply into a CH4-depleted atmosphere, leading to a higher Teff .
5.2. HD 209458b Infrared Data
Currently, the only published secondary eclipse datum fromSpitzer for HD 209458b is the 24 !m detection of Deming et al.(2005). The models presented here have a planet-to-star flux ratioduring secondary eclipse that is 1.6 # larger than this observationaldata point. Together with our excellent agreement with the ground-based data at 2.3 !m from Richardson et al. (2003a) and Seageret al. (2005) and our 1.1 # difference with the 3.8 !m data fromDeming et al. (2006b), we regard this as excellent agreement—significantly better than has been previously obtained with one-dimensional radiative equilibrium models.It is interesting to discuss a few issues that arise if the flux
ratios are indeed 10%Y25% less than we calculate here, as in-dicated by the L0 and 24 !m band data. For instance, perhapsday-night temperature contrasts in the atmosphere are not aslarge as predicted by CS06, leading to smaller deviations from a‘‘planetwide’’ TeA !1200 K. This may involve radiative timeconstants that are significantly longer than predicted by Iro et al.(2005), winds faster than predicted by CS06, or both. It wouldbe worthwhile for other groups that possess hot Jupiter radiativetransfer codes to compute radiative time constants at these tem-peratures and pressures. This is an area that we will pursue inthe near future.Another possibility for a smaller planet-to-star flux ratio dur-
ing secondary eclipse would be if the planet had a larger Bondalbedo than calculations currently indicate. This would mean lessabsorbed stellar flux and correspondingly lower temperatures every-where on the planet. Cooler temperatures everywhere on the planetwould lead to chemical abundances that differ from our previ-ous cases. More CH4 would form, at the expense of CO, whichwould also lead to a slightly higher mixing ratio for H2O, whichshares oxygen with CO.Hot Jupiters are believed to have very low Bond albedos—on
the order of 90% or more of incident stellar flux is expected to beabsorbed. In Fortney et al. (2005)we found that our one-dimensional
Fig. 10.—Planetary flux in MKO infrared bands as a function of planetaryorbital phase. The left panels are case 0 and right panels case 1. The bottom panelsshow the HD 209458b planet-to-star flux ratios. The top panels show the plan-etary flux at every phase divided by the planetary flux seen during the transit (at0"). The dotted line indicates a prediction for case 2 chemistry. At 180" is theDeming et al. (2006b) secondary eclipse observation at L0 band, with 1 # errorbars. The observation is#0:0007 * 0:0014, so the actual data point is well off ofthe bottom of the plot. This is shown in dark blue, which is the color used for theL0 curve.
5 As described in Deming et al. (2006b) this observation was actuallyperformed in a narrow band centered on 3.8 !m, within the standard L0 band.Our calculated planet-to-star flux ratio at secondary eclipse increases by 4%when using this narrow band, compared to standard L0. Since this is a smallcorrection, our conclusions are unchanged.
FORTNEY ET AL.754 Vol. 652

model atmosphere for HD 209458b scattered only 8% of inci-dent flux. For TrES-1, this was 6%. To date, there is at least a hintthat the Bond albedo of TrES-1 may have been underestimated.Charbonneau et al. (2005) under the assumption that the planetemits as a blackbody, determined a Bond albedo of 0:31 * 0:14from their Spitzer IRAC observations at 4.5 and 8.0 !m. Perhapshot Jupiters are not quite as hot as had been previously thought.However, this determination should be considered very prelim-inary at this time.
Richardson et al. (2006) have recently observed the transit ofHD 209458b at 24 !m, as well. From an observed transit depthof 0:0149 * 0:0003, they determined the radius of the planet inthis band to be (1:26 * 0:08)RJ, which includes uncertaintiesin the stellar radius. Our model predicts a change in the appar-ent planet-to-star flux ratio of !0.00008 during the 20" of theRichardson et al. (2006) transit observations, !4 times smallerthan their uncertainty, and hence too small to have been detected.As was seen in Figures 9 and 10, the change in planetary flux as afunction of orbital phase is not as pronounced near the time oftransit (and secondary eclipse) as it is at other phases.
5.3. Temperature Sensitivity
To illustrate the sensitivity of our results to temperature changes,we have computed spectra as a function of orbital phase, usingequilibrium (case 0) chemistry for two additional models. Theseare additional dynamical models described in CS06, in which thebase P-T profile of Iro et al. (2005) has been increased or de-creased by 300 K, with correspondingly warmer or colder nightsides. The full dynamical simulations have been run again withthese parameters. The resulting light curves, in Spitzer bands, areshown in Figures 11a, and 11c. For the ‘‘cold’’ (#300 K) model
CH4 is the dominant carbon carrier on the night hemisphere, andCO on the day hemisphere, leading to large flux variation in ex-cess of that found for our nominal CS06 simulation, as shown inFigure 11. For the ‘‘hot’’ (+300 K) model, on both the day andnight hemispheres, CO is the dominant carbon carrier. Methaneabsorption features are very weak on the night side, leading toflux variations in every band no larger than a factor of 2.7 frompeak to trough. This model is somewhat similar to our earliercase 2, but at warmer temperatures, as at all phases CO is the dom-inant carbon carrier. Fluxes are everywhere greater in the hotmodel than the nominal model, and everywhere less in the coldmodel than in the nominal model. This is due to the differingatmospheric temperatures. The cold model best fits the Deminget al. (2005) datum at 24 !m. In addition, the phase of maximumand minimum flux in a given band can change by up to !10"
between these simulations, due both to differing chemistry andatmospheric dynamics. As discussed in Cooper & Showman(2005) and CS06, while these models all possess similarly strongeast-to-west jets, the dynamical atmospheres differ slightly indetail.
CS06 also examined nonequilibrium CH4/CO chemistry forthese models. For the ‘‘cold’’ (#300 K) model, nonequilibriumchemistry was important, and the CH4/CO ratio at P < 1 bar be-came homogenized at 0.20 around the entire planet. This ratiowas 0.014 for the nominal case 1 described earlier. For the coldmodel, equilibrium chemistry would predict a night side domi-nated by CH4 and a day side dominated by CO. For the ‘‘hot’’model (+300 K) both equilibrium and nonequilibrium chemistrypredicts that CO is the dominant carbon carrier on both the dayand side hemispheres. Figure 11d shows our computed flux ra-tios for nonequilibrium chemistry for the cold case. As was
Fig. 11.—Planetary flux in Spitzer bands as a function of planetary orbital phase. The light curves in panels a, b, and c assume equilibrium chemistry, while panel d usesnonequilibrium chemistry. The bottom panels show the HD 209458b planet-to-star flux ratios. The top panels show the planetary flux at every phase divided by theplanetary flux seen during the transit (at 0"). Panel a shows the CS06 simulation with a 300 K increase in temperature. Panel b shows the nominal case 0 simulation,previously shown in Fig. 9a. Panel c shows the CS06 dynamical simulation with a 300 K temperature decrease. Panel d is also the simulation with the 300 K temperaturedecrease, but uses nonequilibrium chemistry with a fixed CH4 /CO ratio of 0.20. (See text.) For all panels, the Deming et al. (2005) datum at 24 !m is shown.
ATMOSPHERIC DYNAMICS AND HOT JUPITER SPECTRA 755No. 1, 2006

shown previously for our nominal case, flux variation is smallerwith nonequilibrium chemistry, because themixing ratios of CH4,CO, and H2O are the same on the night and day hemispheres.Again, because of the nearly isothermal temperature structure ofthe day side, chemical abundances have little effect on the day-side planet-to-star flux ratios, which are nearly equal for thesetwo chemistry cases.
These additional cases further highlight the importance ofCH4/CO chemistry in the computation of infrared light curves.Infrared fluxes as a function of orbital phase are sensitive to thetemperatures of the hemisphere facing the observer, as well asthe abundances of important molecular absorbers. For planetaryP-T profiles that cross important CH4/CO chemical boundaries,as most hot Jupiters surely do, whether or not these species arefound in their equilibrium mixing ratios has a major impact onresulting infrared flux in Spitzer bands, especially on the nightside.
5.4. The Future and Conclusions
From the size of the error bar from the Deming et al. (2005)24!mobservations, it is clear that, could this instrument stabilitybe sustained over the course of tens of hours of observations, thechange in flux over time presented here could be detected. One-half of an orbital period for HD 209458b is 42 hr. If flux in the8.0 !m band for HD 209458b is higher than models predict, aswas the case for TrES-1 (Fortney et al. 2005; Barman et al. 2005),then this would be an attractive band as well, as the error barsshould be smaller.
What might one hope to see with sustained observations? Ifthe peak in infrared flux does occur only !25"Y30" before sec-ondary eclipse, this would be difficulty to discern. However, thedetection of any sort of ramp up in flux from the time of transit tosecondary eclipse would give us important information on theday-night temperature contrast. The recently discovered transit-ing planet HD 189733b (Bouchy et al. 2005) would likely be anevenmore attractive target, as the planet-star flux ratios are likelytwice as large (Fortney et al. 2006; Deming et al. 2006a), andthe orbital period is!40% shorter. We predict secondary eclipseplanet-to-star flux ratios for this system in Fortney et al. (2006);our calculation at 16 !m is a good match to the published ob-servation of Deming et al. (2006a).
A clear prediction from our calculations here is that when oneuses realistic nonequilibrium chemistry calculations, the changein planetary flux as a function of orbital phase is greatly reduced,relative to equilibrium chemistry calculations, because the atmo-
sphere’s composition is fixed. For the Spitzer bands, for case 0,the maximum flux variation is in the 3.6 !m band, which variesby a factor of 15 from peak to trough. Theminimum variation is afactor of 2.2, in the 16 !m band. For case 1, this variation dropssignificantly, and the maximum variation is a factor of 3.7, in the5.8 !m band, and the minimum is 2.0, again in the 16 !m band.We suggest that the 5.8 and 8.0 !mbands may be the best Spitzerbands in which to search for flux variations as a function oforbital phase, as these bands combine a high planet-to-star fluxratio and the sensitivity and stability of the IRAC detectors.If the dayside thermal emission of hot Jupiters is similar to a
blackbody, as we find here, problems arise with the notion thatthe emission can be used to characterize the atmospheric chem-istry from secondary eclipse observations. Absorption features dueto CH4, CO, and H2O would be nonexistent or extremely weak.Observations at other orbital phases would then take on addi-tional importance.Given the significant spectral differences between our model
and radiative-equilibrium models, it is clear that more workin this area is certainly warranted. We note that blackbody-likehot Jupiter emission can simultaneously explain all observationsto date. First is the secondary eclipse observation at 24 !m byDeming et al. (2005), a clear detection. Second is the very lowflux ratio upper limit in L0 band byDeming et al. (2006b). Third isthe 2.3!m relative flux observation of Richardson et al. (2003a),whichmost one-dimensionalmodels cannot fit (Seager et al. 2005).Fourth is the set of observations of TrES-1 by Charbonneau et al.(2005), who found an infrared spectral slope from 4.5 to 8 !mthat was redder than that found by most one-dimensional models(Fortney et al. 2005; Barman et al. 2005). Additional observationsof these planets, especially in the Spitzer 3.6 !m band, whichcatches much of the predicted 4 !m flux peak, would strengthenor refute this argument and provide a critical test for the CS06dynamical simulation. Deming et al. (2006b) posited, perhapswith a wink, that a blackbody-like spectrum would be more con-sistent with observations to date than any published hot Jupitermodel. Due to the dynamically altered temperature structure of theatmosphere of HD 209458b, we find that this could be the reality.
We acknowledge support from NASA Postdoctoral Program(NPP) and Spitzer Space Telescope fellowships (J. J. F.), NASAGSRP fellowship NGT5-50462 (C. S. C.), NSF grant AST 03-07664 (A. P. S.), and NASA grants NAG2-6007 and NAG5-8919 (M. S. M.).
REFERENCES
Anders, E., & Grevesse, N. 1989, Geochim. Cosmochim. Acta, 53, 197Barman, T. S., Hauschildt, P. H., & Allard, F. 2005, ApJ, 632, 1132Bezard, B., Lellouch, E., Strobel, D., Maillard, J.-P., & Drossart, P. 2002,Icarus, 159, 95
Bouchy, F., et al. 2005, A&A, 444, L15Brown, T. M., Charbonneau, D., Gilliland, R. L., Noyes, R. W., & Burrows, A.2001, ApJ, 552, 699
Burkert, A., Lin, D. N. C., Bodenheimer, P. H., Jones, C. A., & Yorke, H. W.2005, ApJ, 618, 512
Burrows, A., Hubeny, I., & Sudarsky, D. 2005, ApJ, 625, L135Burrows, A., Sudarsky, D., & Hubeny, I. 2006, ApJ, 650, 1140Charbonneau, D., Brown, T. M., Burrows, A., & Laughlin, G. 2006, in Proto-stars and Planets V, ed. Reipurth, D. Jewitt, & K. Keil (Tucson: Univ. ArizonaPress) in press (astro-ph/0603376)
Charbonneau, D., Brown, T. M., Latham, D. W., & Mayor, M. 2000, ApJ, 529,L45
Charbonneau, D., Brown, T. M., Noyes, R. W., & Gilliland, R. L. 2002, ApJ,568, 377
Charbonneau, D., Noyes, R. W., Korzennik, S. G., Nisenson, P., Jha, S., Vogt,S. S., & Kibrick, R. I. 1999, ApJ, 522, L145
Charbonneau, D., et al. 2005, ApJ, 626, 523Cho, J. Y.-K., Menou, K., Hansen, B. M. S., & Seager, S. 2003, ApJ, 587, L117Collier Cameron, A., Horne, K., Penny, A., & Leigh, C. 2002, MNRAS, 330,187
Cooper, C. S., & Showman, A. P. 2005, ApJ, 629, L45———. 2006, ApJ, 649, 1048 (CS06)Deming, D., Harrington, J., Seager, S., & Richardson, L. J. 2006a, ApJ, 644,560
Deming, D., Richardson, L. J., Seager, S., & Harrington, J. 2006b, in TenthAnniversary of 51 Peg-b: Status of and Prospects for Hot Jupiter Studies, ed.L. Arnold, F. Bouchy, & C. Moutou (Paris: Frontier Group), 218
Deming, D., Seager, S., Richardson, L. J., & Harrington, J. 2005, Nature, 434,740
Fegley, B., & Prinn, R. G. 1985, ApJ, 299, 1067Fegley, B. J., & Lodders, K. 1994, Icarus, 110, 117———. 1996, ApJ, 472, L37Fortney, J. J., Marley, M. S., Lodders, K., Saumon, D., & Freedman, R. 2005,ApJ, 627, L69
Fortney, J. J., Saumon, D., Marley, M. S., Lodders, K., & Freedman, R. S.2006, ApJ, 642, 495
FORTNEY ET AL.756 Vol. 652

Goody, R., West, R., Chen, L., & Crisp, D. 1989, J. Quant. Spectrosc. Radiat.Transfer, 42, 539
Griffith, C. A., & Yelle, R. V. 1999, ApJ, 519, L85Henry, G. W., Marcy, G. W., Butler, R. P., & Vogt, S. S. 2000, ApJ, 529, L41Holton, J. R. 1992, An Introduction to Dynamic Meteorology (3rd ed.; SanDiego: Academic)
Iro, N., Bezard, B., & Guillot, T. 2005, A&A, 436, 719Kalnay, E. 2002, Atmospheric Modeling, Data Assimilation and Predictability(Cambridge: Cambridge Univ. Press)
Kurucz, R. 1993, CD-ROM 13, ATLAS9 Stellar Atmosphere Programs and2 km/s Grid (Cambridge: SAO)
Leigh, C., Collier Cameron, A., Udry, S., Donati, J.-F., Horne, K., James, D., &Penny, A. 2003, MNRAS, 346, L16
Liang, M., Parkinson, C. D., Lee, A. Y.-T., Yung, Y. L., & Seager, S. 2003,ApJ, 596, L247
Liang, M., Seager, S., Parkinson, C. D., Lee, A. Y.-T., & Yung, Y. L. 2004,ApJ, 605, L61
Lodders, K. 2002, ApJ, 577, 974———. 2003, ApJ, 591, 1220Lodders, K., & Fegley, B. 1998, The Planetary Scientist’s Companion (NewYork: Oxford Univ. Press)
———. 2002, Icarus, 155, 393Marley, M. S., Fortney, J., Seager, S., & Barman, T. 2006, in Protostars andPlanets V, ed. B. Reipurth, D. Jewitt, & K. Keil (Tucson: Univ. ArizonaPress) in press (astro-ph/0602468)
Noll, K. S., Geballe, T. R., & Marley, M. S. 1997, ApJ, 489, L87Prinn, R. G., & Barshay, S. S. 1977, Science, 198, 1031Richardson, L. J., Deming, D., & Seager, S. 2003a, ApJ, 597, 581
Richardson, L. J., Deming, D., Wiedemann, G., Goukenleuque, C., Steyert, D.,Harrington, J., & Esposito, L. W. 2003b, ApJ, 584, 1053
Richardson, L. J., Harrington, J., Seager, S., & Deming, D. 2006, ApJ, 649,1043
Saumon, D., Geballe, T. R., Leggett, S. K., Marley, M. S., Freedman, R. S.,Lodders, K., Fegley, B., & Sengupta, S. K. 2000, ApJ, 541, 374
Saumon, D., Marley, M. S., Cushing, M. C., Leggett, S. K., Roellig, T. L.,Lodders, K., & Freedman, R. S. 2006, ApJ, 647, 552
Saumon, D., Marley, M. S., Lodders, K., & Freedman, R. S. 2003, in Proc. IAUSymp. 211, Brown Dwarfs, ed. E. Martin (San Francisco: ASP), 345
Seager, S., Richardson, L. J., Hansen, B. M. S., Menou, K., Cho, J. Y.-K., &Deming, D. 2005, ApJ, 632, 1122
Seager, S., & Sasselov, D. D. 1998, ApJ, 502, L157Showman, A. P., & Cooper, C. S. 2006, in Tenth Anniversary of 51 Peg-b:Status of and Prospects for Hot Jupiter Studies, ed. L. Arnold, F. Bouchy, &C. Moutou (Paris: Frontier Group), 242
Showman, A. P., & Guillot, T. 2002, A&A, 385, 166Snellen, I. A. G. 2005, MNRAS, 363, 211Suarez, M. J., & Takacs, L. L., ed. 1995, Documentation of the Aries/GEOSDynamical Core Version 2 (NASA Tech. Memo 104606)
Toon, O. B., McKay, C. P., Ackerman, T. P., & Santhanam, K. 1989, J. Geophys.Res., 94, 16287
Visscher, C., & Fegley, B. J. 2005, ApJ, 623, 1221———. 2006, ApJ, 648, 1181Williams, P. K. G., Charbonneau, D., Cooper, C. S., Showman, A. P., &Fortney, J. J. 2006, ApJ, 649, 1020
Yung, Y. L., Drew, W. A., Pinto, J. P., & Friedl, R. R. 1988, Icarus, 73, 516
ATMOSPHERIC DYNAMICS AND HOT JUPITER SPECTRA 757No. 1, 2006