Embed Size (px)
Citation preview
The Astrophysical Journal, 709:1396–1406, 2010 February 1 doi:10.1088/0004-637X/709/2/1396C© 2010. The American Astronomical Society. All rights reserved. Printed in the U.S.A.
TRANSMISSION SPECTRA OF THREE-DIMENSIONAL HOT JUPITER MODEL ATMOSPHERES
J. J. Fortney1, M. Shabram
1, A. P. Showman
2, Y. Lian
2, R. S. Freedman
3,4, M. S. Marley
3, and N. K. Lewis
21 Department of Astronomy and Astrophysics, University of California, Santa Cruz, CA 95064, USA; [email protected]
2 Lunar and Planetary Laboratory, 1629 E. University Blvd., University of Arizona, Tucson, AZ, USA3 Space Science and Astrobiology Division, NASA Ames Research Center, Mail Stop 245-3, Moffett Field, CA 94035, USA
4 SETI Institute, 515 N. Whisman Road, Mountain View, CA 94043, USAReceived 2009 September 16; accepted 2009 December 17; published 2010 January 13
ABSTRACT
We compute models of the transmission spectra of planets HD 209458b, HD 189733b, and generic hot Jupiters.We examine the effects of temperature, surface gravity, and metallicity for the generic planets as a guide tounderstanding transmission spectra in general. We find that carbon dioxide absorption at 4.4 and 15 μm is prominentat high metallicity, and is a clear metallicity indicator. For HD 209458b and HD 189733b, we compute spectra forboth one-dimensional and three-dimensional model atmospheres and examine the differences between them. Thedifferences are usually small, but can be large if atmospheric temperatures are near important chemical abundanceboundaries. The calculations for the three-dimensional atmospheres, and their comparison with data, serve asconstraints on these dynamical models that complement the secondary eclipse and light curve data sets. For HD209458b, even if TiO and VO gases are abundant on the dayside, their abundances can be considerably reducedon the cooler planetary limb. However, given the predicted limb temperatures and TiO abundances, the model’soptical opacity is too high. For HD 189733b we find a good match with some infrared data sets and constrain thealtitude of a postulated haze layer. For this planet, substantial differences can exist between the transmission spectraof the leading and trailing hemispheres, which are an excellent probe of carbon chemistry. In thermochemicalequilibrium, the cooler leading hemisphere is methane-dominated, and the hotter trailing hemisphere is CO-dominated, but these differences may be eliminated by non-equilibrium chemistry due to vertical mixing. It may bepossible to constrain the carbon chemistry of this planet, and its spatial variation, with James Webb Space Telescope.
Key words: planetary systems – radiative transfer – stars: individual (HD 209458, HD 189733)
Online-only material: color figures
1. INTRODUCTION
Soon after the detection of the transits of planet HD 209458b(Charbonneau et al. 2000; Henry et al. 2000), atmosphere mod-elers realized that transits could provide a probe of the atmo-spheric composition of transiting planet atmospheres (Seager &Sasselov 2000; Brown 2001; Hubbard et al. 2001). Stellar light,which passes through the thin upper atmosphere of a transitingplanet, travels through a long path length in the planet’s atmo-sphere, which allows atomic and molecular absorption featuresin the atmosphere to be imprinted on top of the stellar spectrum.This prediction was stunningly confirmed by observations ofHD 209458b by Charbonneau et al. (2002) with the STIS in-strument aboard the Hubble Space Telescope (HST).
This first detection of an exoplanet’s atmosphere began ourcurrent era of exoplanet characterization, which has seen ourknowledge of these planets expand due to Hubble, Spitzer,MOST, CoRoT, Kepler, and ground-based efforts. The useof Hubble’s STIS spectrograph as the premier instrument oftransmission spectroscopy was cut short by the instrument’sfailure in 2004, soon after the detection of an evaporatingexosphere around HD 209458b (Vidal-Madjar et al. 2003, 2004)and the full-optical transmission spectrum of HD 209458b(Knutson et al. 2007a). The Knutson et al. (2007a) data setwas further analyzed by Barman (2007) and D. Sing andcollaborators (Sing et al. 2008a, 2008b; Lecavelier des Etangset al. 2008b; Desert et al. 2008).
For HD 209458b, the optical transmission spectra data setsachieved so far have basically confirmed the predictions of thefirst models (Seager & Sasselov 2000; Brown 2001; Hubbard
et al. 2001): absorption features, which can be thought of asan increase in the cross-sectional area or radius of the planet ata given wavelength, can be seen during the transit. Prominentfeatures include Rayleigh scattering off of H2 molecules in theblue, absorption due to the neutral atomic Na doublet at 589 nm,and perhaps TiO/VO absorption (Desert et al. 2008) and H2Oabsorption in the red (Barman 2007). Zahnle et al. (2009b) havealso pointed out that species such as HS may also contribute inthe blue, along with the Rayleigh scattering contribution.
In the absence of this optical space spectrograph, otherinstruments aboard Hubble and Spitzer were used to probe theatmosphere of planet HD 189733b. Hubble’s NICMOS was usedby Swain et al. (2008) to obtain a near-IR transmission spectrum,which detected CH4 (but see also Sing et al. 2009). UsingHubble ACS Pont et al. (2008) detected a featureless, slopingoptical spectrum, perhaps implying a Rayleigh-scattering hazelayer, and Tinetti et al. (2007b) and Beaulieu et al. (2008)used Spitzer’s Infrared Array Camera (IRAC) to find absorptionvariation in the mid-IR that is consistent with absorption viawater vapor (however, see also Desert et al. 2009, for a differentanalysis). For HD 209458b at mid-infrared wavelengths, thereis a 24 μm MIPS point (Richardson et al. 2006) and a four-band IRAC data set (Beaulieu et al. 2010). HD 209458b, a pMclass planet in the terminology of Fortney et al. (2008) andHD 189733b, pL class, remain by far the best-characterizedtransiting planets, and this will likely remain the case for quitesome time.
The characterization of these atmospheres has increased insophistication, in particular with the complementary detectionof secondary eclipses of the transiting planets, which yield
1396
No. 2, 2010 THREE-DIMENSIONAL TRANSMISSION SPECTRA 1397
the dayside planet-to-star flux ratios for these systems (e.g.,Knutson et al. 2008; Charbonneau et al. 2008; Machalek et al.2008). These kinds of observations are complementary to thetransmission spectrum observations. Due to the longer pathlength at slant viewing geometry, transmission spectra probelower atmospheric pressures at a given wavelength (Fortney2005). Perhaps more importantly, transmission spectra probe theterminator region of the planets, the great circle route dividingday from night. The terminator region is obviously much lessirradiated than the substellar point or the dayside mean, so wecould expect temperature-dependent and irradiation-dependentchemical mixing ratios that are different on the terminator,compared to the substellar point, due to the lower incident fluxesand cooler temperatures. Interestingly, Swain et al. (2008) andSwain et al. (2009) apparently find such a situation for HD189733b, where on the dayside, they find little to no carbon inCH4, while it is detectable at the terminator.
More complex models of the atmospheric temperature struc-ture, chemical mixing ratios, and the dynamics of these atmo-spheres have become necessary to understand these growingdata sets. Recent one-dimensional (1D) models of hot Jupiters,that aimed to predict the mean temperature structure and spec-trum (Burrows et al. 2005; Fortney et al. 2005; Seager et al.2005), and ignored dynamics, have yielded in some circum-stances to multi-dimensional purely radiative-transfer models(Barman et al. 2005), or models that also include parameteriza-tions of dynamics (Iro et al. 2005; Burrows et al. 2008).
Our group has taken a different path, first in examiningthe spectral properties of three-dimensional (3D) dynamicalmodels (Fortney et al. 2006a; Showman et al. 2008), and nowin pioneering the coupling of non-gray radiative transfer to 3Ddynamics (Showman et al. 2009). While these 3D models arebeing tested by observations of secondary eclipses and orbitalphase variations with Spitzer, it is also possible to test theirpredictions for chemical mixing ratios and upper atmospherictemperatures via transmission spectra observations. The mainfocus of this paper is to describe the results of the calculation ofthe transmission spectra of these 3D models.
The paper is organized as follows. In Section 2 we describeour methods, while in Section 3 we show results for the trans-mission spectrum of simple isothermal models to investigate therole of surface gravity and enhanced metallicity. In Section 4 wedescribe our 3D atmosphere models, while in Section 5 we re-view the transmission spectrum data for planet HD 189733b, andpresent our models, while Section 6 is the corresponding sectionfor planet HD 209458b. Section 7 focuses on the observabilityof chemical abundance gradients in hot Jupiter atmospheres,while Section 8 gives our conclusions.
2. METHODS: TRANSMISSION SPECTRUM
We have previously developed a code to compute the trans-mission spectrum of planetary atmospheres. The first generationof the code, which used 1D atmospheric pressure–temperature(P–T) profiles, is described in Hubbard et al. (2001). In additionto absorption by atomic and molecular species, Hubbard et al.(2001) also explored the effects of refraction and a glow of pho-tons around the planet’s limb due to Rayleigh scattering. Theseadditional effects were found to be negligible for hot Jupiters, sowe ignore them here. Fortney et al. (2003) investigated simple2D models of the atmosphere of HD 209458b, which includedone planet-wide P–T profile, but 2D changes in the absorptioncross section of neutral Na, due to photoionization of Na asfunction of depth and angle from the substellar point.
One can imagine a straight path through the planet’s atmo-sphere, parallel to the star–planet–observer axis, at an impactparameter r from this axis. The gaseous optical depth τG, start-ing above the terminator and moving outward in one directionalong this path, can be calculated via the equation
τG =∫ ∞
r
r ′dr ′σ (r ′)n(r ′)
(r ′2 − r2)1/2 , (1)
where r ′ is the distance between the local location in theatmosphere and the planetary center, n is the local numberdensity of molecules in the atmosphere, and σ is the wavelength-dependent cross section per molecule. We assume hydrostaticequilibrium with a gravitational acceleration that falls off withthe inverse of the distance squared.5 In practice, the modelatmosphere is broken up into 1000 radius intervals, between thearbitrary base radius r and the maximum radius r + Δr , whereΔr is (10–15) ×103 km. The base radius, which is either at 10or 100 bars, is adjusted to yield the best fit to the observations.Along the light ray path through the atmosphere parallel tothe star–planet–observer axis, the local atmospheric density andopacity are also sampled at 1000 points. For absorption, thewavelength-dependent cross section is calculated based on thelocal chemical equilibrium mixing ratios, while the Rayleighscattering cross section is
σR = 8π3(2 + ν)2ν2
3λ4n2, (2)
where ν is the refractivity (refractive index minus 1) of the gas.Since ν � 1 and ν ∝ n, σR is a function only of λ and the gascomposition.
Here we define the wavelength-dependent transit radius asthe radius where the total slant optical depth reaches 0.56,following Lecavelier des Etangs et al. (2008b). We match theanalytical results of these authors for the transit radius as afunction of wavelength for a constant gravity, pure Rayleighscattering atmosphere.
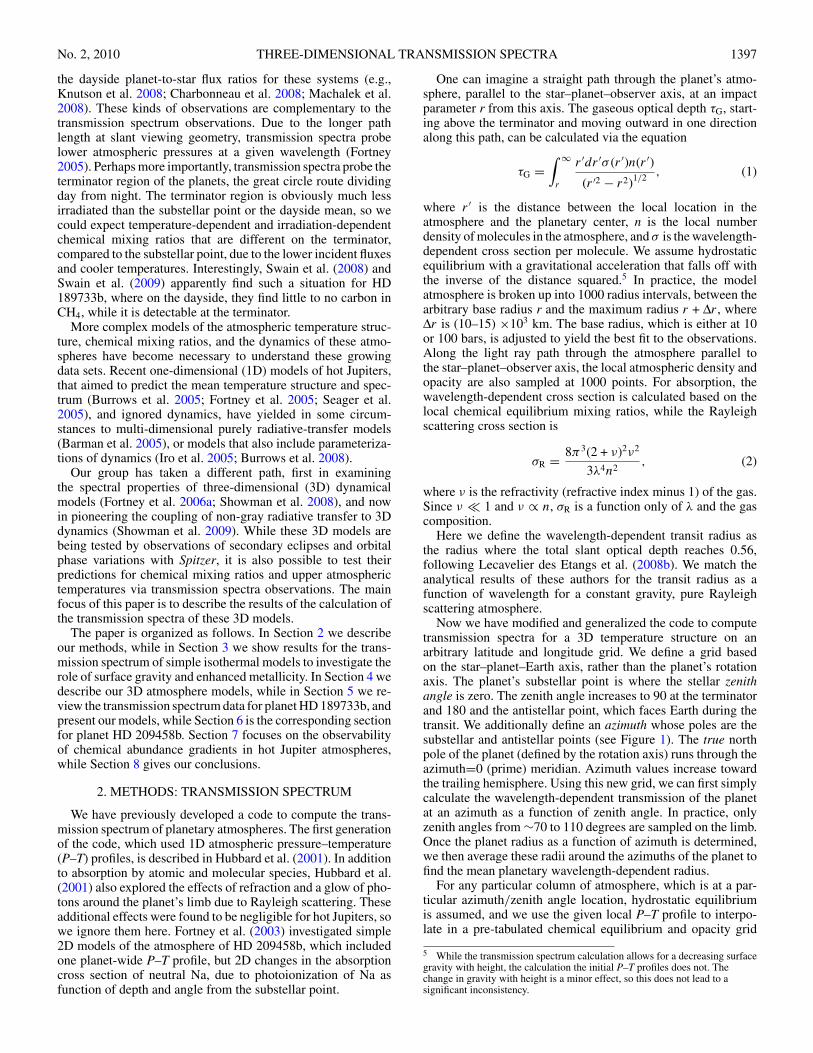
Now we have modified and generalized the code to computetransmission spectra for a 3D temperature structure on anarbitrary latitude and longitude grid. We define a grid basedon the star–planet–Earth axis, rather than the planet’s rotationaxis. The planet’s substellar point is where the stellar zenithangle is zero. The zenith angle increases to 90 at the terminatorand 180 and the antistellar point, which faces Earth during thetransit. We additionally define an azimuth whose poles are thesubstellar and antistellar points (see Figure 1). The true northpole of the planet (defined by the rotation axis) runs through theazimuth=0 (prime) meridian. Azimuth values increase towardthe trailing hemisphere. Using this new grid, we can first simplycalculate the wavelength-dependent transmission of the planetat an azimuth as a function of zenith angle. In practice, onlyzenith angles from ∼70 to 110 degrees are sampled on the limb.Once the planet radius as a function of azimuth is determined,we then average these radii around the azimuths of the planet tofind the mean planetary wavelength-dependent radius.
For any particular column of atmosphere, which is at a par-ticular azimuth/zenith angle location, hydrostatic equilibriumis assumed, and we use the given local P–T profile to interpo-late in a pre-tabulated chemical equilibrium and opacity grid
5 While the transmission spectrum calculation allows for a decreasing surfacegravity with height, the calculation the initial P–T profiles does not. Thechange in gravity with height is a minor effect, so this does not lead to asignificant inconsistency.
1398 FORTNEY ET AL. Vol. 709
Figure 1. Diagram of our zenith angle and azimuth grid that aids in thecomputation of 3D transmission spectra. The antistellar point faces the observer,while the substellar point faces the star. Azimuths are in red, while zenith anglesare in green. The terminator is shown in blue and the planet’s true north pole isalso labeled. The blue band and purple slice are meant to schematically showthe region of the atmosphere that is being probed during the transit.
(A color version of this figure is available in the online journal.)
that extends out to 1 μbar. The equilibrium chemistry mixingratios (Lodders & Fegley 2002, 2006; Lodders 2010) are pairedwith the opacity database (Freedman et al. 2008) to generatepressure-, temperature-, and wavelength-dependent absorptioncross sections that are used for that particular column. For adifferent column of atmosphere, with a different P–T profile, lo-cal pressures and temperatures will yield different mixing ratiosand wavelength-dependent cross sections.
3. CALCULATIONS FOR SIMPLE ATMOSPHERES
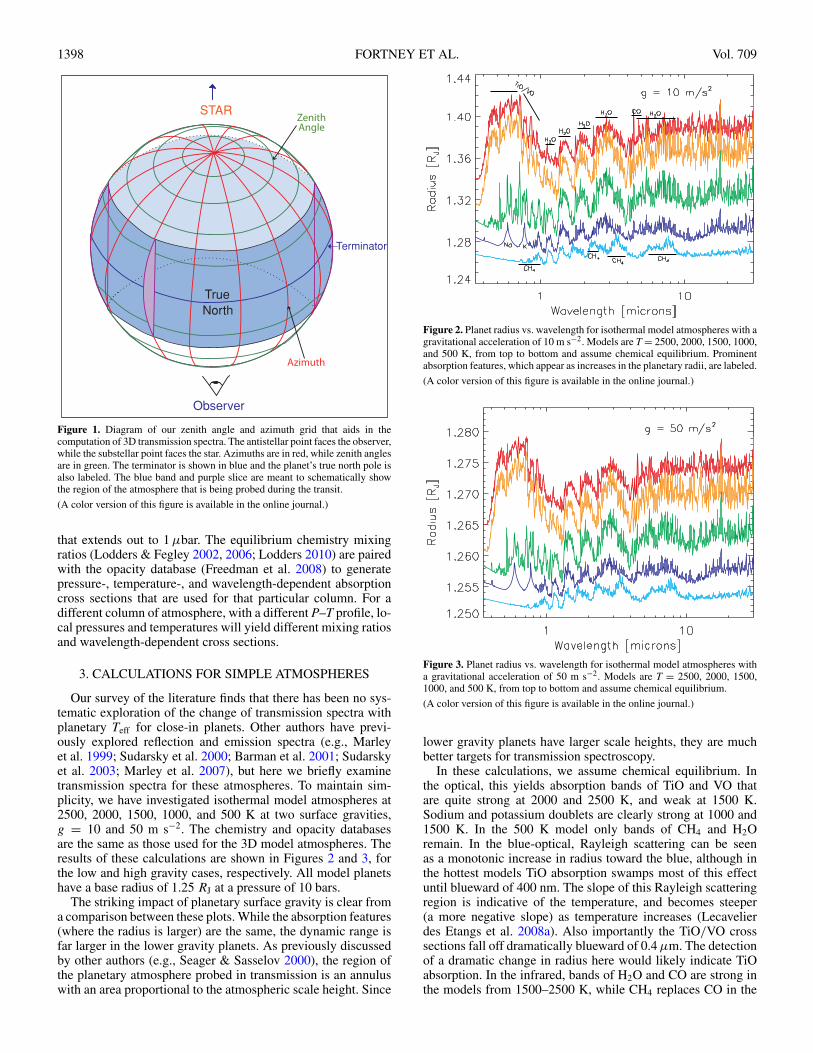
Our survey of the literature finds that there has been no sys-tematic exploration of the change of transmission spectra withplanetary Teff for close-in planets. Other authors have previ-ously explored reflection and emission spectra (e.g., Marleyet al. 1999; Sudarsky et al. 2000; Barman et al. 2001; Sudarskyet al. 2003; Marley et al. 2007), but here we briefly examinetransmission spectra for these atmospheres. To maintain sim-plicity, we have investigated isothermal model atmospheres at2500, 2000, 1500, 1000, and 500 K at two surface gravities,g = 10 and 50 m s−2. The chemistry and opacity databasesare the same as those used for the 3D model atmospheres. Theresults of these calculations are shown in Figures 2 and 3, forthe low and high gravity cases, respectively. All model planetshave a base radius of 1.25 RJ at a pressure of 10 bars.
The striking impact of planetary surface gravity is clear froma comparison between these plots. While the absorption features(where the radius is larger) are the same, the dynamic range isfar larger in the lower gravity planets. As previously discussedby other authors (e.g., Seager & Sasselov 2000), the region ofthe planetary atmosphere probed in transmission is an annuluswith an area proportional to the atmospheric scale height. Since
Figure 2. Planet radius vs. wavelength for isothermal model atmospheres with agravitational acceleration of 10 m s−2. Models are T = 2500, 2000, 1500, 1000,and 500 K, from top to bottom and assume chemical equilibrium. Prominentabsorption features, which appear as increases in the planetary radii, are labeled.
(A color version of this figure is available in the online journal.)
Figure 3. Planet radius vs. wavelength for isothermal model atmospheres witha gravitational acceleration of 50 m s−2. Models are T = 2500, 2000, 1500,1000, and 500 K, from top to bottom and assume chemical equilibrium.
(A color version of this figure is available in the online journal.)
lower gravity planets have larger scale heights, they are muchbetter targets for transmission spectroscopy.
In these calculations, we assume chemical equilibrium. Inthe optical, this yields absorption bands of TiO and VO thatare quite strong at 2000 and 2500 K, and weak at 1500 K.Sodium and potassium doublets are clearly strong at 1000 and1500 K. In the 500 K model only bands of CH4 and H2Oremain. In the blue-optical, Rayleigh scattering can be seenas a monotonic increase in radius toward the blue, although inthe hottest models TiO absorption swamps most of this effectuntil blueward of 400 nm. The slope of this Rayleigh scatteringregion is indicative of the temperature, and becomes steeper(a more negative slope) as temperature increases (Lecavelierdes Etangs et al. 2008a). Also importantly the TiO/VO crosssections fall off dramatically blueward of 0.4 μm. The detectionof a dramatic change in radius here would likely indicate TiOabsorption. In the infrared, bands of H2O and CO are strong inthe models from 1500–2500 K, while CH4 replaces CO in the
No. 2, 2010 THREE-DIMENSIONAL TRANSMISSION SPECTRA 1399
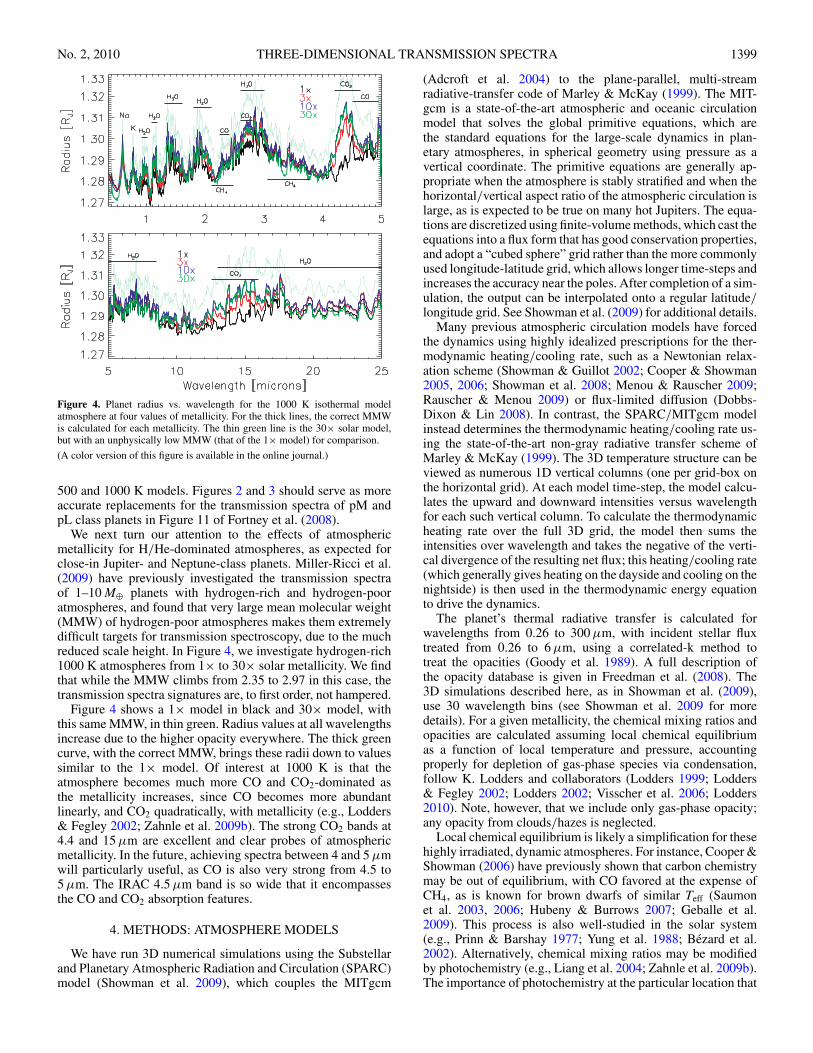
Figure 4. Planet radius vs. wavelength for the 1000 K isothermal modelatmosphere at four values of metallicity. For the thick lines, the correct MMWis calculated for each metallicity. The thin green line is the 30× solar model,but with an unphysically low MMW (that of the 1× model) for comparison.
(A color version of this figure is available in the online journal.)
500 and 1000 K models. Figures 2 and 3 should serve as moreaccurate replacements for the transmission spectra of pM andpL class planets in Figure 11 of Fortney et al. (2008).
We next turn our attention to the effects of atmosphericmetallicity for H/He-dominated atmospheres, as expected forclose-in Jupiter- and Neptune-class planets. Miller-Ricci et al.(2009) have previously investigated the transmission spectraof 1–10 M⊕ planets with hydrogen-rich and hydrogen-pooratmospheres, and found that very large mean molecular weight(MMW) of hydrogen-poor atmospheres makes them extremelydifficult targets for transmission spectroscopy, due to the muchreduced scale height. In Figure 4, we investigate hydrogen-rich1000 K atmospheres from 1× to 30× solar metallicity. We findthat while the MMW climbs from 2.35 to 2.97 in this case, thetransmission spectra signatures are, to first order, not hampered.
Figure 4 shows a 1× model in black and 30× model, withthis same MMW, in thin green. Radius values at all wavelengthsincrease due to the higher opacity everywhere. The thick greencurve, with the correct MMW, brings these radii down to valuessimilar to the 1× model. Of interest at 1000 K is that theatmosphere becomes much more CO and CO2-dominated asthe metallicity increases, since CO becomes more abundantlinearly, and CO2 quadratically, with metallicity (e.g., Lodders& Fegley 2002; Zahnle et al. 2009b). The strong CO2 bands at4.4 and 15 μm are excellent and clear probes of atmosphericmetallicity. In the future, achieving spectra between 4 and 5 μmwill particularly useful, as CO is also very strong from 4.5 to5 μm. The IRAC 4.5 μm band is so wide that it encompassesthe CO and CO2 absorption features.
4. METHODS: ATMOSPHERE MODELS
We have run 3D numerical simulations using the Substellarand Planetary Atmospheric Radiation and Circulation (SPARC)model (Showman et al. 2009), which couples the MITgcm
(Adcroft et al. 2004) to the plane-parallel, multi-streamradiative-transfer code of Marley & McKay (1999). The MIT-gcm is a state-of-the-art atmospheric and oceanic circulationmodel that solves the global primitive equations, which arethe standard equations for the large-scale dynamics in plan-etary atmospheres, in spherical geometry using pressure as avertical coordinate. The primitive equations are generally ap-propriate when the atmosphere is stably stratified and when thehorizontal/vertical aspect ratio of the atmospheric circulation islarge, as is expected to be true on many hot Jupiters. The equa-tions are discretized using finite-volume methods, which cast theequations into a flux form that has good conservation properties,and adopt a “cubed sphere” grid rather than the more commonlyused longitude-latitude grid, which allows longer time-steps andincreases the accuracy near the poles. After completion of a sim-ulation, the output can be interpolated onto a regular latitude/longitude grid. See Showman et al. (2009) for additional details.
Many previous atmospheric circulation models have forcedthe dynamics using highly idealized prescriptions for the ther-modynamic heating/cooling rate, such as a Newtonian relax-ation scheme (Showman & Guillot 2002; Cooper & Showman2005, 2006; Showman et al. 2008; Menou & Rauscher 2009;Rauscher & Menou 2009) or flux-limited diffusion (Dobbs-Dixon & Lin 2008). In contrast, the SPARC/MITgcm modelinstead determines the thermodynamic heating/cooling rate us-ing the state-of-the-art non-gray radiative transfer scheme ofMarley & McKay (1999). The 3D temperature structure can beviewed as numerous 1D vertical columns (one per grid-box onthe horizontal grid). At each model time-step, the model calcu-lates the upward and downward intensities versus wavelengthfor each such vertical column. To calculate the thermodynamicheating rate over the full 3D grid, the model then sums theintensities over wavelength and takes the negative of the verti-cal divergence of the resulting net flux; this heating/cooling rate(which generally gives heating on the dayside and cooling on thenightside) is then used in the thermodynamic energy equationto drive the dynamics.
The planet’s thermal radiative transfer is calculated forwavelengths from 0.26 to 300 μm, with incident stellar fluxtreated from 0.26 to 6 μm, using a correlated-k method totreat the opacities (Goody et al. 1989). A full description ofthe opacity database is given in Freedman et al. (2008). The3D simulations described here, as in Showman et al. (2009),use 30 wavelength bins (see Showman et al. 2009 for moredetails). For a given metallicity, the chemical mixing ratios andopacities are calculated assuming local chemical equilibriumas a function of local temperature and pressure, accountingproperly for depletion of gas-phase species via condensation,follow K. Lodders and collaborators (Lodders 1999; Lodders& Fegley 2002; Lodders 2002; Visscher et al. 2006; Lodders2010). Note, however, that we include only gas-phase opacity;any opacity from clouds/hazes is neglected.
Local chemical equilibrium is likely a simplification for thesehighly irradiated, dynamic atmospheres. For instance, Cooper &Showman (2006) have previously shown that carbon chemistrymay be out of equilibrium, with CO favored at the expense ofCH4, as is known for brown dwarfs of similar Teff (Saumonet al. 2003, 2006; Hubeny & Burrows 2007; Geballe et al.2009). This process is also well-studied in the solar system(e.g., Prinn & Barshay 1977; Yung et al. 1988; Bezard et al.2002). Alternatively, chemical mixing ratios may be modifiedby photochemistry (e.g., Liang et al. 2004; Zahnle et al. 2009b).The importance of photochemistry at the particular location that
1400 FORTNEY ET AL. Vol. 709
we are interested in here, the terminator, is not clear. Given thesecaveats, for HD 189733b in particular, we will investigate thetransmission spectra assuming both chemical equilibrium anda fixed CO/CH4 ratio, following Cooper & Showman (2006).Given the importance of CO2 at high metallicity, future workon non-equilibrium chemistry should include the effect of thismolecule as well.
Here, we analyze SPARC/MITgcm simulations of HD189733b and HD 209458b that adopt solar metallicity and usea horizontal resolution of C32, approximately equivalent to astandard global grid of 128 longitudes × 64 latitudes. (Here itis interpolated onto 64 zenith angles and 128 azimuths.) Thesimulations use 53 vertical layers, with a base at 200 bar anda top at 2 μbar (see Showman et al. 2009). Our HD 189733bcase excludes TiO and VO from the opacity calculation, whilethe HD 209458b case includes both these species due to theirpossible relevance in producing the stratosphere inferred onthat planet (Knutson et al. 2008; Burrows et al. 2007; Fortneyet al. 2008; Showman et al. 2009; Spiegel et al. 2009). OurHD 209458b simulation is identical to that in Showman et al.(2009, see their Figures 16–21); our HD 189733b simulations isanalogous to their nominal HD 189733b case (see Figures 4–10in Showman et al. 2009) except that it includes more verticallayers and extends to 2 μbar rather than 0.2 mbar. Both simula-tions assume tidal locking of the planets, i.e., a permanent dayand night hemisphere.
In Showman et al. (2009), we considered the thermal emissionof these planets as a function of orbital phase, post-processingthe P–T grids to compute spectra as a function of orbitalphase, using the methods outlined in Fortney et al. (2006a).These spectra can also be integrated over Spitzer bandpassesto compute thermal emission light curves. These model spectraand light curves can then be directly compared to observedsecondary eclipse photometry, spectra, and light curves. Themain goals of this work is to further constrain the 3D modelatmospheres in a region of the atmosphere that is distinct fromthat probed at secondary eclipse, as well as to point to futureobservations that may help us better understand these planetaryatmospheres.
5. HD 189733b
Since its detection by Bouchy et al. (2005), planetHD 189733b has leapt to the forefront of exoplanetary char-acterization. It features a large planet-to-star radius ratio andbright parent star, which enables detailed study of its atmo-sphere via observations of both its emission and transmissionspectrum. For the transmission spectrum, optical data have beenpublished by Pont et al. (2008) and Redfield et al. (2008), near-infrared data by Swain et al. (2008) and Sing et al. (2009), and3.6 and 5.8 μm IRAC mid-infrared data by Beaulieu et al. (2008)and Ehrenreich et al. (2007)—this Spitzer data was then reducedagain by Desert et al. (2009), who also added new 4.5 and8.0 μm points.
Soon after the discovery of HD 189733b, Fortney et al.(2006b) computed the first models of its atmosphere. Theyfound that the planet was considerably cooler than that ofHD 209458b, and was likely more similar to TrES-1, whichhad just been observed in secondary eclipse (Charbonneau et al.2005). In particular, Fortney et al. (2006b) noted the strongmethane absorption features in their 1D model, which was meantto represent a planet-wide average P–T profile. This predictionwas confirmed with the Swain et al. (2008) detection of methanein the planet’s transmission spectrum.
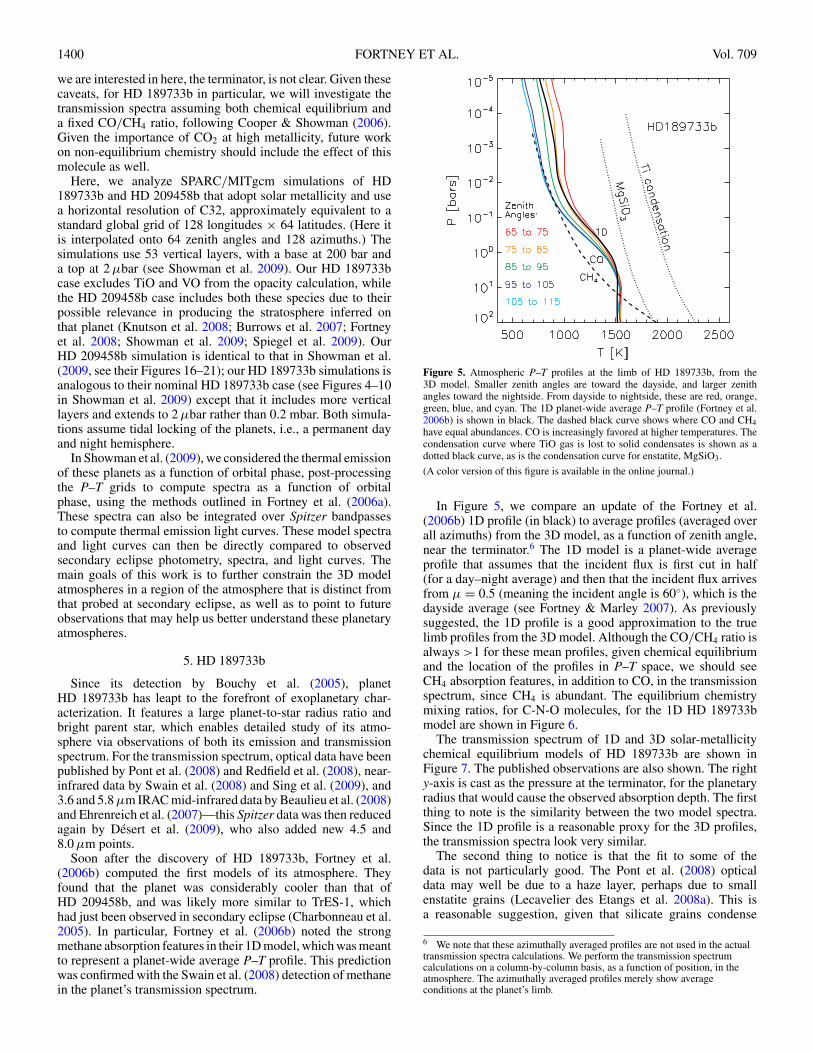
Figure 5. Atmospheric P–T profiles at the limb of HD 189733b, from the3D model. Smaller zenith angles are toward the dayside, and larger zenithangles toward the nightside. From dayside to nightside, these are red, orange,green, blue, and cyan. The 1D planet-wide average P–T profile (Fortney et al.2006b) is shown in black. The dashed black curve shows where CO and CH4have equal abundances. CO is increasingly favored at higher temperatures. Thecondensation curve where TiO gas is lost to solid condensates is shown as adotted black curve, as is the condensation curve for enstatite, MgSiO3.
(A color version of this figure is available in the online journal.)
In Figure 5, we compare an update of the Fortney et al.(2006b) 1D profile (in black) to average profiles (averaged overall azimuths) from the 3D model, as a function of zenith angle,near the terminator.6 The 1D model is a planet-wide averageprofile that assumes that the incident flux is first cut in half(for a day–night average) and then that the incident flux arrivesfrom μ = 0.5 (meaning the incident angle is 60◦), which is thedayside average (see Fortney & Marley 2007). As previouslysuggested, the 1D profile is a good approximation to the truelimb profiles from the 3D model. Although the CO/CH4 ratio isalways >1 for these mean profiles, given chemical equilibriumand the location of the profiles in P–T space, we should seeCH4 absorption features, in addition to CO, in the transmissionspectrum, since CH4 is abundant. The equilibrium chemistrymixing ratios, for C-N-O molecules, for the 1D HD 189733bmodel are shown in Figure 6.
The transmission spectrum of 1D and 3D solar-metallicitychemical equilibrium models of HD 189733b are shown inFigure 7. The published observations are also shown. The righty-axis is cast as the pressure at the terminator, for the planetaryradius that would cause the observed absorption depth. The firstthing to note is the similarity between the two model spectra.Since the 1D profile is a reasonable proxy for the 3D profiles,the transmission spectra look very similar.
The second thing to notice is that the fit to some of thedata is not particularly good. The Pont et al. (2008) opticaldata may well be due to a haze layer, perhaps due to smallenstatite grains (Lecavelier des Etangs et al. 2008a). This isa reasonable suggestion, given that silicate grains condense
6 We note that these azimuthally averaged profiles are not used in the actualtransmission spectra calculations. We perform the transmission spectrumcalculations on a column-by-column basis, as a function of position, in theatmosphere. The azimuthally averaged profiles merely show averageconditions at the planet’s limb.
No. 2, 2010 THREE-DIMENSIONAL TRANSMISSION SPECTRA 1401
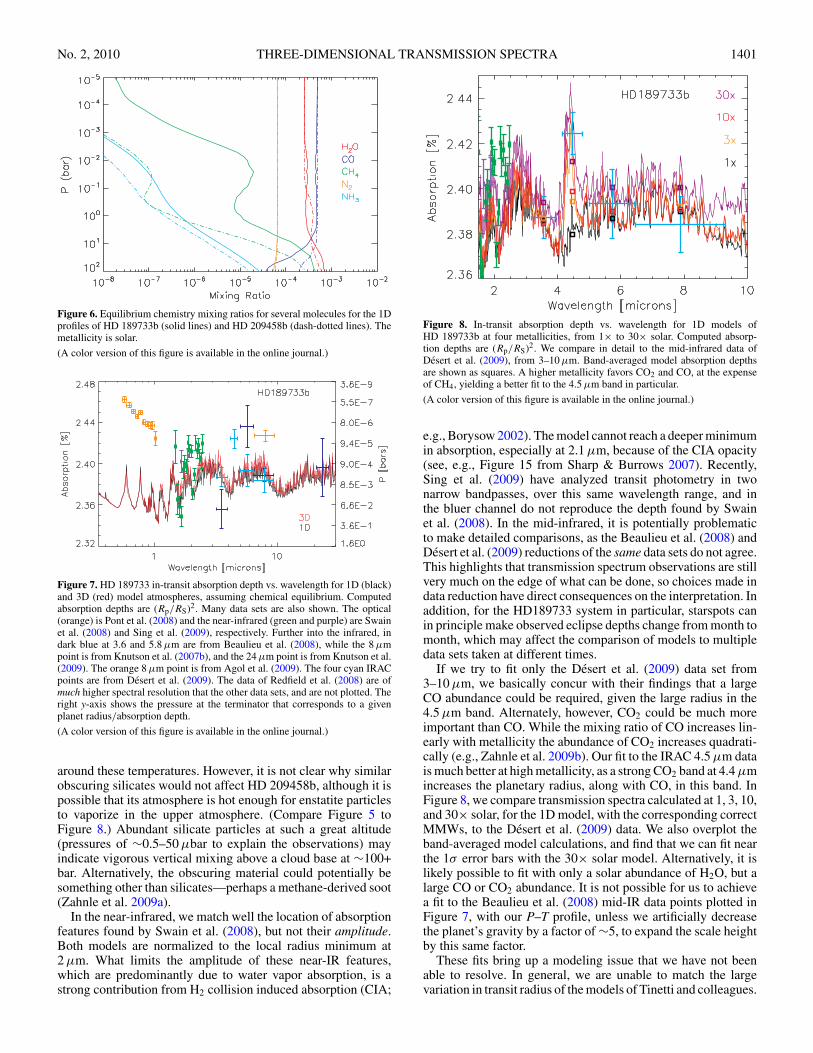
Figure 6. Equilibrium chemistry mixing ratios for several molecules for the 1Dprofiles of HD 189733b (solid lines) and HD 209458b (dash-dotted lines). Themetallicity is solar.
(A color version of this figure is available in the online journal.)
Figure 7. HD 189733 in-transit absorption depth vs. wavelength for 1D (black)and 3D (red) model atmospheres, assuming chemical equilibrium. Computedabsorption depths are (Rp/RS)2. Many data sets are also shown. The optical(orange) is Pont et al. (2008) and the near-infrared (green and purple) are Swainet al. (2008) and Sing et al. (2009), respectively. Further into the infrared, indark blue at 3.6 and 5.8 μm are from Beaulieu et al. (2008), while the 8 μmpoint is from Knutson et al. (2007b), and the 24 μm point is from Knutson et al.(2009). The orange 8 μm point is from Agol et al. (2009). The four cyan IRACpoints are from Desert et al. (2009). The data of Redfield et al. (2008) are ofmuch higher spectral resolution that the other data sets, and are not plotted. Theright y-axis shows the pressure at the terminator that corresponds to a givenplanet radius/absorption depth.
(A color version of this figure is available in the online journal.)
around these temperatures. However, it is not clear why similarobscuring silicates would not affect HD 209458b, although it ispossible that its atmosphere is hot enough for enstatite particlesto vaporize in the upper atmosphere. (Compare Figure 5 toFigure 8.) Abundant silicate particles at such a great altitude(pressures of ∼0.5–50 μbar to explain the observations) mayindicate vigorous vertical mixing above a cloud base at ∼100+bar. Alternatively, the obscuring material could potentially besomething other than silicates—perhaps a methane-derived soot(Zahnle et al. 2009a).
In the near-infrared, we match well the location of absorptionfeatures found by Swain et al. (2008), but not their amplitude.Both models are normalized to the local radius minimum at2 μm. What limits the amplitude of these near-IR features,which are predominantly due to water vapor absorption, is astrong contribution from H2 collision induced absorption (CIA;
Figure 8. In-transit absorption depth vs. wavelength for 1D models ofHD 189733b at four metallicities, from 1× to 30× solar. Computed absorp-tion depths are (Rp/RS)2. We compare in detail to the mid-infrared data ofDesert et al. (2009), from 3–10 μm. Band-averaged model absorption depthsare shown as squares. A higher metallicity favors CO2 and CO, at the expenseof CH4, yielding a better fit to the 4.5 μm band in particular.
(A color version of this figure is available in the online journal.)
e.g., Borysow 2002). The model cannot reach a deeper minimumin absorption, especially at 2.1 μm, because of the CIA opacity(see, e.g., Figure 15 from Sharp & Burrows 2007). Recently,Sing et al. (2009) have analyzed transit photometry in twonarrow bandpasses, over this same wavelength range, and inthe bluer channel do not reproduce the depth found by Swainet al. (2008). In the mid-infrared, it is potentially problematicto make detailed comparisons, as the Beaulieu et al. (2008) andDesert et al. (2009) reductions of the same data sets do not agree.This highlights that transmission spectrum observations are stillvery much on the edge of what can be done, so choices made indata reduction have direct consequences on the interpretation. Inaddition, for the HD189733 system in particular, starspots canin principle make observed eclipse depths change from month tomonth, which may affect the comparison of models to multipledata sets taken at different times.
If we try to fit only the Desert et al. (2009) data set from3–10 μm, we basically concur with their findings that a largeCO abundance could be required, given the large radius in the4.5 μm band. Alternately, however, CO2 could be much moreimportant than CO. While the mixing ratio of CO increases lin-early with metallicity the abundance of CO2 increases quadrati-cally (e.g., Zahnle et al. 2009b). Our fit to the IRAC 4.5 μm datais much better at high metallicity, as a strong CO2 band at 4.4 μmincreases the planetary radius, along with CO, in this band. InFigure 8, we compare transmission spectra calculated at 1, 3, 10,and 30× solar, for the 1D model, with the corresponding correctMMWs, to the Desert et al. (2009) data. We also overplot theband-averaged model calculations, and find that we can fit nearthe 1σ error bars with the 30× solar model. Alternatively, it islikely possible to fit with only a solar abundance of H2O, but alarge CO or CO2 abundance. It is not possible for us to achievea fit to the Beaulieu et al. (2008) mid-IR data points plotted inFigure 7, with our P–T profile, unless we artificially decreasethe planet’s gravity by a factor of ∼5, to expand the scale heightby this same factor.
These fits bring up a modeling issue that we have not beenable to resolve. In general, we are unable to match the largevariation in transit radius of the models of Tinetti and colleagues.
1402 FORTNEY ET AL. Vol. 709
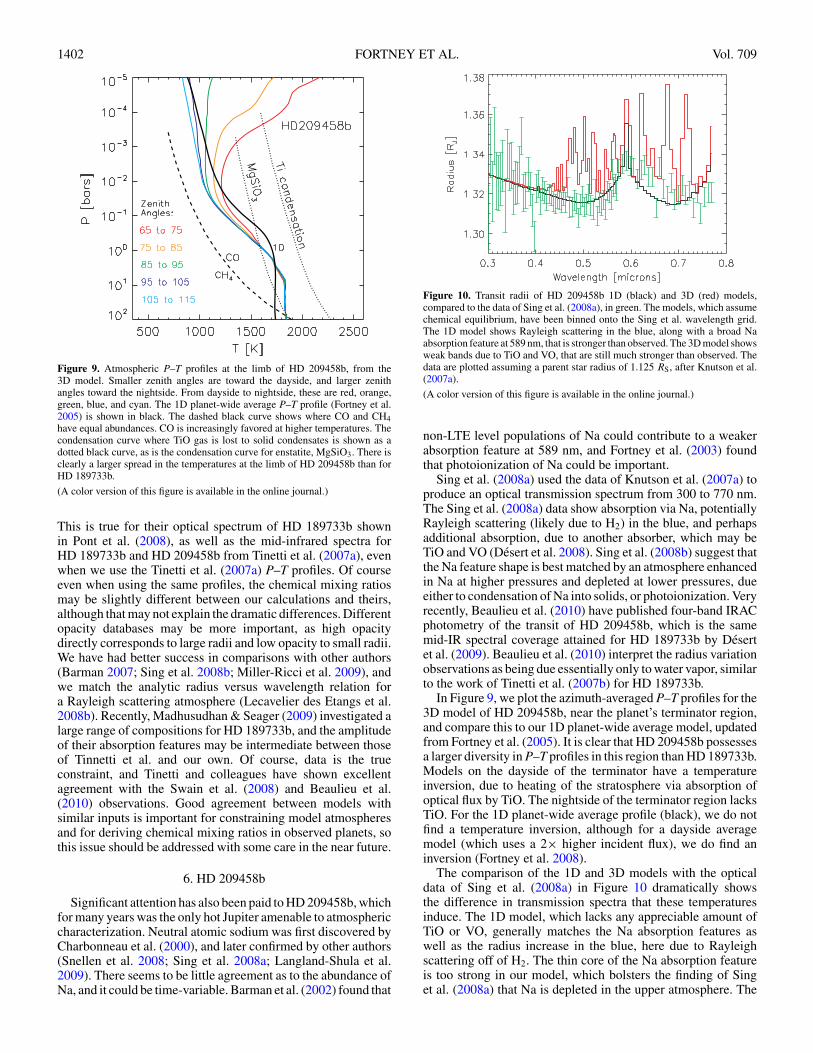
Figure 9. Atmospheric P–T profiles at the limb of HD 209458b, from the3D model. Smaller zenith angles are toward the dayside, and larger zenithangles toward the nightside. From dayside to nightside, these are red, orange,green, blue, and cyan. The 1D planet-wide average P–T profile (Fortney et al.2005) is shown in black. The dashed black curve shows where CO and CH4have equal abundances. CO is increasingly favored at higher temperatures. Thecondensation curve where TiO gas is lost to solid condensates is shown as adotted black curve, as is the condensation curve for enstatite, MgSiO3. There isclearly a larger spread in the temperatures at the limb of HD 209458b than forHD 189733b.
(A color version of this figure is available in the online journal.)
This is true for their optical spectrum of HD 189733b shownin Pont et al. (2008), as well as the mid-infrared spectra forHD 189733b and HD 209458b from Tinetti et al. (2007a), evenwhen we use the Tinetti et al. (2007a) P–T profiles. Of courseeven when using the same profiles, the chemical mixing ratiosmay be slightly different between our calculations and theirs,although that may not explain the dramatic differences. Differentopacity databases may be more important, as high opacitydirectly corresponds to large radii and low opacity to small radii.We have had better success in comparisons with other authors(Barman 2007; Sing et al. 2008b; Miller-Ricci et al. 2009), andwe match the analytic radius versus wavelength relation fora Rayleigh scattering atmosphere (Lecavelier des Etangs et al.2008b). Recently, Madhusudhan & Seager (2009) investigated alarge range of compositions for HD 189733b, and the amplitudeof their absorption features may be intermediate between thoseof Tinnetti et al. and our own. Of course, data is the trueconstraint, and Tinetti and colleagues have shown excellentagreement with the Swain et al. (2008) and Beaulieu et al.(2010) observations. Good agreement between models withsimilar inputs is important for constraining model atmospheresand for deriving chemical mixing ratios in observed planets, sothis issue should be addressed with some care in the near future.
6. HD 209458b
Significant attention has also been paid to HD 209458b, whichfor many years was the only hot Jupiter amenable to atmosphericcharacterization. Neutral atomic sodium was first discovered byCharbonneau et al. (2000), and later confirmed by other authors(Snellen et al. 2008; Sing et al. 2008a; Langland-Shula et al.2009). There seems to be little agreement as to the abundance ofNa, and it could be time-variable. Barman et al. (2002) found that
Figure 10. Transit radii of HD 209458b 1D (black) and 3D (red) models,compared to the data of Sing et al. (2008a), in green. The models, which assumechemical equilibrium, have been binned onto the Sing et al. wavelength grid.The 1D model shows Rayleigh scattering in the blue, along with a broad Naabsorption feature at 589 nm, that is stronger than observed. The 3D model showsweak bands due to TiO and VO, that are still much stronger than observed. Thedata are plotted assuming a parent star radius of 1.125 RS, after Knutson et al.(2007a).
(A color version of this figure is available in the online journal.)
non-LTE level populations of Na could contribute to a weakerabsorption feature at 589 nm, and Fortney et al. (2003) foundthat photoionization of Na could be important.
Sing et al. (2008a) used the data of Knutson et al. (2007a) toproduce an optical transmission spectrum from 300 to 770 nm.The Sing et al. (2008a) data show absorption via Na, potentiallyRayleigh scattering (likely due to H2) in the blue, and perhapsadditional absorption, due to another absorber, which may beTiO and VO (Desert et al. 2008). Sing et al. (2008b) suggest thatthe Na feature shape is best matched by an atmosphere enhancedin Na at higher pressures and depleted at lower pressures, dueeither to condensation of Na into solids, or photoionization. Veryrecently, Beaulieu et al. (2010) have published four-band IRACphotometry of the transit of HD 209458b, which is the samemid-IR spectral coverage attained for HD 189733b by Desertet al. (2009). Beaulieu et al. (2010) interpret the radius variationobservations as being due essentially only to water vapor, similarto the work of Tinetti et al. (2007b) for HD 189733b.
In Figure 9, we plot the azimuth-averaged P–T profiles for the3D model of HD 209458b, near the planet’s terminator region,and compare this to our 1D planet-wide average model, updatedfrom Fortney et al. (2005). It is clear that HD 209458b possessesa larger diversity in P–T profiles in this region than HD 189733b.Models on the dayside of the terminator have a temperatureinversion, due to heating of the stratosphere via absorption ofoptical flux by TiO. The nightside of the terminator region lacksTiO. For the 1D planet-wide average profile (black), we do notfind a temperature inversion, although for a dayside averagemodel (which uses a 2× higher incident flux), we do find aninversion (Fortney et al. 2008).
The comparison of the 1D and 3D models with the opticaldata of Sing et al. (2008a) in Figure 10 dramatically showsthe difference in transmission spectra that these temperaturesinduce. The 1D model, which lacks any appreciable amount ofTiO or VO, generally matches the Na absorption features aswell as the radius increase in the blue, here due to Rayleighscattering off of H2. The thin core of the Na absorption featureis too strong in our model, which bolsters the finding of Singet al. (2008a) that Na is depleted in the upper atmosphere. The
No. 2, 2010 THREE-DIMENSIONAL TRANSMISSION SPECTRA 1403
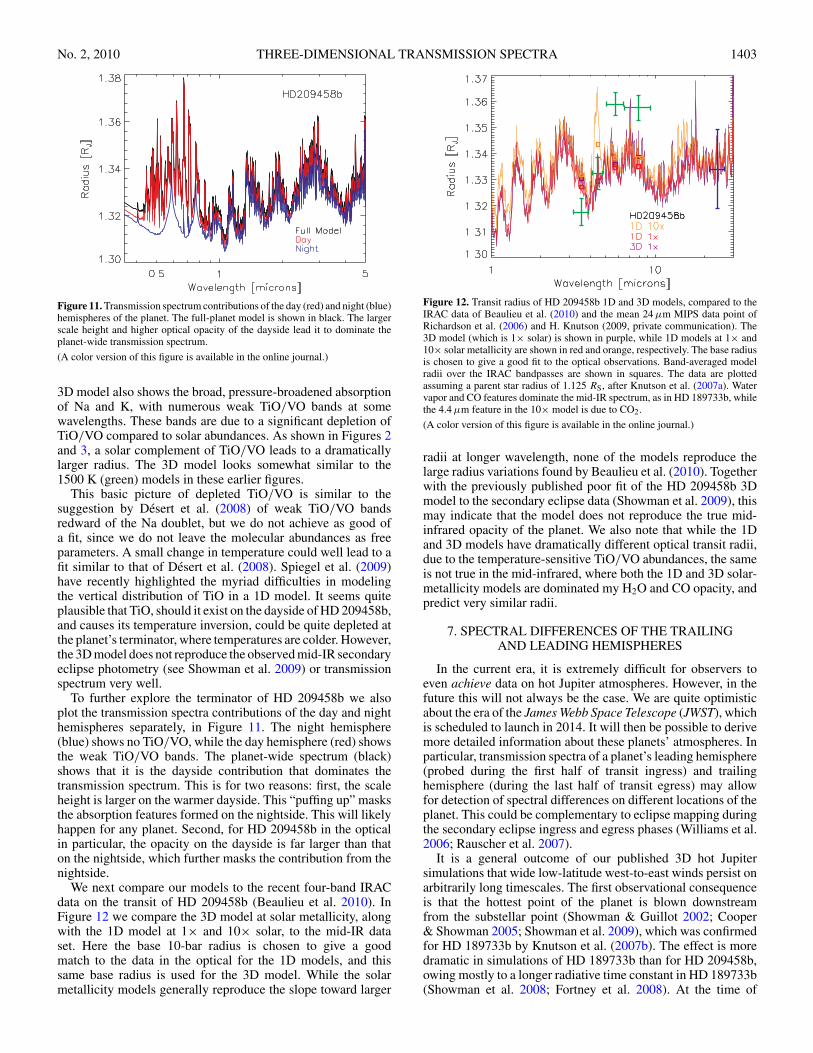
Figure 11. Transmission spectrum contributions of the day (red) and night (blue)hemispheres of the planet. The full-planet model is shown in black. The largerscale height and higher optical opacity of the dayside lead it to dominate theplanet-wide transmission spectrum.
(A color version of this figure is available in the online journal.)
3D model also shows the broad, pressure-broadened absorptionof Na and K, with numerous weak TiO/VO bands at somewavelengths. These bands are due to a significant depletion ofTiO/VO compared to solar abundances. As shown in Figures 2and 3, a solar complement of TiO/VO leads to a dramaticallylarger radius. The 3D model looks somewhat similar to the1500 K (green) models in these earlier figures.
This basic picture of depleted TiO/VO is similar to thesuggestion by Desert et al. (2008) of weak TiO/VO bandsredward of the Na doublet, but we do not achieve as good ofa fit, since we do not leave the molecular abundances as freeparameters. A small change in temperature could well lead to afit similar to that of Desert et al. (2008). Spiegel et al. (2009)have recently highlighted the myriad difficulties in modelingthe vertical distribution of TiO in a 1D model. It seems quiteplausible that TiO, should it exist on the dayside of HD 209458b,and causes its temperature inversion, could be quite depleted atthe planet’s terminator, where temperatures are colder. However,the 3D model does not reproduce the observed mid-IR secondaryeclipse photometry (see Showman et al. 2009) or transmissionspectrum very well.
To further explore the terminator of HD 209458b we alsoplot the transmission spectra contributions of the day and nighthemispheres separately, in Figure 11. The night hemisphere(blue) shows no TiO/VO, while the day hemisphere (red) showsthe weak TiO/VO bands. The planet-wide spectrum (black)shows that it is the dayside contribution that dominates thetransmission spectrum. This is for two reasons: first, the scaleheight is larger on the warmer dayside. This “puffing up” masksthe absorption features formed on the nightside. This will likelyhappen for any planet. Second, for HD 209458b in the opticalin particular, the opacity on the dayside is far larger than thaton the nightside, which further masks the contribution from thenightside.
We next compare our models to the recent four-band IRACdata on the transit of HD 209458b (Beaulieu et al. 2010). InFigure 12 we compare the 3D model at solar metallicity, alongwith the 1D model at 1× and 10× solar, to the mid-IR dataset. Here the base 10-bar radius is chosen to give a goodmatch to the data in the optical for the 1D models, and thissame base radius is used for the 3D model. While the solarmetallicity models generally reproduce the slope toward larger
Figure 12. Transit radius of HD 209458b 1D and 3D models, compared to theIRAC data of Beaulieu et al. (2010) and the mean 24 μm MIPS data point ofRichardson et al. (2006) and H. Knutson (2009, private communication). The3D model (which is 1× solar) is shown in purple, while 1D models at 1× and10× solar metallicity are shown in red and orange, respectively. The base radiusis chosen to give a good fit to the optical observations. Band-averaged modelradii over the IRAC bandpasses are shown in squares. The data are plottedassuming a parent star radius of 1.125 RS, after Knutson et al. (2007a). Watervapor and CO features dominate the mid-IR spectrum, as in HD 189733b, whilethe 4.4 μm feature in the 10× model is due to CO2.
(A color version of this figure is available in the online journal.)
radii at longer wavelength, none of the models reproduce thelarge radius variations found by Beaulieu et al. (2010). Togetherwith the previously published poor fit of the HD 209458b 3Dmodel to the secondary eclipse data (Showman et al. 2009), thismay indicate that the model does not reproduce the true mid-infrared opacity of the planet. We also note that while the 1Dand 3D models have dramatically different optical transit radii,due to the temperature-sensitive TiO/VO abundances, the sameis not true in the mid-infrared, where both the 1D and 3D solar-metallicity models are dominated my H2O and CO opacity, andpredict very similar radii.
7. SPECTRAL DIFFERENCES OF THE TRAILINGAND LEADING HEMISPHERES
In the current era, it is extremely difficult for observers toeven achieve data on hot Jupiter atmospheres. However, in thefuture this will not always be the case. We are quite optimisticabout the era of the James Webb Space Telescope (JWST), whichis scheduled to launch in 2014. It will then be possible to derivemore detailed information about these planets’ atmospheres. Inparticular, transmission spectra of a planet’s leading hemisphere(probed during the first half of transit ingress) and trailinghemisphere (during the last half of transit egress) may allowfor detection of spectral differences on different locations of theplanet. This could be complementary to eclipse mapping duringthe secondary eclipse ingress and egress phases (Williams et al.2006; Rauscher et al. 2007).
It is a general outcome of our published 3D hot Jupitersimulations that wide low-latitude west-to-east winds persist onarbitrarily long timescales. The first observational consequenceis that the hottest point of the planet is blown downstreamfrom the substellar point (Showman & Guillot 2002; Cooper& Showman 2005; Showman et al. 2009), which was confirmedfor HD 189733b by Knutson et al. (2007b). The effect is moredramatic in simulations of HD 189733b than for HD 209458b,owing mostly to a longer radiative time constant in HD 189733b(Showman et al. 2008; Fortney et al. 2008). At the time of
1404 FORTNEY ET AL. Vol. 709
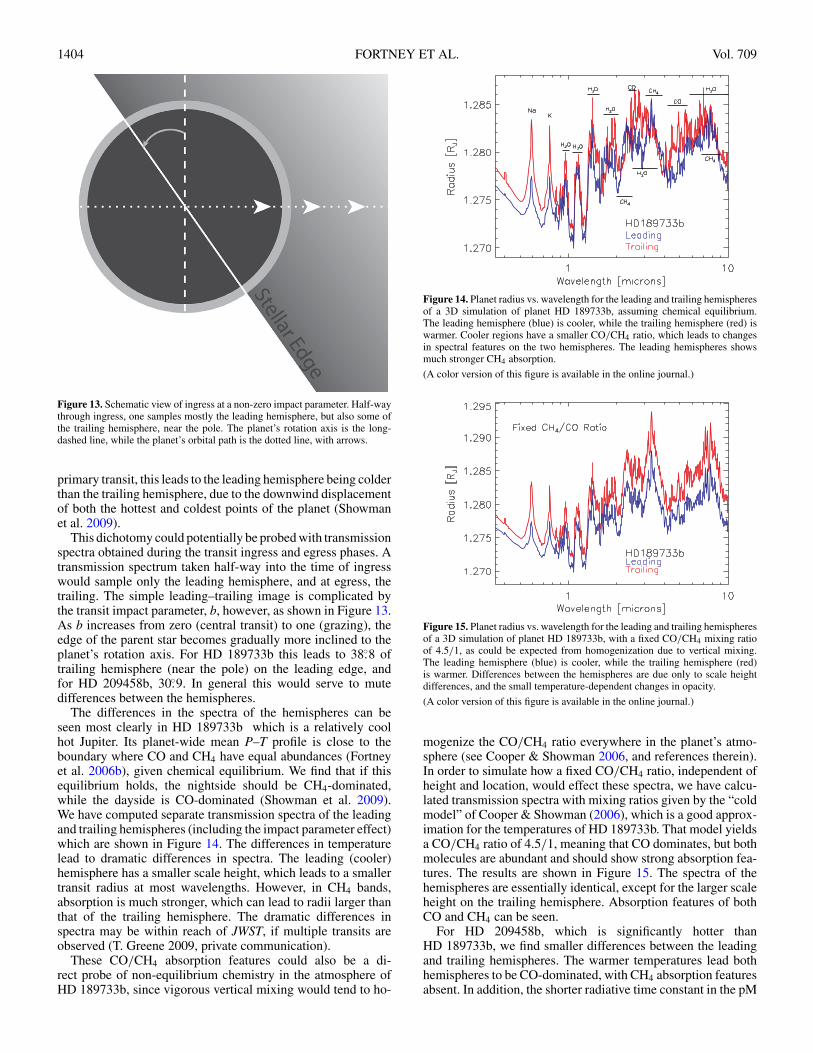
Figure 13. Schematic view of ingress at a non-zero impact parameter. Half-waythrough ingress, one samples mostly the leading hemisphere, but also some ofthe trailing hemisphere, near the pole. The planet’s rotation axis is the long-dashed line, while the planet’s orbital path is the dotted line, with arrows.
primary transit, this leads to the leading hemisphere being colderthan the trailing hemisphere, due to the downwind displacementof both the hottest and coldest points of the planet (Showmanet al. 2009).
This dichotomy could potentially be probed with transmissionspectra obtained during the transit ingress and egress phases. Atransmission spectrum taken half-way into the time of ingresswould sample only the leading hemisphere, and at egress, thetrailing. The simple leading–trailing image is complicated bythe transit impact parameter, b, however, as shown in Figure 13.As b increases from zero (central transit) to one (grazing), theedge of the parent star becomes gradually more inclined to theplanet’s rotation axis. For HD 189733b this leads to 38.◦8 oftrailing hemisphere (near the pole) on the leading edge, andfor HD 209458b, 30.◦9. In general this would serve to mutedifferences between the hemispheres.
The differences in the spectra of the hemispheres can beseen most clearly in HD 189733b which is a relatively coolhot Jupiter. Its planet-wide mean P–T profile is close to theboundary where CO and CH4 have equal abundances (Fortneyet al. 2006b), given chemical equilibrium. We find that if thisequilibrium holds, the nightside should be CH4-dominated,while the dayside is CO-dominated (Showman et al. 2009).We have computed separate transmission spectra of the leadingand trailing hemispheres (including the impact parameter effect)which are shown in Figure 14. The differences in temperaturelead to dramatic differences in spectra. The leading (cooler)hemisphere has a smaller scale height, which leads to a smallertransit radius at most wavelengths. However, in CH4 bands,absorption is much stronger, which can lead to radii larger thanthat of the trailing hemisphere. The dramatic differences inspectra may be within reach of JWST, if multiple transits areobserved (T. Greene 2009, private communication).
These CO/CH4 absorption features could also be a di-rect probe of non-equilibrium chemistry in the atmosphere ofHD 189733b, since vigorous vertical mixing would tend to ho-
Figure 14. Planet radius vs. wavelength for the leading and trailing hemispheresof a 3D simulation of planet HD 189733b, assuming chemical equilibrium.The leading hemisphere (blue) is cooler, while the trailing hemisphere (red) iswarmer. Cooler regions have a smaller CO/CH4 ratio, which leads to changesin spectral features on the two hemispheres. The leading hemispheres showsmuch stronger CH4 absorption.
(A color version of this figure is available in the online journal.)
Figure 15. Planet radius vs. wavelength for the leading and trailing hemispheresof a 3D simulation of planet HD 189733b, with a fixed CO/CH4 mixing ratioof 4.5/1, as could be expected from homogenization due to vertical mixing.The leading hemisphere (blue) is cooler, while the trailing hemisphere (red)is warmer. Differences between the hemispheres are due only to scale heightdifferences, and the small temperature-dependent changes in opacity.
(A color version of this figure is available in the online journal.)
mogenize the CO/CH4 ratio everywhere in the planet’s atmo-sphere (see Cooper & Showman 2006, and references therein).In order to simulate how a fixed CO/CH4 ratio, independent ofheight and location, would effect these spectra, we have calcu-lated transmission spectra with mixing ratios given by the “coldmodel” of Cooper & Showman (2006), which is a good approx-imation for the temperatures of HD 189733b. That model yieldsa CO/CH4 ratio of 4.5/1, meaning that CO dominates, but bothmolecules are abundant and should show strong absorption fea-tures. The results are shown in Figure 15. The spectra of thehemispheres are essentially identical, except for the larger scaleheight on the trailing hemisphere. Absorption features of bothCO and CH4 can be seen.
For HD 209458b, which is significantly hotter thanHD 189733b, we find smaller differences between the leadingand trailing hemispheres. The warmer temperatures lead bothhemispheres to be CO-dominated, with CH4 absorption featuresabsent. In addition, the shorter radiative time constant in the pM
No. 2, 2010 THREE-DIMENSIONAL TRANSMISSION SPECTRA 1405
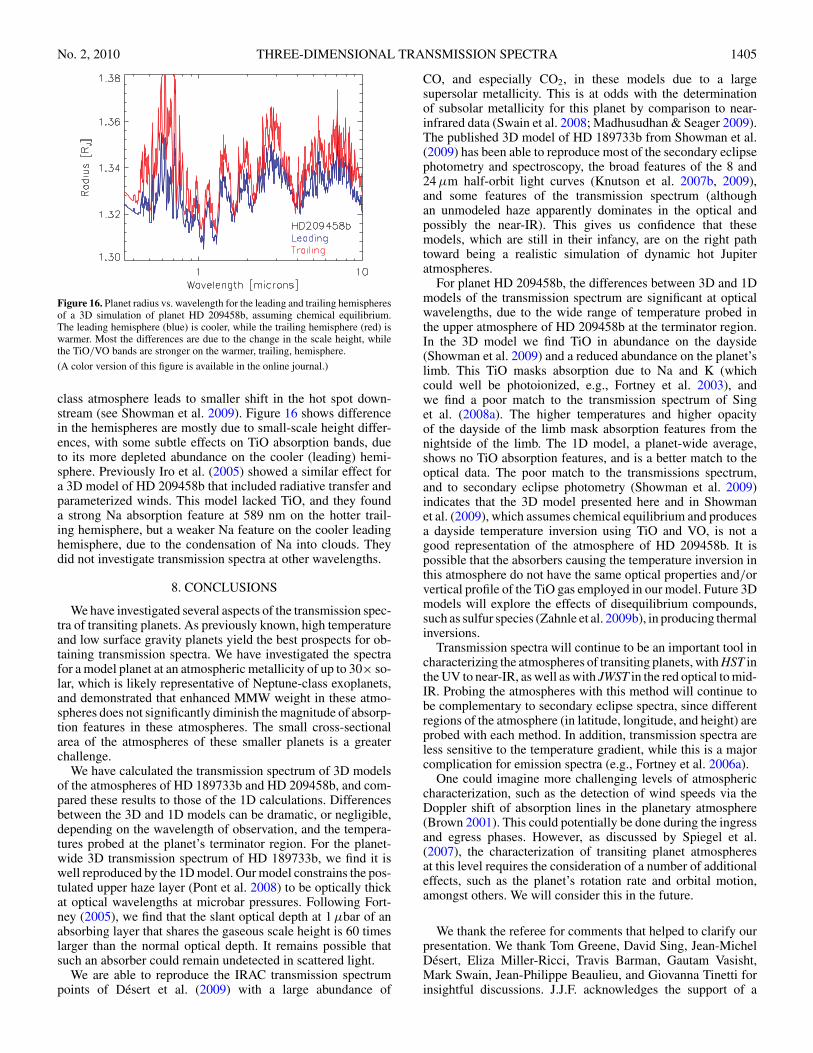
Figure 16. Planet radius vs. wavelength for the leading and trailing hemispheresof a 3D simulation of planet HD 209458b, assuming chemical equilibrium.The leading hemisphere (blue) is cooler, while the trailing hemisphere (red) iswarmer. Most the differences are due to the change in the scale height, whilethe TiO/VO bands are stronger on the warmer, trailing, hemisphere.
(A color version of this figure is available in the online journal.)
class atmosphere leads to smaller shift in the hot spot down-stream (see Showman et al. 2009). Figure 16 shows differencein the hemispheres are mostly due to small-scale height differ-ences, with some subtle effects on TiO absorption bands, dueto its more depleted abundance on the cooler (leading) hemi-sphere. Previously Iro et al. (2005) showed a similar effect fora 3D model of HD 209458b that included radiative transfer andparameterized winds. This model lacked TiO, and they founda strong Na absorption feature at 589 nm on the hotter trail-ing hemisphere, but a weaker Na feature on the cooler leadinghemisphere, due to the condensation of Na into clouds. Theydid not investigate transmission spectra at other wavelengths.
8. CONCLUSIONS
We have investigated several aspects of the transmission spec-tra of transiting planets. As previously known, high temperatureand low surface gravity planets yield the best prospects for ob-taining transmission spectra. We have investigated the spectrafor a model planet at an atmospheric metallicity of up to 30× so-lar, which is likely representative of Neptune-class exoplanets,and demonstrated that enhanced MMW weight in these atmo-spheres does not significantly diminish the magnitude of absorp-tion features in these atmospheres. The small cross-sectionalarea of the atmospheres of these smaller planets is a greaterchallenge.
We have calculated the transmission spectrum of 3D modelsof the atmospheres of HD 189733b and HD 209458b, and com-pared these results to those of the 1D calculations. Differencesbetween the 3D and 1D models can be dramatic, or negligible,depending on the wavelength of observation, and the tempera-tures probed at the planet’s terminator region. For the planet-wide 3D transmission spectrum of HD 189733b, we find it iswell reproduced by the 1D model. Our model constrains the pos-tulated upper haze layer (Pont et al. 2008) to be optically thickat optical wavelengths at microbar pressures. Following Fort-ney (2005), we find that the slant optical depth at 1 μbar of anabsorbing layer that shares the gaseous scale height is 60 timeslarger than the normal optical depth. It remains possible thatsuch an absorber could remain undetected in scattered light.
We are able to reproduce the IRAC transmission spectrumpoints of Desert et al. (2009) with a large abundance of
CO, and especially CO2, in these models due to a largesupersolar metallicity. This is at odds with the determinationof subsolar metallicity for this planet by comparison to near-infrared data (Swain et al. 2008; Madhusudhan & Seager 2009).The published 3D model of HD 189733b from Showman et al.(2009) has been able to reproduce most of the secondary eclipsephotometry and spectroscopy, the broad features of the 8 and24 μm half-orbit light curves (Knutson et al. 2007b, 2009),and some features of the transmission spectrum (althoughan unmodeled haze apparently dominates in the optical andpossibly the near-IR). This gives us confidence that thesemodels, which are still in their infancy, are on the right pathtoward being a realistic simulation of dynamic hot Jupiteratmospheres.
For planet HD 209458b, the differences between 3D and 1Dmodels of the transmission spectrum are significant at opticalwavelengths, due to the wide range of temperature probed inthe upper atmosphere of HD 209458b at the terminator region.In the 3D model we find TiO in abundance on the dayside(Showman et al. 2009) and a reduced abundance on the planet’slimb. This TiO masks absorption due to Na and K (whichcould well be photoionized, e.g., Fortney et al. 2003), andwe find a poor match to the transmission spectrum of Singet al. (2008a). The higher temperatures and higher opacityof the dayside of the limb mask absorption features from thenightside of the limb. The 1D model, a planet-wide average,shows no TiO absorption features, and is a better match to theoptical data. The poor match to the transmissions spectrum,and to secondary eclipse photometry (Showman et al. 2009)indicates that the 3D model presented here and in Showmanet al. (2009), which assumes chemical equilibrium and producesa dayside temperature inversion using TiO and VO, is not agood representation of the atmosphere of HD 209458b. It ispossible that the absorbers causing the temperature inversion inthis atmosphere do not have the same optical properties and/orvertical profile of the TiO gas employed in our model. Future 3Dmodels will explore the effects of disequilibrium compounds,such as sulfur species (Zahnle et al. 2009b), in producing thermalinversions.
Transmission spectra will continue to be an important tool incharacterizing the atmospheres of transiting planets, with HST inthe UV to near-IR, as well as with JWST in the red optical to mid-IR. Probing the atmospheres with this method will continue tobe complementary to secondary eclipse spectra, since differentregions of the atmosphere (in latitude, longitude, and height) areprobed with each method. In addition, transmission spectra areless sensitive to the temperature gradient, while this is a majorcomplication for emission spectra (e.g., Fortney et al. 2006a).
One could imagine more challenging levels of atmosphericcharacterization, such as the detection of wind speeds via theDoppler shift of absorption lines in the planetary atmosphere(Brown 2001). This could potentially be done during the ingressand egress phases. However, as discussed by Spiegel et al.(2007), the characterization of transiting planet atmospheresat this level requires the consideration of a number of additionaleffects, such as the planet’s rotation rate and orbital motion,amongst others. We will consider this in the future.
We thank the referee for comments that helped to clarify ourpresentation. We thank Tom Greene, David Sing, Jean-MichelDesert, Eliza Miller-Ricci, Travis Barman, Gautam Vasisht,Mark Swain, Jean-Philippe Beaulieu, and Giovanna Tinetti forinsightful discussions. J.J.F. acknowledges the support of a
1406 FORTNEY ET AL. Vol. 709
Spitzer Theory Program grant. A.P.S. acknowledges supportfrom the Origins and Spitzer programs. M.S.M. acknowledgesthe support of the NASA Planetary Atmospheres Program.
REFERENCES
Adcroft, A., Campin, J.-M., Hill, C., & Marshall, J. 2004, Mon. Weather Rev.,132, 2845
Agol, E., Cowan, N. B., Bushong, J., Knutson, H., Charbonneau, D., Deming,D., & Steffen, J. H. 2009, in IAU Symp. 253, Transiting Planets, ed. D.Queloz et al. (Dordrecht: Kluwer), 209
Barman, T. 2007, ApJ, 661, L191Barman, T. S., Hauschildt, P. H., & Allard, F. 2001, ApJ, 556, 885Barman, T. S., Hauschildt, P. H., & Allard, F. 2005, ApJ, 632, 1132Barman, T. S., Hauschildt, P. H., Schweitzer, A., Stancil, P. C., Baron, E., &
Allard, F. 2002, ApJ, 569, L51Beaulieu, J. P., Carey, S., Ribas, I., & Tinetti, G. 2008, ApJ, 677, 1343Beaulieu, J. P., et al. 2010, MNRAS, in press (arXiv:0909.0185)Bezard, B., Lellouch, E., Strobel, D., Maillard, J.-P., & Drossart, P. 2002, Icarus,
159, 95Borysow, A. 2002, A&A, 390, 779Bouchy, F., et al. 2005, A&A, 444, L15Brown, T. M. 2001, ApJ, 553, 1006Burrows, A., Budaj, J., & Hubeny, I. 2008, ApJ, 678, 1436Burrows, A., Hubeny, I., Budaj, J., Knutson, H. A., & Charbonneau, D.
2007, ApJ, 668, L171Burrows, A., Hubeny, I., & Sudarsky, D. 2005, ApJ, 625, L135Charbonneau, D., Brown, T. M., Latham, D. W., & Mayor, M. 2000, ApJ, 529,
L45Charbonneau, D., Brown, T. M., Noyes, R. W., & Gilliland, R. L. 2002, ApJ,
568, 377Charbonneau, D., Knutson, H. A., Barman, T., Allen, L. E., Mayor, M., Megeath,
S. T., Queloz, D., & Udry, S. 2008, ApJ, 686, 1341Charbonneau, D., et al. 2005, ApJ, 626, 523Cooper, C. S., & Showman, A. P. 2005, ApJ, 629, L45Cooper, C. S., & Showman, A. P. 2006, ApJ, 649, 1048Desert, J.-M., Lecavelier des Etangs, A., Hebrard, G., Sing, D. K., Ehrenreich,
D., Ferlet, R., & Vidal-Madjar, A. 2009, ApJ, 699, 478Desert, J.-M., Vidal-Madjar, A., Lecavelier Des Etangs, A., Sing, D., Ehrenreich,
D., Hebrard, G., & Ferlet, R. 2008, A&A, 492, 585Dobbs-Dixon, I., & Lin, D. N. C. 2008, ApJ, 673, 513Ehrenreich, D., Hebrard, G., Lecavelier des Etangs, A., Sing, D. K., Desert,
J.-M., Bouchy, F., Ferlet, R., & Vidal-Madjar, A. 2007, ApJ, 668, L179Fortney, J. J. 2005, MNRAS, 364, 649Fortney, J. J., Cooper, C. S., Showman, A. P., Marley, M. S., & Freedman, R. S.
2006a, ApJ, 652, 746Fortney, J. J., Lodders, K., Marley, M. S., & Freedman, R. S. 2008, ApJ, 678,
1419Fortney, J. J., & Marley, M. S. 2007, ApJ, 666, L45Fortney, J. J., Marley, M. S., Lodders, K., Saumon, D., & Freedman, R.
2005, ApJ, 627, L69Fortney, J. J., Saumon, D., Marley, M. S., Lodders, K., & Freedman, R. S.
2006b, ApJ, 642, 495Fortney, J. J., Sudarsky, D., Hubeny, I., Cooper, C. S., Hubbard, W. B., Burrows,
A., & Lunine, J. I. 2003, ApJ, 589, 615Freedman, R. S., Marley, M. S., & Lodders, K. 2008, ApJS, 174, 504Geballe, T. R., Saumon, D., Golimowski, D. A., Leggett, S. K., Marley, M. S.,
& Noll, K. S. 2009, ApJ, 695, 844Goody, R., West, R., Chen, L., & Crisp, D. 1989, J. Quant. Spectrosc. Radiat.
Transfer, 42, 539Henry, G. W., Marcy, G. W., Butler, R. P., & Vogt, S. S. 2000, ApJ, 529, L41Hubbard, W. B., Fortney, J. J., Lunine, J. I., Burrows, A., Sudarsky, D., & Pinto,
P. 2001, ApJ, 560, 413Hubeny, I., & Burrows, A. 2007, ApJ, 669, 1248Iro, N., Bezard, B., & Guillot, T. 2005, A&A, 436, 719Knutson, H. A., Charbonneau, D., Allen, L. E., Burrows, A., & Megeath, S. T.
2008, ApJ, 673, 526Knutson, H. A., Charbonneau, D., Noyes, R. W., Brown, T. M., & Gilliland,
R. L. 2007a, ApJ, 655, 564Knutson, H. A., et al. 2007b, Nature, 447, 183Knutson, H. A., et al. 2009, ApJ, 690, 822Langland-Shula, L. E., Vogt, S. S., Charbonneau, D., Butler, P., & Marcy, G.
2009, ApJ, 696, 1355
Lecavelier des Etangs, A., Pont, F., Vidal-Madjar, A., & Sing, D. 2008a, A&A,481, L83
Lecavelier des Etangs, A., Vidal-Madjar, A., Desert, J.-M., & Sing, D.2008b, A&A, 485, 865
Liang, M., Seager, S., Parkinson, C. D., Lee, A. Y.-T., & Yung, Y. L. 2004, ApJ,605, L61
Lodders, K. 1999, ApJ, 519, 793Lodders, K. 2002, ApJ, 577, 974Lodders, K. 2010, in Formation and Evolution of Exoplanets, ed. R. Barnes
(Berlin: Wiley), in press (arXiv:0910.0811)Lodders, K., & Fegley, B. 2002, Icarus, 155, 393Lodders, K., & Fegley, B. 2006, Astrophysics Update 2 (Berlin: Springer)Machalek, P., McCullough, P. R., Burke, C. J., Valenti, J. A., Burrows, A., &
Hora, J. L. 2008, ApJ, 684, 1427Madhusudhan, N., & Seager, S. 2009, ApJ, 707, 24Marley, M. S., Fortney, J., Seager, S., & Barman, T. 2007, in Protostars and
Planets V, ed. B. Reipurth, D. Jewitt, & K. Keil (Tucson, AZ: Univ. ofArizona Press), 733
Marley, M. S., Gelino, C., Stephens, D., Lunine, J. I., & Freedman, R. 1999, ApJ,513, 879
Marley, M. S., & McKay, C. P. 1999, Icarus, 138, 268Menou, K., & Rauscher, E. 2009, ApJ, 700, 887Miller-Ricci, E., Seager, S., & Sasselov, D. 2009, ApJ, 690, 1056Pont, F., Knutson, H., Gilliland, R. L., Moutou, C., & Charbonneau, D.
2008, MNRAS, 385, 109Prinn, R. G., & Barshay, S. S. 1977, Science, 198, 1031Rauscher, E., & Menou, K. 2009, ApJ, submitted (arXiv:0907.2692)Rauscher, E., Menou, K., Seager, S., Deming, D., Cho, J. Y.-K., & Hansen,
B. M. S. 2007, ApJ, 664, 1199Redfield, S., Endl, M., Cochran, W. D., & Koesterke, L. 2008, ApJ, 673, L87Richardson, L. J., Harrington, J., Seager, S., & Deming, D. 2006, ApJ, 649,
1043Saumon, D., Marley, M. S., Cushing, M. C., Leggett, S. K., Roellig, T. L.,
Lodders, K., & Freedman, R. S. 2006, ApJ, 647, 552Saumon, D., Marley, M. S., Lodders, K., & Freedman, R. S. 2003, in IAU Symp.
211, Brown Dwarfs, ed. E. Martin (San Francisco, CA: ASP), 345Seager, S., Richardson, L. J., Hansen, B. M. S., Menou, K., Cho, J. Y.-K., &
Deming, D. 2005, ApJ, 632, 1122Seager, S., & Sasselov, D. D. 2000, ApJ, 537, 916Sharp, C. M., & Burrows, A. 2007, ApJS, 168, 140Showman, A. P., Cooper, C. S., Fortney, J. J., & Marley, M. S. 2008, ApJ, 682,
559Showman, A. P., Fortney, J. J., Lian, Y., Marley, M. S., Freedman, R. S., Knutson,
H. A., & Charbonneau, D. 2009, ApJ, 699, 564Showman, A. P., & Guillot, T. 2002, A&A, 385, 166Sing, D. K., Desert, J.-M., Lecavelier des Etangs, A., Ballester, G. E., Vidal-
Madjar, A., Parmentier, V., Hebrard, G., & Henry, G. W. 2009, A&A, 505,891
Sing, D. K., Vidal-Madjar, A., Desert, J.-M., Lecavelier des Etangs, A., &Ballester, G. 2008a, ApJ, 686, 658
Sing, D. K., Vidal-Madjar, A., Lecavelier des Etangs, A., Desert, J.-M., Ballester,G., & Ehrenreich, D. 2008b, ApJ, 686, 667
Snellen, I. A. G., Albrecht, S., de Mooij, E. J. W., & Le Poole, R. S. 2008, A&A,487, 357
Spiegel, D. S., Haiman, Z., & Gaudi, B. S. 2007, ApJ, 669, 1324Spiegel, D. S., Silverio, K., & Burrows, A. 2009, ApJ, 699, 1487Sudarsky, D., Burrows, A., & Hubeny, I. 2003, ApJ, 588, 1121Sudarsky, D., Burrows, A., & Pinto, P. 2000, ApJ, 538, 885Swain, M. R., Vasisht, G., & Tinetti, G. 2008, Nature, 452, 329Swain, M. R., Vasisht, G., Tinetti, G., Bouwman, J., Chen, P., Yung, Y., Deming,
D., & Deroo, P. 2009, ApJ, 690, L114Tinetti, G., Liang, M.-C., Vidal-Madjar, A., Ehrenreich, D., Lecavelier des
Etangs, A., & Yung, Y. L. 2007a, ApJ, 654, L99Tinetti, G., et al. 2007b, Nature, 448, 169Vidal-Madjar, A., Lecavelier des Etangs, A., Desert, J.-M., Ballester, G. E.,
Ferlet, R., Hebrard, G., & Mayor, M. 2003, Nature, 422, 143Vidal-Madjar, A., et al. 2004, ApJ, 604, L69Visscher, C., Lodders, K., & Fegley, B. J. 2006, ApJ, 648, 1181Williams, P. K. G., Charbonneau, D., Cooper, C. S., Showman, A. P., & Fortney,
J. J. 2006, ApJ, 649, 1020Yung, Y. L., Drew, W. A., Pinto, J. P., & Friedl, R. R. 1988, Icarus, 73, 516Zahnle, K., Marley, M. S., & Fortney, J. J. 2009a, ApJ, submitted
(arXiv:0911.0728)Zahnle, K., Marley, M. S., Freedman, R. S., Lodders, K., & Fortney, J. J.
2009b, ApJ, 701, L20