Embed Size (px)
Citation preview
1
Cahier de recherche 2016-09
The Incidence of XBRL Voluntary Disclosure on the Value Relevance of Earnings: The Role of Corporate
Governance
Denis Cormier, ESG UQAM
Dominique Dufour, Philippe Luu, Pierre Teller, Robert
Teller
GRM IAE de Nice, Université de Nice Sophia Antipolis
We acknowledge the financial support from l’Autorité des marchés financiers (Québec).
All usual caveats apply.
2
The Incidence of XBRL Voluntary Disclosure on the Value Relevance of Earnings:
The Role of Corporate Governance
Abstract
The aim of this paper is to investigate how voluntary disclosures in XBRL files affect the
value relevance of GAAP earnings considering the quality of corporate governance.
Results are the following. Good corporate governance is positively associated with
voluntary XBRL extensions. We observe that XBRL extensions enhance the positive
relationship between earnings and stock price. However, this positive association is
reduced for firms with a good governance, suggesting a substitution effect between
XBRL extensions and corporate governance. This research highlights the importance to
consider corporate governance when assessing the relevance of XBRL disclosures for
stock market participants. It also appears that XBRL extensions would strategically be
related to earnings quality. Finally, findings show that XBRL extensions attract financial
analysts.
Key words: Governance, Value relevance, XBRL
Incidence de la divulgation volontaire XBRL sur la valeur valorisation boursière
des résultats : Le rôle de la gouvernance d'entreprise
Résumé
L'objectif de cette étude est d'analyser comment les divulgations volontaires en fichiers
XBRL influent sur la pertinence des résultats comptables selon les normes comptables
compte tenu de la qualité de la gouvernance d'entreprise. Les résultats sont les suivants:
Une bonne gouvernance d'entreprise est positivement associée aux extensions XBRL
volontaires. Nous observons que les extensions XBRL améliorent la relation positive
entre les résultats et les cours boursiers. Toutefois, cette association positive est réduite
pour les entreprises ayant une bonne gouvernance, ce qui suggère un effet de substitution
entre les extensions XBRL et la gouvernance d'entreprise. Cette recherche met en
évidence l'importance d'examiner la gouvernance d'entreprise lors de l'évaluation de la
pertinence des informations XBRL pour les participants du marché boursier. Il semble
également que les extensions XBRL seraient stratégiquement liées à la qualité des
résultats. Enfin, les résultats montrent que les extensions XBRL attirent les analystes
financiers.
Mots clés : Gouvernance, Valorisation boursière, XBRL
3
1. Introduction
XBRL (eXtensible Business Reporting Language) is a freely available and global
language for exchanging business information, mainly financial statements. XBRL
taxonomy fixed by the regulator (e.g. Securities and Exchange Commission) provides an
identifying tag for each individual item of data, whether numeric or textual. This tag is
computer readable and allows the information to be used interactively.
Each year, accounting standard setters publish or update the reference taxonomy
for their accounting standards. The FASB publishes XBRL taxonomy for the U.S. GAAP
(Generally Accepted Accounting Principles) that supersedes SEC taxonomy (with over
15,000 unique tags), while the IFRS Foundation publishes taxonomy for the IFRS and so
on. Filers can also find other taxonomies for more specific and accurate purposes (for a
country, an industry, mmutual funds, credit rating agencies, etc.), which can be used
along the reference taxonomy. But, and this is very important, an essential feature of
XBRL is the possibility for the filer to create new tags (and a new custom taxonomy at
the same time). The new tags are called “extensions”. Filers can create as many
extensions as they want if they believe that these voluntary new tags are relevant to
describe their particular situation. The aim of this paper is to investigate the determinants
and value relevance of these extensions.
Studies on the incidence of XBRL for market participants are numerous but little
is known about the mechanisms underlying the real impact of taxonomy extensions.
Similarly, our study is the first to focus on the link between extensions and corporate
governance mechanisms. Prior research shows that the impact of XBRL adoption for
4
market participants is important but the great majority of them considers XBRL
implementation as a uniform process (i.e. adoption or not). However, this approach does
not allow assessing how investors perceive information published by companies using
XBRL’s extensions.
The central concern is about the flexibility associated with the taxonomy’s
extensions. XBRL’s extensions can facilitate better reporting and reduce information
asymmetry but extensive use of taxonomy extensions can also produce uncertainty
related to financial statement quality.
There are two opposite views about the taxonomy’s extensions impact on stock
markets. Critics argue that extensions increase the uncertainty of financial information
and information asymmetry between filers and market participants. For them, extensions
may require a manual analysis of the meaning of an extended item and this process can
reduce the speed and accuracy of financial analysis. Critics also argue that, even properly
used, extensions make computer comparisons difficult because each element of the
extension must be interpreted by the user (see Debreceny et al., 2011). Financial
information will be harder for investors to analyze because extensions can threaten
comparability and reliability of the XBRL-based disclosures (Boritz and No, 2005).
Furthermore, managers may abuse the reporting discretion permitted under the XBRL to
manipulate extensions for private objectives.
Supporters of taxonomy’s extensions, such as SEC and IFRS foundation argue
that extensions improve reporting transparency and create a better information
environment between filers, regulators and investors. SEC and IFRS foundation are in
5
favor of taxonomy extensions for the U.S. GAAP and IFRS financial reporting
taxonomy. For them, the use of extensions is consistent with reporting flexibility and
suggests that such flexibility would facilitate financial analysis with better information
between the firms and outsiders, including investors (IFRS Foundation, 2015).
With a better reporting flexibility, managers can use extensions to communicate
information that would otherwise be missing or poorly reflected in the mandated
taxonomy. The use of extensions avoids loss of information and improves the quality of
financial reporting for investors and financial markets (Boritz and No, 2009). Debreceny
et al. (2011) argue that the XBRL extensions, when employed properly, add value for
stock market’s participants.
In the current study, we aim to assess the impact of these extensions on the value
relevance of published financial statements and we highlight how voluntary disclosures
in XBRL format affect the value relevance of GAAP earnings considering the quality of
corporate governance. More specifically, our research investigates the nature and the
importance of taxonomy’s extensions and argues that this practice is part of a voluntary
disclosure strategy.
Our sample comprises Canadian firms, some of which are cross-listed to a U.S.
stock exchange and using U.S. GAAP XBRL taxonomy. Foreign companies which use
International Financial Reporting Standards (IFRS) are expected to submit their financial
statements to the SEC using XBRL once the IFRS taxonomy has been accepted by the
SEC. By the meantime, Canadian companies cross-listed to the U.S. are not yet required
to comply with XBRL unless they report under US-GAAP.
6
Results are the following: We show that good corporate governance is associated
with voluntary XBRL extensions. As expected, we observe that XBRL extensions
enhance the value relevance of earnings. However, this positive association between
XBRL extensions and stock price is reduced for firms with a good governance,
suggesting a substitution effect between XBRL extensions and corporate governance. It
also appears that XBRL extensions would strategically be related to earnings quality.
Finally, findings show that XBRL extensions attract financial analysts.
The paper is organized as follows: Section 2 presents the framework and research
hypotheses. Section 3 presents the methodology. The results follow in Section 4 and the
last section provides a conclusion and a discussion of the potential results’ implications.
2. Framework
2.1 XBRL disclosure: A literature review
XBRL is a language for the electronic communication of business and financial
data around the world. It is a product of XBRL International, a nonprofit consortium
(www.xbrl.org). Initiated in 1998 by Charles Hoffman, the XBRL language is supported
by numerous jurisdictions all around the world. XBRL is used by more than 100
regulators in more than 60 countries, supported by more than 200 software packages and
in an increasing number of corporates to facilitate structured data reporting within
millions of companies (XBRL, 2016). This electronic language permits computer-
automated acquisition and representation of information within financial reports
(Blankespoor, Miller and White, 2014). The introduction of XBRL tags enables
automated processing of business information by computer software, cutting out
7
laborious and costly processes of manual re-entry and comparison (Alles and Piechocki,
2012).
Investors, analysts, financial institutions and regulators, can receive and analyze
data rapidly and efficiently when the data is in XBRL format. Moreover, XBRL increases
the speed of reporting financial data and reduces the risk of error by checking information
automatically (Liu et al., 2014). With XBRL files, financial analysts can easily
incorporate the information when performing forecasts. Hence, they can incorporate more
data into their analyses and follow more firms (Baldwin and Trinkle, 2011).
XBRL can disaggregate and reformat data for each specific user. It has the
potential to liberate the substance of financial data over its form (Alles and Piechocki,
2012). It is also expected to improve the transparency and the quality of information
(Yoon et al., 2011; Kim et al., 2012; Wang and Seng 2014; Yen and Wang, 2015). XBRL
is also believed to be crucial in democratizing capital markets by leveling the playing
field for all investors (Debreceny et al., 2005).
Data is available in a less costly and timelier fashion, once the setup costs have
been incurred, the costs of processing the data in XBRL filings should be greatly reduced
(Efendi, Park and Smith, 2014). XBRL improves the ability of firms to provide real-time
data by eliminating the need to rekey data, thus improving the speed of data acquisition
(Debreceny and Gray, 2001).
With XBRL, it is also possible to extract both financial and corporate governance
indicators, when the information is presented in XBRL format (Li, Liang, Lin and Chen,
2015). In addition, the standardized tagging structure of XBRL provides a way to
8
compare information across firms and allows investors to quickly compare items without
restatements of data across firms.
Since the adoption of XBRL language by the SEC in 2009, XBRL has become an
international standard for addressing the challenging issues that businesses and
governments face worldwide in financial reporting and regulation (Li, Liang, Lin, and
Chen, 2015).
Prior research on the impact and effectiveness of XBRL finds some significant
effects of XBRL adoption. Chen, Harris, Li and Wu (2015), and Li et al. (2012) find that
XBRL adoption leads to a significant reduction in the cost of equity capital as a result of
a decrease in information processing cost. Yoon, Zo and Ciganek (2011) and Kim et al.
(2012) have documented an impact of XBRL on information asymmetry. Generally,
XBRL use is associated with an increased level of transparency in financial reporting. If
the level of financial disclosures is increased by adopting XBRL, information asymmetry
is expected to be reduced, which could lead to the decrease of the cost of equity capital
and the increase of a firm's stock market valuation (Yoon, Zo and Ciganek, 2011).
However, the effect of XBRL on information asymmetry provides conflicting results. For
example, Liu et al. (2014) find an increase in information asymmetry while Chen and Li
(2013) indicate a decrease.
Kim et al. (2012) examine the mandated first-year XBRL adoption and find an
increase in information efficiency and a decrease in stock return volatility. Focusing on
intra-day market reaction, Cong et al. (2014) argue that XBRL reporting facilitates the
convergence of information into the market and improves market efficiency. Liu et al.
9
(2014) find a positive relationship between the XBRL implementation in the U.S. and the
number of analysts following a firm, as well as analyst forecast accuracy.
Yoon et al. (2011), using Korean data, find that XBRL implementation is
negatively associated with bid-ask spreads but Blankespoor et al. (2014) find the opposite
results using U.S. data. Efendi et al. (2014) use post-earnings announcement drift as a
measure of information efficiency and find that after XBRL adoption, the drift declines
with positive unexpected earnings. Kim et al. (2013) find that XBRL adoption improves
firms’ disclosure policies with less opportunistic accruals. XBRL provide detailed
information that can help investors interpret and confirm the earnings news.
2.2 SEC’s XBRL mandate
In 2006, the SEC contracted with XBRL US to develop the foundation taxonomy.
The U.S. GAAP Financial Reporting Taxonomy together with the FASB was designed to
represent common reporting practices and support the disclosure requirements of U.S.
GAAP, allowing filers to tag information in their financial statements with the
appropriate tags in the U.S. GAAP Financial Reporting Taxonomy (Debreceny and al.,
2011; Li and Nwaeze, 2015). For its part, the IFRS Foundation promotes XBRL use and
supports the move towards structured electronic reporting by producing the IFRS
Taxonomy for XBRL filings.
The SEC's objective was to enhance the informational efficiency in stock markets
by making financial data easier to use and analyze for a broad range of investors (Efendi,
Park and Smith, 2014).
10
Furthermore, the adoption of XBRL avoids the additional effort associated with
multiple reconciliations of domestic financial statements to U.S. GAAP or IFRS. Thus,
XBRL promotes the harmonization of international business reporting standards all
around the world and provides the possibility to build information systems that enhance
the comparison of financial reports of different firms within one or more sets of GAAP
(Premuroso and Bhattacharya, 2008).
The SEC contends that this new search-facilitating technology will reduce
informational barriers that separate smaller investors from larger, thereby reducing
information asymmetry (Blankespoor, Miller and White, 2014).
2.3 Corporate Governance and Financial Reporting
The association between corporate governance and financial reporting quality can
be viewed from two perspectives. First, Bushman, Chen, Engel and Smith (2004) posit
and find evidence that is consistent with firms building strong governance structures to
counter poor quality earnings measures. The authors posit that limited transparency of
firms’ operations to outside investors increases demands on governance systems to
alleviate moral hazard problems. This line of reasoning suggests that strong corporate
governance structures, such as external monitoring, respond to poor earnings quality, i.e.,
improved governance is implemented to increase earnings quality.
A second perspective is that poor governance leads to poor earnings quality (e.g.
Holthausen, Larcker and Sloan, 1995; Klein, 2002; Larcker and Richardson, 2004;
Bowen, Rajgopal and Venkatachalam, 2008). This line of research suggests that earnings
quality responds to governance structures, i.e., poor earnings quality is associated with
11
poor governance. For instance, Athanasakou and Olsson (2012) separate innate and
discretionary components of earnings quality. Their results suggest that better
discretionary earnings quality is associated with better governance.
2.4 Hypotheses
Extensive disclosure helps financial analysts to produce valuable new
information, such as more precise forecasts and buy/sell recommendations, thereby
increasing demand on their services (Healy and Palepu, 2001). Lang and Lundholm
(1996) provide evidence that firms with more informative disclosures have a larger
analyst following, more accurate analyst earnings forecasts, and less dispersion in analyst
forecasts. Hence, we anticipate a positive relationship between analyst following
(ANFOL) and the release of XBRL extensions. We also anticipate that XBRL extensions
should help analysts to make more precise earnings predictions and, therefore, a greater
association between earnings and stock price. This gives rise to the following hypotheses:
H1. ANFOL is positively associated with the level of XBRL extensions
H2. XBRL extensions enhance the value relevance of earnings
In addition, there is also the possibility that there is a moderating effect between
firm-level governance and XBRL extensions. In that respect, Cormier and Magnan
(2014) as well as Craighead, Magnan and Thorne (2004) both find that corporate
voluntary disclosure and corporate governance can act as substitutes to one another.
While they focus on either environmental reporting (Cormier and Magnan, 2014) or

12
executive compensation reporting (Craighead et al., 2004), we infer that their evidence
extends to financial reporting, including XBRL reporting. For instance, earnings are
likely to be of high quality, i.e., relevant and reliable, if there is strong governance, a
situation which will attract greater financial analysts’ coverage and reduce information
asymmetry. In such a context, XBRL extensions are likely to be less needed and less
relevant for earnings valuation. XBRL extensions are likely to be more relevant in a
context of weak governance, i.e. to act as a substitute for less effective governance
mechanisms in reducing asymmetry. Overall, XBRL extensions should help market
participants to better assess earnings valuation when the firm-level governance is weak.
Hence, the following hypothesis:
H3. Corporate governance moderates the relation between XBRL extensions and the
value relevance of earnings.
3. Method
3.1 Sample
The sample comprises 155 firm-year observations of Canadian firms. We first
choose U.S. cross-listed firms composing the S&P/TSX index of the Toronto stock
exchange for years from 2010 to 2015, for a 38 firm-year observations (8 firms) reporting
under US-GAAP and providing extended (voluntary) XBRL information. Second, from
SEDAR Canadian database, we find 24 firm-year observations (13 firms) of Canadian
firms reporting under IFRS providing XBRL extensions. This gives 62 firm-year
observations (21 firms). Third, we match these 21 firms based on size (total asset) and
13
industry membership based on listed firms composing the S&P/TSX index of the Toronto
stock exchange for the same years. This matched sample gives 93 firm-year observations
(21 X 6 years = 126 – 33 missing data essentially for the ISS Governance score = 93).
This match sample is warranted since focusing on a sample of firms that report XBRL
extensions is likely to create a sample selection bias. Hence, our final sample comprises
155 firm-year observations (42 firms). These large firms (average market capitalization
of 13 billion Cd $ per firm) represent more than 35% of the Canadian total stock market
capitalization in 2015 and 55% of S&P/TSX index.
3.2 Database
In 2009, the U.S. SEC issued a rule requiring certain listed firms to submit their
financial statements (10K and 10Q) in the XBRL format. Following a transition phase, all
public companies and foreign private issuers listed in the United States are now subject to
this regulation. Thus, a very large amount of XBRL files concerning firms operating in
North America is now available, because all the files are publicly available on the
EDGAR platform.
The XBRL files are not only publicly available, but the SEC and XBRL US
created multiple tools to make the data easy to read and collect. We can cite, for example,
the EDGAR Dashboard XBRL Cloud (from the SEC), a free-to-use online service
granting an access to any XBRL file in any web browser. Another interesting application
is the XBRL API built by XBRL US, which adds some functions to spreadsheet software
14
like Excel or Google Docs to extract and load the content of a tag within an XBL file of
the SEC database into the spreadsheet.
Presently, no other XBRL initiative in the world can be compared to the SEC
mandate in the U.S. (both in terms of quantity or availability of the data). But that may
change in the future, since other XBRL initiatives exist now in several countries. In
Canada, some XBRL files are available online on the SEDAR web service. It is still a
voluntary process for filers, but Canadian government is pushing towards a standard
digital reporting for public companies, and XBRL is of course the favourite option. The
situation is similar in Europe, the European Commission started consultations about the
mandatory adoption of a standard business reporting language. In some European
countries, XBRL initiatives already took place (in Belgium, the Netherlands, Spain, UK,
etc.). The main difference between North America and Europe is that there is no platform
like EDGAR or SEDAR to collect the data in Europe. In other words, the XBRL data
exists (both in IFRS and local GAAP) but the gathering is more complex, and still
implies heavy manual work.
To build our database, we first imported XBRL financial statements from the SEC
Edgar platform, which contains all the XBRL files issued by listed companies since 2009.
This set contains all the files submitted to the SEC. Since new files are continually
published, we created a program to automatically find, download and store the new files.
This program reads the RSS file available on the EDGAR website, and when it finds a
file that is not in the database, it downloads it. The different files are stored in a way
allowing further research (by CIK code, company name, issue date, etc.). We completed
15
our database with Canadian XBRL files available on the SEDAR website. The import of
Canadian files had to be done manually because there is no such platform as EDGAR
allowing the automatic collection of data.
We built another program to count the number of tags belonging to a specific
taxonomy in an XBRL file (written in Java). This program can be used to find the
proportion of extensions in a given XBRL file, but also the total number of tags, the
number of tags belonging to the reference taxonomy, and so on.
3.3 Empirical Models
We consider that the determination of XBRL extensions and stock pricing are
closely intertwined. The possibility exists that XBRL extensions (voluntary disclosures)
are correlated with instrumental variables like analyst following, corporate governance
and earnings management. Hence, we first assess whether or not endogeneity exists
between the variables using the Hausman test. Endogeneity tests (reported in the results
section) confirm interrelations for Stock price and XBRL extensions for the model
estimated on the full sample (including matched firms). This justifies relying on
simultaneous equations.
The valuation model is inspired by the work of Feltham and Ohlson (1995) and
Amir and Lev (1996). Such a model maps a firm’s book value and earnings into its stock
market valuation. The empirical models are the following:
16
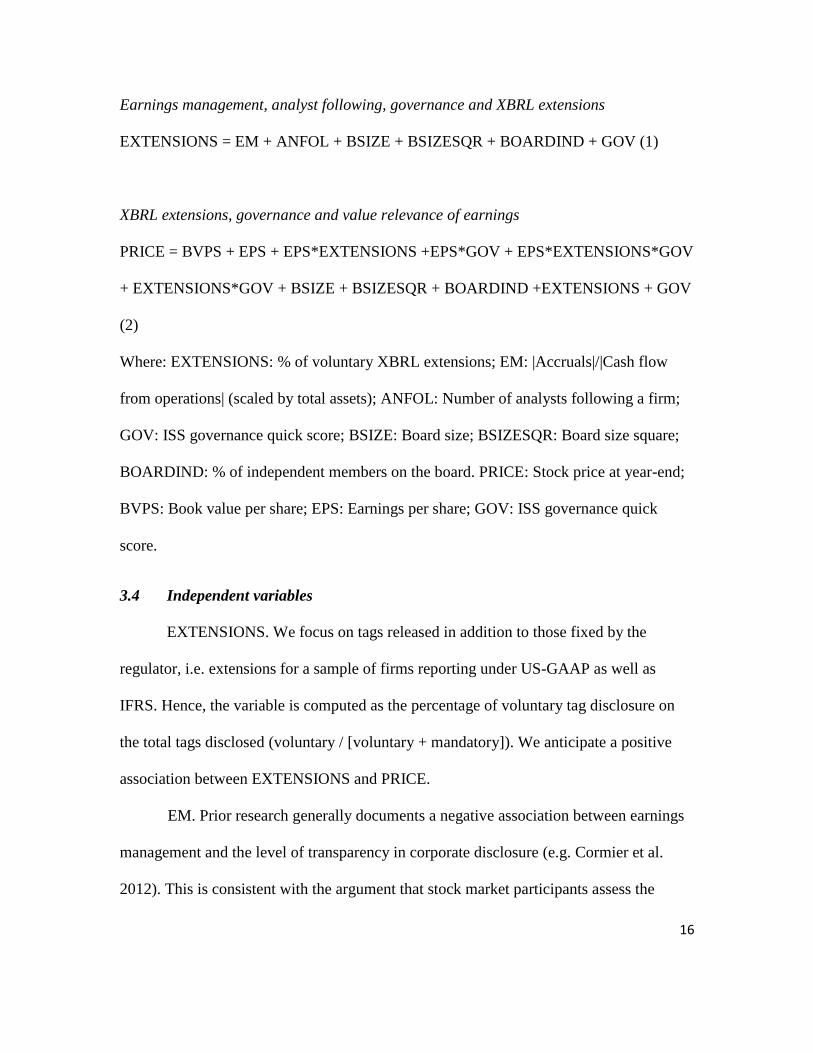
Earnings management, analyst following, governance and XBRL extensions
EXTENSIONS = EM + ANFOL + BSIZE + BSIZESQR + BOARDIND + GOV (1)
XBRL extensions, governance and value relevance of earnings
PRICE = BVPS + EPS + EPS*EXTENSIONS +EPS*GOV + EPS*EXTENSIONS*GOV
+ EXTENSIONS*GOV + BSIZE + BSIZESQR + BOARDIND +EXTENSIONS + GOV
(2)
Where: EXTENSIONS: % of voluntary XBRL extensions; EM: |Accruals|/|Cash flow
from operations| (scaled by total assets); ANFOL: Number of analysts following a firm;
GOV: ISS governance quick score; BSIZE: Board size; BSIZESQR: Board size square;
BOARDIND: % of independent members on the board. PRICE: Stock price at year-end;
BVPS: Book value per share; EPS: Earnings per share; GOV: ISS governance quick
score.
3.4 Independent variables
EXTENSIONS. We focus on tags released in addition to those fixed by the
regulator, i.e. extensions for a sample of firms reporting under US-GAAP as well as
IFRS. Hence, the variable is computed as the percentage of voluntary tag disclosure on
the total tags disclosed (voluntary / [voluntary + mandatory]). We anticipate a positive
association between EXTENSIONS and PRICE.
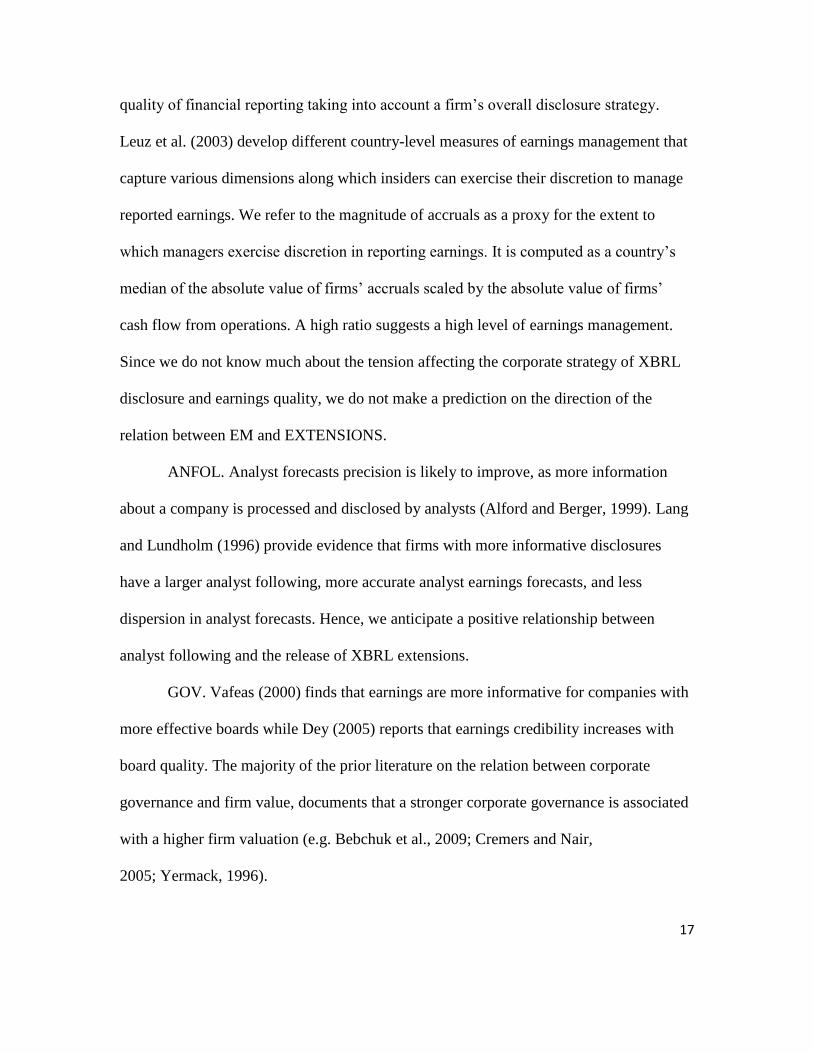
EM. Prior research generally documents a negative association between earnings
management and the level of transparency in corporate disclosure (e.g. Cormier et al.
2012). This is consistent with the argument that stock market participants assess the
17
quality of financial reporting taking into account a firm’s overall disclosure strategy.
Leuz et al. (2003) develop different country-level measures of earnings management that
capture various dimensions along which insiders can exercise their discretion to manage
reported earnings. We refer to the magnitude of accruals as a proxy for the extent to
which managers exercise discretion in reporting earnings. It is computed as a country’s
median of the absolute value of firms’ accruals scaled by the absolute value of firms’
cash flow from operations. A high ratio suggests a high level of earnings management.
Since we do not know much about the tension affecting the corporate strategy of XBRL
disclosure and earnings quality, we do not make a prediction on the direction of the
relation between EM and EXTENSIONS.
ANFOL. Analyst forecasts precision is likely to improve, as more information
about a company is processed and disclosed by analysts (Alford and Berger, 1999). Lang
and Lundholm (1996) provide evidence that firms with more informative disclosures
have a larger analyst following, more accurate analyst earnings forecasts, and less
dispersion in analyst forecasts. Hence, we anticipate a positive relationship between
analyst following and the release of XBRL extensions.
GOV. Vafeas (2000) finds that earnings are more informative for companies with
more effective boards while Dey (2005) reports that earnings credibility increases with
board quality. The majority of the prior literature on the relation between corporate
governance and firm value, documents that a stronger corporate governance is associated
with a higher firm valuation (e.g. Bebchuk et al., 2009; Cremers and Nair,
2005; Yermack, 1996).
18
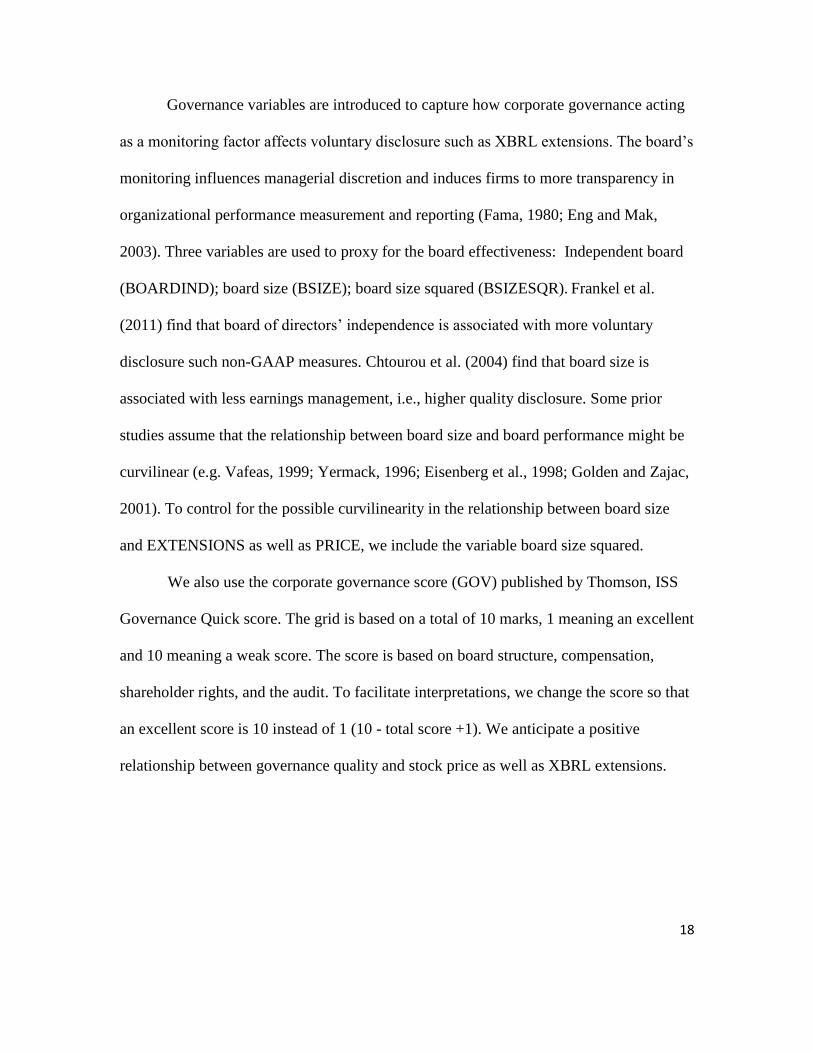
Governance variables are introduced to capture how corporate governance acting
as a monitoring factor affects voluntary disclosure such as XBRL extensions. The board’s
monitoring influences managerial discretion and induces firms to more transparency in
organizational performance measurement and reporting (Fama, 1980; Eng and Mak,
2003). Three variables are used to proxy for the board effectiveness: Independent board
(BOARDIND); board size (BSIZE); board size squared (BSIZESQR). Frankel et al.
(2011) find that board of directors’ independence is associated with more voluntary
disclosure such non-GAAP measures. Chtourou et al. (2004) find that board size is
associated with less earnings management, i.e., higher quality disclosure. Some prior
studies assume that the relationship between board size and board performance might be
curvilinear (e.g. Vafeas, 1999; Yermack, 1996; Eisenberg et al., 1998; Golden and Zajac,
2001). To control for the possible curvilinearity in the relationship between board size
and EXTENSIONS as well as PRICE, we include the variable board size squared.
We also use the corporate governance score (GOV) published by Thomson, ISS
Governance Quick score. The grid is based on a total of 10 marks, 1 meaning an excellent
and 10 meaning a weak score. The score is based on board structure, compensation,
shareholder rights, and the audit. To facilitate interpretations, we change the score so that
an excellent score is 10 instead of 1 (10 - total score +1). We anticipate a positive
relationship between governance quality and stock price as well as XBRL extensions.
19
4. Results
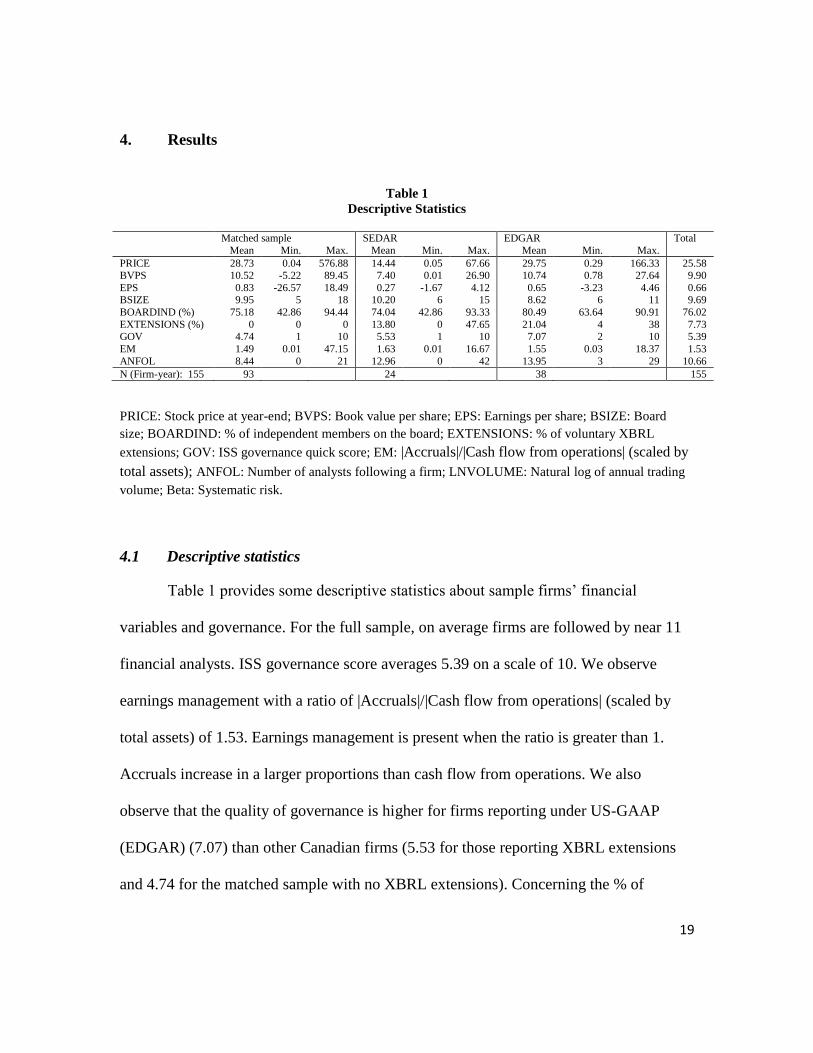
Table 1
Descriptive Statistics
Matched sample SEDAR EDGAR Total
Mean Min. Max. Mean Min. Max. Mean Min. Max.
PRICE 28.73 0.04 576.88 14.44 0.05 67.66 29.75 0.29 166.33 25.58 BVPS 10.52 -5.22 89.45 7.40 0.01 26.90 10.74 0.78 27.64 9.90
EPS 0.83 -26.57 18.49 0.27 -1.67 4.12 0.65 -3.23 4.46 0.66 BSIZE 9.95 5 18 10.20 6 15 8.62 6 11 9.69
BOARDIND (%) 75.18 42.86 94.44 74.04 42.86 93.33 80.49 63.64 90.91 76.02
EXTENSIONS (%) 0 0 0 13.80 0 47.65 21.04 4 38 7.73 GOV 4.74 1 10 5.53 1 10 7.07 2 10 5.39
EM 1.49 0.01 47.15 1.63 0.01 16.67 1.55 0.03 18.37 1.53
ANFOL 8.44 0 21 12.96 0 42 13.95 3 29 10.66
N (Firm-year): 155 93 24 38 155
PRICE: Stock price at year-end; BVPS: Book value per share; EPS: Earnings per share; BSIZE: Board
size; BOARDIND: % of independent members on the board; EXTENSIONS: % of voluntary XBRL
extensions; GOV: ISS governance quick score; EM: |Accruals|/|Cash flow from operations| (scaled by
total assets); ANFOL: Number of analysts following a firm; LNVOLUME: Natural log of annual trading
volume; Beta: Systematic risk.
4.1 Descriptive statistics
Table 1 provides some descriptive statistics about sample firms’ financial
variables and governance. For the full sample, on average firms are followed by near 11
financial analysts. ISS governance score averages 5.39 on a scale of 10. We observe
earnings management with a ratio of |Accruals|/|Cash flow from operations| (scaled by
total assets) of 1.53. Earnings management is present when the ratio is greater than 1.
Accruals increase in a larger proportions than cash flow from operations. We also
observe that the quality of governance is higher for firms reporting under US-GAAP
(EDGAR) (7.07) than other Canadian firms (5.53 for those reporting XBRL extensions
and 4.74 for the matched sample with no XBRL extensions). Concerning the % of
20
voluntary XBRL extensions, there is a large difference between firms reporting under
US-GAAP (21.04%) versus those reporting under IFRS (13.80%). Finally, overall,
except for % of extensions, and governance, there are no major differences in the mean
variables between sub-samples.
4.2 Multivariate analyses
Given that a firm’s information dynamics may affect XBRL disclosure and stock
market value simultaneously, we first assess whether or not interactions exist between
these variables using Hausman tests (residuals of XBRL extension model – equation 1 -
added to the Price model - equation 2). Based on this procedure, the null hypothesis of no
endogeneity is rejected with respect to PRICE and EXTENSIONS for the model with a
sample of 155 observations (t=2.72; p > 0.007), but not for the model restricted to
observations with extension (t = 0.40; p > 0.423). Moreover, focusing on firms that report
XBRL extensions is likely to create a sample selection bias (Heckman, 1979). To correct
this potential bias, Heckman’s two-step procedure is used. Hence, since results show
endogeneity between stock price and extensions, we rely on a sample selection model
with endogeneity treatment effect.
We rely on a two-step sample selection model for the sample involving 155
observations (full sample) and on OLS estimation for the model including 62
observations (restricted sample).
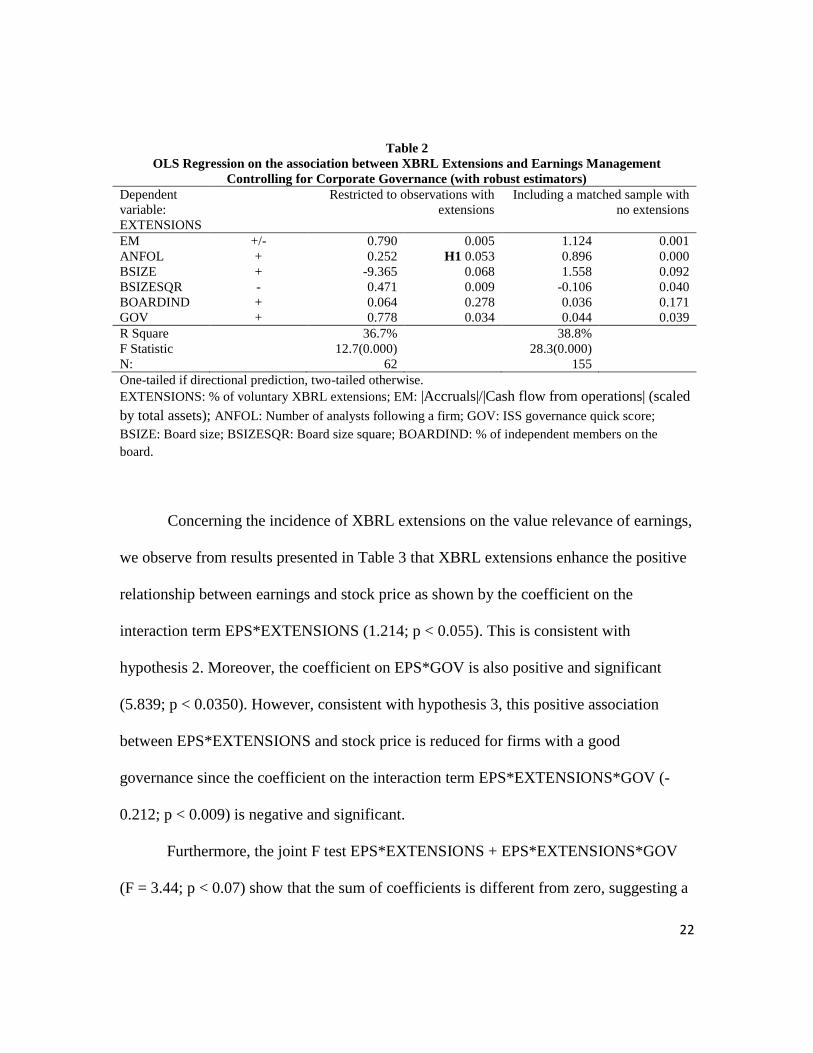
Results presented in Table 2, for the restricted sample, show that analyst
following is positively associated with the level of XBRL extensions (0.252; p < 0.053
21
for the restricted sample and 0.896; p < 0.000 for full sample). This is consistent with
hypotheses 1. We also observe that good corporate governance is positively associated
with XBRL extensions. Finally, a positive relationship with earnings management is
observed (0.790; p < 0.005 for restricted sample and 1.124; p < 0.001 for full sample),
suggesting that XBRL extensions would strategically be related to earnings quality;
earnings quality leading to less voluntary XBRL extensions. Finally, we observe quite
similar results when using a reduced sample on firms reporting extensions versus the full
sample including a matched sample with no extensions.
For the full sample, since the dependent variable (EXTENSION) is censored with
many observations at zero, an analysis using TOBIT may provide a powerful
specification check. The TOBIT specification assumes that an unobserved latent variable
index determines the level of the dependent variable so that observed values of
environmental disclosure scores are censored at zero whenever the latent variable index
plus the disturbance term is negative (for an illustration, see Yermack, 1995). Results (not
tabulated) remain similar to those reported in Table 2.
22
Table 2
OLS Regression on the association between XBRL Extensions and Earnings Management
Controlling for Corporate Governance (with robust estimators)
Dependent
variable:
EXTENSIONS
Restricted to observations with
extensions
Including a matched sample with
no extensions
EM +/- 0.790 0.005 1.124 0.001
ANFOL + 0.252 H1 0.053 0.896 0.000
BSIZE + -9.365 0.068 1.558 0.092
BSIZESQR - 0.471 0.009 -0.106 0.040
BOARDIND + 0.064 0.278 0.036 0.171
GOV + 0.778 0.034 0.044 0.039
R Square
F Statistic
N:
36.7%
12.7(0.000)
62
38.8%
28.3(0.000)
155
One-tailed if directional prediction, two-tailed otherwise.
EXTENSIONS: % of voluntary XBRL extensions; EM: |Accruals|/|Cash flow from operations| (scaled
by total assets); ANFOL: Number of analysts following a firm; GOV: ISS governance quick score;
BSIZE: Board size; BSIZESQR: Board size square; BOARDIND: % of independent members on the
board.
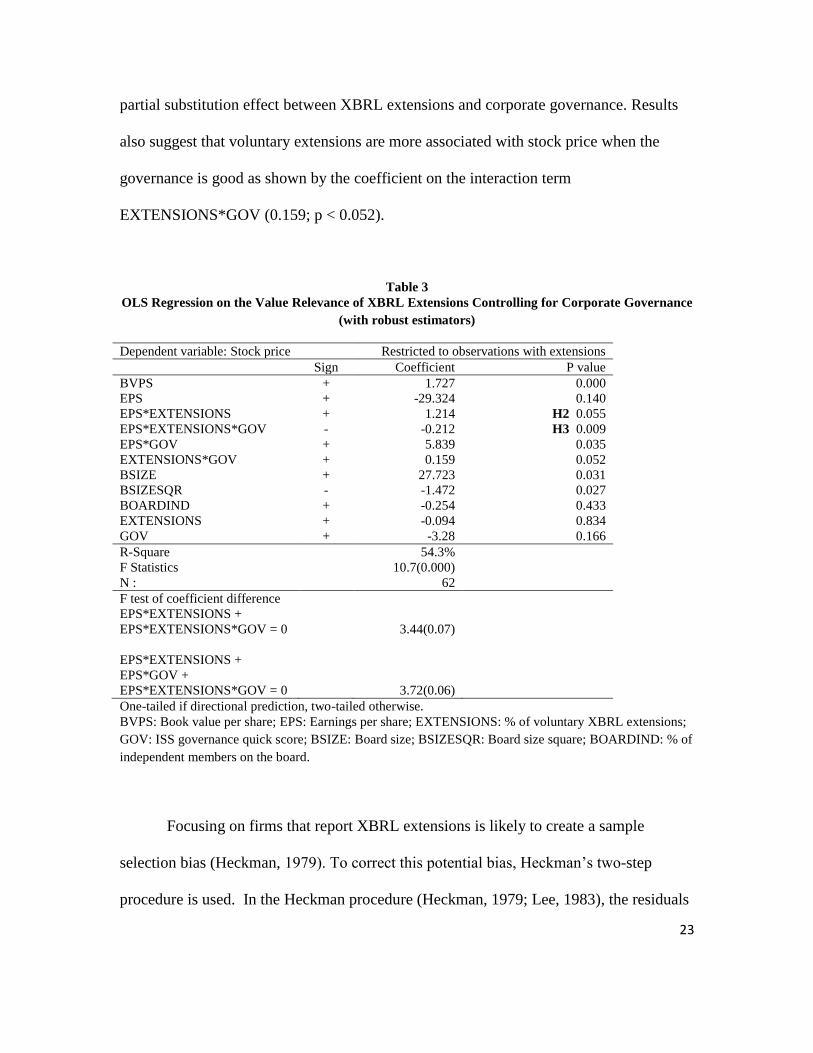
Concerning the incidence of XBRL extensions on the value relevance of earnings,
we observe from results presented in Table 3 that XBRL extensions enhance the positive
relationship between earnings and stock price as shown by the coefficient on the
interaction term EPS*EXTENSIONS (1.214; p < 0.055). This is consistent with
hypothesis 2. Moreover, the coefficient on EPS*GOV is also positive and significant
(5.839; p < 0.0350). However, consistent with hypothesis 3, this positive association
between EPS*EXTENSIONS and stock price is reduced for firms with a good
governance since the coefficient on the interaction term EPS*EXTENSIONS*GOV (-
0.212; p < 0.009) is negative and significant.
Furthermore, the joint F test EPS*EXTENSIONS + EPS*EXTENSIONS*GOV
(F = 3.44; p < 0.07) show that the sum of coefficients is different from zero, suggesting a
23
partial substitution effect between XBRL extensions and corporate governance. Results
also suggest that voluntary extensions are more associated with stock price when the
governance is good as shown by the coefficient on the interaction term
EXTENSIONS*GOV (0.159; p < 0.052).
Table 3
OLS Regression on the Value Relevance of XBRL Extensions Controlling for Corporate Governance
(with robust estimators)
Dependent variable: Stock price Restricted to observations with extensions
Sign Coefficient P value
BVPS + 1.727 0.000
EPS + -29.324 0.140
EPS*EXTENSIONS + 1.214 H2 0.055
EPS*EXTENSIONS*GOV - -0.212 H3 0.009
EPS*GOV + 5.839 0.035
EXTENSIONS*GOV + 0.159 0.052
BSIZE + 27.723 0.031
BSIZESQR - -1.472 0.027
BOARDIND + -0.254 0.433
EXTENSIONS + -0.094 0.834
GOV + -3.28 0.166
R-Square
F Statistics
N :
54.3%
10.7(0.000)
62
F test of coefficient difference
EPS*EXTENSIONS +
EPS*EXTENSIONS*GOV = 0
EPS*EXTENSIONS +
EPS*GOV +
EPS*EXTENSIONS*GOV = 0
3.44(0.07)
3.72(0.06)
One-tailed if directional prediction, two-tailed otherwise.
BVPS: Book value per share; EPS: Earnings per share; EXTENSIONS: % of voluntary XBRL extensions;
GOV: ISS governance quick score; BSIZE: Board size; BSIZESQR: Board size square; BOARDIND: % of
independent members on the board.
Focusing on firms that report XBRL extensions is likely to create a sample
selection bias (Heckman, 1979). To correct this potential bias, Heckman’s two-step
procedure is used. In the Heckman procedure (Heckman, 1979; Lee, 1983), the residuals
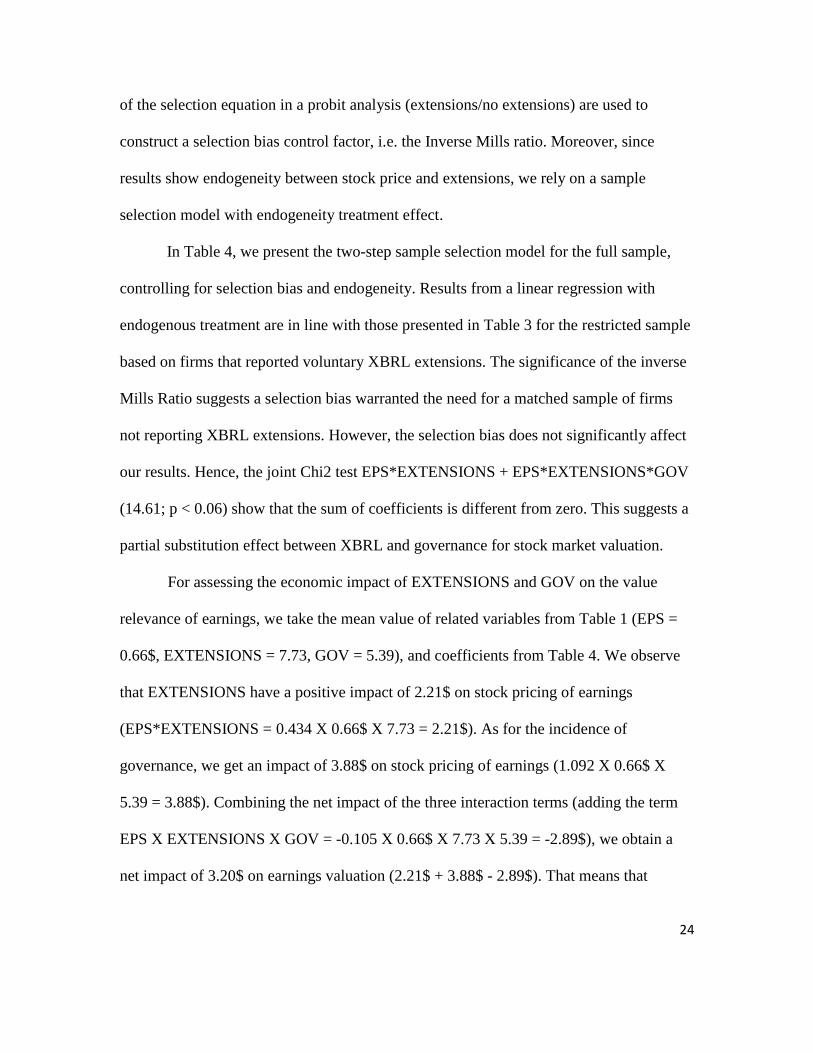
24
of the selection equation in a probit analysis (extensions/no extensions) are used to
construct a selection bias control factor, i.e. the Inverse Mills ratio. Moreover, since
results show endogeneity between stock price and extensions, we rely on a sample
selection model with endogeneity treatment effect.
In Table 4, we present the two-step sample selection model for the full sample,
controlling for selection bias and endogeneity. Results from a linear regression with
endogenous treatment are in line with those presented in Table 3 for the restricted sample
based on firms that reported voluntary XBRL extensions. The significance of the inverse
Mills Ratio suggests a selection bias warranted the need for a matched sample of firms
not reporting XBRL extensions. However, the selection bias does not significantly affect
our results. Hence, the joint Chi2 test EPS*EXTENSIONS + EPS*EXTENSIONS*GOV
(14.61; p < 0.06) show that the sum of coefficients is different from zero. This suggests a
partial substitution effect between XBRL and governance for stock market valuation.
For assessing the economic impact of EXTENSIONS and GOV on the value
relevance of earnings, we take the mean value of related variables from Table 1 (EPS =
0.66$, EXTENSIONS = 7.73, GOV = 5.39), and coefficients from Table 4. We observe
that EXTENSIONS have a positive impact of 2.21$ on stock pricing of earnings
(EPS*EXTENSIONS = 0.434 X 0.66$ X 7.73 = 2.21$). As for the incidence of
governance, we get an impact of 3.88$ on stock pricing of earnings (1.092 X 0.66$ X
5.39 = 3.88$). Combining the net impact of the three interaction terms (adding the term
EPS X EXTENSIONS X GOV = -0.105 X 0.66$ X 7.73 X 5.39 = -2.89$), we obtain a
net impact of 3.20$ on earnings valuation (2.21$ + 3.88$ - 2.89$). That means that
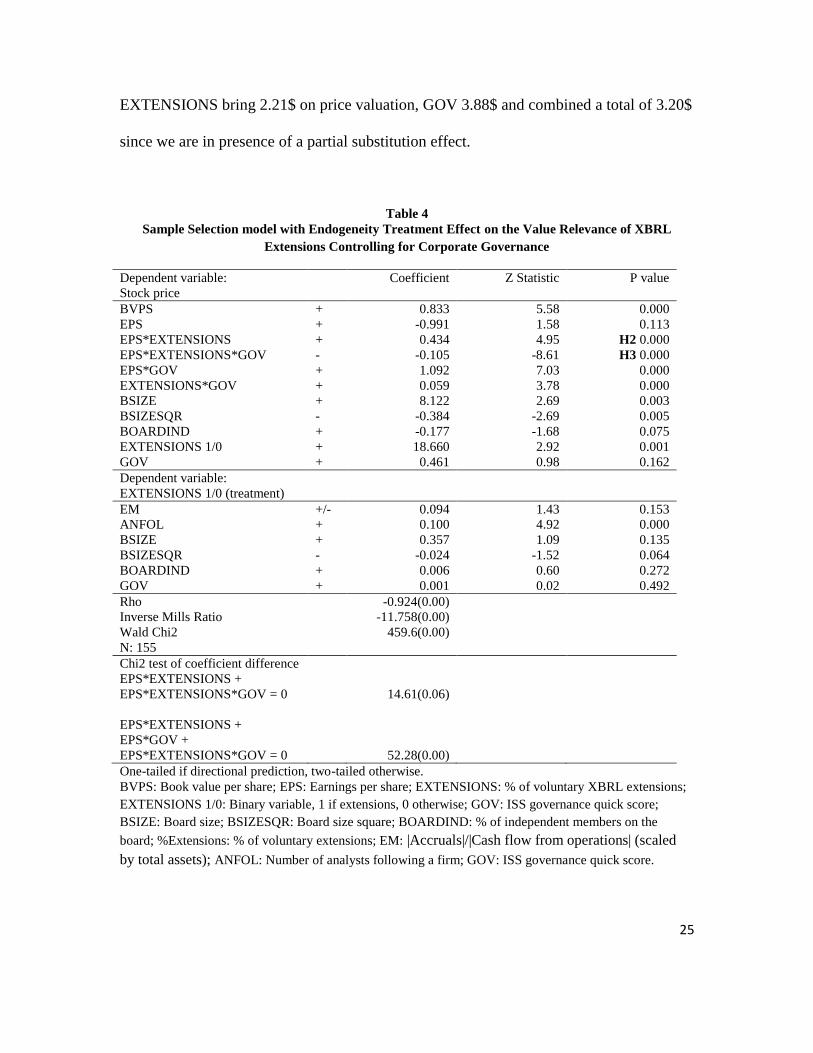
25
EXTENSIONS bring 2.21$ on price valuation, GOV 3.88$ and combined a total of 3.20$
since we are in presence of a partial substitution effect.
Table 4
Sample Selection model with Endogeneity Treatment Effect on the Value Relevance of XBRL
Extensions Controlling for Corporate Governance
Dependent variable:
Stock price
Coefficient Z Statistic P value
BVPS + 0.833 5.58 0.000
EPS + -0.991 1.58 0.113
EPS*EXTENSIONS + 0.434 4.95 H2 0.000
EPS*EXTENSIONS*GOV - -0.105 -8.61 H3 0.000
EPS*GOV + 1.092 7.03 0.000
EXTENSIONS*GOV + 0.059 3.78 0.000
BSIZE + 8.122 2.69 0.003
BSIZESQR - -0.384 -2.69 0.005
BOARDIND + -0.177 -1.68 0.075
EXTENSIONS 1/0 + 18.660 2.92 0.001
GOV + 0.461 0.98 0.162
Dependent variable:
EXTENSIONS 1/0 (treatment)
EM +/- 0.094 1.43 0.153
ANFOL + 0.100 4.92 0.000
BSIZE + 0.357 1.09 0.135
BSIZESQR - -0.024 -1.52 0.064
BOARDIND + 0.006 0.60 0.272
GOV + 0.001 0.02 0.492
Rho
Inverse Mills Ratio
Wald Chi2
N: 155
-0.924(0.00)
-11.758(0.00)
459.6(0.00)
Chi2 test of coefficient difference
EPS*EXTENSIONS +
EPS*EXTENSIONS*GOV = 0
EPS*EXTENSIONS +
EPS*GOV +
EPS*EXTENSIONS*GOV = 0
14.61(0.06)
52.28(0.00)
One-tailed if directional prediction, two-tailed otherwise.
BVPS: Book value per share; EPS: Earnings per share; EXTENSIONS: % of voluntary XBRL extensions;
EXTENSIONS 1/0: Binary variable, 1 if extensions, 0 otherwise; GOV: ISS governance quick score;
BSIZE: Board size; BSIZESQR: Board size square; BOARDIND: % of independent members on the
board; %Extensions: % of voluntary extensions; EM: |Accruals|/|Cash flow from operations| (scaled
by total assets); ANFOL: Number of analysts following a firm; GOV: ISS governance quick score.
26
Finally, results (not tabulated) show a positive correlation between
EXTENSIONS and trading volume (p < 0.06) and a negative relationship with bid-ask
spread (p < 0.014). This suggests that voluntary disclosure of XBRL information reduces
information asymmetry in the market place.
5. Conclusion
Adopted by the SEC and by IFRS Foundation, XBRL language has become a
universal format to exchange financial data. It promotes the harmonization of
international reporting standards and it is implemented in more than 60 countries around
the world. The taxonomies fixed by the regulator (SEC or IFRS Foundation) provide
identifying tags which are computer readable. This language can extract both financial
and corporate governance indicators used in financial statements. Thereby, investors and
financial analysts can receive and analyze data rapidly and efficiently because computers
recognize instantly the information in an XBRL document.
Research on XBRL impact on financial reporting are numerous and show a
significant effect on transparency and reliability of information produced for market
participants. However, these studies rarely take into account the possibility of completing
the reference XBRL taxonomy by extension tags when an item cannot be properly
represented by an existing tag. This possibility of using extensions is proving to be a
crucial problem in assessing the real impact of XBRL on the quality of information
released to stock markets. In this paper we investigate the determinants and value
27
relevance of these extensions for a sample of Canadian firms reporting under US-GAAP
as well as IFRS.
While the great majority of prior research consider XBRL implementation as a
uniform process (adoption or not), our research investigate the nature and the importance
of taxonomy’s extensions and argue that this practice is an element of a voluntary
disclosure strategy. We document how voluntary disclosures in XBRL format affect the
value relevance of GAAP earnings considering the quality of corporate governance.
We use a valuation model to test the empirical relationships between, on the one
hand, earnings management, analyst following, governance and XBRL extensions; and,
on the other hand, XBRL extensions, governance and value relevance of earnings.
We observe earnings management practice since accruals increase in larger
proportions than cash flow from operations. The quality of governance is higher for firms
reporting under US-GAAP than other Canadian firms for those reporting XBRL
extensions. Concerning the percentage of voluntary XBRL extensions, there is a large
difference between firms reporting under US-GAAP versus those reporting under IFRS.
We find that analyst following is positively associated with the level of XBRL
extensions. We also observe that good corporate governance is positively associated with
XBRL extensions. A positive relationship with earnings management is observed
suggesting that XBRL extensions would strategically be related to earnings quality;
earnings quality leading to voluntary XBRL extensions.
Concerning the incidence of XBRL extensions on the value relevance of earnings,
we observe that XBRL extensions enhance the positive relationship between earnings and
28
stock price but this positive association is reduced for firms with a good governance,
suggesting a substitution effect between XBRL extensions and corporate governance.
Finally, findings also show that XBRL extensions attract financial analysts.
Our study is subject to some limitations, which may also warrant further research.
First, within the context of this study, all XBRL extensions are viewed as equivalent in
terms of their impact on stock market participants. Future research way attempt to
disentangle the relevance of individual extension items for market participants. Second,
we rely on a single external measure of corporate governance. However, ISS Governance
Quick Score published by Thomson has been widely used in prior research. Finally, the
sample size could be an issue and prevent us to make generalization of our results.
However, sample firms represent a significant portion of market capitalization in Canada.
This makes us somewhat confident about the relevance of our results.
Prior research documents that institutional characteristics affect the information
environment across countries, thus potentially influencing analysts’ costs and benefits
from collecting and processing corporate information. This research highlights the
importance to consider XBRL extensions’ practices and corporate governance when
assessing the relevance of XBRL disclosures for stock market participants. Future
research can fruitfully explore the interface between a firm’s governance and XBRL
extensions in other regulatory contexts, allowing learning more about the importance to
control for such contexts if one wants XBRL disclosures to permit comparability of
financial statement information among different jurisdictions.
29
References
Alford, A.W., Berger, P.G. (1999). A Simultaneous Equations Analysis of Forecast
Accuracy, Analyst Following, and Trading Volume. Journal of Accounting, Auditing
and Finance, 14(3), 219-40.
Alles, M., Piechocki, M. (2012). Will XBRL Improve Corporate Governance? A
Framework for Enhancing Governance Decision Making Using Interactive Data,
International Journal of Accounting Information Systems, 13(2), 91–108.
Amir, E., Lev, B. (1996). Value-Relevance of Non-Financial Information: The Wireless
Communication Industry. Journal of Accounting and Economics, 22 (1-3), 3-30.
Athanasakou, V., Olsson, P. (2012). Earnings Quality, Corporate Governance, and
Earnings Quality. Unpublished working paper.
http://fisher.osu.edu/supplements/10/12906/presentationpaper_Olsson_9-5-12.pdf
Baldwin, A.A., Trinkle B.S. (2011). The impact of XBRL: A Delphi investigation. The
International Journal of Digital Accounting Research, 11, 1–24.
Bebchuk, L., Cohen, A., Ferrell, A. (2009).What Matters in Corporate Governance?.
Review of Financial Studies, 22(2), 783–827.
Blankespoor, E., Miller B.P., White H.D. (2014). Initial Evidence on the Market Impact
of the XBRL Mandate, Review of Accounting Studies, 19(4), 1468–1503.
Boritz, J.E. No, W.G. (2009). Assurance on XBRL-Related Documents: The case of
United Technologies Corporation. Journal of Information Systems, 23(2), 49–78.
Bowen, R.M., Rajgopal, S., Venkatachalam, M. (2008). Accounting Discretion,
Corporate Governance and Firm Performance. Contemporary Accounting Research,
25(2), 310–405.
30
Bushman, R., Chen, Q., Engel, E., Smith, A. (2004). Financial Accounting Information,
Organizational Complexity and Corporate Governance Systems. Journal of
Accounting and Economics, 37 (2), 167–201.
Chen, Y.C. (2012). A Comparative Study of e-Government XBRL Implementations: The
Potential of Improving Information Transparency and Efficiency. Government
Information Quarterly, 29(4), 553–563.
Chen, H., Li, F., (2013). Analysis the Impact of XBRL in China’s Capital Market Using
Methods of Empirical Research. Research Journal of Applied Sciences, Engineering
and Technology 5(5), 1521–1527.
Chen S., Harris, L., Li, W., Wu, D. (2015). How Does XBRL Affect the Cost of Equity
Capital? Evidence from an Emerging Market, Journal of International Accounting
Research, American Accounting Association, 14(2), 123–145.
Chtourou, S., Bédard, J., Courteau, L. (2004). The Effect of Audit Committee Expertise,
Independence and Activity on Aggressive Earnings Management. Auditing: A
Journal of Practice and Theory, 23(2), 13-35.
Cong, Y., Hao, J., Zou, L. (2014). The Impact of XBRL on Market Efficiency, Journal of
Information Systems, 28-2, 181-207.
Cormier, D., Ledoux, M.J., Magnan, M. (2012). The Moderating Effect of Voluntary
Disclosure on the Relation between Earnings Quality and Information Asymmetry:
some Canadian evidence. International Journal of Accounting, Auditing and
Performance Evaluation, 8(2), 157-183.
31
Cormier, D., Magnan, M. (2014). The Impact of Social Responsibility Disclosure and
Governance on Financial Analysts’ Information Environment. Corporate
Governance, 14(4), 467-484.
Craighead, J., Magnan, M., Thorne, L. (2004). The Impact of Mandated Disclosure on
Performance-Based CEO Compensation. Contemporary Accounting Research, 21(2),
1-30.
Cremers, M., Nair, V.B. (2005). Governance Mechanisms and Equity Prices. Journal of
Finance, 60(6), 2859–2894.
Debreceny, R., Chandra, A., Cheh, J.J., Guitheus-Amrhein, D., Hannon, N.J., Hutchison,
P.D. (2005). Financial Reporting in XBRL on the SEC's EDGAR System: A Critique
and Evaluation. Journal of Information Systems, 19(2), 191–210.
Debreceny, R., Farewell, S., Piechocki, M., Felden, C., Graning, A. (2010). Does it Add
Up? Early Evidence on the Data Quality of XBRL Filings to the SEC. Journal of
Accounting and Public Policy, 29(3), 296–306.
Debreceny, R., Gray, G.L. (2001). The Production and Use of Semantically Rich
Accounting Reports on the Internet: XML and XBRL. International Journal of
Accounting Information Systems, 2(1), 47-74
Dey, A. (2005). Corporate Governance and Financial Reporting Credibility. Phd,
Illinois, North Western University.
32
Efendi, J., Park J.D., Murphy Smith, L. (2014). Do XBRL Filings Enhance Informational
Efficiency? Early Evidence from Post-Earnings Announcement Drift. Journal of
Business Research, 67(6), 1099–1105.
Eng, L.L., Mak, Y.T. (2003). Corporate Governance and Voluntary Disclosure. Journal
of Accounting and Public Policy, 22(4), 325-345.
Eisenberg, T., Sundgren, S., Wells, M.T. (1998). Larger Board Size and Decreasing Firm
Value in Small Firms. Journal of Financial Economics, 48(1), 35–54.
Fama, E.F. (1980). Agency Problems and the Theory of the Firm. Journal of Political
Economy, 88(2), 288-307.
Feltham, G., Ohlson, J. (1995). Valuation and Clean Surplus Accounting for Operating
and Financial Activities. Contemporary Accounting Research, 11(2), 689-731.
Frankel, R., McVay, S., Soliman, M. (2011). Non-GAAP Earnings and Board
Independence. Review of Accounting Studies, 16(4), 719–744.
Golden, B.R., Zajac, E.J. (2001). When Will Boards Influence Strategy? Inclination X
Power = Strategic Change. Strategic Management Journal, 22(12), 1087–1117.
Gräning, A., Felden, C., Piechocki, M. (2011). Status Quo and Potential of XBRL for
Business and Information Systems Engineering. Business & Information Systems
Engineering, 3(4), 231-239.
Henselmann K., Ditter, D., Scherr, E., Alexander F. (2015). Irregularities in Accounting
Numbers and Earnings Management- A Novel Approach Based on SEC XBRL
Filings. Journal of Emerging Technologies in Accounting, 12(1), 117–151.
33
Healy, P.M., Palepu, K.G. (2001). Information Asymmetry, Corporate Disclosure, and
the Capital Markets: A Review of the Empirical Disclosure Literature. Journal of
Accounting and Economics, 31(1), 405-440.
Heckman, J.J. (1979). Sample Selection Bias as a Specification Error. Econometrica,
47(1), 153-162.
Holthausen R., Larcker, D., Sloan, R. (1995). Annual Bonus Schemes and the
Manipulation of Earnings. Journal of Accounting and Economics, 19(1), 29–74.
IFRS Foundation, International Acounting Standards Board, (2015). Using the IFRS
Taxonomy, A Regulator’s Guide, 1-32.
Kim, J. W., Lim, J. H., No, W.G. (2012). The Effect of First Wave Mandatory XBRL
Reporting Across the Financial Information Environment. Journal of Information
Systems, 26(1), 127–153.
Kim, J.-B., Kim, J.W., Lim, H. (2013). Does XBRL Adoption Constrain Managerial
Opportunism in Financial Reporting? Evidence from Mandated U.S. Filers. Working
paper, City University of Hong Kong, Nova Southeastern University and University
of Waterloo.
Klein, A. (2002). Audit Committee, Board of Director Characteristics, and Earnings
Management. Journal of Accounting and Economics, 33(3), 375–400.
Lang, M., Lundholm, R. (1996). Corporate Disclosure Policy and Analyst Behavior. The
Accounting Review, 71(4), 467–492.
34
Larcker D., Richardson, S., Tuna, I. (2007). Corporate Governance, Accounting
Outcomes, and Organizational Performance. The Accounting Review, 82(4), 963–
1008.
Lee, L.F. (1983). Generalized Econometric Models with Selectivity. Econometrica,
51(2), 507-513.
Leuz, C., Nanda, D., Wysocki, P.D. (2003). Earnings Management and Investor
Protection: An International Comparison. Journal of Financial Economics, 69(3),
505-527.
Li, C.K., Liang, D., Lin, F., Chen, K.L. (2015). The Application of Corporate
Governance Indicators with XBRL Technology to Financial Crisis Prediction,
Emerging Markets Finance & Trade, 51(1), 58–72.
Li, S., Nwaeze, E.T. (2015). The Association between Extensions in XBRL Disclosures
and Financial Information Environment, Journal of Information Systems, American
Accounting Association, 29(3), 73–99.
Liu, C., Luo X.R., Sia, C.L., O'Farrell, G., Teo, H.H. (2014). The Impact of XBRL
Adoption in PR China. Decision Support Systems, 59, 242–249.
Liu, C., Wang, T., Yao, L.J. (2014) XBRL’s Impact on Analyst Forecast Behavior: An
Empirical study, Journal of Accounting and Public Policy, 33(1), 69–82.
Perdana, A., Robb, A., Rohde, F. (2015). An Integrative Review and Synthesis of XBRL
Research in Academic Journals. Journal of Information Systems, American
Accounting Association, 29(1), 115-153.
35
Premuroso, R. F., Bhattacharya, S. (2008). Do Early and Voluntary Filers of Financial
Information in XBRL Format Signal Superior Corporate Governance and Operating
Performance?. International Journal of Accounting Information Systems, 9(1), 1–20.
Securities and Exchange Commission (SEC). (2009). Interactive Data to Improve
Financial Reporting, https://www.sec.gov/rules/final/2009/33-9002.pdf
Vafeas, N. (2000). Board Structure and the Informativeness of Earnings. Journal of
Accounting and Public Policy, 19(2), 139-160.
Wang, T., Seng, J.L. (2014). Mandatory Adoption of XBRL and Foreign Institutional
Investors’ Holdings: Evidence from China. Journal of Information Systems, 28(2),
127–147.
Yen J.C., Wang, T. (2015). The Association between XBRL Adoption and Market
Reactions to Earnings Surprises. Journal of Information Systems, American
Accounting Association, 29(3), 51–71.
Yermack, D. (1996). Higher Market Valuation for Firms with a Small Board of Directors.
Journal of Financial Economics, 40(2), 185–211.
Yoon, H., Zo, H., Ciganek A.P. (2011). Does XBRL adoption reduce information
asymmetry?. Journal of Business Research, 64(2), 157–163.
36
Appendix: Technical aspects of XBRL
1.0 Definitions
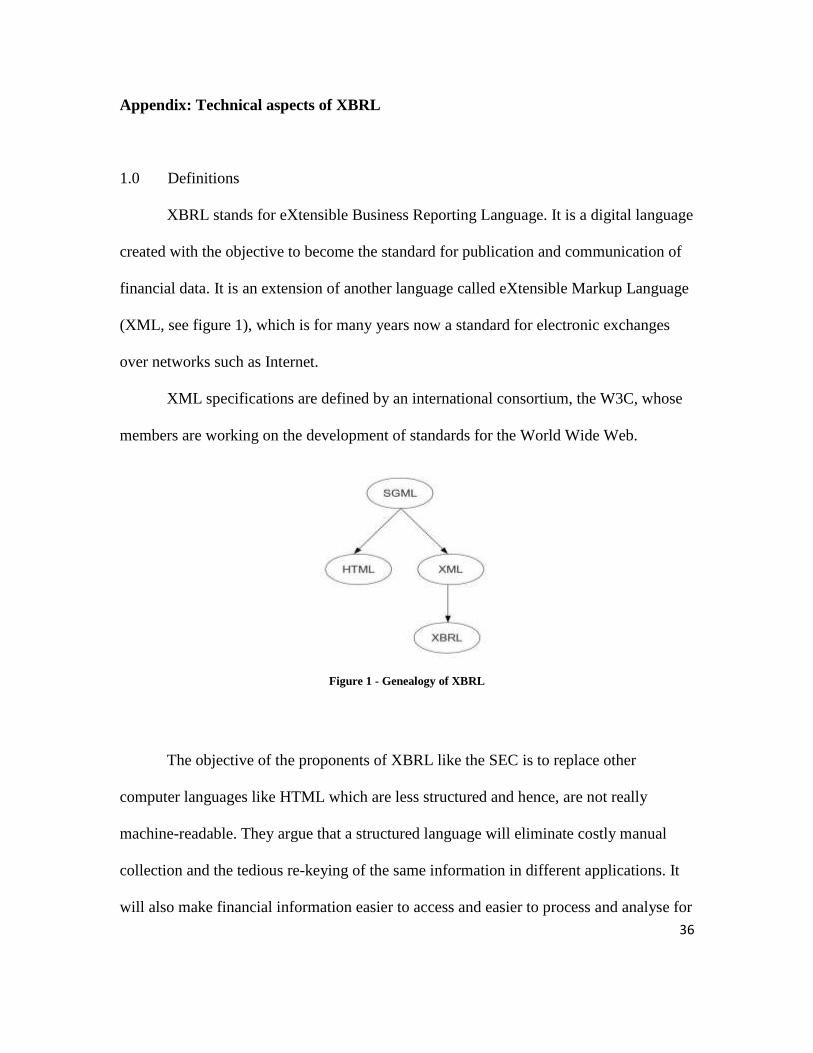
XBRL stands for eXtensible Business Reporting Language. It is a digital language
created with the objective to become the standard for publication and communication of
financial data. It is an extension of another language called eXtensible Markup Language
(XML, see figure 1), which is for many years now a standard for electronic exchanges
over networks such as Internet.
XML specifications are defined by an international consortium, the W3C, whose
members are working on the development of standards for the World Wide Web.
Figure 1 - Genealogy of XBRL
The objective of the proponents of XBRL like the SEC is to replace other
computer languages like HTML which are less structured and hence, are not really
machine-readable. They argue that a structured language will eliminate costly manual
collection and the tedious re-keying of the same information in different applications. It
will also make financial information easier to access and easier to process and analyse for
37
investors, a standardized information platform being easier to compare across different
businesses.
As an extension of XML, XBRL inherits some of its main characteristics. First, it
is an open standard, everyone can use it freely without any restriction, and the entire
specifications of the language are publicly available. Second, the standard is platform
independent, meaning that XBRL data can be created and read on any kind of device,
running on any operating system and with any compatible software. It also means that
the data does not need to be converted when it moves from one application to another.
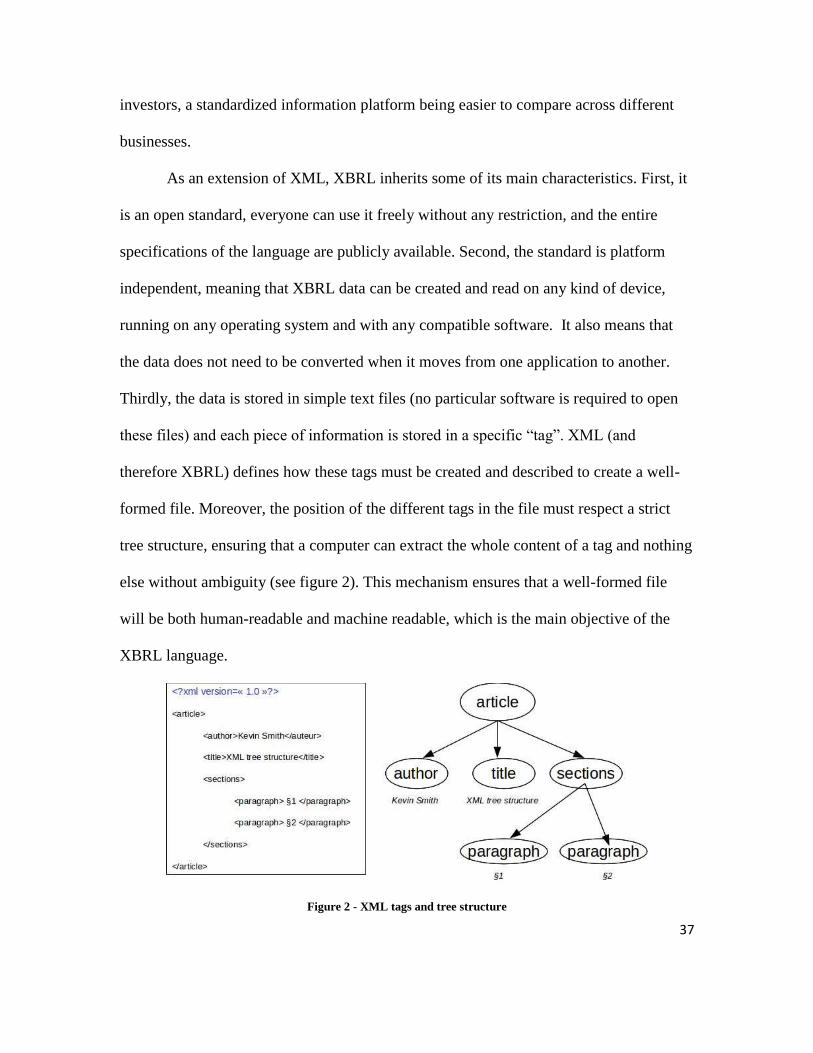
Thirdly, the data is stored in simple text files (no particular software is required to open
these files) and each piece of information is stored in a specific “tag”. XML (and
therefore XBRL) defines how these tags must be created and described to create a well-
formed file. Moreover, the position of the different tags in the file must respect a strict
tree structure, ensuring that a computer can extract the whole content of a tag and nothing
else without ambiguity (see figure 2). This mechanism ensures that a well-formed file
will be both human-readable and machine readable, which is the main objective of the
XBRL language.
Figure 2 - XML tags and tree structure
38
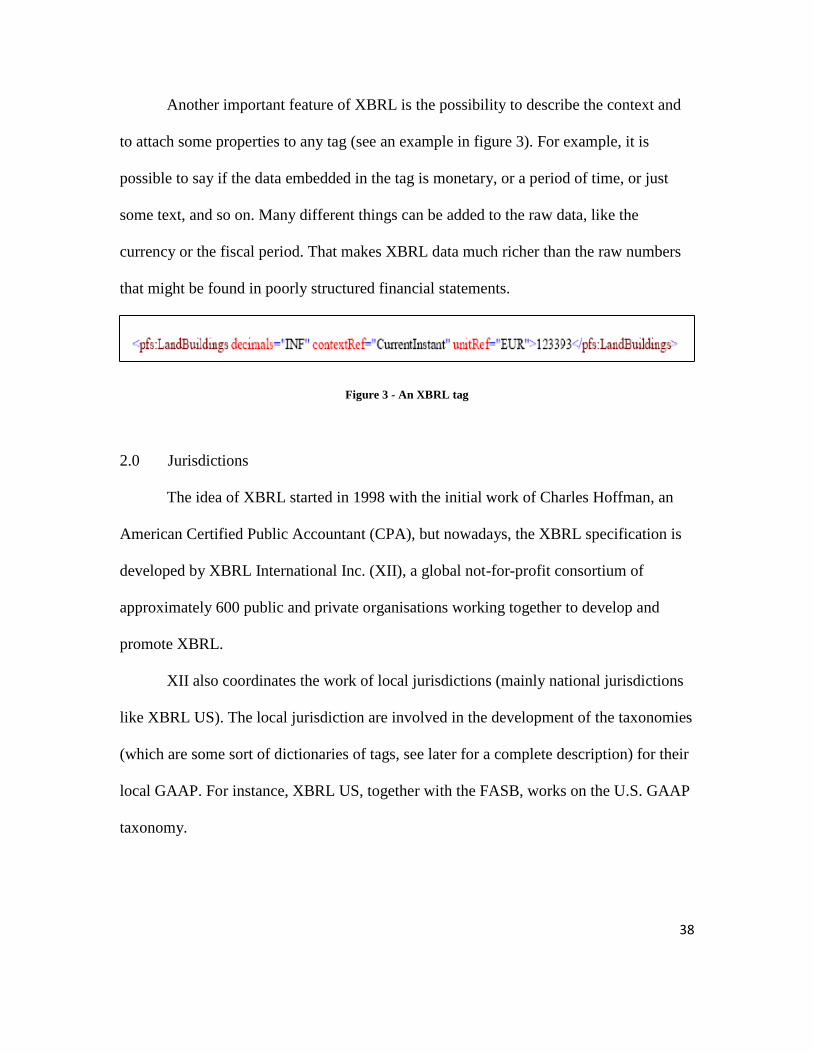
Another important feature of XBRL is the possibility to describe the context and
to attach some properties to any tag (see an example in figure 3). For example, it is
possible to say if the data embedded in the tag is monetary, or a period of time, or just
some text, and so on. Many different things can be added to the raw data, like the
currency or the fiscal period. That makes XBRL data much richer than the raw numbers
that might be found in poorly structured financial statements.
Figure 3 - An XBRL tag
2.0 Jurisdictions
The idea of XBRL started in 1998 with the initial work of Charles Hoffman, an
American Certified Public Accountant (CPA), but nowadays, the XBRL specification is
developed by XBRL International Inc. (XII), a global not-for-profit consortium of
approximately 600 public and private organisations working together to develop and
promote XBRL.
XII also coordinates the work of local jurisdictions (mainly national jurisdictions
like XBRL US). The local jurisdiction are involved in the development of the taxonomies
(which are some sort of dictionaries of tags, see later for a complete description) for their
local GAAP. For instance, XBRL US, together with the FASB, works on the U.S. GAAP
taxonomy.
39
3.0 Instance and taxonomies
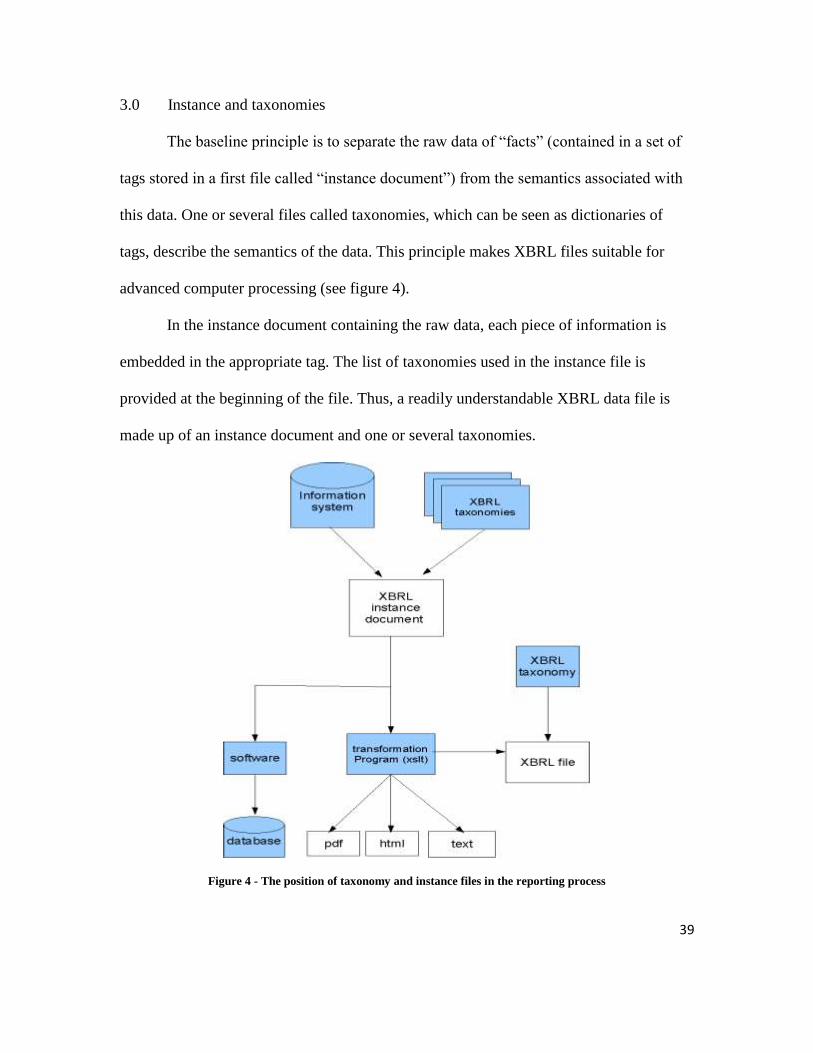
The baseline principle is to separate the raw data of “facts” (contained in a set of
tags stored in a first file called “instance document”) from the semantics associated with
this data. One or several files called taxonomies, which can be seen as dictionaries of
tags, describe the semantics of the data. This principle makes XBRL files suitable for
advanced computer processing (see figure 4).
In the instance document containing the raw data, each piece of information is
embedded in the appropriate tag. The list of taxonomies used in the instance file is
provided at the beginning of the file. Thus, a readily understandable XBRL data file is
made up of an instance document and one or several taxonomies.
Figure 4 - The position of taxonomy and instance files in the reporting process
40
To be more precise, the taxonomy consists in two different things: a taxonomy
schema and a taxonomy linkbase. The taxonomy schema is a logical model that describes
financial reporting “concepts”, e.g. the description of the different items that can be found
in the reporting documents, such as Assets or Liabilities. Each concept is uniquely
declared and defined in the schema. These concepts (at least some of them) will later be
given a value in a tag inside the instance document. Linkbases define some links between
the taxonomy and other resources. These links express relationships between concepts, or
associate concepts with additional documentation. There are five types of links:
calculation, definition, presentation, label, and reference links.
4.0 Rules and calculations
Giving a clear and shared definition to reporting concepts is not the only benefit
of XBRL reporting. Another important feature is the ability to create business rules.
These rules constrain what can be reported, can be automatically checked by a computer,
avoiding the reporting of obviously incorrect data. These rules can be logical or
mathematical. For example, it is possible to create rules asserting that Assets = Liabilities
+ Equity. It is also possible to use logical rules, such as the whole-part relation. Properly
used, business rules are a powerful mean to improve the quality of data.
5.0 Extensions
When creating an XBRL file, the filer is not limited to the tags contained in the
standard U.S. GAAP taxonomy published by the FASB. This is what the X in XBRL
41
means (it stands for “eXtended”): if the filer believes that there is no tag relevant enough,
a new one can be created. A new custom taxonomy is created de facto. This is an
important feature, since regulators cannot practically create a complete and exhaustive set
of concepts for all businesses. XBRL US recommends that filers extend the base
taxonomy before tagging data in the instance document.
These new tags are called extensions. The extension rate varies greatly from one
XBRL file to another (this rate ranges between 0% and 81%). The impact of extensions is
still an open question. A filer is never required to create custom tags, and yet this practice
is relatively common. The possibility to create extensions, on the one hand, allows filers
to customize the taxonomies to suit their needs, but on the other hand it resulted in
serious challenges in terms of interoperability of XBRL data. That is, for example, the
case when the same concept have different names, or when different concepts have the
same name. These problems occur because there is no common convention to follow for
the filers extending their taxonomies.