Embed Size (px)
Citation preview

Full Terms & Conditions of access and use can be found athttps://www.tandfonline.com/action/journalInformation?journalCode=rero20
Economic Research-Ekonomska Istraživanja
ISSN: (Print) (Online) Journal homepage: https://www.tandfonline.com/loi/rero20
The impacts of institutional quality and businessenvironment on Chinese foreign direct investmentflow to African countries
Dinkneh Gebre Borojo & Jiang Yushi
To cite this article: Dinkneh Gebre Borojo & Jiang Yushi (2020) The impacts of institutional qualityand business environment on Chinese foreign direct investment flow to African countries, EconomicResearch-Ekonomska Istraživanja, 33:1, 26-45, DOI: 10.1080/1331677X.2019.1696691
To link to this article: https://doi.org/10.1080/1331677X.2019.1696691
© 2019 The Author(s). Published by InformaUK Limited, trading as Taylor & FrancisGroup
Published online: 27 Dec 2019.
Submit your article to this journal Article views: 1059
View related articles View Crossmark data
Citing articles: 2 View citing articles

The impacts of institutional quality and businessenvironment on Chinese foreign direct investmentflow to African countries
Dinkneh Gebre Borojo and Jiang Yushi
School of Economics and Management, Southwest Jiaotong University, Chengdu, China
ABSTRACTThis study examines the impacts of institutional quality and busi-ness environment on Chinese foreign direct investment (F.D.I.)flow to Africa. We derive aggregate indicators of institutionalquality and business environment using economic and govern-ance institutions, doing business, transport efficiency indicatorsconducting a principal component analysis. We employ Poissonpseudo-maximum likelihood (P.P.M.L.) procedure to estimate thegravity model of F.D.I. flow as it can solve zero-valued observa-tions and heterogeneity problems. Our findings disclose that insti-tutional quality and business environment indicators aresignificant motivators of Chinese F.D.I. flow to Africa. Our findingsare robust and similar after we account for endogeneity concernsusing an I.V. estimator. Based on our results, we conclude thatimprovement in the business environment and the institutionalquality of African countries is key to spurring Chinese F.D.I. flowto Africa.
ARTICLE HISTORYReceived 9 August 2018Accepted 4 November 2019
KEYWORDSforeign direct investment(F.D.I.) flow; businessenvironment; institutionalquality Poisson pseudo-maximum likelihood(P.P.M.L.) estimator;China; Africa
JEL CODESF35; F41
1. Introduction
Chinese engagement in African countries is not a recent phenomenon. However, theireconomic relation has experienced the fastest growth after the forum on theChina–Africa cooperation conference in Beijing in 2000. This Africa–China economictie has been mainly manifested by trade openness, Chinese foreign direct investment(F.D.I.) flow and financial assistance for African countries. Chinese F.D.I. intoAfrican countries has grown rapidly in recent years since the conference. Forexample, Chinese F.D.I. stock in sub-Saharan African countries reached nearly US$24billion in 2013, reflecting an annual growth rate of more than 50% between 2004 and2013 (Copley, Maret-Rakotondrazaka & Sy 2014).
Furthermore, Chinese F.D.I. into Africa increased dramatically in 2016, registeringa 106% jump in projects (EY Africa, 2017). This rapid growth of Chinese F.D.I. in
CONTACT Dinkneh Gebre Borojo [email protected]� 2019 The Author(s). Published by Informa UK Limited, trading as Taylor & Francis Group.This is an Open Access article distributed under the terms of the Creative Commons Attribution License (http://creativecommons.org/licenses/by/4.0/), which permits unrestricted use, distribution, and reproduction in any medium, provided the original work isproperly cited.
ECONOMIC RESEARCH-EKONOMSKA ISTRAŽIVANJA2020, VOL. 33, NO. 1, 26–45https://doi.org/10.1080/1331677X.2019.1696691

Africa is considered as one of the indicators of Africa’s development potential andinvestment appeal and also points to the mutually beneficial nature of China–Africacooperation. The interesting thing about Chinese F.D.I. is its composition. It is morediversified than the composition of other major countries that are investing in Africa.It consists 19.5% in financial services sector, 16.4% in construction sector, 15.3% inmanufacturing, and the remaining 18.2% in business and tech services, geologicalprospecting, wholesale retail, agriculture and real estate (Copley et al., 2014) and it isalso distributed in almost all African countries (Figure A1 in Appendix).
However, according to the existing empirical studies this diversified Chinese F.D.I.inflow to African countries is claimed to be driven by natural resources, infrastruc-ture sectors for export of natural resources and market size. For example, studies byAdisu, Sharkey and Okoroafo (2010) reveal that Chinese F.D.I. inflow to Africancountries is claimed to follow the state-driven strategy of giving infrastructure andtaking natural resources. In addition, a study by Cheung et al. (2011) suggests thatChina’s investment in Africa is driven by the common traditional determinants con-sidered in the literature on Chinese foreign investment to African countries. Hencemarkets and resources seeking motives and economic risk factors are significantdeterminants of China’s F.D.I. to Africa. Similarly, a study by Sanfilippo (2010)implies that Chinese F.D.I. to Africa is pushed by the need to satisfy a growinginternal demand for natural resources and good market potential to place its low-costproduction. To our knowledge, no previous research studies have examined thedomestic investment environment and institutional quality as determinants ofChinese F.D.I. to African countries.
Several pieces of empirical literature (Kapuria-Foreman, 2008; Anyanwu, 2012;Buchanan, Le and Rishi, 2012; William, Agyapong and Abass, 2013) argue that insti-tutional factors such as good governance, economic freedom, and a business-friendlyregulatory environment are the most important in investors’ decision-making arebecoming highly popular determinants of F.D.I. flow, indicating a shift from marketand resource seeking to efficiency-seeking motives to F.D.I. That is traditional F.D.I.promoters such as natural resources and market size are relatively becoming lessimportant, while less traditional factors, such as business environment, institutionalquality and governance, and economic freedom are becoming major promoters ofF.D.I. flow. In addition, a study by Ali, Feiss and MacDonald (2010) shows that insti-tutional quality more specifically economic institutions such as property right andcontract enforcement are robust factors to attract F.D.I. Similarly, an improvement indoing business indicators (ease of doing business) is becoming one of the importantfactors to attract more F.D.I. to developing countries (Bayraktar, 2015; Moran et al.,2018). Therefore, empirical assessment of the drivers of Chinese F.D.I. flow toAfrican countries should take into account the business environment and institutionalquality on the top of the traditional determinants of F.D.I. flow.
Hence, the major aim of this article is to examine the impact of the domestic busi-ness environment and institutional quality on Chinese F.D.I. flow to African coun-tries. We match aggregate indicators of business environment and institutionalquality indicators (doing business, border and transport efficiency, economic freedomand governance) of African countries with Chinese F.D.I. flow to Africa. In addition,
ECONOMIC RESEARCH-EKONOMSKA ISTRAŽIVANJA 27

we examine the impact of major economic freedom indicators on Chinese F.D.I. flowseparately. Our results provide evidence that Chinese F.D.I. flow to African countriesis significantly affected by the business environment and institutional quality.
This study is significant for a few reasons. First, it examines the role of businessenvironment and institutional quality on Chinese F.D.I. flow which is an under-researched topic. Second, we employ Poisson pseudo-maximum likelihood (P.P.M.L.)estimator that helps include zero-valued observations in the sample and robustmethod of estimation in the presence of heteroscedasticity. Finally, our results arerobust and have no evidence of endogeneity problem.
The rest of this article is organized as follows. Part two discusses the literaturereview. Part three explains the data and methodology of the study. Part four presentsthe results and findings of the study. Part five provides results of robustness checkfor endogeneity, and part six gives conclusions.
2. Literature review
Economic literature examining the drivers of F.D.I. flow have arisen aiming primarilyto pinpoint which factors F.D.I. recipients have to provide. Over the last several deca-des, a consensus has emerged that donor interests and the recipient needs to shape theF.D.I. flow among countries. Using the Heckscher–Ohlin (H–O) trade model to explainthe motives behind investors who operate production chains abroad in 1960s andinternalization theory, which was introduced by Buckley and Casson in 1976, Dunningdeveloped O.L.I. paradigm. The O.L.I. paradigm consists of three sub-paradigms fromwhich one can analyse the reasons why firms engage in F.D.I.: Ownership (O),Location (L), and Internalization (I). These determinants have categorised into threetypes: market-seeking, resource-seeking, and efficiency-seeking (Dunning, 2000).Furthermore, Helpman, Melitz and Yeaple (2004) developed a theory that relates F.D.I.to international trade. On the other hand, Nocke and Yeaple (2008) developed anassignment theory to analyse the volume and composition of F.D.I.
Based on the above theories and motives of F.D.I. flow a number of empiricalstudies have been conducted so far regarding the determinants of F.D.I. flow to dif-ferent countries. For example, using Bayesian statistical techniques, Blonigen andPiger (2011) selects from a large set of candidates from those variables most likely tobe determinants of F.D.I. find that cultural distance, per capita G.D.P., labour endow-ments and trade are the major determinants of F.D.I. flow to developing countries.However, the little support is found for trade openness, host-country business costs,host-country infrastructure and institutions. Similarly, Abbas and Mosallamy (2016)using a panel data model found that resources, market openness, human capital,infrastructure and political stability are significant determinants of F.D.I. Likewise,Richet (2019) reveals that countries with smaller market opportunities receive less dir-ect investment.
Most of F.D.I. literature emphasis on tradition determinants of F.D.I flow.However, recently, some empirical studies have been conducted on the impact ofinstitutional quality on cross countries F.D.I. flow. Kapuria-Foreman (2008) employscross-country growth regressions for a sample of developing countries to examine the
28 D. G. BOROJO AND J. YUSHI

effects of institutional quality more specifically the effect of economic institutionssuch as enforcement of property rights, corruption and policy orientation factors(openness) find that F.D.I. positively responds to changes in levels of economic free-dom. Similarly, Ali et al. (2010) and Buchanan et al. (2012) examine the effect ofinstitutional quality on F.D.I. based on a panel data analysis found that the govern-ance infrastructure has a positive effect on F.D.I. flows. Using corruption control, therule of law and regulatory quality Anyanwu (2012) reveals the prevalence of the ruleof law increases F.D.I. inflows to African countries. Bayraktar (2015) examines thelink between F.D.I. and business environment using ease of doing business indicatorsshows that countries which have better records of doing business tend to attractmore F.D.I. In addition, Moussa, Caha and Karag€oz (2016) investigate the impact ofeconomic freedom on F.D.I. inflows in both global and regional panel analysis con-cerning 156 countries, including fragile and conflict-affected states, sub-Saharan coun-tries. Their results show a positive impact of economic freedom on F.D.I.
Most of the earlier studies on Chinese F.D.I. have been emphasising market sizeand natural resources motives. Studies examining the association between ChineseF.D.I. and the business environment and institutional quality of African countries arelimited. A study by Sanfilippo (2010) and Cheung et al. (2011) suggests that China’sinvestment in Africa is driven by the common traditional determinants considered inthe literature on Chinese foreign investment to African countries. Thus, this studyaims to examine the impact of the business environment and institutional quality onChinese F.D.I. flow to African countries.
3. Methodology and data
3.1. The data
Our study covers Chinese F.D.I. flow to 44 African countries for the periods2003–2014 based on data availability. The list and definition of variables and datasources are given in the Appendix (Table A1). The countries included in the sampleare also listed in the Appendix (Table A3). Chinese F.D.I. to Africa used in this studyis compiled from U.N.C.T.A.D. bilateral F.D.I. statistics and China statistical yearbookby Johns Hopkins S.A.I.S. China–Africa Research Institute from the year 2003 (ChinaAfrica Research Initiative, 2017). Facts of the explanatory variables controlled in thisstudy are spelled out in the following part.
3.1.1. Political and governance indexThe empirical analysis for this article utilises a political and governance institutiondata set of governance indicators of worldwide governance indicators (W.G.I.),namely: the rule of law, the absence of violence and instability, regulatory quality,government effectiveness, voice and accountability and control of corruption. Therule of law shows contract and property right protection and abilities of police andcourt to enhance private rights. Political stability and absence of violence representsthe capacity of government in avoiding internal and external conflicts and ethnic ten-sions and control of corruption indicates the position of countries in fighting againstcorruption. Regulatory quality captures perceptions of the ability of the government
ECONOMIC RESEARCH-EKONOMSKA ISTRAŽIVANJA 29

to formulate and implement sound policies and regulations that promote private sec-tor development. Government effectiveness captures perceptions of the quality ofpublic and civil services, and the degree of its independence from political pressures,the quality of policy formulation and implementation. Voice and accountabilitycatches view of the degree to which citizens can take an interest in selecting theirgovernment, the opportunity of free expression and association, and a free media.Their values range from –2.5 to 2.5 with higher values corresponding to betterinstitutions.
Using these indicators of institutional quality of African countries, we derive a sin-gle composite index using principal component analysis. The eigenvalue of the firstprincipal component of institutional quality is greater than 1 (4.565> 1). However,none of the other components have eigenvalues more than 1. Since the first compo-nent explains 76% of the variation in the original variables, the study uses the eigen-vectors of the first principal component (see Table A2 in Appendix). Furthermore,we employ the polity variable to proxy the democracy level of African countries.
3.1.2. Border and transport efficiency indicesWe add border and transport efficiency indicators into our analysis using six softtransport and border efficiency indicators. These are the cost of export, cost ofimport, time to export, time to import, documents to export and documents toimport. The cost of export and import measures the fees imposed on a 20-foot con-tainer in U.S. dollars. It includes charges associated with completing the processes toexport or import the goods. Time to export and to import is measured by the timerecorded in calendar days. The time calculation for an export or import process startsfrom the moment it is started and runs until it is completed. All documents requiredper shipment to export or import goods are captured.
Using principal component analysis, we find two aggregate indicators of borderand transport efficiency index. The eigenvalues of the first two components of theborder and transport efficiency are 1.749, 3.799 and 1.369, explaining 63.3% and22.8% of the total variance, respectively. Hence we include the first two principalcomponents of border and transport efficiency as the sum of the variances of theindividual components 87.1% (see Table A2 in Appendix). We hypothesise that thereshould be a negative relationship between border and transport efficiency indicatorsand Chinese F.D.I. flow because of the ease of cross border trading activities pro-motes F.D.I. inflow (William et al., 2013).
3.1.3. Doing business indexWe control for doing business index using four ease of doing business indicators ofworld development indicators (W.D.I.) such as cost to start the business, cost toenforce the contract, cost to register property right and minimum capital required tostart the business. The eigenvalues of the first two components of these indicators aregreater than 1 (1.749 and 1.058> 1). The first two principal components of doingbusiness have variance 1.749 and 1.058, explaining 44% and 26.5% of the total vari-ance, respectively explaining 70% of the total variance (see Table A2 in Appendix).We hypothesise that a better business environment promotes Chinese F.D.I. flow to
30 D. G. BOROJO AND J. YUSHI
Africa because countries with better records of doing business environment attractmore F.D.I. (Bayraktar, 2015).
3.1.4. Economic freedom indicatorsEconomic freedom indicator is used to proxy economic institutions of African coun-tries (Pearson, Nyonna & Kim, 2012). We add property right, legal protection, regula-tion, sound money, freedom to trade internationally, government size and investmentfreedom. In all cases, the values of these indicators vary from 0 to 10, with highervalues corresponding to a better status. Our hypothesis is that there should be a posi-tive association between economic freedom and Chinese F.D.I. flow because a higherdegree of economic freedom results in higher F.D.I. inflow (Pearson et al., 2012).
3.1.5. Other traditional determinantsReal G.D.P. per capita and population size: They are used to proxy market size.Countries with a high level of per capita G.D.P. might attract less F.D.I. inflowsbecause it indicates a lower marginal product of capital (Arbatli, 2011). A countrywith a big population size attracts more F.D.I. inflow (Peres, Ameer & Xu, 2018).
Distance: Is represented by the physical distance between African countries andChina. Chinese F.D.I. in Africa tends to be more concentrated in the East and SouthAfrican regions. Some of the reasons why East Africa stands out as a popular destin-ation for these private Chinese investments maybe because of its relative closeness toChina (Chen, Dollar & Tang, 2015).
Real G.D.P. per capita of China: We include real G.D.P. per capita of China basedon the work of Blonigen and Piger (2011) that shows 99% inclusion probability oforigin countries’ real G.D.P. per capita.
Natural resources depletion: It is used to proxy the natural resources motives ofChinese F.D.I. flow to African countries based on Foster, William, Chuan andNataliya (2009) which associate Chinese F.D.I. flow to natural resources extraction.
Diplomatic relationship: it is represented by China’s voting alignment with Africancountries in the U.N. General Assembly and a dummy of African countries on therecognition of one-China policy (Zhang, Jiang & Zhou, 2014).
China–Africa trade: It is used to measure African countries’ trade intensity withChina following the works of Cheung et al. (2011) that used to proxy economic linksof China with African countries.
Inflation rate: It is used to represent the macroeconomic stability. Furthermore,domestic credit is used as a proxy to access credit and financial market.
Debt to G.D.P. ratio: It is used to proxy creditworthiness. External debt will have anegative effect on F.D.I., and increasing foreign debt will destroy foreign investors’vision and create negative expectations of the future economy (Ostadi & Ashja, 2014).
3.2. Methods of analysis
The empirical analysis of this article is based on the gravity specification of paneldata. The estimation of the gravity model in the recent empirical literature is mostlybased on panel data (Bussi�ere, Fidrmuc & Schnatz, 2008; Westerlund & Wilhelmsson,
ECONOMIC RESEARCH-EKONOMSKA ISTRAŽIVANJA 31
2011). The gravity specification developed by Tinbergen (1962) to analyse inter-national trade flow is shown in Equation (1). Trade flow between countries is a func-tion of the mass of the country of origin, the mass of the country of destination andthe physical distance between the two countries.
Tij ¼ vMbni Mbm
j =DbZij (1)
where Tij is international flow from reporter i country to partner j country (trade,F.D.I. and migration), Mi and Mj are the mass of the origin and destination countries(G.D.P. per capita of countries, population and so on), Dij is a physical distancebetween origin and destination countries. b and v represent parameters and constant,respectively.
In gravity models, the issues of heteroscedasticity are significantly important. If theerror term is heteroskedastic, which is highly probable in practice, then the expectedvalue of the error term depends on one or more of the explanatory variables becauseit includes the variance term. This violates the first assumption of O.L.S. and suggeststhat the estimator may be biased and inconsistent. The presence of heteroscedasticityunder the assumption of a multiplicative error term in the original nonlinear gravitymodel specification requires the adoption of P.P.M.L. (Santos Silva & Tenreyro,2006). Furthermore, if there are zero-valued observations, using the log-linear methodto estimate the gravity model results in loss of information because transforming datato logarithm form drops zero-valued observations potentially leading to sample selec-tion bias, which has become an important issue in recent empirical work. Theapproach followed by the large majority of empirical studies is to drop the pairs withzero-valued observations from the data set and estimate the log-linear form by O.L.S.In turn, dropping zero-valued observations reduces the efficiency of data and lead tobiased estimates (G�omez-Herrera, 2013). However, this procedure will lead to incon-sistent estimators of the parameters of interest.
The best alternative method for estimating the gravity model to accommodatezero-valued observation is the P.P.M.L. estimator. Thus, the ability of Poisson toinclude zero observations naturally and without any additions to the basic model ishighly desirable. This estimator is generally well behaved even when the proportionof zeros in the sample is considerable (Santos Silva & Tenreyro, 2011). Alternatively,Prehn, Br€ummer and Glauben (2016) developed a random intercept P.P.M.L. modelto allow for the estimation of exporter and importer invariant variables in the estima-tion. It is an ideal estimator for the gravity model if the sample size is large enoughand the sample has many origin and destination countries. However, this method isruled out in this study because the sample size is not large enough as that of tradeflow and we have only one origin and many destination countries in the samplewhich do not allow us to estimate the effects of time-invariant characteristics ofthe pair.
We extend the P.P.M.L. estimator to estimate the gravity model of F.D.I. flowbecause there are some zero-valued observations and heterogeneity issues (SantosSilva & Tenreyro, 2006; Westerlund & Wilhelmsson, 2011; Jacimovic, Mitrovi�c, Bjeli�c,Tianping & Rajkovic, 2018). Thus, Equation (1) can be augmented to include
32 D. G. BOROJO AND J. YUSHI

traditional gravity variables, institutional quality and business environment indicatorsin this study.
FDIcit ¼ b0 þ b1gdpcait þ b2UNVict þ b3exdeptit þ b4naturalit þ b5distwict þ b6gdpcctþb7dipic þ b8chinatradeict þ b9popit þ b10inf it þ b11credit þ bnBEit þ eict
(2)
where FDIcit denotes F.D.I. from China to Africa, gdpca is real G.D.P. per capita,U.N.V. is China’s voting alignment with African countries in the U.N. GeneralAssembly, exdept is debt G.D.P. ratio of African countries, natural is natural resour-ces depletion rate of African countries, distw is distance between African countriesand China, gdpc is real G.D.P. per capita of China, dip is dummy variable 1 ifAfrican country support one-China policy and 0 otherwise, chinatrade representstrade openness between China and African countries, pop is the population size ofAfrican countries, inf represents the inflation rate of African countries, cred iscredit to the private sector, BE represents the level of democracy, business environ-ment and institutional quality indicators of African countries and eijt is stochas-tic term.
Multilateral resistance term (M.R.T.), which is a function of exogenous variables, istaken into account by employing the Baier and Bergstrand (2009) method1. STATA13 is used to exercise the model.
The log-linear transformation of Equation (2) is:
FDIcit ¼ b0 þ b1 ln gdpcait þ b2UNVict þ b3 ln exdeptitþ b4 ln naturalit þ b5 ln distwict þ b6 ln gdpcctþ b7dipict þ b8 ln chinatradeict þ b9 ln popit þ b10 ln inf itþ b11 ln credit þ bn lnBEit þ eict
(3)
4. Results and findings
In this section, we discuss the main findings of the study. Table 1 presents P.P.M.L.estimation results for the impacts of the aggregate business environment and institu-tional quality on Chinese F.D.I. flow to African countries.
The results in Table 1 reveal that the economic magnitude of African countriesrepresented by their real G.D.P. per capita has a positive effect on F.D.I. flowfrom China to African countries. However, its effect is statistically insignificantexcept in column (ii). Additionally, population size has a significantly positiveeffect on Chinese F.D.I. flow to African countries. This result indicates that anincrease in population size provides a large market for products and services pro-duced by Chinese F.D.I. in local markets. It also provides the economy with alarge labour force. Hence, it suggests that Chinese F.D.I. flow to Africa is associ-ated with population size. The geographical distance between African countriesand China has a significant negative effect on F.D.I. flow indicating that physicaldistance discourages flow of F.D.I. However, bilateral trade openness betweenChina and Africa has a robust positive effect on Chinese F.D.I. flow to African
ECONOMIC RESEARCH-EKONOMSKA ISTRAŽIVANJA 33

countries. Therefore, trade openness between China and African countries is oneof the major drivers of Chinese F.D.I. to African countries. Besides, the G.D.P.per capita of China has a significantly positive effect on Chinese F.D.I. flow toAfrican countries. This indicates that one of the drivers of F.D.I. flow from Chinato African countries is an increase in the economic potential and magnitude ofthe Chinese economy.
The effect of diplomacy between China and African countries represented byChina’s voting alignment with African countries in the U.N. General Assembly andrecognition of the One-China policy has a robust positive effect on Chinese F.D.I.flow to African countries. Therefore, the diplomatic relationship between China andAfrican countries plays a significant role in attracting Chinese F.D.I. because it
Table 1. The impacts of institutional quality and business environment on Chinese F.D.I. flow toAfrican countries.Variables (i) (ii) (iii) (iv)
lngdpcait 0.369(0.291)
0.460��(0.212)
0.295(0.265)
0.178(0.283)
U.N.V.ict 4.613���(1.297)
3.701���(1.299)
4.977���(1.368)
5.497���(1.366)
lnexdebtit �0.072(0.152)
�0.165(0.134)
�0.071(0.138)
�0.085(0.168)
lnnaturalit 0.041(0.082)
0.033(0.068)
0.066(0.101)
0.108(0.115)
lndistwict �0.744���(0.242)
�0.691���(0.254)
�0.533��(0.257)
�0.356(0.260)
lngdpct 0.909���(0.122)
0.798���(0.172)
1.171���(0.127)
1.108���(0.139)
Dipic 3.277��(1.440)
3.392��(1.440)
3.690��(1.445)
3.895���(1.447)
lnchinatradeict 0.387���(0.114)
0.288���(0.089)
0.354���(0.107)
0.385���(0.115)
lnpopit 0.446���(0.137)
0.645���(0.118)
0.463���(0.127)
0.392���(0.131)
infit �0.059(0.089)
0.050(0.056)
0.052(0.089)
�0.030(0.093)
lncredit �0.203(0.129)
�0.019(0.135)
�0.090(0.175)
�0.164(0.178)
lnpoliit 1.588���(0.293)
1.180���(0.176)
1.365���(0.242)
1.223���(0.234)
lndoingbusiness1it �0.556���(0.205)
lndoingbusiness2it �0.726�(0.437)
lnbordertransport1it 0.073(0.051)
lnbordertransport2it �0.244���(0.082)
lnpoliticalinstituit 0.275(0.548)
lneconomicinstituit 2.388��(1.123)
Cons. �21.408���(2.330)
�20.238���(2.820)
�25.692���(2.520)
�34.074���(4.901)
Obs. 280 270 341 311R2 0.873 0.898 0.856 0.873Ramsey 0.259 0.136 0.140 0.079
Notes: ��� significant at 1%, �� significant at 5%, � significant at 10%, standard error in parenthesis. Source:Authors’ calculations.
34 D. G. BOROJO AND J. YUSHI

increases F.D.I. inflow by reducing barriers that may face Chinese investors inAfrican countries.
Chinese F.D.I., however, is not significantly affected by natural resources extrac-tion. This is because of Chinese F.D.I. presents in a broad range of countries, includ-ing non-resource-rich countries in East Africa such as Ethiopia, Kenya and Tanzania.On top of that, sizable F.D.I. inflows from China to Africa are going into the servicessector, constituting more than 60%. This justification is true even in some oil-richAfrican countries. The remaining part goes to the manufacturing, construction, andnatural resources sectors. Thus, against popular perception, most of the ChineseF.D.I. inflow is not focusing on natural resources motives.
Turning to our explanatory variables of main interest, all institutional quality andbusiness environment indicators have expected signs and their effect is statisticallysignificant but the first indicators of border and transport efficiency and politicalinstitution index. The coefficient of the business environment is negative and statistic-ally significant, indicating that African countries with a conducive doing businessenvironment attract more F.D.I. from China. Similarly, there is a significant negativeassociation between border and transport efficiency indicator and Chinese F.D.I. flowto African countries, indicating improvements in border and transport efficiency pro-motes Chinese F.D.I. flow to African countries.
Furthermore, the economic freedom indicator has a robust positive effect onChinese F.D.I. flow to African countries. Furthermore, the coefficient of polity vari-able is significant at the conventional level, implying an improvement in democraticinstitutions promotes Chinese F.D.I. flow to African countries.
Since economic freedom indicators are significantly important, we aim toexamine the effect of each economic freedom indicator on Chinese F.D.I. flow toAfrican countries. We are interested in these indicators because it is believed thatinstitutional quality, more specifically economic institutions such as propertyright and contract enforcement, profoundly matters for the attraction of F.D.I.Thus, compared to political and democratic indicators, economic institutions aremore relevant to affect F.D.I. flow, more specifically, Chinese F.D.I. as China fol-lows a noninterference policy. Hence in this part, we examine the effect of prop-erty right, legal enforcement, sound money, freedom to trade internationally,investment freedom, business regulation and government size on F.D.I. flow sep-arately (Table 2).
The coefficients of property right and legal system are also positive and significant,indicating that improvement in security of property rights and legal systems affectsChinese F.D.I. flow positively. Hence Chinese F.D.I. is attracted to African countrieswhere the rule of law, security of property rights, an independent and unbiased judi-ciary, and impartial and effective enforcement of the law are secured. Furthermore,the effect of regulation and sound money is significantly positive. This reveals thatregulatory restraints that limit the freedom of exchange in credit, labour, and productmarkets discourage F.D.I. inflow to African countries. Similarly, the absence of soundmoney negatively affects Chinese F.D.I. flow to African countries. Therefore, asecured property right and legal enforcement and noble regulatory environment driveChinese F.D.I. to African countries.
ECONOMIC RESEARCH-EKONOMSKA ISTRAŽIVANJA 35

5. Robustness check
According to some literature, there will be potential reverse causality between thebusiness environment and institutional quality indicators and F.D.I. Hence businessenvironment and institutional quality may not be determined exogenously; however,it may depend on the type of law that rules the country, the legal origins, and thelevel of economic development (Buchanan et al., 2012; Peres et al., 2018). If the busi-ness environment and institutional indicators are potentially endogenous, it is essen-tial to look for alternative methods that do not suffer from the same problem.Therefore, to address the endogeneity concern we estimate instrumental variable
Table 2. The impacts of separate economic freedom indicators on Chinese F.D.I. flow to Africa.Variables (i) (ii) (iii) (iv) (v) (vi) (vii)
lngdpcait 0.236(0.288)
0.205(0.232)
0.183(0.247)
0.146(0.285)
0.223(0.311)
0.218(0.253)
0.240(0.263)
UNVict 5.301���(1.391)
5.671���(1.045)
4.968���(1.207)
4.154���(1.187)
4.935���(1.418)
3.846���(1.049)
5.255���(1.473)
lnexdebtit �0.124(0.188)
�0.198(0.131)
�0.185(0.135)
�0.267(0.163)
�0.173(0.188)
�0.157(0.150)
�0.232(0.176)
lnnaturalit 0.074(0.107)
�0.021(0.059)
0.008(0.077)
0.059(0.103)
0.050(0.099)
0.091(0.117)
0.050(0.097)
lndistwict �0.375(0.276)
�0.444�(0.243)
�0.590���(0.211)
�0.375(0.279)
�0.467(0.284)
�0.518��(0.257)
�0.470�(0.251)
lngdpct 1.131���(0.142)
1.081���(0.131)
1.141���(0.127)
1.103���(0.129)
1.159���(0.160)
0.997���(0.159)
1.146���(0.150)
Dipic 3.683��(1.438)
3.545��(1.447)
3.438��(1.440)
3.688��(1.443)
3.587��(1.440)
3.560��(1.443)
3.472��(1.443)
lnchitradeict 0.363���(0.114)
0.476���(0.067)
0.407���(0.111)
0.381���(0.113)
0.361���(0.120)
0.384���(0.101)
0.381���(0.119)
lnpopit 0.389���(0.144)
0.330���(0.097)
0.339���(0.126)
0.452���(0.109)
0.373��(0.179)
0.362���(0.112)
0.326�(0.168)
infit 0.014(0.095)
0.119(0.081)
�0.021(0.079)
�0.017(0.091)
0.029(0.085)
0.015(0.106)
0.029(0.090)
lncredit �0.060(0.176)
�0.304(0.186)
�0.046(0.128)
�0.114(0.164)
�0.002(0.162)
�0.077(0.166)
0.034(0.147)
lnpoliit 1.408���(0.272)
1.182���(0.186)
1.443���(0.223)
1.334���(0.186)
1.410���(0.250)
1.305���(0.203)
1.390���(0.228)
lninfreeit 0.379(0.304)
logproperit 0.868���(0.296)
lnlegalpit 0.537��(0.220)
lnbregulatit 1.511�(0.826)
lntradeintit 0.399(1.726)
lnsoumonit 1.898���(0.551)
lngovsizeit 0.562(0.600)
Cons. �26.341���(2.352)
�26.276���(2.201)
�24.828���(1.836)
�25.220���(2.155)
�25.158���(2.934)
�25.698���(2.002)
�25.738���(2.387)
Obs. 311 247 286 294 297 295 297R2 0.864 0.868 0.867 0.871 0.862 0.888 0.858Ramsey 0.068 0.479 0.245 0.166 0.190 0.132 0.222
Notes: ��� significant at 1%, �� significant at 5%, � significant at 10%, standard error in parenthesis. Source:Authors’ calculations.
36 D. G. BOROJO AND J. YUSHI

(I.V.) using legal origin and the lagged values of independent variables as instrumentsfor each institutional quality and business environment variables because these varia-bles are controlled separately to proxy institutional quality and business environmentof African countries (Buchanan et al., 2012; Peres et al., 2018). Countries with alighter regulatory environment will have a better institutional quality and businessenvironment. In our analysis we consider countries with French legal origin havelower institutional quality and highly regulated business environment because it ishighly correlated with an excessive regulatory environment and may lead to lowerquality institutions, mainly when the French legal system was implemented in devel-oping countries (Djankov, La Porta, L�opez-de-Silanes & Shleifer, 2002). However,
Table 3. The impacts of institutional quality and business environment on Chinese F.D.I. flow toAfrican countries.Variables I ii iii iv
lngdpcait 0.890���(0.178)
0.807���(0.186)
0.610���(0.153)
0.814���(0.189)
UNVict 4.317��(1.852)
3.562�(2.050)
4.827���(1.737)
4.989��(2.035)
lnexdebtit 0.032(0.105)
0.018(0.110)
�0.084(0.099)
�0.224�(0.128)
lnnaturalit 0.046(0.035)
0.056(0.037)
0.013(0.032)
0.044(0.037)
lndistwict �1.070���(0.259)
�0.974���(0.273)
�0.846���(0.230)
�1.105���(0.284)
lngdpct 0.973���(0.223)
0.785���(0.235)
1.369���(0.186)
0.739���(0.248)
Dipic �0.952(0.672)
�1.250�(0.681)
�1.130(0.737)
�2.491���(0.800)
lnchinatradeict 0.174���(0.035)
0.168���(0.035)
0.228���(0.034)
0.282���(0.046)
lnpopit 0.752���(0.085)
0.801���(0.085)
0.643���(0.077)
0.740���(0.090)
infit �0.029(0.069)
0.020(0.066)
0.013(0.058)
�0.133�(0.072)
lncredit �0.551���(0.114)
�0.370���(0.127)
�0.343���(0.102)
�0.539���(0.141)
lnpoliit 1.644���(0.184)
1.495���(0.192)
1.253���(0.161)
1.361���(0.199)
lndoingbusiness1it �1.143���(0.307)
lndoingbusiness2it �0.179(0.304)
lnbordertransport1it 0.056(0.052)
lnbordertransport2it �0.174��(0.078)
lnpoliticalinstituit �0.339(0.251)
lneconomicinstituit 1.784�(0.997)
Cons. �17.186���(2.904)
�16.219���(3.033)
�20.292���(2.627)
�19.091���(3.189)
Obs. 234 231 331 208R2 0.71 0.711 0.718 0.678Wald v2 (p-value) 0.000 0.000 0.000 0.000Wu–Hausman (p-value) 0.126 0.215 0.275 0.064
Notes: ��� significant at 1%, �� significant at 5%, � significant at 10%, standard error in parenthesis. Source:Authors’ calculations.
ECONOMIC RESEARCH-EKONOMSKA ISTRAŽIVANJA 37
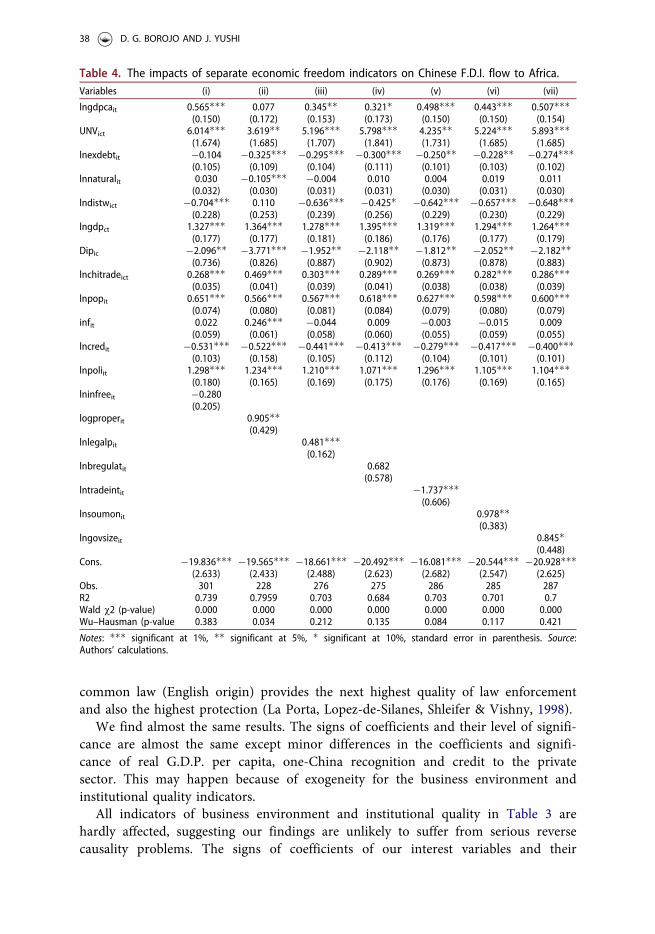
common law (English origin) provides the next highest quality of law enforcementand also the highest protection (La Porta, Lopez-de-Silanes, Shleifer & Vishny, 1998).
We find almost the same results. The signs of coefficients and their level of signifi-cance are almost the same except minor differences in the coefficients and signifi-cance of real G.D.P. per capita, one-China recognition and credit to the privatesector. This may happen because of exogeneity for the business environment andinstitutional quality indicators.
All indicators of business environment and institutional quality in Table 3 arehardly affected, suggesting our findings are unlikely to suffer from serious reversecausality problems. The signs of coefficients of our interest variables and their
Table 4. The impacts of separate economic freedom indicators on Chinese F.D.I. flow to Africa.Variables (i) (ii) (iii) (iv) (v) (vi) (vii)
lngdpcait 0.565���(0.150)
0.077(0.172)
0.345��(0.153)
0.321�(0.173)
0.498���(0.150)
0.443���(0.150)
0.507���(0.154)
UNVict 6.014���(1.674)
3.619��(1.685)
5.196���(1.707)
5.798���(1.841)
4.235��(1.731)
5.224���(1.685)
5.893���(1.685)
lnexdebtit �0.104(0.105)
�0.325���(0.109)
�0.295���(0.104)
�0.300���(0.111)
�0.250��(0.101)
�0.228��(0.103)
�0.274���(0.102)
lnnaturalit 0.030(0.032)
�0.105���(0.030)
�0.004(0.031)
0.010(0.031)
0.004(0.030)
0.019(0.031)
0.011(0.030)
lndistwict �0.704���(0.228)
0.110(0.253)
�0.636���(0.239)
�0.425�(0.256)
�0.642���(0.229)
�0.657���(0.230)
�0.648���(0.229)
lngdpct 1.327���(0.177)
1.364���(0.177)
1.278���(0.181)
1.395���(0.186)
1.319���(0.176)
1.294���(0.177)
1.264���(0.179)
Dipic �2.096��(0.736)
�3.771���(0.826)
�1.952��(0.887)
�2.118��(0.902)
�1.812��(0.873)
�2.052��(0.878)
�2.182��(0.883)
lnchitradeict 0.268���(0.035)
0.469���(0.041)
0.303���(0.039)
0.289���(0.041)
0.269���(0.038)
0.282���(0.038)
0.286���(0.039)
lnpopit 0.651���(0.074)
0.566���(0.080)
0.567���(0.081)
0.618���(0.084)
0.627���(0.079)
0.598���(0.080)
0.600���(0.079)
infit 0.022(0.059)
0.246���(0.061)
�0.044(0.058)
0.009(0.060)
�0.003(0.055)
�0.015(0.059)
0.009(0.055)
lncredit �0.531���(0.103)
�0.522���(0.158)
�0.441���(0.105)
�0.413���(0.112)
�0.279���(0.104)
�0.417���(0.101)
�0.400���(0.101)
lnpoliit 1.298���(0.180)
1.234���(0.165)
1.210���(0.169)
1.071���(0.175)
1.296���(0.176)
1.105���(0.169)
1.104���(0.165)
lninfreeit �0.280(0.205)
logproperit 0.905��(0.429)
lnlegalpit 0.481���(0.162)
lnbregulatit 0.682(0.578)
lntradeintit �1.737���(0.606)
lnsoumonit 0.978��(0.383)
lngovsizeit 0.845�(0.448)
Cons. �19.836���(2.633)
�19.565���(2.433)
�18.661���(2.488)
�20.492���(2.623)
�16.081���(2.682)
�20.544���(2.547)
�20.928���(2.625)
Obs. 301 228 276 275 286 285 287R2 0.739 0.7959 0.703 0.684 0.703 0.701 0.7Wald v2 (p-value) 0.000 0.000 0.000 0.000 0.000 0.000 0.000Wu–Hausman (p-value 0.383 0.034 0.212 0.135 0.084 0.117 0.421
Notes: ��� significant at 1%, �� significant at 5%, � significant at 10%, standard error in parenthesis. Source:Authors’ calculations.
38 D. G. BOROJO AND J. YUSHI

significance are almost similar to our results in Table 1, proofing that there is no evi-dence of the endogeneity problem. Furthermore, the Wu–Hausman test for endogeneityindicates that there is no evidence of endogeneity as we fail to reject the null hypothesisthat specifies no existence of endogeneity, proving the existence of exogeneity.
Furthermore, we test the endogeneity issue for each economic freedom indicatorsusing the same instruments. The Wu–Hausman test of endogeneity in Table 4 showsthat there is no endogeneity problem.
The signs of coefficients of property right, legal enforcement, sound money, gov-ernment size, investment freedom are consistent with the results in Table 2. Theireffect on Chinese F.D.I. flow is robust positive. However, the coefficient of inter-national trade freedom turns to negative and significant. Hence I.V. results are almostsimilar to our results in Table 2, confirming that there is no endogeneity problem.
6. Conclusion
This article examines the impact of institutional quality and business environmentindicators on Chinese F.D.I. flow to African countries. Aggregate institutional qualityand business environment indicators are derived employing principal component ana-lysis using different institutional quality and business environment indicators. Theseaggregate indicators are economic and political institutions, doing business, borderand transport efficiency of African countries. We employ the P.P.M.L. gravity modelestimator which is robust to accommodate zero-valued observations and heterosce-dasticity concerns. Furthermore, we conduct robustness check for endogeneity prob-lem using I.V. controlling the legal origin and lagged values of the variables asinstruments for institutional quality and business environment indicators. As thesetests disclose our results are proven to be robust and do not suffer from reverse caus-ality problem.
Controlling for different explanatory variables, our findings indicate that improve-ment in institutional quality and business environment of African countries have asignificant positive effect on Chinese F.D.I. flow to African countries. The coefficientof doing business environment is negative and statistically significant, indicatingAfrican countries with a conducive doing business environment attract more F.D.I.from China. Similarly, there is a significant negative association between border andtransport efficiency and Chinese F.D.I. flow to African countries, demonstratingimprovements in border and transport efficiency promotes Chinese F.D.I. flow toAfrican countries. Additionally, economic institutional indicators have a robust posi-tive effect on Chinese F.D.I. flow to African countries. Besides, the coefficient of pol-ity variable is significant at the conventional level indicating improvement in politicaland democratic institutions promotes Chinese F.D.I. flow to African countries.
Furthermore, we examine the impact of separate indicators of economic freedomon Chinese F.D.I. flow because of economic freedom indicators such as property rightand contract enforcement, sound money and investment freedom. Our estimatesshow that legal enforcement and property right have a robust positive effect onChinese F.D.I. flow to African countries. Hence Chinese F.D.I. is more attracted toAfrican countries where legal enforcement, security of property rights, an independent
ECONOMIC RESEARCH-EKONOMSKA ISTRAŽIVANJA 39

and unbiased judiciary are promoted. Also, business regulation and sound money havea significant positive effect on Chinese F.D.I. flow to Africa. Therefore, regulatoryrestraints that limit the freedom of exchange in credit, labour, and product marketsand the absence of sound money obstruct Chinese F.D.I. inflow to African countries.
Our results also reveal that population size has a robust positive effect on ChineseF.D.I. flow to African countries. This implies that Chinese F.D.I. flow to African coun-tries is motivated by market size as it delivers a large labour force and potential con-sumer that can promote production. Besides, there is a strongly significant positiveassociation between Africa–China trade openness and Chinese F.D.I. flow to Africancountries. However, the coefficients of natural resources are insignificant revealing thatChinese F.D.I. flow is not tied with resources motives. Thus, against popular percep-tion, most of the Chinese F.D.I. inflow is not primarily motivated by natural resources.Moreover, internal economic growth of the Chinese economy and the diplomatic rela-tionship between China and African countries significantly affect F.D.I. flow fromChina to African countries. The debt per G.D.P. has a robust negative effect onChinese F.D.I. flow revealing African countries with higher debt-G.D.P. ratio likelyreceive less Chinese F.D.I. compared to countries with lower debt per G.D.P.
To conclude, our results provide evidence that the business environment and insti-tutional quality of African countries significantly matter for Chinese F.D.I. flow toAfrica. Hence to promote F.D.I. flow from China to Africa, it is significantly essentialto improve the quality of the domestic business environment and institutions ofAfrican countries.
Notes
1. We replace the bilateral variable that accounts for F.D.I. flow cost (distance) by M.R.T. inthe model following Baier and Bergstrand (2009) methods BY indexing (i,b,c) forreporters countries and (j,e,f) for partner country (China).MRTlnXijt ¼ lnXijt-{
Pe=2i hi lnXiet 1
Pb=2j hj lnXbjt-
Pc
Pf hjhi lnXcft}
Where, X is bilateral variables accounting for bilateral F.D.I. flow costs, hi¼Yi/YT andhj¼Yj/YT, Yi¼G.D.P.cit, YT¼G.D.P.cworld
Acknowledgements
We would like to thank the editor and referees for their insightful suggestions that significantlyimproved the article.
Disclosure statement
The authors declare no conflict of interest.
Funding
This work was supported by the National Natural Science Foundation under Grant No.71572156; Sichuan Wine Development Research Center under Grant No. CJZB18-02; SichuanCircular Economy Research Center under Grant No. XHJJ-1815; and the Humanity and SocialScience Youth Foundation of Ministry of Education of China under Grant No. 19YJC630060.
40 D. G. BOROJO AND J. YUSHI

References
Abbas, S., & Mosallamy, D. (2016). Determinants of FDI flows to developing countries: Anempirical study on the MENA region. Journal of Finance and Economics, 4(1), 30–38. doi:10.12691/jfe-4-1-4
Adisu, K., Sharkey, T., & Okoroafo, S. C. (2010). The impact of Chinese investment in Africa.International Journal of Business and Management, 5(9), 3–9. doi:10.5539/ijbm.v5n9p3
Ali, F. A., Fiess, N., & MacDonald, R. (2010). Do institutions matter for foreign direct invest-ment? Open Economies Review, 21(2), 201–219. doi:10.1007/s11079-010-9170-4
Anyanwu, J. C. (2012). Why does foreign direct investment go where it goes?: New evidencefrom African countries. Annals of Economics and Finance, 13(2), 425–462. http://aeconf.com/Articles/Nov2012/aef130207.pdf
Arbatli, E. (2011). Middle East and Central Asia department economic policies and FDIinflows to emerging market economies (IMF Working Paper No. 11/192). Retrieved fromhttps://www.imf.org/external/pubs/ft/wp/2011/wp11192.pdf.
Baier, S. L., & Bergstrand, J. H. (2009). Bonus vetus OLS: A simple method for approximatinginternational trade-cost effects using the gravity equation. Journal of InternationalEconomics, 77(1), 77–85. doi:10.1016/j.jinteco.2008.10.004
Bayraktar, N. (2015). Importance of investment climates for inflows of foreign direct invest todeveloping countries. Business and Economic Research, 5(1), 24–50. doi:10.5296/ber.v5i1.6762
Blonigen, B. A., & Piger, J. (2011). Determinants of foreign direct investment (NBER WorkingPaper No. 16704 Issued in January 2011). Retrieved from https://www.nber.org/papers/w16704.
Buchanan, B. G., Le, Q. V., & Rishi, M. (2012). Foreign direct investment and institutionalquality: Some empirical evidence. International Review of Financial Analysis, 21, 81–89. doi:10.1016/j.irfa.2011.10.001
Bussi�ere, M., Fidrmuc, J., & Schnatz, B. (2008). EU Enlargement and Trade Integration:Lessons from a Gravity Model. Review of Development Economics, 12(3), 562–576. doi:10.1111/j.1467-9361.2008.00472.x
CEPII (2015). Gravity CEPII. Retrieved from http://www.cepii.fr/CEPII/en/bdd_modele/down-load.asp?id=8.
Chen, W., Dollar, D., & Tang, H. (2015). Why is China investing in Africa? Evidence from thefirm level. Brookings. Brookings Institution. Retrieved from https://www.brookings.edu/research/why-is-china-investing-in-africa-evidence-from-the-firm-level/.
Cheung, Y.-W., de Haan, J., Qian, X. W., & Yu, S. (2011). China’s outward direct investment inAfrica (HKIMR Working Paper No.13/2011 Issued in April 2011). doi:10.2139/ssrn.1824167
China Africa Research Initiative (2017). Data: China-Africa Trade 2017. Retrieved from http://www.sais-cari.org/data-china-africa-trade.
China Africa Research Initiative (2017). Data: Chinese investment in Africa 2017. Retrievedfrom http://www.sais-cari.org/chinese-investment-in-africa.
Copley, A., Maret-Rakotondrazaka, F., & Sy, A. (2014). The U.S.-Africa leaders summit: Afocus on foreign direct investment. Retrieved from https://www.brookings.edu/blog/africa-in-focus/2014/07/11/the-u-s-africa-leaders-summit-a-focus-on-foreign-direct-investment/.
Djankov, S., La Porta, R., L�opez-de-Silanes, F., & Shleifer, A. (2002). The regulation of entry.The Quarterly Journal of Economics, 117(1), 1–37. doi:10.1162/003355302753399436
Dunning, J. H. (2000). The eclectic paradigm as an envelope for economic and business theo-ries of MNE activity. International Business Review, 9 (2)000), 163–190. doi:10.1016/S0969-5931(99)00035-9
EY_Africa (2017). EY’s attractiveness program Africa, connectivity redefined. Retrieved fromhttps://www.ey.com/za/en/home/article.
Foster, V., William, B., Chuan, C., & Nataliya, P. (2009). Building bridges: China’s growing roleas infrastructure financier for sub-Saharan Africa (Report No. 05).Washington D.C., WorldBank. Retrieved from https://openknowledge.worldbank.org/handle/10986/2614
Fraser Institute (2017). Economic freedom. Retrieved from https://www.fraserinstitute.org/eco-nomic-freedom/dataset?geozone=world&page=dataset.
ECONOMIC RESEARCH-EKONOMSKA ISTRAŽIVANJA 41

G�omez-Herrera, E. (2013). Comparing alternative methods to estimate gravity models of bilat-eral trade. Empirical Economics, 44(3), 1087–1111. doi:10.1007/s00181-012-0576-2
Helpman, E., Melitz, M. J., & Yeaple, S. R. (2004). Export versus FDI with heterogeneousfirms. American Economic Review, 94 (1), 300–316. doi:10.1257/000282804322970814
Heritage Foundation (2017). Index of economic freedom 2017. Retrieved from https://www.heri-tage.org/index/.
Jacimovic, D., Mitrovi�c, R. D., Bjeli�c, P., Tianping, K., & Rajkovic, M. (2018). The role of Chineseinvestments in the bilateral exports of new E.U. member states and Western Balkan countries.Economic Research-Ekonomska Istra�zivanja, 31(1), 1185–1197. doi:10.1080/1331677X.2018.1456357
Kapuria-Foreman, V. (2008). Economic freedom and foreign direct investment in developingcountries. The Journal of Developing Areas, 41(1), 143–154. doi:10.1353/jda.2008.0024
La Porta, R., Lopez-de-Silanes, F., Shleifer, A., & Vishny, R. (1998). Law and finance. Journalof Political Economy, 106(6), 1113–1155. doi:10.1086/250042
Marshall, M. G., Gurr, T. R., & Jaggers, K. (2017). Polity IV project: Political regime character-istics and transitions, 1800-2016. Center for Systemic Peace. Retrieved from http://www.sys-temicpeace.org/inscrdata.html
Moran, T., G€org, H., Seri�c, A., & Krieger-Boden, C. (2018). Attracting FDI in middle-skilledsupply chains. Economics: The Open-Access, Open-Assessment E-Journal, 12(2018-26), 1–9.doi:10.5018/economics-ejournal.ja.2018-26
Moussa, M., Caha, H., & Karag€oz, M. (2016). Review of economic freedom impact on FDI:New evidence from fragile and conflict countries. Procedia Economics and Finance, 38(2016), 163–173. doi:10.1016/S2212-5671(16)30187-3
Nocke, V., & Yeaple, S. (2008). An assignment theory of foreign direct investment. Review ofEconomic Studies, 75(2), 529–557. doi:10.1111/j.1467-937X.2008.00480.x
Ostadi, H., & Ashja, S. (2014). The relationship between external debt and foreign directinvestment in D8 member countries (1995-2011. ). WALIA Journal, 30(S3), 18–22. http://waliaj.com/archive/2014-2/special-issue-3-2014/
Pearson, D., Nyonna, D., & Kim, K.-J. (2012). The relationship between economic freedom,state growth and foreign direct investment in US states. International Journal of Economicsand Finance, 4(10), 140–146. doi:10.5539/ijef.v4n10p140
Peres, M., Ameer, W., & Xu, H. (2018). The impact of institutional quality on foreign directinvestment inflows: evidence for developed and developing countries. Economic Research-Ekonomska Istra�zivanja, 31(1), 626–644. doi:10.1080/1331677X.2018.1438906
Prehn, S., Br€ummer, B., & Glauben, T. (2016). Gravity model estimation: fixed effects vs. ran-dom intercept Poisson pseudo-maximum likelihood. Applied Economics Letters, 23(11),761–764. doi:10.1080/13504851.2015.1105916
Richet, X. (2019). Geographical and Strategic Factors in Chinese Foreign Direct Investment inEurope. Asian Economic Papers, 18(2), 102–119. doi:10.1162/asep_a_00700
Sanfilippo, M. (2010). Chinese FDI to Africa: What is the nexus with foreign economic cooper-ation?. African Development Review, 22(S1), 599–614. doi:10.1111/j.1467-8268.2010.00261.x
Santos Silva, J. M. C., & Tenreyro, S. (2006). The log of gravity. The Review of Economics andStatistics, 88(4), 641–658. doi:10.1162/rest.88.4.641
Santos Silva, J. M. C., & Tenreyro, S. (2011). Further simulation evidence on the performanceof the poisson pseudo-maximum likelihood estimator. Economics Letters, 112(2), 220–222.doi:10.1016/j.econlet.2011.05.008
Tinbergen, J. (1962). Shaping the World Economy: Suggestions for an International EconomicPolicy. New York: The Twentieth Century Fund.
Voeten, E., Strezhnev, A., & Bailey, M. (2009). United Nations General Assembly voting data.Harvard Dataverse, V18. Retrieved from https://hdl.handle.net/1902.1/12379.
Westerlund, J., & Wilhelmsson, F. (2011). Estimating the gravity model without gravity usingpanel data. Applied Economics, 43(6), 641–649. doi:10.1080/00036840802599784
William, C. G., Agyapong, W. E., & Abass, A. (2013). Foreign direct investment and trade pol-icy openness in sub-Saharan Africa (MPRA Working Paper No. 58074 Issued in October2013). Retrived from https://mpra.ub.uni-muenchen.de/58074/.
42 D. G. BOROJO AND J. YUSHI

World Bank (2017). World Development Indicators 2017. Washington, DC. # World Bank. License:CC BY 3.0 IGO. Retrieved from https://openknowledge.worldbank.org/handle/10986/26447
World Bank (2017). Worldwide Governance Indicators 2017 # World Bank Group. Retrievedfrom https://datacatalog.worldbank.org/dataset/worldwide-governance-indicators.
Zhang, J., Jiang, J., & Zhou, C. (2014). Diplomacy and investment - the case of China.International Journal of Emerging Markets, 9(2), 216–235. doi:10.1108/IJoEM-09-2012-010
Appendix
The aggregate indicators in Table A2 are derived from 16 single variables using principal com-ponent analysis that aim to reduce the dimensionality in data. It changes the data into newaggregate variables. Each principal component is essentially the weighted average of the varia-bles included. The eigenvalues are the variances of the principal components. The first princi-pal component has the maximum variance for any of the combinations. Similarly, in all cases,the Kaiser-Meyer-Olkin Measure (K.M.O.) of sampling adequacy is used to check for theappropriateness of the P.C.A.
Table A1. Sources and definition of variables.Variable Source Definition
FDIcit China Africa Research Initiative (2017) Chinese FDI to African countriesgdpcai World Bank (2017) W.D.I. database Per capita GDP of African countriespopi CEPII (2015) The total population of the reporting countrygdpct World Bank (2017) W.D.I. database Per capita GDP of Chinadisict CEPII (2015) The distance between the capitals
of African countries and ChinaUNVict Voeten, Strezhnev & Bailey (2009) The diplomatic relationship between
China and African countriesinfit World Bank (2017) W.D.I. database Infrastructure quality of African countriesnaturalit World Bank 2017) W.D.I. database Natural resources depletion ratecredit World Bank (2017) W.D.I. database Credit to the private sectortradeict China Africa Research Initiative (2017) Africa–China Trade flowccit World Bank (2017) W.G.I. project Control of corruptionrlit World Bank (2017) W.G.I. project Rule of lawstabit World Bank (2017) W.G.I. project The absence of violence and instabilityvait World Bank (2017) W.G.I. project Voice and accountabilityrqit World Bank (2017) W.G.I. project Regulatory qualitygeit World Bank (2017) W.G.I. project Government effectivenesspolityit Marshall, Gurr and Jaggers (2017) Regime authority to consolidated democracysoundmoney Fraser Institute (2017) Sound moneyregulation Fraser Institute (2017) market regulationinvfree Heritage Foundation (2017) Investment freedom indexpropertyright Fraser Institute (2017) Property rightlegelaenfo Fraser Institute (2017) Legal enforcementtradeinter Fraser Institute (2017) Freedom of trade internationallycosts World Bank (2017) W.D.I. database The cost to start a businesscoste World Bank (2017) W.D.I. database The cost to enforce the contractcostr World Bank (2017) W.D.I. database The cost to register property rightmcbussiness World Bank (2017) W.D.I. database Minimum capital required to start the businessdocim World Bank (2017) W.D.I. database Document to importdocex World Bank (2017) W.D.I. database Document to exporttimport World Bank (2017) W.D.I. database Time to importtexport World Bank (2017) W.D.I. database Time to exportcexport World Bank (2017) W.D.I. database Cost to exportcimport World Bank (2017) W.D.I. database Cost to importexdeptit World Bank (2017) W.D.I. database Dept/GDP of African countries
ECONOMIC RESEARCH-EKONOMSKA ISTRAŽIVANJA 43

(b) Border and transport efficiencyComponent PC1 PC2
Eigenvalue 3.799 1.369Proportion 0.633 0.228Cumulative 0.633 0.861EigenvectorsVariable Vector 1 Vector 2 KMODocument to import 0.299 0.615 0.537Document to export 0.279 0.647 0.536Time to import 0.469 �0.078 0.695Time to export 0.464 �0.130 0.673Cost to import 0.445 �0.277 0.728Cost to export 0.446 �0.323 0.718Overall KMO 0.664
Table A2. Principal component analysis.(a) Doing business indexComponent PC1 PC2
Eigenvalue 1.749 1.058Variance Proportion 0.437 0.265Cumulative Proportion 0.437 0.702EigenvectorsVariable Vector 1 Vector 2 KMOMinimum capital required to start the business 0.491 �0.527 0.583The cost to start the business 0.563 �0.193 0.649The cost to enforce the contract 0.586 0.197 0.605The cost to register property right 0.314 0.804 0.49Overall KMO 0.595
(c) Political and governance indexComponent PC 1
Eigenvalue 4.565Proportion 0.761Cumulative 0.761EigenvectorsVariable Vector 1 KMOControl corruption 0.428 0.926Rule of law 0.448 0.850Regulatory quality 0.435 0.883Government effectiveness 0.433 0.872Absence of political instability 0.368 0.883Voice and accountability 0.322 0.904Overall KMO 0.883
Source: Authors’ calculations.
44 D. G. BOROJO AND J. YUSHI

Table A3. African countries included in the sample.Angola Guinea NigeriaBenin Gambia, The RwandaBurkina Faso Guinea-Bissau SudanBotswana Kenya SenegalIvory Coast Liberia Sierra LeoneCameroon Libya SeychellesCongo Republic Morocco ChadComoros Madagascar TogoCabo Verde Mali TunisiaDjibouti Mozambique TanzaniaAlgeria Mauritania UgandaEgypt Mauritius South AfricaEthiopia Malawi ZambiaGabon Namibia ZimbabweGhana Niger
Figure A1. Distribution of Chinese F.D.I. in Africa (Million U.S.D.).
ECONOMIC RESEARCH-EKONOMSKA ISTRAŽIVANJA 45