Embed Size (px)
Citation preview

DI
SC
US
SI
ON
P
AP
ER
S
ER
IE
S
Forschungsinstitut zur Zukunft der ArbeitInstitute for the Study of Labor
Does Institutional Quality Affect Firm Performance? Insights from a Semiparametric Approach
IZA DP No. 6351
February 2012
Sumon Kumar BhaumikRalitza DimovaSubal C. KumbhakarKai Sun

Does Institutional Quality Affect Firm Performance? Insights from a
Semiparametric Approach
Sumon Kumar Bhaumik Aston Business School, WDI and IZA
Ralitza Dimova
IDPM, University of Manchester and IZA
Subal C. Kumbhakar Binghamton University and Aston Business School
Kai Sun
Aston Business School
Discussion Paper No. 6351 February 2012
IZA
P.O. Box 7240 53072 Bonn
Germany
Phone: +49-228-3894-0 Fax: +49-228-3894-180
E-mail: [email protected]
Any opinions expressed here are those of the author(s) and not those of IZA. Research published in this series may include views on policy, but the institute itself takes no institutional policy positions. The Institute for the Study of Labor (IZA) in Bonn is a local and virtual international research center and a place of communication between science, politics and business. IZA is an independent nonprofit organization supported by Deutsche Post Foundation. The center is associated with the University of Bonn and offers a stimulating research environment through its international network, workshops and conferences, data service, project support, research visits and doctoral program. IZA engages in (i) original and internationally competitive research in all fields of labor economics, (ii) development of policy concepts, and (iii) dissemination of research results and concepts to the interested public. IZA Discussion Papers often represent preliminary work and are circulated to encourage discussion. Citation of such a paper should account for its provisional character. A revised version may be available directly from the author.

IZA Discussion Paper No. 6351 February 2012
ABSTRACT
Does Institutional Quality Affect Firm Performance? Insights from a Semiparametric Approach*
Using a novel modeling approach, and cross-country firm level data for the textiles industry, we examine the impact of institutional quality on firm performance. Our methodology allows us to estimate the marginal impact of institutional quality on productivity of each firm. Our results bring into question conventional wisdom about the desirable characteristics of market institutions, which is based on empirical evidence about the impact of institutional quality on the average firm. We demonstrate, for example, that once both the direct impact of a change in institutional quality on total factor productivity and the indirect impact through changes in efficiency of use of factor inputs are taken into account, an increase in labor market rigidity may have a positive impact on firm output, at least for some firms. We also demonstrate that there are significant intra-country variations in the marginal impact of institutional quality, such that the characteristics of “winners” and “losers” will have to be taken into account before policy is introduced to change institutional quality in any direction. JEL Classification: C14, D24, K31, O43 Keywords: institutional quality, firm performance, marginal effect, textiles industry Corresponding author: Sumon Kumar Bhaumik Economics and Strategy Group Aston Business School Aston University Birmingham United Kingdom E-mail: [email protected]
* We thank workshop participants at the University of Manchester, and conference participants at the ‘Workers, Businesses and Government: Understanding Labour Compliance in Global Supply Chains’ conference (October 2011, Washington, D.C.). The authors remain responsible for all remaining errors.

1 Introduction
It is well understood that the institutional environment in a country, which defines formal and
informal rules that economic agents have to adhere to when they interact with each other, affects
its economic performance. Efficient institutions reduce transactions cost and cost of enforcing
contracts, thereby facilitating transactions that, in turn, enhance economic performance. Re-
searchers have demonstrated that factors that characterize the economic environment, such as
property rights, legal institutions and labor market institutions affect not only macro variables
such as growth (Levine, 1998; Nickell & Layard, 1999; Acemoglu & Johnson, 2005), indeed
much more than factors such as geography and trade (Rodrik, et al, 2004), but also micro
variables such as firm performance (Dollar et al, 2005; Commander & Svejnar, 2011). In other
words, “good” institutional quality is essential for economic growth, and there is a conventional
wisdom about the nature of institutions that are desirable. A key problem that requires further
attention is that the genesis of this wisdom lies in evidence about the impact of institutional
quality on economic growth and unemployment in the average country or region, sales growth
(or some other performance measure) of the average firm, and unemployment duration of the
average laborer. The regression models from which the marginal effects of institutional quality
are calculated (i.e., the coefficients) do not allow them to vary across firm (country). Note that
here we interpret these constant regression parameters (marginal effects) as average effects or
effects on the average firm. The focus on the average obscures the fact that the characterization
of an institution as “good” or “bad” is a difficult exercise.
Consider, for example, the conventional wisdoms about labor market institutions. It has
been argued that lack of labor market flexibility, and the corresponding ability to hire and
fire laborers without incurring significant cost, can inhibit economic growth (Eichengreen &
Iversen, 1999), and increase the unemployment rate (Saint-Paul, 2004). From a macroeconomic
perspective therefore, flexible labor markets are desirable, and indeed this has been the popular
wisdom among policymakers for some time. Micro level evidence, however, suggest that the
“rigidity” of the labor market can have beneficial implications for the long term growth potential
of firms. Labor market rigidity induce firms to invest in training and on-the-job learning (Storm
& Naastepad, 2007). Indeed, part time labor contracts and short term labor contracts, that
are generally outcomes of labor market flexibility, are associated with significantly less work-
2

related training (Arulampalam & Booth, 2002). Available evidence also suggest that incentives
such as employment security can improve employee commitment, and are positively correlated
with performance enhancing strategies such as greater investment in R&D and new technology
(Michie & Sheehan, 1999).
Similarly, conventional wisdom suggests that social safety nets such as significant or pro-
longed unemployment benefits have undesirable impact on the magnitude and duration of un-
employment (Katz & Meyer, 1990). In political discourse, therefore, it has become stylized to
think of reduction in social safety nets as providing incentives that reduce (long term) unem-
ployment. However, this popular wisdom does not take into account the possible impact of
social safety nets on long term productivity of the laborers and their ability to bear search costs
that can enhance x-efficiency. It is well understood by development economists that if income
shocks resulting from unemployment significantly reduces nutritional intake, the productivity
of the laborers, and hence likelihood of gaining employment, are adversely affected (Dasgupta,
1993). These benefits also enable out-of-work laborers to bear the search cost of finding em-
ployment that are consistent with their skills, thereby enhancing post-employment x-efficiency.
Indeed, Acemoglu and Shimer (2000) demonstrate that an increase in unemployment insurance
increases labor productivity by encouraging laborers to look for high productivity jobs and also
by encouraging firms to create such jobs.
From the above discussion, it is evident as to why it would be imprudent to make a judg-
ment about the desirability of an institution on the basis of its impact on the headline economic
performance measures (e.g., growth and unemployment rates) of the average country or region
or firm. Institutions that characterize social safety nets, for example, may have considerably
different impact on countries, depending on factors such as the availability of non-wage sources
of income and consumption. Further, within countries, the impact of institutions might differ
considerably across economic agents such as firms, depending on their characteristics such as
size and ownership. In other words, greater insight into the impact of institutions on economic
performance requires that we examine both within-country distributions of the impact of insti-
tutional quality on performance of microeconomic agents such as firms, as well as the differences
in these distributions across countries. More generally, the discussion has to involve more than
the point estimates of the impact of these institutions on the performance of the average firm.
3

The standard regression models with constant coefficients (in a linear (or log-linear) models)
can not address heterogeneity in the marginal effects across firms (countries).
In this paper, we use a novel methodology that treats institutions and firm characteristics
such as ownership as facilitating factors that can have an impact on both total factor produc-
tivity, as well as on the efficiency with which factor inputs are used. The methodology allows us
to estimate the impact of institutional quality on the performance of individual firms, thereby
allowing us to examine within-country distributions of this impact, and to compare the distribu-
tions across countries. In contrast, the use of standard regression will give coefficients that are
exactly the same for firms and all countries, such that the marginal effect of each institutional
variable will be the same for all firms within and across countries. This is clearly very restric-
tive. We focus on three different institutions, namely, a measure of the overall environment in
which firms operate, a measure of labor market flexibility, and a measure of the quality of a
country’s social safety net. For our estimation, we use data from the textile industry in in which
developing countries (where institutional quality matters more at the margin than in developed
countries) have comparative advantage.
Our results suggest two important things that bring into question the veracity of the conven-
tional wisdom about the desirable characteristics of institutions, and hence about the desirable
direction of change of institutional quality in developing countries. First, our results suggest
that the marginal impact of institutional quality on firm performance varies significantly within
countries. Hence, any change in institutional quality for the “better”, based on conventional
wisdom, could have winners and losers, such that the overall impact on headline variables such
as economic growth would depend on the distribution of these marginal impacts. Policymakers
might also have to take into account whether the losers, if any, belong disproportionately to
vulnerable groups such as small and medium enterprises. Second, they indicate that conven-
tional wisdom about the desirable characteristics of institutions may have to be re-evaluated,
especially once both the direct impact of institutions on firm performance through total fac-
tor productivity and the indirect impact through efficiency of use of factor inputs are taken
into account. An increase in labor market rigidity may have a positive impact on firm output,
for example. The contribution of our paper, therefore, is twofold: (a) it provides prima facie
evidence that the empirical results that form the basis of conventional wisdom about the devel-
4

opment of market institutions may not stand up to closer scrutiny, and (b) it suggests a novel,
and arguably more reliable, way to empirically examine the impact of institutions on economic
performance.
The rest of the paper is organized as follows: In Section 2, we discuss the empirical strategy.
The data are discussed in Section 3, and the empirical results in Section 4. The latter section
also highlights the key observations that can be made on the basis of our results. Section 5
concludes.
2 Empirical strategy
2.1 Stylized modeling approach
The stylized literature models firm performance as a linear function of among other things,
measures of institutional and governance quality. Bhaumik and Estrin (2007), for example,
model output (or sales) as a function of firm-specific characteristics such as factor inputs and
ownership, as well as institutional (and economic) characteristics of the regions in which the
firms are located. In other words, output of the ith firm is given by
Yi = f(Xi, Zi) (1)
where y is output (or sales), x is a vector of factor inputs and other firm level characteristics,
and E is a vector of region or country level institutional features that are common to a number
of firms. Under the assumption of Cobb-Douglas functional form, this yields the following linear
regression model:
Yi = θ0 + Θ′Xi + Φ
′Ei + ui (2)
where ui is the iid error term.1 In effect, therefore, the regression model estimates the impact
of the institutional characteristics on total factor productivity (TFP) growth2 of the average
firm.
1In this specification, Y is generally the natural logarithm of output while each component of the X vector isnatural logarithm of the factor inputs. But we continue with the same notation for the sake of continuity.
2In a standard Cobb-Douglas model (without any institutional characteristics) the intercept term is oftenviewed as total factor productivity growth because it represents residual output growth rate, i.e., the outputgrowth after subtracting the contribution of inputs. Thus, in the formulation above in (2) TFP would be
captured by θ0 + Φ′Ei. In this formulation TFP varies with firm but the contribution of a particular E variable
on TFP growth will be constant for all firms.
5

This approach has two important shortcomings. First, as discussed above, it does not
capture the impact of institutional quality on individual firms, even though it may have sig-
nificantly different impact on firm performance, depending on firm characteristics such as size
and ownership. A natural extension of this model would be to have a model that allows insti-
tutional quality variables to have firm-specific effect on TFP growth. A partial linear model
reformulation 2 would allow this.
Yi = θ0(Zi) + Θ′Xi + ui (3)
where Z is a vector of variables that include both the components of the E vector and firm-level
characteristics such as ownership. In this formulation θ0 is a nonparametric function of the Z
variables, such that these environmental factors are allowed to affect TFP growth in a flexible
manner in the sense that these effects do not rely on any functional form of θ0. Furthermore,
the effect of one Z variable (say Zk) on TFP growth will also depend on the level of all the Z
variables (Zk, k = 1, · · ·K). This captures non-linearity in the institutional variables and TFP
growth relationship, as well as their cross-effects.
Although the above model captures non-linearity and cross-effects of the Z variables on
productivity, the overall effect of these Z variables is neutral to the standard inputs X. That
is, the partial linear model fails to take into account the fact that the firm characteristics and
institutional factors can affect productivity through the efficiency with which factor inputs are
converted into output. Put differently, the institutional quality variables not only affects TFP,
but also the productivity of factor inputs such as labor and capital. The model in (3) captures
the direct effect of the Z variables. There can, however, be an indirect effect. For example,
labor institutions are much more likely to affect productivity through improved training and
x-efficiency (indirect effect) than through the direct effect. In other words, the empirical rela-
tionship between output and inputs should ideally capture the way in which both institutional
quality and firm characteristics such as size and quality affect both the efficiency with which
factor inputs are used and the direct effect. To accommodate this, we reformulate the model in
equation 2 as:
Yi = θ0(Zi) + Θ′(Zi)Xi + ui (4)
6

where Z is a vector of variables that include both the components of the E vector and firm-level
characteristics such as ownership. Note that in this model TFP growth will depends on the X
variables. That is, TFP growth is not necessarily neutral and the neutrality hypothesis can be
econometrically tested. The econometrics of this new modeling approach is discussed next in
the following section.
2.2 Formulation of the new non-neutral TFP model
In line with the above discussion, we write the production function in more general form, viz.,
Yi = E(Yi|Xi, Zi) + ui (5)
where Yi denotes the natural logarithm of a scalar output for the ith observation, Xi is a k-vector
of log of inputs, Zi is a q-vector of environmental factors, ui is an iid noise term.
2.2.1 Neutral TFP growth model
First, we specify E(Yi|Xi, Zi) as
E(Yi|Xi, Zi) = θ(Zi) +X ′iβ (6)
where θ(·) denotes an unknown smooth (i.e., nonparametric) function, and β denotes a k-vector
of parameters. This specification is popularized by Robinson (1988) and is in line with the TFP
model used in Griffith, et al (2004). The parameters in this specification are of most interest
since they can be interpreted as input elasticities. This specification implies that
Yi = θ(Zi) +X ′iβ + ui (7)
To estimate β, we take the conditional expectation E(·|Zi) for both sides of (7),
E(Yi|Zi) = θ(Zi) + E(X ′i|Zi)β + E(ui|Zi) (8)
7

Subtracting (8) from (7) would yield
Y ∗i = X∗′
i β + ui (9)
assuming E(ui|Zi) = 0, where Y ∗i = Yi−E(Yi|Zi) and X∗′
i = (Xi−E(Xi|Zi))′. One would then
be able to estimate β using ordinary least squares, assuming E(X∗i ui|Zi) = 0:
β̂ =
(n∑
i=1
X∗iX∗′i
)−1 n∑i=1
X∗i Y∗i (10)
where n denotes sample size. Note that one could empirically estimate E(Yi|Zi) and E(Xi|Zi)
using Nadaraya-Wastson kernel estimator as∑
iK(Zi, z)Ti/∑
iK(Zi, z), where Ti ∈ {Xi, Yi},
K(·) denotes a product kernel function, and z denotes the datum at which the kernel function
is evaluated.
2.2.2 Non-neutral TFP growth model
The previous model allows the Z variables to explain TFP growth in a fully flexible manner.
The only limitation of the model is that the Z variables affect TFP growth in a neutral fashion.
The specification we use in this section allows indirect effects via the input elasticities which
are affected by the Z variables (Li et al. (2002) calls this semiparametric smooth coefficient
model because it allows the β coefficients to be some unknown smooth functions of Zi). Here
the conditional expectation is written as
E(Yi|Xi, Zi) = θ(Zi) +X ′iβ(Zi)
= W ′iγ(Zi)
(11)
where both θ(·) and β(·) denote unknown smooth functions of the Z variables, W ′i = [1 X ′i],
γ′(Zi) = [θ(Zi) β′(Zi)], both Wi and γ(Zi) are of dimension (k + 1) × 1. This specification
implies that
Yi = W ′iγ(Zi) + ui (12)
8

Pre-multiplying (12) by Wi and taking the conditional expectation E(·|Zi) would yield
E(WiYi|Zi) = E(WiW′i |Zi)γ(Zi) (13)
assuming E(Wiui|Zi) = 0. One would then be able to employ kernel method to estimate γ(Zi)
as
γ̂(z) =
[n∑
i=1
WiW′iKh(Zi, z)
]−1 n∑i=1
WiYiKh(Zi, z) (14)
where Kh(·) denotes generalized product kernel function (Li & Racine, 2006), z denotes the da-
tum at which the kernel function is evaluated, h denotes the bandwidth parameter, which can be
selected via the least-squares cross-validation method (Li & Racine, 2010) by minimizing the ob-
jective function∑n
i=1[Yi−W ′i γ̂−i(Zi)]2M(Zi), whereW ′i γ̂−i(Zi) = W ′i
[∑nj 6=iWjW
′jKh(Zj , zi)
]−1∑nj 6=iWjYjKh(Zj , zi) is the leave-one-out kernel conditional mean, and 0 ≤M(·) ≤ 1 is a weight
function that serves to avoid difficulties caused by dividing by zero.
2.2.3 Constrained non-neutral TFP growth model
While the semiparametric specification of Li et al (2002) is more flexible, the price one has to
pay for the flexibility is the higher probability of empirical violations of economic conditions.
In estimating a flexible model, one cannot guarantee positive estimates of input elasticities
for each observation. Negative input elasticity implies negative marginal products, which is
counter-intuitive. To overcome this shortcoming, we propose a constrained semiparametric
smooth coefficient model, where we are able to guarantee that all the input elasticity estimates
are non-negative. To do this, we rewrite (14) as
γ̂(z) =n∑
i=1
Ai(Wi, Zi, z)Yi (15)
where Ai(·) = [∑
iWiW′iKh(Zi, z)]
−1WiKh(Zi, z). The idea of imposing the observation-
specific constraints is simply re-weighting each observation of the dependent variable, Yi. To do
this, we rewrite (15) as
γ̂(z) = n ·n∑
i=1
Ai(Wi, Zi, z) · pu · Yi (16)
9

where pu = n−1 denotes the uniform weights. The unconstrained semiparametric smooth co-
efficient estimator is given in (16). To impose the constraints, we can write the constrained
estimator as
γ̂∗(z) = n ·n∑
i=1
Ai(Wi, Zi, z) · pi · Yi (17)
where γ̂∗(z) denotes the constrained smooth coefficient estimator, pi denotes the observation-
specific weights, and∑
i pi = 1. To select optimal pi, we follow the Racine et al (2011) approach
and minimize the L2 norm criterion function:
∑i
(pi − pu)2
subject to β̂(z) ≥ 0
(18)
This is a quadratic programming procedure. We used the quadprog package in R to solve for
optimal pi. Since we observed some economic violations (i.e., negative marginal product) in our
application, we applied this approach to impose the constraints on each smooth coefficient.3
3 Data
For the empirical exercise, we bring together data from three different sources. The firm-
level data on measures of output and input, size and ownership are obtained from the World
Bank Enterprise Surveys which collect data from manufacturing sector firms from around the
world. The surveys use standardized survey instruments, making data from different countries
comparable. We pool together cross-section data sets from countries that were surveyed between
2002 and 2005. Nominal variables used for the estimation of the production function were
converted into real US dollars, thereby making them comparable across the countries.
The firm level data set also gives us our measure of firm size which is a categorical variable
that ranks firms on a 5-point scale. The categories themselves are based on the number of
employees. It also gives us our control for ownership. We have continuous data for proportion
of a firm that is owned by the state, domestic private investors and foreign investors. However,
with a few exceptions, the largest shareholder of each firm whether the state, domestic private
or foreign owned close to 100 percent of the shares. Hence, instead of using the continuous
3R codes for imposing these constraints are available from the authors upon request.
10
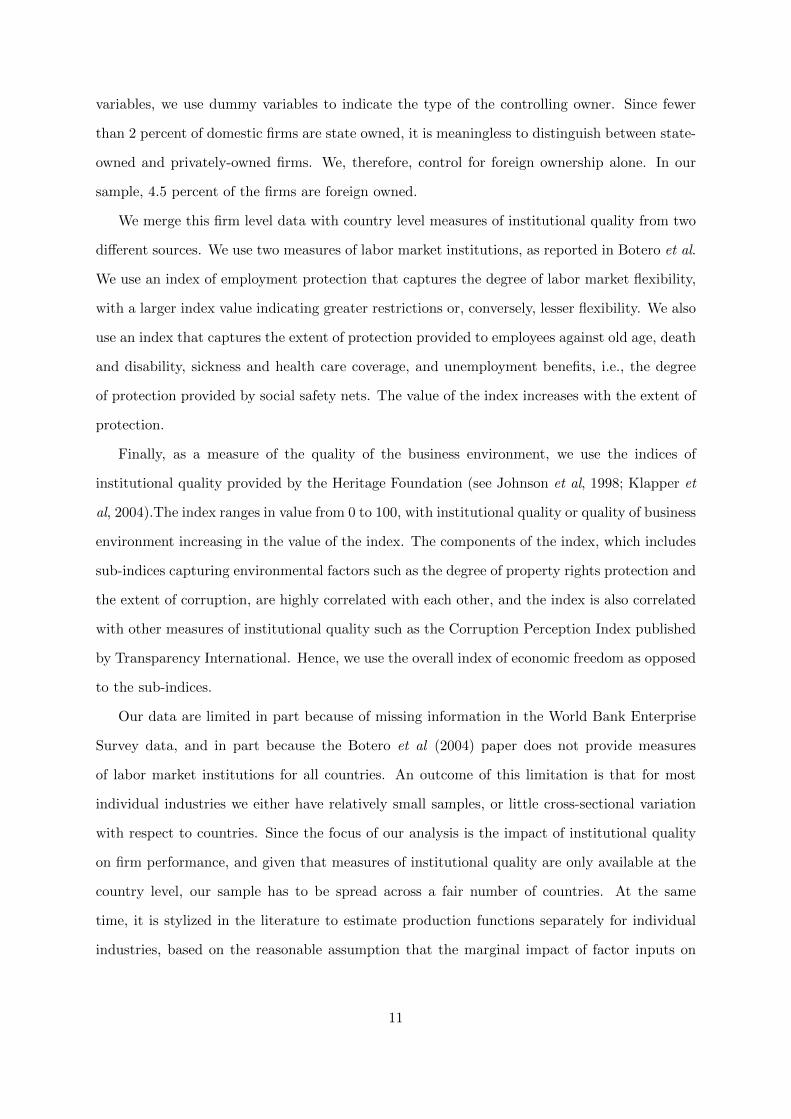
variables, we use dummy variables to indicate the type of the controlling owner. Since fewer
than 2 percent of domestic firms are state owned, it is meaningless to distinguish between state-
owned and privately-owned firms. We, therefore, control for foreign ownership alone. In our
sample, 4.5 percent of the firms are foreign owned.
We merge this firm level data with country level measures of institutional quality from two
different sources. We use two measures of labor market institutions, as reported in Botero et al.
We use an index of employment protection that captures the degree of labor market flexibility,
with a larger index value indicating greater restrictions or, conversely, lesser flexibility. We also
use an index that captures the extent of protection provided to employees against old age, death
and disability, sickness and health care coverage, and unemployment benefits, i.e., the degree
of protection provided by social safety nets. The value of the index increases with the extent of
protection.
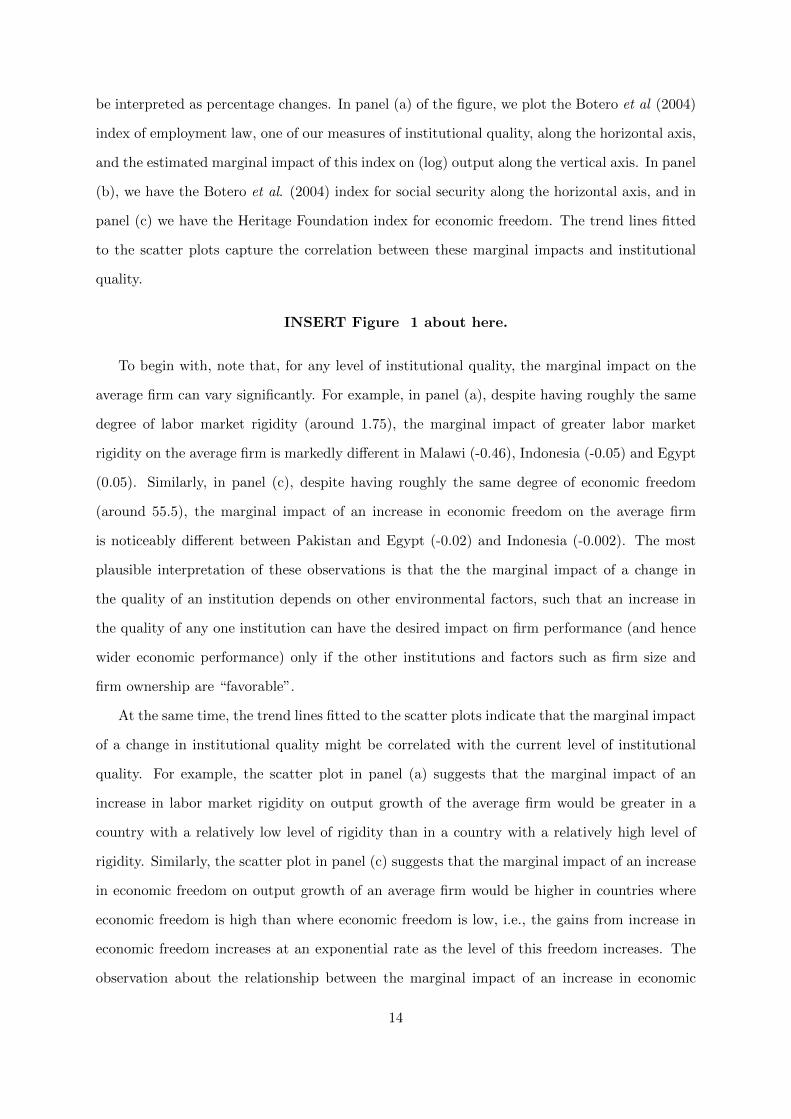
Finally, as a measure of the quality of the business environment, we use the indices of
institutional quality provided by the Heritage Foundation (see Johnson et al, 1998; Klapper et
al, 2004).The index ranges in value from 0 to 100, with institutional quality or quality of business
environment increasing in the value of the index. The components of the index, which includes
sub-indices capturing environmental factors such as the degree of property rights protection and
the extent of corruption, are highly correlated with each other, and the index is also correlated
with other measures of institutional quality such as the Corruption Perception Index published
by Transparency International. Hence, we use the overall index of economic freedom as opposed
to the sub-indices.
Our data are limited in part because of missing information in the World Bank Enterprise
Survey data, and in part because the Botero et al (2004) paper does not provide measures
of labor market institutions for all countries. An outcome of this limitation is that for most
individual industries we either have relatively small samples, or little cross-sectional variation
with respect to countries. Since the focus of our analysis is the impact of institutional quality
on firm performance, and given that measures of institutional quality are only available at the
country level, our sample has to be spread across a fair number of countries. At the same
time, it is stylized in the literature to estimate production functions separately for individual
industries, based on the reasonable assumption that the marginal impact of factor inputs on
11

output vary across industries, such that we require a reasonably large sample for each industry
that is analyzed. Only one industry textiles and garments meet both these criteria. It gives
us a cross-section of 1625 firms, spread across nine developing countries: Brazil, China, Egypt,
India, Indonesia, Malawi, Pakistan, South Africa and Zambia.
The textiles and garments industry however has characteristics that are quite suitable for
our analysis. To begin with, it is an industry in which developing countries have comparative
advantage. Recent estimates suggest that the ratio of the share of textiles and garments in
exports of individual developing countries to the ratio of textiles and garments in world exports is
significantly greater than one for many developing countries, indicating that developing countries
have a comparative advantage in these products (Nord̊as, 2004).
INSERT Table 1 about here.
At the same time, the nine countries in our sample also have quite different levels of insti-
tutional quality (Table 1). Consider, for example, economic freedom, which is our measure of
the quality of the business environment. At one extreme we have a country like South Africa
with an index of economic freedom that is 67.1, very close to the threshold of 70 for mostly
free countries, and at the other end we have India with an index value of 51.2, just above the
threshold of 50 below which lie the repressed countries. The indices capturing the quality (or
nature) of labor market institutions too vary significantly across the countries. At the one ex-
treme, we have countries such as South Africa (1.04) that have quite flexible employment laws,
and at the other extreme we have countries such as Brazil (2.40) where there is a fair degree
of rigidity. Similarly, in countries like Malawi (0) and Zambia (0.32) there is very little (or no)
protection for laborers in the form of social safety nets, and, at the other extreme, countries
like China (2.24) and Egypt (2.22) provide a fair degree of protection.
In other words, even though difficulties with the data require us to focus on one industry, the
chosen industry is one in which developing countries have comparative advantage, such that it is
important for export growth (and consequently employment generation) in these countries. It is
sufficiently large to provide significant variations across firms with respect to characteristics such
as size and ownership. It also includes data from nine countries that are significantly different
with respect to the quality (or nature) of their institutions. In other words, there is a fair
degree of variation in the values of Z vectors of the firms in our sample. Our empirical exercise,
12

discussed below, should therefore provide us with strong prima facie evidence about within
and between country variations in the impact of institutional quality on firm performance, our
proxy for performance of microeconomic agents within the economy.
4 Regression results
The regression results are reported in Table 2. To recapitulate, in neutral TFP model, the
intercept term is treated as a nonparametric function of institutional quality and firm char-
acteristics variables such as age, size and ownership. Hence, there is a separate estimate of
the intercept term for each observation. However, the coefficients of the factor inputs, namely,
materials, labor and capital do not vary across observations. On the other hand, in the SPSC
model, the coefficients of the factor inputs are also treated as nonparametric functions of the
institutional variables and firm characteristics. Hence, the estimates of the coefficients of the
factor inputs (and hence also the estimates of returns to scale) are observation-specific so long
as the Z variables are observation-specific. In Table 2, therefore, we report the distributions
of the aforementioned estimates.4 The coefficient estimates suggest that the returns to scale
for the median firm is 1.00, which is consistent with our expectations about returns to scale of
mature industries. The estimates also indicate that the median marginal contribution of capital
to the output firm is less than those of labor and material inputs, which is consistent with se-
lective evidence about significant investment in physical capital – specifically, power looms – in
textiles industries in developing countries (Bhaumik et al, 2008). Importantly, it is immediately
obvious that there is a fairly wide range of values for the estimated coefficients, even within a
single 3-digit industry, such that the use of a point estimate for the average (or the median)
firm is not very meaningful.
INSERT Table 2 about here.
In Figure 1, we plot the averages of marginal impact of institutional quality on (log) output
for each country in the sample, against institutional quality in these countries. We do so to
focus on heterogeneity of inter-country differences. Note that since the dependent variable is in
log and the institutional variables are indices, the marginal effects (when multiplied by 100) can
4When the model is estimated without imposing constraints to make the estimated marginal products non-negative, we find 0.53% violations for β1, 6.86% for β2, 2.44% for β3.
13
be interpreted as percentage changes. In panel (a) of the figure, we plot the Botero et al (2004)
index of employment law, one of our measures of institutional quality, along the horizontal axis,
and the estimated marginal impact of this index on (log) output along the vertical axis. In panel
(b), we have the Botero et al. (2004) index for social security along the horizontal axis, and in
panel (c) we have the Heritage Foundation index for economic freedom. The trend lines fitted
to the scatter plots capture the correlation between these marginal impacts and institutional
quality.
INSERT Figure 1 about here.
To begin with, note that, for any level of institutional quality, the marginal impact on the
average firm can vary significantly. For example, in panel (a), despite having roughly the same
degree of labor market rigidity (around 1.75), the marginal impact of greater labor market
rigidity on the average firm is markedly different in Malawi (-0.46), Indonesia (-0.05) and Egypt
(0.05). Similarly, in panel (c), despite having roughly the same degree of economic freedom
(around 55.5), the marginal impact of an increase in economic freedom on the average firm
is noticeably different between Pakistan and Egypt (-0.02) and Indonesia (-0.002). The most
plausible interpretation of these observations is that the the marginal impact of a change in
the quality of an institution depends on other environmental factors, such that an increase in
the quality of any one institution can have the desired impact on firm performance (and hence
wider economic performance) only if the other institutions and factors such as firm size and
firm ownership are “favorable”.
At the same time, the trend lines fitted to the scatter plots indicate that the marginal impact
of a change in institutional quality might be correlated with the current level of institutional
quality. For example, the scatter plot in panel (a) suggests that the marginal impact of an
increase in labor market rigidity on output growth of the average firm would be greater in a
country with a relatively low level of rigidity than in a country with a relatively high level of
rigidity. Similarly, the scatter plot in panel (c) suggests that the marginal impact of an increase
in economic freedom on output growth of an average firm would be higher in countries where
economic freedom is high than where economic freedom is low, i.e., the gains from increase in
economic freedom increases at an exponential rate as the level of this freedom increases. The
observation about the relationship between the marginal impact of an increase in economic
14

freedom and the level of economic freedom itself is largely consistent with the conventional
wisdom that is based on results derived from variations of equation (2). But the implication
for the impact of an increase in labor market rigidity is not as clear. In our case, the marginal
impact of an increase in this rigidity on the output growth of the average firm is positive for
countries with low levels of rigidity, i.e., firms in these countries could benefit from greater labor
market rigidity. This observation runs counter to the conventional wisdom about the impact
of labor market rigidity, but is perfectly plausible if a low level of labor market rigidity reflects
the presence of a widespread informal sector, and if replacement of informal with formal sector
inevitably increases labor market rigidity.
Observation 1. The impact of an increase in institutional quality on firm performance may
be non-monotonic and non-linear. In some cases, benefits (measured, for example, as output
growth) can be substantial but only if the level of institutional quality exceeds some threshold. In
some other cases, by contrast, firms may benefit from what conventional wisdom would suggest
is a reduction in institutional quality.
INSERT Figure 2 about here.
Thus far, we have focused on the marginal impact of changes in institutional quality on the
average firm in the countries in our sample. However, from Table 2, we have already noted that
there can be considerable variations in the marginal impact across firms within each country.
To recapitulate, our methodology allows us to estimate the marginal impact of a change in
institutional quality on output growth of every firm in the sample. Therefore, in Figure 2,
we highlight the distributions of the firm level marginal impact of institutional qualities (on
output) for each of the countries in the sample. The vertical lines represent the distributions of
the firm level marginal impacts in each of the countries, and the red horizontal lines indicate the
means of the distributions that were used to generate the scatter plots in Figure 1. Consider
now panel (a), in which we highlight the distributions of the marginal impact of labor market
rigidity. Brazil, India and Indonesia have very similar average values of the marginal impact,
even though the underlying distributions are very different. Similarly, in panel (c), the averages
of the marginal impact of economic freedom (on output) are very similar for Malawi, South
Africa and Zambia, even though their underlying distributions are very different. These graphs
also suggest that it is perhaps not meaningful to focus on inter-country differences in the impact
15

of institutional quality on economic performance of micro agents; intra-country variation in this
impact could be much greater than inter-country differences in the average impact.
Observation 2a. The focus on the average impact of a change in institutional quality on firm
performance may be misleading. One has to consider the entire underlying distribution of the
impact of this change on firm level performance.
Observation 2b. Intra-country variations in the marginal impact of institutional quality on
firm performance may be greater than inter-country differences in the averages of these under-
lying country level distributions.
INSERT Figure 3 about here.
We then focus on the non-neutral model and, in Figure 3, we highlight the distributions
of the estimated firm-specific coefficients of the (log) labor and (log) capital variables (which
are labor and capital elasticities), and the associated firm-specific returns to scale. The input
elasticities are often interpreted as input share (cost share of inputs to the total value of output),
which holds under profit maximization behavior in a competitive market conditions (inputs and
output). The graphs once again demonstrate that there is considerable intra-country variation
in these estimates, in part reflecting the co-existence of smaller and less efficient firms and larger
efficient firms that has been discussed in studies about textiles industries in these countries (e.g.,
Bhaumik et al, 2008). The graphs also suggest that both intra- and inter-country variations
in the labor elasticity (share) is much greater than variations in the capital elasticity (share)
and in the estimates of returns to scale. This observation suggests that international trade in
capital goods may have led to convergence in productivity of capital across countries (at least
on average). It also suggests that since labor is less mobile across countries and is also more
heterogeneous both within and between countries, greater heterogeneity in labor productivity
persists within and across countries.
Observation 3. There is greater intra- and inter-country heterogeneity in the firm level labor
productivity, than in the productivity of capital and returns to scale at the firm level.
INSERT Figure 4 about here.
16

Next, as in Figure 1, we plot the averages of marginal impact of institutional quality on
output growth for each country in the sample, against institutional quality in these countries.
However, to recapitulate, in the non-neutral model, we take into consideration not only the
direct impact of a change in institutional quality on output through changes in total factor
productivity, but also the indirect impact through changes in the efficiency with which factor
inputs are used. It is easy to see that once these indirect effects are taken into consideration,
some of the key results derived from Figure 1 are reversed. For example, the scatter plot in
panel (a) of Figure 4 suggests that the marginal impact of an increase in labor market rigidity
on output growth of the average firm would be greater in a country with a relatively high level
of rigidity than in a country with a relatively low level of rigidity. By contrast, the scatter plot
in panel (c) suggests that the marginal impact of an increase in economic freedom on the output
growth of an average firm would be higher in countries where economic freedom is low than
where economic freedom is high, i.e., the gains from increase in economic freedom increases
at a diminishing rate. The implications of these reversals of results, relative to those reported
in Figure 1, are significant. If, as in our case, the marginal impact of an increase in labor
market rigidity is positive for higher levels of rigidity and negative for lower levels of rigidity,
policymakers can aim to raise the level of this rigidity beyond some threshold and benefit from
further tightening of employment laws thereafter. At the same time, the benefits from increasing
economic freedom beyond some threshold may not be significant. In other words, the results
based on the non-neutral model raise considerable doubts about the conventional wisdoms about
what constitutes the desirable direction of change and level of institutional quality.
Observation 4. Once both the direct impact of a change in institutional quality on firm per-
formance through total factor productivity and the indirect impact through impact on efficiency
of use of factor inputs are taken into consideration, the conventional wisdom about the desirable
direction of change and level of institutional quality requires re-evaluation.
INSERT Figure 5 about here.
Finally, in Figure 5, we highlight the intra-country distributions of the marginal impact
of institutional quality on output growth of firms, for the non-neutral model. As in the case
of Figure 2, for each country in the sample, the vertical lines represent the range of marginal
impact on firm level output growth, and the red horizontal lines represent the averages of
17

these distributions. These graphs confirm that intra-country variations within the distributions
of the marginal impact of institutional change on firm performance are greater than inter-
country differences in the associated averages. We tested the non-neutral model where all the
coefficients are nonparametric functions of the Z variables against a parametric model where
all the coefficients are linear parametric functions of the Z variables. Both models capture
observation-specific coefficients. However, the consistent model specification test proposed by
Li et al. (2002) showed that the non-neutral model is preferred for our application.
5 Conclusion
In this paper, we use a novel econometric approach to examine the impact of institutional
quality on firm performance in the textiles industry, across nine developing countries. Our
approach has two major advantages. First, we are able to estimate the marginal impact of
institutional quality on individual firms. Second, we are able to estimate not just the direct
impact of institutional quality on firm performance – output growth, in our case – but also the
indirect impact by way of the efficiency with which factor inputs are transformed into output.
Our results, which we discuss in the previous section, suggest the following:
• There is considerable intra-country variation in the marginal impact of institutional quality
on firm performance (i.e., output). Since, at any given point in time, institutional quality
is the same for all firms within a country, certainly for a given industry, this implies that,
ceteris paribus, institutional quality does not have the same impact on the performance
of all firms. In other words, while an improvement in institutional quality can enhance
performance of some firms, the impact may be low or indeed negative for many other
firms. This suggests that improvement in the quality of institutions may not be sufficient
for enhancing firm performance (measured in terms of change in output).
• Conventional wisdom about the desirable direction of changes in institutional quality, as
well as desirable levels of quality, requires re-evaluation. Our results indicate, for example,
that an increase in labor market rigidity may actually have a positive impact on output
growth of firms, if the level of rigidity is already fairly high. This is consistent with the
literature on the impact of labor market rigidity on training. At the same time, we find
18

that an increase in the degree of economic freedom may not have a significant impact on
output growth of firms once this freedom exceeds some threshold.
• While differences in institutional quality can affect the efficiency with which all factor
inputs are converted into output, and indeed the returns to scale at the firm level, the
efficiency of labor inputs are most affected. This is evident from Figure 3. Hence,
if policymakers have to prioritize the list of institutional deficiencies that they should
address, the institutions that can affect labor productivity may have to be given top
priority.
Our analysis does provide strong prima facie evidence that the issue of the impact of changes
in institutional quality on economic performance at the micro level requires closer examination,
especially in the context of policy decisions about desirable level and direction of change of
various institutions.
19

References
[1] Acemoglu, Daron & Johnson, Simon (2005). Unbundling institutions, Journal of Political
Economy 113, 949-995.
[2] Acemoglu, Daron & Shimer, Robert (2000). Productivity gains from unemployment insur-
ance, European Economic Review 44, 1195-1224.
[3] Arulampalam, Wiji & Booth, Alison L. (2002). Training and labour market flexibility: Is
there a trade off? British Journal of Industrial Relations 36, 521-536.
[4] Bhaumik, Sumon Kumar & Estrin, Saul (2007). How transition paths differ: Enterprise
performance in Russia and China, Journal of Development Economics 82, 374-392.
[5] Bhaumik, Sumon Kumar, Gangopadhyay, Shubhashis & Krishnan, Shagun (2008). Policy,
economic federalism, and product market entry: The Indian experience, European Journal
of Development Research 20, 1-30.
[6] Botero, Juan et al. (2004). The regulation of labor, Quarterly Journal of Economics 119,
1339-1382.
[7] Commander, Simon & Svejnar, Jan (2011). Business environment, exports, ownership, and
firm performance, Review of Economics and Statistics 93, 309-337.
[8] Dasgupta, Partha (1993). An Inquiry into Well-Being and Destitution, New York: Oxford
University Press.
[9] Dollar, David, Hallward-Driemeier, Mary & Mengistae, Taye (2005). Investment climate and
firm performance in developing countries, Economic Development and Cultural Change 54,
1-31.
[10] Eichengreen, Barry & Iversen, T. (1999). Institutions and economic performance: Evidence
from the labour market, Oxford Review of Economic Policy 15, 121-138.
[11] Griffith, Rachel, Redding, Stephen & Van Reenen, John (2004). Mapping the two faces
of R&D: Productivity growth in a panel of OECD industries, Review of Economics and
Statistics 86, 883-895.
20

[12] Johnson, Simon, Kaufman, Daniel & Zoido-Lobaton, Pablo (1998). Regulatory discretion
and the unofficial economy, American Economic Review 88, 387-392.
[13] Katz, Lawrence & Meyer, Bruce (1990). The impact of the potential duration of unemploy-
ment benefits on the duration of unemployment, Journal of Public Economics 41, 45-72.
[14] Klapper, Leora, Laeven, Luc & Rajan, Raghuram (2004). Business environment and firm
entry, Working paper no. 3232, The World Bank, Washington, D.C.
[15] Levine, Ross (1998). The legal environment, banks and long run economic growth, Journal
of Money, Credit and Banking 30, 596-613.
[16] Li, Qi, Huang, Cliff, Li, Dong & Fu, Tsu-tan (2002). Semiparametric smooth coefficient
models, Journal of Business and Economic Statistics 20, 412-422.
[17] Li, Qi and Racine, Jeffrey (2006). Nonparametric Econometrics: Theory and Practice,
Princeton University Press.
[18] Li, Qi and Racine, Jeffrey (2010). Smooth varying-coefficient estimation and inference for
qualitative and quantitative data, Econometric Theory 26, 1-31.
[19] Michie, Jonathan & Sheehan, Maura (1999). HMR practices, R&D expenditure and in-
novative investment: Evidence from the UKs 1990 workplace industrial relations surveys
(WIRS), Industrial and Corporate Change 8, 211-234.
[20] Nickell, Stephen & Layard, Richard (1999), Labor market institutions and economic perfor-
mance, In: Ashenfelter, Orley & Card, David (Eds.), Handbook of Labor Economics, Volume
3, Elsevier, Chapter 46, pp. 3029-3084.
[21] Nord̊as, Hildegunn (2004). The global textile and clothing industry post the agreement on
textiles and clothing, Discussion paper no. 5, World Trade Organization, Geneva, Switzer-
land.
[22] Racine, Jeffrey, Parmeter, Christopher & Du, Pang(2011). Constrained nonparametric ker-
nel regression: Estimation and inference, Unpublished manuscript, Binghamton University,
New York, USA, Downloadable from http://www.eco.uc3m.es/temp/Racine.pdf.
21

[23] Robinson, Peter (1988). Root-n-consistent semiparametric regression, Econometrica 56,
931-954.
[24] Saint-Paul, Gilles (2004). Why are European countries diverging in their unemployment
experience? Journal of Economic Perspectives 18, 49-68.
[25] Storm, Servaas & Naastepad, C.W.M. (2007). Why labour market regulation may pay off:
Worker motivation, coordination and economic growth. Economic and labour market paper
no. 2007/4, Employment analysis and research unit, International Labour Office, Geneva.
22

Table 1: Measures of institutional quality
Country Employment law Social security Economic freedom
Brazil 2.40 1.65 63.4China 1.62 2.24 52.6Egypt 1.62 2.22 55.5India 1.30 1.20 51.2Indonesia 1.75 0.53 55.8Malawi 1.72 0 54.7Pakistan 1.17 1.39 55.8South Africa 1.04 1.69 67.1Zambia 1.15 0.32 59.6
Table 2: Regression estimates
PercentileRobinson model SPSC model
Intercept Intercept (Log) materials (Log) labor (Log) capital Returns to scale
1st 0.84 0.54 0.12 0.001 0.18e-09 0.7810th 1.18 0.89 0.19 0.13 0.08 0.8725th 1.28 1.02 0.29 0.31 0.15 0.9550th 1.36 1.07 0.39 0.39 0.22 1.0075th 1.61 1.48 0.48 0.44 0.24 1.0290th 2.58 2.05 0.58 0.59 0.34 1.0699th 3.77 3.52 0.73 0.83 0.42 1.20
23
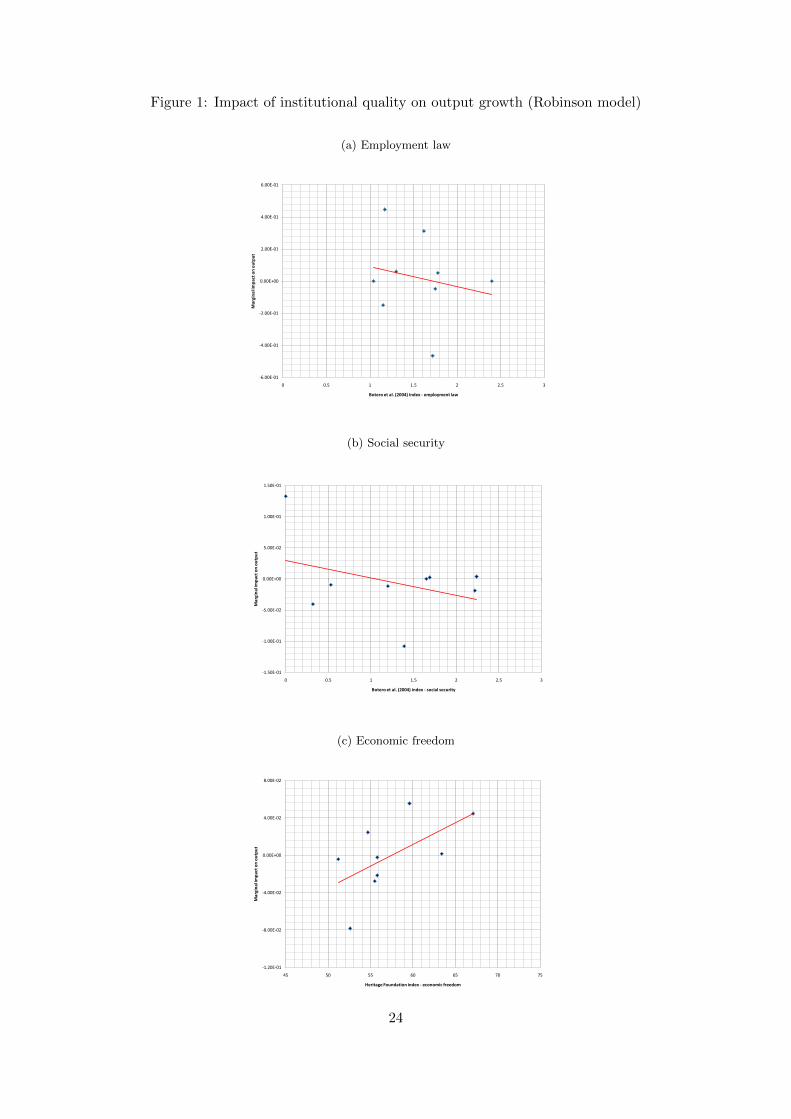
Figure 1: Impact of institutional quality on output growth (Robinson model)
(a) Employment law
-6.00E-01
-4.00E-01
-2.00E-01
0.00E+00
2.00E-01
4.00E-01
6.00E-01
0 0.5 1 1.5 2 2.5 3
Mar
gin
al im
pac
t o
n o
utp
ut
Botero et al. (2004) index - employment law
(b) Social security
-1.50E-01
-1.00E-01
-5.00E-02
0.00E+00
5.00E-02
1.00E-01
1.50E-01
0 0.5 1 1.5 2 2.5 3
Mar
gin
al im
pac
t o
n o
utp
ut
Botero et al. (2004) index - social security
(c) Economic freedom
-1.20E-01
-8.00E-02
-4.00E-02
0.00E+00
4.00E-02
8.00E-02
45 50 55 60 65 70 75
Mar
gin
al im
pac
t o
n o
utp
ut
Heritage Foundation index - economic freedom
24

Figure 2: Distribution of marginal impact of institutional quality (Robinson model)
(a) Employment law
-1.50E+00
-1.00E+00
-5.00E-01
0.00E+00
5.00E-01
1.00E+00
1.50E+00
Brazil China Egypt India Indonesia Malawi Pakistan South Africa Zambia
Botero et al. (2004) - employment law
(b) Social security
-1.00E+00
-5.00E-01
0.00E+00
5.00E-01
1.00E+00
1.50E+00
2.00E+00
Brazil China Egypt India Indonesia Malawi Pakistan South Africa Zambia
Botero et al. (2004) - social security
(c) Economic freedom
-4.00E-01
-3.00E-01
-2.00E-01
-1.00E-01
0.00E+00
1.00E-01
2.00E-01
3.00E-01
4.00E-01
Brazil China Egypt India Indonesia Malawi Pakistan South Africa Zambia
Heritage Foundation - economic freedom
25

Figure 3: Distribution of coefficient estimates and returns to scale (SPSC model)
(a) (Log) labour
0.00E+00
2.00E-01
4.00E-01
6.00E-01
8.00E-01
1.00E+00
1.20E+00
Brazil China Egypt India Indonesia Malawi Pakistan South Africa Zambia
Coefficient of (log) labour
(b) (Log) capital
0.00E+00
2.00E-01
4.00E-01
6.00E-01
8.00E-01
1.00E+00
1.20E+00
Brazil China Egypt India Indonesia Malawi Pakistan South Africa Zambia
Coefficient of (log) capital
(c) Returns to scale
0.00E+00
2.00E-01
4.00E-01
6.00E-01
8.00E-01
1.00E+00
1.20E+00
1.40E+00
1.60E+00
Brazil China Egypt India Indonesia Malawi Pakistan South Africa Zambia
Returns to scale
26
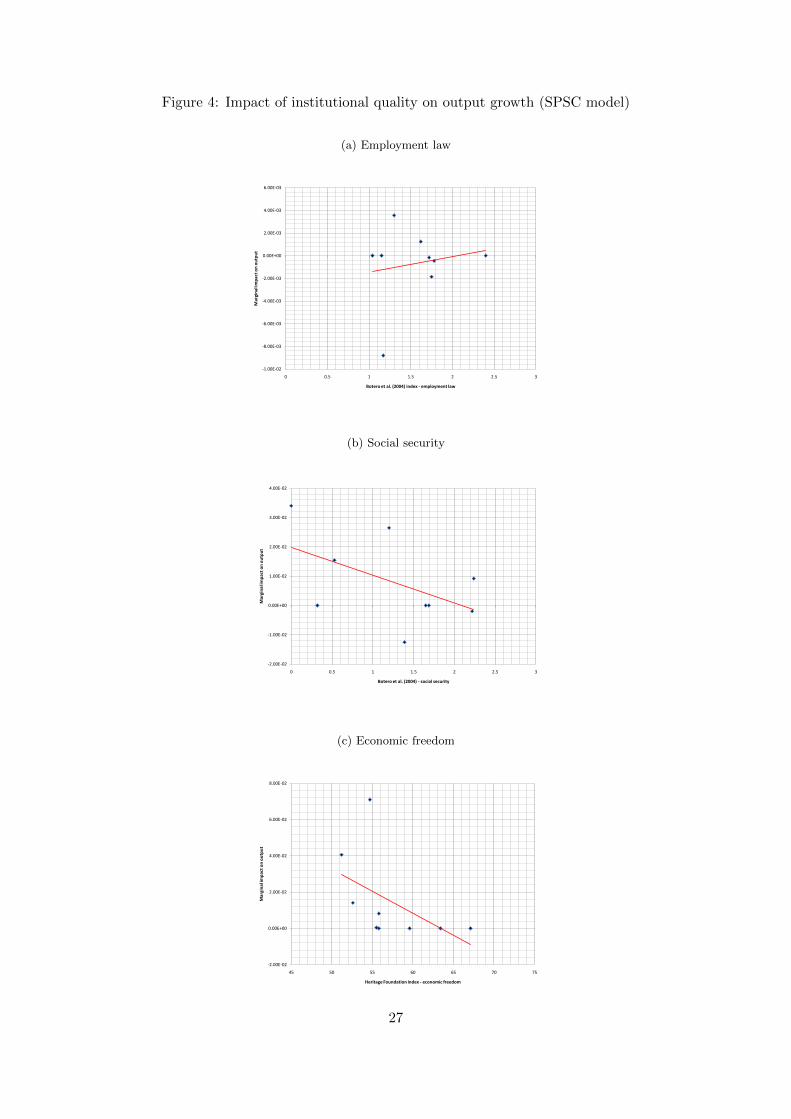
Figure 4: Impact of institutional quality on output growth (SPSC model)
(a) Employment law
-1.00E-02
-8.00E-03
-6.00E-03
-4.00E-03
-2.00E-03
0.00E+00
2.00E-03
4.00E-03
6.00E-03
0 0.5 1 1.5 2 2.5 3
Mar
gin
al im
pac
t o
n o
utp
ut
Botero et al. (2004) index - employment law
(b) Social security
-2.00E-02
-1.00E-02
0.00E+00
1.00E-02
2.00E-02
3.00E-02
4.00E-02
0 0.5 1 1.5 2 2.5 3
Mar
gin
al im
pac
t o
n o
utp
ut
Botero et al. (2004) - social security
(c) Economic freedom
-2.00E-02
0.00E+00
2.00E-02
4.00E-02
6.00E-02
8.00E-02
45 50 55 60 65 70 75
Mar
gin
al im
pac
t o
n o
utp
ut
Heritage Foundation index - economic freedom
27

Figure 5: Distribution of marginal impact of institutional quality (SPSC model)
(a) Employment law
-2.00E-01
-1.50E-01
-1.00E-01
-5.00E-02
0.00E+00
5.00E-02
1.00E-01
Brazil China Egypt India Indonesia Malawi Pakistan South Africa Zambia
Botero et al. (2004) - employment law
(b) Social security
-9.00E-01
-6.00E-01
-3.00E-01
-1.00E-16
3.00E-01
6.00E-01
9.00E-01
Brazil China Egypt India Indonesia Malawi Pakistan South Africa Zambia
Botero et al. (2004). - social security
(c) Economic freedom
-8.00E-01
-4.00E-01
0.00E+00
4.00E-01
8.00E-01
1.20E+00
Brazil China Egypt India Indonesia Malawi Pakistan South Africa Zambia
Heritage Foundation index - economic freedom
28