Embed Size (px)
Citation preview
American University in Cairo American University in Cairo
AUC Knowledge Fountain AUC Knowledge Fountain
Theses and Dissertations Student Research
2-1-2020
Foreign direct investment, institutional quality and business Foreign direct investment, institutional quality and business
regulatory environment: Evidence from Africa regulatory environment: Evidence from Africa
Nada Abdelghany
Follow this and additional works at: https://fount.aucegypt.edu/etds
Recommended Citation Recommended Citation
APA Citation Abdelghany, N. (2020).Foreign direct investment, institutional quality and business regulatory environment: Evidence from Africa [Master's Thesis, the American University in Cairo]. AUC Knowledge Fountain. https://fount.aucegypt.edu/etds/834
MLA Citation Abdelghany, Nada. Foreign direct investment, institutional quality and business regulatory environment: Evidence from Africa. 2020. American University in Cairo, Master's Thesis. AUC Knowledge Fountain. https://fount.aucegypt.edu/etds/834
This Master's Thesis is brought to you for free and open access by the Student Research at AUC Knowledge Fountain. It has been accepted for inclusion in Theses and Dissertations by an authorized administrator of AUC Knowledge Fountain. For more information, please contact [email protected].
The American University in Cairo
School of Global Affairs and Public Policy
Foreign Direct Investment, Institutional Quality and Business Regulatory
Environment: Evidence from Africa
A Thesis Submitted to the
Public Policy and Administration Department
in partial fulfillment of the requirements for the degree of
Master of Public Policy
Submitted By
Nada Abdelghany
Under the Supervision of
Dr. Ghada Barsoum, Ph.D.
Chair Department Public Policy and Administration
Fall 19
Abstract
Foreign direct investment (FDI) plays a significant role in both the economic growth and
development of a nation. Given Africa’s development and economic characteristics, FDI is an
attractive tool for economic development. Hence, understanding the key drivers of FDI is of
major importance to help promote the sustainable development of the private sector. This thesis
focuses on the interrelation between two key determinants of FDI inflows: institutional quality
and the business regulatory environment, while controlling for economic determinants
including the market and resource characteristics of a country. Using a panel of 46 countries
for the period 2012-2016, a mediation analysis is employed to examine the relationship
between an established governance index, as a proxy measure of institutional quality, using
Worldwide Governance Indicators (WGI) and the doing business score developed by the World
Bank (WB), as a proxy measure of business regulatory environment. The conditions of
mediation analysis were tested using a number of multivariate log-linear regression models.
The model is estimated using fixed effect panel regression analysis with robust cluster standard
error to account for homoscedasticity and serial autocorrelation. The data on the included
variables were gathered from publicly available resources. In line with literature such as
Globerman and Sharpio (2002) and Gani (2007), the findings of the study regarding the
relevance of governance index for FDI inflows showed a robust, consistent significance using
different estimation techniques. However, contrary to the literature such as Piwonski (2010)
and Morriz and Aziz (2011), the business regulatory environment did not demonstrate any
robust significance to FDI inflows. Though these findings result in a statistical rejection of the
main hypothesis, it does not constitute conclusive evidence that the business regulatory
environment does not mediate the effect of institutional quality on FDI inflows within the
African context. This is due to a concern regarding the validity of the doing business score
validity as a proxy for the business regulatory environment.

To
The 25th Jan Revolution, My Mother, My Sister
My Person,
&
To
All the Women and Girls around the world who fight every day for
their dreams, their families and their lives.

Acknowledgment
“Those who pursue a quest for knowledge, Allah shall ease their path to heaven”
I would like to start my acknowledgment by expressing my gratitude to Allah for making me
start and complete this journey, for being the god who inspires his worshipers to pursue a quest
for intellectual exploration. I pray that the knowledge I gained during my journey become of
benevolent use for humanity and the research community.
I am also thankful to my mother Hasnaa, who always supported my dreams and prayed for me
sincerely on whatever quest I pursue; my father Abdelghany, who challenged me during my
early years to always become the best version of myself; my siblings Mariam and Mahmoud
who always had unquestionable, though sometimes annoying, confidence that I will always
make my dreams come true and who have been a reason for me to actually do it. You all are
the truest meaning of a family with your unconditional support even when you have no idea
what is going on in my head.
To my partner and soulmate Erfan, who believes in me and my wild dreams and who keeps
pushing me out of my comfort zone. Thank you for all the late nights you stayed up with me via
skype while I was working on my thesis just to support me to keep moving forward and thank
you for being the go to whenever I needed to brainstorm a research idea or an analytical
understanding and for thoroughly proof-reading my thesis.
I am also grateful for all the professors at the GAPP school, in particular my supervisor Dr.
Ghada Barsoum, who is such an inspiration as a research guru and who is also an inspiration
when it comes to supporting her students and giving them the most honest advice. I am also
thankful to my readers’ committee: Dr. Shahjahan Bhuiyan and Dr. Rana Hendy and for their
valuable comments. I am indebted to all the intellectual minds who either taught or mentored
me during my journey: Dr. Laila Elbaradie, Dr. Khaled Abdelhaleem, Dr. Racha Helwa and
Dr. Hania Elsholokamy.
I am also indebted to Mr. Youssef ElJameel, who is my scholarship sponsor and whom this
journey would have never been possible if it were not for his kind generosity and his
commitment to community service, in particular to research and education.
I’d like to express my appreciation for my late maternal grandmother’s soul Reda, the first
female to go to university in her family, while being a wife and a mother, the first female to
work abroad in her family too and who was the reason that all her nieces were sent to school
to finish their education. The one who pushed my grandfather to complete his law degree while
being married and on full time job. Knowing how much you cherished education and how you
fought for women empowerment in your own way has kept me going when I was surrounded
by the doubting voices in the community that girls cannot go beyond their limit.
Lastly, I am thankful for all the beautiful souls who has been of great support during my
journey: Ahmad Khaled, Yosra Osama, Shilla Mirzaei, Amira Elbiltagy, Mahmoud Elrefaie,
Roqaya Zamzam, Eman Elhadry, Mays Abu Hegab, Rawda Ali, Ramy Refaat.

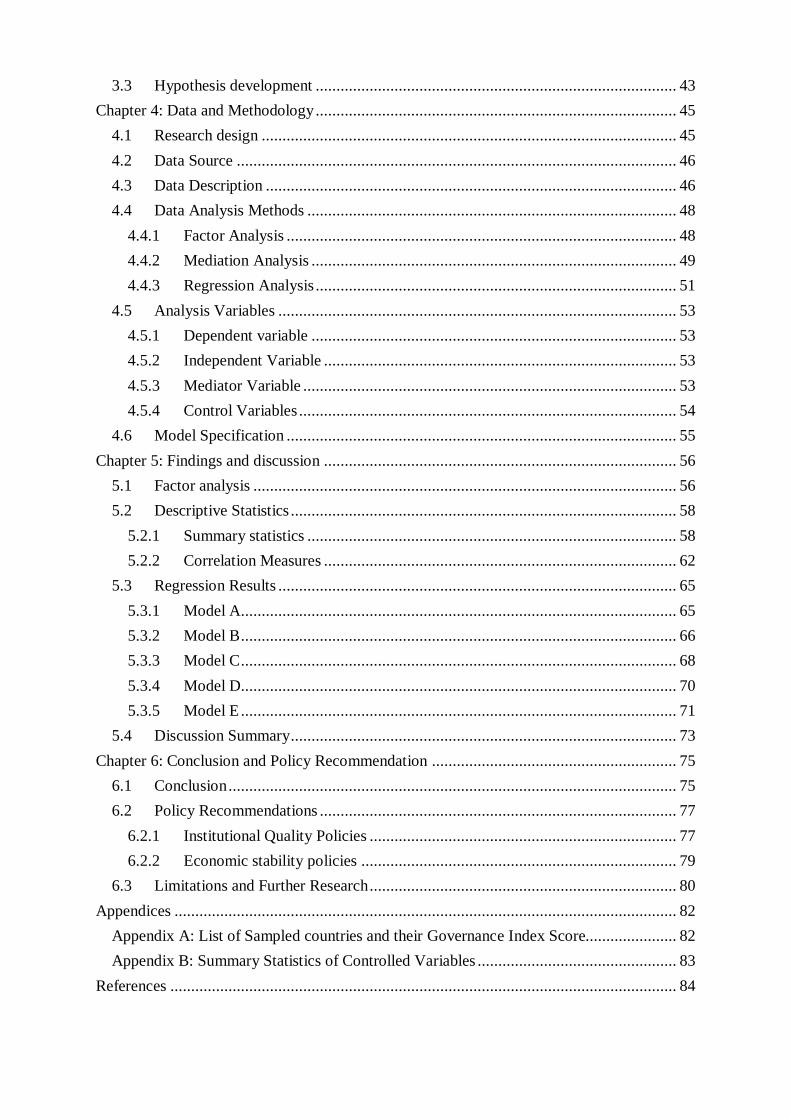
Table of Contents List of Table .......................................................................................................................... 7
List of Figures ....................................................................................................................... 8
List of Acronyms .................................................................................................................. 9
Chapter 1: Introduction ....................................................................................................... 10
1.1 Definition of Concepts .......................................................................................... 12
1.1.1 Foreign Direct Investment (FDI) .................................................................... 12
1.1.2 Governance .................................................................................................... 13
1.1.3 Ease of Doing Business .................................................................................. 18
1.2 Research Objective and Approach ......................................................................... 19
1.3 Research Question and Hypothesis ........................................................................ 19
1.3.1 Research Question ......................................................................................... 19
1.3.2 Main Hypothesis ............................................................................................ 20
1.4 Thesis Outline ....................................................................................................... 20
Chapter 2: Literature Review............................................................................................... 21
2.1 Theories on FDI Determinants. ............................................................................. 21
2.1.1 Conventional Theories ................................................................................... 21
2.1.1.1 Trade and Comparative Advantage Approach ......................................... 22
2.1.1.2 Finance and Capital Movement Approach ............................................... 23
2.1.1.3 Firm-Specific Approach .......................................................................... 24
2.1.2 Modern Theories ............................................................................................ 25
2.1.2.1 Theory of Internalization and Transaction cost ........................................ 25
2.1.2.2 The Eclectic Paradigm ............................................................................ 25
2.2 Empirical evidence on FDI determinants ............................................................... 28
2.2.1 Economic Determinants of FDI ...................................................................... 29
2.2.2 FDI and Institutional Quality.......................................................................... 29
2.2.3 FDI and Business Regulatory Environment .................................................... 33
2.3 Institutional Quality and Business Regulatory Environment .................................. 36
2.4 Literature Gap and Research Contribution ............................................................. 37
Chapter 3: Conceptual Framework ...................................................................................... 38
3.1 Location specific determinants Paradigm .............................................................. 38
3.2 Investment Climate ............................................................................................... 39
3.2.1 Institutional Quality ....................................................................................... 40
3.2.2 Business Regulatory Environment.................................................................. 40
3.2.3 Economic Determinants. ................................................................................ 41
3.2.3.1 Market Seeking ....................................................................................... 41
3.2.3.2 Resource Seeking. ................................................................................... 42
3.3 Hypothesis development ....................................................................................... 43
Chapter 4: Data and Methodology ....................................................................................... 45
4.1 Research design .................................................................................................... 45
4.2 Data Source .......................................................................................................... 46
4.3 Data Description ................................................................................................... 46
4.4 Data Analysis Methods ......................................................................................... 48
4.4.1 Factor Analysis .............................................................................................. 48
4.4.2 Mediation Analysis ........................................................................................ 49
4.4.3 Regression Analysis ....................................................................................... 51
4.5 Analysis Variables ................................................................................................ 53
4.5.1 Dependent variable ........................................................................................ 53
4.5.2 Independent Variable ..................................................................................... 53
4.5.3 Mediator Variable .......................................................................................... 53
4.5.4 Control Variables ........................................................................................... 54
4.6 Model Specification .............................................................................................. 55
Chapter 5: Findings and discussion ..................................................................................... 56
5.1 Factor analysis ...................................................................................................... 56
5.2 Descriptive Statistics ............................................................................................. 58
5.2.1 Summary statistics ......................................................................................... 58
5.2.2 Correlation Measures ..................................................................................... 62
5.3 Regression Results ................................................................................................ 65
5.3.1 Model A......................................................................................................... 65
5.3.2 Model B ......................................................................................................... 66
5.3.3 Model C ......................................................................................................... 68
5.3.4 Model D......................................................................................................... 70
5.3.5 Model E ......................................................................................................... 71
5.4 Discussion Summary ............................................................................................. 73
Chapter 6: Conclusion and Policy Recommendation ........................................................... 75
6.1 Conclusion ............................................................................................................ 75
6.2 Policy Recommendations ...................................................................................... 77
6.2.1 Institutional Quality Policies .......................................................................... 77
6.2.2 Economic stability policies ............................................................................ 79
6.3 Limitations and Further Research .......................................................................... 80
Appendices ......................................................................................................................... 82
Appendix A: List of Sampled countries and their Governance Index Score...................... 82
Appendix B: Summary Statistics of Controlled Variables ................................................ 83
References .......................................................................................................................... 84

7
List of Table
TABLE 1: ILLUSTRATION OF WGIS SIX DIMENSIONS ......................................................................... 16
TABLE 2: UNCTAD CRITERIA OF HOST COUNTRY DETERMINANTS OF FDI........................................ 27
TABLE 3: MEDIATION MODEL CONSTRUCTION ................................................................................. 52
TABLE 4: CONTROL VARIABLES DESCRIPTION. ................................................................................ 54
TABLE 5: CORRELATION MATRIX OF WGIS' DIMENSIONS IN AFRICAN COUNTRIES. ........................... 56
TABLE 6: FACTOR ANALYSIS SUMMARY OUTCOME PER YEAR ........................................................... 57
TABLE 7: SUMMARY STATISTICS OF GOVERNANCE INDEX PER YEAR ............................................... 58
TABLE 8: PANEL SUMMARY STATISTICS OF INDEPENDENT, DEPENDENT AND MEDIATOR VARIABLES 59
TABLE 9: CORRELATION MATRIX BETWEEN DEPENDENT, INDEPENDENT, MEDIATOR AND CONTROL
VARIABLES .............................................................................................................................. 63
TABLE 10: PEARSON CORRELATION BETWEEN GOVERNANCE SCORE AND LOG DOING BUSINESS SCORE
PER YEAR ................................................................................................................................. 64
TABLE 11: PEARSON CORRELATION BETWEEN LOG FDI INFLOWS AND GOVERNANCE SCORE PER YEAR
................................................................................................................................................ 64
TABLE 12: PEARSON CORRELATION BETWEEN LOG FDI INFLOWS AND LOG DOING BUSINESS SCORE
PER YEAR ................................................................................................................................. 64
TABLE 13: MODEL (A) ESTIMATION RESULTS .................................................................................. 66
TABLE 14: MODEL (B) ESTIMATION RESULTS .................................................................................. 67
TABLE 15: MODEL (C) ESTIMATION RESULTS .................................................................................. 69
TABLE 16: MODEL (D) ESTIMATION RESULTS .................................................................................. 71
TABLE 17: MODEL (E) ESTIMATION RESULTS ................................................................................... 72
TABLE 18: GOVERNANCE INDEX FOR AFRICAN COUNTRIES (2011-2015) .......................................... 82
TABLE 19: SUMMARY STATISTICS OF CONTROL VARIABLES ............................................................ 83
8
List of Figures
FIGURE 1: FDI TRENDS BY REGION (1990-2018) ............................................................................... 12
FIGURE 2: AUTHOR’S CONCEPTUAL MAP ........................................................................................ 44
FIGURE 3: SAMPLED AFRICAN COUNTRIES BY INCOME LEVEL OVER AFRICAN SUB-REGIONS. ........... 47
FIGURE 4: AVERAGE GOVERNANCE INDEX BY REGION VS. OVERALL GOVERNANCE INDEX AVERAGE
OVER TIME ....................................................................................................................................... 60
FIGURE 5: AVERAGE GOVERNANCE SCORE VS. MEDIAN GOVERNANCE SCORE OVER TIME .............. 60
FIGURE 6: AVERAGE FDI INFLOWS BY REGION VS. OVERALL FDI INFLOWS AVERAGE OVER TIME..... 61
FIGURE 7: AVERAGE DB SCORE BY REGION VS. OVERALL DB SCORE AVERAGE OVER TIME............. 62

9
List of Acronyms
ADB Asian Development Bank
AFDB African Development Bank
EDB Ease of Doing Business
FDI
FPI
Foreign Direct Investment
Foreign Portfolio Investment
GDP Gross Domestic Product
GMM Generalized Methods of Moments
HDR Human Development Report
IDI Infrastructure Development Index
IMF International Monetary Fund
MNCs Multinational Corporations
MNEs
OECD
Multinational Enterprises
Organization of Economic Cooperation and Development
OLS Ordinary Least Square
UN United Nations
UNCTAD United Nations Conference on Trade and Development
UNDP United Nations development
U.S. United States
WB World Bank
WDIs World Development Indicators
WGIs Worldwide Governance Indicators

10
Chapter 1: Introduction
There is a consensus amongst academics and practitioners that foreign direct investment (FDI)
contributes to the economic growth and development of any given country, mainly due to
capital accumulation and FDI spillover effects. This is particularly true for developing end
emerging economies (OECD, 2002; Reisen and Soto, 2001). Consequently, maintaining
enticing incentives that attract FDI inflows is a central concern on the national policy agenda,
especially developing countries. This picked the interests of scholars in identifying the main
determinants of FDI inflows and constructing governmental best policy practices to create a
conducive FDI ecosystem.
The eclectic paradigm is recognized as a comprehensive conceptualization of FDI determinants
that proposed location specific advantages, integrating it with internalization specific
advantages and ownership advantages (Dunning, 1977, 1980, 1993). This paradigm pioneered
a framework that integrated both micro and macro level factors responsible for influencing
Multinational Corporation’s (MNCs) decision to invest in a foreign country (Kinda, 2008).
Focusing on macro location specific advantages, a variety of studies investigated potential
determinants such as trade openness, tax incentives, market size, natural resources endowment,
human capital, macroeconomic stability, institutional quality and the investment climate
(Jadhav, 2012). However, over the past two decades, scholars glorified investment climate role
in attracting the lion share of FDI in developed countries. Based on Dunning (2003), it is argued
that the it is an important indicator for MNCs when deciding on their internalization specific
advantages as directly contributes to transaction costs.
According to the International Monetary Fund (IMF), investment climate is defined as “a set
of location specific factors shaping the opportunities and incentives for firms to invest in
productivity, create jobs and expand” (Smith & Driemier, 2005, p.40). Mansoor et al. (2018)
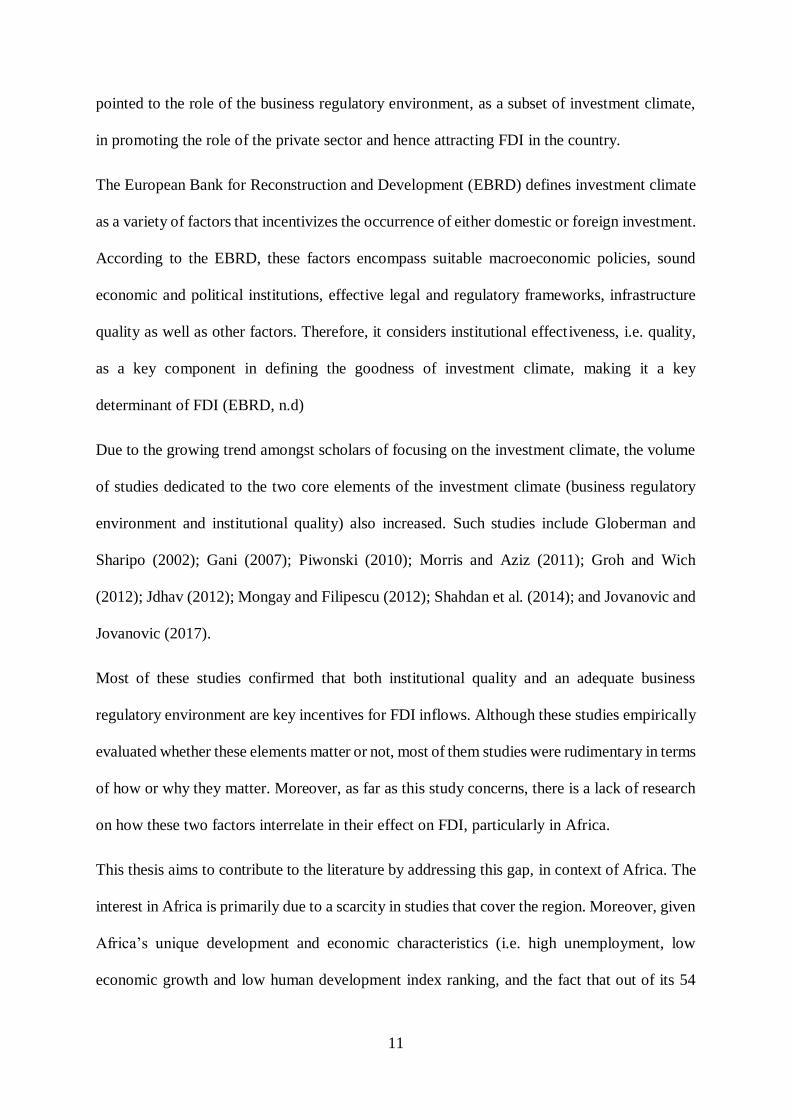
11
pointed to the role of the business regulatory environment, as a subset of investment climate,
in promoting the role of the private sector and hence attracting FDI in the country.
The European Bank for Reconstruction and Development (EBRD) defines investment climate
as a variety of factors that incentivizes the occurrence of either domestic or foreign investment.
According to the EBRD, these factors encompass suitable macroeconomic policies, sound
economic and political institutions, effective legal and regulatory frameworks, infrastructure
quality as well as other factors. Therefore, it considers institutional effectiveness, i.e. quality,
as a key component in defining the goodness of investment climate, making it a key
determinant of FDI (EBRD, n.d)
Due to the growing trend amongst scholars of focusing on the investment climate, the volume
of studies dedicated to the two core elements of the investment climate (business regulatory
environment and institutional quality) also increased. Such studies include Globerman and
Sharipo (2002); Gani (2007); Piwonski (2010); Morris and Aziz (2011); Groh and Wich
(2012); Jdhav (2012); Mongay and Filipescu (2012); Shahdan et al. (2014); and Jovanovic and
Jovanovic (2017).
Most of these studies confirmed that both institutional quality and an adequate business
regulatory environment are key incentives for FDI inflows. Although these studies empirically
evaluated whether these elements matter or not, most of them studies were rudimentary in terms
of how or why they matter. Moreover, as far as this study concerns, there is a lack of research
on how these two factors interrelate in their effect on FDI, particularly in Africa.
This thesis aims to contribute to the literature by addressing this gap, in context of Africa. The
interest in Africa is primarily due to a scarcity in studies that cover the region. Moreover, given
Africa’s unique development and economic characteristics (i.e. high unemployment, low
economic growth and low human development index ranking, and the fact that out of its 54

12
countries, 33 are classified among the least developing countries), there is a demand for greater
FDI. Hence, understanding the key factors driving FDI is of major importance to promote
sustainable development tools that are related to the promotion of a private sector.
Figure 1 shows how FDI has developed over time. Generally, it has been exhibiting a relatively
minor increase compared to the other regions.; Africa’s share has been increasing less than
average over the past 30 years. This trend highlights the importance of understanding the
determinants of FDI, the quality of those determinants in Africa and hence why FDI has thus
far escaped the region compared to its peers.
Figure 1: FDI trends by Region (1990-2018)
Source: Constructed by Author using UNCTAD FDI data set (1990-2018)
1.1 Definition of Concepts
1.1.1 Foreign Direct Investment (FDI)
The World Bank (WB) defines FDI as “a category of cross-border investments in which an
investor resident in one economy establishes a lasting interest in and a significant degree of
influence over an enterprise resident in another economy”.1 OECD quantifies such influence
as a minimum of 10% of both enterprise ownership and voting power, where voting power
1https://datahelpdesk.worldbank.org/knowledgebase/articles/114954-what-is-the-difference-between-foreign-
direct-inve

13
represents their management role. 2 In addition to equity stake affecting the degree of influence,
FDI components include investment in both indirectly and directly controlled enterprises,
investment in debt and reverse investment.
The WB classifies FDI as Inward direct investment and Outward direct investment, where
direct investment involve reallocation of both assets and liabilities. Inward investments are the
direct investment at the resident/reporting country by foreign investors while outward
investments are the direct investment of the resident/reporting country by local investors
abroad (World Bank, n.d).
It is worth mentioning that foreign portfolio investment “FPI” is not a component of FDI, where
the former constitutes passive investment in financial assets in the form of securities such as
bonds and stocks while the latter constitutes investment in both financial and non-financial
assets.
In other words, FPI is concerned with ownership and channeling funds only, while FDI is
concerned with both ownership and management authority, alongside channeling funds,
resources, innovation and technology knowhow.
This thesis focuses solely on Inward direct investment, hence any FDI connotation mentioned
later implies inward direct investment. In the methodology section, an explanation of how FDI
is measured in this study.
1.1.2 Governance
The notion of governance and its vital role in development was brought to attention and
popularized in the WB’s (1989) long-term, perspective study on Sub-Saharan Africa. The
report highlighted the role of governance in enhancing economic performance, along with
2 https://www.oecd-ilibrary.org/finance-and-investment/foreign-direct-investment-fdi/indicator-
group/english_9a523b18-en

14
private sector development and market mechanisms. In this study the WB defined governance
as “the exercise of political power to manage nations’ affairs” (World Bank, 1989, p.60).
In 1992, the WB’s annual report on governance and development formally defined governance
as “the manner in which power is exercised in the management of a country’s economic and
social resources for development”. The report stated three factors that conceptualize the notion
of governance: the political regime, the government’s capacity and capabilities and also how
authority is exercised. Later, WB (1994) listed four elements that could be used to evaluate
governance: “public sector management, accountability, a legal framework for development,
and information and transparency” (World Bank, 1994, p.XV).
The attempt to find an adequate definition of governance is not limited to the WB. Many
development-oriented organizations have expended resources trying to define governance, as
well as the key drivers which are responsible for its effectiveness, in pursuit of relevant criteria
for a targeted plan to promote economic development.
In 1995, the Asian Development Bank (ADB) proposed governance as a system of sound
development management, used to allocate both economic and social resources. ADB limited
its scope to efficient management. Hence, the main factors that constituted governance were
accountability, participation, predictability and transparency (ADB, 1995).
The UNDP defined governance as “the exercise of economic, political and administrative
authority to manage a country’s affairs at all levels. It comprises the mechanisms, processes
and institutions through which citizens and groups articulate their interests, exercise their
legal rights, meet their obligations and mediate their differences” (UNDP, 1997).
In their 1999 policy paper, the AFDB defined governance as “a process referring to the
manner in which power is exercised in the management of the affairs of a nation, and its
relations with other nations” (OCED,1999, p.2). In the same paper, they put forward elements

15
of good governance as accountability, transparency, fighting corruption, stakeholder
participation and the legal and judicial framework. Hence, governance encompasses both a
political dimension and a management dimension (OCED, 1999).
The above, stated definitions are concerned with the qualitative identification of governance
and its elements. Measuring governance, on the other hand, has been a key focus of the WB.
In a long standing research program by the World Bank Institute (WBI) and Brookings
institute, Kaufmann and Kraay produces annually the Worldwide Governance Indicators
(WGIs) using the WB governance survey. To comprehensively capture different governance
elements, Kaufman, Kraay and Mastruzi built on previous definitions of governance,
particularly those of the WB and advanced the definition of governance to “the traditions and
institutions by which the authority in a country is exercised” (Kaufmann et.al, 2011, p.4).
This definition captures 3 main elements of governance:
1. The nomination, accountability and replacement process of governments.
2. The Government’s effective aptitude to articulate and execute sound policies.
3. Citizens and state conformity to institutions ruling economic and social interactions
between them.
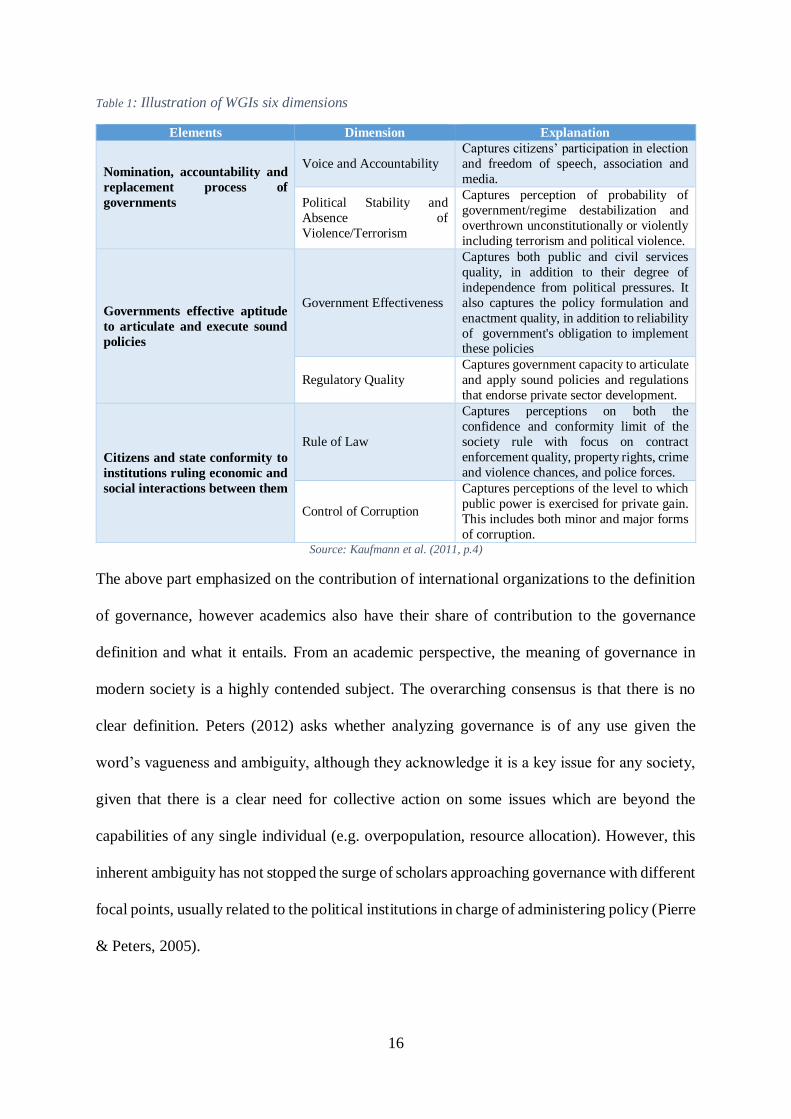
The developed WGIs were proposed to measure the above elements using six dimensions. The
six dimensions are: “voice and accountability, political stability and absence of violence /
terrorism, government effectiveness, regulatory quality, rule of law and control of
corruption” (Kaufmann et.al, 2011, p.4). An explanation of each dimension, along with each
element it captures is provided in table 1.
16
Table 1: Illustration of WGIs six dimensions
Elements Dimension Explanation
Nomination, accountability and
replacement process of
governments
Voice and Accountability
Captures citizens’ participation in election
and freedom of speech, association and
media.
Political Stability and
Absence of
Violence/Terrorism
Captures perception of probability of
government/regime destabilization and
overthrown unconstitutionally or violently
including terrorism and political violence.
Governments effective aptitude
to articulate and execute sound
policies
Government Effectiveness
Captures both public and civil services
quality, in addition to their degree of
independence from political pressures. It
also captures the policy formulation and
enactment quality, in addition to reliability
of government's obligation to implement these policies
Regulatory Quality
Captures government capacity to articulate
and apply sound policies and regulations
that endorse private sector development.
Citizens and state conformity to
institutions ruling economic and
social interactions between them
Rule of Law
Captures perceptions on both the
confidence and conformity limit of the
society rule with focus on contract
enforcement quality, property rights, crime
and violence chances, and police forces.
Control of Corruption
Captures perceptions of the level to which
public power is exercised for private gain.
This includes both minor and major forms
of corruption. Source: Kaufmann et al. (2011, p.4)
The above part emphasized on the contribution of international organizations to the definition
of governance, however academics also have their share of contribution to the governance
definition and what it entails. From an academic perspective, the meaning of governance in
modern society is a highly contended subject. The overarching consensus is that there is no
clear definition. Peters (2012) asks whether analyzing governance is of any use given the
word’s vagueness and ambiguity, although they acknowledge it is a key issue for any society,
given that there is a clear need for collective action on some issues which are beyond the
capabilities of any single individual (e.g. overpopulation, resource allocation). However, this
inherent ambiguity has not stopped the surge of scholars approaching governance with different
focal points, usually related to the political institutions in charge of administering policy (Pierre
& Peters, 2005).

17
For instance, Oxborne and Gaebler (1995) look at governance as the “business of government”,
whereas Fukuyama (2013) tackles governance by concentrating on the implementation of
public policy as opposed to the formulation of it by political actors. The author does this by
separating political ideology from the practical application of government, allowing him to
theorize about their empirical relationship. This is in contrast to Peters (2012), who seems to
suggest ‘good governance’ is linked to an open, democratic political system.
In the same paper, Fukuyama clearly tackles governance from a pragmatic perspective,
focusing on the features of actually carrying out policy. Fukuyama looks at governance through
4 objective measures: inputs, outputs, procedures and the degree of bureaucracy.
Pierre and Peters (2005) also condense governance into 4 elements, although their factors are
staged and goal-oriented. They suggest governance first involves codifying societal objectives
into policy goals; Then, balancing these goals in order to create prioritized policy agendas;
finding ways to achieve these goals and finally, holding the implementers accountable to
society at large. These two authors showcase two common, yet distinct, methods of measuring
governance found in the literature: practical and objective vs political and subjective.
In another paper, Fukuyama (2016) further highlights the practical aspect of governance by
suggesting public administration and governance are equivalent terms. In addition, he also went
on to emphasize the role of non-governmental actors in governance. Indeed, a greater number
of NGOs, think tanks and supranational organizations (e.g. European Union) are involved in
the political process. However, Fukuyama also brings up the importance of domestic networks
(e.g. pressure groups, activists) for monitoring social conduct. So although an initial inspection
of governance suggests it is associated with the actions of a formal government, some authors
highlight the role of non-state bodies as well. Stoker (1998) seems to validate this idea. Stoker
implies the heightened academic interest in governance is a result of an exploration into

18
whether, in this day and age, the resource allocation function of governments is actually worth
the resource commitment, bureaucracy and risk of corruption.
In summary, scholars seem to agree on the fact Governance has come to convey nothing at all
(Colebatch, 2009). Instead, it is used as a blanket term to describe all the elements involved in
public administration, whether they be the actors, practices or measurement tools.
Given the scope of this thesis, it adopts Kaufmann et al. (2011) definition on governance. This
is to better accommodate the data and measurement tools employed to quantitatively measure
governance, which serve as key components for the author’s research and addressing the
research question.
1.1.3 Ease of Doing Business
The ease of doing business “EDB” is an index developed by the WB annually, since 2003. It
is traced back Djankov et al. (2002) journal paper on “the regulation of entry” which measured
the ease of market entry in terms of cost and procedures for start-ups and related it to corruption.
EDB is not an economic indicator that reflects inflation or market growth, it is concerned
mainly with measuring the efficiency of regulations that are affecting business operations
directly.
The EDB assesses 10 topics, using 41 indicators for all of them. These 10 topics are starting a
business, dealing with construction permits, paying taxes, getting electricity, trading across
borders, registering property, enforcing contracts, getting credit, resolving insolvency, and
protecting minority investors. Most of the used sub-indicators are to measure procedures
complexity, time and cost. The index provides two measures: EDB score and EDB rank.
The EDB score, known before as ‘distance to frontier’, measures the difference between a
country’s business regulatory performance and business regulatory best practices. EDB rank
measures a country’s performance relative to each other, providing cross countries comparison.

19
The thesis utilizes only 8 topics of the EDB score to be used as a proxy of the business
regulatory environment as shall be furtherly elaborated in the conceptual framework.
1.2 Research Objective and Approach
The research objective of this thesis is explanatory, where the researcher attempts to explain
how governance relates to FDI with a focus on African countries. The approach adopted
involves using the OLI paradigm and North’s theory of institution to study the interrelation
between institutional quality and business regulatory environment on FDI. Institutional quality
is conceptualized using Kaufmann et al. definition of governance and is operationalized by a
governance index, constructed by the researcher using WGIs. Business facilitation is
conceptualized by the business regulatory environment and measured by the WB’s EDB score.
Both measures are used to investigate the effect of both institutional quality and business
facilitation, respectively, on FDI inflows, whilst controlling for relevant economic
determinants.
The thesis conducts a panel analysis of 46 African countries over the span of five years (2012-
2016) using secondary data from key organizations such as WB, African Development Bank
(AFDB), United Nations Development Programme (UNDP) and International Labour
Organization (ILO). To further the analysis, mediation analysis developed by Baron and Kenny
(1986) is also employed to address the research question and test the research hypotheses stated
in the following section.
1.3 Research Question and Hypothesis
1.3.1 Research Question
How does the business regulatory environment, measured by doing business score, affect the
relationship between FDI inflows and the institutional quality, measured by governance?

20
1.3.2 Main Hypothesis
The main thesis hypothesis is that “Business regulatory environment mediates the
relationship between institutional quality and FDI inflows.”
1.4 Thesis Outline
This thesis is divided into 6 chapters. The first chapter presents the introduction to the thesis,
highlighting the research objective and question. The second chapter delves into previous
theoretical studies on FDI determinants, with a focus on institutional quality and the business
regulatory environment. Empirical studies with a similar focus are also investigated. The third
chapter defines the conceptual framework adopted in the thesis. The fourth chapter describes
the data used in the analysis as well as their sources. It also identifies the methodology used to
address the research question. The fifth chapter presents and discusses the findings of the
analysis. The sixth chapter concludes the thesis with policy recommendation and further
research.
21
Chapter 2: Literature Review
There are numerous studies that focus on analyzing FDI determinants, which are the subject of
this chapter. The chapter contains four sections. The first section begins by thoroughly
addressing the different theoretical approaches of the studies, which include both conventional
and modern theories spanning from Tobin (1958) to Dunning (1993). The second section shines
a light on empirical studies, which focus mainly on institutional quality and the business
regulatory environment. The third section briefly addresses the relationship between
institutional quality and the business regulatory environment. The chapter concludes with the
fourth section identifying existing literature gaps and potential research questions that need to
be addressed.
2.1 Theories on FDI Determinants.
Multiple theories have been developed to explain what drives firms into investing in different
host countries. These theories have different approaches in addressing the question of what
determines FDI, which can be classified into two main waves: conventional and modern.
2.1.1 Conventional Theories
Conventional theories were pioneered by three main approaches that emerged between 1930s
and 1960s. The three approaches are:
The trade and comparative advantage approach tracing back to the neoclassical theory
of international trade and Hecksher Ohlin model (1933)
Finance theories and the international capital movement approach introduced during
the mid- 1930s by Iversen (1936)
Firm-specific approach developed by Hymer (1960) and Vernon (1966).

22
This section will illustrate the different approaches elaborating on the different theories that
developed under each approach.
2.1.1.1 Trade and Comparative Advantage Approach
The first attempt to explain FDI inflows relied mainly on the classical trade theory,
demonstrated by Ricardo’s model (1817) on comparative advantage to explain international
trade (Hosseini, 2005). The Ricardian model assumed a model of two countries, such that each
country produces one product that it has comparative advantage in it, under perfect
competition, using immobile labor resource. In addition, the model assumed zero transaction
and transportation cost. However, the simplistic form of Ricardian model and its assumptions–
such as labor being the only relevant production factor, which is also immobile – do not allow
for the existence of FDI (Ozwa, 1992).
The Heckshar-Ohlin trade model built on Ricardo’s work such that it moved from classical
trade theory to neoclassical trade theory by considering other production factors in addition to
labor only. Yet, it still failed to replicate empirical conditions as it kept both the immobility
assumption of production factors and the perfect competition assumptions (Ozwa, 1992;
Chaudhuri & Mukhopadhyay, 2014).
Notably, Mundell (1957) eased the factors immobility assumption of the Heckshar-Ohlin
model in an attempt to explain FDI, however, he focused only on capital mobility. This resulted
in a shortfall in explaining FDI as by definition capital movement is concerned with portfolio
foreign investment not production foreign investment. Accordingly, the suggested comparative
advantage based model failed to explain FDI as it did not allow for the mobility of non-financial
factors of production, which are a substantial pillar of FDI (Minabe, 1977)
Kojima and Uzawa’s (1984) attempted a different approach in explaining FDI. They attributed
a country’s FDI to having a comparative disadvantage, while exports were attributed to a

23
country’s comparative advantage. This means that FDI moves from source countries with a
comparative disadvantage in production/industry to host countries with a comparative
advantage in production/industry (Minabe, 1977; Hosseini, 2005). While the Kojima and
Ozawa’s model represent the first attempt to separate between exports and FDIs under the trade
approach, it still lacked the mapping of the real economy as the assumption on absence of
transactional costs remained. Given such a shortfall, another approach was sought to
understand the reasons of FDI inflows.
2.1.1.2 Finance and Capital Movement Approach
Under the umbrella of this approach emerged three main theories. Initially, FDI inflows were
attributed to the theory of differential rates of return on capital investment by Iversen (1936).
Iversen (1936) explained that capital move to countries offering high interest rate to countries
offering lower interest rate. However, this theory showed its limitation when the United States
(U.S.) FDI in Europe persisted despite a decline in the rate of return in Europe compared to the
U.S. (Hufbauer, 1975).
Later, Tobin (1958) and Markowitz (1959)’s portfolio diversification theory, initially
developed for securities diversification, looked at the FDI allocation decision from a risk
minimization and return maximization perspective. Accordingly, companies’ decision on
capital reallocation incorporated lowering concentration risk in one market, while accounting
for the rate of return simultaneously (Moosa, 2002).
Given that countries have different currencies, Itgaski (1981) and Cushamn (1985) then
incorporated exchange rate factor in the portfolio diversification theory. They explained FDI
flows by stating that countries with stronger currencies would be the FDI source to countries
with weaker currencies as both the production and transactional costs shall be lower given the
exchange rate disparity. While the factors incorporated under this approach matters to FDI,

24
these theories focused on the movement of financial assets only, resulting in its adequacy for
explaining FPI as FDI incorporate both financial and non-financial assets (Denisia, 2010).
2.1.1.3 Firm-Specific Approach
Hymer (1960) led a breakthrough in the analysis of FDI determinants by shifting the focus
from finance and trade to the analysis of firms. This approach is more microeconomics-
focused, as macroeconomics variables are not explicitly included. In addition, this approach
assumes market inefficiencies, addressing the limitation of the first approach. Moreover,
Hymer’s approach is the pioneer in identifying FDI as “international production” addressing
the limitation of capital approach that is focused on capital, i.e. financial assets, movement only
(Dunning & Rugman, 1985).
According to this approach, FDI occurs due to reasons associated with firm-specific advantages
of asset ownership in terms of technology, knowledge management and market failures. Hence,
a company would operate in a foreign country when its specific advantages makes up for the
cost of conducting business in the host country.
In line with Hymer, Vernon (1966) presented the production cycle theory in which he identified
four production stages: innovation, growth, maturity and decline. He explained that the source
company first invents a new product and introduces it to the local market; then in the growth
stage, production increases in response to the demand of the local market and the surplus is
exported to foreign countries, which are of the same or higher income level than the source
country, creating competition. In the maturity stage, demand stabilize and profit margins
decline but high volumes of production and low cost make up for that. In the decline stage,
after the peak of maturity, revenues decline where it is no longer economically attractive to
invest. At the declining point, companies start seeking alternatives to minimize costs by moving
production to a country with lower labor costs while simultaneously creating new products for
their local market (Hosseini, 2005; Denisia, 2010).
25
Although this approach highlighted the firm-specific viewpoint, it completely neglected the
host country perspective and potential locational determinant. This shortfall is addressed in the
modern theories.
2.1.2 Modern Theories
This new wave of theories came about as a further development of Hymer’s approach,
accounting for the shortcomings of his theory. Two main approaches emerged: internalization
and transactional costs by Buckley and Casson (1985) and the eclectic paradigm of foreign
direct investment by Dunning (1977).
2.1.2.1 Theory of Internalization and Transaction cost
Buckley and Casson (1985) intellectualized the internalization theory of Multinational
enterprises/companies “MNEs”/ “MNCs” and Casson (1985) reformulated the theory to be
inclusive of the transactional cost aspect between consumer and producer. Internalization refers
to cost-effective transactions within the enterprise rather than through the market.
Rugman (1980) utilized the theory to understand the determinants of FDI, where he explained
that market failures/imperfections nudge companies to internalize their transactions within the
firm across different national boundaries rather than establish business transactions between
two different companies across different national borders.
2.1.2.2 The Eclectic Paradigm
Dunning (1977, 1979, 1988) introduced the ownership, location and internalization “OLI”
paradigm, formally known as the eclectic paradigm, as an attempt to formulate a cohesive
theory of FDI flows. “O” stands for ownership specific advantages, “L” stands for location
specific advantages and “I” stands for internalization specific advantage.
As highlighted before, ownership is concerned with management and technology knowledge,
whereas internalization considers transaction costs within the firm. This makes both of them
26
firm-specific determinants. Location specific advantages, on the other hand, refers to
characteristics of the host country in terms of policy framework, economic determinants and
business facilitation (UNCTAD, 1998). Accordingly, FDI only occurs if these three advantages
are attained together (Kurtishi-Kastrati, 2013).
According to UNCTAD (1998), the policy framework mainly encompasses different aspects
related to economic policies such as rules of Entry and Operations, market policies and
structure, international agreements on FDI, trade policy and tax policy. The economic
determinants are classified based on market, resource and efficiency seeking, while business
facilitation aspect is concerned with investment services and facilitation such as investment
promotion, investment incentives, hassle costs and post investment services (UNCTAD, 1998,
p. 91).
Looking more in-depth into economic determinants, market seeking is focused on market
characteristics such as size, growth, structure and access to external markets. Resource seeking
dimension element focus on labor, natural resources, technology and infrastructure availability,
while efficiency Seeking is concerned with the cost of seeking these resources (UNCTAD,
1998, p.91).
Table (1) summarizes different elements of FDI determinants under the three aspects
considered by UNCTAD to provide a clear visualization of UNCTAD operationalization
method of the OLI paradigm. This operationalization resulted in a shortfall, mainly because the
he policy aspect focused solely on economic and business dimensions.

27
Table 2: UNCTAD criteria of host country determinants of FDI
Aspect Elements
Policy
Framework
Economic, political and social stability
Rules of Entry and Operations
Market policies and structure
International agreements on FDI
Trade Policy
Tax Policy
Economic
determinants
Market Seeking: Market size, growth, structure and access to external markets
Resource Seeking: Labor, Natural Resources, Technology & Infrastructure availability
Efficiency Seeking: the cost of resources seeking
Business
facilitation
Investment promotion
Investment incentives
Hassle costs3
Post-investment services
Source: UNCTAD World Investment Report (1998, p. 91).
North (1990) introduced the notion of institutions and its effect on country’s economic
performance. He pointed to the effect of institutional quality on FDI inflows with a focus on
investments transactional cost, while also accounting for the effect on production costs.
According to North (1991), institutions are "humanly devised constraints that structure
political, economic and social interactions". These constraints consist of explicit legislation and
unofficial socio-political norms, which are influenced by the strength of a country’s
institutions. Indeed, North argued that by facilitating exchange between market participants,
institutions are a key driver of economic development, free trade and free movement of factors
of production.
North’s 1991 paper suggests that once a society grows beyond a simple barter system relying
on the strong social bonds between citizens living in close proximity to each other, transaction
costs develop. These costs relate to increasingly larger physical distances between market
participants; the enforcement of contractual terms and the protection of intellectual property.
The existence of these costs necessitates institutional oversight and hence promote institutional
development within the country.
3 UNCTAD (1998) defined hassle cost as cost related to corruption and administrative inefficiency
28
Interestingly, a year later, North (1992) published a paper stating that the political aspirations
of those who govern these institutions may mean that political aspirations are prioritized above
the welfare of society at large. Hence, suggesting the minimization effect on transaction costs
may not be as potent as originally thought. Nonetheless, North’s ground-breaking work
introduced a new non-economic element – institutional quality – under location specific
advantages. This drew the attention of scholars towards the effect of governance and corruption
on institutional quality and hence on attracting FDI. Dunning (2003) supported North’s
institutions theory as he emphasized that MNCs strategic thinking became directed towards
efficiency seeking rather than market and resources seeking.
As the scope of this thesis is the host country characteristics, this thesis focuses on the last two
theories under the modern umbrella. The next section brings to the forefront different empirical
studies concerned with the determinants of FDI in the host country.
2.2 Empirical evidence on FDI determinants
There is abundant literature which provides empirical evidence on the factors affecting FDI
determinants. For instance, UNCTAD produces an annual report on FDI trends and
development that tackles factors affecting its movement around the world since 1991.
Generally speaking, Empirical literature on FDI determinants can be divided into two schools.
A school concerned with the micro level of FDI, highlighting how certain factors shape firms’
decisions to invest in a foreign economy. Another school is concerned with the macro level of
FDI, where the studies under its umbrella focus on the country-specific characteristics that
attract FDI on an aggregate level (Groh & Wich, 2012). The macro level school defines the
scope of this thesis.
29
2.2.1 Economic Determinants of FDI
Ample number of studies focus on the various variables affecting FDI at a macro level.
Fortunately, some of these studies conducted a comprehensive survey of these variables (see
for example, Moosa & Cardak, 2006, p.202). These different variables include market size,
population size, wages, trade barriers, growth rate, openness, trade deficit, exchange rate, taxes,
corruption, country risk and inflation (Moosa & Cardak, 2006; Mengistu & Adhikary 2011;
Jadhav, 2012).
A wave of literature has paid attention to the role of fiscal incentives and consensually
concluded that tax-related incentives are substantial element for FDI attraction (UNCTAD,
2000; Buttner & Ruf, 2005; Cleeve, 2008). However, these studies also acknowledged that the
role of tax incentives, per se, is secondary to other vital determinants that must exist for tax
incentives to achieve its objective. These vital determinants include proper institutions, macro-
economic stability, regulatory environment, and investment barriers operationalized by
administrative cost in terms of red-tape and bribery (UNCTAD, 2000; Rajan, 2004).
2.2.2 FDI and Institutional Quality
Following North’s 1990 theory on the role of institution, the relationship between FDI inflows
and governance has been extensively studied. This section sheds the light on some of the
studies addressing this relation with focus on the studies that adopted quantitative research
methods. The section showcases the different elements and measures of governance used in
these studies, the control variables, the methodology adopted and the main findings of them.
In the late 1990s and early 2000, the literature witnessed the introduction of a number of studies
which picked up on the importance of institutional determinants on FDI inflows for host
countries.
30
Lankes and Venables (1996) found that the strong institutional and legal infrastructure
influenced the scope of vertical FDI and also lowered the risk profile of investments in the host
country. Indeed, host countries with more developed infrastructure benefitted from not only
greater FDI flows, but with more consistent and successful investments. These authors also
advocate investing in structural reforms to progress the level of infrastructure and attract greater
FDI.
A study by Bende-Nabende and Ford (1998) studied the role of economic institutional quality
as an endogenous stimulus for FDI. They measured institutional quality by the liberalization
of both fiscal and monetary policy in Taiwan, in addition to infrastructure development. They
concluded the importance of these two elements to FDI using a dynamic model between 1959-
1995.
Similarly, Altomonte (2000) conducted a panel analysis of 2,500 MNC investments in Central
and Eastern Europe (CEE) host countries from 1989-1996. The study considered the
institutional determinants of FDI inflows, alongside the more typical macroeconomic variables
and found that they were also significant in determining the pattern of FDI inflows. Altomonte
suggested that the legal environment of CEE is one of the key factors behind boosting FDI
flows in the future.
Mengistu and Adhikary (2011) studied the relationship between FDI inflows and good
governance using the WGI as a measure of good governance. Using a panel from 1996-2007,
their study focused on 15 Asian economies. Their model discretely included six dimensions,
while accounting for other multiple factors. These factors include market size, human capital,
local investment, infrastructure, lending interest rate, economic openness, labor force, GDP
growth and natural resources endowment. Fitting a log-level fixed effect model, they concluded
that only political stability, rule of law and government effectiveness are significant robust
31
governance factors. Among the control variables, only infrastructure and lending interest rate
had a significant robust effect over FDI inflows.4
To assess the importance of institutional and corporate governance compared to economic
incentives, Fazio and Talamo (2008) used a two step gravity model of trade approach.5 This
controlled for standard economic factors affecting FDI inflows such as wages, taxes, GDP,
population and others. In order to have a comprehensive measure of governance, they
operationalized governance using a triangulation of different indeces from a number of sources.
They used a shareholder protection variable developed by La porta et al.(2000) and they also
included WGIs. Moreover, they added other indicators developed by Kaufmann et al. (2004)
that capture defacto governance and an index of administrative openness. Using a panel of 61
countries which are FDI host from OECD source countries across the period 1980–2003, their
findings indicated the significant impact of both de jure and de facto institutional governance
on attracting FDI flows. Their findings are robust to the existence of lower wages and taxes as
alternarive incentives for FDI.
In line with the previous study, Subasat and Bellos (2012) studied the relationship between FDI
and governance in 14 transition economies using a two step gravity model approach. They
primairly investigated the direct relation between governanace and FDI in the 1st step. Then,
they introduced the governance difference level between the host and source country in the 2nd
step. In their study, they measured governance using the PRS Group International Country Risk
Guide data on law and order, buracratic quality, democratic accountability and corruption.
Unlike the previous studies, they found that the lack of governance attracts FDI.
4 Robustness is concluded based on fitting two other econometric models that provided consistent findings over
these variables with the fixed effect fitting. 5 Gravity model approach is an international economics trade model that analyze bilateral trade and FDI flows
based on both countries’ economic sizes and geographical distance. It was firstly introduced in 1954 by Walter
Isard

32
Testing the robustness of their findings, Subasat and Bellos (2013) conducted a similar study
on a panel of 18 Latin American countries across 1985-2004. Their findings validated the
findings on the transition economies, which imply that, on the contrary, poor governance
attracts FDI.
Another study by Groh and Wich (2012) analyzed governance effect in emerging markets on
FDI inflows. They derived a composite index of FDI attraction for 127 countries where they
included business environment, economic activity, infrastructure, and legal and political
system as a definition of governance. They measured governance using only 4 indices of the
WGIs, where they excluded voice and accountability and included corrruption as an indicator
for the business environment. Based on their findings, they argued that the reason why
developing and emerging economies attract less FDI than developed countries, on average, is
due to the poor legal and political system as well as poor infrastructure.
Jadhav (2012) studied the economic, political and institutional determinants of FDI in Brazil,
Russia, India, China and South Africa, formally known as the BRICS nations. He conducted a
panel study spanning a period of 10 years 2000-2009, using pooled multivariate regression
and panel root test. Their model encompassed market size, trade openness and natural resources
as economic determinants as well as inflation rate as a measure of macroeconomic stability. In
order to measure the institutional and political determinants, he used WGIs and included each
dimension separately in the model. The study found that the two significant dimension of
governance are rule of law and voice and accountability. Moreover, both market size and trade
openness were of signifcant effect. His findings confirmed that economic determinants are of
more relevance to FDI inflows than both political and institutional determinants.
All the previous studies have included the dimensions of governance as separate variables in
the model; however, this raised a collinearity concern due to their interrelations. Therefore, to
account for multicollinearity in studying governance impact on both inwards and outwards

33
FDI, Globerman and Sharipo (2002) combined the six dimensions in one index. Using 114
countries, they averaged FDI flows between 1995-1997. Their model controlled for human
capital and GDP. They found a significant effect for the governance index; however, transition
economies demonstrated higher governance impact.
Following the same approach of accounting for the collinearity issue, Gani (2007) analyzed
each governance dimension impact in a separate model. Using pooled OLS for a panel data of
46 economies from Asia and Latin America over 4 years, he deduced that only voice and
accountability indicator is of insignificant effect on FDI, implying that the remaining 5
dimensions’ matter for FDI.
Using the same method of analyzing each dimension, Gangi and Abdulrazek (2013) studied
the relationship between the six dimensions of governance, separately, and FDI inflows in a
panel of 50 African countries over 1996-2010. Using both fixed effect and random effects
estimation, they concluded a robust significant effect of three dimensions only. These
dimensions are voice and accountability, government effectiveness and rule of law.
To conclude, the wave of literature on relationship between governance and FDI has
established an agreement on the existence of a significant relationship between both variables.
Still, there has been a shortfall as there is no consensus on which institutional quality
dimensions are the most significant and the direction of the relation.
2.2.3 FDI and Business Regulatory Environment
The Business regulatory environment of the host country constructs a location-specific
advantage that is a direct element of investment climate. The release of the EDB index by the
WB marked the beginning of a new wave of literature. This wave focuses on studying the
business regulatory framework as an incentive scheme that creates an attractive investment
34
climate for FDI inflows. This section provides an illustrative sample of these studies with a
focus on the used sub-indices of EDB, how they were used in the model and the main findings.
Piwonski (2010) studied the relation between the aggregate rank of doing business and the FDI
inflows of countries included in the WB Survey over 2004-2010. Her study used the EDB index
as a proxy for the incentives that governments adopt to attract FDI. She concluded that
enhancing a country’s doing business rank one level, increased FDI flow by $44 million USD
using pooled OLS regression analysis.
Morris and Aziz (2011) investigated the relationship between factors that affects conducting
business and FDI inflows to 57 Sub-Saharan African and Asian countries over six years 2000-
2005. Using the correlation coefficient, the study provided mixed evidence to support a robust
correlation. The overall EDB index was only significant for the year 2000, factors of enforcing
contracts and closing business were significant for four years. The ease of credit factor showed
significance in just in one year. Only trading across borders and registering a property showed
significance for the whole period. Moreover, upon segregating the findings over Sub-Saharan
and Asian countries, it was found that EDB is insignificant for FDI inflows in Asian economies
over the span of six years.
Bayraktar (2013) analyzed the role of EDB in changing the direction of FDI in the outset of
the financial crisis using correlation measures. Analyzing all countries included in the index
during 2004-2010, she concluded that better EDB score attracts more FDI. However, this effect
has partial explanatory power for developing countries.
Gillanders and Corcoran (2015) used the EDB as a proxy to understand the effect of the
business regulatory environment. They studied the average of FDI inflows over the period
between 2004-2009 for countries in the doing business report in 2009. They concluded that
even though the aggregate level of EDB is significant determinant of the FDI inflows, this

35
conclusion is only valid for middle-income countries. In addition, they attributed that
significance to the “trading across borders” factor.
Investigating the same relation in six Asian economies for the period 2004-2013, Shahadan et
al. (2014) concluded that FDI is attracted to a better rated business environment. Analyzing the
factors of the EDB, they found that all factors are significant contributors except for paying
taxes and resolving insolvency or closing business in the region.
Vogiatzoglou (2016) findings were in line with previous studies regarding the relevance of
doing business to FDI in South East Asian countries. However, only 7 indicators from the 10
indicators that composes the EDB index were identified as relevant to the business regulatory
environment in the model. The main contribution of the study is investigating the significant
sub-indicators under each of the thematic indicators in the model.
Jovanovic and Jovanovic (2017) also investigated the relationship between the 10 indicators of
the WB’s EDB indicators and FDI inflows in 27 ex-socialist countries from 22 OECD countries
over the period of 2004-2011. Only three indicators showed significant impact using two
econometrics techniques. While both the ease of paying taxes and enforcing contracts were
significant in one of the two models, only the ease of trade across borders showed significant
robust effect on FDI.
In order to account for the structural instability that occurred due to the global financial crisis,
the scholars refit the models for two separate period group 2004-2007 and 2008-2011.
Moreover, DBI showed more significance in the earlier period implying that the weak effect
could be attributed to the crisis then.
In a study by Blanchet (2006), He analyzed the relationship between FDI inflows in France
over 2005-2006 and EDB. He compared between them using the aggregate ranking in the
model and using the separate ranking of the factors composing the index. He concluded that

36
the aggregate ranking is a more accurate predictor for FDI than each factor separately.
However, as his study spanned only one country for two years, there is no conducive evidence
to support the robustness of his findings.
Based on the above studies, there is a common tendency toward considering the EDB index as
a proxy for the business regulatory environment. While a study by Pinheiro-Alves and
Zambujal-Oliveira (2012) concluded that the WB indicator is neither a consistent measure for
the business environment nor an adequate descriptive power, EDB is the sole universal
quantitaive measure for business regulatory environment. This gives it the advantage of being
suitable for international comparison.
To conclude this section, most studies varied between studing the overall index, the 10 sub-
indices or both; however what is more important is the inconsistency of evidence on the role
of EDB. Moreover, there is no consensus on the relevance of sub-indices.
2.3 Institutional Quality and Business Regulatory Environment
Unlike the studies on the relation between FDI and institutional quality or business
environment, there are limited number of studies on the interrelation between both of these
determinants. A study by Mongay and Filipescu (2012) examined the relation between
institutional quality and the business regulatory environment for 172 nations. The measures
used were the corruption perception index and EDB rankings, respectively. The findings of the
study supported the interrelation between the two variables using pairwise correlation
measures.
Bota-Avram (2014) also investigated the interrelation between the different dimensions of
WGIs and EDB score while clustering countries by income group. Her study concluded that
both rule of law and control of corruption significantly manifest in their impact on the quality

37
of business environment in high income economies. Still, both government effectiveness and
regulatory quality matters for all countries irrespective of their income group.
Another study on 41 African countries by Alemu (2015) examined the relation between both
WGIs and EDB score between 2005 till 2012. Using a generalized method of moments “GMM”
estimation model and others, five dimensions of WGIs showed significant impact on business
environment. Only voice and accountability showed irrelevance to the EDB score. Such
interrelation raises a question on whether the reason WGIs impact on FDI is actually through
its impact on EDB index.
2.4 Literature Gap and Research Contribution
There are abundant number of empirical studies that addressed the role of institutional quality,
particularly those that operationalize it through governance and WGIs, in attracting FDIs.
There are also multiple studies that tackled the role of the business regulatory environment,
operationalized by the EDB score, on FDI inflows. However, there is a lack of research that
addressed why institutional quality or governance matters for FDI using quantitative research
methods while accounting for business regulatory environment in the model, despite the
presence of a few studies that affirms the existence of a significant relationship between them.
Moreover, there are not enough studies that address these two elements with a focus on Africa,
not to mention, jointly in the same model. This provides room for plenty of further research.
This thesis contributes to the existing literature by examining the interrelation between two
central determinants of FDI inflows: institutional quality and business regulatory environment.
Moreover, the thesis contributes to literature on Africa as its scope is focused on both North
and Sub-Saharan Africa.

38
Chapter 3: Conceptual Framework
Drawing from the literature review chapter, the objective of this chapter is to highlight the main
theories, concepts and definitions that are used as the frame of this thesis. It also aims to
illustrate how these concepts are operationalized within the scope of the thesis and the rationale
behind their relationship.
The theoretical framework of this thesis integrates two main theories on FDI determinants. As
highlighted in the literature review chapter, the ownership, location and internalization
specific advantages theory, known as OLI and introduced by Dunning (1977), is the only
theory that considers the host country specification. Since this thesis aims at investigating the
interrelation between different aspects of the location specific determinants of FDI host
countries and FDI inflows, it adopts the OLI theory. Moreover, this thesis integrates OLI
theory with North’s (1990) theory on institutions to construct the main theoretical framework
for its hypothesis on the dynamics of the relation between governance and ease of doing
business.
3.1 Location specific determinants Paradigm
UNCTAD (1998) proposed a frame of the location specific determinants, where it identified
them based on three aspects: policy framework, economic determinants and business
facilitation. The policy framework adopted by UNCTAD is focused on economic related policy
in terms of monetary, fiscal and trade policies. While assessment of the economic policies, per
se, is beyond the scope of this dissertation, assessing the capacity of governments to adopt
adequate policies that promote private sector development is a key interest.6 Hence, the frame
6 Understanding the economic policy framework requires an in-depth investigation of each country’s case and
its set of adopted policies. Moreover, the researcher believes that such investigation should be done through a
case study method encompassing both qualitative and quantitative methodology to provide a comprehensive
evaluation.
39
of the location specific determinants adopted in this thesis follows the main outline of that
proposed by UNCTAD while replacing policy framework element with institutional quality.
UNCTAD conceptualization of business facilitation is mainly based on the role of investment
promotion agencies as it entails investment promotion, incentives and services. The functional
role of agencies is beyond the scope of this thesis. The thesis is more focused on the overall
institutional performance as highlighted in the previous subsection.
Within the scope of this thesis, business facilitation refers to efficiency elements which MNCs
seek that are related to business operations. In that sense, efficiency is reflected by the costs
incurred by the MNCs due to administrative inefficiency in terms of time, complexity of
procedures, information gap and financial cost. Such efficiency is governed by the business
regulatory environment of the host country. Hence, business regulatory environment replaces
business facilitation in the paradigm adopted in this thesis.
The economic determinants proposed by UNCTAD include market seeking, resource seeking
and efficiency seeking. However, following Dunning (2003), efficiency seeking is a business
facilitation element in the context of this thesis.
Figure 2 exemplifies the paradigm of the location specific determinants adopted in this thesis,
where it shows the main factors of each element. It is worth noting that the paradigm adopted
follows a neoclassical approach on the role of government in investment promotion. As this
approach suggests governments should be limited to establishing a sound environment and
does not condone any direct incentives (Ali, 2016).
3.2 Investment Climate
As defined by the IMF and EBRD, the investment climate is a set of location specific
determinants of both domestic investments and FDI. Following the EBRD approach towards
governance as a main shaper of investment climate reform, this thesis defines investment

40
climate as location specific characteristics set of the host country encompassing institutional
quality, business facilitation and economic determinants.
3.2.1 Institutional Quality
In this thesis, governance is used to operationalize institutional quality in the proposed
paradigm. As highlighted in the introduction chapter, governance has been defined by multiple
organization and academics where each of the suggested definitions tackled different
dimensions depending on the scope of work of each them. Some of the dimensions were
common amongst them, nonetheless this thesis adopts the Kaufmann et al. definition to
conceptualize governance. The thesis also utilizes the WGIs measured by Kaufmann and
Kraay, in order to construct an aggregate index that combine the six indicators/dimensions to
measure governance. The method used to construct the governance index is extensively
illustrated in the data and methodology chapter.
3.2.2 Business Regulatory Environment
This thesis adopts the WB EDB regulatory frame as a measurement tool of business regulatory
environment. The regulatory frame originally encompasses 10 business operations factors as
listed in the definition of concepts chapter. Within the scope of this thesis, both protecting
minority investors and enforcing contracts factors are excluded as they are implicitly reflected
by governance dimensions. The assessment of the regulatory frame is measured by the total
EDB score constructed by the WB minus the two excluding factors scores where detailed
illustration of the score is provided in the methodology section.
As has been demonstrated in the studies tackled in the literature, there are other factors that are
partial/potential contributor to FDI inflows and characterize location specific determinants.
These factors are classified under the elements of economic determinants in the adopted
41
paradigm. The next section provides a description on how economic determinants are
operationalized within the scope of this thesis.
3.2.3 Economic Determinants.
Based on OLI theory of FDI determinants, MNCs decide to invest on the basis of resources
seeking, market seeking or efficiency seeking. Efficiency seeking is already reflected within
business facilitation, given the thesis scope, as shown in previous sections. Based on the
adopted paradigm, this thesis defines the economic determinants as a set of market and
resources characteristics sought by MNCs that factor into their internalization and transactional
cost.
3.2.3.1 Market Seeking
This thesis conceptualizes market seeking based on four elements: market size, scale of internal
market, economic stability, and openness. These four elements are referred to as market
characteristics in the conceptual map. The choice of the market size element is based on the
market size hypotheses, which states countries with a bigger market size are expected to grow
quicker, due to economies of scale. Accordingly, a bigger market size is a sought-after
characteristic. Market size is operationalized by GDP per capita to account for the population
size effect, while internal market scale is operationalized by population size (Petrović-
Ranđelović et al., 2017).
Sudden and persistent fluctuations in the market are considered investment dampening. Both
political and economic stability are sought after characteristics by investors. Political stability
is accounted for under the umbrella of institutional quality. Economic stability on the other
hand is reflected by a steadily growing market with low inflation rate. Hence, economic
stability is operationalized by inflation adjusted economic growth.

42
There is no interest for any firm in investing in a closed economy. Hence, access to different
markets is a key characteristic sought after by MNCs. While the EDB score considers trade
across borders, it focuses only on the procedural and cost aspect. Trade openness within the
context of the economic determinants focuses on the share of global trade in GDP including
imports and exports. Trade openness indicate the size of extended markets that a host country
can offer to MNCs investing in it.
3.2.3.2 Resource Seeking.
The thesis borrows from UNCTAD conceptualization of resource seeking elements. These
elements include labor force availability, natural resources, technology and infrastructure.
While labor force is defined as percentage of population in the working age, a concern on how
to define the criteria of skilled labor arouse. Ideally, a skilled labor force would be
operationalized by a labor force with an advanced education level. However, constrained by
the availability of data for this variable, we operationalize labor force by two dimensions:
percentage of population in the working age and mean years of schooling.
Natural resources matter, especially for Africa, as highlighted in the literature. Natural
resources are operationalized by rents from the natural endowment of the country such as oil,
minerals and forests. Both technology and infrastructure are aggregately operationalized by the
infrastructure development index “IDI” in the context of this thesis. This index was introduced
by the AFDB, where It is a composite index of four composite indices: electricity;
transportation; information and communication technology “ICT” and water and sanitation
(AFDB, 2018).7
7As explained in the AFDB (2018) bulletin, Electricity is measured by net generation while transportation is
measured by total paved roads and total roads network. ICT comprises four measures: total phone subscription,
number of internet users, fixed broadband internet subscribers and international internet bandwidth. Water and
sanitation index measures improved water sources and sanitation facilities accounting for population accessibility.

43
3.3 Hypothesis development
The relations between the different concepts stated above are demonstrated in figure 2. These
relations construct the main hypothesis of this thesis. Within the investment climate,
institutional quality, business regulatory environment and economic determinants
simultaneously affect the FDI inflows.
Institutional quality and business regulatory environment are respectively measured by the
governance index and the total score of doing business factors. The two elements interrelate
such that institutional quality affects business regulatory environment. Hence, the governance
index directly affects the doing business score.
Economic determinants encompass both market performance and resources of the host country
as conceptualized in this thesis. Hence, market performance and resources directly affect FDI
inflows as well. North’s theory on institution mostly pointed to the importance of institution
for a country’s economic performance. Since market performance reflects economic
performance, institutional quality affects market performance. Hence, governance index also
affects market performance.
Based on this conceptual map, the researcher hypothesizes that the reason why institutional
quality matters for FDI is mainly due to its direct impact on the business regulatory
environment, while controlling for its direct impact on the economic performance of the host
country and the impact of economic determinants on FDI inflows. That is, the business
regulatory environment, measured by EDB score, mediates the relationship between
institutional quality, measured by governance, and FDI inflows.
The next section provides an illustration for the methodology adopted in this thesis to test the
first part of the suggested hypothesis as the thesis shall control for the economic determinants.

44
Figure 2: Author’s Conceptual Map8
Source: Author’s conceptualization based on Dunning (1977), UNCTAD (1998), Globerman &Sharipo (2002), Morris &Aziz (2011) and Alemu (2015)
8 ˙FDI Inflows are driven by resources, market characteristics, institutional quality and business regulatory environment. These 4 factors are split into two groups, overall making up the investment climate of any given economy.
The first group is termed the economic determinants, composed of a country’s market performance and their respective resources. These are controlled for in the analysis.
In the second group, we can find the factor which serves as the focus of this thesis: institutional quality. This factor is of paramount importance due to its interrelations with the other factors; it directly affects both business facilitation and market performance.
Consequently, the measurement tool (governance index) which is used to measure the quality of a country’s institutions, implicitly and directly affects the measure of both the business facilitation factor (doing business score) as well as the country’s market performance (by way of economic performance).

45
Chapter 4: Data and Methodology
This thesis aims at understanding the interrelation between two central location specific
determinants of FDI: institutional quality and business regulatory environment controlling for
the economic determinants. This aim is driven by the researcher’s interest in understanding
how and why governance matters for FDI, especially in the case of Africa.
This chapter illustrates the design, data and the adopted analysis methodology for this thesis.
The thesis analysis methodology is comprised of 3 stages: factor analysis, mediation analysis
and regression analysis. It is divided into five sections: research design, data sources, data
description, the data analysis methods, the variables of interest and the model specifications.
4.1 Research design
The thesis employs a quantitative research design using secondary panel data resources
publicly available on the WB databank, AFDB databank and UNDP website. The thesis
employs panel data analysis due to their advantages when it comes to cross country analysis.
As referenced in (Bellos & Subasat, 2012), these advantages are:
It provides larger degrees of freedom compared to either cross-sectional or time series
analyses. This leads to more precise regression estimates.
It accounts for the omitted variable bias and heteroscedasticity, which is essential as it
is expected to encounter country specific characteristics that cannot be included in the
model.
It captures relationships complexities between variables more than either cross-
sectional or time series data with bigger capacity.
46
4.2 Data Source
The thesis combines data on the used variables using different resources. The data on economic
variables used in the analysis were gathered from the WB database; the IDI is obtained from
AFDB data bank; the education index is obtained from the UNDP website and the labor share
is obtained from ILO.
Moreover, the variables used in this thesis are calculated by different resources. The
macroeconomic variables in the study are compiled by the WB from the country’s national
accounts. The governance variables, known as WGIs, used in constructing the governance
index, as illustrated later, are calculated by Kaufmann and Kraay. Both the doing business score
and the measure of a country’s Natural Resources Indicator (NRI) are estimated by the WB.
It is worth noting that NRI is estimated by the WB as one of the World Development Indicators
(WDIs). Mean schooling year, also known as education index (EI), is estimated by the UNDP
as one of the Human Development Report (HDR) measures, while labor force is calculated by
International Labor Organization (ILO).
4.3 Data Description
The data set consists of strongly balanced panel for a sample of 46 African economies, out of
54 African countries, for the period 2012 – 2016.9 Eight countries are excluded due to a lack
of data and to preserve the strong balanced data set given the short time period.
In spite of the data availability since 1996 onwards for most variables, the thesis focuses on the
time period from 2012-2016 as the data on EDB score is only available starting 2010.
9 The list of sampled African countries includes: Algeria, Benin, Botswana, Burkina Faso, Burundi,
Cabo Verde, Cameroon, Central African Republic, Chad , Comoros, Congo, Dem. Rep., Congo, Rep.
Cote d'Ivoire, Egypt, Equatorial Guinea, Eswatini, Ethiopia, Gabon, Gambia, Ghana, Guinea, Guinea-
Bissau, Kenya, Lesotho, Liberia, Madagascar, Malawi, Mali, Mauritania, Mauritius, Morocco,
Mozambique, Namibia, Niger, Rwanda, Senegal, Seychelles, Sierra Leone, South Africa, Sudan, Tanzania, Togo, Tunisia, Uganda, Zambia and Zimbabwe.
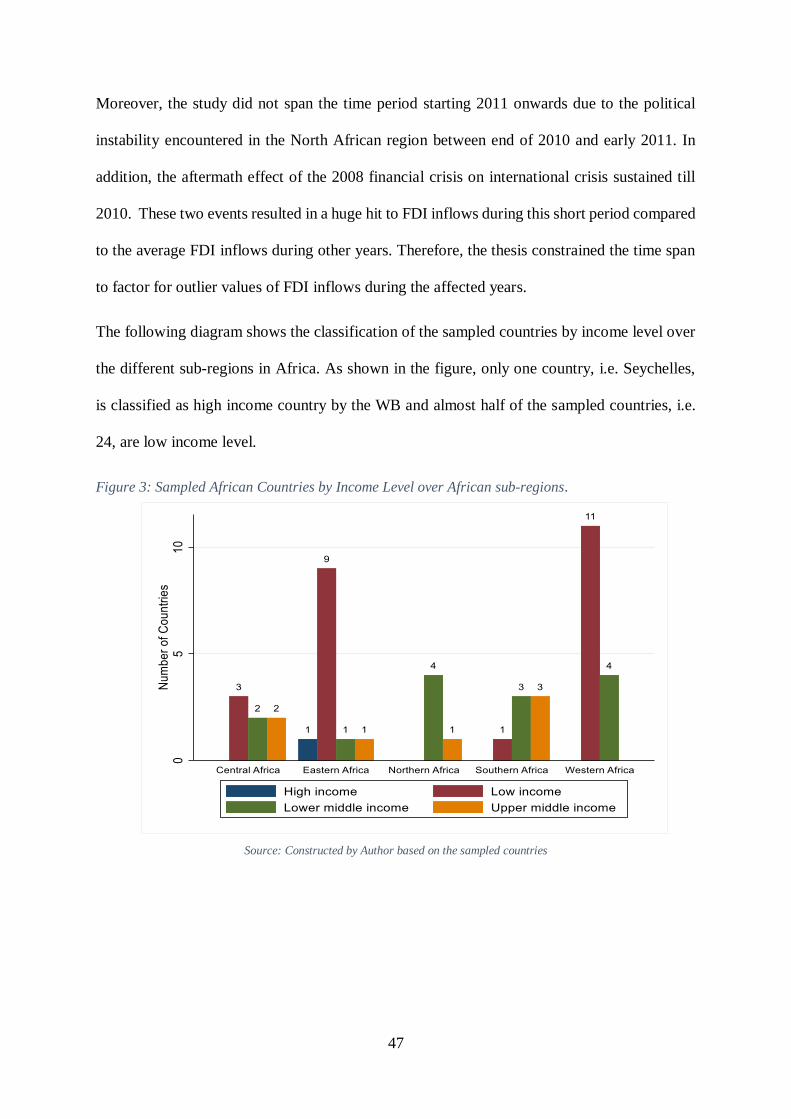
47
Moreover, the study did not span the time period starting 2011 onwards due to the political
instability encountered in the North African region between end of 2010 and early 2011. In
addition, the aftermath effect of the 2008 financial crisis on international crisis sustained till
2010. These two events resulted in a huge hit to FDI inflows during this short period compared
to the average FDI inflows during other years. Therefore, the thesis constrained the time span
to factor for outlier values of FDI inflows during the affected years.
The following diagram shows the classification of the sampled countries by income level over
the different sub-regions in Africa. As shown in the figure, only one country, i.e. Seychelles,
is classified as high income country by the WB and almost half of the sampled countries, i.e.
24, are low income level.
Figure 3: Sampled African Countries by Income Level over African sub-regions.
Source: Constructed by Author based on the sampled countries

48
4.4 Data Analysis Methods
4.4.1 Factor Analysis
The thesis employs factors analysis for the purpose of constructing a composite index that
measures governance. The thesis follows the guidance of Nardo et al. (2005) on the building
and out of composite indices, where it divides index construction into consistency analysis,
standardization and normalization, weighting and aggregation.
Factor analysis is a dimension reduction statistical technique. It is used to combine the
variability between multiple highly correlated variables, such that this variability become
captured by a lower number of unobserved variables. These unobserved variables are referred
to as factors. Factor analysis comes in two forms: exploratory and confirmatory analysis.
As referenced in Gnanadesikan (2011), when the researcher has a pre-defined hypothesis on
the factors that combine the variables, confirmatory factor analysis is employed to affirm this
hypothesis. Alternatively, exploratory factor analysis reveals the variability and multiplicity of
interrelations that generate such factors between large numbers of variables. It is used when
the researcher is still formulating an understanding of the used data.
Based on the literature, high multicollinearity between WGI dimensions is expected. Hence,
the thesis employs confirmatory factor analysis to reduce these six dimensions in form of less
item, i.e. governance the variables seek to measure is pre-identified.
Correlation measures between the estimates of the six dimensions are employed to confirm the
researcher’s concern of multicollinearity issues. Consistency is checked with both the Kaiser-
Meyer-Olkin (KMO) value and Bartlett’s test significance Chi-square to see if the factor
analysis is plausible or not. KMO is an official test for the partial correlations between all the
included dimensions while Bartlett’s test examines whether the correlation matrix is an identity
matrix or not. For factor analysis to be conducted, the KMO value must exceed 0.5 and the null
49
hypothesis of Bartlett’s test must be rejected indicating that the correlation matrix is invertible
(Groh & Wich, 2012).
Normalization and standardization indicate using the z-score of the variables value as it
standardizes the measure of all the input variables across the same range and remove the unit
of measurement effect. Moreover, the z-score yields a distribution transformation for the data
to a normal distribution with mean zero and standard deviation of one.
One of the key advantages of factor analysis for composite construction is that each component
produced is assigned a weight proportional to its share of the total variance in the data. Nicoletti
et al. (2000) emphasize that this property ensures large coverage of the cross-country variance
which is required for cross-country comparisons i.e. the scope of this thesis. The aggregation
step is done to aggregate the retained factors that would explain an accumulated variability of
60% at least. The aggregation method used is the linear summation of the retained factors
accounting for their weights. The linear method is chosen so that input variables shall be
standardized, so the measure unit concern is invalid in this case. A final step is added, where
the aggregated factors are standardized using a Min-Max method for the sake of the
interpretability and comparability of the index score. The thesis relies on SPSS as a statistical
software to run the factor analysis for the index needed.
4.4.2 Mediation Analysis
Mediation analysis is used to investigate the dynamics of the interrelation between institutional
quality and business regulatory environment in determining the FDI inflows to a certain
country. Hence, the mediation analysis technique is used to formally test the main hypothesis
of the thesis. As presented in the introduction, the thesis main hypothesis is that “Business
Regulatory Environment mediates the relation between Institutional Quality and FDI
inflows”.

50
Baron and Kenny’s (1986) three-step mediation analysis was adopted, where they listed three
necessary conditions, yet insufficient, that must be satisfied to establish mediation effect. These
conditions are:
1. A significant relationship between the mediator and the independent variable
2. A significant relationship between the independent variable and the dependent variable
in absence of the mediator
3. A significant relationship between the dependent variable and the mediator variable.
When these three necessary conditions are satisfied, a further necessary and sufficient condition
for concluding mediation is examined. This condition concerns the change in the effect of the
independent variable on the dependent variable upon the inclusion of the mediator variable in
the model. If the effect fully diminishes after introducing the mediator variable, then a full
mediation effect is concluded. In case the effect declines, then a partial mediation is concluded.
To assess the change in the effect, a formal mediation effect test known as the Sobel test is
conducted. This test assesses whether the mediator variable carries the effect of an independent
variable to a dependent variable. The test measures the reduction in the effect of the
independent variable on dependent variable upon introducing the mediator variable. The test
score is then compared to the Normal distribution/T-distribution to decide whether the
reduction is significant. Hence, it can be concluded whether the mediation effect is statistically
significant.
The Sobel test null hypothesis is that there is no significant reduction in the effect, hence no
mediation effect. The Sobel test equation is:
𝑡𝑒𝑠𝑡 − 𝑠𝑡𝑎𝑡𝑖𝑠𝑡𝑖𝑐 = 𝑎 ∗ 𝑏
√(𝑏2 ∗ 𝑠𝑎 + 𝑎2 ∗ 𝑠𝑏
Where:
a = unstandardized regression coefficient of governance variable in Model C;
b = unstandardized regression coefficient of DB variable in Model B;
Sa = standard error of a & Sb = standard error of b.
51
In order to formally check the fulfillment of these three conditions and conduct the Sobel test,
if conditions are fulfilled, 5 sub-hypotheses are developed. These sub-hypotheses are as
follows:
Sub- hypothesis 1: There is a significant, positive relationship between governance
and ease of doing business.
Sub- hypothesis 2: There is a significant, positive relationship between governance
and FDI inflows in the absence of the ease of doing business variable.
Sub- hypothesis 3: There is a significant, positive relationship between ease of doing
business and FDI inflows in the absence of the governance variable.
Sub- hypothesis 4: There is a significant, relationship between governance and FDI
inflows when ease of doing business is considered.
Sub- hypothesis 5: There is a significant, positive relationship between ease of doing
business and FDI inflows when governance is considered.
In order to establish the mediation effect, these five hypotheses must not be rejected except for
hypothesis four, as perfect mediation is established when the effect of governance completely
diminishes when ease of doing business is introduced in the model. To formally test for these
sub-hypotheses, multiple multivariate log linear panel regression analyses are carried out. The
next section illustrates the models used and which sub-hypotheses they test.
4.4.3 Regression Analysis
Regression analysis is used for two purposes:
Validating the fulfillment of Baron and Kenny necessary conditions
Investigating the relationship between governance index, doing business score and
FDI inflows whilst controlling for economic determinants to determine the
mediation effect

52
As the variables of interest are continuous variables, a multivariate log-linear regression model
is used to fit the different models specified in table 3. Model A, C and D are used to test the
fulfillment of the three necessary conditions respectively. Model B is used to verify the
importance of the control variables prior including them in the model. Model E shall be used
to test for the necessary and sufficient condition if model A, C and D imply conditions are met.
Table 3: Mediation Model Construction
Model
Variable
Model A Model B Model C Model D Model E
Dependent Ln (DB score) Ln (FDI) Ln (FDI) Ln (FDI) Ln (FDI)
Independent Governance Governance Ln (DB score) Governance
Mediator Ln (DB score)
Control GDP per Capita, Openness, Economic Growth, IDI, NRI, Labor Force, EI, Population
Tested Sub-
Hypotheses
Sub-
hypothesis 1 Sub-hypothesis 2 Sub-hypothesis 3
Sub-hypothesis 4
&5 Source: Constructed by Author
The thesis primarily specifies the fixed effect estimation method as it assumes the time
invariant characteristics of the countries are correlated with both the explanatory and control
variables. For instance, the country’s region in Africa, whether north or Sub-Saharan, is an
invariant characteristic that potentially indicates the natural endowments of the country; this is
already reflected in the NRI variable. Moreover, the income level classification by the WB, is
correlated to GDP per capita, which is included in the model as a measure of one of the control
variables.
As referenced in Gujarati (2009), fixed effect estimates are characterized by being consistent
estimates, though inefficient. Moreover, it lacks the capacity to reflect the long run effect on
the investigated variable. However, it is believed that given the short span this thesis is
investigating, i.e. 5 years, the long run effect is not of a concern.
Still, the thesis formally compares between pooled, fixed effect and random effect estimation,
as well as utilizing the specification tests including both the Hausman test and the Breusch and
Pagan Lagrange multiplier test to draw a formal conclusion on the fixed effect specification.
53
Findings from both models will be included in the result section, although the analysis will
only consider the correctly specified one. The thesis will adopt post estimation diagnostic tests
to check for multicollinearity, homoscedasticity and autocorrelation to ensure that the estimates
provided are consistent. In this part of the methodology, the software package STATA is used.
4.5 Analysis Variables
4.5.1 Dependent variable
The dependent variable is the log level of the annual net inflows FDI. The net figures indicate
new investment inflows less disinvestment from foreign investors in the reporting country.
Net inflows FDI is annually available in current/nominal values. Since current values do not
account for changes in market prices, a deflation is required. The deflation is done using the
consumer price index of the same year of the inflows.
𝐿𝑛(𝐹𝐷𝐼)𝑖𝑡 = ln (𝑁𝑒𝑡 𝑖𝑛𝑓𝑙𝑜𝑤𝑠 𝐹𝐷𝐼𝑖𝑡
𝐶𝑃𝐼𝑖𝑡
100
) , 𝑠𝑢𝑐ℎ 𝑡ℎ𝑎𝑡 𝑖: 𝐶𝑜𝑢𝑛𝑡𝑟𝑦 & 𝑡: 𝑡𝑖𝑚𝑒; 𝑈𝑛𝑖𝑡: 𝑀𝑖𝑙𝑙𝑖𝑜𝑛
4.5.2 Independent Variable
The independent variable is governance. In order to account for the collinearity issue that was
raised in the literature, an aggregate index is constructed by conducting factor analysis using
the six estimates of the WGIs. The illustration of the process of conducting factor analysis is
provided in the next section. The index scale is from 0 to 100 with 0 being the worst and 100
being the best.
4.5.3 Mediator Variable
As highlighted in the conceptual framework, business facilitation is defined by the business
regulatory environment which is measured by the summation of the scores of 8 factors of the
doing business score in this thesis. Each of these factors is scored against 100. Hence, it is a
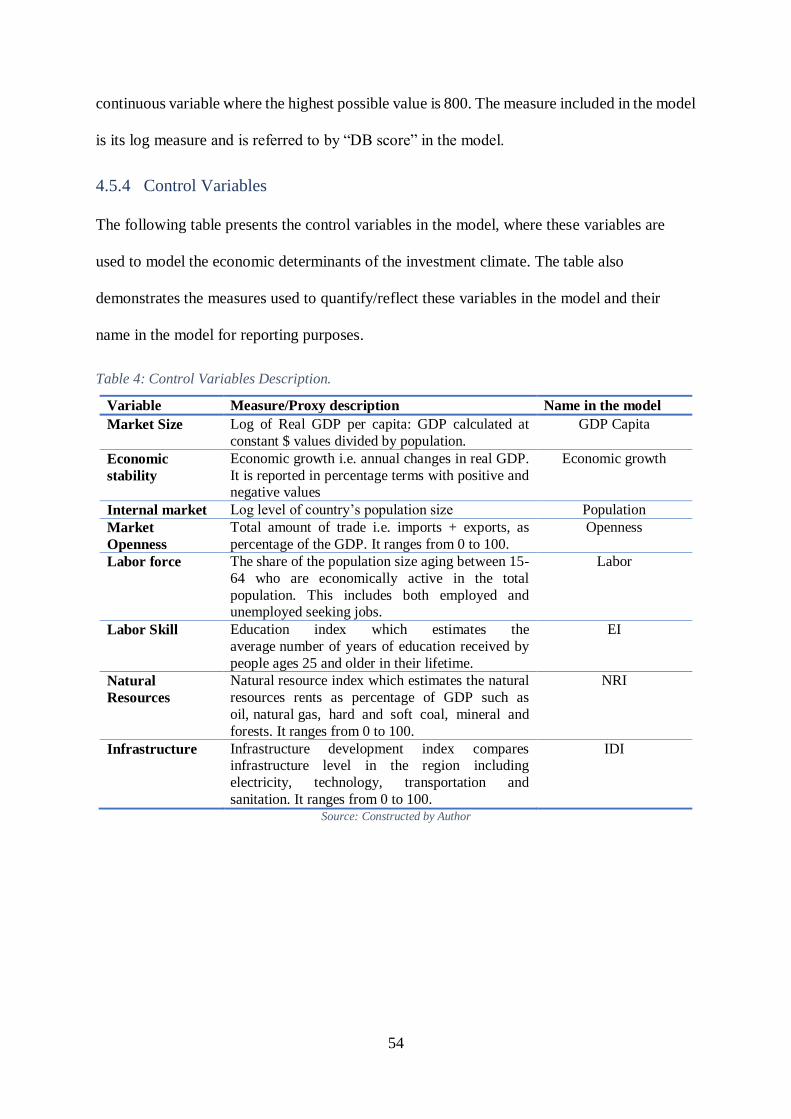
54
continuous variable where the highest possible value is 800. The measure included in the model
is its log measure and is referred to by “DB score” in the model.
4.5.4 Control Variables
The following table presents the control variables in the model, where these variables are
used to model the economic determinants of the investment climate. The table also
demonstrates the measures used to quantify/reflect these variables in the model and their
name in the model for reporting purposes.
Table 4: Control Variables Description.
Variable Measure/Proxy description Name in the model
Market Size Log of Real GDP per capita: GDP calculated at
constant $ values divided by population.
GDP Capita
Economic
stability
Economic growth i.e. annual changes in real GDP.
It is reported in percentage terms with positive and negative values
Economic growth
Internal market Log level of country’s population size Population
Market
Openness
Total amount of trade i.e. imports + exports, as
percentage of the GDP. It ranges from 0 to 100.
Openness
Labor force The share of the population size aging between 15-
64 who are economically active in the total
population. This includes both employed and unemployed seeking jobs.
Labor
Labor Skill Education index which estimates the
average number of years of education received by
people ages 25 and older in their lifetime.
EI
Natural
Resources
Natural resource index which estimates the natural
resources rents as percentage of GDP such as
oil, natural gas, hard and soft coal, mineral and
forests. It ranges from 0 to 100.
NRI
Infrastructure Infrastructure development index compares infrastructure level in the region including
electricity, technology, transportation and
sanitation. It ranges from 0 to 100.
IDI
Source: Constructed by Author

55
4.6 Model Specification
The following models are the ones that shall be fitted to test the main hypothesis of this thesis.
It is worth noting that both independent, mediator and control variables are included in the
model with one-year lag. Hence, while the dependent variables span the period 2012-2016, the
remaining variables span the period 2011-2015.
Model A: ln (𝐷𝐵 𝑠𝑐𝑜𝑟𝑒)𝑖(𝑡−1) = 𝛽0 + 𝛽1 𝐺𝑜𝑣𝑒𝑟𝑛𝑎𝑛𝑐𝑒𝑖(𝑡−1)
Model B: ln (𝐹𝐷𝐼𝑖(𝑡−1)) = 𝛽0 + 𝛽𝑥 ∗ 𝐶𝑜𝑛𝑡𝑟𝑜𝑙 𝑉𝑎𝑟𝑖𝑎𝑏𝑙𝑒𝑠𝑖(𝑡−1)
Model C: ln (𝐹𝐷𝐼𝑖(𝑡−1)) = 𝛽0 + 𝛽1 𝐺𝑜𝑣𝑒𝑟𝑛𝑎𝑛𝑐𝑒𝑖(𝑡−1) + 𝛽𝑥 ∗ 𝐶𝑜𝑛𝑡𝑟𝑜𝑙 𝑉𝑎𝑟𝑖𝑎𝑏𝑙𝑒𝑠𝑖(𝑡−1)
Model D: ln (𝐹𝐷𝐼)𝑖(𝑡−1) = 𝛽0 + 𝛽1 ∗ ln (𝐷𝐵 𝑠𝑐𝑜𝑟𝑒)𝑖(𝑡−1) + 𝛽𝑥 ∗ 𝐶𝑜𝑛𝑡𝑟𝑜𝑙 𝑉𝑎𝑟𝑖𝑎𝑏𝑙𝑒𝑠𝑖(𝑡−1)
Model E: ln (𝐹𝐷𝐼)𝑖(𝑡−1) = 𝛽0 + 𝛽1 𝐺𝑜𝑣𝑒𝑟𝑛𝑎𝑛𝑐𝑒𝑖(𝑡−1) + 𝛽2 ∗ ln (𝐷𝐵 𝑠𝑐𝑜𝑟𝑒)𝑖(𝑡−1) + 𝛽𝑥 ∗
𝐶𝑜𝑛𝑡𝑟𝑜𝑙 𝑉𝑎𝑟𝑖𝑎𝑏𝑙𝑒𝑠𝑖(𝑡−1)
Such that; 𝑖 = 𝑐𝑜𝑢𝑛𝑡𝑟𝑦 & 𝑡 = 𝑦𝑒𝑎𝑟

56
Chapter 5: Findings and discussion
This chapter presents the findings of the data analysis conducted using the tools and methods
described in the previous section.
5.1 Factor analysis
Prior to conducting the factor analysis, the correlation matrix of the six dimensions of the WGIs
were checked. The correlation is presented in the following table over the pooled data used in
the analysis irrespective of the year. It is noticed that all the pairwise correlation are higher than
0.6, presenting a highly significant correlation that will cause a multicollinearity issue upon
including all the dimensions in the model.
Table 5: Correlation Matrix of WGIs' dimensions in African countries.
Dimension Control of
Corruption
Government
Effectiveness
Political
Stability
Regulatory
Quality
Rule of
Law
Voice &
Accountability
Control of
Corruption 1.0000
Government
Effectiveness 0.8656 1.0000
Political
Stability 0.7142 0.6833 1.0000
Regulatory
Quality 0.7858 0.8939 0.6534 1.0000
Rule of Law 0.8986 0.9502 0.7421 0.9124 1.0000
Voice &
Accountability 0.7318 0.7433 0.6346 0.7777 0.8033 1.0000
Source: Constructed by Author using SPSS output
Hence, as highlighted in the methodology, the thesis resorts to constructing a composite index
to comprehensively measure governance. Following Nardo et al. (2005), consistency analysis
is conducted prior to computing the factor analysis. Table 6 presents a summary of the SPSS
factor analysis output per year including consistency checks. The consistency checks
conducted are KMO value, Bartlett’s test significance Chi-square and the component matrix of
the six dimensions. All KMO values significantly exceeds 0.6 (the threshold required) which
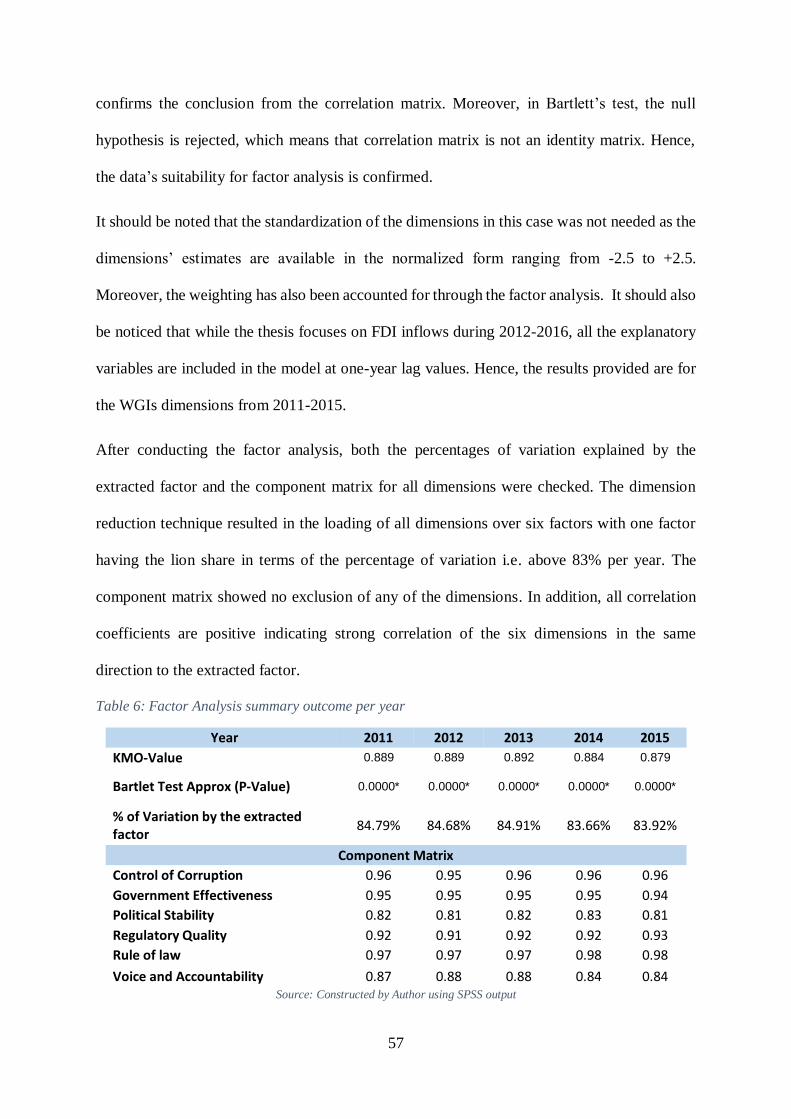
57
confirms the conclusion from the correlation matrix. Moreover, in Bartlett’s test, the null
hypothesis is rejected, which means that correlation matrix is not an identity matrix. Hence,
the data’s suitability for factor analysis is confirmed.
It should be noted that the standardization of the dimensions in this case was not needed as the
dimensions’ estimates are available in the normalized form ranging from -2.5 to +2.5.
Moreover, the weighting has also been accounted for through the factor analysis. It should also
be noticed that while the thesis focuses on FDI inflows during 2012-2016, all the explanatory
variables are included in the model at one-year lag values. Hence, the results provided are for
the WGIs dimensions from 2011-2015.
After conducting the factor analysis, both the percentages of variation explained by the
extracted factor and the component matrix for all dimensions were checked. The dimension
reduction technique resulted in the loading of all dimensions over six factors with one factor
having the lion share in terms of the percentage of variation i.e. above 83% per year. The
component matrix showed no exclusion of any of the dimensions. In addition, all correlation
coefficients are positive indicating strong correlation of the six dimensions in the same
direction to the extracted factor.
Table 6: Factor Analysis summary outcome per year
Year 2011 2012 2013 2014 2015
KMO-Value 0.889 0.889 0.892 0.884 0.879
Bartlet Test Approx (P-Value) 0.0000* 0.0000* 0.0000* 0.0000* 0.0000*
% of Variation by the extracted factor
84.79% 84.68% 84.91% 83.66% 83.92%
Component Matrix
Control of Corruption 0.96 0.95 0.96 0.96 0.96
Government Effectiveness 0.95 0.95 0.95 0.95 0.94
Political Stability 0.82 0.81 0.82 0.83 0.81
Regulatory Quality 0.92 0.91 0.92 0.92 0.93
Rule of law 0.97 0.97 0.97 0.98 0.98
Voice and Accountability 0.87 0.88 0.88 0.84 0.84 Source: Constructed by Author using SPSS output
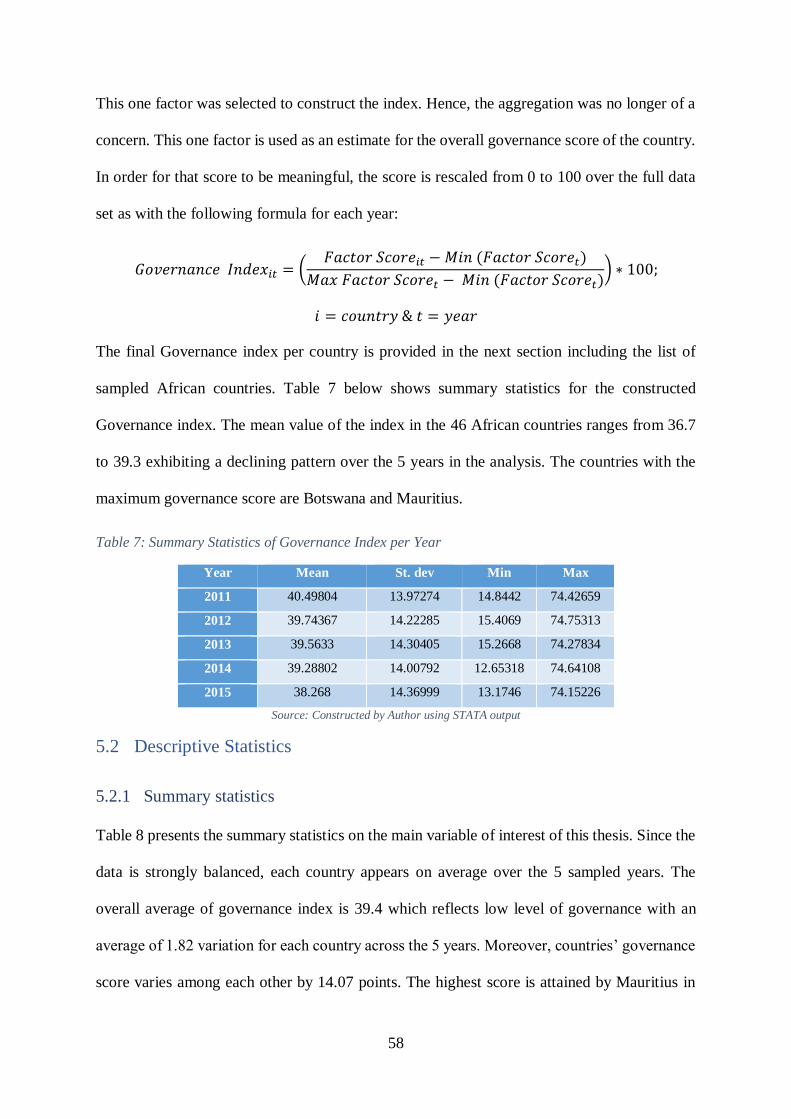
58
This one factor was selected to construct the index. Hence, the aggregation was no longer of a
concern. This one factor is used as an estimate for the overall governance score of the country.
In order for that score to be meaningful, the score is rescaled from 0 to 100 over the full data
set as with the following formula for each year:
𝐺𝑜𝑣𝑒𝑟𝑛𝑎𝑛𝑐𝑒 𝐼𝑛𝑑𝑒𝑥𝑖𝑡 = (𝐹𝑎𝑐𝑡𝑜𝑟 𝑆𝑐𝑜𝑟𝑒𝑖𝑡 − 𝑀𝑖𝑛 (𝐹𝑎𝑐𝑡𝑜𝑟 𝑆𝑐𝑜𝑟𝑒𝑡)
𝑀𝑎𝑥 𝐹𝑎𝑐𝑡𝑜𝑟 𝑆𝑐𝑜𝑟𝑒𝑡 − 𝑀𝑖𝑛 (𝐹𝑎𝑐𝑡𝑜𝑟 𝑆𝑐𝑜𝑟𝑒𝑡)) ∗ 100;
𝑖 = 𝑐𝑜𝑢𝑛𝑡𝑟𝑦 & 𝑡 = 𝑦𝑒𝑎𝑟
The final Governance index per country is provided in the next section including the list of
sampled African countries. Table 7 below shows summary statistics for the constructed
Governance index. The mean value of the index in the 46 African countries ranges from 36.7
to 39.3 exhibiting a declining pattern over the 5 years in the analysis. The countries with the
maximum governance score are Botswana and Mauritius.
Table 7: Summary Statistics of Governance Index per Year
Year Mean St. dev Min Max
2011 40.49804 13.97274 14.8442 74.42659
2012 39.74367 14.22285 15.4069 74.75313
2013 39.5633 14.30405 15.2668 74.27834
2014 39.28802 14.00792 12.65318 74.64108
2015 38.268 14.36999 13.1746 74.15226
Source: Constructed by Author using STATA output
5.2 Descriptive Statistics
5.2.1 Summary statistics
Table 8 presents the summary statistics on the main variable of interest of this thesis. Since the
data is strongly balanced, each country appears on average over the 5 sampled years. The
overall average of governance index is 39.4 which reflects low level of governance with an
average of 1.82 variation for each country across the 5 years. Moreover, countries’ governance
score varies among each other by 14.07 points. The highest score is attained by Mauritius in
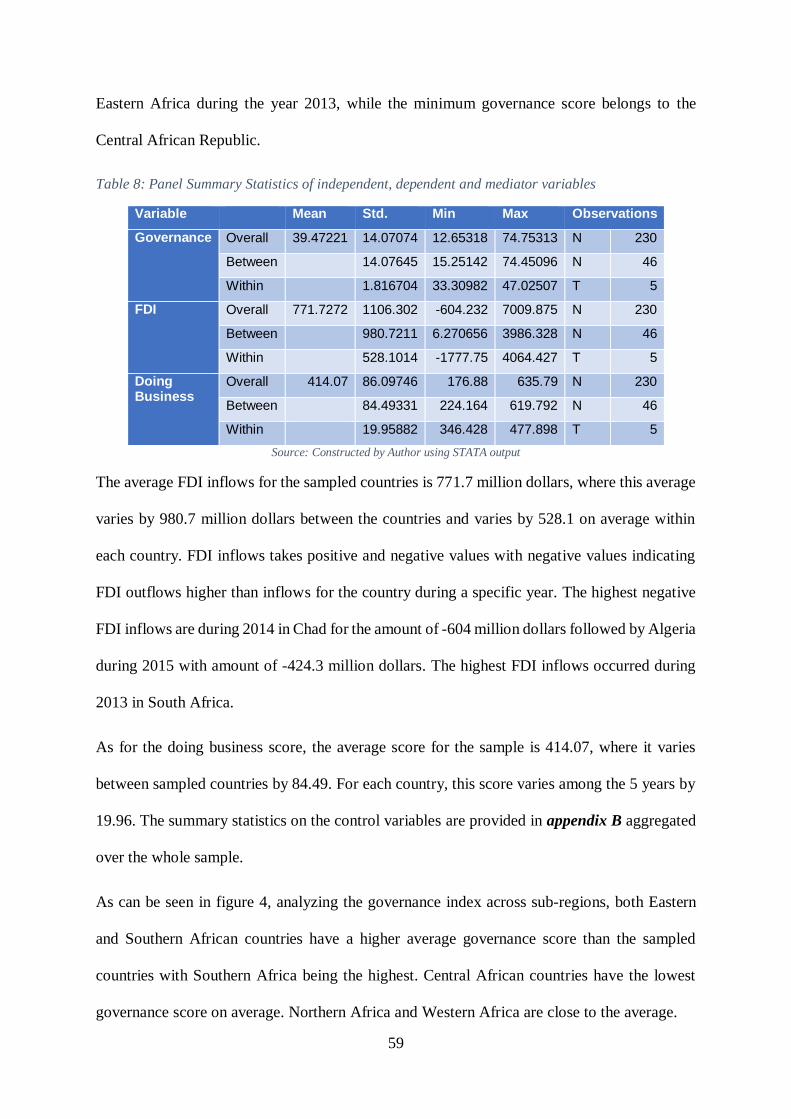
59
Eastern Africa during the year 2013, while the minimum governance score belongs to the
Central African Republic.
Table 8: Panel Summary Statistics of independent, dependent and mediator variables
Variable Mean Std. Min Max Observations
Governance Overall 39.47221 14.07074 12.65318 74.75313 N 230
Between 14.07645 15.25142 74.45096 N 46
Within 1.816704 33.30982 47.02507 T 5
FDI Overall 771.7272 1106.302 -604.232 7009.875 N 230
Between 980.7211 6.270656 3986.328 N 46
Within 528.1014 -1777.75 4064.427 T 5
Doing Business
Overall 414.07 86.09746 176.88 635.79 N 230
Between 84.49331 224.164 619.792 N 46
Within 19.95882 346.428 477.898 T 5
Source: Constructed by Author using STATA output
The average FDI inflows for the sampled countries is 771.7 million dollars, where this average
varies by 980.7 million dollars between the countries and varies by 528.1 on average within
each country. FDI inflows takes positive and negative values with negative values indicating
FDI outflows higher than inflows for the country during a specific year. The highest negative
FDI inflows are during 2014 in Chad for the amount of -604 million dollars followed by Algeria
during 2015 with amount of -424.3 million dollars. The highest FDI inflows occurred during
2013 in South Africa.
As for the doing business score, the average score for the sample is 414.07, where it varies
between sampled countries by 84.49. For each country, this score varies among the 5 years by
19.96. The summary statistics on the control variables are provided in appendix B aggregated
over the whole sample.
As can be seen in figure 4, analyzing the governance index across sub-regions, both Eastern
and Southern African countries have a higher average governance score than the sampled
countries with Southern Africa being the highest. Central African countries have the lowest
governance score on average. Northern Africa and Western Africa are close to the average.

60
Figure 4: Average Governance index by region vs. Overall Governance index average over time
Source: Constructed by Author using STATA output
While this primitive insight may suggest that the average is low due to the weight of Central
African countries, the reality is that the average is skewed up due to high values from Southern
and Eastern African countries. This can be seen by comparing both the annual overall
governance average to the annual overall median, where the median values of the governance
index are below the average values. Figure 5 clearly shows that the governance index is
exhibiting a declining pattern over the 5 years for the sampled countries.
Figure 5: Average Governance Score VS. Median Governance Score over time
Source: Constructed by Author using STATA output
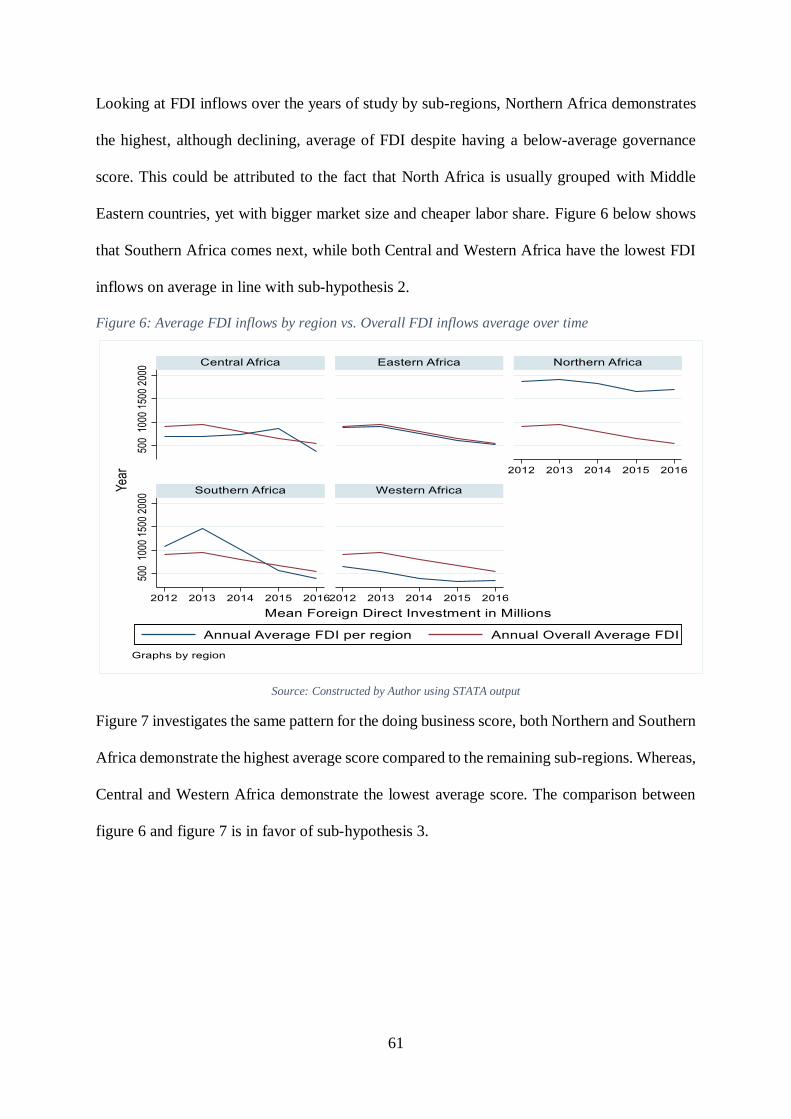
61
Looking at FDI inflows over the years of study by sub-regions, Northern Africa demonstrates
the highest, although declining, average of FDI despite having a below-average governance
score. This could be attributed to the fact that North Africa is usually grouped with Middle
Eastern countries, yet with bigger market size and cheaper labor share. Figure 6 below shows
that Southern Africa comes next, while both Central and Western Africa have the lowest FDI
inflows on average in line with sub-hypothesis 2.
Figure 6: Average FDI inflows by region vs. Overall FDI inflows average over time
Source: Constructed by Author using STATA output
Figure 7 investigates the same pattern for the doing business score, both Northern and Southern
Africa demonstrate the highest average score compared to the remaining sub-regions. Whereas,
Central and Western Africa demonstrate the lowest average score. The comparison between
figure 6 and figure 7 is in favor of sub-hypothesis 3.

62
Figure 7: Average DB Score by region vs. Overall DB score Average over Time
Source: Constructed by Author using STATA output
5.2.2 Correlation Measures
To investigate the correlation factor among the variables used in the analysis and to check for
potential multicollinearity issues among predictor variables, the Pearson correlation coefficient
is tabulated below in table 9. The table shows the correlation matrix for the variables included
in the model including the dependent variable accounting for the measurement level. It is
calculated over the whole period of the study.

63
Table 9: Correlation Matrix between dependent, independent, mediator and control variables
Variables
Ln
(FDI) Governance Ln (DB) IDI EI
Economic
Growth
Openness
Index NRI
Ln
(Market
size)
Ln
(GDP
per
Capita)
Ln (FDI) 1
Governance 0.1977* 1
Ln (DB) 0.2653* 0.7173* 1
IDI 0.1714* 0.5325* 0.6373* 1
EI 0.2339* 0.4419* 0.5366* 0.6604* 1
Economic
Growth 0.2822* 0.0717 0.0229 -0.1244* -0.0392 1
Openness
Index 0.0672 0.3676* 0.1971* 0.2787* 0.3847* 0.0809 1
NRI 0.1262* -0.4966* -0.5111* -0.3930* -0.1758* 0.1317* 0.1746* 1
Ln (Market
size) 0.5148* -0.2996* -0.1203* -0.2127* -0.1866* 0.1598* 0.5897* 0.0925 1
Ln (GDP
per Capita) 0.1798* 0.4635* 0.5600* 0.6879* 0.7229* 0.0989 0.4786* -0.1361* -0.4309* 1
(*) indicates significance at 10% error**
Source: Constructed by Author using STATA output
The correlation matrix shows high prospects for the selected model as the bivariate relation
between the dependent variable and each of the specified variables in the model is significant
except for openness index. Moreover, there is a strong positive correlation between governance
and doing business, hinting at a potential mediation effect, whilst also raising a suspicion
regarding multicollinearity. However, it must be noted that this measure pools observations
irrespective of the time dimension and does not consider cross section dependence.
As for the control variables, the moderate to strong correlation amongst them, as well as the
independent and mediator variable raises concern regarding multicollinearity. Yet, Gujrati
(2009) emphasized that multicollinearity can be tolerated as long as collinearity between
variables is not perfect. Nonetheless, a formal diagnostic test will be carried out after fitting
the model to reach a formal conclusion regarding the significance of the issue.
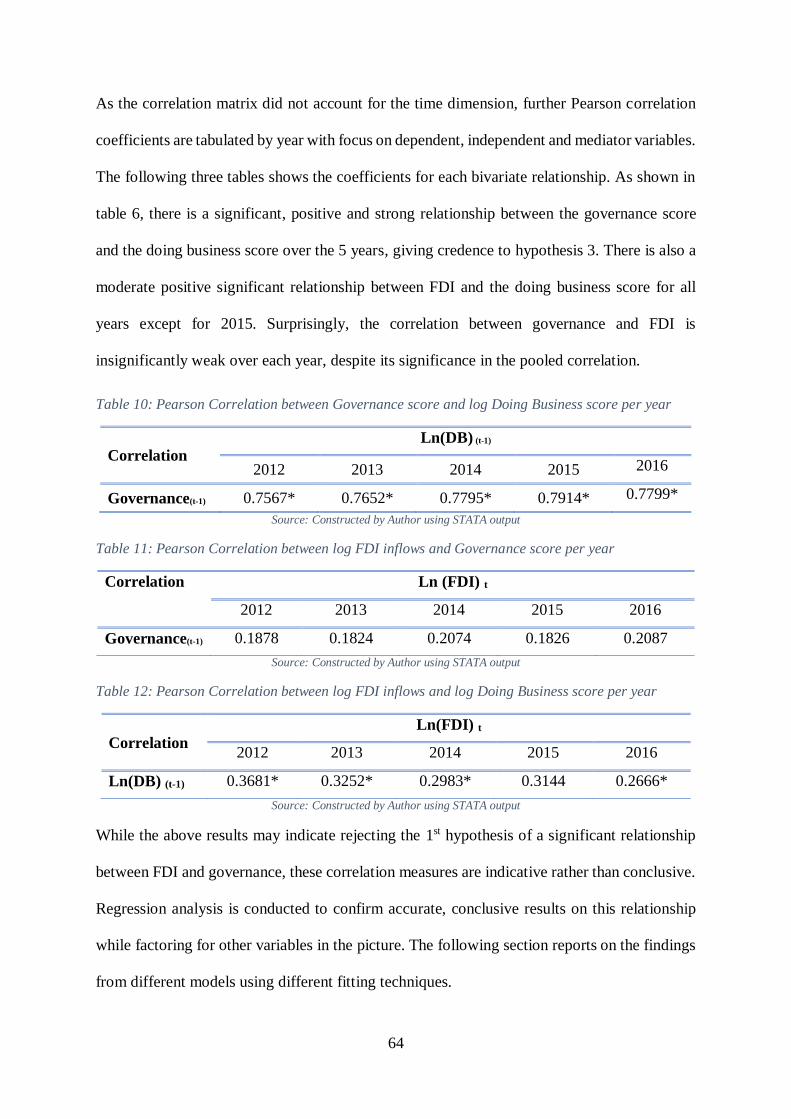
64
As the correlation matrix did not account for the time dimension, further Pearson correlation
coefficients are tabulated by year with focus on dependent, independent and mediator variables.
The following three tables shows the coefficients for each bivariate relationship. As shown in
table 6, there is a significant, positive and strong relationship between the governance score
and the doing business score over the 5 years, giving credence to hypothesis 3. There is also a
moderate positive significant relationship between FDI and the doing business score for all
years except for 2015. Surprisingly, the correlation between governance and FDI is
insignificantly weak over each year, despite its significance in the pooled correlation.
Table 10: Pearson Correlation between Governance score and log Doing Business score per year
Correlation
Ln(DB) (t-1)
2012 2013 2014 2015 2016
Governance(t-1) 0.7567* 0.7652* 0.7795* 0.7914* 0.7799*
Source: Constructed by Author using STATA output
Table 11: Pearson Correlation between log FDI inflows and Governance score per year
Correlation Ln (FDI) t
2012 2013 2014 2015 2016
Governance(t-1) 0.1878 0.1824 0.2074 0.1826 0.2087
Source: Constructed by Author using STATA output
Table 12: Pearson Correlation between log FDI inflows and log Doing Business score per year
Correlation
Ln(FDI) t
2012 2013 2014 2015 2016
Ln(DB) (t-1) 0.3681* 0.3252* 0.2983* 0.3144 0.2666*
Source: Constructed by Author using STATA output
While the above results may indicate rejecting the 1st hypothesis of a significant relationship
between FDI and governance, these correlation measures are indicative rather than conclusive.
Regression analysis is conducted to confirm accurate, conclusive results on this relationship
while factoring for other variables in the picture. The following section reports on the findings
from different models using different fitting techniques.
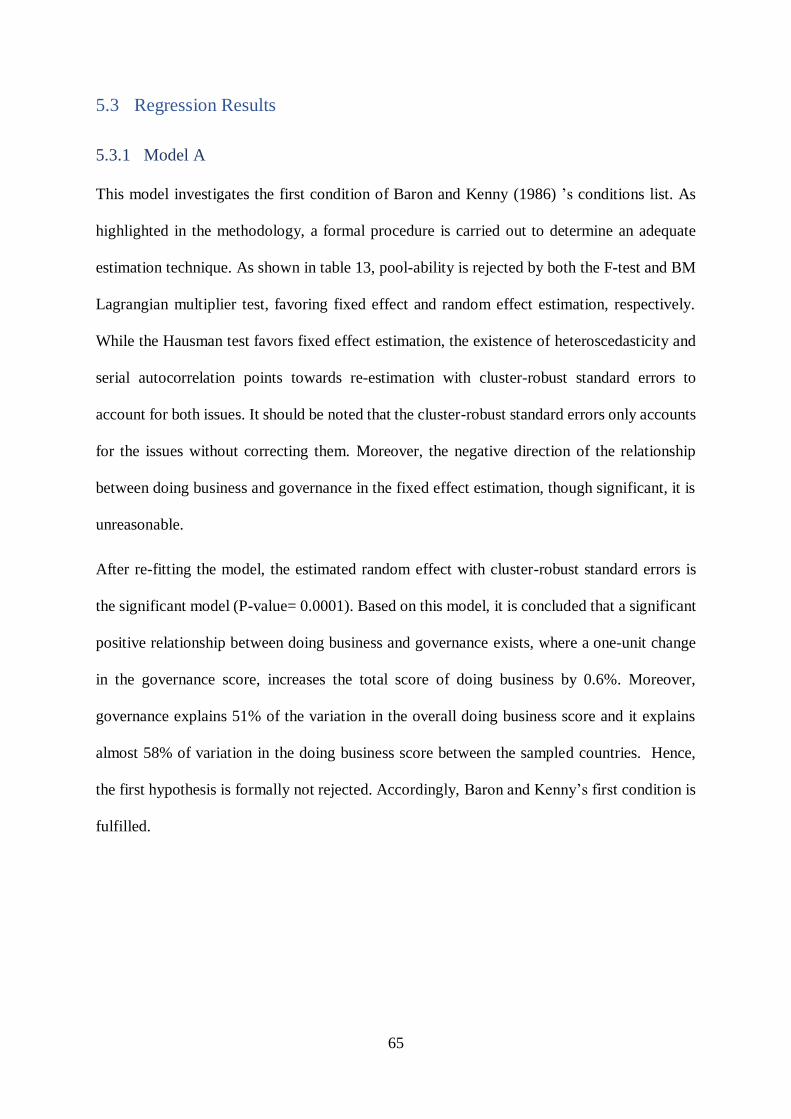
65
5.3 Regression Results
5.3.1 Model A
This model investigates the first condition of Baron and Kenny (1986) ’s conditions list. As
highlighted in the methodology, a formal procedure is carried out to determine an adequate
estimation technique. As shown in table 13, pool-ability is rejected by both the F-test and BM
Lagrangian multiplier test, favoring fixed effect and random effect estimation, respectively.
While the Hausman test favors fixed effect estimation, the existence of heteroscedasticity and
serial autocorrelation points towards re-estimation with cluster-robust standard errors to
account for both issues. It should be noted that the cluster-robust standard errors only accounts
for the issues without correcting them. Moreover, the negative direction of the relationship
between doing business and governance in the fixed effect estimation, though significant, it is
unreasonable.
After re-fitting the model, the estimated random effect with cluster-robust standard errors is
the significant model (P-value= 0.0001). Based on this model, it is concluded that a significant
positive relationship between doing business and governance exists, where a one-unit change
in the governance score, increases the total score of doing business by 0.6%. Moreover,
governance explains 51% of the variation in the overall doing business score and it explains
almost 58% of variation in the doing business score between the sampled countries. Hence,
the first hypothesis is formally not rejected. Accordingly, Baron and Kenny’s first condition is
fulfilled.
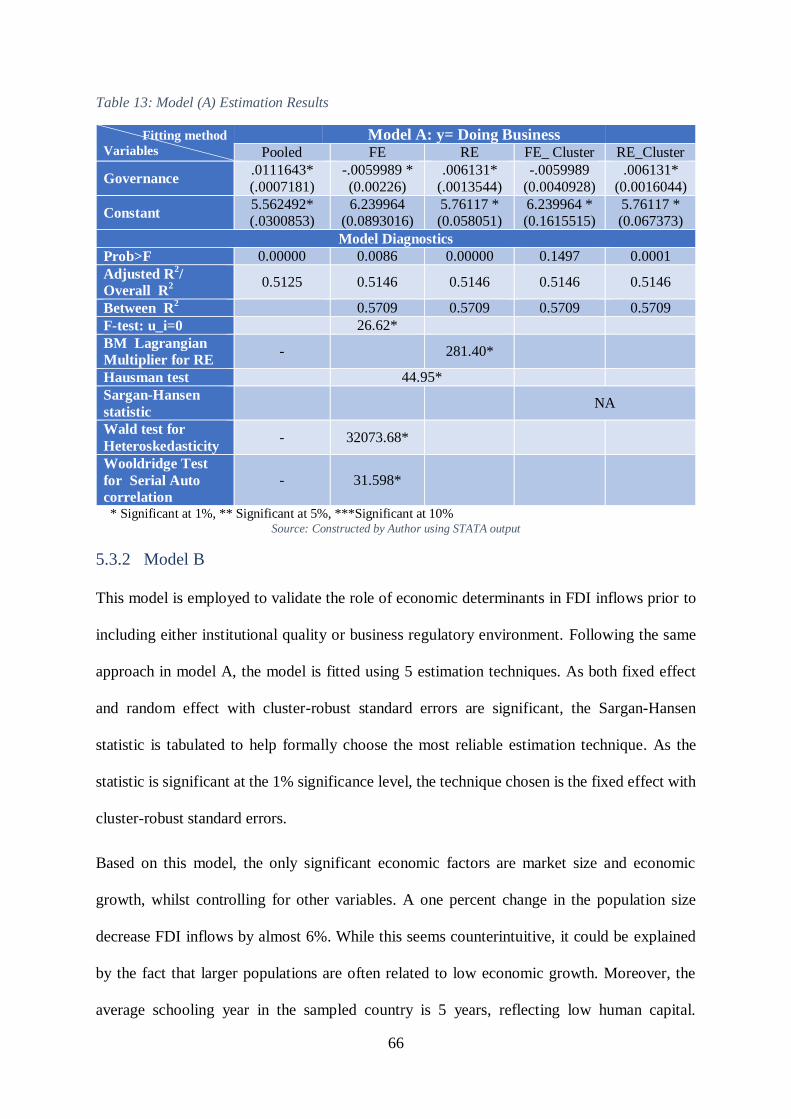
66
Table 13: Model (A) Estimation Results
Source: Constructed by Author using STATA output
5.3.2 Model B
This model is employed to validate the role of economic determinants in FDI inflows prior to
including either institutional quality or business regulatory environment. Following the same
approach in model A, the model is fitted using 5 estimation techniques. As both fixed effect
and random effect with cluster-robust standard errors are significant, the Sargan-Hansen
statistic is tabulated to help formally choose the most reliable estimation technique. As the
statistic is significant at the 1% significance level, the technique chosen is the fixed effect with
cluster-robust standard errors.
Based on this model, the only significant economic factors are market size and economic
growth, whilst controlling for other variables. A one percent change in the population size
decrease FDI inflows by almost 6%. While this seems counterintuitive, it could be explained
by the fact that larger populations are often related to low economic growth. Moreover, the
average schooling year in the sampled country is 5 years, reflecting low human capital.
Fitting method
Variables Model A: y= Doing Business
Pooled FE RE FE_ Cluster RE_Cluster
Governance .0111643*
(.0007181)
-.0059989 *
(0.00226)
.006131*
(.0013544)
-.0059989
(0.0040928)
.006131*
(0.0016044)
Constant 5.562492* (.0300853)
6.239964 (0.0893016)
5.76117 * (0.058051)
6.239964 * (0.1615515)
5.76117 * (0.067373)
Model Diagnostics
Prob>F 0.00000 0.0086 0.00000 0.1497 0.0001
Adjusted R2/
Overall R2
0.5125 0.5146 0.5146 0.5146 0.5146
Between R2 0.5709 0.5709 0.5709 0.5709
F-test: u_i=0 26.62*
BM Lagrangian
Multiplier for RE - 281.40*
Hausman test 44.95*
Sargan-Hansen
statistic NA
Wald test for
Heteroskedasticity - 32073.68*
Wooldridge Test
for Serial Auto
correlation
- 31.598*
** Significant at 1%, ** Significant at 5%, ***Significant at 10%

67
Economic stability, however, showed an expected relationship; a change by 1% increases FDI
inflows by 2.5%.
Table 14: Model (B) Estimation Results
Source: Constructed by Author using STATA output
Fitting method
Variables
Model B: y=Ln (FDI)
Pooled FE RE FE_ Cluster RE_ Cluster
Governance
Ln (DB)
Internal Market 1.144013*** (0.0768116)
-6.075557** (2.951355)
1.116237* (0.112619)
-6.075557** (3.341463)
1.116237* (0.129035)
Economic Stability 0.0544278***
(0.017661)
0.0258909
(0.019018)
0.0382694**
(0.016215)
0.0258909**
(0.013478)
0.0382694**
(0.015679)
Market Size 0.778374* (0.144671)
2.284592 (1.557151)
0.8398267* (0.212733)
2.284592 (1.655689)
0.8398267* (0.204685)
Openness 0.0234996*
(0.003778)
-0.0100134
(0.011428)
0.0196165*
(0.005209)
-0.0100134
(0.0209734)
0.0196165*
(0.0078764)
Labor 0.0929414 (1.423562)
-3.811521 (11.64354)
0.3076082 (2.09738)
-3.811521 (7.092048)
0.3076082 (1.943998)
EI -0.0591831
(0.06406)
-0.4720584
(0.504665)
-0.0626821
(0.095955)
-0.4720584
(0.5774436)
-0.0626821
(0.0764748)
NRI 0.0038047
(0.008687)
0.0048321
(0.018031)
0.0081899
(0.011166)
0.0048321
(0.0301073)
0.0081899
(0.015618)
IDI 0.0015871
(0.007231)
0.0025035
(0.025889)
-0.0017811
(0.010241)
0.0025035
(0.0175926)
-0.0017811
(0.0095042)
Constant -6.316243***
(1.927915)
105.2402**
(43.98738)
-6.003014**
(2.831981)
105.2402**
(47.96949)
-6.003014**
(3.125707)
Model Diagnostics Prob>F 0.00000 0.0099 0.00000 0.0001 0.00000
Adjusted R2/
Overall R2
0.6213 0.2097 0.6174 0.2097 0.6174
Between R2 - 0.2752 0.7858 0.2752 0.7858
Within R2 - 0.1142 0.0236 0.1142 0.0236
F-test: u_i=0 3.39* - - -
BM Lagrangian
Multiplier for RE - - 21.92* - -
Hausman test 15.95** - -
Sargan-Hansen
statistic - - - 77.42*
Wald test for
Heteroskedasticity - 78143.65* - - -
Wooldridge Test
for Serial Auto
correlation
- 0.609 - - -
Multicollinearity All VIF values <10
** Significant at 1%, ** Significant at 5%, ***Significant at 10%

68
It is worth noting that model B explain almost 21% of the overall variation of FDI inflows
while it explains 27.5% variation of FDI inflows between the sampled countries.
5.3.3 Model C
This model investigates the role of governance in determining FDI inflows. Following the same
approach in Model B, the most reliable estimation method is found to be the fixed effect with
cluster-robust standard errors, as the Sargan-Hansen statistic is significant at the 1%
significance level. The cluster -robust standard errors technique is used to account only for
heteroskedasticity (Wald test P-value <0.01) as there is no serial autocorrelation among
observations.10 As shown in table 15, Both governance and economic growth exhibited a
significant effect on FDI inflows. A one-unit increase in governance increases FDI inflows by
12%, holding other factor constants. The economic growth effect almost has the same effect
compared to model B; such that a one percent increase in economic growth, increases FDI
inflows by 2.6%.
Interestingly, the overall R-square of model C is less than model B although the newly added
variable is significant. The model explains only 15.5% of the overall variation in FDI inflows,
yet it explains almost 21% of the variation between countries in the sample, which is less than
model B by 6%. Having a closer look, we realize that whilst the explanatory power of the
between country sample decreased, the degree of variation explained in the within country
sample increased. This possibly indicates that monitoring governance levels is a way for
countries assess their performance in attracting FDI inflows. This raises a further question on
what governance index actually reflects for the country itself.
Based on model C, the second sub-hypothesis of the thesis is formally not rejected.
Moreover, Baron and Kenny’s second condition is satisfied.
10 Wald test null hypothesis is the absence of autocorrelation. The p-value of the test is very high, so we fail to
reject the hypothesis indicating no autocorrelation.

69
Table 15: Model (C) Estimation Results
Source: Constructed by Author using STATA output
Fitting method
Variables
Model C: Ln(FDI)
Pooled FE RE FE_ Cluster RE_Cluster
Governance 0.0413332*
(0.008193)
0.120565*
(0.043268)
0.0501143*
(0.011118)
0.120565***
(0.061707)
0.0501143*
(0.0131044)
Ln (DB)
Internal Market 1.168465*
(0.072802)
-2.355551
(3.185225)
1.154804*
(0.105473)
-2.355551
(4.279039)
1.154804*
(0.1090877)
Economic Stability 0.0352702** (0.017129)
0.026271 (0.018636)
0.025719 (0.015827)
0.026271** (0.011373)
0.025719*** (0.0137593)
Market Size 0.7386531*
(0.137042)
0.293353
(1.684861)
0.7511332*
(0.199561)
0.293353
(1.872133)
0.7511332*
(0.1680667)
Openness 0.0161329* (0.00386)
-0.008695 (0.011208)
0.0128502** (0.005137)
-0.008695 (0.02042)
0.0128502** (0.007345)
Labor -0.96352
(1.362451)
-0.898355
(11.457)
1.375005
(1.993394)
-0.898355
(7.664823)
1.375005
(2.053204)
EI -0.04551
(0.060642) -0.551113 (0.495321)
0.045468 (0.089622)
-0.551113 (0.617999)
0.045468 (0.0720935)
NRI 0.009408
(2.86)
0.0120477
(0.017857)
0.0288751**
(0.011529)
0.0120477
(0.029133)
0.0288751**
(0.0171836)
IDI -0.00899
(0.007152) 0.0139497 (0.025698)
0.013281 (0.009947)
0.0139497 (0.023357)
0.013281 (0.0114065)
Constant -7.13909*
(1.830509)
53.78001
(46.89183)
6.835134**
(2.650548)
53.78001
(61.34998)
6.835134**
(2.573162)
Model Diagnostics
Prob>F 0.00000 0.001 0.0000 0.0004 0.0000
Adjusted R2/
Overall R2 0.6630 0.1555 0.6596 0.1555 0.6596
Between R2 - 0.2250 0.8236 0.2250 0.8236
Within R2 - 0.1547 0.0751 0.1547 0.0751
F-test: u_i=0 2.89* - - -
BM LaGrangian
Multiplier for RE - - 17.08* - -
Hausman test 26.82* - -
Sargan-Hansen
statistic 37.27*
Wald test for
Heteroskedasticity - 45840.78* - - -
Wooldridge Test
Auto correlation - 0.652 - - -
Multicollinearity All VIF values <10
** Significant at 1%, ** Significant at 5%, ***Significant at 10%

70
5.3.4 Model D
This model examines the third condition for the mediation analysis by estimating the effect of
business regulatory environment over FDI inflows while controlling for other variables. Doing
business is only significant in the pooled estimation techniques, which is rejected in favor to
both fixed and random effect estimation technique. Like previous models, robust cluster
standard error estimation is applied to account for absence of homoscedasticity. The fixed
effect estimation technique is nominated as the most reliable based on the Sargan-Hansen
statistics (P-value<0.05).
Unlike previous models, economic stability is insignificant. However, internal market size has
a significant negative effect on FDI, in line with model B. A one percent change in the
population size lowers FDI by 5.9%. As highlighted in model B, this could potentially be due
to the association of a large population with low human capital, low economic growth and
macroeconomic instability due to anticipated high unemployment and effect on public finances
(Asongu, 2013a).
Another factor to be considered, MNCs do not necessarily invest in foreign markets to target
local consumers. In many cases, MNCs decide on investment abroad to lower transaction costs
by taking advantage of trade agreements between certain countries, free trade areas, cheap labor
or investment incentives.
Based on the estimation results of this model, shown in table, the 3rd hypothesis of the thesis is
rejected. Moreover, the Baron and Kenny’s third condition for mediation analysis is not
fulfilled. Hence, the main hypothesis of the thesis is statistically rejected. There is no support
that institutional quality matters to FDI due to its effect on the business regulatory environment.
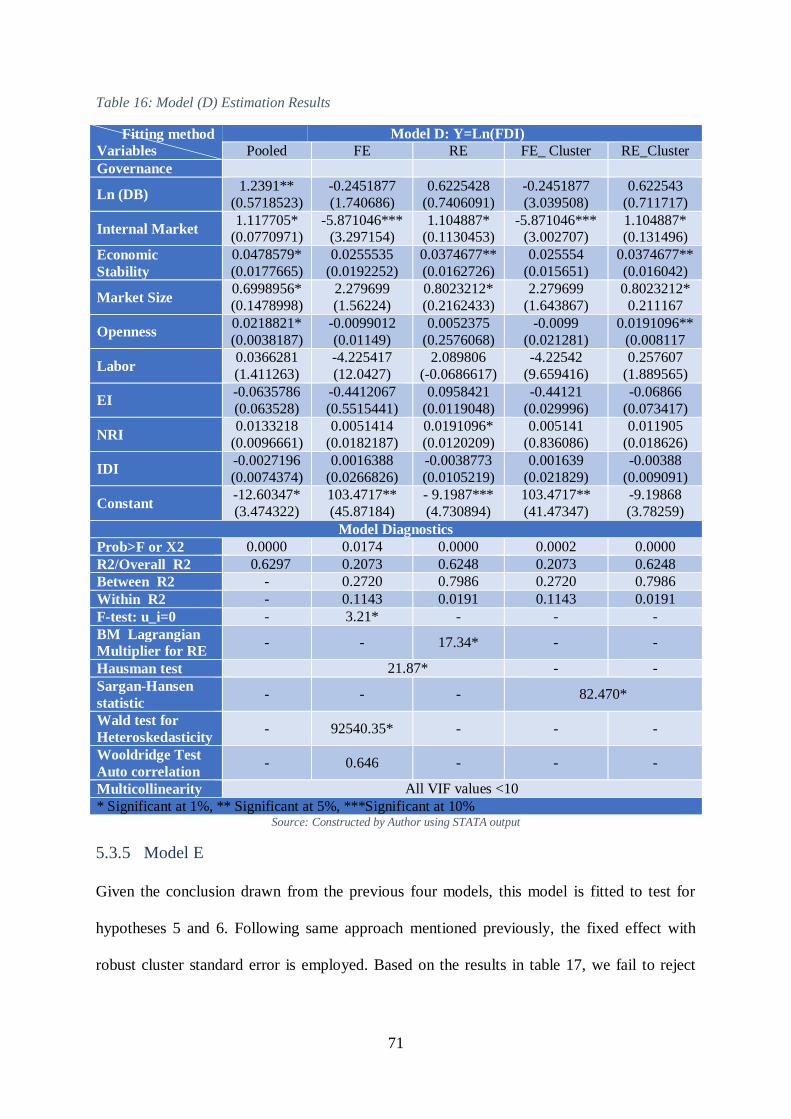
71
Table 16: Model (D) Estimation Results
Source: Constructed by Author using STATA output
5.3.5 Model E
Given the conclusion drawn from the previous four models, this model is fitted to test for
hypotheses 5 and 6. Following same approach mentioned previously, the fixed effect with
robust cluster standard error is employed. Based on the results in table 17, we fail to reject
Fitting method Variables
Model D: Y=Ln(FDI)
Pooled FE RE FE_ Cluster RE_Cluster
Governance
Ln (DB) 1.2391**
(0.5718523)
-0.2451877
(1.740686)
0.6225428
(0.7406091)
-0.2451877
(3.039508)
0.622543
(0.711717)
Internal Market 1.117705*
(0.0770971) -5.871046***
(3.297154) 1.104887*
(0.1130453) -5.871046***
(3.002707) 1.104887* (0.131496)
Economic
Stability
0.0478579*
(0.0177665)
0.0255535
(0.0192252)
0.0374677**
(0.0162726)
0.025554
(0.015651)
0.0374677**
(0.016042)
Market Size 0.6998956*
(0.1478998)
2.279699
(1.56224)
0.8023212*
(0.2162433)
2.279699
(1.643867)
0.8023212*
0.211167
Openness 0.0218821*
(0.0038187)
-0.0099012
(0.01149)
0.0052375
(0.2576068)
-0.0099
(0.021281)
0.0191096**
(0.008117
Labor 0.0366281
(1.411263)
-4.225417
(12.0427)
2.089806
(-0.0686617)
-4.22542
(9.659416)
0.257607
(1.889565)
EI -0.0635786
(0.063528)
-0.4412067
(0.5515441)
0.0958421
(0.0119048)
-0.44121
(0.029996)
-0.06866
(0.073417)
NRI 0.0133218
(0.0096661)
0.0051414
(0.0182187)
0.0191096*
(0.0120209)
0.005141
(0.836086)
0.011905
(0.018626)
IDI -0.0027196
(0.0074374)
0.0016388
(0.0266826)
-0.0038773
(0.0105219)
0.001639
(0.021829)
-0.00388
(0.009091)
Constant -12.60347*
(3.474322)
103.4717**
(45.87184)
- 9.1987***
(4.730894)
103.4717**
(41.47347)
-9.19868
(3.78259)
Model Diagnostics
Prob>F or X2 0.0000 0.0174 0.0000 0.0002 0.0000
R2/Overall R2 0.6297 0.2073 0.6248 0.2073 0.6248
Between R2 - 0.2720 0.7986 0.2720 0.7986
Within R2 - 0.1143 0.0191 0.1143 0.0191
F-test: u_i=0 - 3.21* - - -
BM Lagrangian
Multiplier for RE - - 17.34* - -
Hausman test 21.87* - -
Sargan-Hansen
statistic - - - 82.470*
Wald test for
Heteroskedasticity - 92540.35* - - -
Wooldridge Test
Auto correlation - 0.646 - - -
Multicollinearity All VIF values <10
* Significant at 1%, ** Significant at 5%, ***Significant at 10%
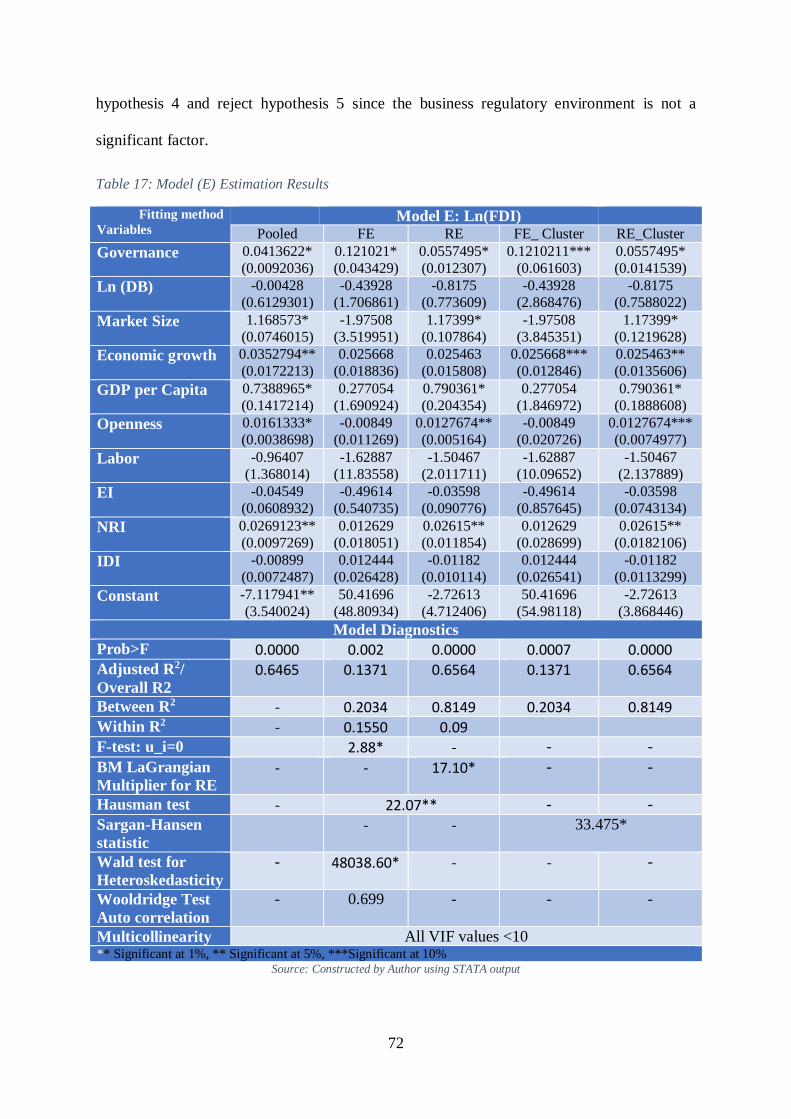
72
hypothesis 4 and reject hypothesis 5 since the business regulatory environment is not a
significant factor.
Table 17: Model (E) Estimation Results
Source: Constructed by Author using STATA output
Fitting method
Variables Model E: Ln(FDI)
Pooled FE RE FE_ Cluster RE_Cluster
Governance 0.0413622*
(0.0092036)
0.121021*
(0.043429)
0.0557495*
(0.012307)
0.1210211***
(0.061603)
0.0557495*
(0.0141539)
Ln (DB) -0.00428
(0.6129301)
-0.43928
(1.706861)
-0.8175
(0.773609)
-0.43928
(2.868476)
-0.8175
(0.7588022)
Market Size 1.168573*
(0.0746015)
-1.97508
(3.519951)
1.17399*
(0.107864)
-1.97508
(3.845351)
1.17399*
(0.1219628)
Economic growth 0.0352794**
(0.0172213)
0.025668
(0.018836)
0.025463
(0.015808)
0.025668***
(0.012846)
0.025463**
(0.0135606)
GDP per Capita 0.7388965*
(0.1417214)
0.277054
(1.690924)
0.790361*
(0.204354)
0.277054
(1.846972)
0.790361*
(0.1888608)
Openness 0.0161333*
(0.0038698)
-0.00849
(0.011269)
0.0127674**
(0.005164)
-0.00849
(0.020726)
0.0127674***
(0.0074977)
Labor -0.96407
(1.368014)
-1.62887
(11.83558)
-1.50467
(2.011711)
-1.62887
(10.09652)
-1.50467
(2.137889)
EI -0.04549
(0.0608932)
-0.49614
(0.540735)
-0.03598
(0.090776)
-0.49614
(0.857645)
-0.03598
(0.0743134)
NRI 0.0269123**
(0.0097269)
0.012629
(0.018051)
0.02615**
(0.011854)
0.012629
(0.028699)
0.02615**
(0.0182106)
IDI -0.00899
(0.0072487)
0.012444
(0.026428)
-0.01182
(0.010114)
0.012444
(0.026541)
-0.01182
(0.0113299)
Constant -7.117941**
(3.540024)
50.41696
(48.80934)
-2.72613
(4.712406)
50.41696
(54.98118)
-2.72613
(3.868446)
Model Diagnostics
Prob>F 0.0000 0.002 0.0000 0.0007 0.0000 Adjusted R2/
Overall R2
0.6465 0.1371 0.6564 0.1371 0.6564
Between R2 - 0.2034 0.8149 0.2034 0.8149 Within R2 - 0.1550 0.09 F-test: u_i=0 2.88* - - -
BM LaGrangian
Multiplier for RE - - 17.10* - -
Hausman test - 22.07** - -
Sargan-Hansen
statistic
- - 33.475*
Wald test for
Heteroskedasticity
- 48038.60* - - -
Wooldridge Test
Auto correlation
- 0.699 - - -
Multicollinearity All VIF values <10 ** Significant at 1%, ** Significant at 5%, ***Significant at 10%

73
5.4 Discussion Summary
To sum up the findings of the conducted analysis, only governance and economic growth
showed a consistent, positive effect on FDI inflows to African countries that was both robust
to different estimation techniques and significant. While these findings are in line with the
discussed literature (Globerman & Shapiro, 2002; Gani, 2007; Gangi and Abdulrazek 2013),
the finding regarding the doing business score is not. Also, contrary to the consensus in the
literature such as Moosa (2002), other variables such as real GDP, population size, labor share,
natural resources and infrastructure did not show an impact on FDI inflows.
Such misalignment with the literature could be attributed to a few factors. Firstly, African
economies differ to other countries. Most studies in the literature, whether for governance or
the doing business effect, have paid greater attention to developed or transition economies. Few
of them focused on developing economies, whilst others aggregated all countries together. This
potentially had masked the effect for countries with the lowest level of development, which is
pre-eminent in the African context. This conclusion is supported by Bayraktar (2013) and
Gillanders and Corcoran (2015), who found that the significnace of the relationship between
EDB and FDI inflows does not hold for poor economies or decline for developing countries.
Second, the methodology for examining the relationship between the variables differ. For
instance, both Morris and Aziz (2011) and Bayraktar (2013) concluded that a significant
relationship between the doing business score and FDI inflows exists; however, they relied
only on the Pearson correlation coefficients. Both studies’ conclusion on the correlation
measures are similar to the findings in the descriptive statistics section of this study. This thesis
extended on their analysis by applying regression analysis to control for other relevant factors.
In addition, other studies in the literature that opted for regression analysis either used a pooled
regression for the panel (Piwonski, 2010) or applied OLS to the average values over the

74
addressed time period (Gillanders and Corcoran, 2015). Again, pool-ability has been tested in
this model and proved to provide inconsistent estimates, which is why fixed effect was favored
instead.
Though governance and the doing business score showed significant relationship using both
panel regression and Pearson correlation measures, the main hypothesis regarding the
mediation effect of the doing business score on the relationship between governance and FDI
inflows is rejected.
The findings from this thesis raise a question on whether the business regulatory environment
is important for FDI inflows or not. It also raises a question on whether it explains the
relationship between institutional quality and FDI. An important aspect to consider is that
perhaps the relationship did not show significance because of the proxy measures used for the
variables of interest i.e. both EDB score for business regulatory environment and governance
index for institutional quality.
Hence, the findings potentially question whether the doing business score actually captures the
business regulatory environment or how the governance index measure is perceived. For
instance, UNCTAD (1999) highlighted that investor’s perception of Africa’s business
suitability is often affected by the stereotype image of the prevalence of political turmoil,
economic instability, diseases and natural disasters. An image that is potentially reflected by
the governance index to investors. Therefore, institutional quality matters for FDI inflows in
Africa since it determines how investors perceive and classify different African countries.
Accordingly, there is no conclusive evidence that the business regulatory environment does not
mediate the relationship between institutional quality and FDI inflows in practice, although the
main thesis hypothesis is rejected.

75
Chapter 6: Conclusion and Policy Recommendation
6.1 Conclusion
The main objective of this thesis is to understand the interrelation between the business
regulatory environment and institutional quality, and their effect on attracting FDI inflows.
This thesis employs a quantitative research method using secondary, panel data consisting of
46 African countries from between 2012-2016. The author extends on previous literature from
scholars such as Globerman and Shapiro (2002), Gani (2007), Piwonski (2010), Morris and
Aziz (2011) and Alemu (2015) by examining the dynamics of interrelation between
institutional quality and business regulatory environment on FDI inflows. The thesis focuses
on whether business regulatory environment mediates the relationship between institutional
quality and FDI inflows. In short, the main hypothesis is statistically not accepted using a
mediation analysis approach, developed by Baron and Kenny (1986), where multivariate
regression models, estimated by robust cluster standard error fixed-effect techniques, are used
to assess the mediation conditions and effects.
To apply the Baron and Kenny (1986) approach, the EDB score is used as a proxy for the
business regulatory environment (excluding minority investor’s rights and the enforcement of
contract scores). Alongside this, a governance index is also constructed as a proxy measure for
institutional quality, using a factor analysis technique aggregating the WGIs developed by the
Kaufmann and Kraay.
The initial analysis begins by examining the bivariate relationship between the main variables
of interest and FDI. Afterwards, a more comprehensive regression analysis is carried out to
control for the economic determinants of FDI within the Eclectic paradigm. 5 regression
models are estimated, where each model is estimated using 5 estimation techniques: pooled
OLS, fixed effect, random effect, robust cluster standard error fixed effect and robust cluster

76
standard error random effect. The different estimation techniques are applied to formally test
for the most reliable estimation technique and also to check for the robustness of the results.
The findings of this study can be summarized as follow:
1. There is a robust, consistent and significant relationship between governance and the
doing business score.
2. Controlling for economic determinants, there is a robust significant relationship
between FDI inflows and governance.
3. Controlling for economic determinants, there is no evidence for a robust relationship
between FDI inflows and the estimated EDB score.
4. Economic stability has a significant, positive effect on FDI inflows, whilst holding
other factors constant.
Only the 1st, 2nd and 4th results are in line with studies from previous literature addressed in
chapter 3 (Globerman & Shapiro, 2002; Gani, 2007; Karr & Cardak, 2006; Alemu, 2015).
Although the 3rd finding is not in line with academics such as Morriz and Aziz (2011) and
Piwonski (2010), it is aligned with Gillanders and Corcoran’s (2015) findings.
Two main reasons are identified for this deviation from the literature: the geographical context
of the African region and the different methodological approach. Africa has 33 Least
Developing Countries (LDCs) out of 54, in addition to having the lowest ranks in WDIs. This
raises a question on the validity of previously adopted models in the aforementioned literature
when modelling Africa.
Regarding the methodological approach, since both the business regulatory environment and
institutional quality are of a qualitative nature, employing proxy measures is limited in its
effectiveness of comprehensively capturing the different and unobservable dimensions.
Moreover, the thesis employs different statistical techniques than the studies addressed in the

77
literature review, as there is a scarcity in the studies employing the same approach, i.e. Baron
and Kenny’s (1986) mediation approach, with regards to the scope of the study.
To conclude, the proxy measures employed to measure the business regulatory environment
showed an insignificant relationship with FDI inflows, which in turn dissatisfy one of the
necessary conditions to establish mediation analysis. Nonetheless, this cannot count as
conclusive evidence that the business regulatory environment does not mediate the relationship
between institutional quality and FDI inflows. On the contrary, this findings points towards the
need for examining whether the EDB score captures the reality of the business regulatory
environment outside the developed world, in order to validate the key results of the thesis.
6.2 Policy Recommendations
As highlighted in the introduction, attracting FDI is a necessity for countries striving for
economic development and growth. Therefore, governments prioritize policies concerned with
attracting FDI on their agendas. Since a high degree of institutional quality and economic
stability showed a positive effect on FDI inflows, this section would focus on policies
promoting these two factors.
6.2.1 Institutional Quality Policies
While aggregating the six dimensions of the WGIs in one index has resolved multicollinearity
issues, it has masked the importance of each dimension and hence the ones which government
should address as a priority in their policies. This section will shed insights on various policies
that tackle these different dimensions separately.
Corruption control defines the extent to which public authorities are able to effectively
discourage state capture and corruption at all levels. Asongu (2013b) suggested the popular
prescription of investing in sustainable economic growth as a method for curbing corruption.
The logic behind this being that growth brings along with it higher incomes and standards of
78
living, reducing the reward of corruption and hence the incentive. Asongu also discovered
meaningful relationships between the corruption control dimension and other WGIs. This
means that curbing corruption policies shall enhance other dimensions of institutional quality.
Addressing the rules of law dimension, government can strengthen faith in the legal system
through thorough investigation of any reported crimes, in particular when elected officials are
suspected of corruption (Montes & Paschoal, 2016). Montes & Paschoal also found that
government effectiveness was greater in countries with lower rates of corruption and more
open democracies. This relates government effectiveness dimension to the voice and
accountability dimension.
Alternatively, governments can focus on the voice and accountability dimension. For instance,
governments can focus on educational empowerment to enhance governance through this
dimension. By providing more educational opportunities, citizens can develop their political
understanding, gaining the confidence and knowledge to engage in democratic proceedings.
Alternatively, governments can take steps to optimize communication channels between
internal and external stakeholders. This builds transparency and trust, encouraging the public
to participate.
To enhance government effectiveness Montes and Paschoal found that high levels of debt and
inflation rates can impede the effectiveness of policy formulation and implementation. Hence,
perhaps prudent fiscal and monetary policies can be employed to encourage efficient policy-
making alongside economic development and the promotion of economic stability.
In tandem with promoting the effectiveness of government, efforts should be made to enhance
the quality of regulation, enabling greater development of the private sector. This requires a
two-pronged approach, taking both proactive and reactive measures.

79
During the early stages of the regulatory process, a forward-looking approach should be taken,
involving subject matter experts, such as behavioral economists, consultants and affected
parties to a greater degree. Creating attractive incentives to inspire voluntary engagement with
affected parties should serve to create more efficient legislation, requiring less re-formulation,
as the affected parties have an inherent interest in creating policies which they are onboard
with. Having said this, caution should be taken to ensure that laws are not created which
asymmetrically benefits certain parties involved in this process.
After new regulations have been implemented, a backward-looking approach should be taken
involving a comprehensive assessment to evaluate compliance and enforcement rates, and
hence whether the regulation has been effective in producing the desired outcome.
Bardhan (2002) highlighted the emphasis the WB placed on the role of decentralization in
governance reforms (World Bank, 2000). Hence, promoting decentralization is a key policy
issue that need to be addressed by governments to promote good governance. There are 4 types
of decentralization according to the WB; they are political, administrative, financial and
markets. However, the thesis cannot extend of this analysis as the WGIs used to construct
governance did not measure the degree of decentralization in the country or measure what type
of decentralization is the most relevant to them.
6.2.2 Economic stability policies
Economic stability comprises two main elements: economic growth and inflation. Hence,
policies aiming at promoting economic stability must address these two elements. Inflation is
directly associated with macroeconomic stability since it is associated with currency and
interest rates shocks.
As for economic growth, governments should focus on promoting the role of the private sector
and encouraging small businesses and entrepreneurship since they are the main employer of
80
labors. Governments can support the private sector through a flexible fiscal policy when it
comes to tax return, helping the sector to accumulate capital at its early stages. Moreover,
governments can also utilize their monetary tool through central banks to lower lending interest
rates, hence lowering the cost of investment, increasing production, employment and spending.
However, governments need also to pay attention to inflation. This is where policies concerned
with macro-economic stability play a role.
When it comes to macroeconomic stability, governments should focus on limiting economic
leakages and taking precautions to curb potential fluctuations. Usually, governments opt for
official policy measures such as implementing automatic fiscal stabilizers which create fiscal
drags during periods of economic prosperity and encourage the opposite during economic
troughs. Similarly, implementing a floating exchange rate or altering monetary policy can be
used to absorb demand-side or supply-side economic shocks.
Alternatively, governments can indirectly intervene by encouraging open and flexible labor
markets to smoothen unemployment rates given variations and transitions in aggregate
demand. Other measure such as interest rate manipulation, supply-side measures and many of
the policies conducive to improving governance would also serve to providing greater
economic stability.
6.3 Limitations and Further Research
Although the study employed formal specifications test to select the most robust estimation
technique, the study faced multiple limitations related to the data and variables selection which
impacted the findings. The data spans only 5 years, which is relatively a short time span for
macro-panel data analysis. Moreover, 8 countries are excluded due to incomplete data on all
the variables of interest. Moreover, both the regulatory environment and institutional quality

81
are measured using proxy measures due to their unobservable nature. This raises a concern
regarding the external validity of the adopted methodology.
Further Research should investigate different proxy measures for the business regulatory
environment and check whether the findings hold or not. In addition, investigating which WGI
dimensions are impacting FDI inflows is a central concern so that governments can prioritize
issues that they need to address. Moreover, it would be interesting to fit the same models to
other regions, continents or countries’ and examine whether the findings validity. Such
examination would also validate the African context justification provided in the thesis.
Another interesting approach to be applied is to conduct focused cases studies on a sample of
African countries with a focus on the policy dimension in addition to the institutional quality
and the role of investment promotion agencies in attracting FDI inflows. In addition, analyzing
types of FDI or sectors of FDI inflows to Africa may provide a breadth analysis on the findings
of the study. Moreover, addressing the role of decentralization in the model as highlighted by
Bardhan (2002), is of a paramount importance.
Understanding FDI inflows is a very generic topic that involves multidimensional analysis to
gain a thorough understanding. This makes it a research area that is always open to new ideas
and exploration studies.

82
Appendices
Appendix A: List of Sampled countries and their Governance Index Score
Table 18: Governance Index for African Countries (2011-2015)
Country 2011 2012 2013 2014 2015
Algeria 33.00 33.15 34.30 33.15 31.51
Egypt, Arab Rep. 36.51 36.27 32.35 31.21 30.31
Libya 21.57 21.55 17.74 11.70 8.27
Morocco 46.82 46.90 46.43 47.43 46.77
Tunisia 50.55 49.29 47.82 48.82 47.41
Angola 28.69 29.81 27.89 28.41 27.19
Burundi 26.18 24.53 26.83 29.74 21.79
Benin 47.49 46.22 46.60 45.71 43.99
Burkina Faso 45.49 44.02 42.39 41.59 42.38
Botswana 71.22 71.54 70.81 69.76 68.92
Central African Republic 24.34 21.97 16.54 12.65 13.74
Cote d'Ivoire 27.41 30.86 33.46 37.81 38.32
Cameroon 31.93 30.87 30.83 30.50 29.05
Congo, Dem. Rep. 14.84 15.41 16.77 16.83 14.19
Congo, Rep. 29.17 27.57 28.04 28.75 27.29
Comoros 30.76 31.00 32.61 33.95 33.05
Cabo Verde 68.03 67.42 66.52 65.26 66.19
Ethiopia 32.01 32.10 31.89 33.94 30.72
Gabon 41.39 40.79 40.79 40.01 37.27
Ghana 57.38 56.22 56.33 53.53 53.20
Guinea 26.66 25.81 26.27 27.06 29.86
Gambia, The 41.88 40.99 38.93 37.86 34.55
Guinea-Bissau 29.38 23.59 21.94 24.04 23.58
Equatorial Guinea 24.12 23.12 21.99 19.07 18.11
Kenya 38.08 36.85 38.51 40.10 38.35
Liberia 35.72 35.80 34.53 34.52 32.47
Lesotho 51.58 51.27 53.00 49.20 47.02
Madagascar 36.50 35.35 34.21 34.77 34.07
Mali 42.92 32.83 34.36 33.82 32.90
Mozambique 46.24 45.51 42.05 40.61 37.39
Mauritania 33.20 33.02 31.98 33.08 30.90
Mauritius 74.43 74.75 74.28 74.64 74.15
Malawi 46.49 45.66 44.66 43.56 41.81
Namibia 61.62 62.63 62.99 60.63 60.79
Niger 41.48 38.27 37.37 37.16 36.85
Nigeria 27.55 27.31 26.96 25.36 27.30
Rwanda 48.86 49.04 51.20 53.05 52.38
Sudan 17.25 15.76 15.27 14.80 13.17
Senegal 45.87 49.24 50.44 51.61 50.51

83
Country 2011 2012 2013 2014 2015
Sierra Leone 38.25 36.33 36.58 35.80 34.76
South Sudan 18.77 20.78 16.46 7.51 5.42
Sao Tome and Principe 46.23 44.99 44.76 45.61 44.35
Eswatini 38.89 39.49 40.64 39.53 37.96
Seychelles 59.55 59.32 59.98 57.72 62.00
Chad 22.94 22.87 23.19 21.31 21.20
Togo 32.87 31.86 31.55 34.14 33.86
Tanzania 44.99 43.79 43.15 41.90 41.48
Uganda 40.97 40.21 39.62 38.88 38.02
South Africa 61.37 59.41 60.38 59.05 57.45
Zambia 47.75 49.60 48.92 47.42 46.34
Zimbabwe 18.53 19.73 20.61 21.26 22.28
Eritrea 20.06 18.79 17.33 16.78 13.08 Source: Constructed by Author using SPSS output
Appendix B: Summary Statistics of Controlled Variables
Table 19: Summary Statistics of Control Variables
Variable Obs Mean Std. Dev. Min Max
IDI 230 23.48082 19.63218 3.91 93.7131
EI 230 5.096957 2.146906 1.4 10.1
Economic growth % 229 4.440429 4.685388 -36.7 20.71577
GDP per capita 230 2622.232 3479.707 228.4325 18236.31
Openness 230 78.20498 33.7556 19.1008 216.4832
NRI 230 13.56302 11.78053 0 59.27
Market Size 230 19351542 22389842 87441 100835458
Labor share 225 0.391966 0.0674 0.25301 0.556228
Source: Constructed by Author using STATA output

84
References
African Development Bank. (2018). The Africa Infrastructure Development Index July 2018.
Retrieved from https://www.afdb.org/en/documents/document/the-africa-infrastructure-
development-index-july-2018-103158
Alemu, A. M. (2015). The nexus between governance infrastructure and the ease of doing
business in Africa. In Comparative case studies on entrepreneurship in developed and
developing countries (pp. 110-131). IGI Global.
Ali, R. S. (2016). Investment promotion in Egypt: Institutional analysis of the general authority
for investment and free zones.
Altomonte, C. (2000). Economic determinants and institutional frameworks: FDI in economies
in transition. Transnational corporations, 9(2), 75-106.
Asian Development Bank. (1999). Governance: Sound Development Management. Manila,
Philippines: Asian Development Bank. Retrieved from
https://www.adb.org/sites/default/files/institutional-document/32027/govpolicy.pdf
Asongu, S. A. (2013a). How would population growth affect investment in the future?
Asymmetric panel causality evidence for Africa. African Development Review, 25(1), 14-29.
Asongu, S. A. (2013b). Fighting corruption in Africa: do existing corruption-control levels
matter?. International Journal of Development Issues, 12(1), 36-52.
Bardhan, P. (2002). Decentralization of governance and development. Journal of Economic
perspectives, 16(4), 185-205.
Bardhan, P. (2002). Decentralization of governance and development. Journal of Economic
perspectives, 16(4), 185-205.
Baron, R. M., & Kenny, D. A. (1986). The moderator–mediator variable distinction in social
psychological research: Conceptual, strategic, and statistical considerations. Journal of
personality and social psychology, 51(6), 1173.
Bayraktar, N. (2013). Foreign Direct investment and Investment Climate. Procedia Economics
and Finance, 5, 83-92. doi: 10.1016/S2212-5671(13)00013-0
Bellos, S., & Subasat, T. (2012). Governance and foreign direct investment: a panel gravity
model approach. International Review of Applied Economics, 26(3), 303-328.
doi:10.1080/02692171.2011.587110
Bellos, S., & Subasat, T. (2012). Governance and foreign direct investment: A panel gravity
model approach. International Review of Applied Economics, 26(3), 303-328.
Bende-Nabende, A. V. R. O. M., & Ford, J. L. (1998). FDI, policy adjustment and endogenous
growth: Multiplier effects from a small dynamic model for Taiwan, 1959–1995. World
development, 26(7), 1315-1330.
Blanchet, D. (2006). Exploratory Analysis of the indicators proposed by Doing Business
Reports Exploratory Analysis of the indicators proposed by Doing Business Reports.
Bota-Avram, C. (2014). Transylvanian Review of Administrative Science.
Buckley, P. J., & Casson, M. (1985). The economic theory of the multinational enterprise.
Springer

85
Büttner, T., & Ruf, M. (2005). Tax incentives and the location of FDI: Evidence from a panel
of German multinationals (No. 2005, 17). Discussion paper Series 1/Volkswirtschaftliches
Forschungszentrum der Deutschen Bundesbank.
Casson, M. (1985). Transaction costs and the theory of the multinational enterprise. In The
economic theory of the multinational enterprise (pp. 20-38). Palgrave Macmillan, London.
Chaudhuri, S., & Mukhopadhyay, U. (2014). Foreign direct investment in developing
countries: A theoretical evaluation (1st;2014; ed.). New Delhi: Springer. doi:10.1007/978-81-
322-1898-2
Cleeve, E. (2008). How effective are fiscal incentives to attract FDI to Sub-Saharan
Africa?. The Journal of Developing Areas, 135-153.
Cristina, B. A. (2014). Good governance and doing business: evidence from a cross-country
survey. Transylvanian Review of Administrative Sciences, 10(41), 27-45.
Cushman, D. O. (1985). Real exchange rate risk, expectations, and the level of direct
investment. The Review of Economics and Statistics, 297-308.
Denisia, V. (2010). Foreign direct investment theories: An overview of the main FDI
theories. European journal of interdisciplinary studies, (3).
Djankov, S., La Porta, R., Lopez-de-Silanes, F., & Shleifer, A. (2002). The regulation of
entry. The quarterly Journal of economics, 117(1), 1-37.
Dunning, J. (2003). Determinants of foreign direct investment: globalization-induced changes
and the role of policies. In B. Tungooddem, N. Stern, & I. Kolstad (Ed.), Annual World Bank
Conference on Development Economics "Toward Pro-Poor Policies Aid, Institutions, and
Globalization" (pp. 279-290). Europe: World Bank. Retrieved April 2019
Dunning, J. H. (1977). Trade, location of economic activity and the MNE: A search for an
eclectic approach. In The international allocation of economic activity (pp. 395-418). Palgrave
Macmillan, London.
Dunning, J. H. (1979). Explaining changing patterns of international production: in defense of
the eclectic theory. Oxford bulletin of economics and statistics, 41(4), 269-295.
Dunning, J. H. (1980). Toward an eclectic theory of international production: Some empirical
tests. Journal of international business studies, 11(1), 9-31.
Dunning, J. H. (1988). The theory of international production. The International Trade
Journal, 3(1), 21-66.
Dunning, J. H. (1993). Internationalizing Porter's diamond. Management International
Review, 33(2), 7.
Dunning, J. H. (1998). Location and the multinational enterprise: a neglected factor?. Journal
of international business studies, 29(1), 45-66.
Dunning, J. H., & Rugman, A. M. (1985). The influence of Hymer's dissertation on the theory
of foreign direct investment. The American Economic Review, 75(2), 228-232.
European Bank for Reconstruction and Development. (n.d.). What are investment climate and
governance? Retrieved from https://www.ebrd.com/what-we-do/sectors-and-
topics/investment-climate-governance.html
Faundez, J. (2016). Douglass North’s theory of institutions: lessons for law and
development. Hague Journal on the Rule of Law, 8(2), 373-419.
86
Fazio, G., & Chiara Talamo, G. M. (2008). How “attractive” is good governance for FDI?.
In Institutional Approach to Global Corporate Governance: Business Systems and Beyond (pp.
33-54). Emerald Group Publishing Limited.
Fazio, G., & Talamo, G. M. (2008). How "attractive" is good governance? In J. J. Dow, & S.
Dow (Ed.), Institutional Approach to Global Corporate Governance : Business Systems and
Beyond (Vol. 9, pp. 33-54). Emerald Group Publishing Limited. doi:10.1016/S1569-
3767(08)09002-X
Fukuyama, F. (2013). What is governance?. Governance, 26(3), 347-368.
Fukuyama, F. (2016). Governance: What do we know, and how do we know it?. Annual Review
of Political Science, 19, 89-105.
Gangi, Y. A., & Abdulrazak, R. S. (2012). The impact of governance on FDI flows to African
countries. World Journal of Entrepreneurship, Management and Sustainable Development,
162-169.
Gani, A. (2007) Governance and Foreign Direct Investment Links: Evidence from Panel Data
Estimations. Applied Economics Letters, 14, 753-756.
Gillanders, A., & Corcoran, R. (2015, February). Foreign direct investment and the ease of
doing business. Review of World Economics, 151(1), 103-126. doi:10.1007/s10290-014-0194-
5
Globerman, S., & Shapiro, D. (2002). Global foreign direct investment flows: The role of
governance infrastructure. World development, 30(11), 1899-1919.
Gnanadesikan, R. (2011). Methods for statistical data analysis of multivariate observations.
John Wiley & Sons.
Groh, A. P., & Wich, M. (2012). Emerging economies' attraction of foreign direct investment.
Emerging Markets Review, 13, 210-229. doi:10.1016/j.ememar.2012.03.005
Gujarati, D. N. (2009). Basic econometrics. Tata McGraw-Hill Education.
Hosseini, H. (2005). An economic theory of FDI: A behavioral economics and historical
approach. The Journal of Socio-Economics, 34(4), 528-541.
Hufbauer, G. C. (1975). The multinational corporation and direct investment. International
trade and finance: Frontiers for research, 45(1), 253-319.
Hymer, S. (1960). On multinational corporations and foreign direct investment. The theory of
transnational corporations. London: Routledge for the United Nations.
Itagaki, T. (1981). The theory of the multinational firm under exchange rate
uncertainty. Canadian Journal of Economics, 276-297.
Iversen, C. (1936). Aspects of the theory of international capital movements. Taylor & Francis.
Jadhav, P. (2012). Determinants of foreign direct investment in BRICS economies: Analysis
of economic, institutional and political factors. Social and Behavioral Sciences, 37, 5-14.
doi:10.1016/j.sbspro.2012.03.270
Jovanovic, B., & Jovanovic, B. (2018). Ease of doing business and FDI in the ex-socialist
countries. International Economics and Economic Policy, 15(3), 587-627.
Kaufmann, D., Kraay, A., & Mastruzzi, M. (2003). Governance matters III: Governance
indicators for 1996–2002. The World Bank.

87
Kaufmann, D., Kraay, A., & Mastruzzi, M. (2005). Governance matters IV: governance
indicators for 1996-2004. The World Bank.
Kaufmann, D., Kraay, A., & Mastruzzi, M. (2006). Governance matters V: aggregate and
individual governance indicators for 1996-2005. The World Bank.
Kaufmann, D., Kraay, A., & Mastruzzi, M. (2008). Governance matters VII: aggregate and
individual governance indicators 1996-2007. The World Bank.
Kaufmann, D., Kraay, A., & Mastruzzi, M. (2009). Governance matters VIII: Aggregate and
individual governance indicators 1996-2008. The World Bank.
Kaufmann, D., Kraay, A., & Mastruzzi, M. (2011). The worldwide governance indicators:
methodology and analytical issues. Hague Journal on the Rule of Law, 3(2), 220-246.
Kaufmann, D., Kraay, A., & Zoido, P. (1999). Governance matters. World Bank policy
research working paper, (2196).
Kinda, T., Plane, P., & Véganzonès-Varoudakis, M. A. (2008). Productivity and Technical
Efficiency in MENA Manufacturing Industry: The Role of the Business Environment. In ETF
15Th Annual Conference, Cairo. Egypt.
Kojima, K., & Ozawa, T. (1984). Micro-and macro-economic models of direct foreign
investment: toward a synthesis. Hitotsubashi Jo studies, 3(1), 58-67.
Kraay, A., Zoido-Lobaton, P., & Kaufmann, D. (2002). Governance matters II: Updated
indicators for 2000–01. The World Bank.
Kurtishi-Kastrati, S. (2013). Impact of FDI on economic growth: An overview of the main
theories of FDI and empirical research. European Scientific Journal, 9(7).
La Porta, R., Lopez-de-Silanes, F., Shleifer, A., & Vishny, R. (2000). Investor protection and
corporate governance. Journal of financial economics, 58(1-2), 3-27.
Lankes, H. P. and A. J. Venables (1996). “Foreign direct investment in economic transition:
the changing pattern of investments”, Economics of Transition, 4 (2), pp. 331-347.
Maiti, D., & Mukherjee, A. (2013). Governance, foreign direct investment and domestic
welfare. International Review of Economics and Finance 27 (2013) 406–415, 27, 406-415.
doi:10.1016/j.iref.2012.12.001
Mansoor, A., Issoufou, S., & Sembene, D. (2018). "Chapter 15. Relieving Constraints on the
Business Environment and Supporting Foreign Direct Investment". In Race to the Next Income
Frontier: How Senegal and Other Low-Income Countries Can Reach the Finish Line. USA:
INTERNATIONAL MONETARY FUND. doi: https://doi.org/10.5089/9781484303139.071
Markowitz, H.M. (1959). Portfolio selection: efficient diversification of investment. New
York: John Wiley.
Mastruzzi, M., Kraay, A., & Kaufmann, D. (2007). Governance matters VI: aggregate and
individual governance indicators, 1996-2006. The World Bank.
Mengistu, A. A., & Adhikary, B. K. (2011). Does good governance matter for FDI inflows?:
Evidence from Asian Economies. Asia Pacific Business Review, 17(3), 281-299. doi:
10.1080/13602381003755765
Minabe, N. (1977). A simple linear programming model of the Heckscher-Ohlin theory of
international trade. European Economic Review, 9(3), 333-343.
88
Minabe, N. (1977). Mundell and Kojima on trade and capital movements. Hitotsubashi Journal
of Economics,18(1), 35-39. Retrieved from http://www.jstor.org/stable/43295670
Mongay J., Filipescu D.A. (2012) Are Corruption and Ease of Doing Business Correlated? An
Analysis of 172 Nations. In: Harris S., Kuivalainen O., Stoyanova V. (eds) International
Business. The Academy of International Business. Palgrave Macmillan, London
Montes, G. C., & Paschoal, P. C. (2016). Corruption: what are the effects on government
effectiveness? Empirical evidence considering developed and developing countries. Applied
Economics Letters, 23(2), 146-150.
Moosa, I. A. (2002). Foreign direct investment: Theory, evidence, and practice. New York;
Houndmills, Basingstoke, Hampshire: Palgrave.
Moosa, I. A., & Cardak, B. A. (2006). The determinants of foreign direct investment: An
extreme bounds analysis. Journal of Multinational Financial Management, 16, 199-211.
doi:10.1016/j.mulfin.2005.07.002
Morris, R., & Aziz, A. (2011). Ease of doing business and FDI inflow to Sub-Saharan Africa
and Asian countries. Cross Cultural Management: An International Journal, 18(4), 400-411.
Retrieved April 2019
Mundell, R. A. (1957). International trade and factor mobility. American economic -
review, 47(3), 321-335.
Nardo, M., Saisana, M., Saltelli, A., & Tarantola, S. (2005). Tools for composite indicators
building. European Comission, Ispra, 15, 19-20.
Nicoletti, G., Scarpetta, S., & Boylaud, O. (2000). Summary indicators of product market
regulation with an extension to employment protection legislation. Concepts and measurement
of labour markets flexibility/adaptability indicators.
North, D. (1990). C. 1991." Institutions.". Journal of economic perspectives, 5(1), 97-112.
North, D. (1991). Institutions. The Journal of Economic Perspectives, 5(1), 97-112.
North, D. (1992). Institutions, Ideology, and Economic Performance. Cato Journal, 11(3), 477-
496.
Organization of Economic Cooperation and Development (2002), Foreign Direct Investment
for Development: Maximising benefits, minimising costs, OECD Publishing,
Paris, https://doi.org/10.1787/9789264199286-en.
Oxborne, D., & Gaebler, T. (1995). Reinventing government. Journal of Leisure
Research, 27(3), 302.
Ozawa, T. (1992). Foreign direct investment and economic development. Transnational
corporations, 1(1), 27-54.
Peters, B. G. (2012). Governance as political theory. In Civil Society and Governance in
China (pp. 17-37). Palgrave Macmillan, New York.
Petrović-Ranđelović, M., Janković-Milić, V., & Kostadinović, I. (2017). Market size as a
determinant of the foreign direct investment inflows in the Western Balkans countries. Facta
Universitatis, Series: Economics and Organization, 093-104
Pierre, J., & Peters, B. (2005). Governing complex societies: Trajectories and scenarios.
Springer.

89
Pinheiro-Alves, R., & Zambujal-Oliveira, J. (2012). The Ease of Doing Business Index as a
tool for investment location decisions. Economics letters, 117, 66-70.
doi:10.1016/j.econlet.2012.04.026
Piwonski, K. (2010, April). Does the ‘Ease of Doing Business’ In a Country Influence its
Foreign Direct Investment Inflows? Honors Projects in Finance. Retrieved from
https://digitalcommons.bryant.edu/honors_finance/13
Rajan, R. S. (2004). Measures to attract FDI: Investment promotion, incentives and policy
intervention. Economic and political weekly, 12-16.
Reisen, H., & Soto, M. (2001). Which types of capital inflows foster developing‐country
growth?. International finance, 4(1), 1-14.
Rugman, A. M. (1980). Internalization as a general theory of foreign direct investment: A re-
appraisal of the literature. Review of World Economics, 116(2), 365-379.
Shahadan, F., Sarmidi, T., & Faizi, F. J. (2014). Relationships Between Doing Business
Indexes And FDI Net Inflows: Empirical Evidence From Six Asian Countries (Afghanistan,
Bangladesh, India, Iran, Pakistan and Sri Lanka). Prosiding Persidangan Kebangsaan
Ekonomi Malaysia ke-9.
Smith, W., & Hallward-Driemeier, M. (2005). Understanding the investment climate new data
sources about firms provide insights into helping economies grow. Finance and Development-
English Edition, 42(1), 40-43.
Stoker, G. (1998). Governance as theory: five propositions. International social science
journal, 50(155), 17-28.
Strat, V. A., Davidescu, A., & Paul, A. M. (2015). FDI and the unemployment-a causality
analysis for the latest EU members. Procedia economics and finance, 23, 635-643.
Subasat, T., & Bellos, S. (2013, May). Governance And Foreign Direct Investment In Latin
America: A Panel Gravity Model Approach. Latin American Journal of Economics, 50(1), 107-
131. Retrieved from https://www.jstor.org/stable/41959252
Tobin, J. (1958). Liquidity preference as behavior towards risk. The review of economic
studies, 25(2), 65-86.
UNCTAD. (2000). World Investment Report 2000: Cross‐border mergers and acquisitions and
development. New York.
UNCTAD. (2000). World Investment Report 2000: Cross‐border mergers and acquisitions and
development. New York.
UNCTAD. (1998). World investment report 1998: Trends and determinants.
UNCTAD. (1999). Foreign direct investment in Africa: performance and potential.
UNDP. (1997). Governance for sustainable human development. UNDP.
Vernon, R. (1966). International trade and international investment in the product
cycle. Quarterly journal of economics, 80(2), 190-207.
Vogiatzoglou, K. (2016, December). Ease of Doing Business and FDI Inflows in ASEAN.
Journal of Southeast Asian Economies, 33(3), 343-363. Retrieved April 2019, from
https://www.jstor.org/stable/44132410
Weiss, J. (1995). The Academy of Management Review, 20(1), 229-235. Retrieved from
http://www.jstor.org/stable/258896
90
WGI 2018 Interactive > Home. (n.d.). Retrieved March 20, 2019, from
https://info.worldbank.org/governance/wgi.
World Bank (n.d.). What is the difference between Foreign Direct Investment (FDI) net inflows
and net outflows? – World Bank Data Help Desk. [online] Datahelpdesk.worldbank.org.
Available at: https://datahelpdesk.worldbank.org/knowledgebase/articles/114954-what-is-the-
difference-between-foreign-direct-inve [Accessed 24 Aug. 2019].
World Bank. (1989). From crisis to sustainable growth - sub Saharan Africa: a long-term
perspective study (English). Washington, DC: The World Bank.
World Bank. (1994). Governance: The World Bank’s Experience. Washington: The World
Bank.
World Bank. (2000). World development report 2000-2001: attacking poverty. World Bank
Group.
World Bank. (2001). World development report 2002: building institutions for markets. World
development report. Washington, DC: World Bank Group.