Embed Size (px)
Citation preview

The impact of the EU ETS on European energy and carbon markets
David Newbery
Danish Environmental Economic ConferenceSkodsborg Hotel 23 August 2010
http://www.eprg.group.cam.ac. uk

D Newbery Copenhagen 2010 2
Outline• Climate Change Challenge
– more carbon underground than we should release
– Kyoto then ETS sets targets
• The logic of EU targets
• GHG targets and the EU ETS
• EU 20-20-20 Directive and ETS
• R&D andEU SET Plan
D Newbery Copenhagen 2010 3
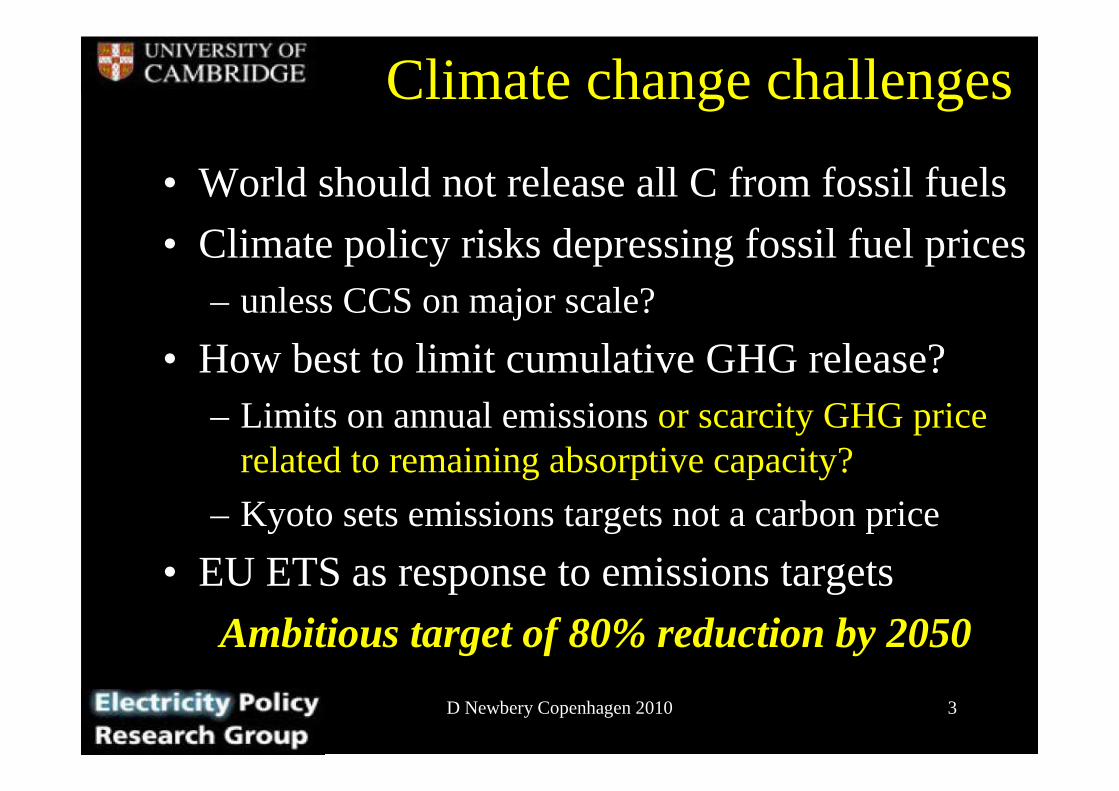
Climate change challenges
• World should not release all C from fossil fuels
• Climate policy risks depressing fossil fuel prices– unless CCS on major scale?
• How best to limit cumulative GHG release?– Limits on annual emissions or scarcity GHG price
related to remaining absorptive capacity?
– Kyoto sets emissions targets not a carbon price
• EU ETS as response to emissions targets
Ambitious target of 80% reduction by 2050
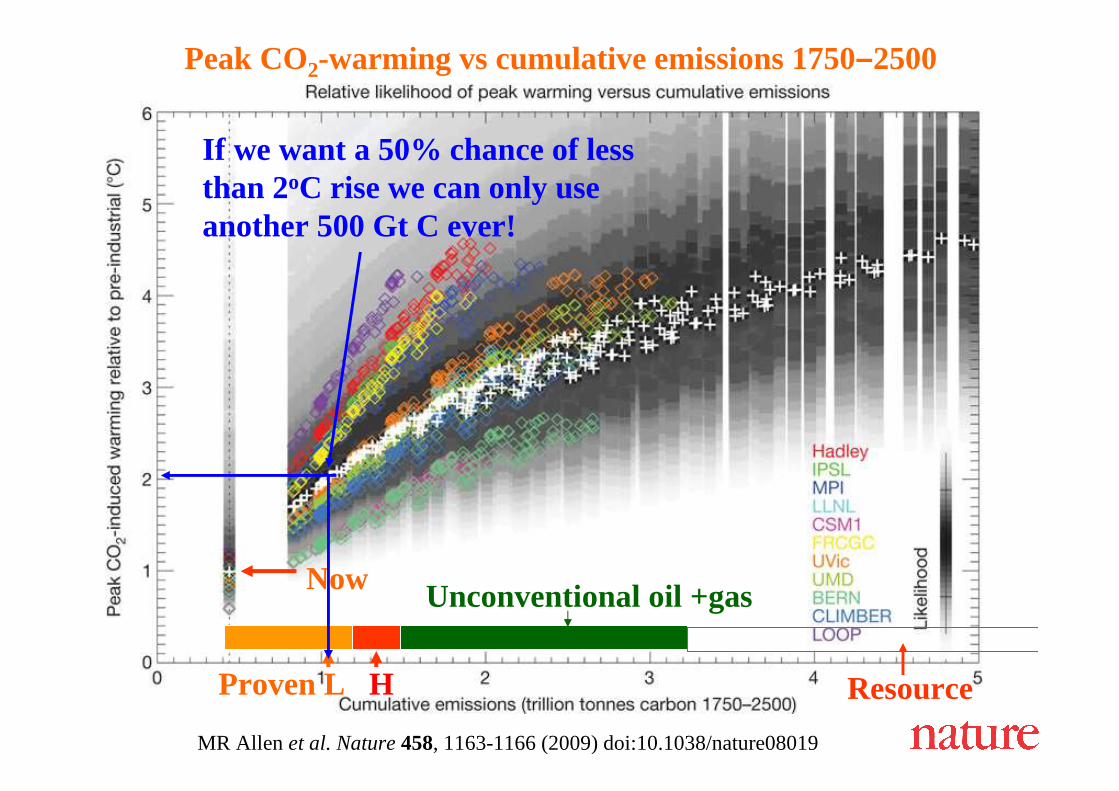
MR Allen et al. Nature 458, 1163-1166(2009)doi:10.1038/nature08019
Peak CO2-warming vs cumulative emissions 1750–2500
Now
Proven L H
Unconventional oil +gas
Resource
If we want a 50% chance of lessthan 2oC rise we can only useanother 500 Gt C ever!

D Newbery Copenhagen 2010 5
The logic of EU targets
• easy to determine “fair” allocation– and can buy off opponents with free allocations
• does not impinge on sovereign tax powers– EU carbon tax failed
• easier to give impression of leadership/action– without spelling out costs
– ETS => electricity prices ⇑ unanticipated by voters
Targets should be translated into sensible policy

6
EUA price October 2004-April 2010
0
5
10
15
20
25
30
35
Oct-04 Apr-05 Sep-05 Mar-06 Sep-06 Mar-07 Sep-07 Mar-08 Sep-08 Mar-09 Sep-09 Mar-10
Eur
o/t
CO
2
Futures Dec 2007OTC IndexSecond period Dec 2008Second period next DecCER 09
start of ETS
Second period
CO2 prices are volatile and now too low
Actual emissions revealed

D Newbery Copenhagen 2010 7
Effect of quota driven ETS
• Scarcity of EUAs determines EUA price– rather than long-run view of required carbon price
• Fuel cost + EUA of marginal plant sets electricity price
• When coal and gas competitive in electricity market
– EUA price set by coal-gas relative price
=> coal and gas-fired plant costs move together
Lax quantity target keeps coal competitive
Discourages greater CO2 reduction

D Newbery Copenhagen 2010 8NETA\Pxdata\fuel_choice
Fuel choices in UK electricity generation, 2000-10
0
2
4
6
8
10
12
14
16
18
20
22
24
26
28
30
0 2 4 6 8 10 12 14 16 18 20 22
Coal price Euros/MWht
Gas
pric
e E
uros
/MW
ht
Fuel post ETS
fuel pre-ETS
fuel +EUA cost Phase I
fuel + EUA Phase II
Gas cheaper than coal
Coal cheaper than gas
Coal 38%, gas 50%
Coal 34%, gas 55%
EUAs can make coal and gas competitive in GB
D Newbery Copenhagen 2010 9
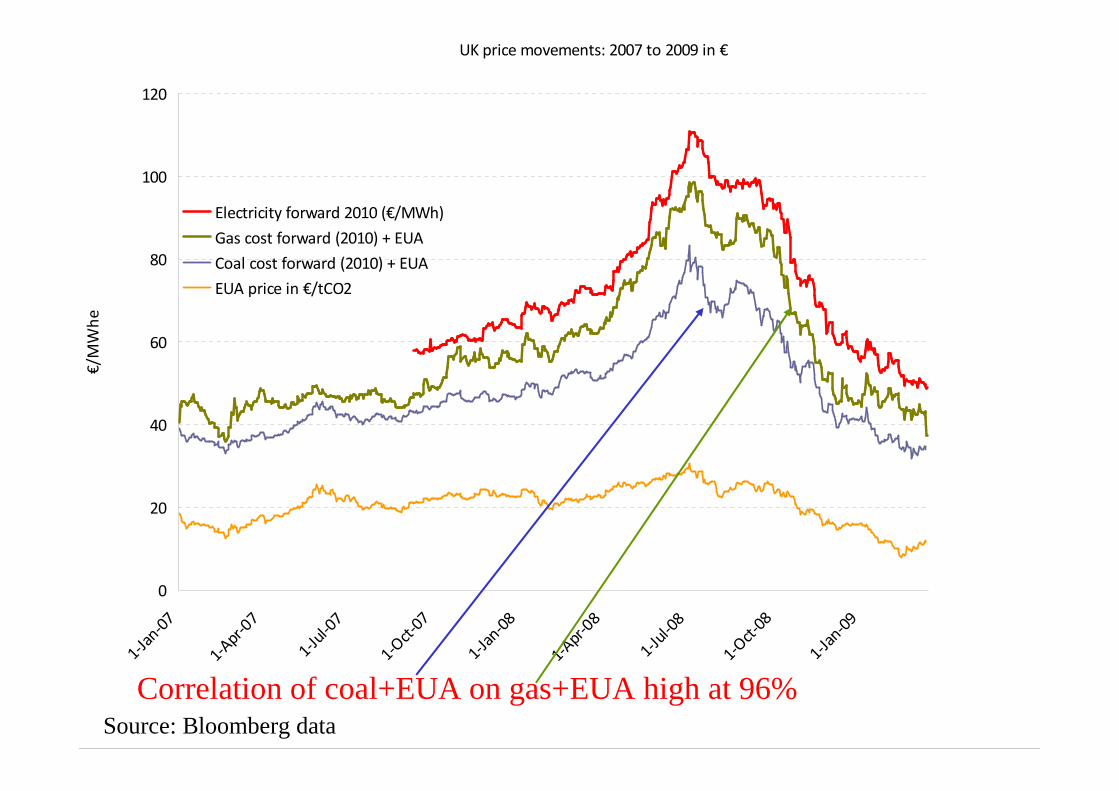
UK price movements: 2007 to 2009 in €
0
20
40
60
80
100
120
1-Ja
n-07
1-Apr-
07
1-Ju
l-07
1-Oct
-07
1-Ja
n-08
1-Apr
-08
1-Ju
l-08
1-O
ct-0
8
1-Jan
-09
€/M
Wh
e
Electricity forward 2010 (€/MWh)
Gas cost forward (2010) + EUA
Coal cost forward (2010) + EUA
EUA price in €/tCO2
Correlation of coal+EUA on gas+EUA high at 96%Source: Bloomberg data

D Newbery Copenhagen 2010 10
Collapse in EUA price impacts electricity pricesForward base year contracts - France and Germany Aug 2005-May 2006
0
10
20
30
40
50
60
70
29-Aug-05
13-Sep-05
28-Sep-05
13-Oct-05
28-Oct-05
12-Nov-05
27-Nov-05
12-Dec-05
27-Dec-05
11-Jan-06
26-Jan-06
10-Feb-06
25-Feb-06
12-Mar-06
27-Mar-06
11-Apr-06
26-Apr-06
11-May-
06
Eur
os/M
Wh
FR base 2007
DE base 2007
EUA coalcost
EUA gas cost
Source: EEX

D Newbery Copenhagen 2010 11
But not price less EUA cost => EUA directly feeds through to electricity price
Forward 2007 annual prices - France and Germany 2006
0
10
20
30
40
50
60
70
80
90
1-Ja
n-06
16-Ja
n-06
31-Ja
n-06
15-F
eb-06
2-Mar
-06
17-M
ar-06
1-Apr-0
6
16-A
pr-06
1-May
-06
16-M
ay-06
Eur
os/M
Wh
FR peak less gasEUA
DE peak less gasEUA
FR base less gasEUA
DE base less gasEUA
DE base less coalEUA
coal EUA cost
EUA cost inCCGT
Source: EEX
D Newbery Copenhagen 2010 12
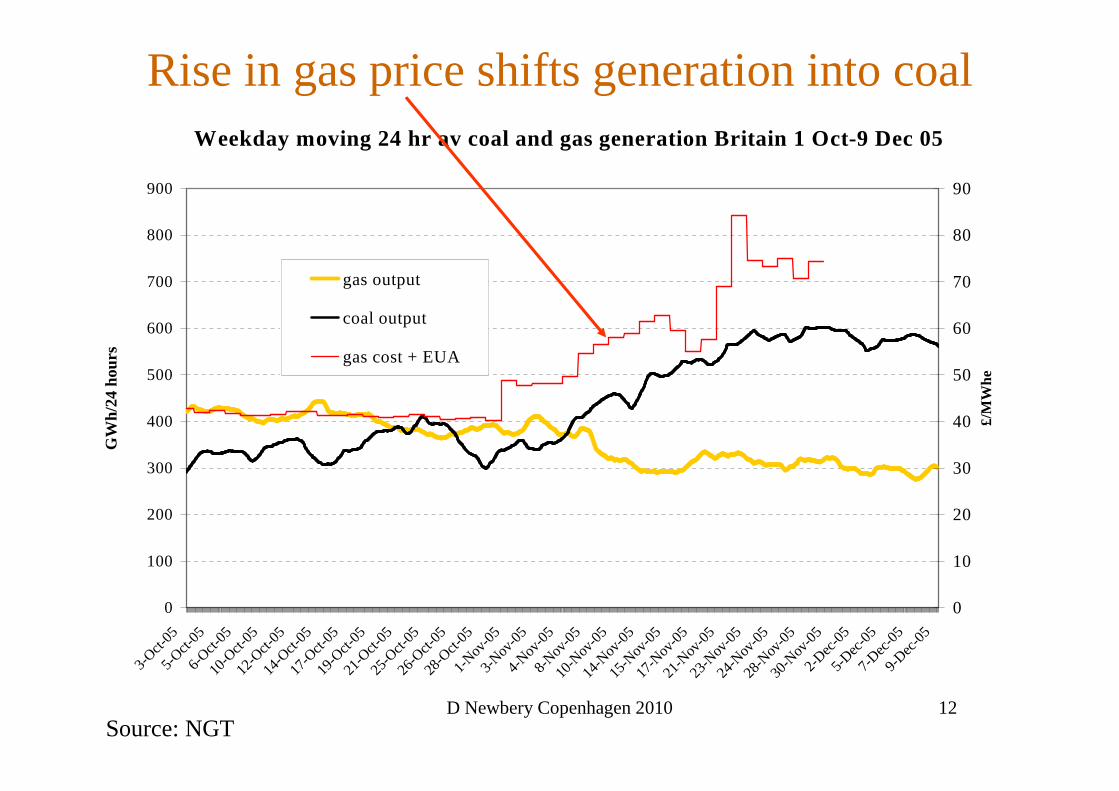
Rise in gas price shifts generation into coalWeekday moving 24 hr av coal and gas generation Britain 1 Oct-9 Dec 05
0
100
200
300
400
500
600
700
800
900
3-Oct-
055-
Oct-05
6-Oct-
0510
-Oct-
0512
-Oct-
0514
-Oct-
0517
-Oct-
0519
-Oct-
0521
-Oct-
0525
-Oct-
0526
-Oct-
0528
-Oct-
051-
Nov-0
53-
Nov-0
54-
Nov-0
58-
Nov-0
510
-Nov
-05
14-N
ov-0
515
-Nov
-05
17-N
ov-0
521
-Nov
-05
23-N
ov-0
524
-Nov
-05
28-N
ov-0
530
-Nov
-05
2-Dec
-05
5-Dec
-05
7-Dec
-05
9-Dec
-05
GW
h/24
hou
rs
0
10
20
30
40
50
60
70
80
90
£/M
Whe
gas output
coal output
gas cost + EUA
Source: NGT

D Newbery Copenhagen 2010 13
Impact on gas market
• Suppose gas price increases– initially: demand falls (fuel switch gas => coal)
=> demand for EUAs rises => EUA price ⇑
=> partially offsets advantage of coal
=> offsets some demand reduction for gas
=> reduces elasticity of demand for gas, ε– Lerner Index (p-c)/p = 1/ε=> increases market power of gas suppliers
• Gazprom, and suppliers with protected markets
Bad idea

D Newbery Copenhagen 2010 14
Demand for gas
Demand for gas in ESI
Priceof Gasg
Price rise
Initial demand fall (gas-coal)
EUA price rise induces someswitch back to gas
Demand for gas if EUA price constant
Demand for gas if EUA price varies

D Newbery Copenhagen 2010 15
Policy implications
• Imposing extra constraint on market reduces demand elasticities, amplifies market power
• If the price of EUAs is independent of gas demand then there is no multiplier effect=> banking over longer periods helps
• Other reasons for fixing C-price, not quantity:
Prices vs Quantities (Weitzman, 1974)
D Newbery Copenhagen 2010 16
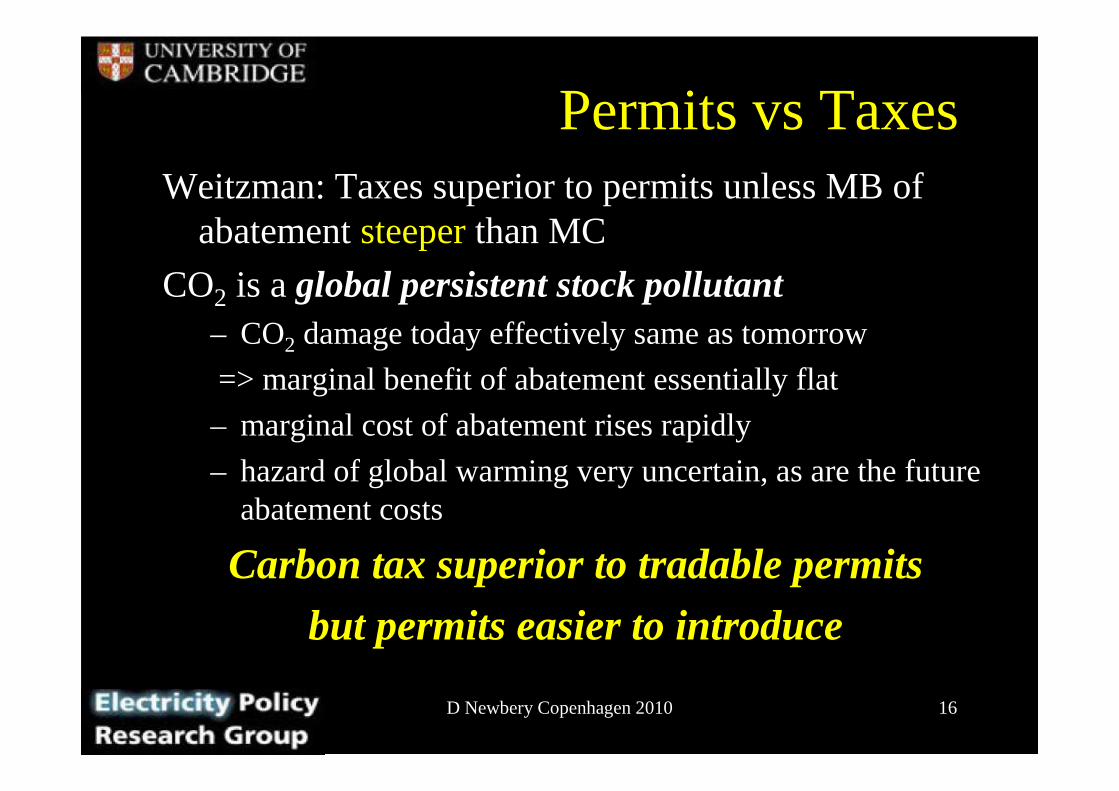
Permits vs TaxesWeitzman: Taxes superior to permits unless MB of
abatement steeperthan MC
CO2 is a global persistent stock pollutant– CO2 damage today effectively same as tomorrow
=> marginal benefit of abatement essentially flat
– marginal cost of abatement rises rapidly
– hazard of global warming very uncertain, as are the future abatement costs
Carbon tax superior to tradable permits
but permits easier to introduce

D Newbery Copenhagen 2010 17Newbery IIB 1 17
Start of ETS
Costs of errors setting prices or quantities
Reductions in emissions
Correct MC
MC
Best estimate of Marginal cost of abatement
MB, Marginal benefit from abatement
£/tC
efficiency lossfrom charge
efficiency lossfrom quota
t
Q* Q
t*

D Newbery Copenhagen 2010 18
Reforming ETS
• Reform EU ETS to provide rising price floor– sufficient for nuclear or on-shore wind or CCS
• Commitment to raise CO2 price at 3% p.a. over life of plant may suffice– €25/EUA 2010 => €34 in 2020, €61 in 2040 ...
• Making it credible: write CfD on this path– offer CfD at €45/EUA for 20y from commissioning?
makes extra carbon savings additional

D Newbery Copenhagen 2010 19
Carbon tax alternative
• Each Member State imposes a Carbon tax – tax bads not goods as part of fiscal adjustment
– rebated by EUA price for covered sector
– can start low: €20/t CO2 and escalate at 5% p.a. above RPI = €34/t by 2020
• Tax or full EUA auctioning to finance SET-Plan and RES, avoid taxing electricity

D Newbery Copenhagen 2010 20
Supporting RD&D
• 80% GHG reduction => decarbonising electricity
• Zero-C electricity requires renewables– and CCS + nuclear
• RES is not yet commercial (except in niches)– requires support now to drive down future costs
• R&D + deployment drives innovation and learning
• But RD&D is a public good benefiting the whole world
So how to gain collective support for RD&D?

D Newbery Copenhagen 2010 21
ETS and Renewables
• Aim: deliver low-C solutions for world
• Need to explore a portfolio of possible solutions– Then select those which show most promise
• Danger with RES target – choose cheapest– Fortunately MS have differing resources to explore
– And differing aspirations to industrial leadership
20-20-20 Directive: least bad feasible solution?

D Newbery Copenhagen 2010 22
Experience curves justify deployment support
Source: IEA

D Newbery Copenhagen 2010 23
2050 projected CO2 price
0
10
20
30
40
50
60
70
with 12.5% renewables with 20% renewables 2009 projections
Eur
os/to
nne
CO
2
Source: Committee on Climate Change, 2008 and 2009
2008 projections 2009 projections
after Renewables Directive andrecessionRenewables
depressesC-price

D Newbery Copenhagen 2010 24
Failures of ETS
• Current ETS sets quota for total EU emissions
• Renewables Directive increases RES=> increased RES does not reduce CO2
=> but does reduce price of EUAs
=> prejudices other low-C generation like nuclear
• Risks undermining support for RES
Solved by fixing EUA price instead of quota

D Newbery Copenhagen 2010 25
Reforming 2020 Directive• Not to reduce CO2 - ETS ensures no impact
– ETS intended to price CO2– but fails to give credible signals
• not to support low-C generation, only RES
=> support to RD&D to drive down costs of RES
• How? Support investment or generation?
• Learning comes from:– design (cost, reliability, controllability, etc)
– production, installation, siting/planning, grid integration
but not from operation (provided reliable)

D Newbery Copenhagen 2010 26
Implications for RES support• No RES should bid below SRMC
– Given that it can rapidly reduce output=> support should be for availability, not output
• RES should not have automatic priority– merit order should be based on avoided costs
=> if RES is more costly than alternatives (including balancing, redispatch), back it off=> foregone RES generation should count to RES
target (as it has no CO2 credit)– unless ETS reformed to support CO2 price

D Newbery Copenhagen 2010 27
Conclusions• ETSto price CO2
– but volatile, price too low, impacts gas market power• RES Directiveto support deployment and learning
=> Well defined MS funding in place through obligations• But RES Directive undermines ETS
– risks bringing ETS into disrepute=> Reform ETS – provide floor price
– de-links gas and coal markets– reduces risk of low-C generation investment– makes Renewables contribute to reduced emissions
• Failing which encourage MS to impose C tax– With rebates for EUA’s surrendered

The impact of the EU ETS on European energy and carbon markets
David Newbery
Danish Environmental Economic ConferenceSkodsborg Hotel 23 August 2010
http://www.eprg.group.cam.ac. uk

Spare slides on SET-Plan
D Newbery Copenhagen 2010 30
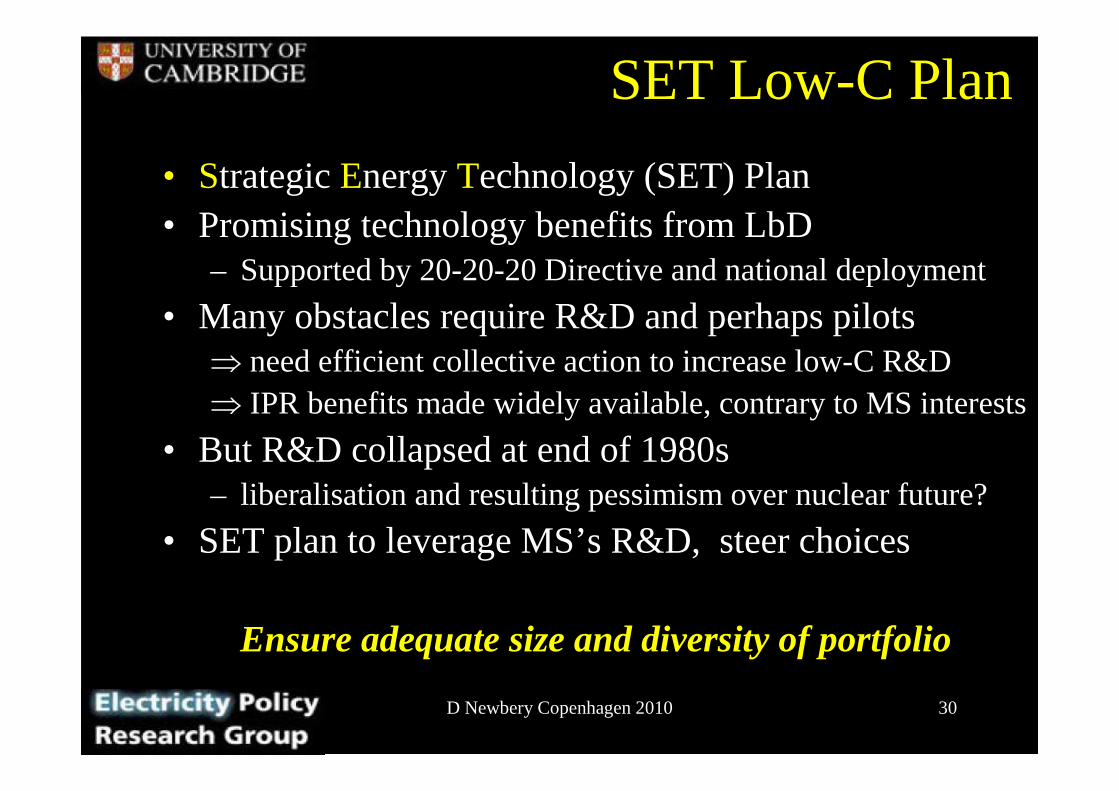
SET Low-C Plan
• Strategic Energy Technology (SET) Plan• Promising technology benefits from LbD
– Supported by 20-20-20 Directive and national deployment
• Many obstacles require R&D and perhaps pilots⇒ need efficient collective action to increase low-C R&D⇒ IPR benefits made widely available, contrary to MS interests
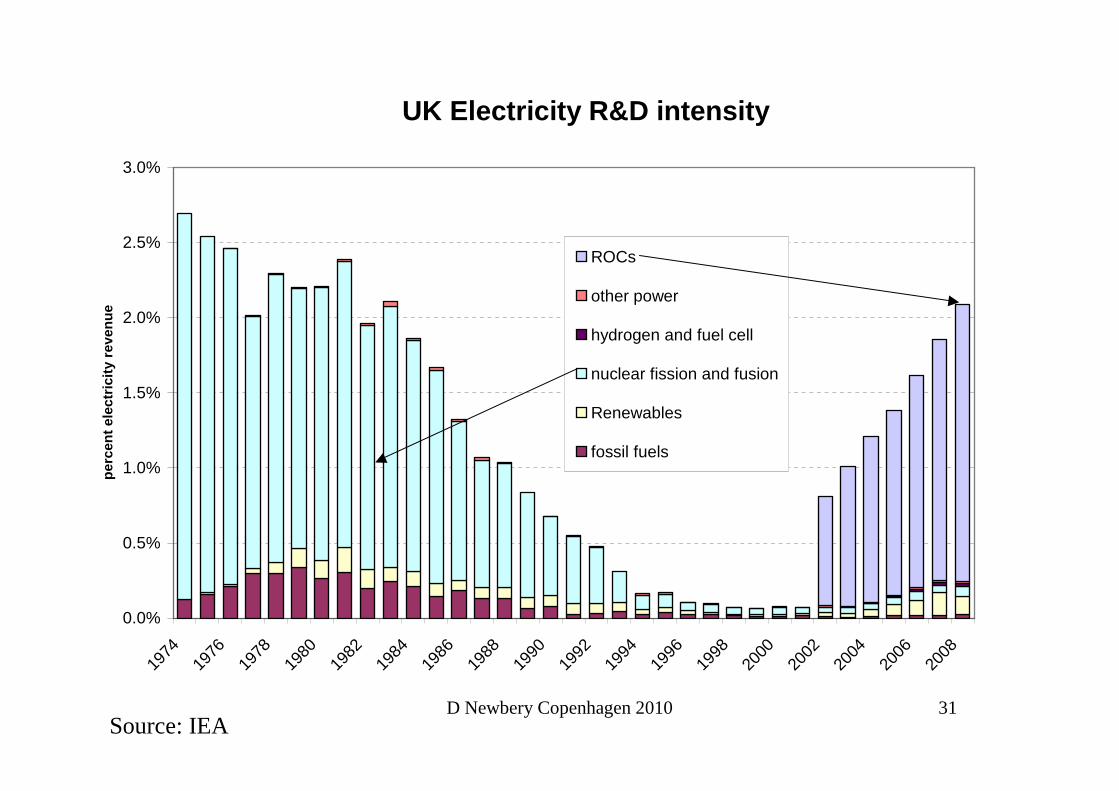
• But R&D collapsed at end of 1980s– liberalisation and resulting pessimism over nuclear future?
• SET plan to leverage MS’s R&D, steer choices
Ensure adequate size and diversity of portfolio
D Newbery Copenhagen 2010 31
UK Electricity R&D intensity
0.0%
0.5%
1.0%
1.5%
2.0%
2.5%
3.0%
1974
1976
1978
1980
1982
1984
1986
1988
1990
1992
1994
1996
1998
2000
2002
2004
2006
2008
perc
ent e
lect
ricity
rev
enue
ROCs
other power
hydrogen and fuel cell
nuclear fission and fusion
Renewables
fossil fuels
Source: IEA

D Newbery Copenhagen 2010 32
UK Renewables R&D intensity (3-yr moving average)
0.00%
0.05%
0.10%
0.15%
1975
1977
1979
1981
1983
1985
1987
1989
1991
1993
1995
1997
1999
2001
2003
2005
2007
perc
ent e
lect
ricity
rev
enue
geo-thermal
bio-energy
ocean
wind
solar
Source: IEA

D Newbery Copenhagen 2010 33
SET support schemes
• 2007 SET R&D non-nuclear ∼ €2.4bn (Nuclear €0.94)– 70:30 private:public; 80:20 MS:EC
• SET plan to 2020 total €70 bn or double current rate– Grid: €2bn; fuel cells + H2: €5bn; Wind: €6bn;
– nuclear fission €7bn; bio-energy € 9bn;
– smart cities €11 bn; CCS €13 bn; Solar: €16bn;
• Joint programming to amplify MS R&D– CCS as an example
ETS auction revenues as funding source?

D Newbery Copenhagen 2010 34
Three pillars of EU low-C policy
• ETSto price CO2
– for mature low-C investments - reform needed
• 20-20-20 Directive: demand pull for renewables– justified by learning spillovers and burden sharing
– induces near-commercial low-C deployment
• EU SET-Plan to treble R&D spend– to support less mature low-C options
Ensure they work together not in conflict