Embed Size (px)
DESCRIPTION
The New EU ETS and the Global Carbon Market Montréal 2010. Dr Nicola Notaro Deputy Head of the Water Unit DG Environment, European Commission. Context. Political framework. Overall EU objective: limit global warming to 2° C above pre-industrial level to avoid dangerous climate change - PowerPoint PPT Presentation
Citation preview
The New EU ETS and the
Global Carbon Market Montréal 2010
Dr Nicola Notaro
Deputy Head of the Water UnitDG Environment, European Commission
Context
Political framework
Overall EU objective: limit global warming to 2° C above pre-industrial level to avoid dangerous climate change Stern report (2006): no action = costs of climate change to 5
– 20% of global GDP 4th IPCC report (2007): man-made climate change
“unequivocal”
European Council March 2007 20% reduction of GHG emissions by 2020, independently of
an international agreement 30% in case of satisfactory international agreement 20% share of renewable energy by 2020 20% increase of energy efficiency by 2020
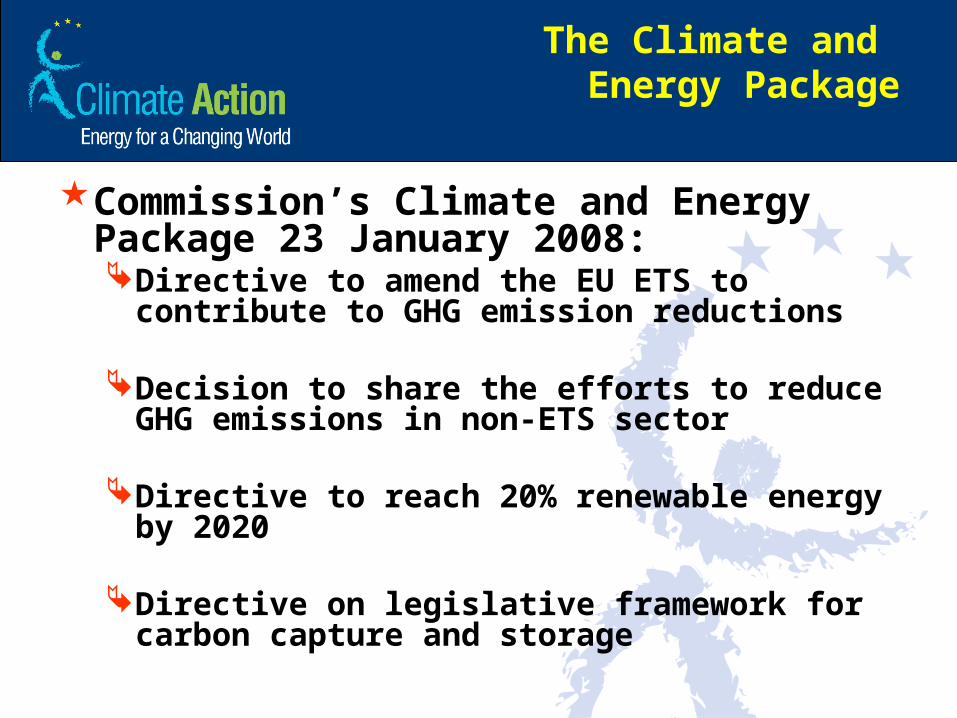
The Climate and Energy Package
Commission’s Climate and Energy Package 23 January 2008:Directive to amend the EU ETS to contribute to
GHG emission reductions
Decision to share the efforts to reduce GHG emissions in non-ETS sector
Directive to reach 20% renewable energy by 2020
Directive on legislative framework for carbon capture and storage
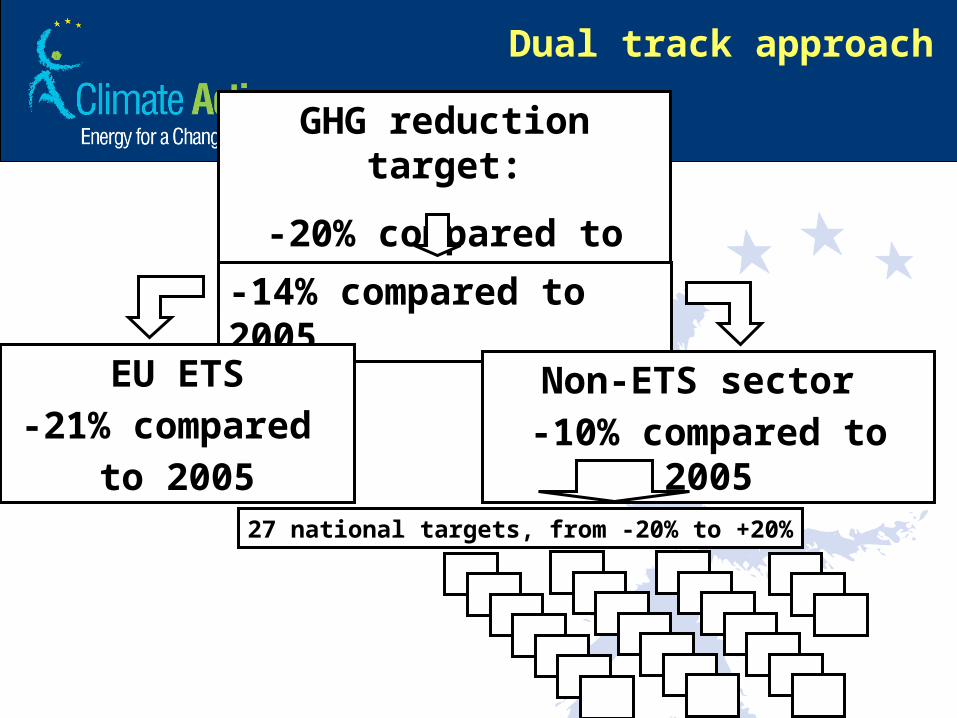
GHG reduction target:
-20% compared to 1990
-14% compared to 2005
EU ETS-21% compared
to 2005
Non-ETS sector -10% compared to 2005
27 national targets, from -20% to +20%
Dual track approach
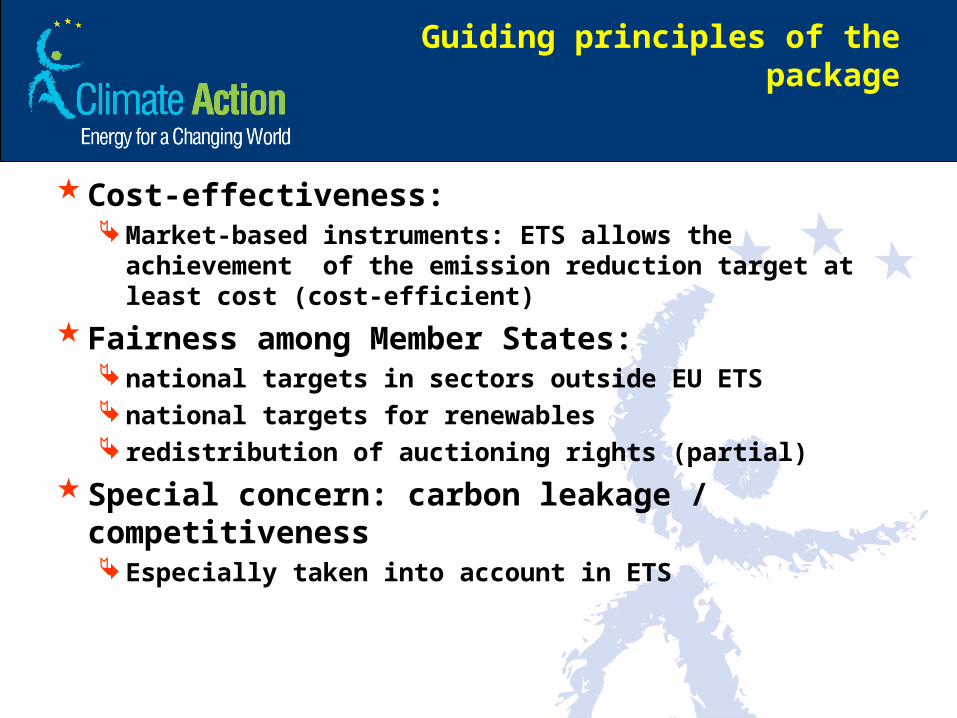
Guiding principles of the package
Cost-effectiveness: Market-based instruments: ETS allows the achievement of
the emission reduction target at least cost (cost-efficient)
Fairness among Member States: national targets in sectors outside EU ETS national targets for renewables redistribution of auctioning rights (partial)
Special concern: carbon leakage / competitiveness Especially taken into account in ETS
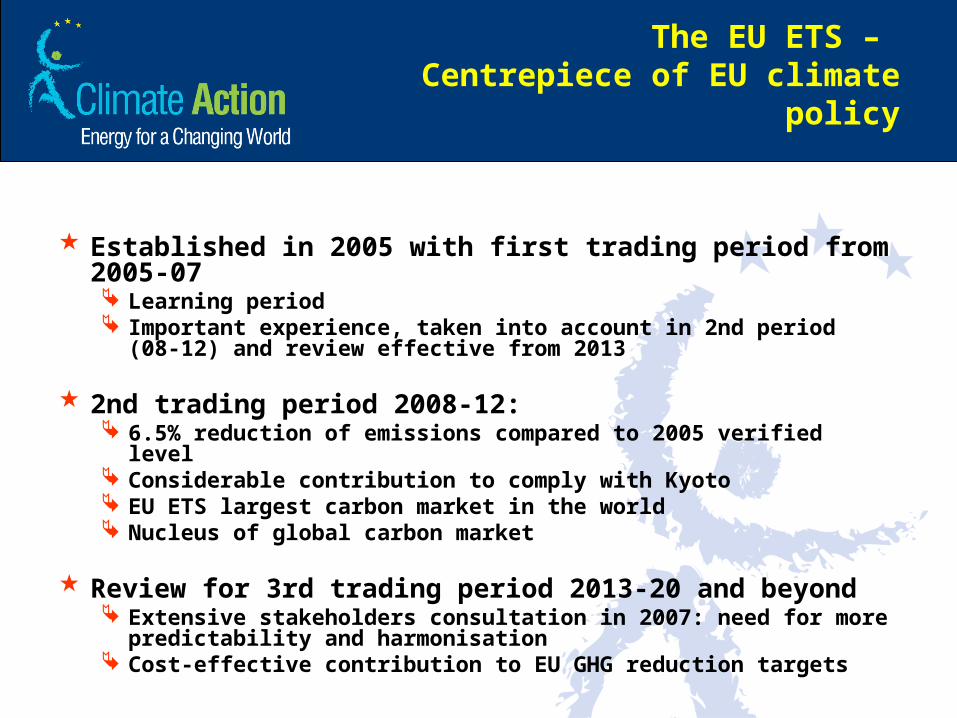
The EU ETS – Centrepiece of EU climate policy
Established in 2005 with first trading period from 2005-07 Learning period Important experience, taken into account in 2nd period (08-12) and
review effective from 2013
2nd trading period 2008-12: 6.5% reduction of emissions compared to 2005 verified level Considerable contribution to comply with Kyoto EU ETS largest carbon market in the world Nucleus of global carbon market
Review for 3rd trading period 2013-20 and beyond Extensive stakeholders consultation in 2007: need for more
predictability and harmonisation Cost-effective contribution to EU GHG reduction targets
Main changes
Key elements in the new EU ETS
EU-wide capScopeHarmonised allocation rulesCarbon leakageUse of auctioning revenuesStrengthened Monitoring, Reporting and
Verification/Market oversightTowards a global carbon market: ETS
linking and CDM
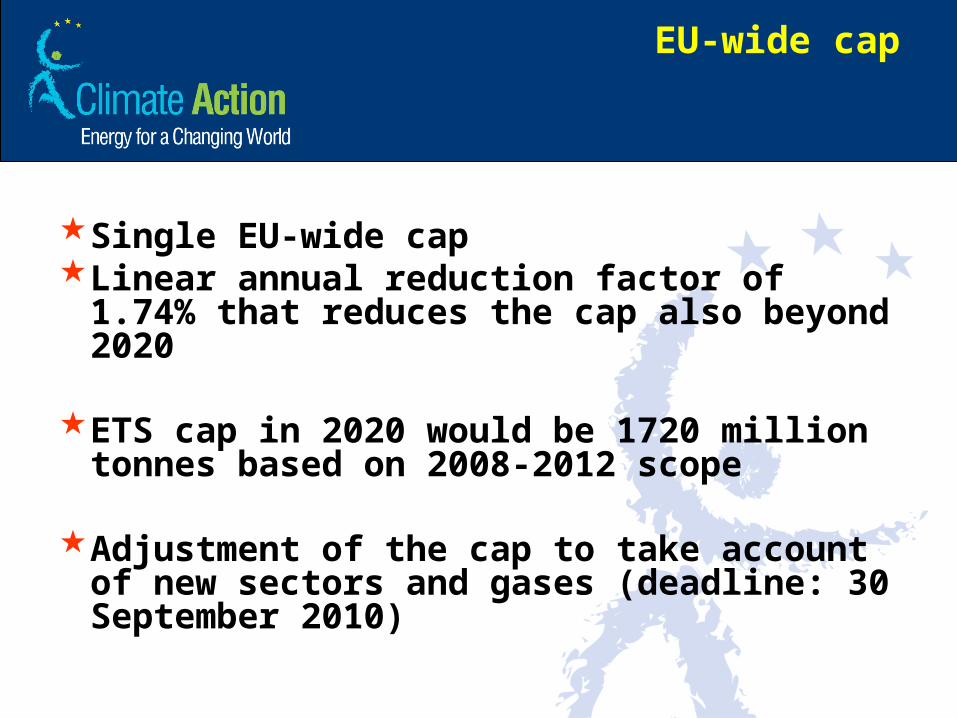
EU-wide cap
Single EU-wide capLinear annual reduction factor of 1.74% that
reduces the cap also beyond 2020
ETS cap in 2020 would be 1720 million tonnes based on 2008-2012 scope
Adjustment of the cap to take account of new sectors and gases (deadline: 30 September 2010)
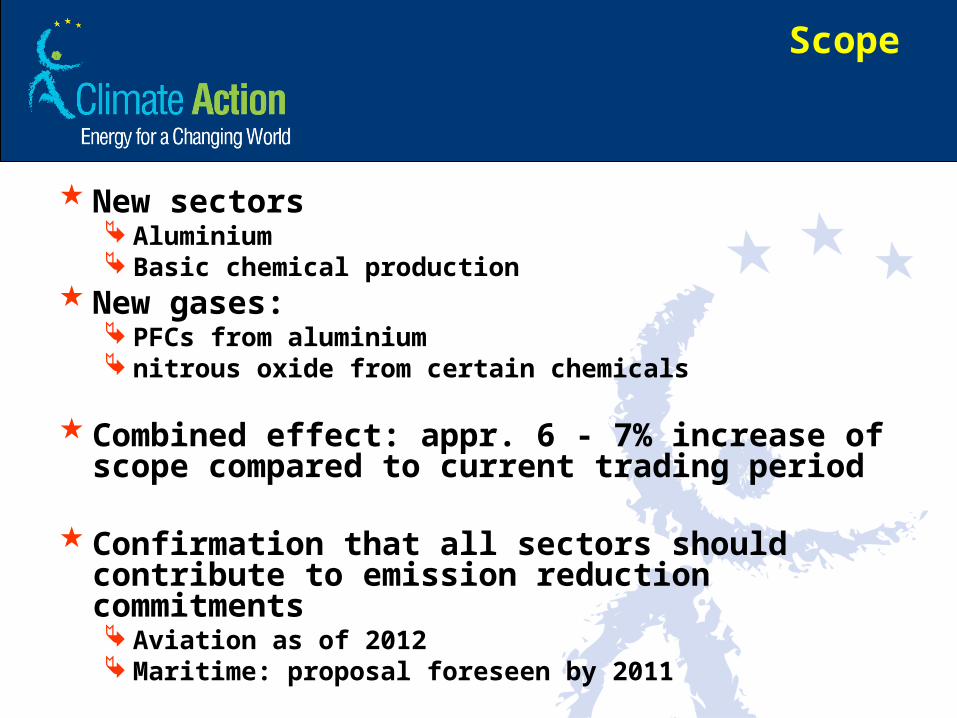
Scope
New sectors Aluminium Basic chemical production
New gases: PFCs from aluminium nitrous oxide from certain chemicals
Combined effect: appr. 6 - 7% increase of scope compared to current trading period
Confirmation that all sectors should contribute to emission reduction commitments Aviation as of 2012 Maritime: proposal foreseen by 2011
Harmonised allocation rules
Fully harmonised allocation rules Minimum distortion of competition No ‘National Allocation Plans’, only ‘National Implementing Measures’, a list
of installations with corresponding allocations based on harmonised rules Auctioning is the default allocation method
Principle: no free allocation for energy production, phase out of free allocation for other sectors exposed or not to international competition
Auctioning Regulation to be adopted by 30 June 2010 Auctioning based on clear and objective principles laid down in Regulation More than 50% of allowances to be auctioned in 2013, increasing thereafter
Free allocation on basis of ex-ante benchmark for all sectors receiving free allocation
Carbon leakage: “exposed sectors” (1)
Quantitative thresholds laid down in Directive:5% cost increase and 10% trade exposure30% for one of the twoQualitative analysis for borderline sectors
List determined in December 2009Allocation for free, 100%Review every five years
Each year, additions are possible in case of change that has substantial impact on the sector
Carbon leakage: “exposed and non exposed sectors” (2)
Individual allocations for free at 100% (exposed) or 80% (non-exposed) down to 0% in 2027% is of the amount determined by
benchmarks
Option of transitional free allowances in power sector
Total amount in 2013 capped at 70% of 2005-2007 verified emissions, gradual decrease to zero in 2020
10 Member States qualify New MS except SI, SK, MS to apply by 30 September 2011, COM can reject within 6 months
For existing installations only
Conditional upon national plan to modernise energy infrastructure, clean technologies, diversification of energy mix Taking into account the need to limit as far as possible directly linked
prices rises, Annual reporting to the Commission
Benchmarks (1)
Free allocation based on benchmarks, where possible:Allocations determined ex-ante, no ex-post
adjustment
Starting point: average performance of 10% most efficient installations in (sub)sector
Important to determine the products for which to set the benchmarks (for e.g. chemical industry a few lead products must be selected)
Benchmarks (2)
Benchmarks to be multiplied by historic production to get the amount of free allowances per installation
Maximum total free allocation for industry set at industry’s share in total cap based on emissions in 2005-07A correction factor may be applied if necessary (if
benchmarks are too generous) to keep within the maximum
Solidarity
88% of auction rights distributed according to MS’ share in verified emissions in 2005 or average of period from 2005 – 07 (whichever is the highest)
10% redistributed for ‘solidarity and growth’ (Annex IIa)
2% “Kyoto bonus”: for MS which are at least 20% below Kyoto base year emission levels (Annex IIb)
Use of auctioning revenues (1)
Member States collect and decide on the use of auctioning revenues
50% of revenues should be used for climate related purposes domestically or in third countries that have ratified the international agreement including: Global Energy Efficiency and Renewable Energy Fund,
Adaptation Fund Developing renewable energies Avoided deforestation Carbon Capture and Storage (CCS) including in third countries
that ratify the international agreement Low emission and public forms of transport
Use of auctioning revenues (2)
Fiscal or financial support policies can be accounted for
MS to inform COM on use of revenues by means of the reports under the Kyoto implementation decision 280/2004/EC
Incentivising CCS and RES projects
300 million allowances available for CCS and innovative renewable energy technology demonstration projectsUntil 31 December 2015 To be given via Member StatesProjects selected on the basis of objective and
transparent criteriaGeographically balanced supportSupport for a single project no more than 15% of
total number of allowancesRules to be determined by comitology
Market oversight provisions (1)
Commission to monitor carbon marketRegular annual reporting to Council and
Parliament If evidence of malfunctioning, special
report along with proposals to improve market functioning
Member States to report on auctions; to be published on Commission website
Market oversight provisions (2)
Insider dealing and market manipulation: By end of 2010, examination whether market is sufficiently
protected from insider dealing and market manipulation If appropriate, proposals to eliminate insider dealing and
market manipulation Excessive price fluctuations:
Definition: average price of allowances in a six months period more than three times of the two preceding years;
Climate Change Committee to meet and consider possible measures (alternatively):
• Bring forward auctions; • Authorise auctioning of up to 25% of remaining NER
Strengthened Monitoring, Reporting and Verification
Monitoring and Reporting Regulation To replace current guidelines To be adopted by 31 December 2011
Verification and Accreditation Regulation Rules for accreditation are new To be adopted by 31 December 2011
Harmonised €100 penalty for non-compliance Inflation-linked Requirement to surrender allowances remains
Single Community registry
Quantitative use of JI/CDM
Maximum allowed use of Kyoto mechanisms fixed at about 4.5% of the EU 2020 target: this is unlikely ever to be reached!
Quality of CDM
Comitology procedure to restrict from 1/1/2013 the use of specific credits Ensure credits represent real, verifiable, additional and
permanent reductions, clear SD benefits and no significant negative environmental or social impacts
Can be done at any time (no one-off measure)
If there is an international agreement Only credits from projects from countries that have ratified
agreement from 1/1/2013
Adjustment from 20% to 30%
Three months after the signature of an international agreement, COM to submit report to assess implications to adjust from 20 to 30%
Report represents basis for proposal to be submitted co-decision
Proposal based on principles of transparency, economic efficiency, cost-effectiveness, fairness, solidarity in the distribution of efforts;
28
The international carbon market and linking emissions trading
systems
29
Where we are
The EU ETS has been the core of the ‘global carbon market’• An absolute emissions cap covering 30
countries for around 11,500 installations and emissions from aircraft
• EU ETS and EU Member States have provided the main demand for Clean Development Mechanism (CDM) credits
• The EU: around 10% of global GHG emissions
30
Where we need to go
Limit global temperature increase to 2°C All countries, including emerging economies, need to
take more action to reduce emissionsPledges under Copenhagen AccordEmission trading systems are a cost-effective way to
do soCap and trade in place or in discussion: US (Federal,
RGGI and WCI), Australia (2013?), Japan, Switzerland, New Zealand and others. ETS developments in Mexico, South Korea, China and India…
31
An important source of climate finance
Climate actions require roughly € 100 billion per year by 2020 in developing countries, with total international public finance needs estimated around € 22 to 50 billion per year.
A strong carbon market can deliver € 38 billion per year by 2020, requires: Ambitious developed country action (-30% developed country
as a group by 2020 rel to 1990) A shift from CDM to sectoral crediting mechanism in advanced
developing countries and sectors
Making the most of the carbon market reduces the need for public finance
32
A robust international carbon market
Through bottom up linking of cap and trade systems in developed countries
OECD wide market by 2015- transatlantic market as first step
Linking increases liquidity, reduces volatility, increases opportunity for low cost abatement
33
A robust international carbon market
Inclusion of advanced developing countries and competitive sectors by 2020
Reform of CDM and replacement over time by a sectoral mechanism for advanced developing economies and sectors
Sectoral crediting as a stepping stone to ETS
34
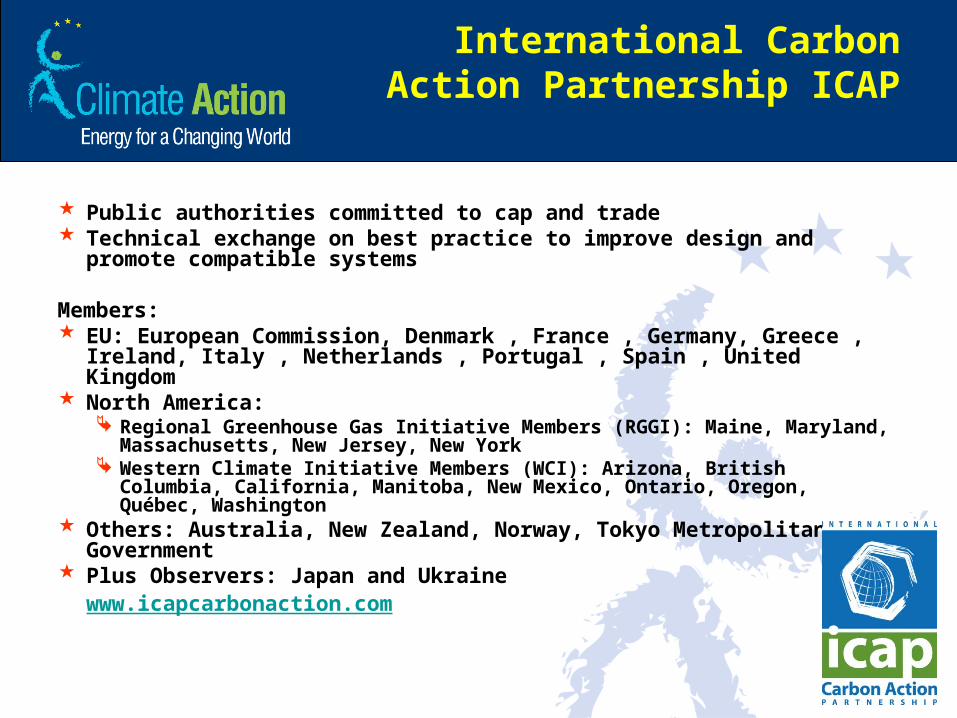
International Carbon Action Partnership ICAP
Public authorities committed to cap and trade Technical exchange on best practice to improve design and promote
compatible systems
Members: EU: European Commission, Denmark , France , Germany, Greece ,
Ireland, Italy , Netherlands , Portugal , Spain , United Kingdom North America:
Regional Greenhouse Gas Initiative Members (RGGI): Maine, Maryland, Massachusetts, New Jersey, New York
Western Climate Initiative Members (WCI): Arizona, British Columbia, California, Manitoba, New Mexico, Ontario, Oregon, Québec, Washington
Others: Australia, New Zealand, Norway, Tokyo Metropolitan Government
Plus Observers: Japan and Ukraine www.icapcarbonaction.com
RGGI & WCI
RGGI (10 North-east US States) 10% reduction CO2 emissions from the electricity sector by 2018 Allowances are auctioned Proceeds for clean energy/consumer benefits Offsets from projects in RGGI States, 10% ceiling per power plant First auctions in 2009
WCI 15% reduction Kyoto gases below 2005 by 2020, multisector,
offsets possible but capped, complementary measures Still to start…
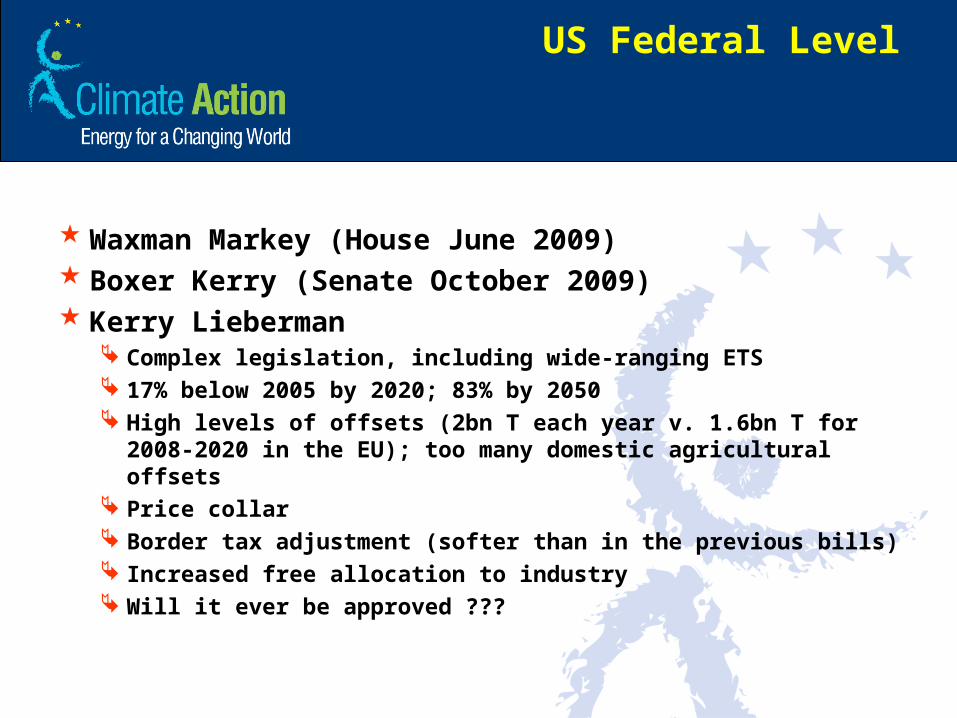
US Federal Level
Waxman Markey (House June 2009) Boxer Kerry (Senate October 2009) Kerry Lieberman
Complex legislation, including wide-ranging ETS 17% below 2005 by 2020; 83% by 2050 High levels of offsets (2bn T each year v. 1.6bn T for 2008-2020
in the EU); too many domestic agricultural offsets Price collar Border tax adjustment (softer than in the previous bills) Increased free allocation to industry Will it ever be approved ???
37
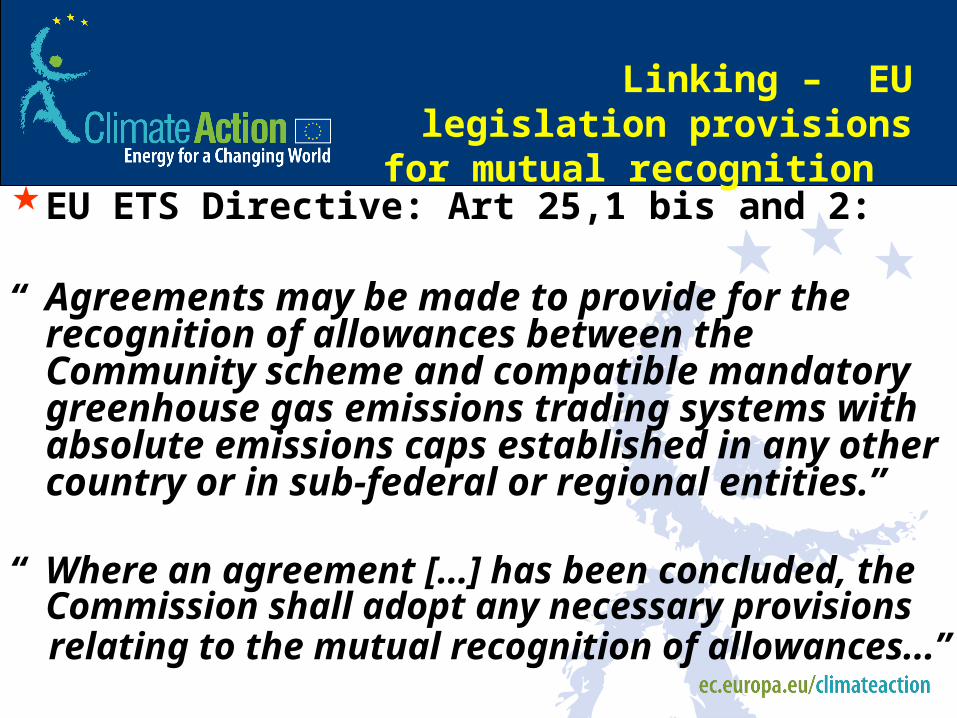
Linking – EU legislation provisions for mutual
recognition EU ETS Directive: Art 25,1 bis and 2:
“ Agreements may be made to provide for the recognition of allowances between the Community scheme and compatible mandatory greenhouse gas emissions trading systems with absolute emissions caps established in any other country or in sub-federal or regional entities.”
“ Where an agreement […] has been concluded, the Commission shall adopt any necessary provisions
relating to the mutual recognition of allowances...”
38
Linking through Aviation
All flights into and out of the EU will be covered by EU ETS from 2012
Where non-EU ETS countries take action on aviation emissions, the EU ETS may recognise it as equivalent action
39
Importance of coordination of recognition policies
In practice two systems accepting the same international credits for compliance will be linked through these international credits
Need for cooperation in the development phase
40
Info on the Climate Action and Renewable Energy Package at http://ec.europa.eu/environment/climat/climate_action.htm