Embed Size (px)
Citation preview

Guangdong ETS - Impact Assessment and
policy recommendations
ZHAO Daiqing · WANG Peng · DAI Hancheng Energy Strategy Research Center
Guangzhou Institute of Energy Conversion, CAS
20th AIM International Workshop – Tsukuba, Japan, January 23-24, 2015
Main Contents
Macroeconomic Impact Analysis of GD ETS 2
1
Introduction of Guangdong ETS – the market building processes
新西兰ETS
广东ETS
泰国ETS
深圳ETS
重庆ETS
上海ETS
天津ETS 北京ETS
湖北ETS
南韩ETS
日本东京ETS
日本全国范围ETS 中国全国范围ETS
哈萨克斯坦ETS
欧盟 EU ETS
瑞士ETS
俄罗斯ETS
乌克兰ETS
土耳其ETS
巴西ETS
智利ETS
墨西哥ETS
美国加州ETS
加拿大不列颠哥伦比亚省 (WCI)
加拿大魁北克省(WCI)
加拿大安大略省(WCI) 美国区域温室气体减排计划
(RGGI)
加拿大马尼托巴ETS (链接WCI)
operating designing
澳大利亚ETS
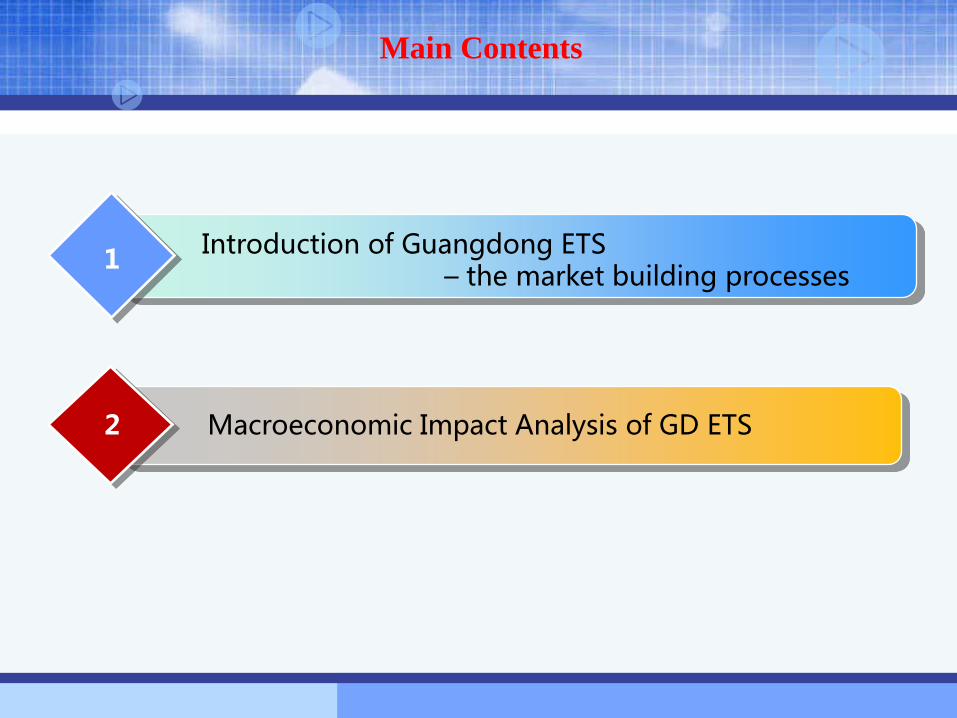
Carbon Trading Mechanism has Become an Important Tool for
Governments to Reduce Carbon Emission
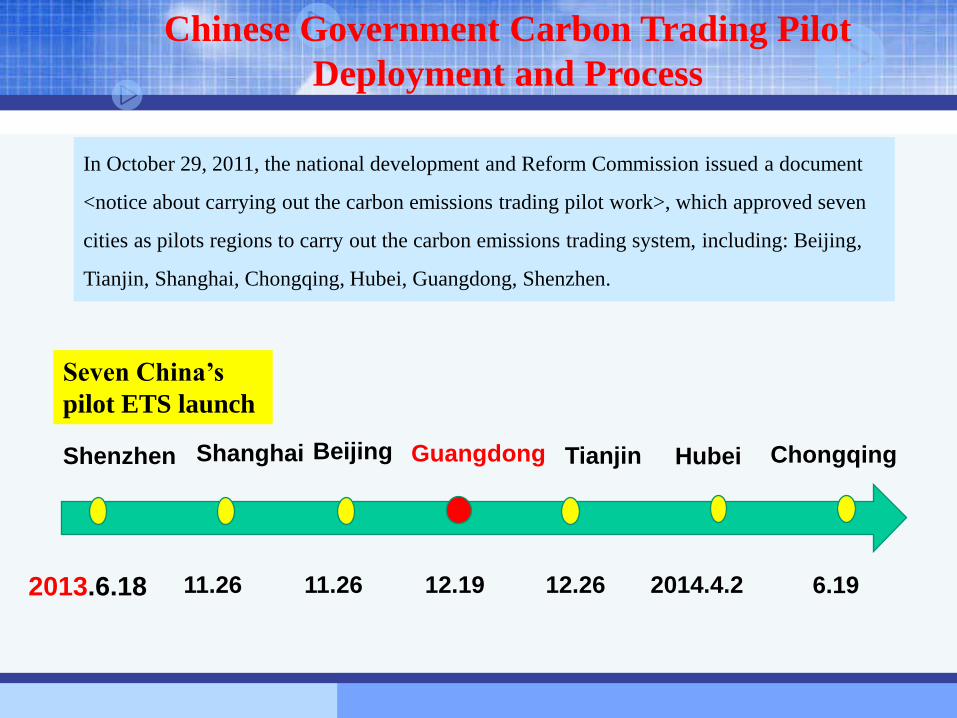
Chinese Government Carbon Trading Pilot
Deployment and Process
Shenzhen Beijing Shanghai Guangdong Tianjin Hubei Chongqing
2013.6.18 11.26 11.26 12.19 12.26 2014.4.2 6.19
In October 29, 2011, the national development and Reform Commission issued a document
<notice about carrying out the carbon emissions trading pilot work>, which approved seven
cities as pilots regions to carry out the carbon emissions trading system, including: Beijing,
Tianjin, Shanghai, Chongqing, Hubei, Guangdong, Shenzhen.
Seven China’s
pilot ETS launch
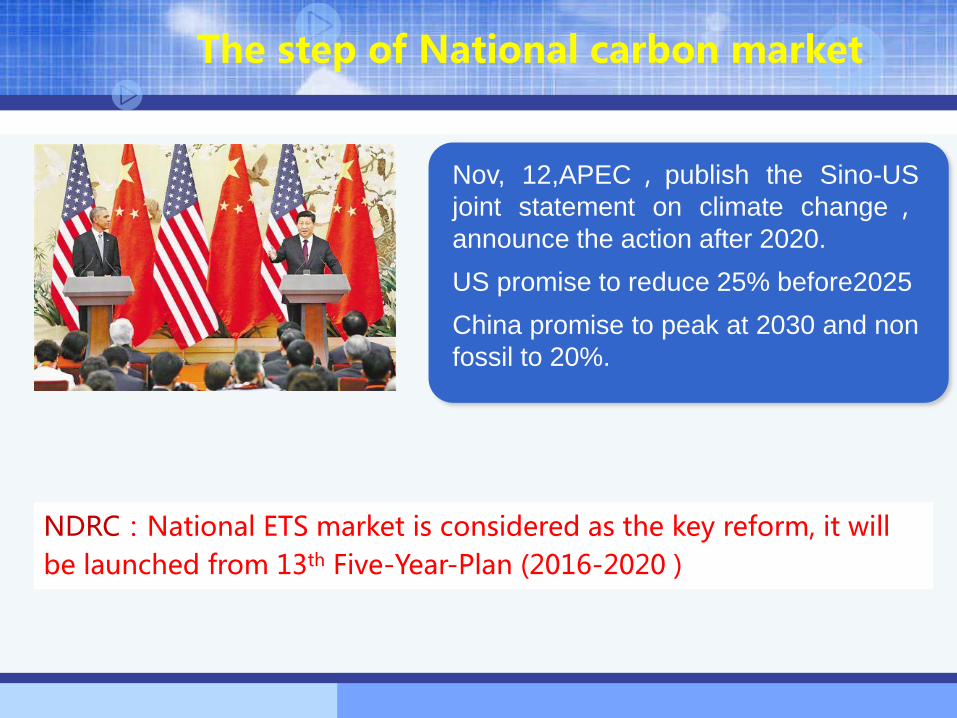
The step of National carbon market
Nov, 12,APEC,publish the Sino-US
joint statement on climate change ,announce the action after 2020.
US promise to reduce 25% before2025
China promise to peak at 2030 and non
fossil to 20%.
NDRC:National ETS market is considered as the key reform, it will
be launched from 13th Five-Year-Plan (2016-2020 )
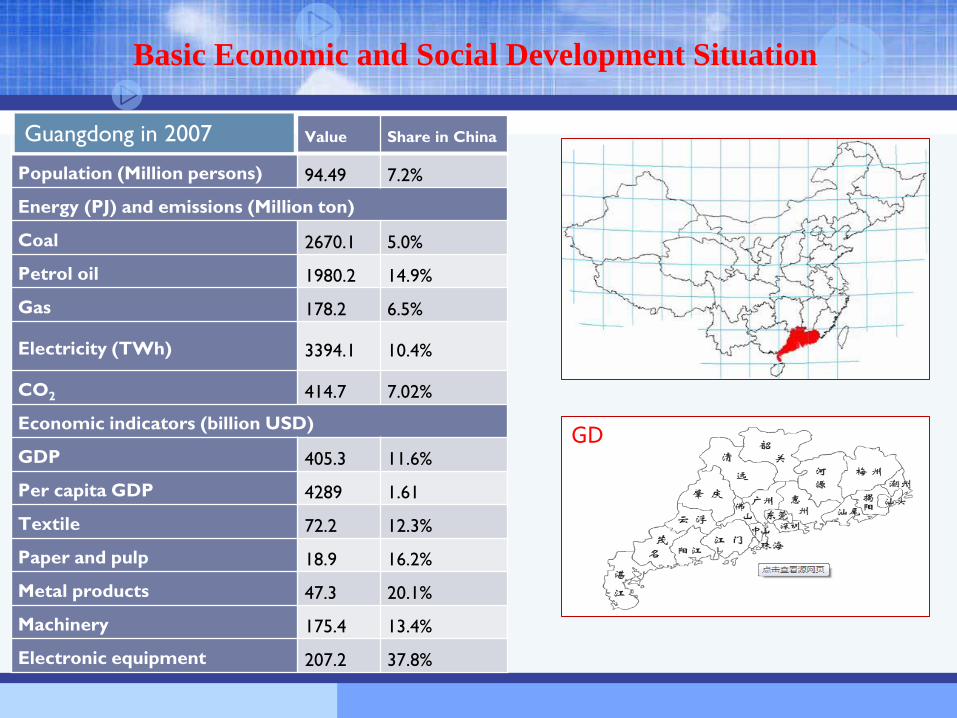
Basic Economic and Social Development Situation
GD
Value Share in China
Population (Million persons) 94.49 7.2%
Energy (PJ) and emissions (Million ton)
Coal 2670.1 5.0%
Petrol oil 1980.2 14.9%
Gas 178.2 6.5%
Electricity (TWh) 3394.1 10.4%
CO2 414.7 7.02%
Economic indicators (billion USD)
GDP 405.3 11.6%
Per capita GDP 4289 1.61
Textile 72.2 12.3%
Paper and pulp 18.9 16.2%
Metal products 47.3 20.1%
Machinery 175.4 13.4%
Electronic equipment 207.2 37.8%
Guangdong in 2007
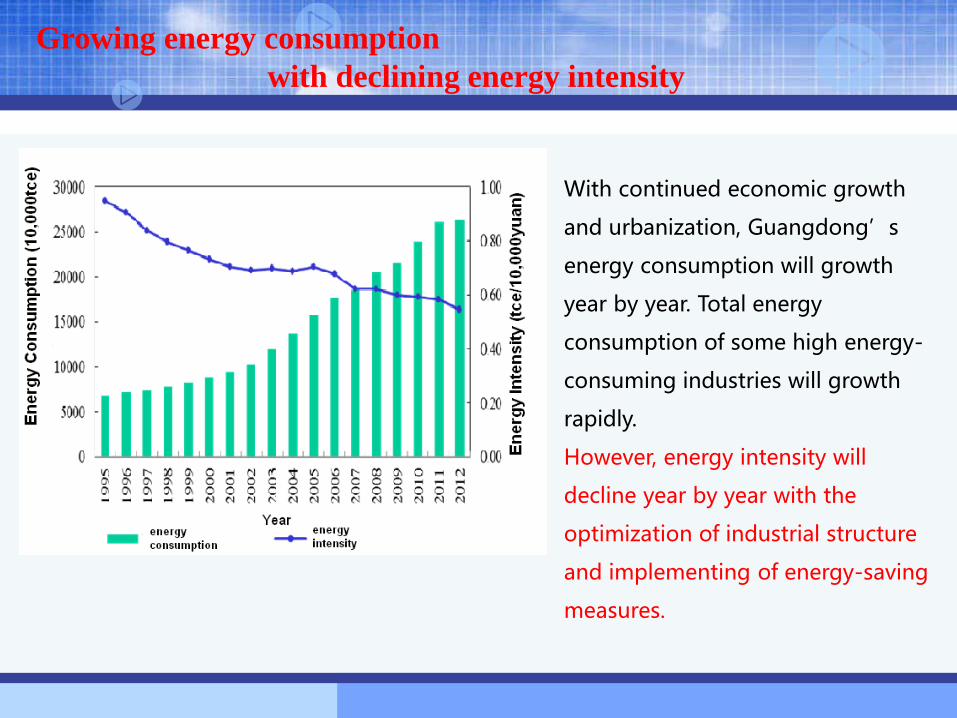
Growing energy consumption
with declining energy intensity
With continued economic growth
and urbanization, Guangdong’s
energy consumption will growth
year by year. Total energy
consumption of some high energy-
consuming industries will growth
rapidly.
However, energy intensity will
decline year by year with the
optimization of industrial structure
and implementing of energy-saving
measures.

The energy saving development situation of GD
– comparing internationally
Energy Structure in 2012 - comparing with other countries
GD
Energy Intensity – comparing with other countries
GD’s energy intensity is lower than the average level of China, and there is still a gap between world.
China
0.00
0.50
1.00
1.50
2.00
2.50
0%
200%
400%
600%
800%
199
5
199
6
199
7
199
8
199
9
200
0
200
1
200
2
200
3
200
4
200
5
200
6
200
7
200
8
200
9
201
0
201
1
201
2
Gd
pg
row
th 和碳排放趋势
(1
99
5年
=1
00
%)
年份
碳排放强度
/(t
CO
2e/万
元)
GDP发展趋势 碳排放趋势
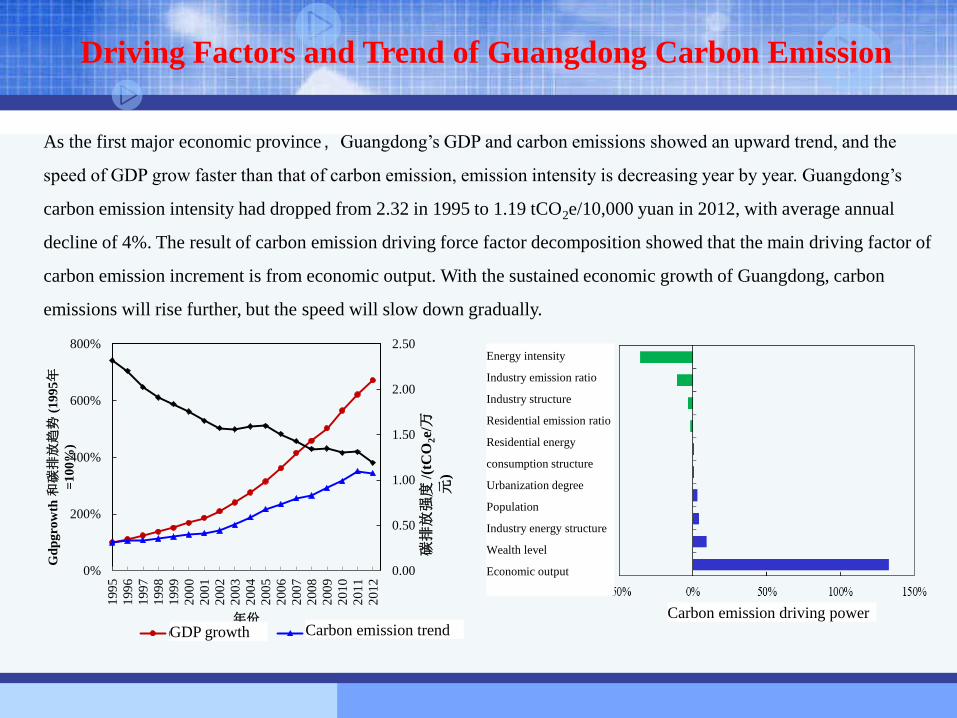
As the first major economic province,Guangdong’s GDP and carbon emissions showed an upward trend, and the
speed of GDP grow faster than that of carbon emission, emission intensity is decreasing year by year. Guangdong’s
carbon emission intensity had dropped from 2.32 in 1995 to 1.19 tCO2e/10,000 yuan in 2012, with average annual
decline of 4%. The result of carbon emission driving force factor decomposition showed that the main driving factor of
carbon emission increment is from economic output. With the sustained economic growth of Guangdong, carbon
emissions will rise further, but the speed will slow down gradually.
Driving Factors and Trend of Guangdong Carbon Emission
Carbon emission trend GDP growth
Carbon emission driving power
Energy intensity
Industry emission ratio
Industry structure
Residential emission ratio
Residential energy
consumption structure
Urbanization degree
Population
Industry energy structure
Wealth level
Economic output

Factors
Reduction target during the 11th five year plan
Reduction target during the12th five year plan
National Guangdong National Guangdong
Target of energy consumption per unit GDP decrease
20% 16% 16% 18%
Target of carbon emission reduction per unit GDP
19.1% - 17% 19.5%
The proportion of new and renewable energy in primary energy consumption
10% 11.4%
Forest coverage percentage 20% 21.66%
The Goal of Energy-saving and Emission Reduction During the 12th Five Year Plan
<planning of energy-saving and carbon emission reduction for the 12th five years>
Form the mechanism of reversal pressure to promote the transformation of economic development mode, establish
an effective incentive and control mechanism to reduce the GHGs emission and enhance energy using efficient.
Marketing mechanism will be an sound tool.

Design and operation of Guangdong carbon emissions trading mechanism
• Local regulations
"Guangdong Province carbon emissions trading pilot work plan“ (September 2012)
Decree 197th , announced the "Guangdong Province trial carbon emissions management measur
es“(January 2014)
• CAP
Guangdong’s total quotas of the cap was about 388 million ton-CO2 in 2013
• Coverage
Four energy intensive sectors: cement, electric power, steel and petrochemical have bee
n incorporated into ETS, the average annual emission of four industries accounted for more than
50% of the total carbon emissions of Guangdong.
• Allocation
Baseline method was employed by electric power and cement industries, the rest of the industry
uses the historical method

Main Contents
Macroeconomic Impact Analysis of GD ETS 2
1
Introduction of Guangdong ETS – the market building processes

• DEA model
• Factor Index analysis
• Two-region dynamic
CGE model
• Carbon cost
• Cost-benefit-ratio
• Allowance allocation
• Enterprise emissions
• Economy development
carbon
market
liquidity
Industry
Competitive
Execution
efficiency of
ETS
Macro
economic
impact
二、 Evaluation Methods of ETS

• This work was published in:
– Wang, P., H.-c. Dai, S.-y. Ren, D.-q. Zhao and T. Masui (2015). "Achieving Copenhagen target thro
ugh carbon emission trading: Economic impacts assessment in Guangdong Province of China." Ene
rgy 79(0): 212-227
• CGE model based on new classical economics general equilibrium theory
• Dynamic-recursive model, including two region of Guangdong and the rest of China and 33
sectors (7 energy sector).
三、 Macro economic impact analysis: model structure
Scenario Emission
trading
Emission constraint
Base None No carbon cap.
LCE None Carbon intensity reduces by 40% over 2010-20;
Annual growth rate of carbon between 2013-15:
Power sector 0.5% Oil refinery 0.8%, cement
0.5%, iron and steel 0.5%; 2016-20: Power
0.1%, other three sectors 0.2%.
LCET Yes
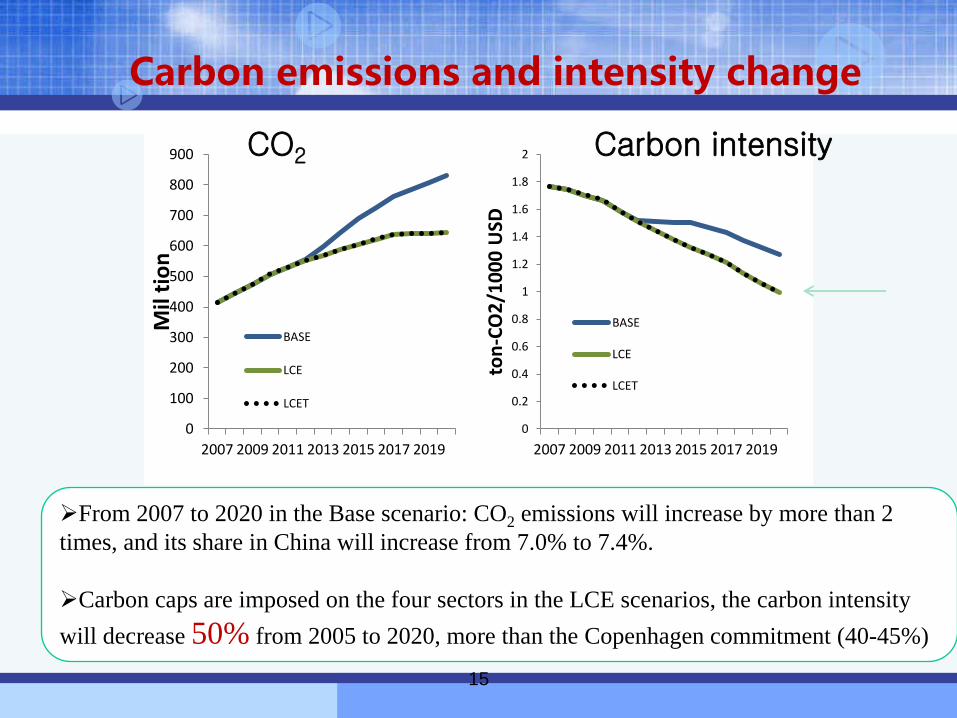
Carbon emissions and intensity change
15
From 2007 to 2020 in the Base scenario: CO2 emissions will increase by more than 2
times, and its share in China will increase from 7.0% to 7.4%.
Carbon caps are imposed on the four sectors in the LCE scenarios, the carbon intensity
will decrease 50% from 2005 to 2020, more than the Copenhagen commitment (40-45%)
0
100
200
300
400
500
600
700
800
900
2007 2009 2011 2013 2015 2017 2019
Mil
tio
n
BASE
LCE
LCET
0
0.2
0.4
0.6
0.8
1
1.2
1.4
1.6
1.8
2
2007 2009 2011 2013 2015 2017 2019
ton
-CO
2/1
00
0 U
SD
BASE
LCE
LCET
CO2 Carbon intensity
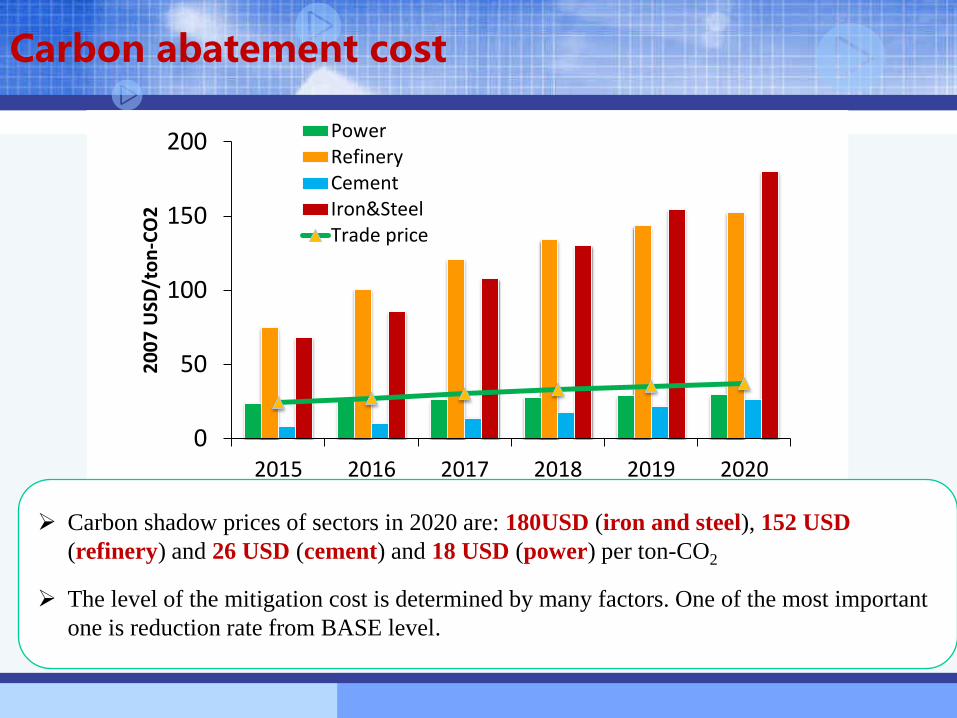
Carbon abatement cost
0
50
100
150
200
2015 2016 2017 2018 2019 2020
20
07
USD
/to
n-C
O2
PowerRefineryCementIron&SteelTrade price
Carbon shadow prices of sectors in 2020 are: 180USD (iron and steel), 152 USD
(refinery) and 26 USD (cement) and 18 USD (power) per ton-CO2
The level of the mitigation cost is determined by many factors. One of the most important
one is reduction rate from BASE level.

Emission trade: carbon price and trade volume
17
-20.0
-15.0
-10.0
-5.0
0.0
5.0
10.0
15.0
20.0
2013 2014 2015 2016 2017 2018 2019 2020
Mill
ion
to
n
Power
Refinery
Cement
Iron&Steel
Seller
Buyer
As the carbon abatement cost is different, emissions trading takes place among sectors
In 2020, the traded volume is 27 Mt and the equilibrium trading price is 37 USD/ton CO2,
resulting in the scale of the carbon market being 1.02 billion USD.
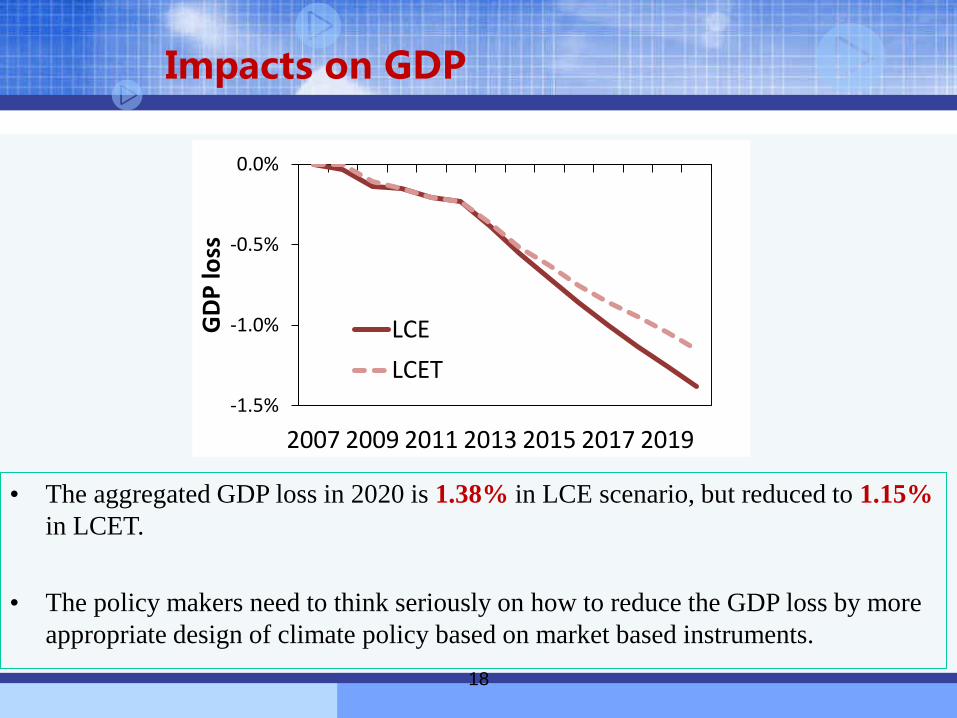
Impacts on GDP
18
• The aggregated GDP loss in 2020 is 1.38% in LCE scenario, but reduced to 1.15%
in LCET.
• The policy makers need to think seriously on how to reduce the GDP loss by more
appropriate design of climate policy based on market based instruments.
-1.5%
-1.0%
-0.5%
0.0%
2007 2009 2011 2013 2015 2017 2019
GD
P lo
ss
LCE
LCET

826
-43
3,881
2,299
34,597
2,650
-6,307
-3,166
-887
10,767
-16,944
31,469
-2,211
-12,889
1,409
-9,914
1,871
0-20,000 40,000
OtherManu
Electricity
Electronic
Transport
Construction
Service
Textile
Machinery
Cement
Metal products
Iron&steel
Food
Agriculture
Oil refinery
Paper
Mining
Chemicals
SAVET vs SAV (person) LCET vs LCE (person)
847
0
-5,575
-20,000
8,500
2,242
-2,557
3,185
-11,712
1,219
-1,170
-13,851
46,103
-13,336
2,692
2,886
41,854
-17,553
1,840
60,000
The quantity of employment in all sector change with and without ETS
ETS increase 45614
Employment increase: Agriculture、Food、textile、 Cement、Iron、Electronic ,service Total increase 37,000-45,000 jobs
Analysis results: ETS on the employment

ETS
adminstration
Province
city
Enterprise
report
control
The third party
verify
Carbon
assest
software
trader
Trade
account
finance
media
association
News
Research
Estimate:ETS on the service
Jobs: ~20,000 person

1. In 2020, the carbon price of power sector is the lowest, followed by cement
sector, whereas that of refinery and iron and steel sectors is higher.
2. During 2015-2020,controlling emissions will cause GDP loss 0.8%-1.4%. ETS
will reduce GDP loss ETS policy is economically efficient.
3. Enlarge the sector coverage of ETS will reduce the GDP loss and decrease the
carbon price.
4. Through CGE model simulation, ETS would bring 40,000 jobs compared with
carbon constraint policy. It’s important to pay attention to the jobless of
construction, mechanics and paper sectors.
Conclusions

Future work on modeling
Further simulate the carbon auction revenue return
back style
Develop the Enduse model to link with CGE to discuss
peak of Guangdong
Using model to research of air pollutant emission
control of Guangdong

Thank you very much !