Embed Size (px)
Citation preview

W&M ScholarWorks W&M ScholarWorks
Dissertations, Theses, and Masters Projects Theses, Dissertations, & Master Projects
2019
The Impact of the Balanced Literacy Approach in Reading The Impact of the Balanced Literacy Approach in Reading
Instruction on Student Reading Motivation and Reading Instruction on Student Reading Motivation and Reading
Competence Competence
Jami Beth Clements William & Mary - School of Education, [email protected]
Follow this and additional works at: https://scholarworks.wm.edu/etd
Part of the Elementary Education Commons
Recommended Citation Recommended Citation Clements, Jami Beth, "The Impact of the Balanced Literacy Approach in Reading Instruction on Student Reading Motivation and Reading Competence" (2019). Dissertations, Theses, and Masters Projects. Paper 1582642577. http://dx.doi.org/10.21220/m2-sfz6-3z08
This Dissertation is brought to you for free and open access by the Theses, Dissertations, & Master Projects at W&M ScholarWorks. It has been accepted for inclusion in Dissertations, Theses, and Masters Projects by an authorized administrator of W&M ScholarWorks. For more information, please contact [email protected].

THE IMPACT OF THE BALANCED LITERACY APPROACH IN
READING INSTRUCTION ON STUDENT READING MOTIVATION AND
READING COMPETENCE
__________________________________________
A Dissertation
Presented to
The Faculty of the School of Education
The College of William and Mary in Virginia
__________________________________________
In Partial Fulfillment
Of the Requirements for the Degree
Doctor of Philosophy
By
Jami B. Clements
November 2019

THE IMPACT OF THE BALANCED LITERACY APPROACH IN READING
INSTRUCTION ON STUDENT READING MOTIVATION AND READING
COMPETENCE
By
Jami B. Clements
Approved November 1, 2019 by
______________________________________
Steven R. Staples, Ed.D.
Chair of Doctoral Committee
______________________________________
Margaret E. Constantino, Ph.D.
______________________________________
Michael F. DiPaola, Ed.D.

i
Dedication
This dissertation is dedicated to the two most important women in my life, my
mother and my daughter. To my mom, thank you for always believing in me and
supporting me. Thank you for listening to me ramble on and on about my research,
hurdles, and next steps even when you really had no clue what it all meant. Without you
by my side, this would not have been possible. To my amazingly curious and happy
daughter, Waverly, I am grateful that you are too young to truly know the sacrifices you
have made to make this possible. Your smile and hugs have often made me smile when I
felt like crying and have given me hope when I felt like throwing in the towel. Next year,
you will start kindergarten. May it be the beginning of a life full of learning, growing,
and exploring. I hope that my pursuit of life-long learning, my work, and my life will be
an inspiration to you as you have been to me!

ii
Table of Contents
List of Tables vii
List of Figures viii
Chapter 1: Introduction 2
Background 2
Program Description 5
Context 5
Description of the Program 7
Overview of the Evaluation Approach 13
Program Evaluation Model 13
Purpose of the Evaluation 21
Focus of the Evaluation 22
Evaluation Questions 23
Definition of Terms 23
Chapter 2: Review of Related Literature 25
Historical Trends in Elementary Reading Instruction 25
Explicit Instruction 32
Whole Language Instruction 34
Current Trend 36
Balanced Literacy 37
Student Reading Behavior 40
Engagement 40
Frequency and Amount 42

iii
Student Motivation to Read 43
Intrinsic and Extrinsic Motivation 43
Self-Determination Theory and Motivation 46
Motivation Measurement Tools 48
CHAPTER 3: Methods 60
Introduction 60
Participants 62
Teachers 63
Students 63
Data Sources 64
Classroom Observation Data 65
Student Survey 66
Longitudinal Summative Assessment Data 68
Comprehensive Reading Assessment Data 71
Data Collection 72
Data Analysis 73
Delimitations, Limitations, and Assumptions 74
Delimitations 74
Limitations 75
Assumptions 76
Ethical Considerations 76
Institutional Review Board 77
Adherence to Program Evaluation Standards 77

iv
Summary 78
CHAPTER 4: Findings 79
Summary Findings for Study 79
Evaluation Question 1 79
Evaluation Question 2 82
Evaluation Question 3 87
Evaluation Question 4 90
Summary of Findings 93
CHAPTER 5: Recommendations 94
Discussion of Findings 94
In Class Student Reading Time 95
Student Motivation to Read 97
Reading Competence 101
Student Motivation to Read and Reading Competence 103
Implications for Policy or Practice 104
Increase Student Reading Time 107
Increasing Student Choice and Interest 107
Early Interventions and Remediation 108
Discontinue the Use of PALS Assessment 108
Recommendations for Future Research 108
Summary 110
Appendices
Appendix A: Indicators of Student Engagement Observation Protocol 111

v
Appendix B: Self-Regulation Questionnaire: Reading Motivation Student Survey 112
Appendix C: Self-Regulation Questionnaire: Reading Motivation Survey Data 114
Appendix D: Participant Consent Letter 116
Appendix E: Student Reading SOL Scores for Years 2012-13 to 2017-18 117
References 134
Vita 152

vi
Acknowledgements
This dissertation is the result of the persistence to never lose sight of the end goal,
resilience to push forward through planned and unplanned detours, and the unwavering
support of so many people in every avenue of my life. I would like to thank the members
of my dissertation process who gave me guidance and encouragement. Dr. Constantino,
thank you for giving precise feedback to ensure I produce a quality program evaluation.
Dr. DiPaola, thank you for keeping me on the right track and making it a manageable
process. Dr. Staples, thank you for your consistent encouragement, feedback, and
understanding.
Thank you to my daughter for not questioning when I had to work. Thank you to
my mother, who has always been my cheerleader and my support in every possible way.
Thank you to my entire family for asking enough questions to hold me accountable and
giving me enough love to make it happen. Thank you to my dear friend and informal
mentor in this process, Dr. Erin Warren, for being there for being my rock when I needed
stability and my pillow when I needed a soft place to land.
Finally, I’d like to thank my administrative peers in the school district and my
faculty at my school. I appreciate our conversations, your understanding, and your
encouragement.

vii
List of Tables
Table 1. Frequency of Coded Topics in “The Reading Teacher” in Five-Year Segments
and Total 27
Table 2. Grades 3-5 SOL Strand Details 71
Table 3. Evaluation Questions and Data Analysis 74
Table 4. Observation Data by Grade Level Teacher 81
Table 5. Student Motivation to Read Mean Scores by Motivation Type 84
Table 6. Correlations by Motivation Type 86
Table 7. Mean Reading SOL Scores by Grade and School Year 87
Table 8. Tukey’s HSD post hoc test analysis of Grade 3 Reading SOL Scores and Year of
Implementation 88
Table 9. Tukey’s HSD post hoc test analysis of Grade 5 Reading SOL Scores and Year of
Implementation 89
Table 10. Student Cohort Mean PALS Scores and Reading SOL Scores 91
Table 11. Research Question Findings and Recommendations 106
viii
List of Figures
Figure 1. District Reading SOL Pass Rates 7
Figure 2. Program Theory for Study of Motivation and Reading Comprehension 12
Figure 3. Logic Model for Balanced Literacy Reading 15

ix
Abstract
The purpose of this quantitative study was to investigate the impact Balanced Literacy
Reading Instruction had on student motivation to read and student reading competence in
the elementary school of one public school district. This study analyzed extant student
summative reading assessment data and extant teacher observation data. The study also
administered the Self-Regulation Questionnaire-Reading Motivation to measure the
reading motivation of students who had received Balanced Literacy Reading Instruction
in the district from first grade through fifth grade. The study sought to determine the
amount of reading time administered during reading instruction during the
implementation, the current level of student reading motivation, and the longitudinal
growth of student reading competence. The study used the CIPP model of program
evaluation for data collection on the context, input, process, and products of
implementation and student results of the Balanced Literacy Reading Instruction. The
findings of the study indicate that the Balanced Literacy approach is not being
implemented with fidelity based on the disparity of student reading time between
teachers. Based on survey results, the current level of student motivation to read varies
significantly between students and does not reflect trends in motivation research. The
students have not experienced significant growth in reading competence during
implementation. Recommendations for future research and continuous program
improvement include providing consistent and continuous professional development on
Balanced Literacy, collecting baseline data on student motivation to measure growth, and
analyzing the effect of Balanced Literacy Reading Instruction on student populations
more aligned to the district’s student population.

THE IMPACT OF THE BALANCED LITERACY APPROACH IN READING
INSTRUCTION ON STUDENT READING MOTIVATION AND READING
COMPETENCE

2
CHAPTER 1
INTRODUCTION
Background
Public education was founded to develop citizens who would have the knowledge
and skills to be productive members of society. The foundation of a structured school
education and a functional society is literacy (Becker, McElvany, & Kortenbruck, 2010;
Bitter, O’Day, Gubbins, & Socias, 2009; Schiefele & Schaffner, 2016). Since the 1950s,
there has been an intense debate regarding the best strategies, practices, and programs to
teach literacy, specifically reading (Adams, 1990). Despite the focus on reading
instruction strategies and the ongoing debate about best practices, state standardized test
scores and the Progress in International Reading Literacy Study indicate that classroom
literacy instruction in the United States is becoming less and less effective (Hao &
Johnson, 2013; “Education Reform,” 2003; Walberg, 1996).
In the United States today, there are numerous challenges schools must address in
order to develop students’ literacy skills. These challenges include a growing English
Language Learner population, an increase in students identified as Learning Disabled
(LD; O’Connor, Beach, Sanchez, Bocian, & Flynn, 2015), the influence of multi-media
(Borgonovi, 2016; Ennemoser & Schneider, 2007; Koolstra &Van Der Voort, 1996;
Vandewater et al., 2005), and a reduced emphasis on reading at home (Flowers &
Flowers, 2008; Rideout, 2014; U.S. Department of Labor, 2017). Another potential
challenge is the influence of text messaging and social media on formal language and

3
sentence structure. There are conflicting research findings in the effect of text messaging
and social media on children’s literacy development (Kemp & Bushnell, 2011; Verheijen,
2013; Wood, Kemp, Waldron, & Hart, 2014; Wood et al., 2011; Zebroff, 2018). Given
the persistent debate over the most effective approach to literacy instruction and the
added 21st century challenges, it is more important than ever that instructional leaders
select literacy programs and strategies that meet the needs of their student population and
that leaders evaluate the program to ensure expected and proclaimed progress is being
actualized.
By definition, literacy includes writing, oral fluency, and reading (Bingham &
Hall-Kenyon, 2011). However, due to the frequency and emphasis of standardized
assessment, reading is the literacy component most consistently and explicitly taught.
Oral fluency is part of the Common Core Standards, which have been adopted by 42 out
of the 50 states (Common Core State Standards Initiative, 2018). Virginia is one of the
eight states that have not adopted the Common Core Standards, but oral fluency is part of
the Virginia Department of Education (VDOE) language arts curriculum (VDOE, 2018).
Despite being part of the written curriculum, oral fluency is not part of the assessed
curriculum. In Virginia, a standardized assessment is not given for oral fluency and oral
fluency is rarely an explicit part of classroom instruction (Dahlgren, 2008). Writing is
part of the VDOE language arts curriculum and is currently assessed by the state
standardized test in the 8th grade and the 11th grade (VDOE, 2018). The 5th grade
Writing Standards of Learning test was eliminated for the 2014-2015 school year. It is
difficult to determine the specific impact this has had on writing instruction at the
elementary level. However, the consistent decline of writing scores for the 8th grade

4
students and the 11th grade students indicates that formal writing instruction with an
emphasis on grammar, sentence structure, and composition has been minimized if not
eliminated (Collazo, 2017; VDOE, 2018). Reading is still assessed every year in
elementary school starting in the 3rd grade and is the primary focus of elementary level
language arts teachers (Bingham & Hall-Kenyon, 2011).
Since reading is the primary focus of the taught curriculum in language arts
classrooms, there are numerous reading programs available for elementary schools to
implement. These programs typically use one of two approaches to reading instruction:
explicit teaching of skills before reading or the holistic approach which asserts learning
skills embedded within reading experiences (Bingham & Hall-Kenyon, 2011). There is
an abundance of research that supports results for both approaches (Barger, 2016;
Reutzel, Child, Jones, & Clark, 2014; Spiegel, 1998). Often reading programs are not
selected based on research and data, but on the current trends or availability with little
justification for the selection (Pavonetti, Brimmer, & Cipielewski, 2003; Yodis, 2016).
Given the contradictory research espousing all different types of reading programs and
approaches to instruction, as well as the fundamental importance of reading to all other
instruction, it is imperative that school systems select and evaluate a reading program to
ensure it effectively meets the needs of its student population and develops the skills to
read and most importantly the motivation to read (Becker et al., 2010; Gambrell, 1996;
Schiefele & Schaffner, 2016).

5
Program Description
The Balanced Literacy approach to reading instruction is based on the teacher
selecting a variety of reading content and instructional methods based on student need.
In addition to increasing reading competence, the Balanced Literacy approach is
purported to increase students’ motivation to read because it gives students choice in
reading material. The small school district in this study selected the Balanced Literacy
approach in an attempt to reverse a downward trend in elementary reading achievement.
Context. The context of the Balanced Literacy approach to reading instruction in
this study is a small rural school district in Virginia. The school district consists of one
elementary school for pre-kindergarten to Grade 4, which will be referenced as the
primary elementary school; one elementary school for Grade 5, which will be referenced
as the single grade elementary school; one middle school for Grades 6-8; and one high
school. The school district serves all children in the county and the city within the
county.
Historically, all of the schools in the district, except the high school, have had an
inconsistent accreditation status. All of the schools in the district were Provisionally
Accredited for the 2002-2003 school year. The following year, the primary elementary
school was Fully Accredited and the other three schools remained Provisionally
Accredited. The high school became Fully Accredited for the 2004-2005 school year and
has maintained full accreditation status. The three schools for Grades K-8 were
Accredited with Warning for the 2004-2005 school year. The primary elementary school
became Fully Accredited the following school year. The single grade elementary school
and the middle school fluctuated between Accredited with Warning and Fully Accredited

6
for the next three school years. In 2008-2009, all four schools in the district were Fully
Accredited and maintained full accreditation until the 2012-2013 school year. In 2013-
2014, when the three-year average plunged below the state benchmark, the two
elementary schools and the middle school became Accredited with Warning. The VDOE
changed the labels for non-accredited during the next three years, but none of the three
schools became Fully Accredited during that period. In 2016-2017, the primary
elementary school and the middle school were Accreditation Denied. The single grade
elementary school was Accreditation Denied the following school year.
The Reading SOL pass rates have been the consistent barrier to full accreditation
for the three lower grade level schools in the district. Figure 1 shows the steady decline
in Reading SOL Pass rates by grade level since the 2011-2012 school year.

7
Figure 1. Reading SOL Pass Rates for Grades 3-8 in the district for the 2011-2012 school
year through the 2016-2017 school year. Pass rates were obtained from the Virginia
Department of Education School Report Card.
During the 2012-2013 school year, the district was using the Open Court Reading
program published by McGraw-Hill Education. The Open Court Reading program is an
explicit instruction program that focuses on phonics and reading comprehension. This
was the reading program used in both elementary schools prior to the district’s transition
to Balanced Literacy, which is the focus of this program evaluation.
Description of the program. Balanced Literacy is not a reading program, but an
approach to reading instruction. Proponents of Balanced Literacy explain the approach
as a combination of explicit and holistic instructional strategies that teachers can tailor to
meet the needs of their students (Barger, 2016). Diane Ravitch (2007), in her glossary of
education terms, defines Balanced Literacy as follows:
0
10
20
30
40
50
60
70
80
90
100
2011-12 2012-13 2013-14 2014-15 2015-16 2016-17
Pe
rce
nt
Pas
s R
ate
Grade 3
Grade 4
Grade 5
Grade 6
Grade 7
Grade 8

8
An approach to reading instruction that emphasizes the primacy of constructing
meaning from authentic texts while also including instruction in skills. Balanced
literacy classes incorporate elements of whole-language instruction, such as the
use of complete and authentic (as opposed to decodable or vocabulary-controlled)
texts and the teaching of common sight words, as well as providing some
instruction in phonics. Such classes employ diverse strategies, including read-
aloud sessions, word walls, guided reading, and reading circles. Advocates laud
the method because it relies primarily on teacher judgment and initiative. Critics
note that balanced literacy pro-grams retain the spirit of whole-language
instruction while including just enough phonics instruction to meet the
requirements of state standards. (p.27)
The basic structure for reading instruction in a Balanced Literacy classroom includes
Read Aloud, Guided Reading, Shared Reading, and Independent Reading.
Balanced Literacy should improve student motivation to read by giving students
choice (Guthrie et al., 2006). During Independent Reading, students choose a book based
on their interest and reading level. This flexibility increases student motivation to read
by allowing students to pick a book they want to read and ensuring they select a book that
is appropriate for the student’s reading level. This minimizes frustration by reading a text
that may be too difficult. Motivation is one of the key factors for improving reading
comprehension skills (Becker et al., 2010; Gambrell, 1996; Guthrie et al., 2006; Schiefele
& Schaffner, 2016). In elementary grades, students are learning to read and to develop a
love of reading. In middle school and high school, students are reading to learn and are
more extrinsically motivated to read (De Naeghel, Van Keer, Vansteenkiste, & Rosseel,

9
2012). In all grades, students read independently to become better readers. The teacher
makes observations, records objective notes on student reading, and conferences with the
students. The notes and observations are used to monitor and plan for individual student
growth and to identify common needs of students for mini-lessons the teacher will teach
during Guided Reading (Barger, 2016).
The Balanced Literacy approach gives teachers the flexibility to tailor reading
instruction to meet the needs of the students (Barger, 2016; Spiegel, 1998). These
tailored lessons are presented during Guided Reading. The classroom teacher
individualizes the mini-lessons to meet the needs of small groups of students based on
observations of the students during shared and independent reading. The groups are
flexible and may change daily based on any deficit of skill or an area of growth identified
during student reading time. Typically in elementary grades, those skills or strategies
will include decoding, phonograms or word families, main idea, using pictures for
context clues, visualizing, and other fundamental reading skills (Barger, 2016). In middle
and high school, mini-lessons may still include basic skills such as decoding for lower
level readers, but typically the strategies extend to recognizing schema, inferencing,
questioning, synthesizing, metacognitive strategies, and other reading strategies to deepen
understanding of and make connections with the text (Claggett, Reid, & Vinz, 2007;
McGregor, 2007). Students in elementary grades may be introduced to these strategies
during Guided Reading.
Building literacy skills through reading requires spiraling and scaffolding of the
skills as well as the texts. The flexibility to use data on student’s reading ability and
specific skill needs to provide small group remediation as well as advanced reading

10
strategies within one class has the potential to maximize student growth. The teacher
monitors student reading progress before, during, and after reading to ensure the taught
skills are implemented successfully. Before the reading, the teacher explicitly teaches a
reading strategy to a small group with similar needs. During the reading, the teacher
models the strategy. This may occur during Shared Reading or Read Aloud. Finally,
after the reading, the teacher monitors the student application of the strategy when
students read independently (Barger, 2016).
During Shared Reading, reading is shared between the student and the teacher.
Shared Reading is not Round Robin Reading. The teacher is the primary reader, but
shares the reading with the student or students by asking questions about the text or
pictures, allowing the student(s) to read the repetitive parts, and rereading the story
together. The teacher adjusts repetition and student involvement based on the needs of
the student, but the basic format of Shared Reading includes introducing the story to the
students and activating prior knowledge, the teacher reading the story with student input,
discussing the story after reading, and rereading the story. The dramatics and input of
each student group may vary based on reading level, attention span, and personality, but
the intent of Shared Reading remains the same to actively engage or share the text with
the students (Barger, 2016). Engaging with the text is another key factor to improve
reading comprehension (Pflaum & Bishop, 2004). Word recognition is a skill necessary
for reading, but reading is not strictly word recognition (Spiegel, 1998). The more
students activate prior knowledge and develop connections with the text, the more they
will build comprehension strategies. Teachers build those engagement skills during
Shared Reading.

11
Teachers do not actively engage students during Read Aloud, but the teacher
demonstrates reading strategies and skills the students are expected to develop. Read
Aloud is often called modeling because the teacher is modeling proficient reading and
reading strategies to understand the text. As the teacher reads, she/he will use think aloud
strategies to sound out unfamiliar words, use context clues to determine meaning, ask
questions about the text, or explain any other thoughts that help the teacher understand or
comprehend the text. During Read Aloud, the teacher may ask the students questions,
but Read Aloud is typically teacher talk. The length and level of the book used will be
based on the attention span, interest, and level of the student group (Barger, 2016).
Each Balanced Literacy component gives the teacher and the student flexibility to
adjust instruction, text, and feedback to the academic needs and interest of the students.
The foundation of Balanced Literacy is students will learn to read by reading. To
actively engage students in reading, the flexibility and choice inherent in the Balanced
Literacy Framework must increase student motivation to read (Becker et al., 2010;
Gambrell, 1996; Guthrie et al., 2006; Schiefele & Schaffner, 2016; Taboada, Tonks,
Wigfield, & Guthrie, 2009).
The theoretical framework of Self Determination Theory (SDT) was used to
frame this study. Students enter the reading classrooms with different knowledge,
experiences, and skills. Each student’s schema affects his or her self-concept and
motivation to read (Guthrie et al., 2006). Intrinsic motivation has been consistently
associated with improved comprehension and longitudinal academic growth, whereas
extrinsic motivation has been associated with short-term, superficial growth (Becker et
al., 2010; De Naeghel et al., 2012). SDT extends the definition of intrinsic and extrinsic

12
motivation to autonomous motivation and controlled motivation respectively (Ryan &
Deci, 2000). The continuum of motivation outlined by SDT provides a research-based
perspective of motivation necessary to examine the role of motivation in becoming an
effective reader. As seen in Figure 2, research shows a student’s self-concept and type of
motivation impact the amount of time a student reads, the level the student actively
engages with the text, and the student’s reading comprehension.
Figure 2. Program theory for study of motivation and reading comprehension.
Research indicates that when students feel like they are good readers they are
motivated to read which in turn increases reading frequency and engagement (Becker et
al., 2010). Students with increased intrinsic and extrinsic motivation spent more time
reading (Guthrie, Wigfield, Metsala, & Cox, 1999). However, students who were
extrinsically motivated in elementary school showed a negative relationship with reading
comprehension in later grades (Becker et al., 2010; De Naeghel et al., 2012; Unrau &
Schlackman, 2006). Consequently, the framework of SDT will create the lens to evaluate

13
the development of student motivation to read, as well as the type of motivation which
significantly impacts reading comprehension.
Overview of the Evaluation Approach
Assessment of education programs is necessary to ensure programs are being
implemented with fidelity and are obtaining the expected results (Praslova, 2010). Given
the imperative role early childhood reading plays in future academic success, it is
imperative that instructional leaders evaluate literacy programs on a regular basis to
ensure students are receiving the reading foundation necessary for future learning
(Gonzalez et al., 2011). The Balanced Literacy approach in this study was an ongoing
framework for reading instruction that the district was planning to continue indefinitely.
The approach had been fully implemented for five school years without a program
evaluation. SOL scores and pass rates in reading and writing were the sole tool used to
assess reading and writing instruction in the district. Therefore, a formative evaluation
was necessary to determine if the program had met the short-range and-mid range
outcomes and if the program was on target to meet the long-range outcomes.
Program evaluation model. The effectiveness of a program or framework is
dependent on evaluation (Hernandez, 2000). A logic model provides a framework to
create a consistent understanding of the needs, beliefs, inputs, outcomes, and results of a
program (Hernandez, 2000). To fully understand the processes that lead to the adaptation
and the steps involved in the implementation of the Balanced Literacy reading approach,
the researcher developed a used the CIPP evaluation model to frame this program
evaluation. CIPP stands for context, input, process, and products. The CIPP evaluation
model was developed by Daniel Stufflebeam (1971) to link the evaluation process with

14
decision making. The CIPP model enables decision making because the areas pertain to
the conception, design, implementation, and assessment of a program. Those four
categories are context, implementation inputs, process, and products. The context is the
planning of the program when the needs, goals, and priorities are identified. The inputs
are the implementation of the program when resources are allocated and steps are taken.
The process is the first step in assessment when the execution of the steps and utilization
of resources are reviewed. The products are the final step in assessing the program when
it is determined if the goals were actualized. The researcher developed a logic model to
organize the context, inputs, process, and products of the Balanced Literacy reading
approach (see Figure 3).

15
Figure 3. Logic model for balanced literacy reading.

16
The context for the program was the small rural school district with one
elementary school. The district instructional team began a review of the primary
elementary school reading program during the 2011-2012 school year. The district team
identified the need for consistent student growth and assessment performance in reading.
In the 2011-2012 school year, all four schools in the district were fully accredited, but
pass rates were declining. In addition to summative assessment data, children entering
the pre-kindergarten program and the kindergarten program were lacking basic literacy
skills including speech. The children entering pre-kindergarten and kindergarten with
literacy skill deficits were falling more and more behind as they progressed through the
grades and schools in the district. This growing performance gap became more
exacerbated as the students were promoted to higher grades and resulted in increased
teacher frustration because the teachers at higher grade levels lacked the skills and
resources to teach basic literacy skills.
In addition to district concerns, the VDOE had designated the primary elementary
school as a Reading First School. As a Reading First School, the primary elementary
school had made some improvements in reading as evidenced by slight increases in the
Reading Standards Of Learning (SOL) pass rates, but these gains were modest and were
not sustained. Given the lack of sustained, significant improvement, VDOE assigned a
state reading specialist to facilitate a transition in reading instruction to the Balanced
Literacy approach.
The Inputs for the program included professional development and administrative
partnerships with outside consultants. In the spring of 2013, the state reading specialist
conducted observations of and debriefings with K-4 reading teachers at the primary

17
elementary school. During the observations and debriefings, the focus was modifying the
currently implemented Open Court Reading program to incorporate strategies from the
Balanced Literacy approach to reading. The teachers were empowered to make
suggestions during the debriefings. As part of this process, all reading teachers at the
primary elementary school were asked to post a word wall in their classrooms. The
second, third, and fourth grade reading teachers also focused on incorporating anchor
charts in their classrooms. In addition to the observations and debriefings, the state
reading specialist facilitated professional development focused on comprehension
strategies. The primary elementary school principal advised teachers to make small
changes to the Open Court Reading program to incorporate the strategies during the 2013
spring semester without completely changing their reading program.
During the summer of 2013, reading teachers at the primary elementary school
received two days of professional development from the state reading specialist and two
other presenters. The training was entitled “Using a Balanced Literacy Approach to
Maximize Student Achievement in Reading.” The objectives for the professional
development were listed as follows:
Identify/review the components of a daily balanced literacy program.
Gather ideas for launching and managing the reading workshop in my
classroom.
Practice using “think-alouds” to model a comprehension strategy.
Plan a guided reading lesson for a small group of students.
Incorporate word study effectively.

18
The teachers received a third day of training from the state reading specialist and one
presenter. The third workshop was titled “Using a Balanced Literacy Approach to
Maximize Student Achievement in Writing.”
The building administrators were given two different examples of master
schedules from two different elementary schools implementing Balanced Literacy. The
administrators were also given three different observation forms with Balanced Literacy
look-fors, as well as an “Active Participation Reference Sheet” that listed 20 different
classroom activities and indicated what the teacher did and what the students did for
each. The classroom teachers were given a lesson plan template and sample lesson plans,
a list of books for modeling at each grade level, and a packet of “Helpful Resources.”
During the fall 2013 semester, two different days of paired observations in the
primary elementary school reading classrooms were conducted. Both sets of
observations were recorded on the Elementary Balanced Literacy Observation Guide
(Courtesy of Chesterfield County Public Schools Language Arts Department). During
the first set of observations, the primary elementary school principal and the two assistant
principals were paired with the district director of instruction, the district superintendent,
and the state reading specialist respectively. During the second set of observations, the
principal was paired with the state reading specialist, one assistant principal was paired
with a Virginia Commonwealth University Training and Technical Assistance Center
(T/TAC) representative, the other assistant principal was paired with the district director
of pupil/personnel services, and the superintendent was paired with the district director of
instruction. Both sets of observations included debriefings with the observation pairs, as
well as the classroom teachers. The state reading specialist returned to the district to

19
review lesson plans and observe reading classes in February 2013. The district team
conducted a third set of observations in March 2014.
In addition to the observations, debriefings, and professional development
provided by the state reading specialist, two different book studies were completed. Ten
teachers in pre-kindergarten through second grade volunteered to participate in the book
study of Reading for Meaning by Debbie Miller (2002). Ten teachers in third and fourth
grade volunteered to participate in the book study of Strategies that Work by Stephanie
Harvey and Anne Goudvis (2017). The primary elementary school Reading Coaches
facilitated the book studies.
The Process for implementing the program was a gradual phase in with limited
support after the program was fully implemented. During the transition from Open Court
Reading to Balanced Literacy, the teachers and administrators at the primary elementary
school received professional development in the form of observations, debriefings, grade
level sessions, and whole group sessions. The professional development included
training on planning and implementing reading and writing instruction using the
Balanced Literacy approach. During the first year of implementation, observations and
feedback were conducted by the school and district level administrators.
The school reading coaches were the primary contacts for teachers. The reading
coaches conducted observations, reviewed lesson plans, and provided feedback to the
teachers. The reading coaches also provided periodic progress reports to school level and
district level instructional leaders.
In order to provide an adequate selection of books for different interests and skill
levels, a school book room was created with leveled readers. In the second year of
20
implementation, the primary elementary school obtained a school-wide license for A-Z
learning. Each year teachers have increased the books available in classroom libraries.
During the 2015-2016 school year, teachers at the primary elementary school did not
have complete classroom libraries to support Balanced Literacy.
The two school level reading coaches developed a lesson plan template for
language arts teachers. The lesson plan template included writing workshops, morning
meetings, and the reading components of Balanced Literacy: Shared Reading, Guided
Reading, Read Aloud, and Independent Reading. All grade level teachers at the primary
elementary school were expected to use the lesson plan template to plan and implement
daily reading and writing instruction with guided reading workshops and writing
workshops.
Teachers received training on how to use word walls and anchor charts to support
word study and reading in their classrooms. Teachers were expected to have visible word
walls and anchor charts for students to use. Reading coaches and administrators recorded
the presence and use of word walls and anchor charts during observations. The coaches
and administrators then gave guidance to teachers on the use of these tools to facilitate
word study and reading workshops.
The Products anticipated by the district were increased reading competence as
measured by Reading SOL Pass Rates and increased student motivation to read. The
district leaders realized that improvements in reading instruction and reading skills would
not be achieved in one school year. Creating systemic change and developing student
motivation, would take at least three years with consistent professional development,
feedback, and support. The district did not develop written goals to monitor incremental

21
process. However, the informal goals included short-range, mid-range, and long-range
goals. The short range goals included the first steps that had to be taken prior to full
implementation. Teachers were expected to take away pieces of the Open Court Reading
program and replace them with components of Balanced Literacy. Those components
included using word walls and guided reading groups. Incorporating the guided reading
groups was expected to improve student motivation to read as well as reading skills.
Short-range student growth would be measured using the Developmental Reading
Assessment (DRA). The mid-range goals outlined the intended outcomes for the first
year of full implementation through the third year. The mid-range goals included a
complete transition from Open Court Reading to the Balanced Literacy approach to
teaching reading and writing. By implementing the Balanced Literacy approach to
reading, student motivation to read and academic success in reading were expected to
improve evidenced by the primary elementary school achieving and sustaining a 75%
pass rate on the Reading SOL. The district leaders also expected students’ writing skills
to improve. The student academic growth in reading and writing would reduce teacher
frustration at the primary elementary school as well as the middle and high school
because students would be reading and writing on grade level. The long-range goals
included a measurable outcome of sustained SOL pass rates in reading and writing for all
grade levels and that all students would read on grade level. This would result in high
teacher morale and teacher self-efficacy. The final long-range goal was to develop
students who would be lifelong readers.
Purpose of the evaluation. The purpose of this quantitative program evaluation
was to determine the impact the Balanced Literacy approach has had on student

22
motivation to read and to explore the connection between student motivation and
improved reading comprehension as measured by summative reading assessments. Every
reading program has benefits and deficits (Spiegel, 1998). It is imperative that the district
in this study with a high number of at-risk students has a reading program that works for
its student population. This program evaluation sought to determine the progress made
toward achieving the intended outcomes, and ultimately enable district leadership to
make better informed decisions regarding its reading program.
Focus of the evaluation. This program evaluation will focus on the products,
specifically the short-range and mid-range goals. The short-range goals were to be
completed within the first year of implementation. The short-range goals included
incorporating parts of Balanced Literacy into reading instruction, tracking student
progress with DRA, increasing student motivation to read, and building student literacy
skills. Two of the short-range goals will not be a focus in the evaluation. The district no
longer uses any components of the Open Court Reading program. All elementary reading
teachers use the Balanced Literacy approach to writing lesson plans and teaching.
Student DRA records are no longer maintained with fidelity and are not available to
measure achievement of the short-range goals. Student motivation to read was not
measured any time during the five years of Balanced Literacy implementation, so it will
be a focus in this evaluation. Literacy skills will be a focus as measured by the
summative reading assessment analysis for the mid-range goal.
The mid-range goals were to be completed between two to five years after
implementation. The mid-range goals included full implementation of the Balanced
Literacy approach in reading and writing, maintaining a 75% pass rate on the state

23
Reading SOL for Grades 3-5, developing student writing skills, and reducing teacher
frustration. This program evaluation will focus on the student reading competence goal.
Evaluation questions. Evaluation questions were developed to determine if the
short-range and mid-range goals for student reading competence have been achieved.
These questions are:
1. What levels of in-class student reading time have English teachers provided
from Fall 2013 to Spring 2018?
2. To what degree are students motivated to read at home?
3. What are the reading competencies of elementary school students as assessed
by state standardized test data for Grades 3-5 from 2012-13 to 2017-18?
4. What degrees of sustained longitudinal growth in reading comprehension
were achieved by students who were introduced to the Balanced Literacy
approach in the district during first grade in the 2013-2014 school year and
have remained in the school district through sixth grade?
Definition of Terms
Academic reading is student reading in school or for school, including required reading
for various program points, homework, and assignments.
Balanced Literacy is a framework for teaching reading and writing that includes Guided
Reading, Shared Reading, Independent Reading, and Read Aloud. The
framework focuses on small group instruction based on student need, student
reading, and teacher flexibility.
Motivation to read refers to an individual’s interest and desire to read. Intrinsic
motivation to read is an individual’s inherent desire to read for the joy and

24
satisfaction of reading. Extrinsic motivation to read is an individual’s desire to
read in order to receive external rewards such as a good grade, praise, or a
tangible prize.
Phonological Awareness Literacy Screening (PALS) is the state provided screening tool
used in Virginia for Grades K-3. PALS consists of three instruments, PALS-
PreK, PALS-K, and PALS 1-3. PALS assessments are used by 99% of the public
schools in Virginia to identify students in need of additional reading instruction.
Reading Competence includes all of the skills for reading including, decoding, fluency,
and comprehension. It is used throughout the text to refer to the highest level of
overall reading achievement.
Standards of Learning (SOL) outline the minimum expectations for student learning in
Virginia public schools. There are SOLs for English, mathematics, science, social
studies, and other subjects. In certain grades as specified by the state, students
take SOL tests to measure their proficiency on the subject specific SOLs. The
SOL tests are standardized test with a passing score of 400 and a maximum score
of 600.

25
CHAPTER 2
REVIEW OF RELATED LITERATURE
This chapter provides a review of the literature relevant to the critical components
of this study. Background knowledge on the chronological trends of instructional
approaches and programs to teach reading in elementary school is necessary to fully
understand the Balanced Literacy approach. The history of reading instruction and the
persistent debate over explicit versus whole language instruction was the impetus for an
abundance of reading research. The research evidenced the strengths and weaknesses of
both approaches, which developed the foundation for the Balanced Literacy approach. It
is also important to expand on the purpose and implementation of each element of the
Balanced Literacy approach. Finally an understanding of the indispensable role student
motivation plays in the reading process is necessary for framing this study. This chapter
will conclude with a review of the literature on different tools that have been developed
to measure students’ reading motivation.
Historical Trends in Elementary Reading Instruction
Reading is the foundation of all other structured scholarly learning (Becker et al.,
2010; Bitter et al., 2009; Hulme & Snowling, 2011; Schiefele & Schaffner, 2016). Since
the formation of written language, reading has been integral to any formal education.
However, the recognition of the need for structured programs and teacher training have
only been recognized in the last century (Tinker, 1943). Based on his literature review,

26
Tinker (1943) identified 10 trends in reading instruction: extending reading research from
the laboratory to the classroom, use of machines, extending reading instruction to high
school and college, specializing instruction to grade level, teaching reading skills for
specific reading situations, teaching reading skills needed for different content,
individualization of reading instruction, remedial reading work in regular reading classes,
remedial reading from elementary to college, and emphasis on reading readiness.
This new awareness and focus on reading instruction continued with the creation
of The Reading Teacher journal in 1948 (Mohr et al., 2017). From 1948 to 1991,
quantitative research, instructional strategies, and assessment were the most frequent
topics in Reading Teacher articles (Mohr et al., 2017). From 1992 to 2016, instructional
strategies remained the most frequent topic (Mohr et al., 2017). Unfortunately, Mohr et
al. (2017) do not specify the type of instructional strategies, so it cannot be determined if
the focus was on explicit or whole language instruction. However, word identification
(19) and fluency (12), which are typically taught through explicit instruction, were the
topics of more articles from 1997 to 2001 than they were for any other five year period
from 1992 to 2016 (Mohr et al., 2017; Rasinski, 2006). As shown in Table 1,
comprehension and content reading, which are typically associated more with whole
language instruction, were the topics of fewer articles during that time period,
comprehension (20) and content reading (16), when compared to other time periods
(Mohr et al., 2017).

27
Table 1
Frequency of Coded Topics in The Reading Teacher in Five-Year Segments and Total
Topics 1992-
1996
1997-
2001
2002-
2006
2007-
2011
2012-
2016
Total
Articles
(%)
Comprehension 22
(3.47)
20
(3.10)
38
(6.71)
20
(4.90)
58
(10.62)
158
(5.64)
Content
Reading
39
(6.15)
16
(2.48)
25
(4.42)
12
(2.94)
26
(4.76)
118
(4.21)
Word
Identification
6
(0.95)
19
(2.94)
10
(1.77)
5
(1.23)
6
(1.10)
46
(1.64)
Fluency 6
(0.95)
12
(1.86)
11
(1.94)
4
(0.98)
6
(1.10)
39
(1.39)
Attitudes,
Habits, and
Interests
55
(8.68)
38
(5.88)
26
(4.59)
11
(2.70)
30
(5.49)
160
(5.71)
Note. Adapted from Reading the Past to Inform the Future: 25 Years of The Reading
Teacher by K. Mohr, G. Ding, S. Strong, L. Branum, N. Watson, K. Priestley, S. Juth, N.
Carpenter, and K. Lundstrom, 2017, The Reading Teacher. The Reading Teacher, 71, p.
254.
In the United States, there has been a debate in reading instruction over best approaches.
The two primary approaches in the last 55 years have been explicit instruction and whole
language instruction (The Free Press, 2001; Vellutino, 1991).
Between 1930 and 1960, the Dick and Jane series was a popular text for
children’s reading instruction (The Free Library, 2001). The text used high frequency
words and focused on a whole word approach, but the plot was often too simple to
develop comprehension skills. In the 1940s, Tinker (1943) mentioned a modified
phoneme activity in his literature analysis. Despite this reference, reading instruction in
the 1940s was based on whole word reading and comprehension (K12 Academics, 2018).

28
The phoneme activity mentioned by Tinker (1943) was for remedial readers. In 1955,
Rudolf Flesch published Why Johnny Can’t Read, which presented a passionate political
and academic argument for using a phonics based approach to teach reading (Robinson,
1955; The Free Press, 2001). Flesch’s book initiated the polarized debate over explicit or
whole language instruction. However, despite his argument and the public attention,
reading instruction within schools maintained a meaning emphasis method (Barry, 2008).
In an attempt to resolve the debate and improve reading instruction, a Harvard
researcher, Jeanne S. Chall, published Learning to Read: The Great Debate in 1967.
Based on her analysis of reading research and programs, Chall presented evidence that
code emphasis produces better readers. Concurrent with Chall’s book and the shift to
code-emphasis was the use of basal readers in the classroom. Basal readers introduced
characters of color to the American classroom, but they also contributed to the overuse of
workbooks and drill strategies (Morrow, 1992; Ravitch, 2007). As a reaction to the
overemphasis on code and drill, the whole language approach was introduced in the
1970s. Yetta and Ken Goodman were early advocates of the whole language approach
(Foorman, 1995; Vellutino, 1991). This shifted the focus from whole word to whole
language. The whole language approach continued to gain popularity among teachers
and professional education organizations in the 1980s (Barry, 2008; The Free Library,
2001).
In 1983, Jeanne S. Chall republished Learning to Read: The Great Debate, which
included more research supporting the use of phonics in reading instruction, but also
acknowledged the benefits of whole word instruction (Barry, 2008). In 1985 Rudolph
Flesch published Why Johnny Can’t Read and What You Can Do about It in an attempt to

29
undermine the shift to whole language. Despite these publications, the whole language
movement continued to grow. Advocates of the whole language approach thought the
debate was over in 1987, when the California State Superintendent mandated a shift from
skills-based reading programs to quality literature. However, after California students
ranked near the bottom on the National Assessment of Educational Progress (NAEP) in
1992 and 1994, California returned to a phonics-based approach in reading instruction
(Barry, 2008).
In the late 1990s, the U.S. Congress and the National Research Council developed
two different panels to analyze the existing reading research, programs, and outcomes to
determine the most effective approaches to reading instruction. Both groups published
reports that advocated for explicit instruction on phonics, fluency, and vocabulary as well
as reading comprehension (Barry, 2008). This seemed to be a more balanced approach
rather than the polarized view of explicit instruction or whole language. Then in 2001,
No Child Left Behind (NCLB) legislation mandated the use of reading programs that
were scientifically based on reading research. Given the limited research on whole
language approaches, advocates of code-based or explicit instruction felt this was a
mandate for the return to code-based instruction (Brown, 2017; Vellutino, 1991). More
explicit, code-based instruction may have been implied in NCLB, phonics was not
mandated by the legislation (Brenner & Hiebert, 2010).
Core reading programs, also referred to as basal reading programs, were used
from the 1950s through the 1980s, but use was decreasing in the 1990s until the passage
of NCLB (Barry, 2008; Brenner & Hiebert, 2010). NCLB required the use of evidence-
based instructional practices. Given the long history of the use of core reading programs,

30
there is extensive research on the content, design, and components (Reutzel et al., 2014).
Immediately following the passage of NCLB, many states advocated for more explicit
instruction and invested in more prescribed reading programs or core reading programs
(Brenner & Hiebert, 2010; Strauss, 2012).
Core reading programs offer a prescriptive approach to reading instruction with
workbooks and explicit teacher’s editions. Primary grade level core reading programs
include phonics or decodable readers and leveled texts (Reutzel et al., 2014). Two of the
most popular programs offered decodable readers which reinforced the phonics lessons
(Brenner & Hiebert, 2010). Despite the emphasis on reading fundamentals and research-
based instructional practices, the use of core reading programs did not build the reading
skills necessary to become analytical or even proficient readers (Pilonieta, 2010; Strauss,
2012). It was estimated that 80-90% of elementary classrooms in the U.S. were using
basal reading programs, but only 24% of fourth-grade students and 29% of eighth-grade
students could meet the benchmark for proficient reading (Pilonieta, 2010).
The lack of student reading comprehension mastery may be due to two identified
instructional deficiencies with basal reading programs: student reading time and the lack
of instruction on reading comprehension strategies (Brenner & Hiebert, 2010; Pilonieta,
2010). In their research of student reading time based on word count in six of the most
popular core reading programs, Brenner and Hiebert (2010) found that the mean volume
of reading texts was 15 minutes a day. In a 90-minute block of reading instruction,
students would read a mean of 16.7% of the allotted time, with the lowest amount of time
being 11.3% for one program (Brenner & Hiebert, 2010). The core reading programs
focused more on decoding and explicit instruction than actual student reading.

31
Pilonieta (2010) found that core reading programs do not teach, model, or practice
comprehension strategies consistently or in a coherent sequence. The lack of systematic
introduction and application of comprehension strategies and the disproportionate
recommendations of reading comprehension strategies contribute to the limited
development of competent readers in elementary schools using core reading programs
(Pilonieta, 2010; Reutzel et al., 2014). Reading comprehension strategies enable a
student to monitor and evaluate their learning by using learned comprehension strategies
in new contexts. Proficient readers utilize comprehension strategies almost every time
they read, but poor readers use a limited number of strategies and are not able to transfer
the skill to new texts as easily (Baumann & Heubach, 1996; Lenski & Nierstheimer,
2002; O’Connor et al., 2015). Elementary school students utilize metacognitive
awareness more and across varied reading scenarios when they are explicitly taught
comprehension strategies and given the opportunity to practice the strategies in various
contexts (Baas, Castelijns, Vermeulen, Martens, & Segers, 2015; Boulware-Gooden,
Carreker, Thornhill, & Joshi, 2007). Core reading programs, which are criticized by
whole language advocates as being too explicit, do not provide succinct, consistent
instruction and application of comprehension strategies necessary for students to become
effective readers.
Given the back and forth swing of the reading instruction pendulum with mixed
results on both sides, researchers and practitioners have advocated for what has been
called a balanced approach. This approach is most often referred to as Balanced Literacy.
Balanced Literacy, as the name implies, incorporates explicit and whole language
approaches to reading instruction. To fully understand what those approaches include,

32
the next section will summarize research on explicit instruction and whole language
instruction.
Explicit instruction. Explicit instruction may also be referred to as code-oriented
instruction (Barry, 2008; Foorman, 1995; Vellutino, 1991). Explicit instruction is a
prescriptive approach to teaching word identification and meaning prior to exposure to
context (Vellutino, 1991). The primary components of explicit instruction are phonics or
phoneme awareness, decoding, and reading fluency, which aligns with the five essentials
of evidence-based reading instruction: phonemic awareness, phonics, fluency,
vocabulary, and comprehension (Reutzel et al., 2014). There is an abundance of research
that supports the use of these components of explicit instruction to develop word
identification skills (Foorman & Francis, 1994). Students who cannot identify words out
of context and have poor phonological awareness tend to perform poorly on reading
assessments (Foorman, 1995; Reutzel et al., 2014; Vellutino, 1991).
Phonics instruction. Phonics instruction is one of the most controversial
components of explicit instruction (Foorman, 1995; Reutzel et al., 2014; Vellutino,
1991). Phonics instruction is the direct teaching of letter sounds to facilitate the decoding
of unfamiliar words (Vellutino, 1991; The Free Library, 2001). Phoneme awareness
enables readers to categorize similar sounds. When similar sounds are at the beginning
of words, it is alliteration. When similar sounds are at the ending of words, it is rhyme.
Children’s skill in rhyming and alliteration are predictors of success in spelling and
reading (Bradley & Bryant, 1985).
Research has provided evidence that most people identified as poor readers also
lack decoding skills and have a deficient understanding of phonemes (Bertelson, 1987;

33
Foorman, 1995; Morais, Cary, Alegria, & Bertelson, 1979; O’Connor, Swanson, &
Geraghty, 2010; Stanovich, Nathan, & Zolman, 1988). There is also an abundance of
research on the lack of phonemic awareness in persons with reading disabilities such as
dyslexia (Byrne & Ledez, 1983; Foorman, 1995; Fox & Routh, 1980; Lundberg, 1989).
Vellutino (1991) uses the research with normal development samples and reading
disabled samples interchangeably to argue the importance of phoneme awareness in
reading instruction.
Reading Recovery was a popular phonics-based program in the 1990s. The
Reading Recovery program targeted the beginning readers who were in the bottom
10-20% in their first-grade class. Trained teachers provided individual remedial
instruction 30-40 minutes per day for 12-20 weeks. The effect sizes were significant
(Wasik & Slavin, 1993).
Decoding. Decoding is one skill taught in explicit reading instruction. Decoding
is the recognition of and processing of letters in words (Foorman, 1995). When readers
lack automaticity of decoding, cognitive effort is spent on letter recognition rather than
meaning and comprehension (Foorman, 1995; O’Connor et al., 2010). The inability to
decode or decipher the words on the page is one of the first obstacles to reading
comprehension (O’Connor et al., 2015).
Reading fluency instruction. There are three key elements to reading fluency:
accuracy in word decoding, automaticity in recognizing words, and appropriate use of
meaningful oral expression while reading or prosody (Rasinski, 2006). Accuracy and
automaticity are taught concurrently by repeated reading with emphasis on increased
reading rate (Hudson, Lane, & Pullen, 2005; O’Connor et al., 2010). Prosody is taught

34
through explicit instruction, teacher modeling with specific focus on phrasing, and
student reading with assisted reading techniques (Hudson et al., 2005). The type of
reading content and the emphasized goal of repeated reading have been debated, but
proponents agree on the need for reading fluency instruction with explicit instruction
(Rasinski, 2006).
Whole language instruction. Whole language instruction may be referred to as
meaning oriented approaches or whole word learning (Foorman, 1995; Vellutino, 1991).
The whole language approach to reading instruction is based on the belief that reading is
natural (The Free Library, 2001). The primary goal of the whole language approach is to
develop a love of reading by exposing the child to authentic and connected text rather
than contrived reading instruction (The Free Library, 2001). Learning to read is a
context-driven process and readers develop word identification and meaning in context
(Vellutino, 1991). The ability to decode is necessary for reading comprehension, but
isolated instruction in decoding and word identification does not improve reading rates
(O’Connor et al., 2010).
Research has been used to argue for the whole language approach to reading
instruction. The studies do not measure the whole language effect on reading
competence. Instead most of the studies highlight a single positive outcome or a single
aspect of the whole language approach. Stahl, McKenna, and Pagnucco’s (1994)
concluded that whole language instruction improves children’s attitudes toward reading.
Attitude when equated to motivation has a significant effect on reading competence, but
this study did not give evidence that whole language instruction improves reading
comprehension (Stahl et al., 1994). Foorman et al. (2006) found that time spent reading

35
was the only factor out of 20 measured that independently improved post-test scores on
reading. The 20 factors included word, alphabetic, or phonemic awareness (Foorman et
al., 2006). Since reading time did improve reading while time spent on phonics
instruction did not, this study has been cited as support for whole language instruction.
Even the National Reading Panel, which supported explicit instruction, informally
acknowledged reading time in the following statement:
Despite widespread acceptance of the idea that schools can successfully
encourage student to read more and that these increases in reading practice will be
translated into better fluency and higher reading achievement, there is not
adequate evidence to sustain this claim. (National Institute of Child Health and
Human Development, 2000, pp. 3-28).
Since the National Reading Panel released its report, there have been studies that support
the effect of reading practice or time on reading competence (Kim & White, 2008;
Reutzel, Fawson, & Smith, 2008).
In 1986, the Accelerated Reader (AR) program was developed. AR did not
market itself as a whole language program, but there was no instructional piece. The
focus of AR was reading. The AR program claimed to build lifelong readers and was
based on the belief that in order to become better readers, children needed to read more.
The AR program is a software management program developed to track the number of
books read, assess the student’s comprehension of the books, and assign points based on
the reading level of the book and the student’s score on the quiz. Despite its popularity,
there are a number of concerns about the program including cost, inconsistent leveling of
books, new books not being included in the program, and limiting classroom discussion

36
of books because teachers did not want students to learn about the books without reading
them.
Notwithstanding these concerns, the most significant issue with the program is
that studies do not support the claim that it increases student motivation and develops
lifelong readers. Students who used AR in elementary school were less likely to read in
middle school than students who did not use AR in middle school. However, students
who used AR in elementary school and continued to use AR in middle school were more
likely to read than both of the aforementioned groups (Pavonetti et al., 2003). This may
support the findings that the desired outcomes of the AR program increase with time.
Paul, VanderZee, Rue, and Swanson (1996) found that student reading increased with the
long-term use of the AR program.
The assignment of points through the AR program, which many schools translate
into grades, develops extrinsic motivation for some students. While intrinsic motivation
is positively correlated with reading comprehension, extrinsic motivation has a negative
effect on reading comprehension, which increases over time (Becker et al., 2010;
Schiefele & Schaffner, 2016). Given the extensive research supporting the negative
effect of extrinsic motivation on reading comprehension, the limited research supporting
the increase of reading growth with extended use of the AR program, and the persistent
sub-standard performance in reading comprehension as measured by standardized tests, it
is difficult to proclaim the positive effect of the AR program.
Current trend. Given the conflicting opinions, research, and stagnant reading
growth over the last 50 years, researchers, educators, and parents have recognized the
need for a different approach to reading instruction. Explicit instruction does not give

37
students enough exposure to connected texts or enough time to read. Even in the limited
amount of time students read in core reading programs, all students read the same texts
during independent reading (Brenner & Hiebert, 2010). There was no differentiation to
meet the reading needs of individual students. “The amount of reading that is
recommended in the instructional plans of these programs is not changing the trajectory
of the very students for whom the mandates have been put in place” (Brenner & Hiebert,
2010, p. 361). The whole language approach exposes students to copious amounts of
connected text but does not provide instruction to build basic word recognition skills that
struggling readers often do not develop from context. The contradictory research,
political debate, and pros and cons of both approaches had led many researchers to
advocate for a blended or balanced approach. The move to a balanced literacy approach
began in the 1990s but has ebbed and flowed with educational legislation and political
debates (Spiegel, 1998; The Free Library, 2001).
Balanced Literacy
The foundation of Balanced Literacy is that there is no single approach to reading
instruction that works for every child. Spiegel (1998) summarized the paradox of reading
instruction, “Research shows that you can teach some of the children some of the time
with one program, but you can’t teach all of the children all of the time with that same
program” (p. 115). Staunch proponents on both sides of the reading debate have
recognized that some students need more explicit instruction and that alphabetic
instruction can occur within meaningful context (Foorman, 1995; Spiegel, 1998). Spiegel
(1998) defines the balanced literacy approach as a decision-making approach that

38
empowers the classroom teacher to make informed choices that will be individualized for
each child to develop reading and writing skills.
Balanced literacy is often simplified to a combination of explicit instruction and a
whole language reading approach (The Free Library, 2001). While the components of
explicit instruction, phonics, decoding, and reading fluency, may be incorporated into
mini-lessons and students do read authentic text as part of a balanced literacy approach, it
is not a uniform blending of the two approaches (Metsala et al., 1997). A balanced
literacy approach is based on these four tenets:
All strategies and approaches are based on research.
The teacher is an informed decision maker.
The approach is flexible to the needs of the child.
Literacy is both reading and writing.
To successfully use a balanced literacy approach in the classroom, teachers must be
knowledgeable of research proven strategies and flexible to make informed daily changes
that best meet the needs of their students (Metsala et al., 1997; Spiegel, 1998).
In 1992, the NAEP reported that most U.S. teachers were using a balanced
approach to reading instruction. However, approximately 40% of fourth graders were
still scoring in the below basic category and overall scores were still very low (Valencia,
Hiebert, & Kapinus, 1992). The underlying issue may be that there is no uniform
understanding of what a balanced approach is (The Free Library, 2001). In 1998, The
National Academy of Sciences released Preventing Reading Difficulties in Young
Children, which was an analysis of reading instruction to determine the most effective
practices and end the debate. This report was oversimplified as a balanced approach and

39
reviewers focused on the two existing approaches (The Free Library, 2001). Despite the
skewed criticism of reviewers, the report advocated engaging preschool environments,
effective reading instruction, and the absence of risk factors to develop reading skills
(Snow, Burns, & Griffin, 1998). The tenets of the Balanced Literacy approach give the
teacher unrestrained flexibility to use research driven strategies. It does not limit
instruction to phonics, decoding, and reading, but often the approach is applied in this
manner, which may account for the limited growth of reading competence despite the
existence of a balanced language approach for 30 years (The Free Library, 2001).
Metsala et al. (1997) found that teachers, who were highly effective using the
balanced literacy approach, incorporated authentic reading and explicit instruction with
extensive flexibility depending on the needs of the students in the classroom. The
explicit instruction did not follow a prescribed plan and the reading was not limited to
leveled or basal readers. The content of decoding, punctuation mechanics, and
comprehension strategies were incorporated using modeling, explanation, mini-lesson re-
teaching, whole class instruction, small group instruction, individual instruction, and a
large variety of reading materials including trade books. The authors identified the
following characteristics of highly effective literacy teachers: instructional balance,
instructional density, extensive use of scaffolding, encouragement of self-regulation,
thorough integration of reading and writing activities, masterful classroom management,
high expectations for all students, and awareness of purpose (Metsala et al., 1997).

40
Student Reading Behavior
To become competent readers, students must be motivated to read, spend time
reading, and be engaged in the process of reading when they read (De Naeghel et al.,
2012).
Engagement. Engagement in reading is the quality of involvement and the
emotional involvement with the text and the reading process (Fredericks, Blumenfeld, &
Paris, 2004). Gambrell (1996) defined the engaged reader as motivated, knowledgeable,
strategic, and socially interactive. Other researchers have supported this definition.
Guthrie et al. (2006) proposed that engaged readers are motivated and strategic.
Engagement has been positively associated with increased reading competence (Guthrie
et al., 2004). Consequently, researchers have studied numerous strategies to increase
student engagement in reading.
Student engagement increases when students are given a choice (Pflaum &
Bishop, 2004). Choice increases ownership and interest in the academic content or
activity. In a study of 32 second- and third-grade students, Fraumeni-McBride (2017)
found that student engagement with the text and reading comprehension increased when
students were allowed to choose the book they read. First, students were assigned a
grade-appropriate book from the Reading A-Z series and their comprehension of the text
was assessed using four evaluations. Then the students were allowed to select a book
from three grade-appropriate books in the Reading A-Z series and were given the same
four assessments. Three trials were conducted during which students read the books
aloud. Three trials were conducted during which students read the books silently. In
addition to choice improving reading comprehension, silent reading improved reading

41
comprehension scores. This study was conducted with high and low income students, but
the sample only consisted of 32 students (Fraumeni-McBride, 2017).
Questioning strategies have been identified as another method to increase student
engagement. Students who are asked scaffolded questions, which build from low
cognitive demand to high cognitive demand, make meaningful connections between the
text and prior knowledge and increase comprehension (Blewitt, Rump, Shealy, & Cook,
2009). However, Zhou and Yadav’s (2017) findings did not support previous research on
the questioning. The researchers measured the reading engagement of 72 four- and
five-year-olds using a reading engagement protocol. Observers used the reading
engagement protocol to code student engagement as they read. The protocol consists of
12 items that measure three aspects of engagement: physical, verbal, and emotional. The
observers ranked each child on a 3-point Likert scale ranging from 0 (rarely) to 2
(frequently). The researchers used a two-way ANOVA test to determine the effects of
multi-media format of the passage and questioning strategy on total student reading
engagement. Students were more engaged using the multi-media format, however, there
was no difference in reading comprehension. Furthermore, different questioning
strategies were not related to a significant difference in engagement or reading
comprehension (Zhou & Yadav, 2017).
Some researchers have suggested that engagement may be the link between
intrinsic motivation and reading competence (Pflaum & Bishop, 2004). However, this has
not been consistently supported. In their study, Guthrie et al. (2006) increased the
frequency of pairing stimulating hands-on task with classroom reading. The hands-on
task increased students’ situational motivation and over time increased intrinsic

42
motivation. Consequently, increased student engagement resulted in increased intrinsic
motivation, which then increased reading comprehension. When the researchers
controlled for student motivation, student engagement did not increase reading
comprehension (Guthrie et al., 2006). Taboada et al. (2009) also found that motivation
increased students’ cognitive processes and engagement. In their study of 1,260 fifth-
grade students, De Naeghel et al. (2012) had teachers rated each of their assigned
students reading engagement on a 5-item scale. The researchers did not find a significant
relationship between academic reading motivation and engagement.
Frequency and amount. Reading frequency and amount have often been
intertwined as one reading behavior in studies (Anderson, Wilson, & Fielding, 1988; De
Naeghel et al., 2012; Schmidt & Retelsdorf, 2016; Stutz, Schaffner, & Schiefele, 2017),
but may also be studied independently. Reading frequency is how often a student reads
and amount is how much time is spent reading. Numerous studies exploring the factors
affecting reading comprehension have included frequency and amount of time with
mixed results. De Naeghel et al. (2012) found that reading frequency and the amount of
time spent reading were not significantly correlated with reading comprehension in their
study of fifth-grade students’ motivation, reading behavior, and reading comprehension.
The researchers found that students who were intrinsically or autonomously motivated to
read spent more time reading recreationally and performed better on a standardized
reading comprehension test; but when other factors were controlled, the reading amount
was not a significant predictor of reading comprehension (De Naeghel et al., 2012).
According to the 2003 NAEP survey of fourth-grade students, more than half responded

43
that they did not read frequently for enjoyment. According to the 2015 NAEP survey,
34% of fourth-grade students agreed that reading is one of their favorite activities.
Student Motivation to Read
The inherent role of motivation in reading competence is ubiquitous in the
literature (Becker et al., 2010; Gambrell, 1996; Pavonetti et al., 2003; Taboada et al.,
2009; Tinker, 1943). As shown in Table 1, motivational aspects of reading which was
coded as attitudes, habits, and interests, was the topic in over 5% of the articles in
Reading Teacher between 1992 and 2016 (Mohr et al., 2017). Motivation is imperative
to become a proficient reader, but motivation has more than one definition. Motivation to
read is defined as intrinsic and extrinsic.
Intrinsic and extrinsic motivation. Intrinsic and extrinsic motivation have
multiple definitions. Guthrie and Wigfield (2000) defined intrinsic motivation as reading
for enjoyment and defined extrinsic motivation as reading to obtain external recognition.
Unrau and Schlackman (2006) defined intrinsic motivation as being based on an
individual’s personal interest and gaining satisfaction by learning about topics of interest.
Unrau and Schlackman (2006) defined external motivation as participation in an activity,
not for the sake of the activity, but for rewards or avoidance of external social
consequences. Schiefele and Schaffner (2016) defined intrinsic motivation as a
willingness to read due to the satisfaction or reward in the act and defined extrinsic
motivation as reading to attain specific external outcomes such as grades or praise.
Unrau and Schlackman (2006) argued that extrinsic motivation may not always
undermine intrinsic motivation to read. Extrinsic motivators such as grades increase
student awareness that control of their learning is external, but some extrinsic motivators

44
become internalized as meaningful (Unrau & Schlackman, 2006). If the external
motivator is the sole motivator, external motivation negatively impacts learning, as well
as intrinsic motivation. If the external motivator aligns with personal values or interest,
even when the activity may not, external motivation can be internalized by young readers
and lead to increased intrinsic motivation (Unrau & Schlackman, 2006).
Research has consistently shown that student motivation declines as students get
older and move to higher grades (Eccles, Lord, & Buchanan, 1996; A. E. Gottfried,
Fleming, & Gottfried, 2001; Harter, 1981; Lepper, Corpus, & Iyengar, 2005; Otis,
Grouzet, & Pelletier, 2005). Lepper et al. (2005) found that intrinsic motivation
decreased significantly as students moved from Grades 3-8. Otis et al. (2005) reported
that intrinsic and extrinsic motivation gradually decreased as students moved from
Grades 8-10. A. E. Gottfried et al. (2001) also reported differences in student motivation
by content area: mathematics and science declined the most, reading declined more
moderately, and social studies had no significant decline. Researchers have speculated
about the causes of this deterioration. Kohn (1993) conjectured that rewards and external
motivators erode the interests and natural curiosity of students.
Few studies have contradicted this decline in student motivation. A. W. Gottfried,
Cook, Gottfried, and Morris (2005) differentiated extremely high academic intrinsic or
gifted motivation from gifted intelligence. Students with gifted motivation did not show
a decline in motivation from elementary grades through high school. The students with
gifted motivation consistently outperformed their peer cohort on measures of
achievement, classroom functioning, intellectual performance, self-concept, and post-
secondary educational progress (A. W. Gottfried et al., 2005).

45
Becker et al. (2010) studied the correlation between intrinsic and extrinsic reading
motivation, reading amount, and reading competence in a longitudinal study of German
students as they moved from third grade to sixth grade. Reading amount included
duration of reading time and frequency. Reading competence was defined as reading
literacy in the study and was measured in third grade with multiple choice questions from
Hamburger Lesetest and in sixth grade with texts from Diagnostischer Test Deutsch.
Vocabulary and decoding were also measured in third and sixth grade. Intrinsic reading
motivation was measured in fourth grade using three dimensions: intrinsic value of the
act of reading, intrinsic value of books, and importance of reading. Extrinsic reading
motivation was measured in fourth grade using three dimensions: parents, school, and
instrumental goals. The items on both motivation measures were answered using a 4-
point Likert scale ranging from agree completely to disagree completely. Based on the
results, extrinsic motivation in fourth grade was negatively correlated with reading
amount and reading competence in sixth grade. When reading amount was controlled
for, fourth grade intrinsic reading motivation was not significantly correlated with
sixth-grade reading competence. The overarching finding was the high stability of
reading achievement. Students who read well in third grade read well in sixth grade.
Students who read poorly in third grade read poorly in sixth grade. Fourth-grade intrinsic
motivation was positively correlated with third-grade reading achievement, which
indicates an inverse relationship that achievement increases intrinsic motivation.
McKenna, Klear, and Ellsworth (1995) also studied the impact of achievement on
the development of motivation. The researchers developed a predictive model based on
the premise that social context and environment impact shape student’s beliefs about

46
external expectations and the student thus conforms to those expectations. Those beliefs,
as well as cultural identity, extent of relation with that culture, specific expectations,
reading purpose, and conflicting expectations, create the student’s subjective norms
regarding reading (McKenna et al., 1995). The predictive model is grounded in the
theory that students who have difficult or frustrating reading experiences form a negative
attitude towards reading and eventually seek other activities. In the study, McKenna et
al. (1995) found that the model predicted a decline in motivation for recreational reading,
but not academic reading. In the study, all students were motivated to read in first grade.
Students who had difficulty reading experienced a more significant decline in
recreational reading motivation by sixth grade than students who were proficient readers.
All students experienced a decrease in academic reading motivation by sixth grade,
regardless of reading ability.
Self-Determination Theory (SDT) and motivation. SDT is a theoretical
framework based on the need for personal growth and self-regulation (Unrau &
Schlackman, 2006). Soenens and Vansteenkiste (2005) found that self-determination
motivation was domain specific and academic self-determination is associated with
higher grades, feelings of competence or self-efficacy, and self-concept. Self-
determination motivation is a component of intrinsic motivation. De Naeghel et al.
(2012) used SDT to frame their study on the impact of motivation on elementary school
reading achievement because it provides a framework to differentiate types of extrinsic
motivation based on autonomy. Intrinsic motivation is completely autonomous, but
extrinsic motivation may be partially autonomous or completely controlled (De Naeghel

47
et al., 2012). The more controlled or externalized the motivation, the more negatively it
impacts learning.
Based on SDT, intrinsic motivation is indicative of an internalized locus of
control and the pursuit of learning for personal meaning and fulfillment (Unrau &
Schlackman, 2006). However, this internalized pursuit of learning is incongruent with
the overwhelming amount of research findings that intrinsic motivation decreases as
students progress to higher grades (Eccles et al., 1996; A. E. Gottfried et al., 2001;
Harter, 1981; Lepper et al., 2005; Otis et al., 2005). There are arguments to explain this
apparent incongruence. If intrinsic motivation is not accompanied by positive academic
achievement as students move to higher grades, however, frustration undermines self-
efficacy and eventually erodes intrinsic motivation because there is limited to no personal
growth or fulfillment (Lepper et al., 2005). Kohn (1993) conjectured that schools’
extrinsic constraints and contingencies on student learning undermine intrinsic
motivation. Despite the overwhelming evidence showing that the longer children are in
schools the less intrinsically motivated they become and the decades of research, there is
no definitive, agreed upon cause for the decline.
Taboada et al.’s (2009) study emphasizes the intertwining of intrinsic motivation,
reading strategies, and increased reading competence. The researchers did not
specifically reference SDT in their study of motivation and cognitive variables effect on
reading comprehension. However, their findings align with the definition of SDT. The
teachers of the fourth-grade students in the study rated five dimensions of students’
intrinsic motivation for reading: perceived control, interest, self-efficacy, involvement,
and social collaboration. The cognitive variables in the study were two reading

48
strategies: activating background knowledge and student questioning. Students in the
study completed two different activities with a researcher designed reading packet to
measure background knowledge and student questioning. The students took a multiple-
text reading comprehension constructed response assessment and the Gates-MacGinitie
Reading Test to measure reading comprehension. The teacher rated each student on five
items, one for each intrinsic motivation dimension, using a Likert scale ranging from a 5
(very true) to a 1 (not true). Based on the results of the study, the two cognitive variables
and intrinsic motivation were independently associated with increased reading
comprehension. The researchers concluded that intrinsic motivation stimulated students
to use their cognitive processes and strategies, which lead to increased reading
competence. Intrinsically motivated students have a desire to understand the text, which
causes them to use the reading strategies such as activating background knowledge and
questioning. This internal motivation to comprehend and grow as a reader is the
alignment with SDT.
Motivation measurement tools. Given the predictive value of student
motivation on reading competence, researchers have developed several different tools to
measure student motivation to read with validity and reliability.
Motivation for Reading Questionnaire (MRQ). Guthrie, McGough, and
Wigfield (1994) developed the MRQ. The MRQ identifies intrinsic and extrinsic
motivation as the two types of motivation (De Naeghel et al., 2012). The original MRQ
identifies 11 dimensions of intrinsic and extrinsic reading motivation: (a) self-efficacy,
(b) challenge, (c) work avoidance, (d) curiosity, (e) involvement, (f) importance, (g)
recognition, (h) grades, (i) competition, (j) social motives, and (k) compliance. Wigfield

49
and Guthrie (1997) refined the MRQ in a study with fourth- and fifth-grade students.
Based on the previous findings, the researchers modified the MRQ to measure three
different aspects of reading motivation: reading efficacy, intrinsic and extrinsic
motivation, and social reasons for reading. The reading efficacy aspect included reading
efficacy and challenge. The intrinsic motivation aspect included (a) curiosity, (b)
involvement, (c) importance, and (d) reading work avoidance. The extrinsic motivation
aspect included (a) recognition, (b) grades, and (c) competition scales. The social aspect
included compliance. There were 82 items on the modified MRQ. The researchers found
that the intrinsic motivation aspect was a better predictor of the amount and breadth of
reading for students. The researchers also found that the fourth-grade students were more
motivated than the fifth-grade students. Finally, the researchers concluded that more
research is needed on the social aspect (Wigfield & Guthrie, 1997).
Baker and Wigfield (1999) used a confirmatory factor analysis to demonstrate
that the MRQ did identify and measure the 11 dimensions of motivation as Guthrie et al.
(1994) originally reported with reliability. This study also supported Wigfield and
Guthrie’s (1997) finding that reading motivation deteriorates as students move to higher
grades. The researchers found that fifth-grade students had significantly higher
motivation to read than sixth-grade students.
Guthrie et al. (1999) used the MRQ in two different studies to measure the effect
of the different dimensions of motivation on reading amount, reading achievement, and
comprehension. Study 1 consisted of third- and fifth-grade students and Study 2
consisted of eighth- and 10th-grade students. In Study 1, the students were given two
measures of text comprehension both of which required free response and a self-report

50
questionnaire to measure reading amount. Reading motivation was measured used a
modified form of the original MRQ. The modified form included 31 of the 54 original
items. The 31 items measured challenge, curiosity, involvement, recognition,
competition, and reading efficacy. The researchers formed an intrinsic composite
consisting of challenge, curiosity, and involvement. The researchers formed an extrinsic
composite consisting of recognition and competition. The researchers did not include
reading efficacy in either motivation composite, but analyzed the three items of reading
efficacy as a separate composite. In Study 1, the researchers found that motivation
predicted reading amount and reading amount predicted reading comprehension when
prior achievement, reading efficacy, and prior knowledge were controlled. The
researchers conducted Study 2 to test the generalizability of Study 1 findings to an older
student population. However, the instruments used in Study 2 were not comparable to
the instruments used in Study 1. In Study 2, students were given a 21 multiple choice
item test to measure comprehension, a Likert scale self-report questionnaire to measure
reading amount, a two-item measure to determine reading motivation, and a 25-item
measure to determine reading efficacy. The researchers concluded that Study 2 did
support the findings of Study 1. However, given the extreme differences in the type and
quantity of items on the measures used to determine reading comprehension, reading
motivation, reading amount, and reading efficacy, the findings may not be as
generalizable as the researchers originally reported.
In their study measuring reading motivation, reading amount, and text
comprehension in 197 Chinese and 187 American fourth grade students, Wang and
Guthrie (2004) did not find that reading amount predicted text comprehension when

51
reading motivation was controlled. The researchers used a two-factor motivational
measurement model in which curiosity, involvement and challenge comprised intrinsic
motivation and recognition, grades, social, competition, and compliance comprised
extrinsic motivation. Based on the composites identified in the two-factor motivational
measurement model, the researchers used a modified version of the original MRQ. Eight
of the 11 constructs were measured using 45 items. The researchers used the Reading
Activity Inventory to measure academic and non-academic reading amount. The
researchers used the International Association for the Evaluation of Educational
Achievement Reading Literacy Test to measure text comprehension. The researchers
determined past reading achievement through teacher reported grades for the previous
semester. Structural equation modeling was used to analyze the direct and indirect
relationships between the two composites of reading motivation, past reading
achievement, academic reading amount, non-academic reading amount, and text
comprehension. Confirmatory Factor Analysis was used to determine that the two-factor
motivational measurement model was a better fit than the single factor model. The
researchers found that intrinsic motivation is positively associated with text
comprehension when all other variables are controlled, whereas extrinsic motivation is
negatively associated with text comprehension when all other variables are controlled.
Reading amount was not significantly associated with text comprehension. There were
differences in the individual motivation composites for the two groups, but the general
findings were consistent for both groups (Wang & Guthrie, 2004).
Watkins and Coffey (2004) conducted two studies to test the validity of the MRQ.
In Study 1, the MRQ was administered to 332 third-, fourth-, and fifth-grade students at
52
two different elementary schools. In Study 2, the MRQ was administered to 735 third-,
fourth-, and fifth-grade students in two different elementary schools. Using confirmatory
factor analysis, the researchers found that the 11-factor model of the MRQ did not fit the
data in either sample. Using exploratory factor analysis, the researchers found that eight
of the eleven factors of the MRQ were a fit in both studies: self-efficacy, challenge,
curiosity, involvement, importance, recognition, grades, and competition. However, a
double confirmatory factor analysis determined those eight factors were an inadequate fit
in both samples. Based on the inconsistencies in previous research and the results of their
own study, Watkins and Coffey (2004) concluded that the MRQ needed to be revised
before it could be considered an independent valid and reliable measure for student
motivation.
Unrau and Schlackman (2006) used the MRQ to investigate the differences in
intrinsic and extrinsic motivation among ethnic groups, Hispanic and Asian, and the
corresponding relationship between motivation and reading achievement. Based on the
previous research of Wang and Guthrie (2004), the researchers hypothesized that
curiosity, involvement, and challenge would comprise the intrinsic motivational construct
and recognition, grades, social, competition, and compliance would comprise the
extrinsic motivational construct. Unrau and Schlackman (2006) used structural equation
modeling to test the direct and indirect relationships between demographic factors, such
as grade, gender, and ethnicity, and motivation both intrinsic and extrinsic, as well as
reading achievement. The researchers determined relationships and compared those
relationships across grades and ethnicity. The study was conducted over a two-year
period in a middle school comprised of Grades 6-8. Students who were sixth- and

53
seventh-graders during the first year, and stayed at the school for the next year, were
included in the study.
Due to the similarities of their study with Wang and Guthrie (2004) and the issue
of dimensionality raised by Watkins and Coffey (2004), Unrau and Schlackman (2006)
conducted confirmatory factor analysis on the original 11 factors of motivation proposed
by Baker and Wigfield (1999) and the 8 factors of motivation proposed by Watkins and
Coffey (2004). However, Unrau and Schlackman (2006) used the original procedures
and items used by Baker and Wigfield (1999) and did not include the extra items used by
Wang and Guthrie (2004). The 11-factor model had a higher Confirmatory Factor Index
(CFI) than the 8-factor model, so the researchers used the 11-factor MRQ (Unrau &
Schlackman, 2006). The Asian students had higher intrinsic motivation than the Hispanic
students, higher reading achievement, and there were other slight differences between the
two ethnic groups (Unrau & Schlackman, 2006). However, the research supported the
consistent themes of prior research on motivation:
Intrinsic motivation is significantly related to achievement, but extrinsic
motivation is not.
Intrinsic motivation is higher for females than males.
Males are more motivated by competition than females.
Intrinsic motivation decreases for all students as they progress to higher
grades, regardless of achievement.
Motivation to Read Profile (MRP). The MRP was developed to explore
elementary students’ motivation to read. The MRP is a two-part tool consisting of a
survey instrument and a conversational interview. The survey instrument evaluates the

54
student’s self-concept as a reader and the student’s value of reading. Each category
consisted of 10 items measured using a 4-point scale. The interview evaluates the
personal, social, and text factors related to reading. The MRP was originally
administered to 330 third-, fourth-, and fifth-grade students. The MRP was designed for
students in Grades 2-6 (Gambrell, 1996; Gambrell, Palmer, Codling, & Mazzoni, 1996).
Shaaban (2006) used the MRP to measure reading motivation and students’ value
of reading in a study investigating the effects of Jigsaw II cooperative learning model and
whole class instruction on improving English language learners’ reading comprehension
skills. Quirk, Schwanenflugel, and Webb (2009) used an amended version of the MRP to
measure reading self-concept of second grade students and determine its relationship to
reading fluency. Applegate and Applegate (2010) used the MRP to determine the
difference in reading motivation and the child’s perceived self-efficacy as a reader
between students who could recall what they read and think deeply about it and students
who could recall what they read but did not respond thoughtfully.
The MRP was revised in 2014 to align more with changes in culture and
linguistics. In the survey section, 7 items were kept without change, 12 items were
revised in the stem to provide clarity or in the response to improve reliability, and 1 item
was replaced to measure out of school reading instead of the original measure of future
perspectives of reading. The survey was reformatted from a paper version to a digital
version and the structure was changed to more closely align with the survey measures.
The Motivation to Read Profile—Revised (MRP-R) was field tested in three different
schools with 281 third-, fourth-, and fifth-grade students. The reliability was tested using
Cronbach’s alpha and the validity was measured using a root mean square error

55
approximation. The MRP-R was designed to measure student reading self-concept and
reading motivation. Teachers can use the MRP-R to inform instruction (Malloy,
Marinak, Gambrell, & Mazzoni, 2014).
Self-Regulation Questionnaire-Reading Motivation (SRQ). De Naeghel et al.
(2012) developed the SRQ based on SDT. The SRQ expands the types of motivation
from intrinsic and extrinsic to a spectrum of autonomy including intrinsic, identified
regulation, introjected, ad external regulation (De Naeghel et al., 2012). The SRQ
consists of 24 items scored on a 5-point Likert scale ranging from 5 (agree a lot) to 1
(disagree a lot). Each of the 24 items was administered twice, once in reference to
academic reading and once in reference to recreational reading. The SRQ was reviewed
by four SDT experts and pilot tested in two classes to ensure the items were understood
by late elementary children before being used in the 2012 study (De Naeghel et al.,
2012).
To ensure validity of the SRQ, De Naeghel et al. (2012) had students complete the
eight subscale MRQ as well as the SRQ. The researchers used structural equation
modeling to test the models relating academic reading motivation and recreational
reading motivation to engagement, frequency, and comprehension. Both academic and
recreational reading models supported the predictive validity of the SRQ and the study
confirmed that the SRQ was a reliable and valid tool to measure recreational and
academic reading motivation in late elementary school students (De Naeghel et al.,
2012).
Reading Motivation Questionnaire (RMQ). Schiefele and Schaffner (2016)
developed the RMQ to target student motivation for recreational reading. The

56
researchers developed a tool for recreational reading because studies had indicated that
the amount of time reading for pleasure was more strongly related to reading competence
than academic reading (De Naeghel et al., 2012) and they felt recreational reading
motivation would measure true reading motivation whereas academic reading motivation
is impacted by the student’s general desire to learn.
Schiefele and Schaffner (2016) analyzed the MRQ as the most comprehensive
tool for measuring reading motivation and narrowed the dimensions of the MRQ to align
with recreational reading. The RMQ includes curiosity, involvement, grades,
competition, and recognition as dimensions of reading motivation (Schiefele &
Schaffner, 2016). The researchers removed efficacy, importance, and challenge because
the constructs were considered to be consequences of reading motivation rather than
factors of motivation. The researchers removed work avoidance because it was
considered to be a consequence of low intrinsic motivation and/or low levels of self-
efficacy in reading. The researchers removed social reasons because the social items on
the MRQ refer to literacy practices without addressing the reason for the practice, which
makes it difficult to infer social motivations. The researchers removed compliance
because the MRQ compliance items indicated that the reading was required by school or
the teacher, which made the items irrelevant for recreational reading. Schiefele and
Schaffner (2016) added two additional dimensions based on previous qualitative
research: emotional regulation and relief from boredom.
Schiefele and Schaffner (2016) used items from the MRQ, other instruments, and
qualitative research to measure all seven dimensions on the RMQ. There were 34 items.
Each item was answered on a 4-point Likert scale ranging from 1 (not at all true) to 4

57
(very true). The study to validate the RMQ was conducted with a sample of 883
sixth-grade students from 24 elementary schools in Germany. The researchers
administered the RMQ, a reading amount questionnaire, a reading fluency test, and a
reading comprehension test to each student in the study. The reading amount tool
addressed frequency and duration of reading time. The researchers used Confirmatory
Factor Analysis to examine the RMQ.
Based on the analysis of the correlations between the dimensions of the RMQ and
reading amount, fluency, and comprehension, the RMQ dimensions of intrinsic reading
motivation were positively correlated with the reading competence variables and the
dimensions of extrinsic reading motivation were either non-significant or negatively
correlated with the reading competence variables. However, the extrinsic motivation
dimensions of competition and social recognition were positively correlated with reading
amount. The correlation was small, but significant. The researchers hypothesized that
this may have been due to the relatively high correlations of the extrinsic motivation
dimensions of competition and social recognition with the intrinsic dimensions of
curiosity and involvement. This study did provide evidence supporting the validity of the
RMQ to measure dimensions of recreational reading motivation for late elementary
students (Schieffele & Schaffner, 2016).
Reading Motivation Questionnaire for Elementary Students (RMQ-E). The
RMQ-E was developed to facilitate research on the role of reading motivation when
students are learning to read and comprehend texts. The RMQ-E was a 3-factor scale
designed for students in Grades 1-3. The RMQ-E measures the motivational factors of
curiosity, involvement, and competition. Curiosity and involvement are factors of

58
intrinsic motivation. Competition is an extrinsic motivation factor. The RMQ-E adapted
the original 20 items from the RMQ to focus on more basic reading achievement. After a
pilot test with 38 children, the RMQ-E was modified to 12 items answered using a
4-point scale (1=no, 2=rather no than yes, 3=rather yes than no, 4=yes). Another change
initiated by the pilot study was the format of the items. Originally, the items were written
as statements, which was confusing for younger students in the pilot study. The items
were re-written as questions for students in Grades 1 and 2. The items remained as
statements for the Grade 3 version.
The final version of the RMQ-E was administered to a sample of 1,497 students
in Grades 1-3. Using exploratory and confirmatory factor analysis, the researchers
confirmed the validity of the RMQ-E. The predictive validity of competition and
involvement on reading comprehension were consistent with previous research.
However, curiosity was either not significantly or negatively correlated with reading
comprehension, which was not expected (Stutz et al., 2017). This inconsistency may be
due to the age of the students and indicates the need for more research on early childhood
reading motivation.
A multitude of different factors affect a student’s ability to learn to read and to
build his/her reading competence. In order to understand the complexity of successfully
selecting and implementing a reading program, it is important to understand these factors.
Student motivation to read is one factor that has been consistently associated with reading
competence and is therefore an indispensable part of any reading program (Becker et al.,
2010; Gambrell, 1996; Pavonetti et al., 2003; Taboada et al., 2009).

59
Increasing a student’s motivation to read or to learn in general is not a
straightforward task. There are books, courses, and institutes trying to determine the
magic formula to motivate students. The Balanced Literacy approach does not offer a
formula, but proponents do argue that the approach increases student motivation to read.
Student motivation to read then increases frequency and reading competence. This study
analyzed the impact the approach has had on student motivation to read and reading
competence for students who have been in Balanced Literacy classrooms from Grades
1-5.

60
CHAPTER 3
METHODS
The purpose of this program evaluation was to investigate the impact the
Balanced Literacy approach had on elementary students’ reading competence and
motivation to read when implemented in a rural Virginia public school district.
Regardless of the reading program, explicit or holistic, being used, reading competence
as measured by standardized test score pass rates in the U.S. has been substandard and
has been stagnant for the last 40 years (Hao & Johnson, 2013; Walberg, 1996). The
fundamental importance of reading makes this trend more alarming. Reading is crucial
for mastery in other academic subjects, so low reading competence leads to student and
teacher frustration in other subjects as well. In addition to academic success, reading is
critical to becoming a productive member of society. Given the foundational importance
of reading and the divergent research on the most effective techniques to teach reading,
selecting a reading instructional program or approach for elementary students is a
difficult and essential task. Once the program or approach has been selected, however,
the task has only begun. To ensure a program is effective, the district must ensure it is
implemented with fidelity and that it yields the intended results.
Chapter 2 provided a review of the literature pertinent to teaching literacy,
including but not limited to the Balanced Literacy approach, as well as the role of student
reading motivation in developing reading competence.

61
This program evaluation sought to provide instructional, building, and district
leaders with an assessment of the impact the Balanced Literacy approach had on student
reading competence in the six years of implementation. These results will enable district
leaders to further evaluate how the program was implemented and identify components to
sustain and support, as well as components that need to be improved or removed. To
assess the impact the Balanced Literacy approach has had on student reading competence
and student reading motivation, the following questions were investigated to understand
the impact on students’ reactions, learning, reading behavior, and results:
1. What levels of in-class student reading time have English teachers provided
from Fall 2013 to Spring 2018?
2. To what degree are students motivated to read at home?
3. What are the reading competencies of elementary school students as assessed
by state standardized test data for Grades 3-5 from 2012-13 to 2017-18?
4. What degrees of sustained longitudinal growth in reading comprehension
were achieved by students who were introduced to the Balanced Literacy
approach in the district during first grade in the 2013-2014 school year and
have remained in the school district through sixth grade?
This study was a program evaluation of the outcomes of Balanced Literacy approach to
reading instruction. When production function research is applied to education, inputs
such as teacher qualifications, student-teacher ratios, and per pupil expenditure should
directly correlate with outcomes such as standardized test scores and graduation rates
(Hoy & Miskel, 2008). However, research has consistently failed to support this direct
correlation. Since quantitative inputs do not directly contribute to outcomes, it was

62
necessary to conduct more comprehensive evaluations to ensure the intended outcomes
are actualized. A comprehensive evaluation includes transformational criteria related to
the quantity, quality, and consistency of internal programs, such as student motivation
and fidelity of program implementation (Hoy & Miskel, 2008).
Too often education programs, teachers, and students are evaluated by one
outcome: a single standardized test score. All educators recognize the need for and
support measures of accountability, but using large-scale standardized tests for evaluation
provides a summative score with no guidance for improvement (Mielke & Frontier,
2012). Students, teachers, and administrators receive a “decontextualized judgment that
is handed down from an outside source on the basis of a small sample of their
performance” (Mielke & Frontier, 2012, p. 10). Given the state and federal
accountability for public schools, standardized test scores are an important part of an
instructional evaluation. However, given the limited scope and guidance of standardized
tests, it is equally important that other measures be included to ensure an instructional
evaluation provides sufficient analysis to make future improvements in classroom
programs and approaches (Lovitt & Fantasia, 1980). Provini (2011) states that any
evaluation plan should include multiple formal and informal data collection tools.
Multiple collection tools enable a comprehensive analysis of the transformational criteria.
Participants
Participants in this study represented students from one pre-kindergarten through
fourth-grade school and one fifth-grade school in the district implementing the Balanced
Literacy Approach. Teachers did not participate directly. The researcher collected
student SRQ data.

63
Teachers. Teachers did not overtly participate in this study. However, historical
teacher observation data were analyzed and teachers were the classroom implementers of
the Balanced Literacy Approach. Inherently, teacher characteristics and qualifications
directly impacted students’ classroom experiences and students directly participated in
the study. The total student population of the district fluctuated between 2,400 at the
maximum and 2,215 at the minimum enrollment during the 6-year period of data
collection. The district does not have more than one school building for any grade level,
so all enrolled students in the district matriculate through the same schools. The primary
elementary school has pre-Kindergarten through fourth grade. A second elementary
school has fifth grade. The two elementary schools had approximately 95 teachers with
two Title I reading coaches. Approximately 20% of the teachers were provisionally
licensed and 40% of the licensed teachers had master’s degrees. For kindergarten
through fourth grade, the classroom teacher taught all core subjects. Kindergarten
through fourth grade averaged 11 classroom teachers per grade level. In fifth grade, there
were three English teachers. The English curriculum includes reading and writing, which
is integrated in the Balanced Literacy approach. Classroom teacher observation data
were analyzed for Grades 1-4. English teacher observation data were analyzed for Grade
5.
Students. Each elementary grade level averages 175 students. The student
cohort that was surveyed and analyzed for longitudinal growth had a membership of 173
students in the first grade, which was when the students took the Phonological Awareness
Literacy Screening (PALS) test. Twenty-three students left the district and 33 students
transferred into the district between the end of first grade and the end of third grade. The

64
cohort had 188 students in third grade, which was the grade when Virginia students took
their first Reading SOL. Fifty-One of these students did not complete fifth grade in the
district. The student cohort had 159 students in fifth grade with 22 students who had
transferred into the district after third grade. There were 137 students from the original
third-grade testing group who stayed in the district through fifth grade. Eight of those
students transferred from the district after fifth grade. The total student cohort consisted
of 110 students, who had been enrolled in the district from first grade through fifth grade.
Students participated directly by taking a reading frequency and motivation
survey, the SRQ-Reading Motivation survey. The survey was not anonymous to enable
reading competence analysis. Parent consent was obtained prior to the survey being
administered.
Data Sources
One of the district’s short-range and mid-range goals was to build literacy skills
and fully implement Balanced Literacy, respectively. Both of these goals require student
reading. In-class student reading was measured by data collected during classroom
observations using the Indicators of Student Engagement Observation Protocol (See
Appendix A). One of the district’s short-range goals was to increase student motivation
to read. Student motivation to read was measured by the SRQ-RM. One of the district’s
mid-range goals and two of the long-range goals were measured by student reading
competence, specifically, achieving and sustaining a 75% SOL pass rate for reading.
Overall student achievement in reading was measured by Virginia SOL test results for
Grades 3-5 from the first year of full implementation in the 2012-2013 school year
through the 2017-2018 school year. To analyze the impact of the Balanced Literacy

65
approach on student motivation and its relationship to reading comprehension, the SRQ-
RM and longitudinal data for the student cohort that received Balanced Literacy
instruction from first grade through fifth grade was analyzed. The longitudinal data
consisted of summative assessment data, PALS test scores in grades one and two and
Virginia Reading Standard of Learning test scores in Grades 3-5.
Classroom observation data. Classroom observation data collected using the
Indicators of Student Engagement Observation Protocol were used to measure reading
frequency in the academic setting and student motivation to read. The observation
protocol was developed by the School-University Research Network (SURN) at The
College of William & Mary. SURN developed the observation protocol using John
Hattie’s meta-analysis research on student engagement and achievement. The
observation protocol consists of 12 Indicators for High, Active Student Engagement and 5
indicators of Lower-Yield Practices for Students. The observer marks whether the item is
Evident or Not Evident and lists specific examples or non-examples for the indicator.
Engages in reading is listed as a high student engagement indicator. Based on the SURN
Descriptions of Student Engagement Terms, student reading is “students are provided
daily time in reading connected with text they comprehend accurately: sustained silent
reading time; reading workshop, reciprocal teaching, etc.” (SURN at the College of
William & Mary).
The school district started using the observation protocol during the 2014-2015
school year as an informal walk-through. Walk-throughs using the observation protocol
were conducted by building level administrators and were entered in the TalentEd
database used by the district. Each walk-through using the observation protocol lasted at

66
least 15 minutes. After completing the walk-through, the observing administrator and the
observed teacher had to electronically sign the observation protocol in TalentEd.
TalentEd Solutions is a private company that provides online human resource
management tools specifically for educators. The district uses the Talent Ed database to
manage licensed personnel applications, annual academic goals, observations, and
evaluations. Each licensed teacher has a TalentEd account through which she or he
submits his or her annual goals and signs informal observations or walkthroughs, formal
observations, and evaluations. Each building administrator has access to all building
teachers’ TalentEd accounts to approve academic goals, submit walk-throughs, formal
observations, and evaluations.
Student survey. The Self-Regulation Questionnaire-Reading Motivation (SRQ-
RM) was used to measure reading frequency and student motivation to read. The SRQ-
RM originally consisted of 24 items that assessed academic reading and 24 items that
assessed recreational reading (DeNaeghel et al., 2012). Each item is answered on a
5-point Likert scale ranging from 1 (disagree a lot) to 5 (agree a lot). The mean and
standard deviation were computed, with 1 indicating low motivation and 5 indicating
high motivation. The SRQ-RM is a valid measurement of autonomous or intrinsic and
controlled or extrinsic reading motivation for late elementary students and is invariant
across boys and girls.
There is a different stem at the beginning of the questions for the recreational and
academic sections. The stems read I read in my free time because… and I read for school
because… respectively. After the stem, the items for the recreational and academic
sections are worded the same. Sample items include:

67
1. I really like it.
2. It’s fun to read.
3. I enjoy reading.
The SRQ-RM items of the survey are in Appendix B.
The original study demonstrated that the SRQ-RM is a reliable and valid tool to
measure late elementary school students’ reading motivation. Exploratory Factor
Analysis using scree-plot analysis and parallel analysis confirmed a two-factor structure
of autonomous reading motivation and controlled reading motivation. Once the factor
structure was confirmed, Confirmatory Factor Analysis was used to analyze the items for
recreational reading motivation and academic reading motivation. The original
questionnaire showed a modest fit for recreational and academic reading. The model was
adapted from 24 items to 17 items. The adapted model shows an acceptable fit for
recreational reading motivation (YB x2(116) = 310.71, p<.001, RMSEA=.05, with 90%
CI [.046, .059], SRMR=.06, CFI=.95) and academic reading motivation (YB x2(116) =
330.34, p<.001, RMSEA=.06, with 90% CI [.049, .061], SRMR=.07, CFI=.95).
Invariance testing found strong invariance enabling valid comparisons across genders
(DeNaeghel et al., 2012). The adapted model was used for this study (see Appendix B).
The original research validating the SRQ-RM used SPSS for all statistical
analysis. Based on descriptive statistics, recreational reading and academic reading had
similar effects. Students had higher autonomous motivation for both types of reading
(M=3.63, SD=0.99; M=3.60, SD=1.02) than controlled motivation (M=2.21, SD=0.67;
M=2.60, SD=0.77). In the academic setting, reading frequency, which was measured on
a 4-point Likert scale, was reported most of the time (M=2.83, SD=0.70). Reading

68
engagement, which was measured on a 5-point Likert scale from five items completed by
the teacher, indicated high levels of student attention, interest, and participation (M=4.72,
SD=1.41). Reading comprehension, which was measured by IRT scores from 0 to 100
taken from a standardized reading comprehension test, showed lower reading
performance levels (M=50.73, SD=5.72) (DeNaeghel et al., 2012).
Structural equation modeling was used to test the model relating recreational and
academic reading motivation with engagement, frequency, and comprehension. Based on
the standardized parameter estimates, the recreational autonomous motivation was
significantly related to reading frequency (p=.70, R2=.65), reading engagement (p=.12,
R2=.11), and reading comprehension (p=.14, R2 =.37). Recreational controlled
motivation was significantly negatively related to reading comprehension (p=-.19).
Academic autonomous motivation was not significantly related to reading engagement
nor reading comprehension. However, academic autonomous motivation was
significantly related to reading frequency (p=.64, R2=61). Academic controlled
motivation was not significant to reading engagement nor reading comprehension.
Academic controlled motivation was significantly related to reading frequency (p=.09).
Longitudinal summative assessment data. PALS and Reading SOL data were
used to measure reading competence and longitudinal growth in reading competence.
Virginia students do not take the Reading SOL test until Grade 3, so the PALS
assessment was used to measure reading competence in first and second grade. PALS is
a state screening tool that was developed to identify students reading below grade level so
they can receive early interventions. The PALS for first and second grade consists of
four levels: Entry Level, Level A, Level B, and Level C. The Entry Level is Word

69
Knowledge and is measured by Spelling Inventory, Word Recognition, and Letter Sounds
for first grade only. Level A is Oral Reading in Context and is measured by Accuracy,
Fluency, Oral Reading Rate, and Comprehension. Level A is timed in order to calculate
oral reading rate. Level B is Alphabetics and is measured by Alphabet Recognition,
Letter Sounds, and Concept of Word. Level C is Phonemic Awareness and is measured
by Blending and Sound-to-Letter (University of Virginia, 2003).
The district has been using the PALS assessment at the primary elementary school
since the 1999-2000 school year. In pre-kindergarten, students take the PALS Pre-K
assessment two times per year, at the beginning of the school year and at the end of the
school year. Kindergarten students take the PALS Pre-K assessment. First- and
second-grade students take the PALS 1-3 assessment. Kindergarten, first-, and
second-grade students take their corresponding PALS assessment three times per year: at
the beginning of the school year, in January, and at the end of the school year. The PALS
assessment results are used to identify students on grade level, below grade level, and
above grade level. The assessment item data are used to implement interventions for
students identified as below grade level.
Starting in third grade, students take the Virginia Reading SOL. Prior to the
2017-2018 school year, Virginia students took the traditional format Reading SOL. In
2017-2018, the students took the Computer Adaptive Test (CAT) Format. The two
different formats tested the same content but varied in the number of questions:
Traditional Grade 3 Reading SOL had 47 questions and the CAT Grade 3 Reading SOL
had 33 questions. In addition to the number of questions, there were two other critical
differences between the two different formats. Using the traditional format, all students

70
answered the same questions and the students were able to go back to review all of the
questions until they submitted the test. Using the CAT format, students may be asked
more or less difficult questions based on the accuracy of their answers on previous
questions so no two students take the exact same test. Also, on the CAT test, once a
student has submitted their answer to a question and moved on to the next question, the
student cannot go back to review.
The Grade 3 Reading SOL test reading standards from kindergarten through
Grade 3. SOL strands from the Grade 2 and Grade 3 curriculum framework are
specifically identified. SOL strands from kindergarten and Grade 1 are not specifically
identified because they are considered foundational skills for reading and are therefore
inherent in the Grade 2 and Grade 3 standards. The Grade 3 Reading SOL consisted of
three Reporting Categories: Use word analysis strategies and word reference materials,
Demonstrate comprehension of fictional texts, and Demonstrate comprehension of
nonfiction texts. The two comprehension categories had approximately twice as many
questions as the word analysis category (VDOE, 2010b).
The Grade 4 and Grade 5 Reading SOL Reporting Categories were the same as
the Grade 3 Reading SOL Reporting Categories with the same distribution of questions
(VDOE, 2010b, 2010c, 2010d). The VDOE reading curriculum spirals the reading skills
so as students move up in grade levels, they are expected to be able to do more with each
SOL strand. For example SOL 3.4 for third grade, SOL 4.4 for fourth grade, and SOL
5.4 for fifth grade outline the skills for word analysis and has the same SOL stem for all
three grade levels. However, the specific strand and the Essential Knowledge, Skills, and

71
Processes outlined in the Curriculum Framework include more content and become more
rigorous at each grade level as shown in Table 2.
Table 2
Grades 3-5 SOL Strand Details
SOL Stem: The student will expand vocabulary when reading.
Specific Grade Level SOL Strand Essential Skill referencing homophones
3.4 a. Use knowledge of homophones Use knowledge of homophones to understand
unfamiliar words
4.4 b. Use knowledge of roots,
affixes, synonyms, antonyms, and
homophones.
Derive word meaning by using their
knowledge of homophones
5.4 c. Use knowledge of roots,
affixes, synonyms, antonyms, and
homophones.
Use word references and context clues to
determine which meaning is appropriate in a
given situation
Note. The Essential Skills identified here are located in the Essential Knowledge, Skills,
and Processes column of the curriculum framework. The skills identified here are an
excerpt from the comprehensive list. Adapted from the English Standards of Learning
curriculum framework 2010 by Virginia Department of Education, 2010a.
The Virginia SOL tests scaled scores range from 0 to 600. There are four categories
based on scaled scores: Fail/Below Basic, Fail/Basic, Pass/Proficient (400-499), and
Pass/Advanced (500-600). Any scaled score below 400 is a failing score, but the two
Fail category cut scores are based on individual performance due to the CAT format.
Comprehensive reading assessment data. The Virginia Reading SOL Data for
Grades 3-5 in 2017-2018 were used to measure overall reading competence. All three
grade levels have had Balanced Literacy instruction since first grade. The use of three
different grade levels demonstrated the elementary reading students overall reading
competence.

72
Data Collection
Data collection took place during the 2018-2019 school year. There were three
independent sources of data, classroom observation data, standardized summative
assessment data, and student survey data (Appendix C). The district used the observation
protocol for informal observations. Observation protocol data for school year 2012-2013
through 2017-2018 were collected during November 2018. The number of times reading
was evident was collected by grade level for each school year. After identifying the
teachers who taught the identified grades and collecting those specific observations,
teacher names were redacted and the data collected were anonymous.
The longitudinal standardized summative assessment data were collected from
school year 2012-2013 through 2017-2018. The reading SOL data were collected for
grades three, four, and five for each school year during the given time period. In addition
to the reading SOL data, the PALS scores for the given student cohort was collected from
the first-grade year, 2013-2014, and the second-grade year 2014-2015.
The first step in administering the student survey was obtaining written parent
permission (Appendix D). Prior to the consent form being sent home, all of the identified
parents received a phone call explaining the purpose of the survey. The permission letter
was sent home with students in February 2019. The parents of students who did not
return the letter received one reminder phone call and a second permission letter was
mailed to the address on record. Two weeks after the letters were sent home, the survey
was given to all of the students for whom parental permission had been received. The
identified students reported to the library during their English class. The school librarian
administered the survey. The surveys were not anonymous in order to allow analysis of

73
the relationship between reading competence and reading motivation. All survey results
remained confidential.
Data Analysis
Data collected for this study were analyzed using quantitative research methods.
The SRQ-RM, teacher observation protocol data, Virginia Reading SOL scores, and
PALS assessment scores were used to provide descriptive statistics on student
motivation, reading frequency, reading competence achievement, and reading
competence growth. Additionally, a correlation between student motivation and Reading
SOL scores was run to determine if a relationship between autonomous motivation or
controlled motivation and student achievement exists. The student assessment scores and
survey results were input to Excel spreadsheets and then transferred to Statistical Package
for the Social Sciences (SPSS) for analysis.
The SRQ-RM results were independently analyzed using the reliability
coefficient. The 17 SRQ-RM items were analyzed for autonomous or intrinsic reading
motivation and 17 items were analyzed for controlled or extrinsic reading motivation.
The autonomous and controlled reading motivation items were interspersed to maintain
variation in statements and minimize repetition. Consistent items were summed to
provide a single score for each type of motivation. This single score for each motivation
was used in further analysis. Multiple regression was used to determine the correlation
between the criterion variable, student reading competence, and the predictor variable
reading motivation. Table 3 provides a summary of the data sources and method of data
analysis for the evaluation questions.

74
Table 3
Evaluation Questions and Data Analysis
Evaluation Question Data Sources Data Analysis
1. What levels of in-class
student reading time have
English teachers provided from
Fall 2013 to Spring 2018?
- Observation Protocol
- Descriptive Statistics
2. To what degree are students
motivated to read at home?
- SRQ-RM
- Descriptive Statistics
- Reliability Coefficient
- Correlation
3. What are the reading
competencies of elementary
school students as assessed by
state standardized test data for
Grades 3-5 from 2012-13 to
2017-18?
- Virginia Reading SOL
Scaled Scores
- Descriptive Statistics
- ANOVA
4. What degrees of sustained
longitudinal growth in reading
comprehension were achieved
by students who were
introduced to the Balanced
Literacy approach in the
district during first grade in the
2013-2014 school year and
have remained in the school
district through sixth grade?
- Virginia Reading SOL
Scaled Scores
- PALS scores
- SRQ-RM
- Descriptive Statistics
- Reliability Coefficient
- Correlation
- Multiple Regression
Note. PALS = Phonological Awareness Literacy Screening; SRQ-RM = Self-Regulation
Questionnaire – Reading Motivation
Delimitations, Limitations, Assumptions
Delimitations. Delimitations are boundaries set by the researcher to control the
scope of the study. Delimitations of this study include the researchers focus on the
student reading results rather than the administrator and teacher implementation of the
program. Also, to ensure students had consistent instruction using the Balanced Literacy
approach the researcher focused on one grade level, which was in first grade during the

75
first year of implementation, for longitudinal growth rather than all grade levels, which
received some level of Balanced Literacy instruction, in the last five years of
implementation. Another delimitation was the program theory used to frame the study.
The study used Self-Determination Theory as the lens through which student reading
competence is analyzed.
Limitations. There are several limitations to this study. Before any program or
intervention is put in place, baseline data should be obtained and monitored (Provini,
2011). There were no specific baseline or pre-assessment data collected; however, the
district had a decline in Reading SOL pass rates after new curriculum standards were
implemented in 2010. The reading SOL scores prior to implementation are available for
analysis, but they were not collected and analyzed by the district prior to implementing
the Balanced Literacy approach. In addition to the lack of SOL analysis prior to
implementation, the PALS test is given as a reading assessment in first and second grade,
but it is not an equivalent measure to the reading SOL. Consequently, measuring
longitudinal student growth from first to fifth grade requires standardizing of non-
equivalent measures of reading competence.
Despite the district identifying increased student reading motivation as a goal of
the new approach, there were no measures of student motivation prior to implementation.
Student motivation can be measured and compared to the average fifth-grade student, but
a growth analysis cannot be conducted. There is a similar limitation with reading
frequency. The district started using the SURN High Student Engagement form
(Appendix A) in 2012-2013, which was the year prior to implementation of the Balanced

76
Literacy Approach. Having only one year of walkthrough data to document reading
frequency in the classroom limits the reliability.
The researcher was an administrator in the school district studied. The researcher
was the middle school principal of the sixth-grade students who were surveyed. As an
administrator in the district, the researcher had used the classroom observation tool,
which was analyzed to determine classroom reading quantity. However, the researcher
was not an administrator at either of the district elementary schools and did not conduct
any of the observations from which the study data were collected. The researcher was
not an administrator at any of the schools or for any of the students during the school
years reading assessment data were collected and analyzed.
Assumptions. There is an assumption that the SURN walkthrough form was used
with fidelity by the elementary school administrators. There was also the assumption that
the students who completed the SRQ-RM accurately reported their reading habits and
motivation when completing the self-report survey.
Ethical Considerations
There were multiple ethical considerations addressed in the development of this
study given the use of student assessment data, administering student surveys, and the
collection of evaluative teacher observation data. Student data had to remain confidential
in handling, analysis, and reporting. Actual student surveys and student survey data had
to remain confidential. The researcher ensured this by maintaining secure possession of
the student surveys once they were completed and the data spreadsheet. The student
names were not recorded in the data analysis. Teacher performance was not a factor of
analysis in this study, but teacher observation protocols were analyzed to collect data an

77
academic student reading. Consequently, teacher anonymity was maintained by only
using grade level and years of experience as an identifier when reporting observation
data. The ethical considerations include adherence to guidelines established by the
College of William & Mary’s Institutional Review Board and adherence to program
evaluation standards.
Institutional Review Board. After a successful dissertation proposal defense,
the researcher applied to the College of William and Mary Educational Institutional
Review Board (IRB). After receiving permission from the IRB to conduct the study, the
researcher secured written permission from the district superintendent to administer a
student survey and granting the researcher access to student assessment data and teacher
observation data following evaluation standards of propriety. Parent permission was
received for all student participants. The student survey was written and was secured in
accordance with IRB and program evaluation standards.
Adherence to program evaluation standards. In addition to IRB standards and
district permission, the study was conducted in accordance with the Standards of
Program Evaluation (Yarbrough, Shulha, Hopson, & Caruthers, 2011). In adherence with
the utility standard, the researcher communicated with district leadership and the primary
elementary school principal to construct useful research questions that would benefit the
district, to develop the logic model, and to collect data. In adherence with the feasibility
standard, the researcher maintained transparent, appropriate, and timely data collection
measures. To minimize class disruptions, student surveys were conducted during non-
instructional time. In adherence to the propriety evaluation standard, the researcher
designed the study to maintain student confidentiality and to respect the performance of
78
students and teachers. In adherence to the accuracy standard, thorough research was
conducted to select the most valid and reliable measures of elementary reading
motivation and reading competence, as well as striving to ensure accuracy in reporting
results. Limitations, delimitations, and conclusions have been clearly reported to district
leaders to ensure accountability and accuracy.
Summary
This program evaluation allowed for a longitudinal study of the Balanced Literacy
approach to reading instruction that had been implemented in the district. This was a
quantitative study including student survey data measuring student reading motivation,
teacher observation data identifying the number of times student reading was observed,
Virginia Reading SOL data measuring reading competence, and PALS assessment data
measuring longitudinal growth in reading. Findings from this study will be used to
inform school administrators and district leaders in the outputs of the Balanced Literacy
approach to reading instruction after six years of implementation.

79
CHAPTER 4
FINDINGS
The purpose of this quantitative program evaluation was to investigate the
relationship the Balanced Literacy Approach to Reading has with student reading
competence and student motivation to read for elementary school students in a small rural
Virginia school district six years after implementation. Additionally, this study analyzed
the actual student reading time in elementary classrooms to determine if student reading
times were implemented with fidelity as outlined by the school district based on the
recommendations of the consultant for Balanced Literacy.
Chapter 3 provided a description of the methodology for the study including the
context of the district and the elementary school implementing the Balanced Literacy
approach, student participants, sources of data for the study, and the methods of data
analysis. Chapter 4 provides an overview of the results of the study and is organized by
data sources and evaluation question. Extant data and survey data for the study were
collected from February 10-28, 2019.
Summary Findings for Study
Evaluation Question 1: What levels of in-class student reading time have
English teachers provided from Fall 2013 to Spring 2018? The first evaluation
question was informed by data collected from the district’s database containing informal
walk-through observations conducted by building level administrators.
80
Teacher walk-through observations. Classroom walk-through observations in the
district were conducted using the Indicators of Student Engagement Observation
Protocol, which lists student reading as a high engagement strategy. The observation
protocol is a walk-through form building level administrators in this school district
access, complete, and share with the teacher using the TalentEd database. The Indicators
of Student Engagement Observation Protocol is provided in Appendix A. The model
lesson template the district implemented for teaching reading using the Balanced Literacy
approach allots 45 minutes of student reading for a 60-75-minute block of instruction,
which means students should be reading 60% to 75% of the time in reading class. Extant
walk-through observation data were collected from the TalentEd Database for the
academic school year 2014-2015 through the year 2017-2018 for 23 elementary reading
teachers for Grades 1-4. The amount of in-class reading time was determined by the
number of times student reading was observed during the recorded number of
observations.
Teacher walk-through observation data were collected and analyzed by running
descriptive statistics to determine the average number of times student reading was
evident in the district’s elementary reading classrooms during the regularly scheduled
school day between 8:30 a.m. and 3:00 p.m. The observation data were imported into
Statistical Package for the Social Sciences (SPSS), a data analysis program, to provide
descriptive statistics including the mean and standard deviation. The observation data for
each teacher by grade level are presented in Table 4.

81
Table 4
Observation Data by Grade Level Teacher
Grade Level
Teacher
First Year in the
District
Total
Observations
Student
Reading
Observed
%
1 Prior to 2014-15 12 3 25.0
1 2016-17 12 6 50.0
1 Prior to 2014-15 10 4 40.0
1 2014-15 11 2 18.2
1 Prior to 2014-15 14 6 42.9
1 Prior to 2014-15 10 5 50.0
2 Prior to 2014-15 19 13 68.4
2 Prior to 2014-15 21 12 57.1
2 Prior to 2014-15 20 9 45.0
2 Prior to 2014-15 19 6 31.6
2 2016-17 19 5 26.3
2 2015-16 31 9 29.0
2 2016-17 10 3 30.0
3 Prior to 2014-15 17 12 70.6
3 2016-17 15 4 26.7
3 Prior to 2014-15 19 14 73.7
3 Prior to 2014-15 17 12 70.6
3 Prior to 2014-15 6 3 50.0
4 2014-15 9 2 22.2
4 2014-15 21 14 66.7
4 Prior to 2014-15 14 8 57.1
4 Prior to 2014-15 10 5 50.0
4 Prior to 2014-15 8 6 75.0
TOTAL 344 163 47.4
There were 344 recorded walk-through observations for the 23 elementary
reading teachers from September 2013 through June 2018. No teacher was observed less
than five times or more than 15 times in a school year using the student engagement
walk-through protocol. During those walk-through observations, student reading was
evident in less than half of the observations (M=0.468, SD=0.115). The walkthrough

82
observations are typically 20 minutes and student reading is marked evident if it is
observed. The observation data do not indicate the duration of student reading time, but
the number of times student reading was seen during reading instruction. Consequently,
the recorded data do not directly correspond to the district expectation of reading time.
However, if student reading took 45 minutes out of 60-75 minutes of reading
instructional time, which is what the district outlined, student reading should have been
evident during more than 46.8% of the walk through observations. Given that no student
reading was observed during 53% of the observations, the teachers observed do not seem
to be implementing the recommended in-class student reading time with fidelity. The
walkthrough observation tool did not include, and this study did not analyze, other
specific literacy related activities, which may have been aligned with the Balanced
Literacy approach.
Evaluation Question 2: To what degree are students motivated to read at
home? The second evaluation question was informed by a motivation survey
administered to the student cohort.
Student survey. The Student Regulation Questionnaire-Reading Motivation
(SRQ-RM) survey (Appendix B) was given to the student cohort, who were enrolled in
the district in first grade during the 2013-14 school year and remained in the school
district through the 2018-19 school year. The SRQ-RM was administered to students
during the first 30 minutes of their assigned sixth-grade English class during the 2018-
2019 school year. Students reported to the school library to take the pencil-paper survey.
There were 110 sixth-grade students eligible to take the survey based on the criteria that
they had been continuously enrolled in the school district since first grade. All of the

83
students met with the researcher and were given a consent letter February 11, 2019.
Parents of students who had not returned the consent letter were called February 18,
2019. The survey was administered to members of the student cohort, who had returned
the active consent form by February 26, 2019. The school librarian administered the
survey. The researcher was not present. There was a 40.91% response rate, as 45
students returned the active consent form and completed the survey. All students who
returned the active consent form completed the survey. The cumulative survey scores for
academic intrinsic motivation, academic extrinsic motivation, free time intrinsic
motivation, free time extrinsic motivation, total academic motivation, total free time
motivation, total intrinsic motivation, total extrinsic motivation, and total motivation
were imported to SPSS for analysis.
The indicators for the second evaluation question were the 17 free-time
motivation to read questions on the SRQ-RM, Questions 1-17 with the “I read in my free
time because…” prefix. The student cohort took the SRQ-RM for free-time motivation
to read and academic motivation to read. The free-time motivation to read questions
began with the prefix “I read in my free time because…” and the academic motivation to
read section began with the prefix “I read for school because…” The survey measured
both motivational settings in two different sections using the same 17 questions. Each set
of motivation to read questions consisted of nine extrinsic motivation items and eight
intrinsic motivation items. The extrinsic and intrinsic motivation questions were
interspersed to minimize redundancy. The student cohort survey responses were
recorded and analyzed using descriptive statistics for each setting, each type of
motivation, and total motivation: free-time intrinsic, free-time extrinsic, free-time total

84
motivation to read, academic intrinsic, academic extrinsic, academic total motivation to
read, total intrinsic motivation, total extrinsic motivation, and total motivation to read.
Intrinsic and extrinsic motivation are defined in Chapter 2 and the settings as part of the
SRQ-RM are described in Chapter 3. The descriptive statistics for each category of
student motivation to read is presented in Table 5. Individual student motivation scores
are presented in Appendix C.
Table 5
Student Motivation to Read Mean Scores by Motivation Type
Motivation Type Maximum Score Mean
Academic Intrinsic 40 29.44
Academic Extrinsic 45 25.71
TOTAL Academic 85 55.15
Free Time Intrinsic 40 29.66
Free Time Extrinsic 45 24.49
TOTAL Free Time 85 54.15
TOTAL Intrinsic 80 59.10
TOTAL Extrinsic 90 50.20
TOTAL Motivation 170 109.29
In addition to descriptive statistics, correlations were run between free-time
intrinsic motivation and free-time extrinsic motivation; academic intrinsic motivation and
academic extrinsic motivation; academic intrinsic motivation and free-time intrinsic
motivation; academic extrinsic motivation and free-time extrinsic motivation; total
intrinsic motivation and total extrinsic motivation; and total academic motivation and
total free-time motivation. There is a substantial amount of research with consistent
findings supporting specific relationships between different types of motivation.
The correlations between the different types of motivation were tested for
statistical significance at the level of p < .01. All of the correlations that were found to be

85
statistically significant had a higher level of significance at p < .001. Four correlations
had a strong significant positive correlation. Total academic motivation to read
(M=52.58, SD=15.537) had a strong significant positive correlation with total free time
motivation to read (M=51.63, SD=15.842) (r=.926, p<.000). Academic intrinsic
motivation to read (M=29.44, SD=6.596) was also found to have a strong positive
significant correlation with free time intrinsic motivation to read (M=29.66, SD=6.647)
(r=.841, p<.000). Academic extrinsic motivation to read (M=25.71, SD=6.623) had a
strong positive significant correlation with free time extrinsic motivation to read
(M=24.49, SD=8.053) (r=.723, p<.000). Total intrinsic motivation to read (M=56.35,
SD=17.673) had a strong positive correlation with total extrinsic motivation to read
(M=47.86, SD=17.069) (r=.571, p<.000).
Two correlations were found not to be significant. Free time intrinsic motivation
to read (M=29.66, SD=6.647) was found to not be significantly correlated with free time
extrinsic motivation to read (M=24.49, SD=8.053) (r=.137, p=.392). Academic intrinsic
motivation to read (M=29.44, SD=6.596) was found to not be significantly correlated
with academic extrinsic motivation to read (M=25.71, SD=6.623) (r=.242, p=.128).
Table 6 shows the correlations between the two different types, extrinsic and intrinsic, of
motivation with location, free-time and academic.

86
Table 6
Correlations by Motivation Type
Motivation Type Motivation Type r value
Free-Time Intrinsic
(M=29.66; SD=6.647)
Free-Time Extrinsic
(M=24.49; SD=8.053)
.137
Academic Intrinsic
(M=29.44; SD=6.596)
Academic Extrinsic
(M=25.71; SD=6.623)
.242
Academic Intrinsic
(M=29.44; SD=6.596)
Free-Time Intrinsic
(M=29.66; SD=6.647)
.841
Academic Extrinsic
(M=25.71; SD=6.623)
Free-Time Extrinsic
(M=24.49; SD=8.053)
.723
Total Intrinsic
(M=56.35; SD=17.673)
Total Extrinsic
(M=47.86; SD=17.069
.571
Total Academic
(M=52.58; SD=15.537)
Total Free-Time
(M=51.63; SD=15.842)
.926
The correlations of the different types of reading motivation measured using the SRQ-
RM were not consistent with research findings that extrinsic motivation undermines
intrinsic motivation and that academic motivation to read does not correlate with free-
time motivation to read, which indicates a need for further research on the student
motivation to read for this student cohort.
Longitudinal summative assessments. Evaluation Questions 3 and 4 required
analysis of summative reading assessments to determine the impact of the Balanced
Literacy approach on the reading competence of elementary students in the district.
Evaluation Question 3 was answered by analyzing the reading Standards of Learning
(SOL) scores of Grades 3-5 for all students in the district during the six years of
implementation and Evaluation Question 4 was answered by analyzing the PALS and
reading SOL scores for the student cohort, who received the Balanced Literacy approach

87
to reading instruction for Grades 15. For Evaluation Question 3, elementary student
reading competence was measured using VDOE Reading Standards of Learning End of
Year State Test scaled scores for Grades 3, 4, and 5 from the 2012-13 school year
through the 2017-18 school year. The scores were analyzed using descriptive statistics,
correlation, and a one-way ANOVA to determine the effect of the year of Balanced
Literacy implementation.
Evaluation Question 3: What are the reading competencies of elementary
school students as assessed by state standardized test data for Grades 3-5 from
2012-13 to 2017-18? The third evaluation question was informed by Reading SOL
scores. Individual student scores for Grades 3, 4, and 5 for each school year from 2012-
13 to 2017-18 are presented in Appendix E. The mean Reading SOL scores by year and
grade are presented in Table 7.
Table 7
Mean Reading SOL Scores by Grade and School Year
Year
Grade 3
Mean SD Grade 4
Mean SD Grade 5
Mean SD
2013 404.69 68.400 407.47 68.067 397.16 64.999
2014 410.94 64.140 406.11 66.107 393.35 63.386
2015 402.10 80.419 411.70 61.948 396.12 65.432
2016 399.85 71.143 395.97 68.072 413.91 71.346
2017 384.69 75.952 404.87 75.825 404.33 72.362
2018 386.79 79.483 408.14 64.772 401.16 73.782
A one way ANOVA was run for Grades 3-5 Reading SOL test scaled scores from year
2013, the first year of Balanced Literacy implementation, to year 2018, the sixth year of
Balanced Literacy implementation. Results were mixed, as some grade levels showed
increased performance then decreased performance by academic year and some student

88
groups showed increased performance and others showed decreased performance over
the three years. A one-way ANOVA revealed a significant main effect for Grade 3 in the
second year of implementation, F(1,5) = 3.718, p = .002. Tukey’s HSD post hoc test
(p<.05) revealed a significant difference between the second and fifth year of
implementation, as well as the second and sixth year of implementation. The Tukey’s
HSD Post Hoc analysis of Grade 3, Year 2 of implementation are presented in Table 8.
Table 8
Tukey’s HSD post hoc test analysis of Grade 3 Reading SOL Scores and Year of
Implementation
Reference Year for
comparison
Year Mean
Difference
Std. Error Sig
Year 2 1 6.245 7.783 .967
3 8.834 7.763 .865
4 11.084 7.763 .710
5 26.248 7.432 .006
6 24.151 8.055 .003
Note. HSD = Honestly Significant Difference; SOL = Standards of Learning
The significant difference for Grade 3 was a decrease in student reading competence
from the second year of implementation to the fifth and sixth years of implementation.
A one-way ANOVA revealed no significant main effect for Grade 4 in year of
implementation, F(1,5) = 1.107, p =.355. Tukey’s HSD post hoc test (p<.05) revealed no
significant difference between any years of implementation. A one-way ANOVA in
Grade 5 in year of implementation was not significant, F(1,5) = 2.052, p = .069. Tukey’s
HSD post hoc test (p<.05) revealed a significant difference between the second and
fourth year of implementation, second and fifth year of implementation, as well as the
second and sixth year of implementation. For Grade 5, there was a significant difference
between the second year of implementation (2014) and fourth year of implementation
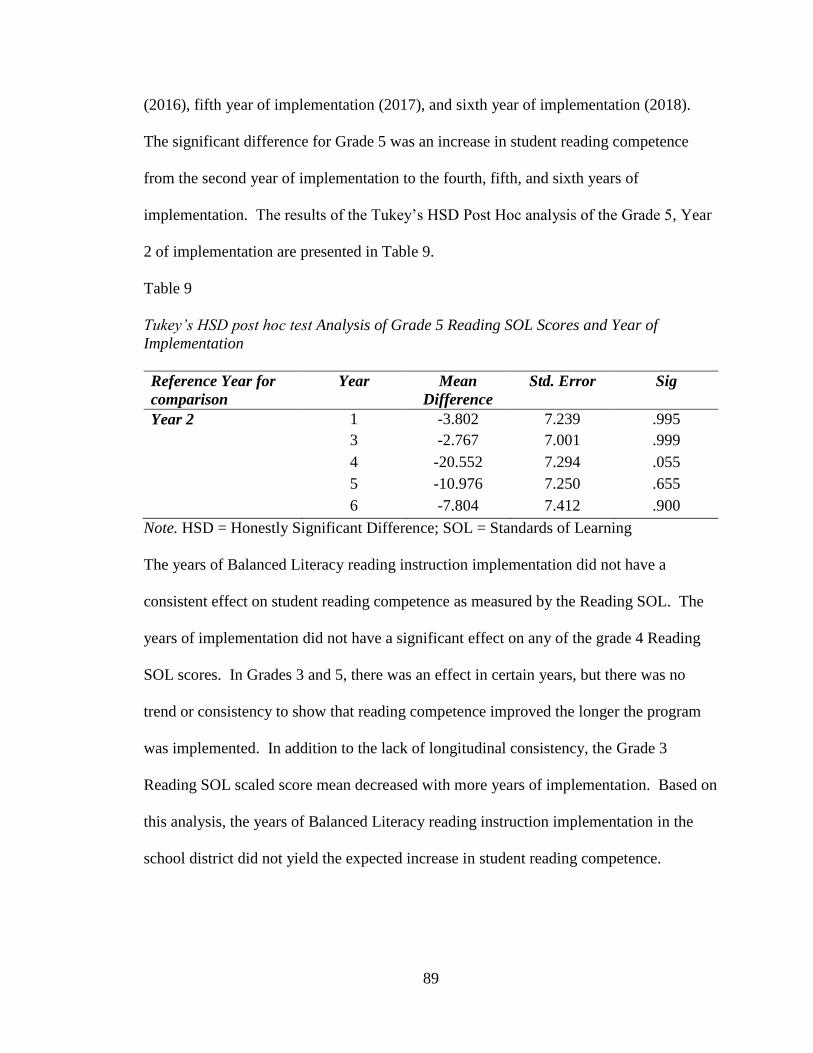
89
(2016), fifth year of implementation (2017), and sixth year of implementation (2018).
The significant difference for Grade 5 was an increase in student reading competence
from the second year of implementation to the fourth, fifth, and sixth years of
implementation. The results of the Tukey’s HSD Post Hoc analysis of the Grade 5, Year
2 of implementation are presented in Table 9.
Table 9
Tukey’s HSD post hoc test Analysis of Grade 5 Reading SOL Scores and Year of
Implementation
Reference Year for
comparison
Year Mean
Difference
Std. Error Sig
Year 2 1 -3.802 7.239 .995
3 -2.767 7.001 .999
4 -20.552 7.294 .055
5 -10.976 7.250 .655
6 -7.804 7.412 .900
Note. HSD = Honestly Significant Difference; SOL = Standards of Learning
The years of Balanced Literacy reading instruction implementation did not have a
consistent effect on student reading competence as measured by the Reading SOL. The
years of implementation did not have a significant effect on any of the grade 4 Reading
SOL scores. In Grades 3 and 5, there was an effect in certain years, but there was no
trend or consistency to show that reading competence improved the longer the program
was implemented. In addition to the lack of longitudinal consistency, the Grade 3
Reading SOL scaled score mean decreased with more years of implementation. Based on
this analysis, the years of Balanced Literacy reading instruction implementation in the
school district did not yield the expected increase in student reading competence.

90
Evaluation Question 4: What degrees of sustained longitudinal growth in
reading comprehension were achieved by students who were introduced to the
Balanced Literacy approach in the district during first grade in the 2013-2014
school year and have remained in the school district through sixth grade? The
fourth evaluation question was informed by survey data, The Phonological Awareness
Literacy Screening (PALS) data, and Reading SOL score data from the student cohort,
who received Balanced Literacy reading instruction from Grades 1-5, to analyze the
relationship between motivation to read and reading competence. The PALS assessment
is given to first- and second-grade students in the district to assess reading competency.
Beginning in third grade, students take an end of year grade level Virginia SOL Reading
Test, which is required by the VDOE for Grades 3-8 and in Grade 11.
The SRQ-RM scores, the student cohort’s PALS test scores from first and second
grade, and the student cohort’s Reading SOL scaled scores from third, fourth, and fifth
grade were analyzed using ordinal regression. Descriptive statistics were run on the
student cohort test data to determine if student reading competence had increased,
decreased, or remained stagnant as students progressed from Grade 1-5 using the
Balanced Literacy approach to reading in all five grades. An overview of the student
cohort’s standardized assessment scores is presented in Table 10.

91
Table 10
Student Cohort Mean PALS Scores and Reading SOL Scores
Year – Test Cut Score Mean SD
Fall 2013 – 1st Gr PALS 41 64.47 10.332
Spring 2014 – 1st Gr PALS 35 50.74 12.736
Fall 2014 – 2nd Gr PALS 35 49.28 13.261
Spring 2015 – 2nd Gr PALS 54 63.62 11.379
Spring 2016 – 3rd Gr Reading SOL 400 399.85 71.143
Spring 2017 – 4th Gr Reading SOL 400 404.87 75.825
Spring 2018 – 5th Gr Reading SOL 400 401.16 73.782
Note. PALS = Phonological Awareness Literacy Screening; SOL = Standards of
Learning
Summative reading assessment data were analyzed to determine the longitudinal
growth of reading competence in the student cohort. The district elementary school uses
the Grade 1 and 2 PALS test scores to identify students for intervention and remediation.
Given the district elementary school’s aforementioned use of the scores and the lack of
scoring alignment between the PALS test and the reading SOL test, an ordinal regression
was run on the two different types of test scores to determine if student reading
competence in Grades 1 and 2 as measured by the PALS test could be used to predict
student reading competence in Grades 3-5 as measured by the Reading SOL scores. The
district uses the PALS test to measure reading competence in Grades 1 and 2 and to
identify students who are not demonstrating grade level reading competence. The district
and the state use Reading SOL scores to identify students as proficient or below
proficient in Grades 3-5. If the district uses both assessments to measure student reading
competence, students scoring at or above grade level on PALS tests in Grades 1-2 should,
with adequate reading instruction, continue to score proficient on the reading SOL tests in
Grades 3-5. However, the relationship between the PALS test scores and the Reading
SOL test scores for the student cohort in this study was not significant,

92
χ2(8, N=120) =13.029, p=0.111. Given this analysis, the PALS test scores are not an
accurate predictor of Reading SOL test scores for the district.
Descriptive statistics were run on the SRQ-RM scores for the different types of
reading motivation to provide a measure of motivation after five years of Balanced
Literacy instruction in reading. The descriptive statistics for motivation are presented in
Table 6. Correlations were run on the student cohort test scores and the SRQ-RM scores
for the different types of reading motivation to determine if there was any significant
relationship between student motivation to read and student reading competence.
Given the framework of Self-Determination Theory and the conflicting research
on the relationship between reading motivation and reading competence (Becker et al.,
2010; De Naeghel et al., 2012; Taboada, et al., 2010), the ordinal regression was run on
the SRQ-RM scores and the Reading SOL scores to determine if reading competence
could be used to predict student motivation to read. The results demonstrate a strong
significant negative correlation between 2018 Reading SOL scores and total extrinsic
motivation to read (r=-.418, p=.007), which means that students who scored higher on the
2018 Reading SOL had lower extrinsic motivation to read. The analysis also revealed a
significant negative correlation between 2018 Reading SOL scores and total motivation
to read (r=-.312, p=.05), which means that students who scored higher on the 2018
Reading SOL also had lower total motivation to read. The relationship between 2018
Reading SOL scores and total intrinsic motivation to read was found to be not significant.
An ordinal regression was completed to determine model fit between PALS
scores, total motivation to read, and Reading SOL scores. The ordinal regression
between PALS scores and total motivation was not significant (ᵡ2(9) = 7.187, p=.618).

93
The ordinal regression between PALS scores and Reading SOL scores was not significant
(ᵡ2(8) = 13.029, p=.111). The results of the ordinal regression indicate that there is not a
predictive relationship between PALS scores and total motivation to read nor is there a
predictive relationship between PALS scores and Reading SOL scores for the district.
Summary of Findings
Chapter 4 provided a detailed breakdown of multiple data sources, including
classroom observation data, student survey data, Reading SOL scores, and PALS scores.
These data sources were used to inform the four evaluation questions. Chapter 5 will
discuss these findings, including the implications of the findings, the relationship of the
findings to the existing research, and recommendations for practice.

94
CHAPTER 5
RECOMMENDATIONS
Reading is fundamental to all academic learning (Becker et al., 2010; Bitter et al.,
2009; Schiefele & Schaffner, 2016). In first through third grade, students are typically
learning to read. After third grade, they are using those reading skills in order to read to
learn. The foundational role of reading competence in learning makes the effectiveness
of literacy programs and instruction in grades one through three crucial to a school’s
success. Students who do not read well by third grade typically have not improved by
sixth grade (Taboada, et al., 2010). In addition to their lack of reading competence, their
motivation to read has decreased due to the frustration and negative experiences
(McKenna et al., 1995). Given the correlation between motivation and reading
competence, school leadership must consider the needs of their student population and
select an approach to literacy instruction that will develop fundamental reading skills,
increase students’ motivation to read, and give the students opportunities to be successful
readers.
Discussion of Findings
The district in this study selected the Balanced Literacy approach to reading
instruction to increase student reading time in the classrooms, increase student motivation
to read, and improve overall reading competence. The quantitative indicators analyzed in
this study do not provide evidence that those goals have been actualized.

95
In class student reading time. According to the lesson plan format adopted by
the district students were supposed to be reading a minimum of 60% of reading
instructional time. Based on the walkthrough observations, student reading was evident
during less than 50% of the recorded observations. On average, reading teachers are not
allotting the recommended student reading time. Given the individual teacher data there
is considerable variance between teachers in the same grade levels and across grade
levels. One possible explanation for the lack of fidelity in implementation may be the
lack of consistent and continuous professional development on the Balanced Literacy
approach. Teachers, who have joined the district since 2016, have not received any
formal professional development on Balanced Literacy. Based on the data as presented
in Table 4, the professional development prior to implementation during the 2013-14
school year appears to have the most impact on implementation. During observations of
reading teachers, who received the training in 2013-14, student reading was observed in
an average of 53.8% of the observations. While observations of reading teachers, who
began working in the district during the 2014-15 school year or after, recorded student
reading during an average of 33.64% of the observations. If the district intends to
continue with Balanced Literacy Reading Instruction, all reading teachers need
foundational professional development on the components and expectations. In addition
to the foundational training, the teachers need more consistent observations with
constructive feedback on Balanced Literacy implementation.
In addition to the lack of data on actual student reading time, the quality of
student reading may also be a contributing factor to the lack of growth in student reading
competence. Student reading is a key component of the Balanced Literacy approach.

96
Metsala et al. (1997) found that authentic student reading was highly effective in
elementary reading classrooms. However, in their study of fifth-grade students, De
Naeghel et al. (2012) found that reading amount did not predict reading comprehension
when all other factors were controlled. Wang and Guthrie (2004) also found that reading
amount did not predict reading comprehension when reading motivation was controlled.
Despite the apparent contradiction in the aforementioned studies of student reading
having an effect in Metsala et al.’s (1997) study and not having an effect in the latter two
studies, the results may not be entirely inconsistent. Metsala et al. (1997) specifically
focused on authentic or engaged student reading whereas De Naeghel et al. (2012) and
Wang and Guthrie (2004) simply recorded reading amount. The quality of student
reading may be a factor in the disparate results of this Balanced Literacy program
evaluation. The observation protocol data used to inform student reading time included
any independent student reading regardless of engagement and only indicated if student
reading was observed without giving the actual length of reading time. Given the results
of the aforementioned studies, the district should only record the actual length of time
students participate in engaged or authentic reading to measure student reading time. In
addition to engaged reading, the observation protocol should be amended to include other
literacy activities which are aligned to the Balanced Literacy approach. In order to make
that transition, the district would need to provide professional development on engaged
student reading to the reading teachers, amend the observation protocol to included
engaged reading and literacy activities, and provide professional development on
engaged student reading indicators to administrators using the protocol.

97
Based on the research and the lack of growth in student reading competence
shown by the data for Evaluation Question 3 and Evaluation Question 4, the lack of
authentic student reading observed in the elementary classrooms may be a contributing
factor, as well as student motivation to read, which was analyzed in Evaluation Question
2.
Student motivation to read. There were 110 students who had been enrolled in
the district from first grade through sixth grade and were eligible to take the Self-
Regulation Questionnaire-Reading Motivation (SRQ-RM) survey. Forty-five students
returned the consent forms, which was a 40.91% response rate. The need to obtain active
consent prior to administering the survey creates an inherent bias in the results. Survey
respondents and non-respondents differ in attitudes and beliefs (Porter, 2004). In this
study, the survey was administered within the students’ home school, the consent letter
was given to the students by the building level principal who was the researcher in this
study, and the students returned the letter to their homeroom teacher. Given the academic
environment and involvement of the student’s school faculty, more academically
motivated students may have been more likely to return the consent form, so the survey
results may indicate a higher level of student motivation to read than would be expected
if there were a 100% response rate. This bias may account for some of the
inconsistencies between the student cohort’s SRQ-RM results and research findings.
McKenna et al. (1995) found that students who had difficulty reading experienced a
decline in free-time motivation and that all students experienced a decline in academic
motivation as they progress from early grade levels in elementary school to higher grade
levels in elementary school and high school. Otis et al. (2005) found that extrinsic and

98
intrinsic motivation decreased as students moved to higher grades. Unrau and
Schlackman (2006) stated that extrinsic motivation may not undermine intrinsic
motivation to read depending on what the external motivators are.
De Naeghel et al. (2012) found that students who are intrinsically motivated to
read spend more time reading in their free time. The student cohort SRQ-RM results
showed a strong positive correlation between total academic motivation to read, academic
intrinsic motivation to read, academic extrinsic motivation to read and total free-time
motivation to read, free-time intrinsic motivation to read, free-time extrinsic motivation
to read respectively. The actual amount of free-time reading was not measured, but the
correlation between academic and free time motivation to read was consistent with the
research. This study confirmed earlier findings that students who were motivated to read
in the academic setting were also motivated to read in their free time. The positive
significant correlations between all types of academic motivation and all types of free-
time motivation to read may be attributed to the aforementioned inherent bias of active
consent. If the students who returned the consent form were more competent readers, it
is consistent with self-determination theory that they would be more motivated to read.
Competent readers feel successful reading and want to read more.
Consistently in research studies, intrinsic motivation is not positively correlated
with extrinsic motivation and extrinsic motivation is negatively correlated with academic
achievement over time (Guthrie & Wigfield, 2000; Schiefele & Schaffner, 2016). The
results of this study were not consistent with the existing research studies. The student
cohort’s SRQ-RM results indicated a positive significant correlation between total
intrinsic motivation to read and total extrinsic motivation to read, which means that

99
students who have an internal desire to read for the enjoyment of reading, are also
motivated by external rewards to read. External rewards may include grades, praise,
computer or TV time, gifts, and so forth. This may also be due to the inherent bias of
active consent because this is inconsistent with the majority of research studies, which
state that extrinsic motivation undermines intrinsic motivation. The students who turned
in their forms may be more motivated students in general, which would mean they have
higher academic achievement resulting in higher intrinsic motivation and they want to
please their teachers indicating higher extrinsic motivation as well.
However, Unrau and Schlackman (2006) argued that extrinsic motivation only
undermines academic achievement and intrinsic motivation if external motivators are the
only motivators present. If the students were extrinsically motivated, but also motivated
by other intrinsic motivators, the positive correlation is consistent with this theory.
However, in this study, the positive correlation between intrinsic and extrinsic motivation
is not significant when the two types of motivation are analyzed by reading environment,
free time and academic. This may be due to the difference of external motivators or
rewards in the academic and the free-time environments. It may also be due to the
opportunity for student choice of reading materials in the free-time environment, which
may be lacking in the academic environment. These two factors may not have impacted
comparisons between overall extrinsic and intrinsic motivation or overall academic and
free-time motivation, but when the types of motivation were analyzed by environment the
SRQ-RM questions were categorized more specifically.
When intrinsic and extrinsic motivation were analyzed by type, free time and
academic, they were not significantly correlated. Free-time intrinsic motivation was not

100
significantly correlated with free time extrinsic motivation and academic intrinsic
motivation was not significantly correlated with academic extrinsic motivation. Students
intrinsically motivated to read in their free time or academically were not extrinsically
motivated to read in their free time or academically. When the survey data were analyzed
by more specific, smaller categories the results were consistent with the research stating
that students who are intrinsically motivated are not typically motivated by external
rewards.
The student cohort’s mean score for total intrinsic motivation was only 70% of
the possible total points and the mean score for total extrinsic motivation was only 53%
of the possible total points. Both categories had a standard deviation of approximately
17. Based on the mean scores, students in the cohort are less motivated by rewards than
internal satisfaction, so the student choice and opportunities for student reading through
the Balanced Literacy approach are more aligned to the student motivation than grades or
teacher incentives. However, the large standard deviation undermines the idea of an
average motivation for this cohort. Based on the standard deviation, some of the students
are highly motivated and some students are not motivated at all. Given the disparity in
student motivation to read and the fact that all of the students in the cohort had been
exposed to the same reading instruction since first grade, one possible explanation is that
the Balanced Literacy approach did not impact student motivation to read. Since there
were no baseline data collected at the onset of the Balanced Literacy approach
implementation, a definitive correlation or causal relationship cannot be determined.
It is not possible in this study to determine an increase or decrease in student
motivation to read because baseline data were never collected by the district. Research

101
has consistently indicated a decrease in intrinsic motivation as students progress to higher
grades (Eccles et al., 1996; A. E. Gottfried et al., 2001; Harter, 1981; Lepper et al., 2005;
Otis et al., 2005). Based on the overwhelmingly consistent findings of motivation
research and given that there were no baseline data for comparison and the SRQ-RM was
administered to the student cohort in Grade 6, there is an assumed decrease in motivation,
but given the mean and standard deviation of scores there may have been no significant
change for individual students.
Reading competence. Reading competence was measured by standardized test
scores. The third-, fourth-, and fifth-grade Virginia Reading SOL scores were used to
determine whether reading competence had increased from the 2012-13 school year to
the 2017-18 school year in response to Evaluation Question 3. There was no significant
increase in reading competence from 2012-13 to 2017-18 for students in Grades 3-5 as
measured by the Virginia Reading SOL test scaled scores. The mean Virginia Grade 3
Reading SOL scaled score actually decreased from the second year of implementation to
the sixth year of implementation. The mean Virginia Grade 5 Reading SOL scaled score
actually increased from the second year of implementation to the sixth year of
implementation. The lack of consistent reading competence growth in Grades 3-5 and
from Year 1 to Year 6 of implementation may have numerous contributing factors:
faculty turnover, lack of implementation fidelity, inconsistent professional development,
and comparing different student groups, for example comparing Grade 3 SOL scores
during each year of implementation even though there is a different student group taking
the Grade 3 Reading SOL each year. The difference in grade levels over the 6-year
period of implementation indicates there is a lack of fidelity in implementation as well as

102
inconsistencies between teachers, which may be a result of faculty turnover or
inconsistent professional development. In addition, the disparate achievement levels in
different years with different student groups may indicate that the Balanced Literacy
approach is not effective for all students in this district.
PALS assessment data from Grades 1 and 2 and Grades 3-5 Reading SOL scores
were used to determine whether reading competence had increased for the student cohort
in response to Evaluation Question 4. Two different assessments were used because the
mandated VDOE Reading SOL is not administered until third grade so the district uses
PALS as a summative reading assessment for Grades 1 and 2. The student cohort for this
study was reading on grade level in first and second grade as measured by the mean
PALS score, which was over 10 points higher than the Virginia PALS grade level cut
score each spring (see Table 5). However, the student cohort did not pass the Grade 3
Reading SOL and barely passed the Grades 4 and 5 Reading SOLs, as measured by the
mean. The PALS assessment was designed to determine the Lexile reading level of
students. The Virginia Reading SOL was designed to assess reading competence rather
than level, so there is not a direct comparison between the two assessments. Without a
comparison between the two different assessments, there was no significant increase in
reading competence from Grade 3 (with a mean score of 399.85) to Grade 5 (with a mean
score of 401.16), as measured by the Virginia Reading SOL. The standard deviations for
all three years of SOL scores were large (71.143, 75.825, and 73.782, respectively),
which indicates a disparity of scores. Students in the cohort either passed with scores
much higher than the mean or failed with much lower scores. The lack of growth in the
mean score indicates that the Balanced Literacy approach did not increase student reading

103
competence from Grade 3 to Grade 5. The disparity of scores supports that conclusion
and further highlights the inability of the approach to close the achievement gap between
the students who began as successful readers and those who struggled.
The mean Reading SOL score for each grade level is within two points of the
passing score of 400 and many of the students are scoring considerably lower given the
standard deviation. This indicates that a considerable number of the elementary students
in this study are not successfully learning to read and are not having positive reading
experiences prior to entering sixth grade. Research consistently reinforces the need for
positive and successful reading experiences in grades one through four. McKenna et al.
(1995) and Taboada et al. (2009) found that negative reading experiences in early
elementary school undermine intrinsic motivation and perpetuate poor reading. Self-
Determination Theory reinforces the relationship between achievement and motivation
stating that feelings of competence and self-efficacy are components of intrinsic
motivation and fulfil the need for personal growth (Unrau & Schlackman, 2006). The
lack of growth in reading competence of the students in this study from Grades 3-5 and
the large standard deviation indicate that students who started out at a reading deficit are
not growing and are not experiencing success in reading, which has decreased student
motivation to read by the sixth grade when the student cohort took the SRQ-RM. The
relationship between reading competence and student motivation for the student cohort is
discussed in the next section.
Student motivation to read and reading competence. Students who scored
higher on the 2018 Reading SOL had lower total extrinsic reading motivation, which is
consistent with existing research (Becker et al., 2010; Schiefele & Schaffner, 2016).

104
However, students who scored higher on the 2018 Reading SOL also had lower total
motivation to read, which was not an expected result based on the existing research. The
relationship between the Reading SOL score and total intrinsic motivation was not
significant. Based on the correlations between the student survey data and the 2018
Reading SOL scores, student motivation to read is not a contributing factor in the reading
competence of the student cohort.
All students who took the SRQ-RM had to return a signed parent permission
letter. Less than 50% of the student cohort returned the permission letter. The
requirement to obtain active consent introduces inherent bias in the survey results.
Students who returned the forms may be higher performing or more academically
motivated. If high achieving students were overrepresented in the surveyed group, the
survey results may not accurately reflect the motivation of the student cohort and may not
be consistent with research obtained from more diverse populations. A 100% survey
response rate would more accurately reflect the motivation of all levels of academic
achievers in the student cohort.
Implications for Policy and Practice
The data analyzed in this program evaluation revealed that the outlined goals of
the Balanced Literacy approach have not been met. The research identified potential
deficits in implementation, which indicate the Balanced Literacy approach has not been
implemented with fidelity making it difficult to determine the actual outcomes. There
were limited baseline data or analysis on reading competence and need prior to
implementing the Balanced Literacy approach in the district reading classes. There was
also a lack of consistent, ongoing professional development for all reading teachers or

105
reinforcement of the expectations for instruction within the classroom. Lastly, this is the
first evaluation of the reading instruction since the implementation of the Balanced
Literacy approach, which has been over six years. The findings and recommendations of
the program evaluation are presented in Table 11.

106
Table 11
Research Question Findings and Recommendations
Research Question Findings Recommendations
1. What levels of in-class
student reading time have
English teachers provided
from Fall 2013 to Spring
2018?
Teachers have not provided the
recommended levels of in-class
student reading time.
Reevaluate existing expectations
and set expectations for student
reading time at each grade level
to increase student reading time
and develop consistency between
grade level teachers so the
approach will be implemented
with fidelity.
2. To what degree are
students motivated to read at
home?
Intrinsic motivation for reading at
home and reading at school are
positively related.
Reevaluate the assessment and
system used to identify students
for intervention programs and
remediation opportunities to
ensure struggling readers are
identified in early elementary
school when they are still
learning to read so their lack of
success will not undermine their
intrinsic motivation.
Extrinsic motivation for reading at
home and reading at school are
positively related.
Intrinsic and extrinsic motivation for
reading at home and school are
positively related.
Motivation to read at home and
motivation to read at school are
positively related.
Overall student motivation to read at
home was low on the 85-point scale
with high variability.
Give students choice by
completing the classroom
libraries with reading material to
increase interest and motivation.
3. What are the reading
competencies of elementary
school students as assessed
by state standardized test
data for Grades 3-5 from
2012-13 to 2017-18?
There was a significant decrease in
reading competence in Grade 3 from
the second year to the fifth and sixth
years of implementation.
Further research into the past and
current implementation of the
Balanced Literacy approach and
other reading programs, with
specific emphasis on the needs
of the district’s student
population.
There was no significant increase or
decrease in reading competence in
Grades 4 during the years of
implementation.
There was a significant increase in
reading competence in Grade 5 from
the second year to the fifth and sixth
years of implementation.
4. What degrees of
sustained longitudinal
growth in reading
comprehension were
achieved by students who
were introduced to the
Balanced Literacy approach
in the district during first
grade in the 2013-2014
school year and have
remained in the school
district through sixth grade?
As total extrinsic motivation
increases, Reading SOL scores
decrease.
Based on the data, decreasing
total extrinsic motivation, which
will also decrease total
motivation, will increase
Reading SOL scores. Total
intrinsic motivation has no effect
on SOL scores.
As total motivation increases,
Reading SOL scores decrease.
There is no relationship between total
intrinsic motivation to read and
Reading SOL scores.
PALS scores are not a predictor of
Reading SOL scores.
PALS scores should not be used
to predict SOL scores or student
motivation to read. PALS scores are not a predictor of
total motivation to read.
Note. SOL = Standards of Learning; PALS = Phonological Awareness Screening

107
Increase student reading time. The findings of this study indicate that students
are not reading during 60% of the reading instruction time in any of the reading classes.
The district should revisit the prescribed reading time to ensure the existing reading
instruction format is most effective for building reading competence for the district’s
student population and that the lesson plan template includes other literacy activities
aligned to the Balanced Literacy approach. In addition to the lack of reading time,
student reading time was inconsistent between grade levels and between teachers within
the same grade level, which indicates a lack of consistent reading instruction within and
between grade levels. Given the disparities between reading classrooms, the district
should provide clear expectations and guidelines then provide ongoing professional
development for teachers to implement the Balanced Literacy approach with fidelity.
Currently, the only tool used to measure student reading time is the Indicators of Student
Engagement Observation Protocol walk-through form. The district should develop a
thorough, transparent measurement tool that administrators and teachers can use to ensure
students are given time for engaged reading and are engaged in other literacy activities
consistent with the Balanced Literacy approach.
Increasing student choice and interest. The district should develop classroom
libraries and provide resources to teachers so they can give students choice of reading
materials and make reading more relevant to the student population. By increasing
student choice or involvement in the reading process and increasing interest, students’
intrinsic motivation to read will increase (Dickerson, 2015). Intrinsic motivation to read
increases student reading time which increases reading competence (Guthrie et al., 1999).

108
Early interventions and remediation. Currently the system uses PALS to
identify struggling readers who need intervention and remediation. However, in this
study, the students were more successful on the PALS test in first and second grade and
were less successful on the VDOE Reading SOL in third, fourth, and fifth grade. The
PALS scores were also determined to not be a good predictor of Reading SOL scores.
Given the misalignment of the two formative assessments, the district should consider
other summative reading assessments for first- and second-grade students in order to
more effectively identify students for an intervention process in kindergarten, first grade,
and second grade to provide academic support to students who lack the fundamental
skills to become successful readers. Given the low mean SOL score and the disparity of
students’ scores on the Reading SOL, a remediation program needs to be implemented in
third and fourth grade to provide supports to struggling readers and break the cycle of
negative reading experiences, which undermine motivation and self-efficacy.
Discontinue the use of PALS assessment. The PALS assessment is not a
predictor of reading competence as measured by a passing score on the Virginia Reading
SOL. The PALS assessment is not aligned to the reading curriculum. There is also
dispute over the Lexile levels assigned by PALS. Given the deficiencies and lack of
predictive validity, the district should re-evaluate the purpose of the assessment and their
needs to find a summative assessment that is more aligned.
Recommendations for Future Research
There has been limited research on the implementation of the Balanced Literacy
approach in high poverty and high minority students. The premise of Balanced Literacy
is that the teacher is empowered to balance reading instruction between explicit

109
instruction and reading to meet the needs of the students. However, the consultants with
whom the district worked gave a prescribed lesson template that outlined the time frames
for whole group instruction, small group instruction, teacher modeling and independent
student reading. To ensure a reading instructional block is organized to maximize student
learning, research needs to be conducted on the most effective instructional reading
strategies for minority students and students living in poverty, which is representative of
the district’s student population.
One of the major limitations of this study was the lack of baseline data, which
were not collected prior to or in the initial phases of implementation. A longitudinal
study designed to collect baseline motivation data and utilize a specific observation
protocol during implementation would provide the data to analyze student growth and
program fidelity.
In addition to a longitudinal study focused on student outcomes, there is a need
for a qualitative study to investigate teacher perspectives, needs, and efficacy. The
Balanced Literacy approach is based on the teacher’s ability to make decisions in the
classroom that balance instruction, strategies, and activities to meet the needs of the
students. Consequently, teacher input is crucial to the successful implementation and
outcomes of the program.
The PALS assessment was intended to be a diagnostic tool rather than a
predictive assessment of SOL test achievement. The PALS assessment is also not
aligned to the SOLs for reading. If the district plans to continue using the K-2 reading
assessment as a predictive assessment, more research needs to be conducted on a valid K-
2 predictive reading assessment that is aligned to the Virginia reading SOLs.

110
Summary
Based on the lack of reading competence growth and the limited number of
students who are motivated to read, the district should re-evaluate its reading instruction
and develop a thorough professional development plan for all reading teachers to ensure
the Balanced Literacy approach is implemented with fidelity. Once the district has
determined the expectations for Balanced Literacy Reading Instruction, building
administrators and reading teachers should receive professional development on the
foundations of Balanced Literacy, the expectations of what it should look like in the
classroom, how to implement, and how the effectiveness will be measured. The
professional development plan should include introductory training for reading teachers
hired after the initial training in the district. As part of implementation, the district needs
to provide the necessary inputs including complete classroom libraries. The district
should also reconsider what assessment it uses to identify first- and second-grade students
for reading interventions. Finally, the district should collect baseline data and develop an
evaluation timeline to determine if the changes they have made are effective. If the
district takes the necessary steps to ensure the approach is implemented with fidelity and
the goals are still not actualized, the district should consider discontinuing the Balanced
Literacy Reading Instruction.

111
Appendix A
Indicators of Student Engagement Observation Protocol
High Student Engagement Strategies
Strategy Examples Non-Examples
1. ENGAGES IN SETTING LEARNING GOALS
2. ENGAGES IN MAKING CHOICES
3. ENGAGES IN READING
4. ENGAGES IN WRITING
5. ENGAGES IN DISCUSSING TEXT OR OTHER INPUT
6. ENGAGES IN PROBLEM SOLVING
7. CREATES PRODUCTS
8. PEER TUTORING, COOPERATIVE LEARNING, RECIPROCAL TEACHING, COOPERATIVE GROUPS
9. APPLIES METACOGNITION STRATEGIES
10. CREATES/USES LEARNING TOOLS INDICATIVE OF : CONCEPT MAP, GRAPHIC ORGANIZERS, MANIPULATIVES, TECHNOLOGY, OTHER
11. ENGAGES IN SELF-ASSESSMENT OF THEIR WORK, WHAT THEY LEARN, AND HOW THEY LEARN
12. ENGAGES IN ASKING FOR AND GIVING SPECIFIC FEEDBACK TO PEERS AND TO THE TEACHER
LOWER-YIELD PRACTICES FOR STUDENTS
1. COMPLETES WORKSHEET OR HOMEWORK
2. ENGAGES IN ORAL TURN TAKING
3. RESPONDS ORALLY
4. ENGAGES IN LISTENING
5. ENGAGES IN OFF-TASK BEHAVIORS

112
Appendix B
Self-Regulation Questionnaire-Reading Motivation Student Survey
Student Name________________________________ Date of Survey____________________
Circle the letter that most closely matches how you feel about reading for each statement.
I READ FOR SCHOOL BECAUSE… Disagree Disagree Neutral Agree Agree A lot A Little A Little A Lot
1. I really like it. 1 2 3 4 5
2. Others think that I have to. 1 2 3 4 5
3. I will feel ashamed of myself if I don’t read. 1 2 3 4 5
4. It’s fun to read. 1 2 3 4 5
5. I don’t want to disappoint others. 1 2 3 4 5
6. I will feel guilty if I don’t do it. 1 2 3 4 5
7. I enjoy reading. 1 2 3 4 5
8. I have to prove myself that I can get good reading grades. 1 2 3 4 5
9. I think reading is fascinating. 1 2 3 4 5
10. Others will only reward me if I read. 1 2 3 4 5
11. I think reading is interesting. 1 2 3 4 5
12. I just can be proud of myself if I get good reading grades. 1 2 3 4 5
13. That is what others expect me to do. 1 2 3 4 5
14. I think reading is meaningful. 1 2 3 4 5
15. Others will punish me if I don’t read. 1 2 3 4 5
16. I think it is very useful for me to read. 1 2 3 4 5
17. It is important to me to read. 1 2 3 4 5

113
Circle the letter that most closely matches how you feel about reading. These are the same
statements, but address reading in your free time.
I READ IN MY FREE TIME BECAUSE… Disagree Disagree Neutral Agree Agree A lot A Little A Little A Lot
1. I really like it. 1 2 3 4 5
2. Others think that I have to. 1 2 3 4 5
3. I will feel ashamed of myself if I don’t read. 1 2 3 4 5
4. It’s fun to read. 1 2 3 4 5
5. I don’t want to disappoint others. 1 2 3 4 5
6. I will feel guilty if I don’t do it. 1 2 3 4 5
7. I enjoy reading. 1 2 3 4 5
8. I have to prove myself that I can get good reading grades. 1 2 3 4 5
9. I think reading is fascinating. 1 2 3 4 5
10. Others will only reward me if I read. 1 2 3 4 5
11. I think reading is interesting. 1 2 3 4 5
12. I just can be proud of myself if I get good reading grades. 1 2 3 4 5
13. That is what others expect me to do. 1 2 3 4 5
14. I think reading is meaningful. 1 2 3 4 5
15. Others will punish me if I don’t read. 1 2 3 4 5
16. I think it is very useful for me to read. 1 2 3 4 5
17. It is important to me to read. 1 2 3 4 5
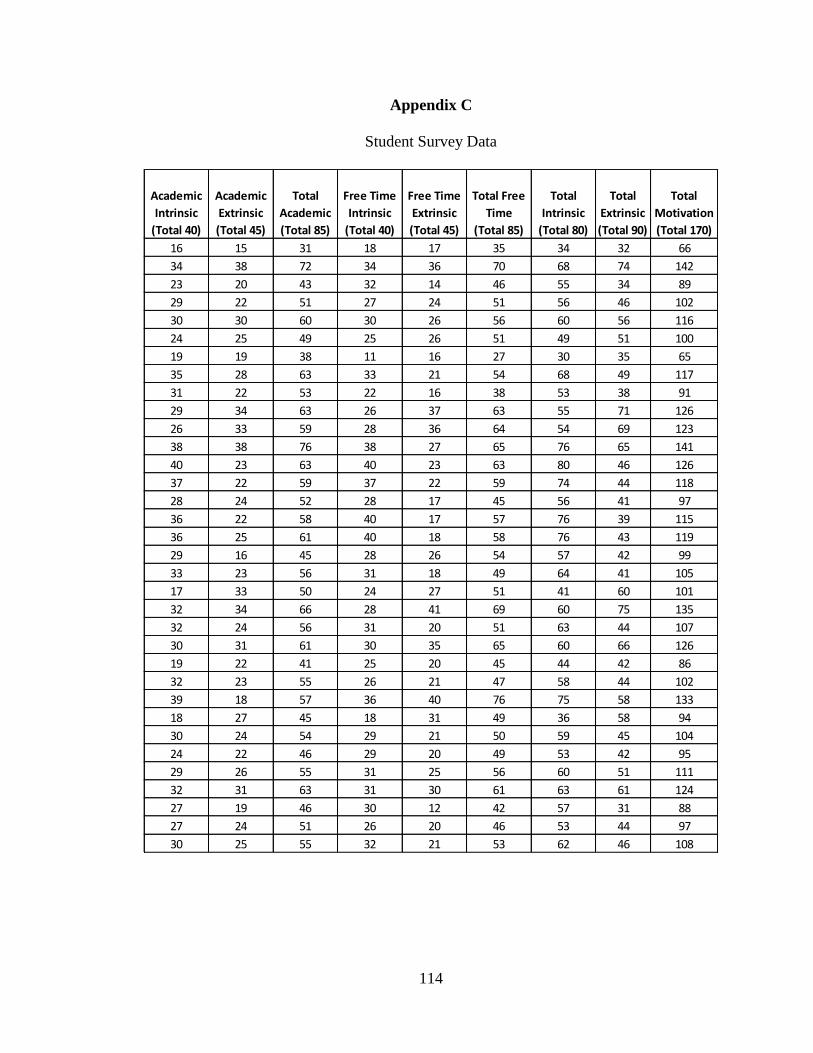
114
Appendix C
Student Survey Data
Academic
Intrinsic
(Total 40)
Academic
Extrinsic
(Total 45)
Total
Academic
(Total 85)
Free Time
Intrinsic
(Total 40)
Free Time
Extrinsic
(Total 45)
Total Free
Time
(Total 85)
Total
Intrinsic
(Total 80)
Total
Extrinsic
(Total 90)
Total
Motivation
(Total 170)
16 15 31 18 17 35 34 32 66
34 38 72 34 36 70 68 74 142
23 20 43 32 14 46 55 34 89
29 22 51 27 24 51 56 46 102
30 30 60 30 26 56 60 56 116
24 25 49 25 26 51 49 51 100
19 19 38 11 16 27 30 35 65
35 28 63 33 21 54 68 49 117
31 22 53 22 16 38 53 38 91
29 34 63 26 37 63 55 71 126
26 33 59 28 36 64 54 69 123
38 38 76 38 27 65 76 65 141
40 23 63 40 23 63 80 46 126
37 22 59 37 22 59 74 44 118
28 24 52 28 17 45 56 41 97
36 22 58 40 17 57 76 39 115
36 25 61 40 18 58 76 43 119
29 16 45 28 26 54 57 42 99
33 23 56 31 18 49 64 41 105
17 33 50 24 27 51 41 60 101
32 34 66 28 41 69 60 75 135
32 24 56 31 20 51 63 44 107
30 31 61 30 35 65 60 66 126
19 22 41 25 20 45 44 42 86
32 23 55 26 21 47 58 44 102
39 18 57 36 40 76 75 58 133
18 27 45 18 31 49 36 58 94
30 24 54 29 21 50 59 45 104
24 22 46 29 20 49 53 42 95
29 26 55 31 25 56 60 51 111
32 31 63 31 30 61 63 61 124
27 19 46 30 12 42 57 31 88
27 24 51 26 20 46 53 44 97
30 25 55 32 21 53 62 46 108

115
Academic
Intrinsic
(Total 40)
Academic
Extrinsic
(Total 45)
Total
Academic
(Total 85)
Free Time
Intrinsic
(Total 40)
Free Time
Extrinsic
(Total 45)
Total Free
Time
(Total 85)
Total
Intrinsic
(Total 80)
Total
Extrinsic
(Total 90)
Total
Motivation
(Total 170)
29 20 49 34 21 55 63 41 104
34 32 66 35 34 69 69 66 135
14 18 32 15 13 28 29 31 60
40 17 57 40 17 57 80 34 114
31 25 56 36 23 59 67 48 115
34 39 73 29 34 63 63 73 136
34 41 75 33 41 74 67 82 149
MEAN MEAN MEAN MEAN MEAN MEAN MEAN MEAN MEAN
29.44 25.71 55.15 29.66 24.49 54.15 59.10 50.20 109.29

116
Appendix D
Participant Consent Letter
February 11, 2019
Dear Parent or Guardian of___________________________________,
I am currently completing a research project with the College of William and Mary. I am
evaluating the Balanced Literacy reading approach used in the Greensville County Public
School system. As part of my research, I would like to know how motivated our students
are to read. To get this information, I am requesting permission to survey your child. I
have selected your child because s/he has been enrolled in Greensville County Public
Schools since first grade and their reading teachers have used the Balanced Literacy
approach in your child’s classes since first grade.
If you give your consent, your child will take a 24 question survey. For each question,
your child will select an answer choice from five options. The survey will be
administered in the school library during your child’s English class. The survey results
will be kept confidential and will not be shared with any of the teachers or other
personnel at the school. Your child will not be penalized if they do not take the survey.
If your child takes the survey, they will be given a snack while taking the survey but they
will not receive any other reward such as extra credit or a grade.
If you have any questions or concerns, please call (434-634-5159) or email me
Sincerely,
Jami Clements
I give permission for my child______________________________ to take the student
motivation survey. I understand their will be no consequences or rewards based on
participation.
Parent/Guardian Name____________________________________________________________
Parent/Guardian Signature_______________________________ Date_____________________
I___________________________(student name) agree to take the survey. I understand their
will be no consequences or rewards based on participation.
Student Signature_____________________________________ Date______________________

117
Appendix E
Student Reading SOL Scores for Academic Years 2012-13 to 2017-18
SPR 2013 SPR 2014 SPR 2015 SPR 2016 SPR 2017 SPR 2018
1 600 600 600 600 600 600
2 600 600 600 564 558 600
3 566 533 600 564 550 593
4 566 533 600 538 545 550
5 566 533 560 538 530 549
6 538 515 560 536 522 547
7 517 513 560 536 506 529
8 517 513 560 517 504 527
9 500 513 560 517 501 525
10 500 496 532 500 499 524
11 500 496 532 500 498 509
12 500 496 532 500 497 493
13 500 496 512 500 496 493
14 500 496 512 499 495 490
15 500 496 512 499 494 483
16 500 496 512 499 493 478
17 500 496 512 499 492 470
18 486 482 512 499 491 469
19 486 482 495 499 491 468
20 486 482 495 486 491 465
21 486 482 495 486 491 464
22 486 482 495 485 489 461
23 486 482 495 485 489 459
24 486 482 495 485 488 459
25 486 482 495 485 488 458
26 486 469 482 485 483 457
27 486 469 481 485 482 456
28 486 469 481 485 480 453
29 473 469 481 474 478 453
30 473 469 481 473 473 453
31 473 469 481 473 472 451
32 473 469 481 462 472 451
33 473 458 481 462 472 0
34 462 458 470 462 471 450
35 462 458 470 462 469 447
36 462 458 469 462 469 0
Third Grade Reading SOL Scores by Academic Year

118
SPR 2013 SPR 2014 SPR 2015 SPR 2016 SPR 2017 SPR 2018
Third Grade Reading SOL Scores by Academic Year
37 462 458 469 461 469 446
38 462 458 469 461 465 445
39 462 458 469 452 462 444
40 462 458 469 452 461 442
41 462 458 469 452 461 442
42 458 458 469 452 458 441
43 452 458 469 451 458 440
44 452 458 469 451 458 439
45 452 458 469 451 454 439
46 452 458 458 451 453 437
47 446 448 458 451 452 436
48 442 448 458 442 452 432
49 442 448 448 442 451 431
50 442 448 448 442 450 429
51 442 448 448 442 447 428
52 442 448 448 442 447 428
53 442 448 448 442 446 427
54 433 448 448 442 446 427
55 433 438 448 442 445 427
56 433 438 438 442 445 423
57 433 438 438 442 444 422
58 433 438 438 433 444 420
59 433 438 438 433 439 419
60 424 438 438 433 438 419
61 424 438 438 433 438 417
62 424 438 438 433 438 415
63 424 438 438 433 437 413
64 424 438 438 425 437 412
65 424 438 430 424 435 411
66 424 438 429 424 435 410
67 424 429 429 424 434 408
68 424 429 429 424 434 408
69 424 429 429 424 434 407
70 424 429 429 424 433 405
71 424 429 421 424 433 404
72 416 429 421 424 430 404
73 416 429 421 424 428 403
74 416 429 421 417 426 401
75 416 429 421 417 424 401
76 416 429 421 417 422 401
77 416 429 421 416 421 400

119
78 416 422 421 416 420 400
79 416 421 421 416 420 400
80 416 421 421 416 418 398
81 416 421 413 416 416 397
82 416 421 413 416 415 397
83 416 421 412 416 414 396
84 416 421 412 416 414 390
85 416 421 412 416 414 387
86 416 421 412 409 413 387
87 416 421 405 409 412 385
88 408 421 405 408 411 380
89 408 421 405 408 409 378
90 408 421 405 408 409 377
91 408 413 405 408 408 366
92 408 413 405 408 408 357
93 408 413 405 401 406 355
94 408 413 405 401 405 354
95 408 413 405 401 405 354
96 408 413 397 401 405 353
97 408 405 397 401 403 352
98 408 405 397 401 403 349
99 400 405 397 401 402 348
100 400 405 397 401 402 348
101 400 405 397 401 401 346
102 400 405 397 401 400 346
103 400 405 390 401 400 345
104 400 405 390 400 400 344
105 400 405 390 393 400 340
106 392 405 390 392 397 340
107 392 405 382 386 391 338
108 392 405 382 386 390 338
109 392 405 382 379 390 337
110 385 405 382 372 390 337
111 385 397 375 372 389 335
112 385 397 375 372 387 334
113 385 390 375 371 385 333
114 385 390 375 371 384 333
115 385 390 375 371 382 331
116 385 390 375 371 381 331

120
117 385 382 375 371 379 330
118 385 382 375 371 378 330
119 384 382 375 365 378 328
120 378 382 368 364 374 328
121 378 382 361 364 372 326
122 378 375 361 364 371 324
123 378 375 361 364 369 324
124 378 375 361 364 366 324
125 378 375 361 364 365 324
126 370 375 354 364 365 323
127 370 371 354 364 364 320
128 370 371 354 364 363 314
129 370 368 354 364 362 312
130 370 368 354 364 361 309
131 370 368 354 364 359 308
132 370 368 354 357 358 306
133 363 363 354 357 358 306
134 363 361 354 357 358 306
135 363 361 347 357 356 305
136 356 361 347 357 351 304
137 356 361 347 357 349 303
138 356 361 347 357 349 300
139 348 361 347 350 347 300
140 348 361 347 350 346 294
141 348 354 347 350 346 289
142 348 354 340 350 345 286
143 341 354 340 343 345 285
144 341 347 340 343 344 281
145 341 347 332 336 344 281
146 333 347 332 336 344 281
147 333 347 332 336 343 279
148 333 347 332 328 342 279
149 333 347 332 328 341 275
150 333 347 325 328 341 268
151 333 340 317 328 338 267
152 333 340 317 328 337 267
153 333 340 317 328 337 267
154 326 340 317 328 336 261
155 326 333 310 321 336 256
156 326 333 310 321 336 251
157 326 326 310 321 336 236

121
158 326 326 310 320 333 221
159 318 326 310 313 332 172
160 318 318 310 313 328
161 318 318 302 313 325
162 318 310 302 313 324
163 318 310 302 313 323
164 318 302 302 305 322
165 316 302 302 305 321
166 310 285 302 305 321
167 310 285 293 305 320
168 310 285 293 305 320
169 310 285 293 296 319
170 310 276 293 296 318
171 302 276 293 287 317
172 293 276 293 287 316
173 293 276 284 278 313
174 293 276 284 278 312
175 293 243 275 277 312
176 284 265 267 311
177 284 265 267 311
178 274 265 267 309
179 274 254 267 306
180 274 254 267 305
181 252 242 267 303
182 252 242 267 303
183 228 267 303
184 228 256 301
185 301
186 300
187 298
188 297
189 296
190 295
191 295
192 294
193 294
194 294
195 293
196 293
197 291
198 291

122
199 290
200 290
201 288
202 287
203 287
204 284
205 284
206 284
207 283
208 279
209 278
210 275
211 272
212 271
213 269
214 267
215 266
216 264
217 254
218 251
219 249
220 237
221 224
222 217

123
SPR 2013 SPR 2014 SPR 2015 SPR 2016 SPR 2017 SPR 2018
1 565 600 600 600 600 554
2 565 554 559 567 593 553
3 537 554 559 567 581 550
4 537 554 531 540 577 548
5 517 554 531 540 563 548
6 517 526 531 540 562 524
7 517 526 511 528 550 522
8 517 514 511 509 549 521
9 517 505 511 509 545 519
10 517 494 494 509 541 518
11 517 488 494 493 536 512
12 517 488 494 490 529 511
13 517 488 488 479 521 510
14 500 488 480 479 516 508
15 500 488 480 479 513 505
16 500 488 480 479 508 501
17 500 488 480 479 505 493
18 500 488 480 477 500 493
19 486 488 480 477 499 492
20 486 488 480 477 497 488
21 486 480 480 477 494 488
22 486 474 480 468 487 487
23 486 474 480 468 487 486
24 486 474 480 468 486 486
25 486 474 480 468 485 480
26 486 474 468 468 485 479
27 486 474 468 468 485 479
28 486 474 468 466 484 478
29 486 474 468 466 483 477
30 486 461 468 466 481 472
31 486 461 468 462 478 472
32 473 461 468 457 473 472
33 473 461 457 457 472 470
34 473 461 457 457 471 469
35 473 461 457 457 466 469
36 473 461 457 456 465 468
37 473 461 457 455 465 465
38 473 461 457 447 465 464
39 473 453 457 447 464 462
40 473 450 457 447 463 461
41 473 450 457 447 460 461
Fourth Grade Reading SOL Scores by Academic Year

124
42 473 450 457 447 460 459
43 462 450 447 447 460 456
44 462 450 447 447 459 456
45 462 450 447 447 459 456
46 462 447 447 438 455 456
47 462 447 447 438 455 456
48 462 446 447 438 454 455
49 462 439 447 438 453 455
50 451 439 447 438 452 454
51 451 439 447 438 451 454
52 451 439 447 438 448 453
53 451 439 447 438 440 451
54 451 439 438 433 440 451
55 451 439 437 433 439 450
56 451 439 437 430 439 447
57 451 439 437 430 438 447
58 451 439 437 430 438 447
59 442 438 437 430 436 446
60 442 438 437 430 436 446
61 442 438 437 430 435 444
62 442 438 437 430 434 443
63 442 436 437 424 433 441
64 442 430 430 424 433 441
65 442 430 430 422 431 440
66 442 430 429 422 430 437
67 442 430 429 422 430 436
68 433 430 429 422 430 436
69 433 430 429 422 429 436
70 433 430 429 422 427 435
71 433 430 429 422 423 435
72 433 430 429 422 423 435
73 433 430 429 416 423 435
74 433 430 429 414 422 434
75 433 430 429 414 422 431
76 433 430 429 414 421 431
77 433 430 429 414 420 430
78 424 421 422 414 418 429
79 424 421 422 414 418 429
80 424 421 420 414 417 429
81 424 421 420 414 416 428
82 424 420 420 414 416 428
SPR 2013 SPR 2014 SPR 2015 SPR 2016 SPR 2017 SPR 2018
Fourth Grade Reading SOL Scores by Academic Year

125
83 424 420 420 408 416 425
84 424 420 420 408 416 425
85 424 420 420 408 416 424
86 424 420 420 408 415 424
87 416 420 420 408 415 424
88 416 420 420 407 414 423
89 416 420 420 407 413 423
90 416 420 420 407 413 423
91 416 420 414 407 412 423
92 416 414 414 407 412 422
93 416 414 414 400 411 422
94 416 414 413 400 411 421
95 416 412 413 399 411 421
96 416 412 413 393 411 421
97 416 412 413 393 410 420
98 416 412 413 393 410 420
99 416 412 413 392 409 419
100 408 412 413 386 409 418
101 408 412 413 385 407 416
102 408 412 413 385 407 416
103 408 412 413 379 405 416
104 408 412 413 378 404 415
105 408 412 413 372 403 415
106 408 412 407 372 402 415
107 408 412 407 371 401 414
108 408 412 407 371 401 413
109 408 406 407 365 401 413
110 408 404 407 365 400 413
111 400 404 407 365 400 412
112 400 404 405 364 396 410
113 400 404 405 364 392 409
114 400 404 405 359 391 408
115 400 404 405 359 391 407
116 400 404 405 359 389 407
117 400 404 405 359 386 406
118 400 404 405 359 385 404
119 400 404 400 358 382 404
120 392 399 400 352 380 403
121 392 399 393 352 380 402
122 392 399 393 352 377 401
123 392 399 393 352 374 400

126
124 392 399 393 352 372 397
125 392 399 393 345 372 395
126 392 399 386 345 371 395
127 385 392 386 345 369 394
128 385 392 386 345 367 394
129 385 390 386 344 361 394
130 385 385 379 343 359 394
131 385 385 379 338 359 393
132 385 378 379 338 357 392
133 385 378 379 338 356 391
134 385 378 372 338 356 391
135 385 378 372 336 356 388
136 385 378 372 331 355 388
137 385 378 372 331 354 385
138 384 378 365 331 350 385
139 378 378 365 331 349 383
140 378 378 365 331 348 383
141 378 373 365 331 348 383
142 378 371 365 331 347 381
143 378 371 358 329 347 380
144 378 364 358 329 346 380
145 370 364 358 329 346 380
146 370 364 358 329 343 380
147 370 364 358 323 343 378
148 370 350 351 323 343 376
149 370 350 351 323 343 373
150 363 350 351 321 339 371
151 363 345 344 316 335 368
152 363 343 344 316 331 366
153 363 343 344 316 331 365
154 363 343 344 313 330 363
155 363 336 336 313 330 362
156 363 336 336 313 329 362
157 356 336 329 308 327 361
158 356 336 329 308 326 360
159 356 331 329 308 326 360
160 356 331 329 308 325 359
161 356 329 321 308 323 358
162 349 329 321 308 323 356
163 349 329 321 308 318 355
164 349 329 313 308 316 354

127
165 349 323 313 305 312 353
166 343 321 313 305 308 351
167 342 321 313 305 307 351
168 342 321 313 305 307 349
169 334 321 304 300 305 347
170 334 321 304 300 302 347
171 334 321 295 291 301 346
172 334 314 295 291 298 344
173 334 314 295 291 298 344
174 327 314 285 282 292 344
175 327 306 275 282 288 342
176 319 297 251 282 286 337
177 316 297 251 261 280 337
178 311 297 200 249 277 334
179 311 289 276 334
180 311 289 275 331
181 311 289 269 330
182 303 279 266 329
183 303 279 263 326
184 303 279 252 324
185 303 269 236 317
186 303 269 233 316
187 303 269 229 315
188 303 257 315
189 294 232 314
190 294 204 309
191 294 308
192 276 308
193 276 307
194 276 302
195 265 301
196 254 297
197 242 294
198 228 291
199 228 291
200 228 291
201 287
202 287
203 279
204 264
205 256

128
206 245
207 227

129
SPR 2013 SPR 2014 SPR 2015 SPR 2016 SPR 2017 SPR 2018
1 600 581 569 600 600 580
2 567 530 540 600 600 575
3 538 530 540 576 546 560
4 538 512 519 572 539 556
5 538 512 519 572 530 532
6 500 512 519 548 529 527
7 500 497 502 548 528 522
8 500 497 502 543 524 518
9 500 497 502 543 518 515
10 486 497 487 526 514 512
11 486 497 487 509 514 507
12 486 484 487 509 514 499
13 486 484 487 509 512 494
14 486 472 487 505 501 494
15 473 472 487 505 501 493
16 473 472 487 495 498 492
17 473 472 487 495 497 490
18 473 461 487 495 496 485
19 473 461 475 495 494 483
20 473 461 475 495 494 483
21 473 461 475 495 489 482
22 462 461 475 490 486 480
23 462 461 475 482 486 479
24 462 451 475 482 485 477
25 462 451 475 482 481 476
26 462 451 475 482 478 471
27 462 451 463 482 477 471
28 462 451 463 482 476 466
29 462 451 463 482 476 464
30 462 451 463 477 474 461
31 462 451 463 477 472 461
32 451 451 463 477 470 460
33 451 451 463 471 469 459
34 451 451 463 471 468 459
35 451 451 463 471 464 452
36 451 441 463 471 460 451
37 451 441 463 471 457 449
38 451 441 463 466 457 448
39 451 441 453 466 455 448
40 451 441 453 460 455 445
41 451 441 453 460 455 444
Fifth Grade Reading SOL Scores by Academic Year
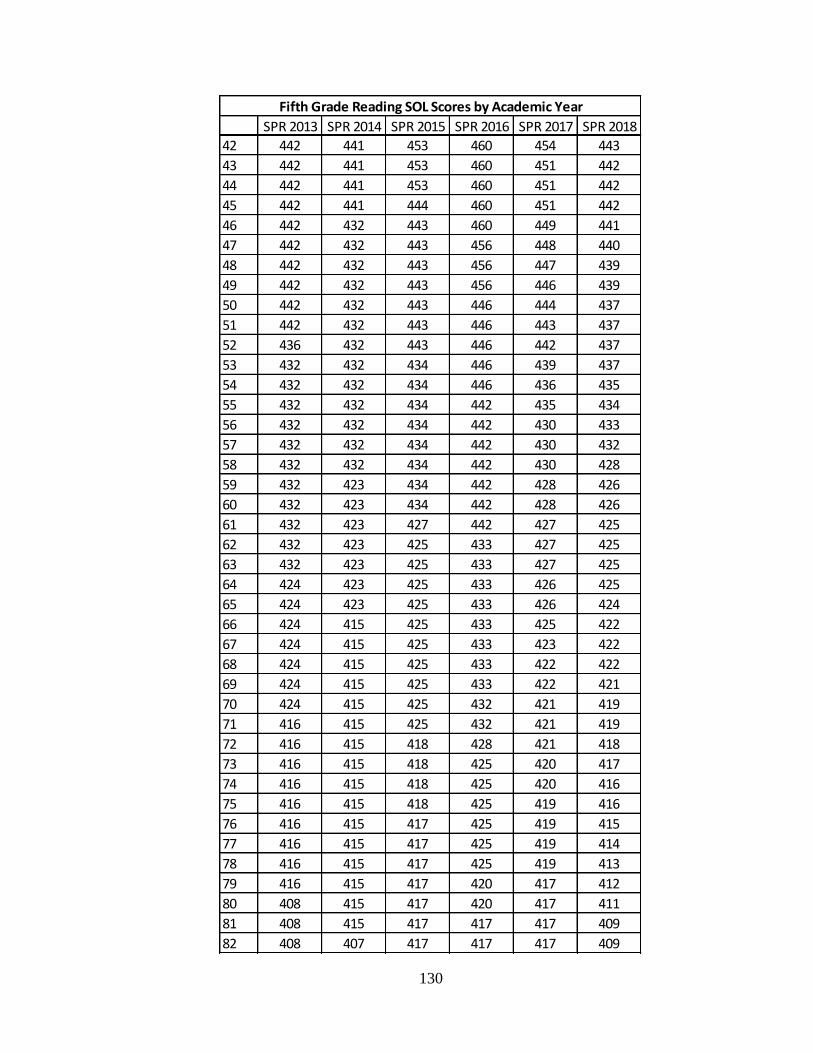
130
SPR 2013 SPR 2014 SPR 2015 SPR 2016 SPR 2017 SPR 2018
Fifth Grade Reading SOL Scores by Academic Year
42 442 441 453 460 454 443
43 442 441 453 460 451 442
44 442 441 453 460 451 442
45 442 441 444 460 451 442
46 442 432 443 460 449 441
47 442 432 443 456 448 440
48 442 432 443 456 447 439
49 442 432 443 456 446 439
50 442 432 443 446 444 437
51 442 432 443 446 443 437
52 436 432 443 446 442 437
53 432 432 434 446 439 437
54 432 432 434 446 436 435
55 432 432 434 442 435 434
56 432 432 434 442 430 433
57 432 432 434 442 430 432
58 432 432 434 442 430 428
59 432 423 434 442 428 426
60 432 423 434 442 428 426
61 432 423 427 442 427 425
62 432 423 425 433 427 425
63 432 423 425 433 427 425
64 424 423 425 433 426 425
65 424 423 425 433 426 424
66 424 415 425 433 425 422
67 424 415 425 433 423 422
68 424 415 425 433 422 422
69 424 415 425 433 422 421
70 424 415 425 432 421 419
71 416 415 425 432 421 419
72 416 415 418 428 421 418
73 416 415 418 425 420 417
74 416 415 418 425 420 416
75 416 415 418 425 419 416
76 416 415 417 425 419 415
77 416 415 417 425 419 414
78 416 415 417 425 419 413
79 416 415 417 420 417 412
80 408 415 417 420 417 411
81 408 415 417 417 417 409
82 408 407 417 417 417 409
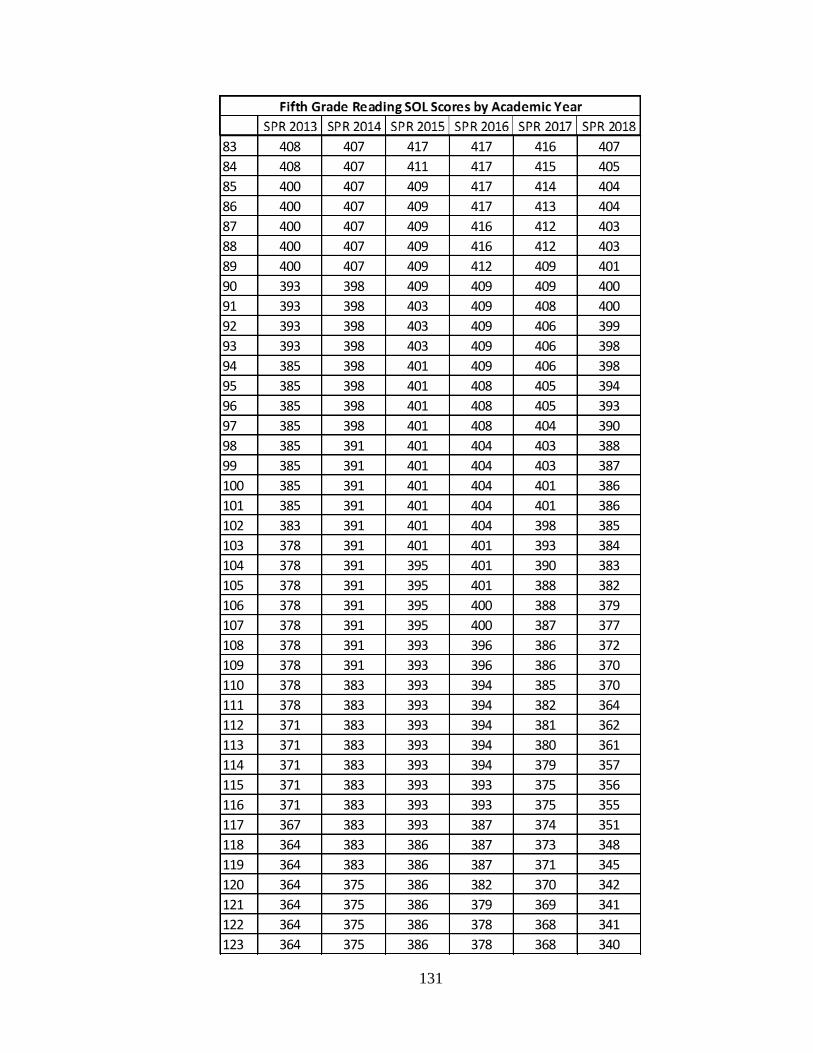
131
83 408 407 417 417 416 407
84 408 407 411 417 415 405
85 400 407 409 417 414 404
86 400 407 409 417 413 404
87 400 407 409 416 412 403
88 400 407 409 416 412 403
89 400 407 409 412 409 401
90 393 398 409 409 409 400
91 393 398 403 409 408 400
92 393 398 403 409 406 399
93 393 398 403 409 406 398
94 385 398 401 409 406 398
95 385 398 401 408 405 394
96 385 398 401 408 405 393
97 385 398 401 408 404 390
98 385 391 401 404 403 388
99 385 391 401 404 403 387
100 385 391 401 404 401 386
101 385 391 401 404 401 386
102 383 391 401 404 398 385
103 378 391 401 401 393 384
104 378 391 395 401 390 383
105 378 391 395 401 388 382
106 378 391 395 400 388 379
107 378 391 395 400 387 377
108 378 391 393 396 386 372
109 378 391 393 396 386 370
110 378 383 393 394 385 370
111 378 383 393 394 382 364
112 371 383 393 394 381 362
113 371 383 393 394 380 361
114 371 383 393 394 379 357
115 371 383 393 393 375 356
116 371 383 393 393 375 355
117 367 383 393 387 374 351
118 364 383 386 387 373 348
119 364 383 386 387 371 345
120 364 375 386 382 370 342
121 364 375 386 379 369 341
122 364 375 386 378 368 341
123 364 375 386 378 368 340

132
124 364 367 386 374 366 339
125 364 367 380 372 365 339
126 356 367 380 372 365 335
127 356 367 378 372 363 334
128 356 367 378 372 362 333
129 356 367 378 372 361 332
130 349 360 378 365 361 331
131 349 360 378 365 358 325
132 349 352 378 360 357 322
133 349 352 373 360 355 322
134 342 352 373 358 354 320
135 342 352 371 358 348 319
136 342 352 371 358 343 318
137 335 352 371 343 342 315
138 335 344 365 343 342 314
139 335 344 364 343 337 313
140 335 344 364 343 335 307
141 335 344 364 338 332 307
142 327 344 364 338 329 305
143 327 344 364 335 325 303
144 327 344 364 335 324 303
145 327 337 364 335 324 300
146 323 337 364 335 323 299
147 320 337 364 327 320 298
148 320 337 364 319 319 298
149 320 337 356 314 319 298
150 320 337 356 314 318 290
151 320 337 356 311 317 286
152 312 329 350 311 317 284
153 312 329 349 306 316 283
154 312 329 349 306 312 275
155 312 329 349 302 312 256
156 303 329 349 302 311 255
157 303 329 343 297 310 239
158 303 320 341 297 310 226
159 303 320 341 293 307 141
160 303 320 341 293 304
161 303 320 334 293 302
162 295 320 334 293 302
163 295 320 327 278 302
164 295 320 327 278 298

133
165 295 312 326 278 297
166 286 312 326 273 289
167 286 312 326 262 286
168 286 303 326 262 285
169 286 303 326 256 259
170 286 303 318 234
171 286 303 318 231
172 276 294 318 198
173 266 294 318 196
174 266 294 310
175 294 310
176 285 310
177 264 310
178 264 301
179 252 301
180 252 301
181 252 301
182 239 292
183 239 292
184 206 292
185 292
186 292
187 283
188 283
189 283
190 283
191 283
192 273
193 262
194 262
195 262
196 262
197 251
198 251
199 223

134
References
Adams, M. J. (1990). Beginning to read: Thinking and learning about print. Cambridge,
MA: MIT Press.
Anderson, R. C., Wilson, P. T., & Fielding, L. G. (1988). Growth in reading and how
children spend their time outside of school. Reading Research Quarterly, 23(3),
285-303. doi:128.239.99.140
Applegate, A. J., & Applegate, M. D. (2010). A study of thoughtful literacy and the
motivation to read. The Reading Teacher, 64(4), 226-234. doi:10.1598/RT.64.4.1
Baas, D., Castelijns, J., Vermeulen, M., Martens, R., & Segers, M. (2015). The relation
between assessment for learning and elementary students’ cognitive and
metacognitive strategy use. British Journal of Educational Psychology, 85(1), 33-
46. doi:10.1111/bjep.12058
Baker, L., & Wigfield, A. (1999). Dimensions of children’s motivation for reading and
their relations to reading activity and reading achievement. Reading Research
Quarterly, 34(4), 452-477.
Barger, K. (2016). Part III: Guided by meaning through early literacy. In J. Carroll, K.
Barger, K. James, & K. Hill (Eds.), Guided by meaning in primary literacy:
libraries, reading, writing, and learning (pp. 113-134). Retrieved from
http://ebookcentral.proquest.com/lib/csm/detail.action?docID=4742120
Barry, A. L. (2008). Reading the past: Historical antecedents to contemporary reading
methods and materials. Reading Horizons, 49(1), 31-52.

135
Baumann, J. F., & Heubach, K. M. (1996). Do basal readers deskill teachers? A national
survey of educators’ use and opinions of basals. The Elementary School Journal,
96(5), 511-526. Retrieved from https://www.jstor.org/stable/1001847
Becker, M., McElvany, N., & Kortenbruck, M. (2010). Intrinsic and extrinsic reading
motivation as predictors of reading literacy: A longitudinal study. Journal of
Educational Psychology, 102(4), 773-785. doi:10.1037/a0020084
Bertelson, P. (1987). The onset of literacy: Cognitive processes in reading acquisition.
Cambridge, MA: MIT Press.
Bingham, G. E., & Hall-Kenyon, K. M. (2011). Examining teachers’ beliefs about and
implementation of a balanced literacy framework. Journal of Research in
Reading, 36(1), 14-28. doi:10.1111/j.1467-9817.2010.01483.x
Bitter, C., O’Day, J., Gubbins, P., & Socias, M. (2009). What works to improve student
literacy achievement? An examination of instructional practices in a Balanced
Literacy approach. Journal of Education for Students Placed at Risk, 14(1), 17-
44. doi:10.1080/10824660802715403
Blewitt, P., Rump, K. M., Shealy, S. E., & Cook, S. A. (2009). Shared book reading:
When and how questions affect young children’s word learning. Journal of
Educational Psychology, 101(2), 294-304.
Borgonovi, F. (2016). Video gaming and gender differences in digital and printed reading
performance among 15-year-old students in 26 countries. Journal of Adolescence,
45, 45-61. doi:10.1016/j.adolescence.2016.01.004
Boulware-Gooden, R., Carreker, S., Thornhill, A., & Joshi, R. (2007). Instruction of
metacognitive strategies enhances reading comprehension and vocabulary

136
achievement of third-grade students. Reading Teacher, 61(1), 70-77.
doi:10.1598/RT.61.1.7
Bradley, L., & Bryant, P. (1985). Rhyme and reason in reading and spelling. Ann Arbor,
MI: University of Michigan Press.
Brenner, D., & Hiebert, E. (2010). If I follow the teachers’ editions, isn’t that enough?
Analyzing reading volume in six core reading programs. The Elementary School
Journal, 110(3), 347-363. doi:10.1086/648982
Brown, E. (2017, February). Re: History of Reading Instruction [Web post]. Retrieved
from https://www.thephonicspage.org/On%20Phonics/historyofreading.html
Byrne, B., & Ledez, J. (1983). Phonological awareness in reading disabled adults.
Australian Journal of Psychology, 35(2), 185-197.
doi:10.1080/00049538308255065
Chall, J. S. (1967). Learning to read: The great debate, First edition. New York, NY:
McGraw-Hill Paperbacks.
Claggett, F., Reid, L., & Vinz, R. (2007). Daybook of critical reading and writing.
Wilmington, MA: Great Source Education Group.
Collazo, V. (2017, December 30). Report: Virginia students toward the bottom in writing.
Loudon Times. Retrieved from http://www.loudontimes.com
Common Core State Standards Initiative. (2018). English Language Arts standards.
Retrieved from http://www.corestandards.org/ELA-Literacy/
Dahlgren, M. E. (2008, July). Oral language and vocabulary development. Poster session
presented at the meeting of the Reading First National Conference, Nashville, TN.

137
De Naeghel, J., Van Keer, H., Vansteenkiste, M., & Rosseel, Y. (2012). The relation
between elementary students’ recreational and academic reading motivation,
reading frequency, engagement, and comprehension: A self-determination theory
perspective. Journal of Educational Psychology, 104(4), 1006-1021.
doi:10.1037/a0027800
Dickerson, K. (2015). Reimagining reading: Creating a classroom culture that embraces
independent choice reading. Penn GSE Perspectives on Urban Education, 12(1),
57-68.
Eccles, J., Lord, S., & Buchanan, C. (1996). School transitions in early adolescence:
What are we doing to our young children? In J. A. Graber, J. Brooks-Gunn, & A.
C. Peterson (Eds.), Transitions through adolescence: Interpersonal domains and
context (pp. 251-284). Hillsdale, NJ: Erlbaum.
Education reform: Progress and confusion. (2003, September 25). The Economist,
368(8343), 29-30. Retrieved from https://www.economist.com/united-
states/2003/09/25/progress-and-confusion
Ennemoser, M., & Schneider, W. (2007). Relations of television viewing and reading:
Findings from a 4-year longitudinal study. Journal of Educational Psychology,
99(2), 349-368. doi:10.1037/0022-0663.99.2.349
Flesch, R. (1983). Why Johnny can’t read and what you can do about it. New York, NY:
Harper & Row, Publishers, Inc.

138
Flowers, T. A., & Flowers, L. A. (2008). Factors affecting urban African American high
school students’ achievement in reading. Urban Education, 43(2), 154-171.
doi:10.1177/0042085907312351
Foorman, B. R. (1995). Research on “The Great Debate”: Code-oriented versus whole
language approaches to reading instruction. School Psychology Review, 24(3),
376-394.
Foorman, B. R., & Francis, D. J. (1994). Exploring connections among reading, spelling,
and phonemic segmentation during first grade. Reading and Writing, 6, 65-91.
doi:10.1007/BF01027278
Foorman, B. R., Schatschneider, C., Eakin, M., Fletcher, J. M., Moats, L. C., & Francis,
D. J. (2006). The impact of instructional practices in Grades 1 and 2 on reading
and spelling achievement in high poverty schools. Contemporary Educational
Psychology, 31(1), 1-29. doi:10.1016/j.cedpsych.2004.11.003
Fox, B., & Routh, D. (1980). Phonemic analysis and severe reading disability in children.
Journal of Psycholinguistic Research, 9(2), 115-119.
Fraumeni-McBride, J. P. (2017). The effects of choice on reading engagement and
comprehension for second- and third-grade students: An action research report.
Journal of Montessori Research, 3(2), 19-38. Retrieved from
https://files.eric.ed.gov/fulltext/EJ1161358.pdf
Fredericks, J. A., Blumenfeld, P. C., & Paris, A. H. (2004). School engagement: Potential
of the concept, state of the evidence. Review of Educational Research, 74(1), 59-
109. doi:10.3102/00346543074001059

139
Gambrell, L. B. (1996). Creating classroom cultures that foster reading motivation. The
Reading Teacher, 50(1), 14-25. Retrieved from www.jstor.org/stable/20201703
Gambrell, L. B., Palmer, B. M., Codling, R. M., & Mazzoni, S. A. (1996). Assessing
motivation to read. The Reading Teacher, 49(7), 518-533. doi: 10.1598/RT.49.7.2
Gonzalez, J., Goetz, E., Hall, R., Payne, T., Taylor, A., Kim, M., & McCormick, A.
(2011). An evaluation of Early Reading First (ERF) preschool enrichment on
language and literacy skills. Reading and Writing: An Interdisciplinary Journal,
24, 253-284. doi:10.1007/s11145-009-9212-8
Gottfried, A. E., Fleming, J. S., & Gottfried, A. W. (2001). Continuity of academic
intrinsic motivation from childhood through late adolescence: A longitudinal
study. Journal of Educational Psychology, 93(1), 3-13. doi:10.1037/0022-
0663.93.1.3
Gottfried, A. W., Cook, C. R., Gottfried, A. E., & Morris, P. E. (2005). Educational
characteristics of adolescents with gifted academic intrinsic motivation: A
longitudinal investigation from school entry through early adulthood. Gifted Child
Quarterly, 49, 172-186. doi:10.1177/001698620504900206
Guthrie, J., McGough, K., & Wigfield, A. (1994). Measuring reading activity: An
inventory (Instructional Resource No. 4). Athens, GA: National Reading Research
Center, Universities of Georgia and Maryland College Park.
Guthrie, J., & Wigfield, A. (2000). Engagement and motivation in reading. In M. L.
Kamil, P. B. Mosenthal, P. D. Pearson, & R. Barr (Eds.). Reading research
handbook (Vol. 3, pp. 402-422). Mahwah, NJ: Erlbaum.

140
Guthrie, J., Wigfield, A., Barbosa, P., Perencevich, K., Taboada, A., & Davis, M. (2004).
Increasing reading comprehension and engagement through concept-oriented
reading instruction. Journal of Educational Psychology, 96(3), 403-423.
doi:10.1037/0022-0663.96.3.403
Guthrie, J., Wigfield, A., Metsala, J., & Cox, K. (1999). Motivational and cognitive
predictors of text comprehension and reading amount. Scientific Studies of
Reading, 3(3), 231-256. doi:10.1207/s1532799xssr0303_3
Guthrie, J., Wigfield, A., Humenick, N., Perencevich, K., Taboada, A., & Barbosa, P.
(2006). Influences of stimulating tasks on reading motivation and comprehension.
The Journal of Educational Research, 99(4), 232-245. Retrieved from
www.jstor.org/stable/27548134
Hao, S., & Johnson, R. L. (2013). Teachers’ classroom assessment practices and fourth-
graders’ reading literacy achievements: An international study. Teaching and
Teacher Education, 29, 53-63. doi:10.1016/j.tate.2012.08.010
Harter, S. (1981). A new self-report scale of intrinsic versus extrinsic orientation in the
classroom: Motivational and informational components. Developmental
Psychology, 17(3), 300-312. doi:0012-1649/81/1703-0300S00.75
Harvey, S., & Goudvis, A. (2017). Strategies that work: Teaching comprehension for
understanding, engagement, and building knowledge, grades K-8, Third edition.
Markham, Ontario: Pembroke Publishers Limited.
Hernandez, M. (2000). Using logic models and program theory to build outcome
accountability. Education and Treatment of Children, 23(1), 24-40. Retrieved
from www.jstor.org/stable/42899601

141
Hoy, W. K., & Miskel, C. G. (2008). School Effectiveness. In M. Ryan (Ed.),
Educational Administration: Theory, Research, and Practice (pp. 299-308). New
York, NY: McGraw-Hill.
Hudson, R. F., Lane, H. B., & Pullen, P. C. (2005). Reading fluency assessment and
instruction: What, why, and how? The Reading Teacher, 58(8), 702-714.
Retrieved from www.jstor.org/stable/20204298
Hulme, C., & Snowling, M. (2011). Children’s reading comprehension difficulties:
Nature, causes, and treatments. Current Directions in Psychological Science,
20(3), 139-142. doi:10.1177/0963721411408673
K12 Academics. (2018). History of reading education in the U.S. Retrieved from
https://www.k12academics.com/reading-education-united-states/history-reading-
education-us
Kemp, N., & Bushnell, C. (2011). Children’s text messaging: abbreviations, input
methods and links with literacy. Journal of Computer Assisted Learning, 27(1),
18-27. doi:10.1111/j.1365-2729.2010.00400.x
Kim, J. S., & White, T. G. (2008). Scaffolding voluntary summer reading for children in
grades 3 to 5: An experimental study. Scientific Studies of Reading, 12(1), 1-23.
Kohn, A. (1993). Punished by rewards: The trouble with gold stars, incentive plans, A’s,
praise, and other bribes. New York, NY: Houghton Mifflin.
Koolstra, C. M., & Van Der Voort, T. H. A. (1996). Longitudinal effects of television on
children’s leisure-time reading: A test of three explanatory models. Human
Communication Research, 23(1), 4-35.

142
Lenski, S. D., & Nierstheimer, S. L. (2002). Strategy instruction from a sociocognitive
perspective. Reading Psychology, 23(2), 127-143.
Lepper, M. R., Corpus, J. H., & Iyengar, S. S. (2005). Intrinsic and extrinsic motivational
orientations in the classroom: Age differences and academic correlates. Journal of
Educational Psychology, 97(2), 184-196. doi:10.1037/0022-0663.97.2.184
Lovitt, T., & Fantasia, K. (1980). Two approaches to reading program evaluation: A
standardized test and direct assessment. Learning Disability Quarterly, 3(4), 77-
87. doi:128.239.99.140
Lundberg, I. (1989). Lack of phonological awareness: A critical factor in development
dyslexia. In C. von Euler, I. Lundberg, & C. Lennerstrand (Eds.), Wenner-Gren
symposium series 54: Brain and reading (pp. 221-231). London, UK: Macmillan.
Malloy, J. A., Marinak, B. A., Gambrell, L. B., & Mazzoni, S. A. (2014). Assessing
motivation to read: The motivation to read profile-revised. The Reading Teacher,
67(4), 273-282. doi:10.1002/TRTR.1215
McGregor, T. (2007). Comprehension connections: Bridges to strategic reading.
Portsmouth, NH: Heinemann.
McKenna, M. C., Kear, D. J., & Ellsworth, R. A. (1995). Children's attitudes toward
reading: A national survey. Reading Research Quarterly, 30(4). 934-956.
doi:10.2307/748205
Metsala, J., Wharton-McDonald, R., Pressley, M., Rankin, J., Mistretta, J., Yokoi, L., &
Ettenberger, S. (1997). Effective primary-grades literacy instruction = Balanced
literacy instruction. The Reading Teacher, 50(6), 518-521.

143
Mielke, P., & Frontier, T. (2012). Keeping improvement in mind. Educational
Leadership, 70(3), 10-13.
Miller, D. (2002). Reading with meaning: Teaching comprehension in the primary
grades. Portsmouth, NH: Stenhouse Publishers.
Mohr, K., Ding, G., Strong, A., Branum, L., Watson, N., Priestley, K.,…Lundstrom, K.
(2017). Reading the past to inform the future: 25 years of The Reading Teacher.
The Reading Teacher, 71(3), 251-264. doi:10.1002/trtr.1636
Morais, J., Cary, L., Alegria, J., & Bertelson, P. (1979). Does awareness of speech as a
consequence of phones arise spontaneously? Cognition, 7(4), 323-331.
doi:10.1016/0010-0277(79)90020-9
Morrow, L. (1992). The impact of a literature-based program on literacy achievement,
use of literature, and attitudes of children from minority backgrounds. Reading
Research Quarterly, 27(3), 250-275. doi:10.2307/747794
The National Academy of Sciences. (1998). Preventing Reading Difficulties in Young
Children. Report of the Commission on Behavioral and Social Sciences and
Education. Retrieved from http://www. nap.edu/read/100067/chapter/6
National Institute of Child Health and Human Development. (2000). Report of the
National Reading Panel. Teaching children to read: An evidence-based
assessment of the scientific research literature on reading and its implications for
reading instruction (NIH Publication No. 00-4769). Washington, DC: U.S.
Government Printing Office.
O’Connor, R. E., Beach, K. D., Sanchez, V. M., Bocian, K. M. & Flynn, L. J. (2015).
Building BRIDGES: A design experiment to improve reading and United States

144
history knowledge of poor readers in eighth grade. Exceptional Children, 81(4),
399-425. doi:10.1177/0014402914563706
O’Connor, R., Swanson, H., & Geraghty, C. (2010). Improvement in reading rate under
independent and difficult text levels: Influences on word and comprehension
skills. Journal of Educational Psychology, 102(1), 1-19. doi:10.1037/a0017488
Otis, N., Grouzet, F. M. E., & Pelletier, L. G. (2005). Latent Motivational Change in an
Academic Setting: A 3-Year Longitudinal Study. Journal of Educational
Psychology, 97(2), 170-183. doi:10.1037/0022-0663.97.2.170
Paul, T., VanderZee, D., Rue, T., & Swanson, S. (1996, October 4). Impact of the
Accelerated Reader technology-based literacy program on overall academic
achievement and school attendance. Paper presented at the National Reading
Research Center Conference on Literacy and Technology for the 21st Century,
Atlanta, GA.
Pavonetti, L. M., Brimmer, K. M., & Cipielewski, J. F. (2003). Accelerated Reader:
What are the lasting effects on the reading habits of middle school students
exposed to Accelerated Reader in elementary grades? Journal of Adolescent &
Adult Literacy, 46(4), 300-311.
Pflaum, S. W., & Bishop, P. A. (2004). Student perceptions of reading engagement:
Learning from the learners. Journal of Adolescent & Adult Literacy, 48(3), 202-
213. doi:10:1598/JAAL.48.3.2
Pilonieta, P. (2010). Instruction of research-based comprehension strategies in basal
reading programs. Reading Psychology, 31(2), 150-175.
doi:10.1080/02702710902754119

145
Porter, S. R. (2004). Raising response rates: What works? New Directions for
Institutional Research, 2004(121), 5-21. doi:10.1002/ir.97
Praslova, L. (2010). Adaptation of Kirkpatrick’s four level model of training criteria to
assessment of learning outcomes and program evaluation in Higher Education.
Educational Assessment, Evaluation and Accountability, 22(3), 215-225.
doi:10.1007/s11092-010-9098-7
Provini, C. (2011). Jump-start your school’s program evaluation: Part I. Education
World.
Quirk, M., Schwanenflugel, P., & Webb, M. (2009). A short-term longitudinal study of
the relationship between motivation to read and reading fluency skill in second
grade. Journal of Literacy Research, 41(2), 196-227.
doi:10.1080/10862960902908467
Rasinski, T. (2006). Reading fluency instruction: Moving beyond accuracy, automaticity,
and prosody. The Reading Teacher, 59(7), 704-706. Retrieved from
www.jstor.org/stable/20204407
Ravitch, D. (2007). Balanced literacy. In J. Houtz (Ed.), Edspeak: A glossary of
education terms, phrases, buzzwords, and jargon. Alexandria, VA: ASCD.
Reutzel, D., Child, A., Jones, C., & Clark, S. (2014). Explicit instruction in core reading
programs. The Elementary School Journal, 114(3), 406-430. doi:10.1086/674420
Reutzel, D. R., Fawson, P. C., & Smith, J. A. (2008). Reconsidering silent sustained
reading (SSR): An exploratory study of scaffolded silent reading (ScRC). Journal
of Educational Research, 102(1), 37-50. Retrieved from
www.jstor.org/stable/27548262

146
Rideout, V. (2014). Children, teens, and reading: A Common Sense Media research
brief. Retrieved from Common Sense Media website:
https://www.commonsensemedia.org/research/children-teens-and-reading
Robinson, H. M. (1955). Educational writings: Reviews and book notes [Review of the
book Why Johnny can’t read and what you can do about it, by R. Flesch]. The
Elementary School Journal, 56(2), 91-92. Retrieved from
www.jstor.org/stable/999438
Ryan, R. M., & Deci, E. L. (2000). Self-determination theory and the facilitation of
intrinsic motivation, social development, and well-being. American Psychologist,
55(1), 68-78. doi:10.1037/0003-066X.55.1.68
Schiefele, U., & Schaffner, E. (2016). Factorial and construct validity of a new
instrument for the assessment of reading motivation. Reading Research
Quarterly, 51(2), 221-237. doi:10.1002/rrq.134
Schmidt, F., & Retelsdorf, J. (2016). A new measure of reading habit: Going beyond
behavioral frequency. Frontiers in Psychology, 7(1364).
doi:10.3389/fpsyg.2016.01364
Shaaban, K. (2006). An initial study of the effects of cooperative learning on reading
comprehension, vocabulary acquisition, and motivation to read. Reading
Psychology, 27(5), 377-403. doi:10.1080/02702710600846613
Snow, C. E., Burns, M. S., & Griffin, P. (Eds.). (1998). Preventing reading difficulties in
young children. Washington, DC: National Academy Press.

147
Soenens, B., & Vansteenkiste, M. (2005). Antecedents and outcomes of self-
determination in 3 life domains: The role of parents’ and teachers’ autonomy
support. Journal of Youth and Adolescence, 34(6), 589-604.
Spiegel, D. L. (1998). Silver bullets, babies, and bath water: Literature response groups in
a balanced literacy program. The Reading Teacher, 52(2), 114-124. Retrieved
from www.jstor.org/stable/20202025
Stahl, S. A., McKenna, M. C., & Pagnucco, J. R. (1994). The effects of whole language
instruction: An update and a reappraisal. Educational Psychologist, 29(4), 175-
185. doi: 10.1207/s15326985ep2904_1
Stanovich, K. E., Nathan, R. G., & Zolman, J. E. (1988). The developmental lag
hypothesis in reading: Longitudinal and matched reading-level comparisons.
Child Development, 59(1), 71-86. doi:10.2307/1130390
Strauss, V. (2012, March 9). No Child Left Behind’s effect on literacy. The Washington
Post. Retrieved from https://www.washingtonpost.com/
Stufflebeam, D. L. (1971, February). The relevance of the CIPP evaluation model for
educational accountability. Annual Meeting of the American Association of
School Administrators, Atlantic City, NJ.
Stutz, F., Schaffner, E., & Schiefele, U. (2017). Measurement invariance and validity of a
brief questionnaire on reading motivation in elementary students. Journal of
Research in Reading, 40(4), 439-461. doi:10.1111/1467-9817.12085
School University Research Network at The College of William & Mary, Visible
Teaching, Assessment, Learning and Leading. (2011). Retrieved from
https://education.wm.edu/centers/sli/surn/SURN%20Past%20Initiatives/index.php

148
Taboada, A., Tonks, S., Wigfield, A., & Guthrie, J. (2009). Effects of motivational and
cognitive variables on reading comprehension. Reading and Writing, 22(1), 85-
106. doi:10.1007/s11145-008-9133-y
Tinker, M. A. (1943). Recent trends in reading instruction. The Journal of Educational
Research, 36(6), 468-480. Retrieved from www.jstor.org/stable/27528381
University of Virginia. (2003). PALS: Phonological Awareness Literacy Screening.
Retrieved from https://pals.virginia.edu/public
Unrau, N., & Schlackman, J. (2006). Motivation and its relationship with reading
achievement in an urban middle school. Journal of Educational Research, 100(2),
81-101. Retrieved from www.jstor.org/stable/27548165
U.S. Department of Labor, Bureau of Labor and Statistics. (2017, June 27). American
time use survey: 2016 results [Press Release]. Retrieved from
https://www.bls.gov/news.release/archives/atus_06272017.pdf
Valencia, S., Hiebert, E., & Kapinus, B. (1992). National Assessment of Educational
Progress: What do we know and what lies ahead? Reading Teacher, 45(9), 730-
734.
Vandewater, E. A., Bickham, D. S., Lee, J. H., Cummings, H. M., Wartella, E. A., &
Rideout, V. J. (2005). When the television is always on: Heavy television
exposure and young children’s development. American Behavioral Scientist,
48(5), 562-577. doi:10.1177/0002764204271496
Vellutino, F. R. (1991). Introduction to three studies on reading acquisition: Convergent
findings on theoretical foundations of code-oriented versus whole-language

149
approaches to reading instruction. Journal of Educational Psychology, 83(4), 437-
443. doi:10.1037/0022-0663.83.4.437
Verheijen, L. (2013). The effects of text messaging and instant messaging on literacy.
English Studies, 94(5), 582-602. doi:10.1080/0013838X.2013.795737
Virginia Department of Education. (2010a). English Standards of Learning curriculum
framework 2010. Retrieved from
http://www.doe.virginia.gov/testing/sol/standards_docs/english/index.shtml
Virginia Department of Education. (2010b). Grade 3 Reading: Standards of Learning test
blueprint. Retrieved from
http://www.doe.virginia.gov/testing/sol/standards_docs/english/index.shtml
Virginia Department of Education. (2010c). Grade 4 Reading: Standards of Learning test
blueprint. Retrieved from
http://www.doe.virginia.gov/testing/sol/standards_docs/english/index.shtml
Virginia Department of Education. (2010d). Grade 5 Reading: Standards of Learning test
blueprint. Retrieved from
http://www.doe.virginia.gov/testing/sol/standards_docs/english/index.shtml
Virginia Department of Education. (2018). Standards of Learning (SOL) & testing:
English. Retrieved from
http://www.doe.virginia.gov/testing/sol/standards_docs/english/index.shtml
Walberg, H. J. (1996). U.S. schools teach reading least productively. Research in the
Teaching of English, 30(3), 328-343. Retrieved from
https://www.jstor.org/stable/40171368

150
Wang, J. H., & Guthrie, J. T. (2004). Modeling the effects of intrinsic motivation,
extrinsic motivation, amount of reading, and past reading achievement on text
comprehension. Reading Research Quarterly, 39(2), 162-186.
doi:10.1598/RRQ.39.2.2
Wasik, B. A., & Slavin, R. E. (1993). Preventing early reading failure with one-to-one
tutoring: A review of five programs. Reading Research Quarterly, 28(2), 178-
200. doi:10.2307/747888
Watkins, M., & Coffey, D.Y. (2004). Reading motivation: Multidimensional and
indeterminate. Journal of Educational Psychology, 96(1), 162-186.
doi:10.1037/0022-0663.96.1.110
What Does a 'Balanced Literacy Approach' Mean? Topics in Early Reading Coherence.
(n.d.) >The Free Library. (2014). Retrieved
from https://www.thefreelibrary.com/What+Does+a+%22Balanced+Literacy+Ap
proach%22+Mean%3f+Topics+in+Early...-a0291191556
Wigfield, A., & Guthrie, J. T. (1997). Relations of children’s motivation for reading to
the amount and breadth of their reading. Journal of Educational Psychology,
89(3), 430-432. doi:10.1037/0022-0663.89.3.420
Wood, C., Kemp, N., Waldron, S., & Hart, L. (2014). Grammatical understanding,
literacy and text messaging in school children and undergraduate students: A
concurrent analysis. Computers & Education, 70, 281-290.
doi:10.1016/j.compedu.2013.09.003
Wood, C., Meachem, S., Bowyer, S., Jackson, E., Tarczynski-Bowles, M., & Plester, B.
(2011). A longitudinal study of children’s text messaging and literacy

151
development. British Journal of Psychology, 102(3), 431-442.
doi:10.1111/j.2044-8095.2010.02002.x
Yarbrough, D. B., Shulha, L. M., Hopson, R. K., & Caruthers, F. A. (2011). The program
evaluation standards: A guide for evaluators and evaluation users (3rd ed.).
Washington, DC: Sage.
Yodis, M. (2016). Educational leaders' decisions, practices, and policies influencing K-2
summer reading programs (Doctoral dissertation). Retrieved from ProQuest
Dissertations and Theses database. (10242979)
Zebroff, D. (2018). Youth texting: Help or hindrance to literacy? Education and
Information Technologies, 23(1), 341-356. doi:10.1007/s10639-017-9606-1
Zhou, N., & Yadav, A. (2017). Effects of multimedia story reading and questioning on
preschoolers’ vocabulary learning, story comprehension and reading engagement.
Education Tech Research Development, 65(6), 1523-1545. doi:10.1007/s11423-
017-9533-2

152
The College of William and Mary
School of Education
PERSONAL INFORMATION
Jami Beth Clements
EDUCATION
2020 Doctorate of Philosophy, The College of William & Mary, Williamsburg, VA
Concentration: Educational Policy, Planning, and Leadership, K-12 Educational
Leadership
2008 Master of Business Administration, Arizona State University, Tempe, AZ
2002 Bachelor of Science (magna cum laude), N. C. State University, Raleigh, NC
Major: Biological Sciences
ACADEMIC POSITIONS
Principal, Benjamin Franklin Middle School, July 2019-Present
Principal, Edward W. Wyatt Middle School, July 2016-June 2019
Assistant Principal, Edward W. Wyatt Middle School, September 2014-June 2016
Secondary Science Teacher, Greensville County High School, August 2008-
September 2014
Secondary Science Teacher, E.E. Smith High School, July 2004-June 2006