Embed Size (px)
Citation preview
Marquette Universitye-Publications@Marquette
Finance Faculty Research and Publications Finance, Department of
9-1-2006
The Impact of Local Predatory Lending Laws onthe Flow of Subprime CreditGiang HoFederal Reserve Bank of St. Louis
Anthony Pennington-CrossMarquette University, [email protected]
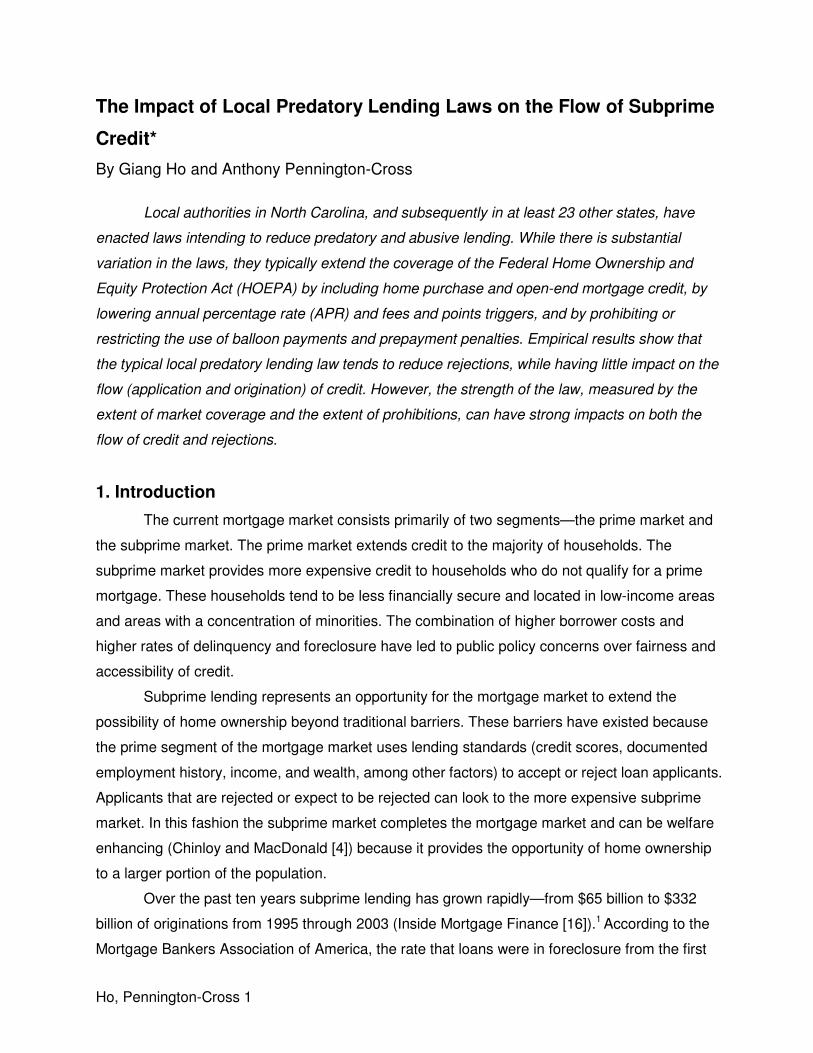
Accepted version. Journal of Urban Economics, Vol. 60, No. 2 (September 2006): 210-228. DOI. ©2006 Elsevier. Used with permission.NOTICE: this is the author’s version of a work that was accepted for publication in Journal of UrbanEconomics. Changes resulting from the publishing process, such as peer review, editing, corrections,structural formatting, and other quality control mechanisms may not be reflected in this document.Changes may have been made to this work since it was submitted for publication. A definitive versionwas subsequently published in Journal of Urban Economics, VOL 60, ISSUE 2, September 2006, DOI.Anthony Pennington-Cross was affiliated with the Federal Reserve Bank of St. Louis at the time ofpublication.
Ho, Pennington-Cross 1
The Impact of Local Predatory Lending Laws on the Flow of Subprime
Credit*
By Giang Ho and Anthony Pennington-Cross
Local authorities in North Carolina, and subsequently in at least 23 other states, have
enacted laws intending to reduce predatory and abusive lending. While there is substantial
variation in the laws, they typically extend the coverage of the Federal Home Ownership and
Equity Protection Act (HOEPA) by including home purchase and open-end mortgage credit, by
lowering annual percentage rate (APR) and fees and points triggers, and by prohibiting or
restricting the use of balloon payments and prepayment penalties. Empirical results show that
the typical local predatory lending law tends to reduce rejections, while having little impact on the
flow (application and origination) of credit. However, the strength of the law, measured by the
extent of market coverage and the extent of prohibitions, can have strong impacts on both the
flow of credit and rejections.
1. Introduction
The current mortgage market consists primarily of two segments—the prime market and
the subprime market. The prime market extends credit to the majority of households. The
subprime market provides more expensive credit to households who do not qualify for a prime
mortgage. These households tend to be less financially secure and located in low-income areas
and areas with a concentration of minorities. The combination of higher borrower costs and
higher rates of delinquency and foreclosure have led to public policy concerns over fairness and
accessibility of credit.
Subprime lending represents an opportunity for the mortgage market to extend the
possibility of home ownership beyond traditional barriers. These barriers have existed because
the prime segment of the mortgage market uses lending standards (credit scores, documented
employment history, income, and wealth, among other factors) to accept or reject loan applicants.
Applicants that are rejected or expect to be rejected can look to the more expensive subprime
market. In this fashion the subprime market completes the mortgage market and can be welfare
enhancing (Chinloy and MacDonald [4]) because it provides the opportunity of home ownership
to a larger portion of the population.
Over the past ten years subprime lending has grown rapidly—from $65 billion to $332
billion of originations from 1995 through 2003 (Inside Mortgage Finance [16]).1 According to the
Mortgage Bankers Association of America, the rate that loans were in foreclosure from the first
Ho, Pennington-Cross 2
quarter of 1998 to the third quarter of 2004 rose by more than 400 percent for subprime loans
while declining by approximately 25 percent for prime loans. In addition, during the same time
period anecdotal evidence of predatory lending in the subprime market was gaining more public
and regulatory attention.2 Therefore, the welfare benefit associated with increased access to
credit is believed to have been reduced by some unscrupulous lending in the subprime mortgage
market.
In response to public concerns of predation in the subprime mortgage market, federal
regulations generated under the Home Ownership and Equity Protection Act (HOEPA) restrict
some types of high-cost lending. Many states, cities, and counties have used HOEPA as a
template and have extended the restrictions on credit to an even broader class of mortgages.
These restrictions include limits on allowable prepayment penalties and balloon payments,
prohibitions of joint financing of various insurance products (credit, life, unemployment, etc.), and
requirements that borrowers participate in loan counseling.
By introducing geographically defined predatory lending laws, policymakers have
conducted a natural experiment with well defined control and treatment groups. Since state
boundaries reflect political and not economic regions, we can compare mortgage market
conditions in states with a law in effect3 (the treatment group) to those in neighboring states
currently without a predatory lending law (the control group). However, instead of examining
whole states we focus on households that are geographically close to each other (border
counties) and as a result are in similar labor and housing markets.
Data at the individual loan level are used to identify the impact of local predatory lending
laws on subprime applications, originations, and rejections. We create an index that measures
the strength of the local laws. This index measures the increase in market coverage and the
extent that certain lending practices and mortgage types are restricted. We find that the strength
of the law can have strong impacts on both the flow of credit and rejections. In fact, variation in
the law design can create substantial heterogeneity in the response of the mortgage market to
local predatory lending laws, and therefore the findings of previous research on the North
Carolina law cannot be generalized to other states.
This paper provides at least three contributions to the literature: (i) a wide variety of local
predatory lending laws are characterized, (ii) the question of whether the market response in
North Carolina (reduce flow of credit) was typical or atypical is examined, and (iii) the importance
of the strength of the law on the flow of credit is examined.
Ho, Pennington-Cross 3
2. Potential Impacts of Predatory Lending Laws
Assume that a predatory lending law is introduced that imposes restrictions on subprime
mortgage lenders in terms of allowable loan types, required lending practices, and information
disclosures. By reducing the menu of available loan types some borrowers will have a more
difficult time qualifying for a loan. In particular, prepayment penalties and balloons mitigate the
debt to income requirement by reducing debt servicing (lower periodic interest payments and a
slower amortization schedule). Therefore, if profitable and complying substitutes for these loan
characteristics cannot be identified, fewer loans will be originated and lending standards will be
tighter.
In addition, if a law cannot perfectly identify predatory loans the law will also restrict some
legitimate lending. While beyond the scope of this paper, in order to determine if the law will have
a net positive impact requires weighing the benefits of stopping predation versus the cost of
denying access to legitimate high cost credit.
The impact of the law that requires tighter lending standards on the number of
applications is a little more indirect. If households apply for a loan regardless of the probability of
the application being accepted, a tightening of lending standards will have no impact on
application rates. In contrast, if there is an application cost (time or money) potential applicants
should be deterred from applying when the chance of being accepted is low.4 Therefore, we
should expect that a tightening of subprime lending standards would be associated with a
reduction in the number of subprime applications. In addition, the impact of the law on the
rejection rate is indeterminate and will depend on the shape of the application function
(probability of applying) and its responsiveness to changing lending standards.5
However, in a market with some dishonest loans, all borrowers must exert extra effort
and time to screen the lender and loan documents to sort the honest from the dishonest loan
offers. This effort represents extra costs (transaction costs) for the borrowers (Akerlof [1]) and as
a result the uncertainty in loan quality can deter potential applicants from applying. If the
introduction of the predatory lending law removes or heavily regulates dishonest loans there
could be a reduction in the fear of being taken advantage of and a lessening in the need to
expend effort sorting honest loans from dishonest loans. Therefore, in markets where potential
applicants are deterred from applying due to fears of predation, the impact of a predatory lending
law could be neutral or could even increase the rate of subprime application and origination.
3. Literature on Predatory Lending Laws
Research on predatory lending laws has been primarily focused on the impact of the
Ho, Pennington-Cross 4
North Carolina law and found that the law significantly reduced the flow of credit. Various
methods and data sets have been used for analysis. Each data source has its different set of
strengths and weaknesses. For example, Quercia, Stegman, and Davis [20,21] and Elliehausen
and Staten [6] use data sources (proprietary loan information6 and asset backed securities
information7) that provide a rich set of information on product types. However, these data
sources only cover certain segments of the subprime mortgage market. Therefore, while these
data may be useful for understanding changes in product types and interest rates they are less
useful in helping to understand the impact of the predatory lending laws on the subprime market
as a whole and the volume of credit in particular. In contrast, research by Ernst, Farris, and Stein
[7] and Harvey and Nigro [11,12] use data from the Home Mortgage Disclosure Act (HMDA)
which provides extensive market coverage, but has little information on product types. Despite
the lack of detailed loan information, for the purpose of volume comparisons as conducted in this
paper HMDA is the preferred source because of its better market coverage.
In addition, prior studies compare mortgage market conditions in North Carolina to
neighboring states, regions (groups of states), or all of the US and conclude that differences in
mortgage types or volume of credit is due to the predatory lending law. However, the use of large
geographic areas may make it difficult to separate out the impact of the law versus unobserved
regional shifts. Therefore, it is preferable to limit the sample to locations that have more similar
labor and housing markets.
4. National Lending Restrictions—Home Ownership and Equity Protection
Act (HOEPA)
State and local predatory lending laws typically follow the structure of national predatory
lending regulations as defined by HOEPA. Therefore, before proceeding to the discussion of
local predatory laws it is instructive to examine HOEPA first. HOEPA and the regulations
promulgated under it define a class of loans that are given special consideration.8
HOEPA-covered loans (loans where HOEPA applies) include only closed-end9 home equity
loans that meet annual percentage rate (APR) and finance fee triggers. Home purchase loans
and other types of lending backed by a home, such as lines of credit, are not covered by HOEPA.
In the 2002 version, HOEPA protections were triggered in one of two ways:
(i) if the loan’s APR exceeded the rate for Treasury securities of comparable maturity by 8
percentage points or more on the first lien and 10 percentage points or higher on
subordinate liens, or

Ho, Pennington-Cross 5
(ii) if finance charges, including points and fees paid at closing for optional insurance
programs and other debt protection programs, were greater than 8 percent of the loan
amount or a fixed $480 amount indexed annually to the consumer price index.
For HOEPA-covered loans, creditors were not allowed to provide short-term balloon
notes, impose prepayment penalties greater than five years, use non-amortizing schedules,
make no-documentation loans, refinance loans into another HOEPA loan in the first 12 months,
or impose higher interest rate upon default. In addition, creditors were not allowed to habitually
engage in lending that did not take into account the ability of the consumer to repay the loan.
5. Regional Restrictions—State and Local Predatory Lending Laws
A number of states and local municipalities have sought to impose restrictions on
predatory lending that reach further than HOEPA and Regulation Z. Ho and Pennington-Cross
[13] provide a detailed description of each law in their Appendix A.10
Beginning with North Carolina in 1999, at least 23 states have passed predatory lending
laws that were in effect by the end of 2004. North Carolina—the first state to enact predatory
lending restrictions—extended HOEPA to include both closed-end and open-end mortgages that
satisfy the conventional conforming loan limit (loans small enough to be purchased by Fannie
Mae and Freddie Mac and therefore not considered part of the jumbo market). While the North
Carolina law did not adjust the APR triggers, the points and fees triggers were reduced from the
HOEPA 8 percent to 5 percent for loans under $20,000. For loans $20,000 or larger, the same 8
percent trigger is used or $1000, whichever is smaller. The North Carolina law also prohibits
prepayment penalties and balloon payments for most covered loans. However the law does
extend HOEPA restrictions by prohibiting the financing of credit life, disability, unemployment, or
other life and insurance premiums into the mortgage.
While most states followed the North Carolina example by expanding the coverage and
restrictions associated with HOEPA, there is substantial variation in the laws. In an attempt to
quantify the differences in the local laws, we created an index. The higher the index, the stronger
the law is. In addition, the index can be broken down into two components. The first component
reflects the extent that the law extends market coverage beyond HOEPA. The second
component reflects the extent that the law restricts or requires specific practices on covered
loans. Table 1 summarizes the construction of the law index. The full index is the sum of all the
assigned points as defined in Table 1 and the coverage and restrictions indexes are the sum of
points assigned in each subcategory.

Ho, Pennington-Cross 6
The coverage category includes measures of loan purpose, APR first lien, APR higher
liens, and points and fees. In general, if the law does not increase coverage beyond HOEPA it is
assigned zero points. Higher points are assigned if the coverage is broader. In each category the
highest points are assigned when all loans are covered. For example, points assigned for loan
purpose range from zero to four and the highest point total (four) indicates that the law covers all
loan purposes. The points assigned for extending first lien APR trigger ranges from zero to three
depending on how low the trigger is. For example, 7 percent triggers are assigned one point
while 6 percent triggers are assigned two points. In addition, laws that do not have a first lien
trigger are assigned three points. A similar scheme is used to assigned points for higher lien
triggers and the points and fees triggers. In general, if the law includes multiple triggers within a
category the most stringent trigger is used to assign the points.11
The restrictions index includes measures of prepayment penalty restrictions, balloon
restrictions, counseling requirements, and restrictions on mandatory arbitration. If the law does
not require any restrictions then zero points are assigned. Higher points indicate more
restrictions. For example, laws that do not restrict prepayment penalties are assigned zero points,
while laws that prohibit all prepayment penalties are assigned four points. Laws that prohibit or
restrict the practice more quickly are assigned higher points. For balloon restriction, the points
vary from zero for no restrictions to four when the law prohibits all balloons.12 The last two
restrictions measure whether the law requires counseling before the loan is originated or restricts
fully or partially mandatory arbitration clauses.
Table 2 reports the calculated full (law) index, the coverage index, and the restrictions
index for each law identified as being in effect by the end of 2004. The average law index is
10.16, varying from 4 in Florida, Maine, and Nevada to 17 in New Mexico and Cleveland. The
coverage index and the restrictions index have a mean just over 5. The coverage and restrictions
indexes are only modestly correlated at 0.19. This indicates that, while laws that increase
coverage more also tend to increase the restrictions more, the relationship is very noisy.
Therefore, there are laws that increase coverage without increasing restrictions (Nevada) and
other states that extend restrictions more than coverage (Florida).
Scaled indexes are created and reported in Table 3. This is necessary because the
magnitude of each subcomponent of the index implicitly weights the index so that it represents
some subcomponents more than others. To help correct for this, each subcomponent number is
scaled so that the maximum value equals one (actual/max). It is then divided by the category
mean value [(actual/max)/mean(actual/max)] so that each category has a mean of one.
Therefore, the scaled index equally reflects each subcomponent in terms of marginal impacts

Ho, Pennington-Cross 7
and the level of the index. Since eight categories are used to create the law index the mean
value of the index is by design eight. Zero also retains the appealing intuition of reflecting no
increase in law strength beyond HOEPA. The scaled law index varies from 17.16 to 1.47 and the
scaled and original law index are highly correlated (0.87).
6. Data Design, Identification, and Probit Estimation
To see whether the experience in North Carolina as examined in prior literature is typical
for all local predatory lending laws, we provide a more complete analysis using a pooled sample
of local laws. We use individual loan data provided in HMDA in conjunction with the HUD
subprime lenders list.13 Any loan application or origination associated with a lender on the list is
identified as a subprime loan. All other loans are treated as not-subprime, that is, as a
conventional loan. Because it is impossible to fully characterize borrower and location
characteristics, the sample is reduced to include only counties at state borders, where labor and
housing market conditions are likely more similar.14 In particular, for the treatment group we use
counties that lie in states with a predatory lending law in place and adjacent to a state without
such a law. The control group includes counties in neighboring states that border the treatment
state and do not have a predatory lending law in effect.15 This contrasts with other studies
(Harvey and Nigro [12], Elliehausen and Staten [6]) that have used whole states or regions to
define both control and treatment groups. This approach should help to increase the
comparability of the treatment group and the control group because they are geographically
closer and, as a result, likely to be more economically similar than full state and region
comparisons. In addition, to help remove the impact of any temporary reaction to each law and
any market reaction prior to the law coming into effect, only the year before and the year after the
law is in effect are included in the sample. This sampling procedure and HMDA availability
reduce the sample to ten local predatory lending laws: California, Connecticut, Florida, Georgia,
Maryland, Massachusetts, North Carolina, Ohio, Pennsylvania, and Texas.
6.1. Identification and Estimation Strategy
To identify the impact of a local predatory lending law, we employ the
difference-indifferences approach. By including indicators of location and the time period when
the law becomes in effect, we can interpret the difference between the treatment and control
group in the post-legislation time period as reflecting the impact of the law on mortgage market
conditions. In addition, we also control for various borrower and location characteristics. Similar
to Harvey and Nigro [11,12], three separate dependent variables (three outcomes) are tested for

Ho, Pennington-Cross 8
impacts of local predatory lending laws—the probability of applying for a subprime loan relative
to all (prime and subprime) applications, the probability of originating a subprime loan relative to
all originations, and the probability of being rejected on a subprime application. The base model
is specified in Eq. (1) as:
�������� �� ����������� � �������� ��
����� ������� ������
����
∑ ��"#��$ ��������� �%&�''���'� �(�����)��� *� , (1)
where ), �, and , index respectively the individual loans, the time period, and law samples,
Ineffect indicates the time period and location where a law is effective, Law indicates that the
loan is in a location that will eventually have a law, Postlaw indicates that it is the time period
when the law is in effect, Sample indicates the law sample (control and treatment), Borrower
represents various borrower characteristics, Location represents various location characteristics,
and *� represents an identically and independently distributed random error term. For each
outcome (application, origination, or rejection), the dependent variable is binary. We estimate Eq.
(1) using the probit specification, which limits the estimated probabilities between zero and one
and assumes a standard normal probability distribution.16
The key variable of interest is Ineffect. This variable indicates that a loan is in a location
when and where a predatory lending law is effective. It is defined as zero before the law is
effective, even in the treatment location, and is always zero in the control location. Ineffect is
constructed by interacting the variable Law, which indicates treatment groups, and Postlaw,
which indicates the time period the treatment is in effect. Therefore, Law identifies the location
specific fixed effect and Postlaw identifies the time specific effects common to the treatment and
control locations. Our estimation sample consists of ten local law samples each of which includes
loans in the treatment location and the control location.17 The variables Law and Postlaw are
interacted with each law sample, with the North Carolina sample excluded as the reference
group. The impact of the average law can then be interpreted directly from the Ineffect variable.
Given the results from prior research we would expect Ineffect to be negative for the application
and origination outcome and potentially insignificant for the rejection outcome.
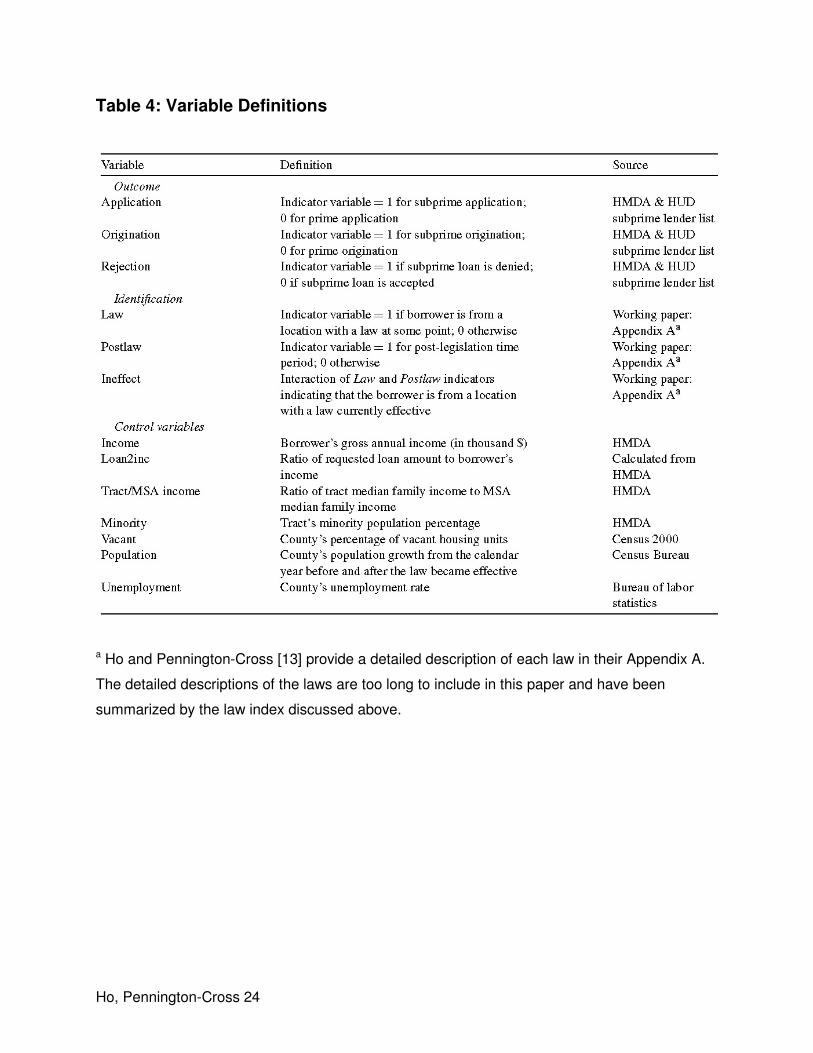
Following Harvey and Nigro [11,12] and Elliehausen and Staten [6], we include a series
of control variables associated with the location of the loan (Location) and the borrower
(Borrower) because they may impact the demand or supply of subprime credit. Table 4 provides
definitions of variables and data sources. In general we expect that borrowers will be more likely
to use/apply for subprime loans (and perhaps be rejected by subprime lenders) in locations with

Ho, Pennington-Cross 9
difficult economic conditions and when borrowers have lower income or are in minority areas
(Calem, Gillen, and Wachter [3] and Pennnington-Cross [18]). Location characteristics are
proxied by the Census tract’s income relative to metropolitan area income, the percent of
minority population in the tract, the county unemployment rate, housing vacancy rate, and
population growth rate. Borrower characteristics are proxied by borrower income and the
loan-to-income ratio. In general, we expect that applicants with more income relative to their loan
amount will have an easier time meeting prime underwriting requirements and therefore should
be less likely to apply for or receive a subprime loan. One important caveat to this analysis is that
the borrower’s credit history or credit score, which has been shown to be a very important
determinant of mortgage performance for both subprime and prime loans (Pennington-Cross
[19]), is not reported in the HMDA data and therefore cannot be included in this analysis.
Table 5 provides descriptive statistics of the variables by outcome. The application
sample includes over 590,000 prime and subprime loan applications; the origination sample
includes over 390,000 prime and subprime originations; and the rejection sample includes over
89,000 subprime applications, which are either accepted or rejected.18 Just over 20 percent of
the applications were subprime, while only 9.7 percent of the originations were subprime.
Consistent with the relative magnitude of applications and originations, the average rejection rate
is very high for our sample of subprime loans: 42.9 percent. The borrowers and applicants
typically have loans approximately twice the size of their income. In addition, as expected, the
income of subprime applicants (rejection sample includes rejects and accepts of subprime loans
only) is substantially lower than for the overall sample (application and origination samples
include both subprime and prime loans). Subprime applications also come from census tracts
with a higher concentration of minority households. The law sample dummy variables indicate
that the Maryland sample is the largest proportion of the sample and the Texas sample is the
smallest.
6.2. Base Model Results
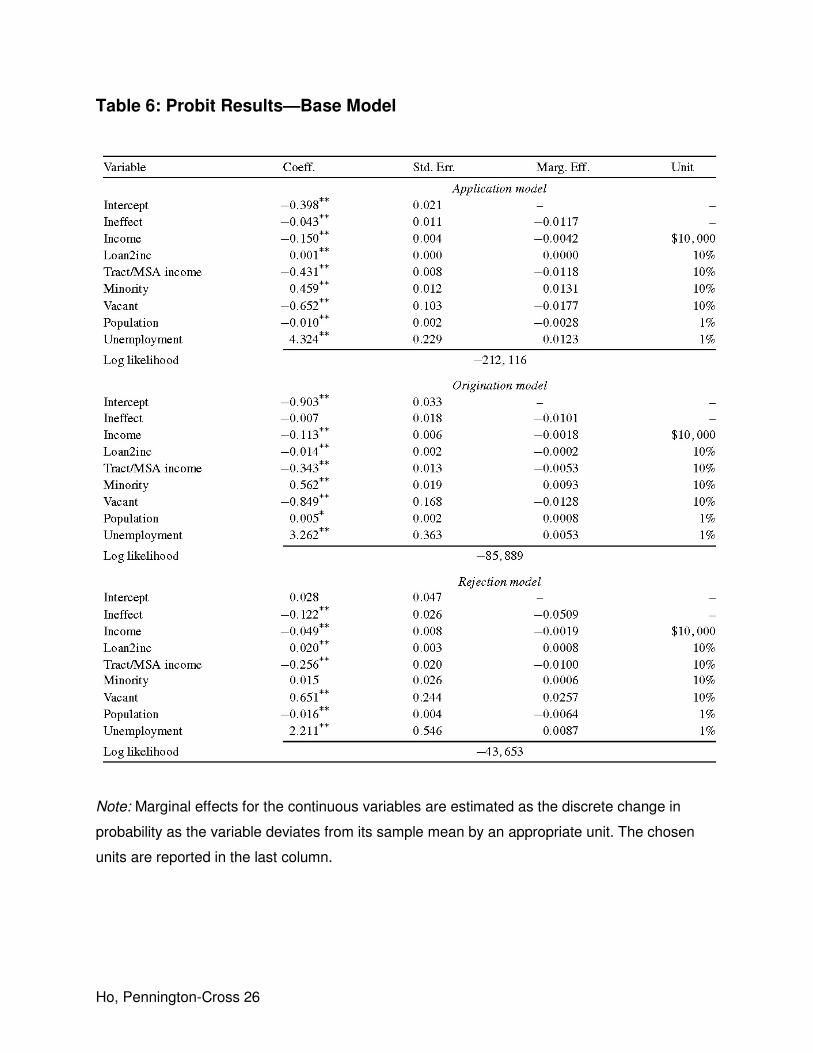
We estimate the model specified in Eq. (1) using maximum likelihood. Table 6 provides
the estimated coefficients, the standard error of the estimates, and the marginal impact of each
variable at a specified interval and evaluated at the mean of all other variables. Results are
reported for each outcome (application, origination, rejection).
The main variable of interest is Ineffect. This coefficient indicates whether the introduction
of the law has had any impact on the application, origination, or rejection of subprime loans on
average. The coefficient estimates are negative and significant at the 1 percent level in the

Ho, Pennington-Cross 10
application equation and rejection equation, and insignificantly different from zero in the
origination equation. The marginal impacts can be interpreted as a percentage point change
from the mean predicted probability. Therefore, the average impact of a local predatory lending
law, using the variable Ineffect, is a reduction of 5.1 percentage points in the probability of being
rejected (mean = 42.9 percent), and a reduction of 1.2 percentage points in the probability of
applying (mean = 20.5 percent).19 Therefore, the average law is associated with only a small or
statistically insignificant change in the flow of credit (apply or originate), but with a substantial
reduction in the probability of being rejected on a subprime application.
Results for other control variables largely meet expectations. Location, borrower, and
mortgage characteristics indicting economic stress are positively associated with the probability
of applying for a subprime loan. For instance, subprime applications are positively associated
with lower borrower income, higher loan-to-income ratios, lower-income census tracts, higher
concentrations of minority populations, lower population growth rates, and higher unemployment
rates. However, subprime applications are negatively associated with higher vacancy rates. This
may partly reflect the need of many subprime applications to have substantial equity in their
home to compensate for weak credit history.
The results for originations are very similar to the application results. However, higher
vacancy rates, lower population growth rates, and higher loan-to-income ratios are all negatively
associated with subprime origination probabilities. Again, the vacancy results may indicate the
need for housing equity in the underwriting of subprime loans to compensate for other
weaknesses in the loan application. In addition, consistent with the population growth results,
Pennington-Cross [18] found that subprime loans were a larger part of the mortgage market in
locations where economic conditions were stressful but improving. Coefficient estimates for the
rejection equation also show that in general more adverse economic conditions are all
associated a higher probability of rejection.
Results for the time and location indicators and law sample dummy variables are not
presented to conserve space. As expected, coefficient estimates differ widely in sign and
magnitude because they capture the prevailing probabilities in various time periods and locations.
For example, the Law coefficients in the application equation, which indicate treatment locations,
range from −0.19 (Texas sample) to 0.66 (California sample).
6.3. Results—Strength of the Laws
While the average law may have only modest impacts on the flow of credit, it may be that
relatively more stringent laws may have a larger impact. In general it is expected that stronger
Ho, Pennington-Cross 11
laws should be associated with larger reductions in applications and originations due to tighter
lending standards. In addition, stronger laws may reduce rejections by deterring marginal
applications or through increased screening by lenders to ensure law compliance.
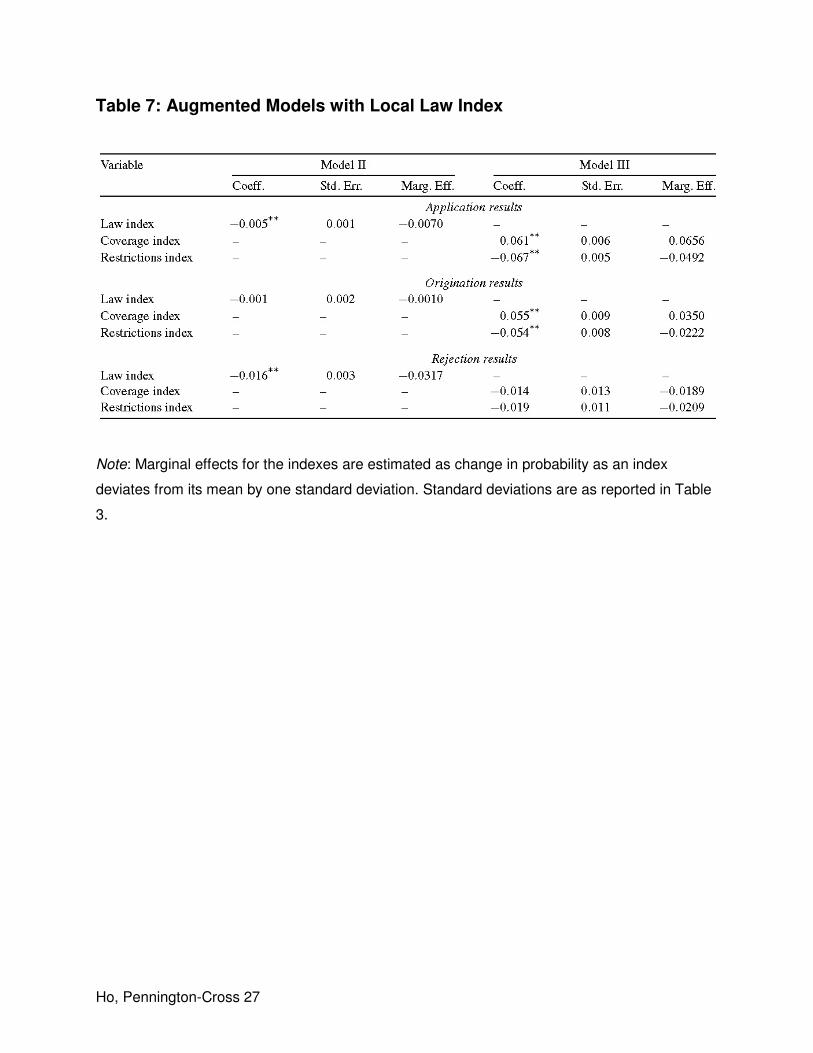
To gauge the potential relevance of a law’s strength, we estimated two additional models.
Model II replaces the Ineffect variable with the scaled law index as an explanatory variable, and
Model III replaces the full law index with the disaggregated law indexes along the dimensions of
coverage and restrictions. The results (coefficient, standard error, and marginal effects) are
reported in Table 7.20
In Model II, the coefficient estimates indicate that stronger laws are associated with lower
probabilities of applying for a subprime loan and being rejected on a subprime application.
However, law strength had no impact on the probability of originating a subprime loan. Again, the
magnitude of the impact on the probability of applying is very small. For example the marginal
impact, measured by a one-standard-deviation increase in the index from the mean, is only −0.7
percentage points in the application equation. In contrast, the marginal impact is much larger for
rejection (−3.17 percentage points). This is highlighted in Fig. 1, which plots the change in the
probability of the outcome (apply, originate, and reject) relative to the strength of the law.
The strength of the law can also be measured along the dimensions of coverage and
restrictions. If appropriate substitutes cannot be found, more restrictions on allowable lending
should lead to less lending because lenders are required to tighten lending standards to comply
with the law. Therefore, originations should be lower for stronger laws and likely applications will
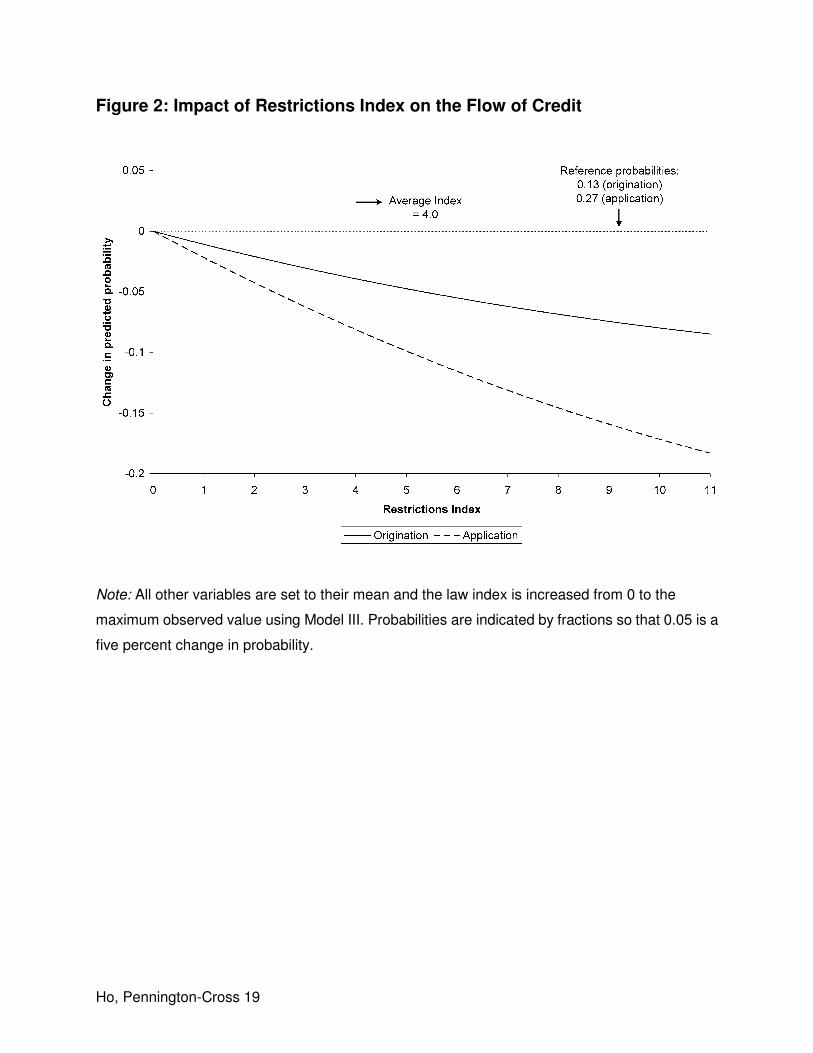
be deterred due to the reduced availability of loan types. In Model III, as illustrated in Fig. 2, the
coefficient estimates indicate that laws with more or stronger restrictions are associated with
reduced probabilities of applying and originating subprime loans. For example, a one-standard
deviation increase in the scaled restrictions index reduces the probability of applying by 4.9
percentage points and the probability of originating by 2.2 percentage points. In addition, the
marginal impact of restrictions gets larger as coverage increases. For example, the reduction in
the probability of applying in response to a one-standard-deviation increase in the restrictions
index increases from 4.4 to 6.1 percentage points as the coverage index goes from zero to six.21
The impact of increased coverage of a law, after controlling for restrictions, is largely an
empirical question. If there is no problem with dishonest loans in the subprime market, more
coverage should unambiguously reduce applications and originations. However, if potential
applicants are deterred from applying because of fear of being taken advantage of by dishonest
lenders or do not apply because of the cost of sorting the honest from the dishonest, then the
introduction of a law that covers more applications may be associated with more applications due
Ho, Pennington-Cross 12
to a reduced fear of predation and a lower cost of screening. Model III in Table 7 and Fig. 3 report
that laws with broader coverage tend to be associated with increased originations and
applications. In fact, the coefficient estimates are very similar in magnitude, although they have
the opposite signs, to the impact of stronger restrictions. The marginal impact of a
one-standard-deviation increase in coverage increases the probability of applying for a subprime
loan by 6.6 percentage points and the probability of originating a subprime loan by 3.5
percentage points. As illustrated in Fig. 3, when a law is passed that covers your loan application
more households are willing to apply. In other words, consistent with a market with a dishonest
lenders problem, the demand for subprime credit can actually increase when a predatory lending
law is enacted.
7. Conclusion
Starting with North Carolina in 1999, states and other localities across the United States
have introduced legislation intended to curb predatory and abusive lending in the subprime
mortgage market. These laws usually extend the reach of the Home Ownership and Equity
Protection Act (HOEPA) by including home purchase and open-end mortgage credit, lowering
annual percentage rate (APR) and fees and points triggers and prohibiting and/or restricting the
use of balloon payments and prepayment penalties on covered loans.
While prior literature found evidence that the North Carolina law did reduce the flow of
credit, the results in this paper indicate that the typical law has little impact on the flow of
subprime credit as measured by loan origination and application. However, rejections do decline
by over 10 percent for the typical law. The reduction in rejections may reflect less aggressive
marketing, additional pre-screening by lenders, increased self-selection by borrowers, a shift in
applications to unregulated lenders, or other factors. While a reduction in rejection rates may not
have been the intent of the predatory lending law, it does indicate that borrowers are benefiting
by saving non-refundable application costs when rejected for a subprime loan.
However, not all local predatory lending laws are created equal. The strength of the law is
measured along two dimensions—coverage and restrictions. Some laws provide broad coverage
of the subprime market (Colorado) and others very little coverage (Texas). Some have
substantial restrictions (Georgia) on allowable lending, while others have very few restrictions
(Maine). The results indicate that coverage and restrictions tend to have opposite impacts. In
general, laws with more extensive restrictions are associated with larger decreases in the flow of
credit. In fact, laws with the strongest restrictions can decrease applications by over 50 percent.
In contrast, laws with broad coverage can increase applications by even more than 50 percent.

Ho, Pennington-Cross 13
Therefore, although on the surface local predatory lending laws seem to have little impact, the
design of the law can stimulate the subprime market, depress the subprime market, or leave
volumes relatively steady but with lower rejection rates. As a result, the design of the law can
have economically important impacts on the flow and make-up of the mortgage market.
Notes
* The views expressed in this research are those of the individual author and do not
necessarily reflect the official positions of the Federal Reserve Bank of St. Louis, the Federal
Reserve System, and the Board of Governors.
1. These numbers are derived from type B&C loans. B&C loans are loans with less
than an A (or prime) rating. See the Mortgage Markets Statistics Annual published by Inside
Mortgage Finance for more details on loan classification schemes.
2. See HUD-Treasury Report (HUD-Treasury [15]) and Federal Reserve HOEPA
Final Rule (Federal Resrve [8]).
3. Laws are first enacted by the local legislature and become effective typically at a
later date. It is not until the law becomes in effect that lenders are required to follow the new
rules and restrictions.
4. While we do observe in the marketplace some rejections of prime applications,
empirical research has shown that subprime loans are rejected at a much higher rate than
prime loans: 33 percent versus 9 percent (Scheessele [22]). For those applicants who are
reported as rejected in HMDA they may look to lenders who do not report to HMDA and are
more likely to be unregulated for a loan or may reapply at a later point in time.
5. Ferguson and Peters [9] and Ambrose, Pennington-Cross and Yezer [2] present a
more formal presentation of mortgage applications and lending standards which is similar to
the concepts discussed here.
6. The data was provided by nine members of the American Financial Services
Association (AFSA). AFSA represents some of the largest subprime lenders (Ameriquest
Mortgage Company, Conseco Finance Corporation, Countrywide Home Loans, Equity One,
CitiFinancial, Household Finance Corporation, Key Consumer Real Estate, Washington
Mutual Finance and Wells Fargo Financial, Inc.).
7. LoanPerformance, a private data vendor, leased mortgage information based on
securitized loans. If loans of better quality (A-rated) or pricing tend to have higher rates of
securitization, then the LoanPerformance data represent only one segment of the subprime
market. This is consistent with Chomsisengphet and Pennington-Cross [5] who show that the
Ho, Pennington-Cross 14
Mortgage Bankers Association of America (MBAA) rate of foreclosures has different time
series properties than the LoanPerformance rate and was on average has almost three times
higher.
8. Congress enacted HOEPA (Pub. L. 103-325, 108 Stat. 21600) by amending the
Truth in Lending Act (TILA, 15 USC 1601). In 1994, the Board of Governors implemented
HOEPA through 12 CFR part 226 (Regulation Z), which articulates specific rules governing
lending practices. The original version, in 1994, set out the framework and defined the
triggers and restrictions. The second version, in 2002, adjusted some of the triggers and
restricted some additional practices.
9. Closed-end loans are loans that disburse a certain amount of money to the
borrower and are repaid over a fixed time period. Lines of credit are an example of an
open-ended loan because the borrower can withdraw (increase the loan amount) more
money at their discretion until the line of credit terminates at a predetermined point in time.
10. Every attempt was made to include all laws in effect by the end of 2004 that,
similar to HOEPA, use triggers to define a class of loans eligible for restrictions and
disclosures. Because other laws are likely to exist, those discussed here should be viewed
as a sample of all the state and local predatory lending laws. Other states have laws that do
not focus on high-cost or subprime lending and do not have any triggers (Idaho, Michigan,
Minnesota, Mississippi, Nebraska, New Hampshire, Oregon, Tennessee, Washington, and
West Virginia).
11. For example, some laws have different triggers depending on loan amount or
other distinctions.
12. The law in Cleveland was determined to be restrictive and was assigned four
points despite not neatly falling into any of the categories.
13. http://www.huduser.org/datasets/manu.html, accessed on 2/1/2005. HUD
generates a list of subprime lenders from industry trade publications, HMDA data analysis,
and phone calls to the lender confirm the extent of subprime lending. Since this list is defined
at the lender level, loans made by the subprime lenders may include both prime and
subprime loans. In addition, subprime loans made by predominately prime lenders will also
be incorrectly identified as prime lending. Therefore, an alternative interpretation of the loans
identified using the HUD subprime lender list is that it identifies the extent of specialized
subprime lending—not full-service lending.
14. This is similar to the approach used by Holmes [14], who examined the impact of
right-to-work laws on manufacturing employment at state borders in order to isolate the effect
Ho, Pennington-Cross 15
of state policies from other state characteristics.
15. This geographically based sampling does not create a “matched” sample, where
one similar loan in the treatment location is matched with another loan in the control location.
In short, all observed loans in the specified location and time periods are included.
16. The probit specification is given by Pr/0 1 | 45 6/4�7�5, where 0 is the
outcome (application, origination, or rejection), 4 is a vector of explanatory variables, � is a
vector of parameters, and 8/95 denotes the standard normal distribution. As given in Greene
[10], the log-likelihood for the probit model is
� � ln<1 = 6/4�7�5>?@��
� ln 6/4�7�5?@��
,
where A� and 4� are, respectively, the observed values of outcome 0 and explanatory
variables 4 for observation ). 17. To enhance computational feasibility, we only include a 10 percent random
sample of each location in the pool sample. We also estimate using the 25 and 50 percent
random samples and find that results are robust across sample sizes.
18. The rejection sample excludes loans whose application was withdrawn by
applicant or whose file was closed for incompleteness.
19. We calculated the marginal effect for the Ineffect variable using the
“double-difference” approach outlined in Norton, Wang, and Ai [17]. Specifically, since
Ineffect is the interaction between Law and Postlaw, the full interaction effect is the change in
the predicted probability for a change in both Law and Postlaw, and therefore, does not only
depend on the Ineffect coefficient.
20. To conserve space all the control variables are not reported. In addition,
specification tests were conducted including both the variable Ineffect and the laws indexes.
In all cases the Ineffect variable was insignificant and is not reported.
21. Note that zero coverage indicates that the law does not extend coverage beyond
HOEPA. However, the law still covers some of the market.
References
[1] G. Akerlof, The market for lemons: Quality uncertainty and the market mechanism,
Quarterly Journal of Economics 84 (3) (1970) 488–500.
[2] B.W. Ambrose, A. Pennington-Cross, A.M. Yezer, Credit rationing in the US mortgage
market: Evidence from variation in FHA market shares, Journal of Urban Economics 51

Ho, Pennington-Cross 16
(2002) 272–294.
[3] P. Calem, K. Gillen, S. Wachter, The neighborhood distribution of subprime mortgage
lending, Journal of Real Estate Finance and Economics 29 (4) (2004) 393–410.
[4] P. Chinloy, N. MacDonald, Subprime lenders and mortgage market completion, Journal
of Real Estate Finance and Economics 30 (2) (2005) 153–165.
[5] S. Chomsisengphet, A. Pennington-Cross, Borrower cost and credit rationing in the
subprime mortgage market, Presented at the American Real Estate and Urban
Economics Association Mid-Year meetings in Washington, DC, 2004.
[6] G. Elliehausen, M.E. Staten, Regulation of subprime mortgage products: An analysis of
North Carolina’s predatory lending law, Journal of Real Estate Finance and Economics
29 (4) (2004) 411–434.
[7] K. Ernst, J. Farris, E. Stein, North Carolina’s subprime home loan market after
predatory lending reform, Center for Responsible Lending, University of North Carolina
at Chapel Hill, Durham, NC, 2002.
[8] Federal Reserve, Truth in Lending, Final Rule, 12 CFP part 226, Regulation Z. Docket
No. R-1090, Board of Governors of the Federal Reserve System, 2002.
[9] M. Ferguson, S. Peters, What constitutes evidence of discrimination in lending? Journal
of Finance 50 (2) (1995) 739–748.
[10] W.H. Greene, Econometric Analysis, fifth ed., Prentice Hall, Upper Saddle River, NJ,
2003.
[11] K.D. Harvey, P.J. Nigro, How do predatory lending laws influence mortgage lending in
urban areas? A tale of two cities, Journal of Real Estate Research 25 (4) (2003)
479–508.
[12] K.D. Harvey, P.J. Nigro, Do predatory lending laws influence mortgage lending? An
analysis of the North Carolina predatory lending law, Journal of Real Estate Finance
and Economics 29 (4) (2004) 435–456.
[13] G. Ho, A. Pennington-Cross, The impact of local predatory lending laws, Working paper
No. 2005-049B, Federal Reserve Bank of St. Louis, 2005. Available at
http://research.stlouisfed.org/wp/2005/2005-049.pdf.
[14] T. Holmes, The effect of state policies on the location of manufacturing: Evidence from
state borders, Journal of Political Economy 106 (4) (1998) 667–705.
[15] HUD-Treasury, Curbing Predatory Home Mortgage Lending, United States Department
of Housing and Urban Development and the United States Treasury Department, 2000.
Available at http://huduser.org/publications/hsgfin/ curbing.html.

Ho, Pennington-Cross 17
[16] IMF, Mortgage Market Statistics Annual, Inside Mortgage Finance Publications, Inc.,
Bethesda, MD, 2004. Available at http://www.imfpubs.com.
[17] E.C. Norton, H. Wang, C. Ai, Computing interaction effects and standard errors in logit
and probit models, The Stata Journal 4 (2) (2004) 103–116.
[18] A. Pennington-Cross, Subprime lending in the primary and secondary markets, Journal
of Housing Research 13 (1) (2002) 31–50.
[19] A. Pennington-Cross, Credit history and the performance of prime and nonprime
mortgages, Journal of Real Estate Finance and Economics 27 (3) (2003) 279–301.
[20] R. Quercia, M.A. Stegman, W.R. Davis, The impact of North Carolina’s anti-predatory
lending law: A descriptive assessment, Center for Community Capitalism, University of
North Carolina at Chapel Hill, Durham, NC, 2003.
[21] R. Quercia, M.A. Stegman, W.R. Davis, Assessing the impact of North Carolina’s
predatory lending law, Housing Policy Debate 15 (3) (2004) 573–601.
[22] R. Scheessele, 1998 HMDA highlights, Housing Finance Working Paper Series, US
Department of Housing and Urban Development, HF-009, 1998.

Ho, Pennington-Cross 18
Appendix
Figure 1: Impact of Local Law Index on the Flow of Credit
Note. All other variables are set to their mean and the law index is increased from 0 to the
maximum observed value using Model II. Probabilities are indicated by fractions so that 0.05 is a
five percent change in probability.
Ho, Pennington-Cross 19
Figure 2: Impact of Restrictions Index on the Flow of Credit
Note: All other variables are set to their mean and the law index is increased from 0 to the
maximum observed value using Model III. Probabilities are indicated by fractions so that 0.05 is a
five percent change in probability.

Ho, Pennington-Cross 20
Figure 3: Impact of Coverage Index on the Flow of Credit
Note: All other variables are set to their mean and the law index is increased from 0 to the
maximum observed value using Model III. Probabilities are indicated by fractions so that 0.05 is a
five percent change in probability.

Ho, Pennington-Cross 21
Table 1: Law Index Definition
Note: The law index is calculated by summing all categories. The coverage and restrictions
indexes are created by summing the subcategories.

Ho, Pennington-Cross 22
Table 2: The Law Index

Ho, Pennington-Cross 23
Table 3: The Scaled Law Index
Note: The coverage and restrictions indexes are modestly correlated (0.21).
Ho, Pennington-Cross 24
Table 4: Variable Definitions
a Ho and Pennington-Cross [13] provide a detailed description of each law in their Appendix A.
The detailed descriptions of the laws are too long to include in this paper and have been
summarized by the law index discussed above.

Ho, Pennington-Cross 25
Table 5: Descriptive Statistics of Selected Variables
Note: During estimation the law sample dummy variables are interacted with Law and Postlaw as
part of the identification strategy.
Ho, Pennington-Cross 26
Table 6: Probit Results—Base Model
Note: Marginal effects for the continuous variables are estimated as the discrete change in
probability as the variable deviates from its sample mean by an appropriate unit. The chosen
units are reported in the last column.
Ho, Pennington-Cross 27
Table 7: Augmented Models with Local Law Index
Note: Marginal effects for the indexes are estimated as change in probability as an index
deviates from its mean by one standard deviation. Standard deviations are as reported in Table
3.