Embed Size (px)
Citation preview
VIETNAM NATIONAL UNIVERSITY HO CHI MINH CITY
INTERNATIONAL UNIVERSITY
THE IMPACT OF FDI SPILLOVERS ON THE PRODUCTIVITY OF
DOMESTICALLY MANUFACTURING FIRMS AND AVERAGE WAGE
IN VIETNAM
In Partial Fulfillment of the Requirements of the Degree of
Doctor of Philosophy
in Business Administration
By
HUYNH THI NGOC HIEN
PBAIU16003
Hồ Chí Minh city
January 2020
VIETNAM NATIONAL UNIVERSITY HO CHI MINH CITY
INTERNATIONAL UNIVERSITY
THE IMPACT OF FDI SPILLOVERS ON THE PRODUCTIVITY OF
DOMESTICALLY MANUFACTURING FIRMS AND AVERAGE WAGE
IN VIETNAM
In Partial Fulfillment of the Requirements of the Degree of
Doctor of Philosophy
in Business Administration
By
HUYNH THI NGOC HIEN
PBAIU16003
Independent Reviewer: PGS. TS Từ Văn Bình
Independent Reviewer: TS Nguyễn Quang Trung
Supervisors:
Assoc. Prof Nguyen Van Phuong (International University – VNU HCM)
Dr Tran Tien Khoa (International University – VNU HCM)
LIST OF ABBREVIATIONS
2SLS Two-stage Least Squares
3SLS Three-stage Least Squares
ASEAN Association of Southeast
Asian Nations
B_FDI Backward FDI spillover
DEA Data Envelopment Analysis
EX_DUM Export Orientation
F_FDI Forward FDI spillover
FDI Foreign Direct Investment
FE Fixed Effect
FEM Fixed Effect Model
FN Financial Development
GDP Gross Domestic Product
GMM Generalized Method of
Moments
GR Gender Ratio
GSO General Statistics Office
H_FDI Horizontal FDI Spillover
HC Human Capital
HHI Herfindahl-Hirschman
Index
HOR_SP Horizontal FDI Spillover
IM Imports
IM_DUM Import Orientation
IO Input-Output
J. STOCK Joint Stock Companies
KL Capital Intensity
LI Labor Intensity
LP Levinsohn and Petrin
Approach
MNCs Multinational Corporations
MNEs Multinational Enterprises
MS Market Share
NI Net Income
ODA Official Development
Assistance
OLS Ordinary Least Squares
OP Olley – Pakes Approach
PCI Provincial Competitiveness
Index
R&D Research and Development
RE Random Effect
REM Random Effect Model
ROE Return on Equity
RQ Real Output
SOEs State-Owned Enterprises
TFP Total Factor Productivity
TG Technology Gap
UK United Kingdom
USD United State Dollars
VCCI Vietnam Chamber of
Commerce and Industry
VSIC Vietnam Standard
Industrial Classification
System
W2SLS Weighted Two-Stage Least
Squares
WEF World Economic Forum
WLS Weighted Least Squares
iv
LIST OF TABLES
Table 2-1: Summary of FDI effects on host country ............................................................... 37
Table 2-2: FDI theories assuming perfect market.................................................................... 40
Table 2-3: FDI theories assuming imperfect market ............................................................... 41
Table 2-4: Other FDI theories from different perspectives ..................................................... 44
Table 3-1: Accumulated FDI until 2017 in cities/ provinces with the highest FDI concentration
................................................................................................................................................ 103
Table 3-2: Summary of variables according to ownership type ............................................ 106
Table 3-3: Variable measurements ........................................................................................ 107
Table 3-4: Foreign share of the total equity in two-digit manufacturing industries in Vietnam
from 2007 to 2015 .................................................................................................................. 112
Table 3-5: Number of total labor employed by two-digit manufacturing industries in Vietnam
from 2007 to 2015 .................................................................................................................. 113
Table 3-6: Capital to labor ratio across two-digit manufacturing industries in Vietnam from
2007 to 2015 .......................................................................................................................... 114
Table 3-7: Revenue generated by two-digit manufacturing industries in Vietnam from 2007 to
2015........................................................................................................................................ 115
Table 3-8: Correlation matrix ................................................................................................ 116
Table 3-9: Summary of variables ........................................................................................... 116
Table 4-1: Productivity spillovers from FDI using fixed effect and random effect model ... 120
Table 4-2: The moderating effect of human capital on productivity spillovers from FDI .... 121
Table 4-3: The moderating effect of technology gap on productivity spillovers .................. 123
Table 4-4: The moderating effect of financial development on productivity spillovers ....... 125
Table 4-5: Productivity spillovers from FDI across six geographical regions ...................... 128
Table 4-6: FDI spillover effect on domestic firm productivity across four economic
regions .................................................................................................................................... 129
Table 4-7: FDI spillover and geographically provincial
proximity…………………………….131
Table 4-8: Robustness check for TFP in six regions in Vietnam using DPD approach ........ 134
Table 4-9: The effects of horizontal FDI spillovers on the average wage from 2007 to 2015
across ownership types .......................................................................................................... 138
Table 4-10: Summary of results on hypotheses testing ......................................................... 144
v
LIST OF FIGURES
Figure 1-1: Number of FDI projects and inward FDI capital in Vietnam from 2000 to 2017.
Source: GSO, translated by author ............................................................................................. 7
Figure 1-2: FDI share across economic sectors in Vietnam in 2017. Source: GSO, drawn by
author ......................................................................................................................................... 8
Figure 1-3: Total output accounted by the FDI sector from 2011 to 2015. Source: GSO,
drawn by author ......................................................................................................................... 9
Figure 1-4: FDI share of total export in Vietnam from 1998 to 2016. Source: VCCI,
translated by author .................................................................................................................. 10
Figure 1-5: Number and labor share of the FDI sector in the total country's labor from 2000 to
2017. Source: VCCI, translated by author ............................................................................... 10
Figure 1-6: Ranking in some indicators of FDI spillover. (Note: the lower the column is, the
better the performance is). Source: World Economic Forum WEF (2014, 2017), translated by
author ....................................................................................................................................... 11
Figure 2-1: Classification of FDI by foreign investors’ motivations/ purposes. Source:
author ....................................................................................................................................... 25
Figure 2-2: Classification of FDI by the host country's orientation. Source: author ............... 27
Figure 2-3: Vertical FDI and horizontal FDI integration. Source: author, adapted from
Corporate Finance Institute (CFI) ............................................................................................ 30
Figure 2-4: Mechanisms of FDI spillovers. Source: author ..................................................... 52
Figure 2-5: A theoretical framework of relevant theories illustrating the presence of FDI
spillovers. Source: author......................................................................................................... 56
Figure 2-6: FDI horizontal and vertical productivity spillovers from MNCs to domestic firms.
Source: author, adapted from Huynh et al. (2019) .................................................................. 61
Figure 2-7: Research model. Source: author ........................................................................... 92
Figure 3-1 The process of implementing research ................................................................... 93
Figure 4-1: Average wage among firms with different types of ownership .......................... 136
Figure 4-2: Horizontal spillover among firms with different types of ownership ................. 136
Figure 4-3: Ratio of importing orientation of firms with different types of ownership ........ 137
Figure 4-4: Ratio of exporting orientation of firms with different types of ownership ......... 137
Figure 4-5 Final research model after testing ........................................................................ 145

vi
COPYRIGHT STATEMENT
This copy of the thesis has been supplied on condition that anyone who consults it is
understood to recognize that its copyright rests with its author and that no quotation from the
thesis and no information derived from it may be published without the author’s prior consent.
© Huynh Thi Ngoc Hien/PBAIU16003/2019

vii
ACKNOWLEDGMENT
To complete this thesis, I received unconditional help from many people. I much
appreciate the contribution of everyone involved and apologize to those I do not mention by
name.
First of all, I would like to express my gratitude and respect to my first advisor - Assoc.
Pro. Nguyen Van Phuong and my second advisor - Dr. Tran Tien Khoa for their supervision
and dedicated instructions. Especially, I'm grateful for my first advisor as he spent plenty of
his precious time instructing and encouraging me in implementing the thesis. Without his
relentless support and encouragement, it is very hard for me to complete the dissertation.
I would like to thank my lecturers at the School of Business for valuable knowledge on
research methods providing me a better understanding and practice to struggle with my
dissertation. Moreover, their constructive comments and suggestions on my research proposal
help me better orient and revise my research design and literature review properly.
Besides, I would like to thank Dr. Nguyen Nhu Ty and Mr. Lai Tran Thanh Son for
their dedicated procedure guidance and excellent support during my Ph.D.'s life at International
University. Especially, I thank my MBA. Trieu Doan Xuan Hoa for relieving my stress every
time I feel depressed and thankful for her dedicated help in the process of STATA
programming – a very challenging part of my study.
Thank you, my friends, my colleagues and especially my family who have brought me
the best conditions and encouragements throughout the learning and researching process to
complete the thesis.
viii
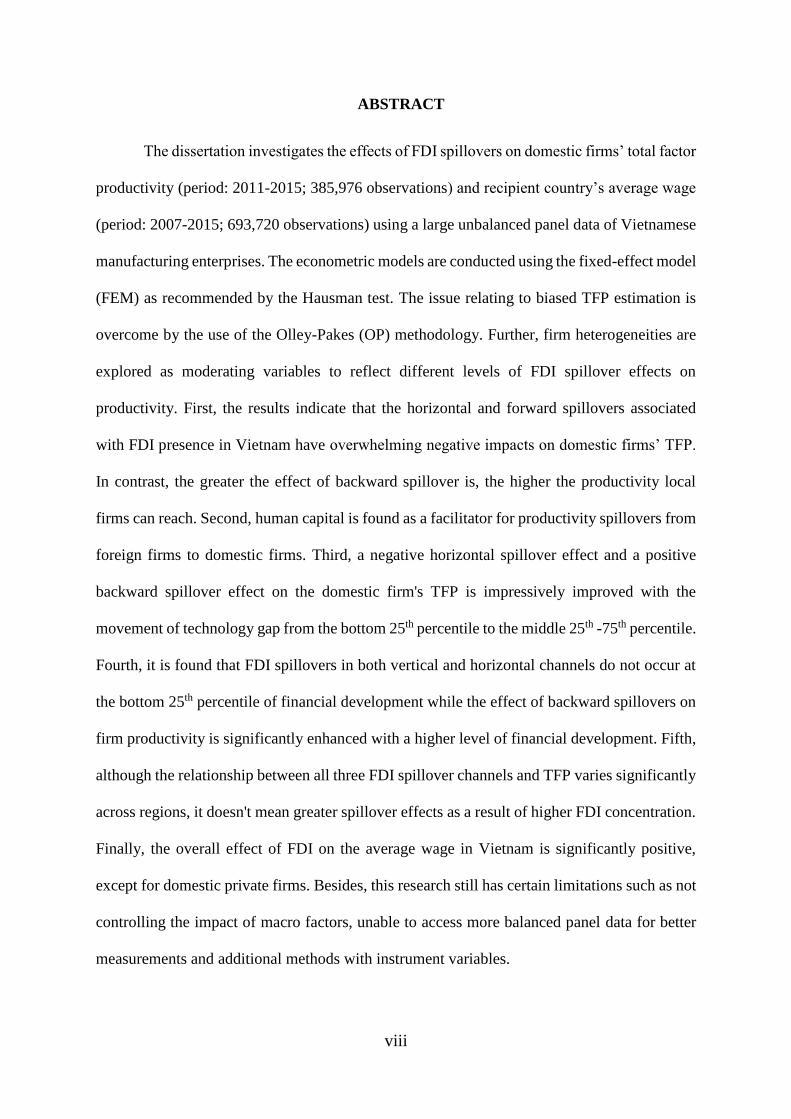
ABSTRACT
The dissertation investigates the effects of FDI spillovers on domestic firms’ total factor
productivity (period: 2011-2015; 385,976 observations) and recipient country’s average wage
(period: 2007-2015; 693,720 observations) using a large unbalanced panel data of Vietnamese
manufacturing enterprises. The econometric models are conducted using the fixed-effect model
(FEM) as recommended by the Hausman test. The issue relating to biased TFP estimation is
overcome by the use of the Olley-Pakes (OP) methodology. Further, firm heterogeneities are
explored as moderating variables to reflect different levels of FDI spillover effects on
productivity. First, the results indicate that the horizontal and forward spillovers associated
with FDI presence in Vietnam have overwhelming negative impacts on domestic firms’ TFP.
In contrast, the greater the effect of backward spillover is, the higher the productivity local
firms can reach. Second, human capital is found as a facilitator for productivity spillovers from
foreign firms to domestic firms. Third, a negative horizontal spillover effect and a positive
backward spillover effect on the domestic firm's TFP is impressively improved with the
movement of technology gap from the bottom 25th percentile to the middle 25th -75th percentile.
Fourth, it is found that FDI spillovers in both vertical and horizontal channels do not occur at
the bottom 25th percentile of financial development while the effect of backward spillovers on
firm productivity is significantly enhanced with a higher level of financial development. Fifth,
although the relationship between all three FDI spillover channels and TFP varies significantly
across regions, it doesn't mean greater spillover effects as a result of higher FDI concentration.
Finally, the overall effect of FDI on the average wage in Vietnam is significantly positive,
except for domestic private firms. Besides, this research still has certain limitations such as not
controlling the impact of macro factors, unable to access more balanced panel data for better
measurements and additional methods with instrument variables.
1
INTRODUCTION
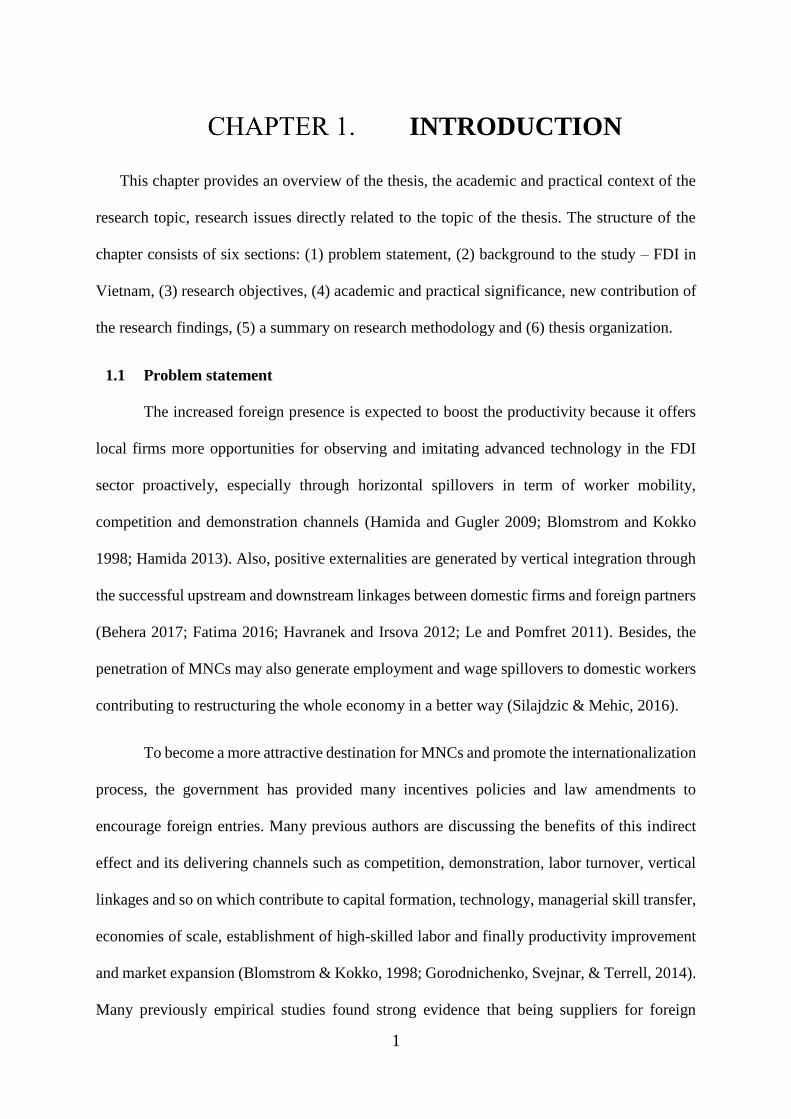
This chapter provides an overview of the thesis, the academic and practical context of the
research topic, research issues directly related to the topic of the thesis. The structure of the
chapter consists of six sections: (1) problem statement, (2) background to the study – FDI in
Vietnam, (3) research objectives, (4) academic and practical significance, new contribution of
the research findings, (5) a summary on research methodology and (6) thesis organization.
1.1 Problem statement
The increased foreign presence is expected to boost the productivity because it offers
local firms more opportunities for observing and imitating advanced technology in the FDI
sector proactively, especially through horizontal spillovers in term of worker mobility,
competition and demonstration channels (Hamida and Gugler 2009; Blomstrom and Kokko
1998; Hamida 2013). Also, positive externalities are generated by vertical integration through
the successful upstream and downstream linkages between domestic firms and foreign partners
(Behera 2017; Fatima 2016; Havranek and Irsova 2012; Le and Pomfret 2011). Besides, the
penetration of MNCs may also generate employment and wage spillovers to domestic workers
contributing to restructuring the whole economy in a better way (Silajdzic & Mehic, 2016).
To become a more attractive destination for MNCs and promote the internationalization
process, the government has provided many incentives policies and law amendments to
encourage foreign entries. Many previous authors are discussing the benefits of this indirect
effect and its delivering channels such as competition, demonstration, labor turnover, vertical
linkages and so on which contribute to capital formation, technology, managerial skill transfer,
economies of scale, establishment of high-skilled labor and finally productivity improvement
and market expansion (Blomstrom & Kokko, 1998; Gorodnichenko, Svejnar, & Terrell, 2014).
Many previously empirical studies found strong evidence that being suppliers for foreign
2
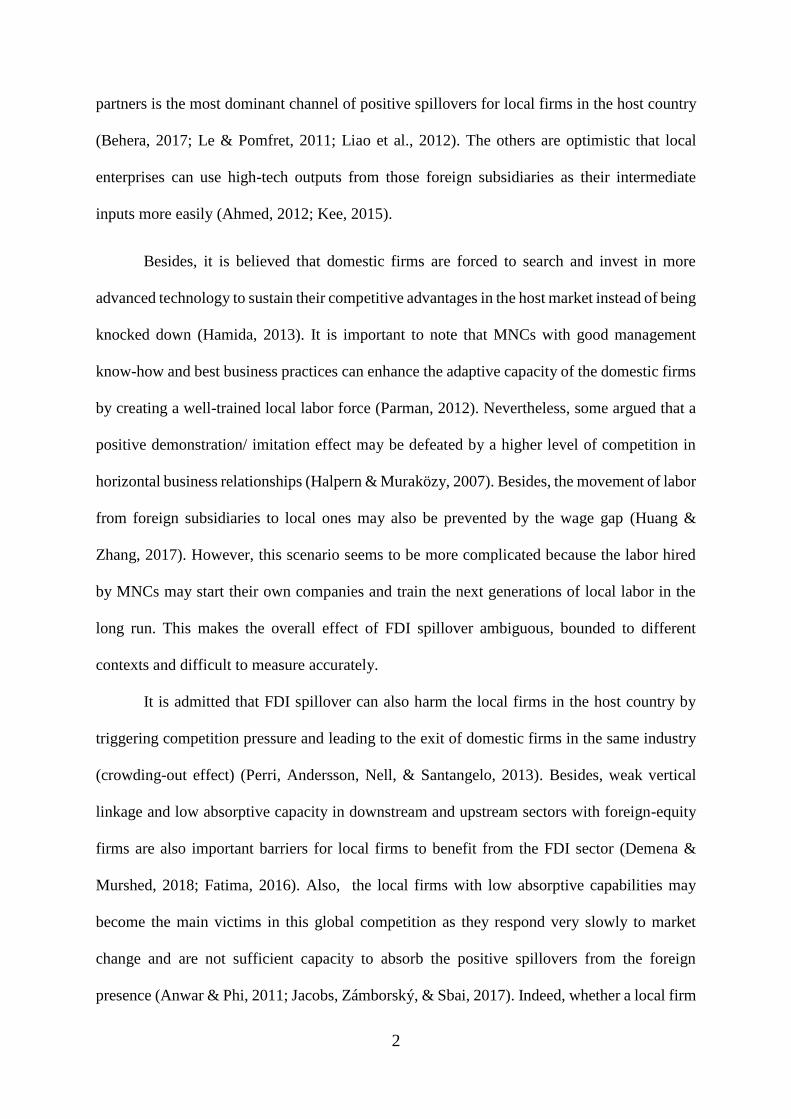
partners is the most dominant channel of positive spillovers for local firms in the host country
(Behera, 2017; Le & Pomfret, 2011; Liao et al., 2012). The others are optimistic that local
enterprises can use high-tech outputs from those foreign subsidiaries as their intermediate
inputs more easily (Ahmed, 2012; Kee, 2015).
Besides, it is believed that domestic firms are forced to search and invest in more
advanced technology to sustain their competitive advantages in the host market instead of being
knocked down (Hamida, 2013). It is important to note that MNCs with good management
know-how and best business practices can enhance the adaptive capacity of the domestic firms
by creating a well-trained local labor force (Parman, 2012). Nevertheless, some argued that a
positive demonstration/ imitation effect may be defeated by a higher level of competition in
horizontal business relationships (Halpern & Muraközy, 2007). Besides, the movement of labor
from foreign subsidiaries to local ones may also be prevented by the wage gap (Huang &
Zhang, 2017). However, this scenario seems to be more complicated because the labor hired
by MNCs may start their own companies and train the next generations of local labor in the
long run. This makes the overall effect of FDI spillover ambiguous, bounded to different
contexts and difficult to measure accurately.
It is admitted that FDI spillover can also harm the local firms in the host country by
triggering competition pressure and leading to the exit of domestic firms in the same industry
(crowding-out effect) (Perri, Andersson, Nell, & Santangelo, 2013). Besides, weak vertical
linkage and low absorptive capacity in downstream and upstream sectors with foreign-equity
firms are also important barriers for local firms to benefit from the FDI sector (Demena &
Murshed, 2018; Fatima, 2016). Also, the local firms with low absorptive capabilities may
become the main victims in this global competition as they respond very slowly to market
change and are not sufficient capacity to absorb the positive spillovers from the foreign
presence (Anwar & Phi, 2011; Jacobs, Zámborský, & Sbai, 2017). Indeed, whether a local firm
3
can benefit from positive spillovers associated with FDI strongly depending on firms’ internal
capabilities and host business environment determined by financial market, network, policies
and regulations (Perri & Peruffo, 2016).
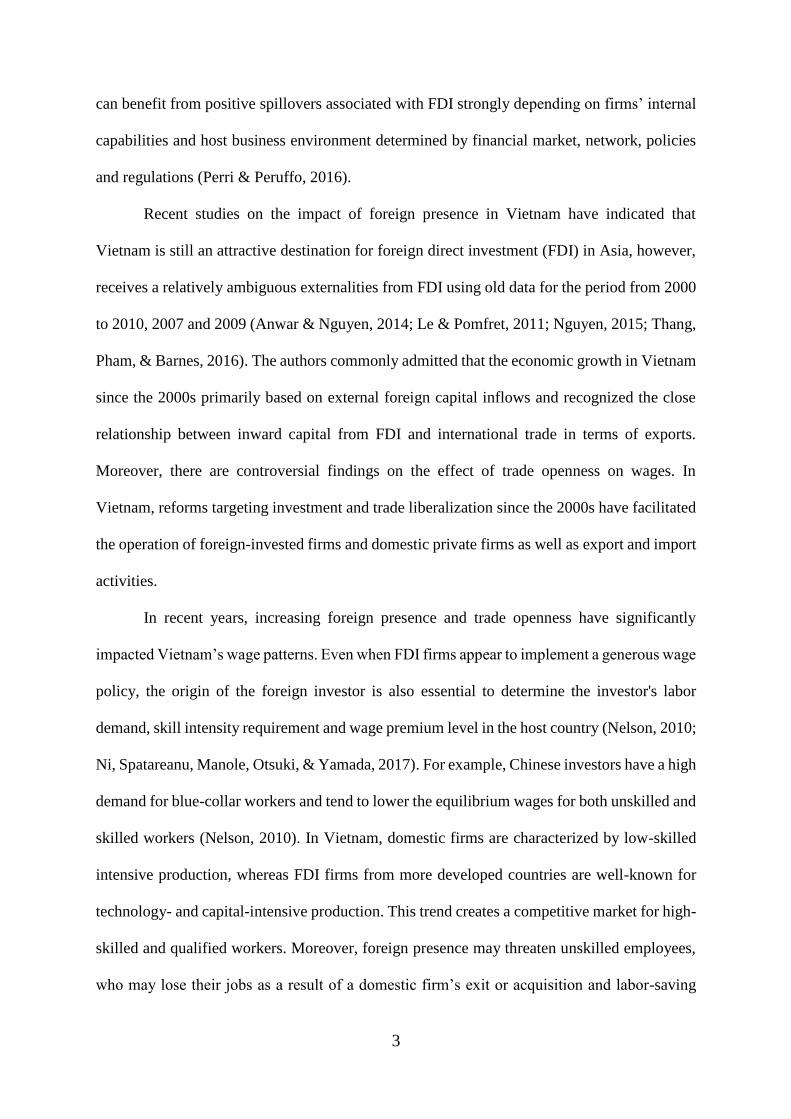
Recent studies on the impact of foreign presence in Vietnam have indicated that
Vietnam is still an attractive destination for foreign direct investment (FDI) in Asia, however,
receives a relatively ambiguous externalities from FDI using old data for the period from 2000
to 2010, 2007 and 2009 (Anwar & Nguyen, 2014; Le & Pomfret, 2011; Nguyen, 2015; Thang,
Pham, & Barnes, 2016). The authors commonly admitted that the economic growth in Vietnam
since the 2000s primarily based on external foreign capital inflows and recognized the close
relationship between inward capital from FDI and international trade in terms of exports.
Moreover, there are controversial findings on the effect of trade openness on wages. In
Vietnam, reforms targeting investment and trade liberalization since the 2000s have facilitated
the operation of foreign-invested firms and domestic private firms as well as export and import
activities.
In recent years, increasing foreign presence and trade openness have significantly
impacted Vietnam’s wage patterns. Even when FDI firms appear to implement a generous wage
policy, the origin of the foreign investor is also essential to determine the investor's labor
demand, skill intensity requirement and wage premium level in the host country (Nelson, 2010;
Ni, Spatareanu, Manole, Otsuki, & Yamada, 2017). For example, Chinese investors have a high
demand for blue-collar workers and tend to lower the equilibrium wages for both unskilled and
skilled workers (Nelson, 2010). In Vietnam, domestic firms are characterized by low-skilled
intensive production, whereas FDI firms from more developed countries are well-known for
technology- and capital-intensive production. This trend creates a competitive market for high-
skilled and qualified workers. Moreover, foreign presence may threaten unskilled employees,
who may lose their jobs as a result of a domestic firm’s exit or acquisition and labor-saving
4
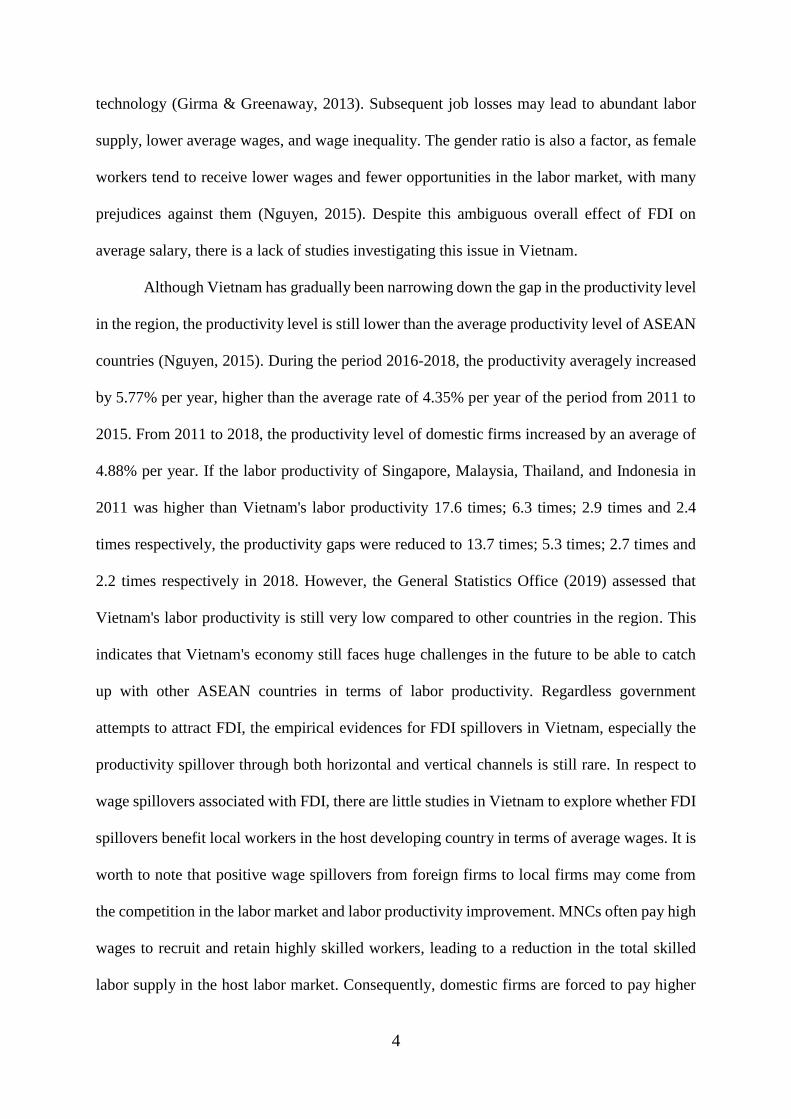
technology (Girma & Greenaway, 2013). Subsequent job losses may lead to abundant labor
supply, lower average wages, and wage inequality. The gender ratio is also a factor, as female
workers tend to receive lower wages and fewer opportunities in the labor market, with many
prejudices against them (Nguyen, 2015). Despite this ambiguous overall effect of FDI on
average salary, there is a lack of studies investigating this issue in Vietnam.
Although Vietnam has gradually been narrowing down the gap in the productivity level
in the region, the productivity level is still lower than the average productivity level of ASEAN
countries (Nguyen, 2015). During the period 2016-2018, the productivity averagely increased
by 5.77% per year, higher than the average rate of 4.35% per year of the period from 2011 to
2015. From 2011 to 2018, the productivity level of domestic firms increased by an average of
4.88% per year. If the labor productivity of Singapore, Malaysia, Thailand, and Indonesia in
2011 was higher than Vietnam's labor productivity 17.6 times; 6.3 times; 2.9 times and 2.4
times respectively, the productivity gaps were reduced to 13.7 times; 5.3 times; 2.7 times and
2.2 times respectively in 2018. However, the General Statistics Office (2019) assessed that
Vietnam's labor productivity is still very low compared to other countries in the region. This
indicates that Vietnam's economy still faces huge challenges in the future to be able to catch
up with other ASEAN countries in terms of labor productivity. Regardless government
attempts to attract FDI, the empirical evidences for FDI spillovers in Vietnam, especially the
productivity spillover through both horizontal and vertical channels is still rare. In respect to
wage spillovers associated with FDI, there are little studies in Vietnam to explore whether FDI
spillovers benefit local workers in the host developing country in terms of average wages. It is
worth to note that positive wage spillovers from foreign firms to local firms may come from
the competition in the labor market and labor productivity improvement. MNCs often pay high
wages to recruit and retain highly skilled workers, leading to a reduction in the total skilled
labor supply in the host labor market. Consequently, domestic firms are forced to pay higher
5
wages for these premium workers (Aitken & Harrison, 1999; Driffield, 2004). Also, foreign
entries may generate positive spillovers on the aggregate labor productivity of domestic firms,
thereby pushing up equilibrium wages in the host country (Aitken, Hanson, & Harrison, 1997).
It is worth to notice that the productivity level of domestic firms under the foreign
presence as well as FDI spillover effects on wages is very hard to predict and could be explained
by a wide range of contextual factors in the host economy such as FDI type, firm
heterogeneities and other macro conditions (Willem, 2019). Under the context of an emerging
economy, local firms are even more vulnerable to the market stealing effects or play as the
newbies in the competition in the same industry or vertical linkage relationships with foreign
giants (Newman, Page, Rand, Shimeles, & Söderbom, 2019; Nguyen & Sun, 2012). Therefore,
the outcome of inward FDI for Vietnam firm productivity and labor welfare should be
measured separately to find out the hidden puzzles with different story-telling as Vietnam’s
economy is quite young and has just entered the global market in recent years. It has been
indicated in recent studies of Demena & Bergeijk (2017); Demena & Bergeijk (2019) and
Rojec & Knell (2017) that there are still rooms for studies differentiating different transmission
channels of FDI spillover in developing countries to provide more recent empirical evidence
because most of the third-world studies on this issue have primarily focused on horizontal FDI
externalities. As each country has its input-output matrix for each particular industry which
varies across countries and regions, it is valuable to examine the vertical spillovers, specifically
through backward and forward interactions (supplier and customer relationships) to better
capture the contextual heterogeneities (Lenaerts & Merlevede, 2016). Furthermore, Behera
(2017) and Anwar, Sun, & Anwar (2018) have suggested that the sufficient inclusion and
investigation of firm heterogeneities such as investment sector, value chain linkages, financial
development level, labor training and mobility, technological and innovative capacity, firm
size, ownership and so on may contribute significantly to the current literature of FDI spillover
6
in emerging economies. Thus, the thesis is expected to contribute to the knowledge of FDI
spillover, especially in the context of a developing country and a transitional economy like
Vietnam.
Besides, another major contribution of the thesis relies on the analysis of horizontal
spillovers and their impact on wages. It is admitted that FDI presence may enhance the
sustainable development in the host economy by their practice of corporate social responsibility
as well as their transfer of managerial knowledge, labor training and welfare regime as well as
the entrepreneurial spirit (Huang & Zhang, 2017; Zhang & Shang, 2018). As a result, local
employees can benefit from labor productivity improvement and capacity building to bargain
for higher compensations (Javorcik, 2015; Nguyen & Ramstetter, 2017). In this way, some
researchers pay much attention to wage discrimination between FDI and the domestic sector
which somehow reflects the wage gap under the foreign presence and its determinants (Nguyen,
2015; Nguyen & Ramstetter, 2017; Stoyanov & Zubanov, 2014). This also leaves a gap for
researching the horizontal spillover effect on the wage in the host economy where the labor
competition and the productivity improvement may occur at the same time.
Therefore, the dissertation aims at answering two big questions: (1) whether FDI
spillovers affect domestic manufacturing firms' productivity? through which channels? any
facilitators or barriers? and (2) whether horizontal FDI spillovers affect labor's average wage
in the host economy? The specifications of the research objectives will be presented in a later
section.
1.2 Background to the study - FDI in Vietnam
After more than 30 years of implementing the open-door policy, Vietnam has built a
relatively synchronous legal framework, creating a favorable business environment to attract
foreign investors. Total registered FDI has significantly increased from 735 million USD in
7
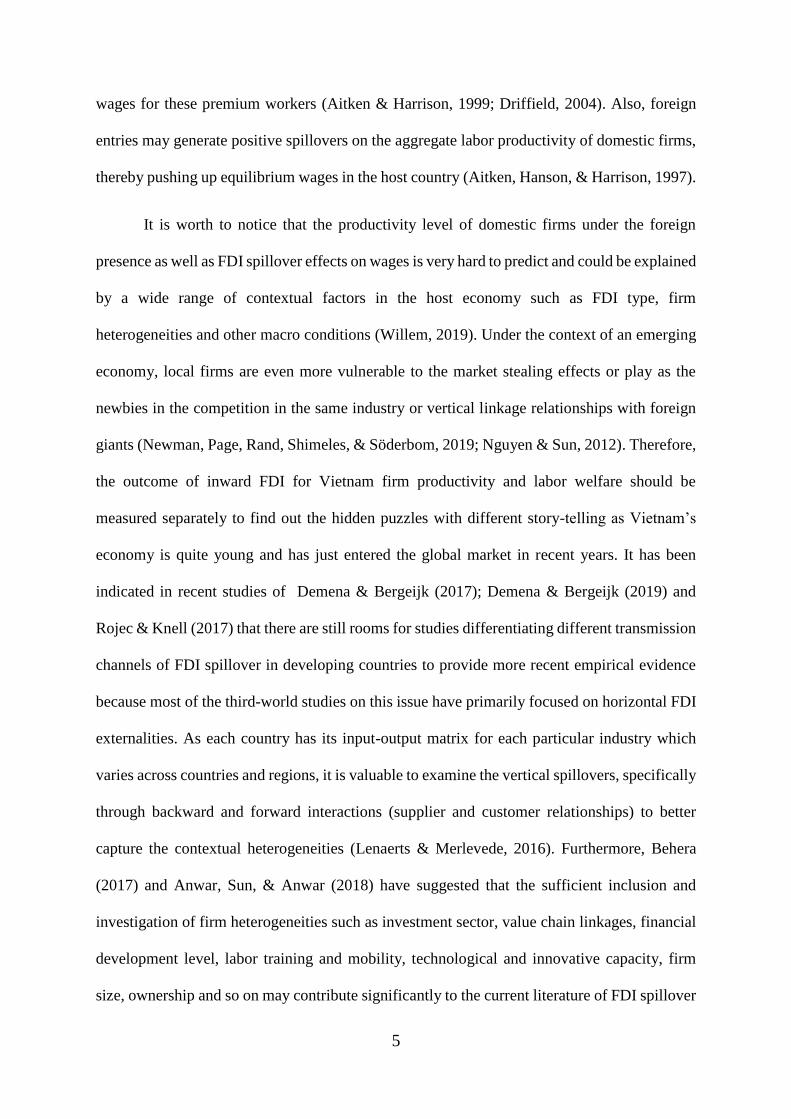
1990 to 19.9 billion USD in 2010, then reach 24.4 billion USD in 2016 (GSO). The number of
registered projects also jumped from 211 projects (1988-1990) to 500 projects in 2000 and
2,500 in 2017 as illustrated in the figure below. It has been shown in figure 1-1 that inward
FDI remained steady from 2000 to 2003 before witnessing a significant increase over the period
from 2004 to 2007 and reaching an unprecedented high peak in 2008. After the world crisis
occurred in 2008, FDI inflows into Vietnam in 2009 reduced dramatically, then fluctuated
during the period from 2009 to 2016 and slightly recovered in 2017.
Figure 1-1: Number of FDI projects and inward FDI capital in Vietnam from 2000 to 2017.
Source: GSO, translated by the author
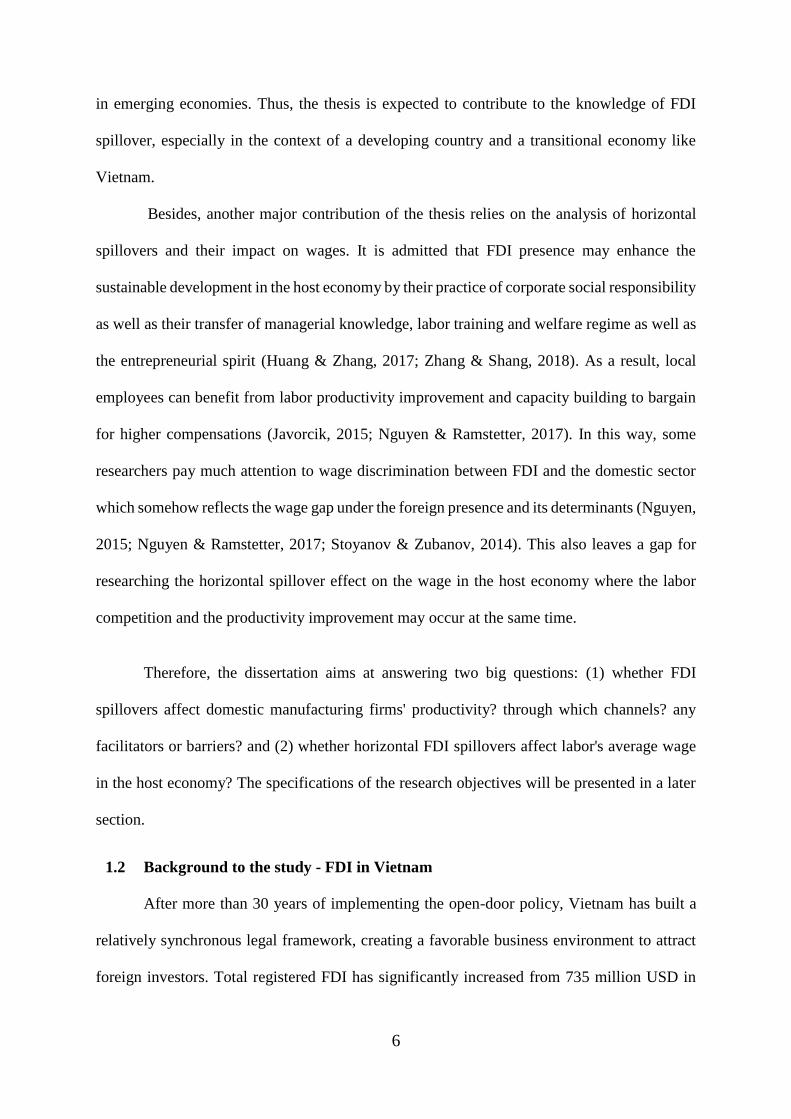
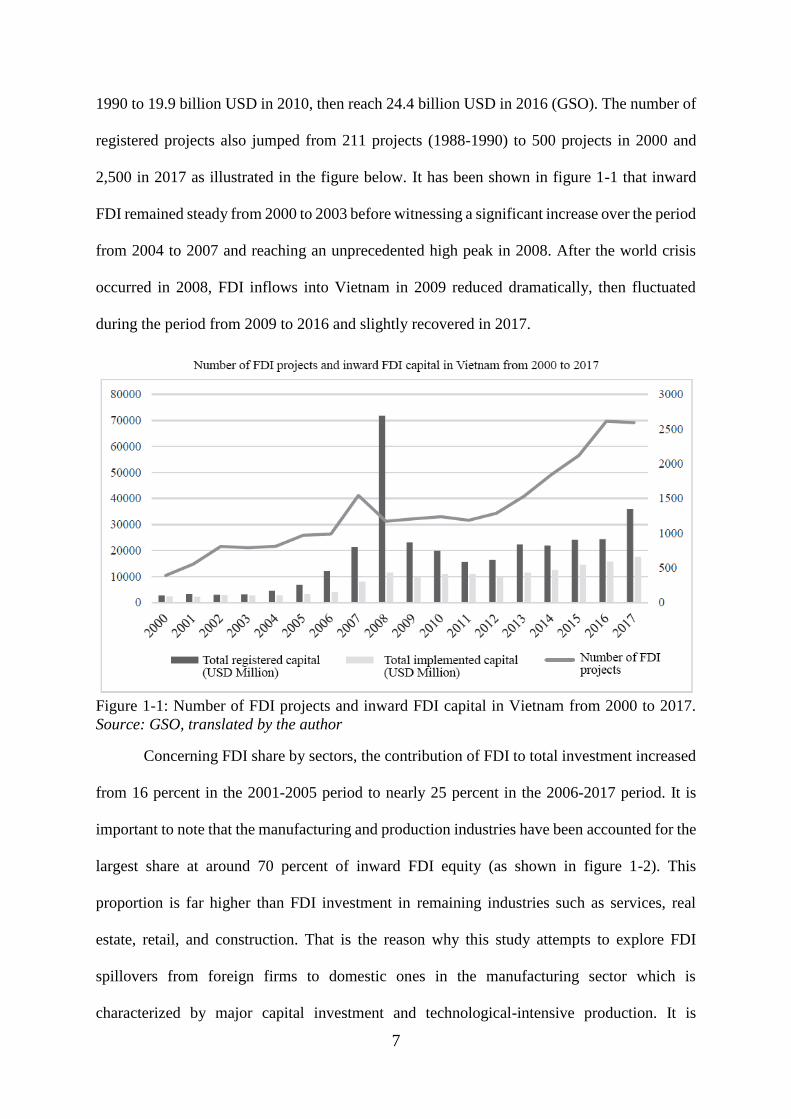
Concerning FDI share by sectors, the contribution of FDI to total investment increased
from 16 percent in the 2001-2005 period to nearly 25 percent in the 2006-2017 period. It is
important to note that the manufacturing and production industries have been accounted for the
largest share at around 70 percent of inward FDI equity (as shown in figure 1-2). This
proportion is far higher than FDI investment in remaining industries such as services, real
estate, retail, and construction. That is the reason why this study attempts to explore FDI
spillovers from foreign firms to domestic ones in the manufacturing sector which is
characterized by major capital investment and technological-intensive production. It is
8
undeniable that high exposures and integration to foreign subsidiaries may contribute to
promote technology transfer and gradually improve the level of domestic production
technology. In response to foreign presence, many Vietnamese enterprises have renovated or
upgraded their existing technology and equipment to meet the increasing competitive pressure
in the economy. As a consequence, Vietnam has now produced many new products not
previously made and restricted the import of many kinds of manufactured goods such as
construction materials, consumer electronic devices, transportation mediums, etc.
Figure 1-2: FDI share across economic sectors in Vietnam in 2017. Source: GSO,
drawn by the author
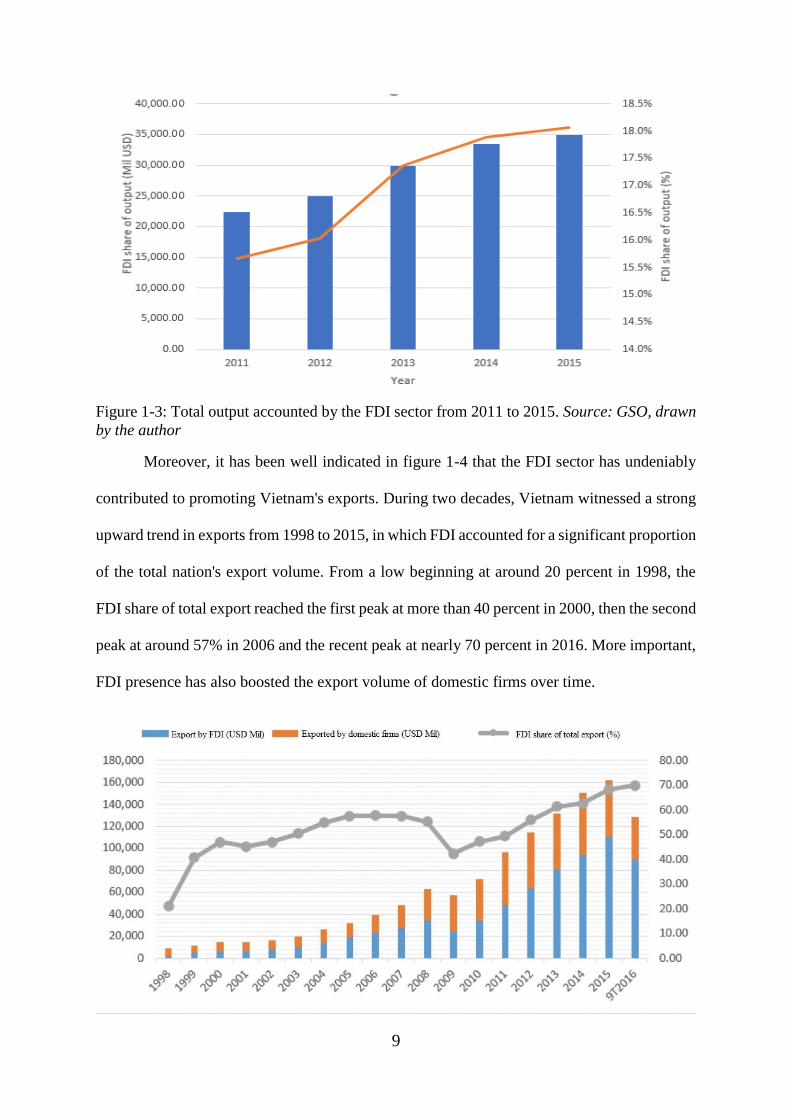
Regarding FDI contribution to GDP, the FDI investment sector has contributed to total
national output increased from 15,000 million USD (around 15.7 percent) in 2011 to 35,000
million USD (over 18 percent) in 2015 (as illustrated in figure 1-3). In this way, FDI has played
an important role in boosting Vietnam's economic growth. In 2017, FDI has contributed nearly
20 percent of GDP and is an important additional source of capital for development investment
in Vietnam occupied 23.7 percent of the total social investment (VCCI, 2017).
9
Figure 1-3: Total output accounted by the FDI sector from 2011 to 2015. Source: GSO, drawn
by the author
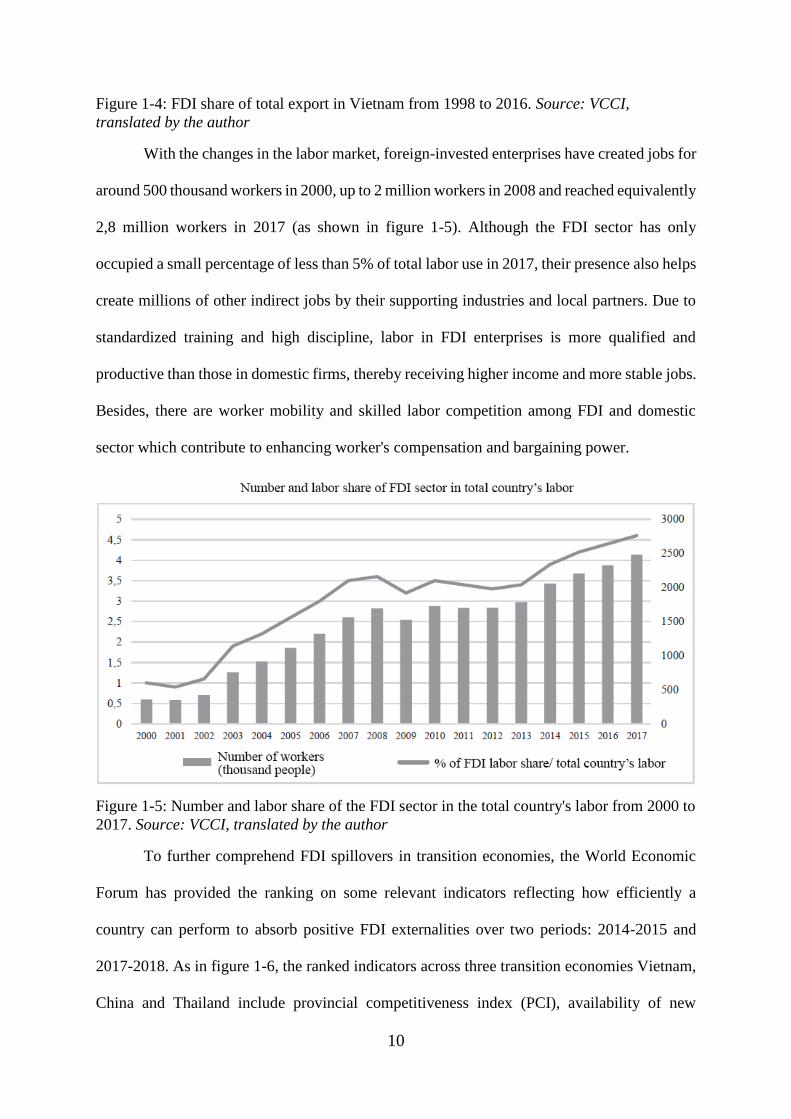
Moreover, it has been well indicated in figure 1-4 that the FDI sector has undeniably
contributed to promoting Vietnam's exports. During two decades, Vietnam witnessed a strong
upward trend in exports from 1998 to 2015, in which FDI accounted for a significant proportion
of the total nation's export volume. From a low beginning at around 20 percent in 1998, the
FDI share of total export reached the first peak at more than 40 percent in 2000, then the second
peak at around 57% in 2006 and the recent peak at nearly 70 percent in 2016. More important,
FDI presence has also boosted the export volume of domestic firms over time.
10
Figure 1-4: FDI share of total export in Vietnam from 1998 to 2016. Source: VCCI,
translated by the author
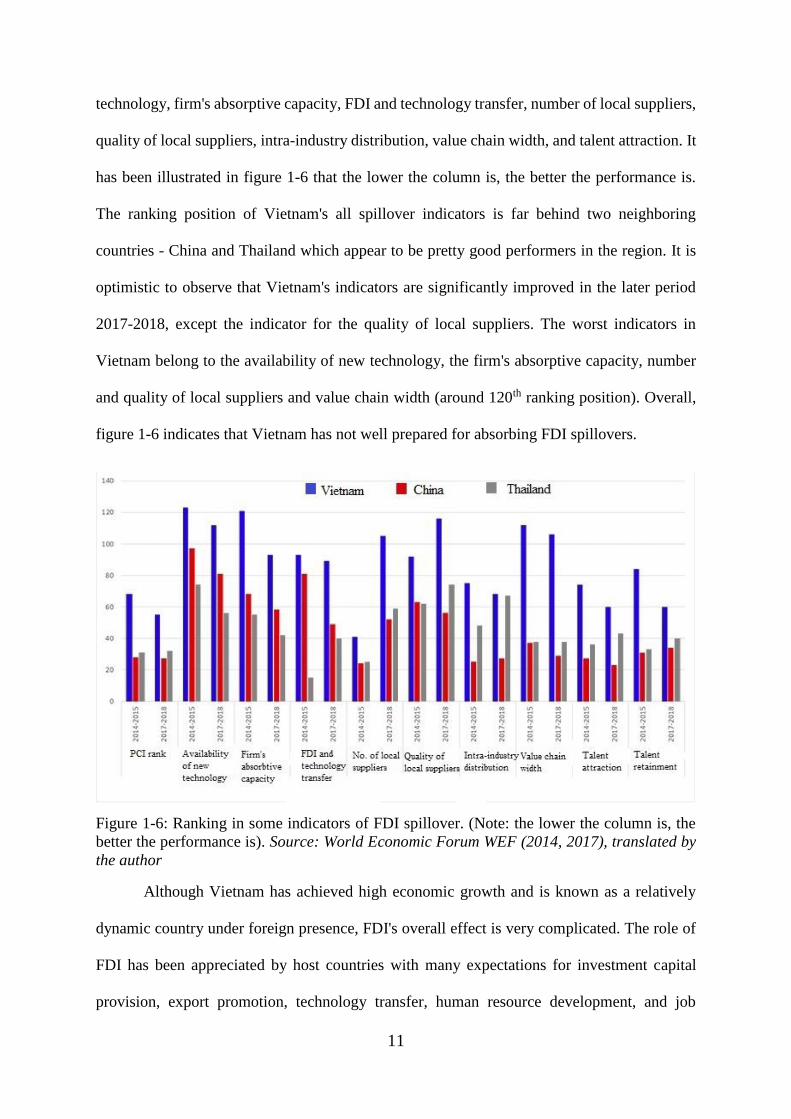
With the changes in the labor market, foreign-invested enterprises have created jobs for
around 500 thousand workers in 2000, up to 2 million workers in 2008 and reached equivalently
2,8 million workers in 2017 (as shown in figure 1-5). Although the FDI sector has only
occupied a small percentage of less than 5% of total labor use in 2017, their presence also helps
create millions of other indirect jobs by their supporting industries and local partners. Due to
standardized training and high discipline, labor in FDI enterprises is more qualified and
productive than those in domestic firms, thereby receiving higher income and more stable jobs.
Besides, there are worker mobility and skilled labor competition among FDI and domestic
sector which contribute to enhancing worker's compensation and bargaining power.
Figure 1-5: Number and labor share of the FDI sector in the total country's labor from 2000 to
2017. Source: VCCI, translated by the author
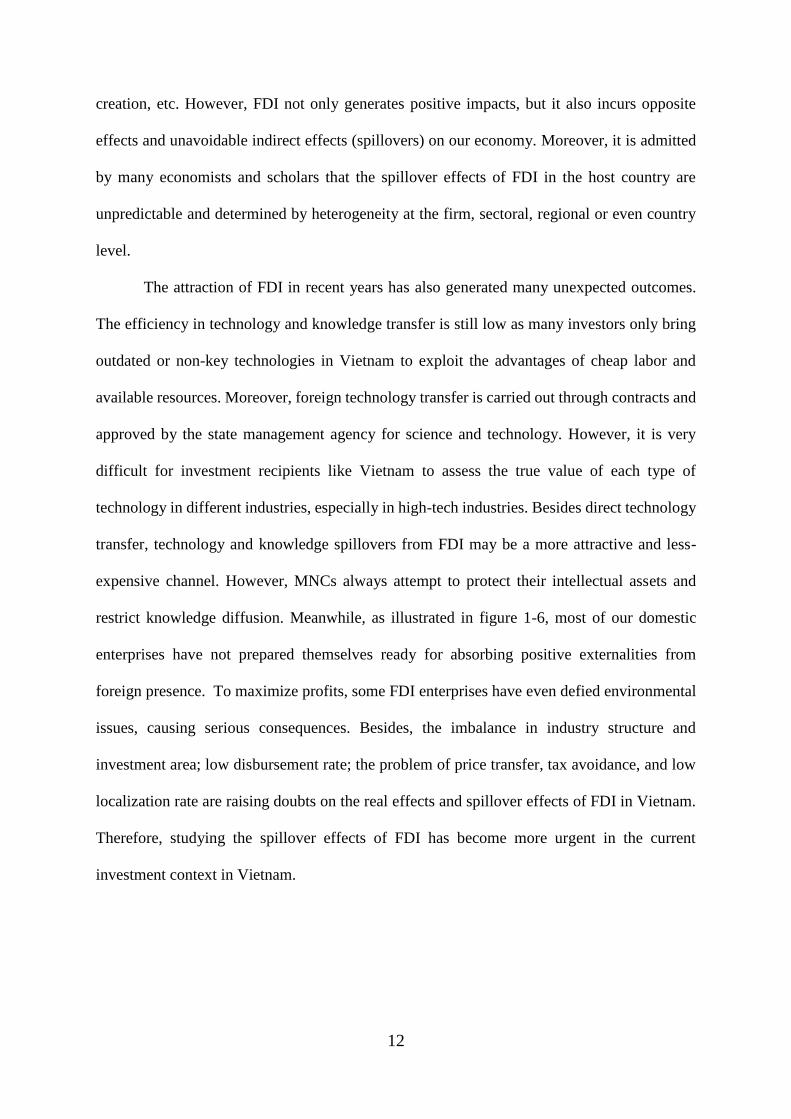
To further comprehend FDI spillovers in transition economies, the World Economic
Forum has provided the ranking on some relevant indicators reflecting how efficiently a
country can perform to absorb positive FDI externalities over two periods: 2014-2015 and
2017-2018. As in figure 1-6, the ranked indicators across three transition economies Vietnam,
China and Thailand include provincial competitiveness index (PCI), availability of new
11
technology, firm's absorptive capacity, FDI and technology transfer, number of local suppliers,
quality of local suppliers, intra-industry distribution, value chain width, and talent attraction. It
has been illustrated in figure 1-6 that the lower the column is, the better the performance is.
The ranking position of Vietnam's all spillover indicators is far behind two neighboring
countries - China and Thailand which appear to be pretty good performers in the region. It is
optimistic to observe that Vietnam's indicators are significantly improved in the later period
2017-2018, except the indicator for the quality of local suppliers. The worst indicators in
Vietnam belong to the availability of new technology, the firm's absorptive capacity, number
and quality of local suppliers and value chain width (around 120th ranking position). Overall,
figure 1-6 indicates that Vietnam has not well prepared for absorbing FDI spillovers.
Figure 1-6: Ranking in some indicators of FDI spillover. (Note: the lower the column is, the
better the performance is). Source: World Economic Forum WEF (2014, 2017), translated by
the author
Although Vietnam has achieved high economic growth and is known as a relatively
dynamic country under foreign presence, FDI's overall effect is very complicated. The role of
FDI has been appreciated by host countries with many expectations for investment capital
provision, export promotion, technology transfer, human resource development, and job
12
creation, etc. However, FDI not only generates positive impacts, but it also incurs opposite
effects and unavoidable indirect effects (spillovers) on our economy. Moreover, it is admitted
by many economists and scholars that the spillover effects of FDI in the host country are
unpredictable and determined by heterogeneity at the firm, sectoral, regional or even country
level.
The attraction of FDI in recent years has also generated many unexpected outcomes.
The efficiency in technology and knowledge transfer is still low as many investors only bring
outdated or non-key technologies in Vietnam to exploit the advantages of cheap labor and
available resources. Moreover, foreign technology transfer is carried out through contracts and
approved by the state management agency for science and technology. However, it is very
difficult for investment recipients like Vietnam to assess the true value of each type of
technology in different industries, especially in high-tech industries. Besides direct technology
transfer, technology and knowledge spillovers from FDI may be a more attractive and less-
expensive channel. However, MNCs always attempt to protect their intellectual assets and
restrict knowledge diffusion. Meanwhile, as illustrated in figure 1-6, most of our domestic
enterprises have not prepared themselves ready for absorbing positive externalities from
foreign presence. To maximize profits, some FDI enterprises have even defied environmental
issues, causing serious consequences. Besides, the imbalance in industry structure and
investment area; low disbursement rate; the problem of price transfer, tax avoidance, and low
localization rate are raising doubts on the real effects and spillover effects of FDI in Vietnam.
Therefore, studying the spillover effects of FDI has become more urgent in the current
investment context in Vietnam.
13
1.3 Significance of the study
1.3.1 Research gap
To provide a more comprehensive picture of the direct and indirect effects of inward
FDI on firm productivity and wage, the dissertation has developed a conceptual framework
presenting the relevant theoretical concepts and the relationships among these elements,
followed by a research model.
Recent meta-analyses on FDI spillovers have emphasized the importance of separating
spillover effects through different transmission channels (Demena & Bergeijk, 2017; Demena
& Bergeijk, 2019; Rojec & Knell, 2017). To further clarify the issue, Rojec & Knell (2017)
have recommended that future researches should differentiate between horizontal and vertical
spillovers, especially backward and forward spillovers generated by established vertical
linkages between local firms and foreign affiliates. These authors claimed that many previous
researchers often focused on analyzing horizontal spillovers while it is less likely to occur than
vertical ones. Thus, the first research objective attempts to fill this gap investigating FDI
spillovers through different spreading mechanisms including horizontal spillover, vertically
backward spillover and vertically forward spillover. To achieve this objective, instead of using
only one indicator as in most of the previous studies, the thesis further complicates the FDI
presence by measuring three dimensions of spillovers. The use of multi-dimensional indicators
can help to compare and have a more comprehensive assessment of the FDI spillover effects.
Besides, the combination uses of FEM, REM and GMM approaches help reinforce the
robustness of research findings.
Besides, Behera (2017) and Anwar, Sun, & Anwar (2018) have indicated the lack of
recent substantive evidence and no or deficient inclusion of firm heterogeneity in recent studies
leads to the bias against no or negative spillovers. It may not be true due to the efforts of MNCs
to prevent the transfer of their technological secrets and intangible assets to their competitors
14
or outsiders (Demena & Bergeijk, 2017). There is no doubt that not every MNCs are willing to
spread their knowledge and not every local enterprise is ready to benefit from foreign presence.
In short, the issues relating to biased spillover estimations may come from the following
reasons as no differentiation between horizontal and vertical spillovers and no or deficient
consideration of host firms’ absorptive capacity and heterogeneity (Demena & Bergeijk, 2017;
Rojec & Knell, 2017). To overcome this, Rojec & Knell (2017) and (Jacobs et al., 2017)
encourage the examination of firm heterogeneity in further researches that may better capture
the variability in spillover outcomes such as geographical distance and absorptive capacity of
domestic firms defined by firm heterogeneity. To fill this gap, the research objectives 2, 3
and 4 in the dissertation aim at examining the moderating variables as absorptive capacities in
term of human capital, technology gap, financial development, regional and provincial
proximity that interact with FDI spillover proxies to recognize the primary facilitators or
barriers of the positive spillover effects.
In addition to capital provision and potential productivity spillover, foreign presence in
emerging countries may also contribute to employment creation, skills and capacity building
for local workers, labor productivity improvement; thereby affecting employees’ wages and
bargaining power (Javorcik, 2015; Nguyen & Ramstetter, 2017). Nguyen (2015) finds
significantly positive wage discrimination between the FDI sector and the local sector in the
host country based on data of Vietnamese manufacturing firms from 2000 to 2009. Also, the
wages paid by multinational corporations (MNCs) and joint venture and state-owned
enterprises (SOEs) are significantly higher than those paid by domestic private firms
controlling for size, capital intensity, education and gender ratio (Nguyen & Ramstetter, 2017).
Although the wage discrimination between foreign and domestic sectors is reflected in recent
researches in Vietnam, there is no or deficient researches on whether foreign presence benefits
the wages of local workers and whether this kind of wage externalities vary across ownership
15
types. Therefore, the research objectives 5 is targeted to answer the above questions. It has
been shown in the research results that productivity and wage diffusion vary significantly
across firms and regions with specific characteristics. Besides, the research results from the
latest panel data (2007-2015) will provide the up-to-date empirical findings and implications
for FDI spillover effects in Vietnam which is useful for managers, policy-makers and further
researchers concerning inward FDI spillovers. It is worth to note that the second research
branch on wage spillovers could be considered as the most significant gap contributing to the
current literature of FDI spillovers in emerging countries.
1.3.2 Research objectives
Based on the above justifications and significance, the dissertation attempts to fulfill
the following research objectives by employing a large panel of Vietnamese manufacturing
enterprises from 2007 to 2015:
1. First, investigating the effects of FDI spillovers through both vertical and horizontal
channels on domestic firms’ productivity.
2. Second, exploring the moderating effects of absorptive capabilities in terms of human
capital, technology gap and financial development on productivity spillovers from FDI
firms to Vietnamese manufacturing firms.
3. Third, examining whether productivity spillovers through vertical and horizontal
channels are associated with regional effects.
4. Fourth, examining whether local firms in provinces located within 100 square
kilometers (sq. km.) of eight cities/ provinces with the highest FDI concentration
receive greater FDI spillovers than those located outside 100 sq. km of these areas.
5. Finally, investigating the effect of horizontal (intra-industry) FDI spillover on the
average wage of domestic employees and whether ownership types influence wage
spillovers from FDI.
16
1.3.3 Research questions
Based on the above research objectives, the dissertation aims at answering the following
research questions for further hypotheses testing:
1. Is there a positive/negative relationship between the productivity of Vietnamese
domestic companies and horizontal/ vertically backward/ vertically forward
technology spillovers from FDI firms?
2. Whether the relationship between FDI spillovers and productivity of domestic firms is
improved with a higher level of human capital?
3. Whether the relationship between FDI spillovers and productivity of domestic firms is
lower at the top 25th and bottom 25th percentile of the technology gap and is enhanced
at the middle 25th-75th percentile of the technology gap?
4. Whether the relationship between FDI spillovers and productivity of domestic firms is
improved with a higher level of financial development?
5. Whether FDI spillover effect on domestic firm productivity vary significantly across
geographical/ economic regions and higher in more FDI-intensive regions?
6. Is there a positive relationship between horizontal FDI spillovers and the average wage
of local firms? And whether this relationship varies across ownership types?
1.3.4 Practical significance
The findings of the thesis are expected to help the policymakers to review the policies
and other institutional factors on national investment and domestic firms, given a backdrop for
the very open economy of Vietnam and the fast-changing international trade, global
investment, and economy. In this way, the good practices and timely policies at both authorized
and managerial levels may enhance the FDI spillovers and benefit the local stakeholders
(Krammer, 2015; Willem, 2019). First, the research results of the thesis, especially on the
existence of spillover effects from FDI, provide significant empirical evidence for
17
policymakers and forecasters about FDI's outcomes, spillover mechanisms as well as its
influential factors, facilitators or barriers to better orient their policies. FDI presence along with
its intensity and externalities have both temporary and long-term impacts on local productivity
and economic growth. Therefore, the timely intervention or incentives at policy-making level
may generate the positive changes on domestic production factors and local firms' capabilities
to build up local strengths and proactively response to the continuous shifts in the economy
toward FDI penetration (Demena & Murshed, 2018; Newman et al., 2019; Willem, 2019). It is
very necessary to realize the power as well as the drawbacks of knowledge spillovers and make
good preparation in terms of policies and long-run industry, regional and national planning
(Barnes, Roose, Heap, & Turner, 2016; Willem, 2019). In this way, it is urgent for Vietnam to
better understand and know what should be done to sustain local firms and the economy under
the situation of increasing FDI inflows.
Second, as the research results indicate the importance of firm heterogeneity in
determining the magnitude of productivity spillovers and wage spillovers, it is worth for firms
in domestically manufacturing industries to implement appropriate strategies and set priorities.
It is worth to realize that positive FDI spillover itself does not only occur automatically but
also highly associated with local firms' absorptive capacities as well as relentless efforts
through improving competitiveness and strengthening vertical linkage collaborations with
foreign partners, especially for newly global participants from the third world (Anwar et al.,
2018; Newman et al., 2019). Hence, the local enterprises' top management must understand the
spillover transmission channels and the mechanisms of how they occur in reality to maximize
the positive effects by enhancing their strengths, recognizing and taking advantage of the
relevant strategies and policies.
Third, the thesis is implemented after Vietnam signed some important free trade
agreements with strategic partners such as Russia-Belarus-Kazakhstan Customs Union
18
(December 2014) and South Korea (May 2015). Thus, the research results from the latest panel
data (2007-2015) will provide the up-to-date empirical findings for FDI spillover effects in
Vietnam which is useful for managers, policy-makers and subsequent researchers in the field
of international business. In this way, the findings can serve as a basis for proposing
suggestions and implications to promote the effect of positive productivity spillovers and wage
spillovers from FDI firms to Vietnamese enterprises and local workers.
1.4 Methodology and Data
1.4.1 Methodology
The thesis uses the Cobb-Douglas production function model as a basis to estimate the
impact of FDI spillovers of foreign subsidiaries on the total factor productivity of domestic
enterprises. This approach allows analysis and testing of technology spillover effects from FDI
through non-traditional factors, namely the total factor productivity. The proxies for FDI
spillovers are established using three indicators of horizontal FDI spillovers, vertically
backward spillovers, and vertically forward spillovers to investigate the existence of (1) the
productivity spillovers and (2) wage spillovers from FDI. In terms of econometric techniques,
the model of spillover effects from FDI is estimated using large panel data, including fixed
effect model (FEM) and random effect model (REM), then selecting the appropriate model by
Hausman test. Additionally, the approach of dynamic panel data (GMM) and statistical tests
are conducted to check for the resulting robustness.
1.4.2 Data
The thesis uses secondary panel data at the enterprise level for the period from 2007 to
2015. Data is collected from the Enterprise Survey conducted by the General Statistics Office.
After the screening and filtering process, the final data set included in the analysis is 385,976
observations (period: 2011-2015) for estimating productivity spillovers from FDI and 693,720
observations (period: 2007-2015) for examining the effect of horizontal FDI spillover on the
19
average wage. Besides, the thesis also uses input-output matrices in 2012 and 2015 to estimate
vertical FDI spillovers between FDI firms and their locally upstream suppliers or downstream
consumers.
1.5 Thesis organization
The organization of the thesis is divided into five chapters. Firstly, chapter 1 briefly
provides an introduction to the thesis. Secondly, chapter 2 aims at reviewing relevant
theoretical and empirical literature of foreign direct investment and spillover effects, thereby
developing the conceptual framework, research model and hypotheses. Thirdly, chapter 3 is
targeted to identify and present the research methodology with proper justification. Fourthly,
chapter 4 analyzes and discusses research results. Finally, Chapter 5 provides conclusions and
implications on the spillover effects of FDI in Vietnam.
20
LITERATURE REVIEW
Chapter 2 presents the theoretical concepts on FDI, MNCs, types of FDI and effects on
the host economy, thereby recognizing the existence of FDI spillovers in terms of (1)
productivity spillovers and (2) wage spillovers – two main focuses of this study. The chapter
is expected to provide a big picture of both theoretical and empirical aspects of FDI spillovers,
thereby justifying the research gap and establishing an appropriate econometric model
estimation. Specifically, this chapter will discuss the different transmissions channels of FDI
spillovers and the possible moderating variables to identify the research gap for proposing a
theoretical framework. The relevant empirical background is presented in the next section with
a discussion of previous empirical results from different perspectives to propose and estimate
the research model as well as make the relevant comparisons and implications among different
authors’ research findings and suggestions.
2.1 FDI definition
Foreign direct investment (FDI) has become a popular form of investment for decades
and has been defined by scholars, international economic organizations as well as national laws
of most countries. According to Boddewyn (1985) and Moosa (2002), FDI can be considered
as a form of long-term investment of individuals or companies of a country (delivering country)
into another country (receiving country) by establishing production and business. In other
words, FDI is the transfer of capital, property, technology or any asset from the home country
to the host country to establish or control an enterprise for profit-making purposes.
By their investment, foreign individuals or companies will acquire the ownership of
assets and the control of all business and manufacturing activities of their establishment in the
host country. In this way, the management aspect of control is the key to distinguish FDI from
other financial instruments (Li & Rugman, 2007). In most cases, the properties/ assets the
21
investor manages abroad are business establishments. In such cases, investors are often called
"parent companies" and assets are well-known as "subsidiaries" or "branch
companies"(Schneider & Frey, 1985). As a result, the global expansion of these subsidiaries in
the host economies leads to the establishment of “Multinational companies/ corporations”
(MNCs) as in (Blomstrom & Kokko, 1998; Chittoor, 2009) that will be defined more clearly
in the latter part.
Further, Vietnam’s Investment Law in 2014 defines FDI as follows: FDI refers to the
fact that foreign investors bring their capital in cash or any assets into Vietnamese territory to
conduct the investment (Assembly, Republic, & Investment, 2014). Direct investment is a form
of investment that the investors invest their capital and get involved in the management
activities of their investment in the host economy (Assembly et al., 2014). By this definition,
FDI can be distinguished from foreign indirect investment. To be considered as a foreign direct
investment, the investment must be large enough to take control of the company abroad. The
United Nations determined that the parent company must own at least 10 percent or more of
the company's shares or voting rights. More important, FDI is an investment occurring through
a private channel, which is different from the official development assistance (ODA)
investment of the Government or international organizations. Besides, Vietnam’s Investment
Law in 2014 also mentions the concept of FDI enterprises including enterprises established by
foreign investors to carry out investment activities in Vietnam; and Vietnamese enterprises are
bought; merged or acquired by foreign investors (Assembly et al., 2014).
To further clarify the FDI definition, Brewer (1992) discussed the particular
characteristics of FDI enterprises including (1) establish the rights and obligations of investors
to where (the firm in the host country) they are invested, (2) establish their ownership with the
right to manage the invested capital, (3) FDI can also be seen as the market expansion of
multinational enterprises and organizations, (4) Demonstrate investors' rights to transfer
22
technology and techniques to local firms in the host country and (5) there is the involvement
and companion of many financial markets and international trade. Based on these
characteristics, the effect of FDI on the host economy will be discussed later.
2.2 Multinational corporations (MNCs) definition
In the popular book focusing on FDI theories and practices, Moosa (2002) defines
multinational corporations (MNCs) or multinational enterprises (MNEs) are companies that
have business operations or service provisions in at least two countries. Specifically, MNCs
initially establish their parent company in one country (origin/ home country), then make direct
investments in other countries to form affiliates in term of subsidiaries (incorporated with major
administrative power (stake > 50 percent) and voting right); associates (incorporated, stake at
least 10 percent and non-dominant voting right) or branches (unincorporated, refer to host
country’s fixed assets, wholly-owned or joint venture).
There are many different terms mentioned to describe the business activities of a
company in many different countries such as 'international', 'multinational' and 'transnational'
due to recent changes like the international business operation (Moosa, 2002; Blomstrom &
Kokko, 1998; Byun & Wang, 1995). These changes include the establishment of business
operations and production in many different countries; cross-border import and export
worldwide regardless of where the goods are produced; new forms of transnational buying-
selling activities (payment, transportation, etc…) (Chittoor, 2009). Indeed, these terms can be
used interchangeably. Thus, in this thesis, the term “multinational corporations (MNCs)” or
FDI firms will be used interchangeably to refer the foreign firms implementing FDI in a host
economy.
Similar to other kinds of business entities, MNCs' fundamental goal is to maximize the
shareholders’ wealth. The achievement of this target is reflected in the increasing value of
23
stocks and dividends at moderate risk. Therefore, MNCs have strongly focused on
implementing international expansion and product diversification strategy (Görg &
Greenaway, 2004). The inter-connected relationships in MNCs and their advantages are
reflected by the transfer of technology, knowledge, resources and management know-how from
the parent firm to its affiliates or among affiliates themselves (Wang & Blomström, 2002).
Multinational companies (MNCs) can be classified into three large groups according to
their production orientation, strategy and integration degree (as mentioned before) in the host
country (Blomstrom & Kokko, 1998). Firstly, horizontal MNCs are established and operated
in terms of horizontal FDI integration (as mentioned in the previous part – FDI classification)
to produce similar products in different countries; for example, the worldwide fast-food chain
of McDonald's from the US. Similarly, vertical MNCs are motivated to establish the
subsidiaries in other countries aimed at developing upstream and downstream sectors (supply
of inputs, distribution) of their core product; for example, Adidas – the sports fashion
corporation from Germany with different subsidiaries producing unrelated products. Finally,
multi-dimensional MNCs have production facilities in different countries that collaborate both
horizontally and vertically; for instance, Microsoft - The world's largest software production
corporation.
Besides, Temiz & Gokmen (2014) emphasized the importance and impacts of MNCs
in the world economy by providing a comprehensive picture of MNCs’ penetration worldwide.
According to these authors' statistics, 500 largest multinational companies are controlling more
than two-thirds of world trade, in which most transactions are made between MNCs and their
subsidiaries or among their affiliates. However, the location of these MNCs is uneven, with the
majority of more than 63,000 MNCs in the world having headquarters in the US, Europe, and
Japan.
24
2.3 FDI classifications and its natures
The types of FDI or foreign affiliates are primarily driven by various investors’
motivations and targets (Dunning, 2000). In practice, there are many different ways to classify
FDI depending on investment motivations, investors' perspective, the host country's
perspective and ownership structure (Moosa, 2002; Denisia, 2010).
2.3.1 Classified by foreign investment motivations
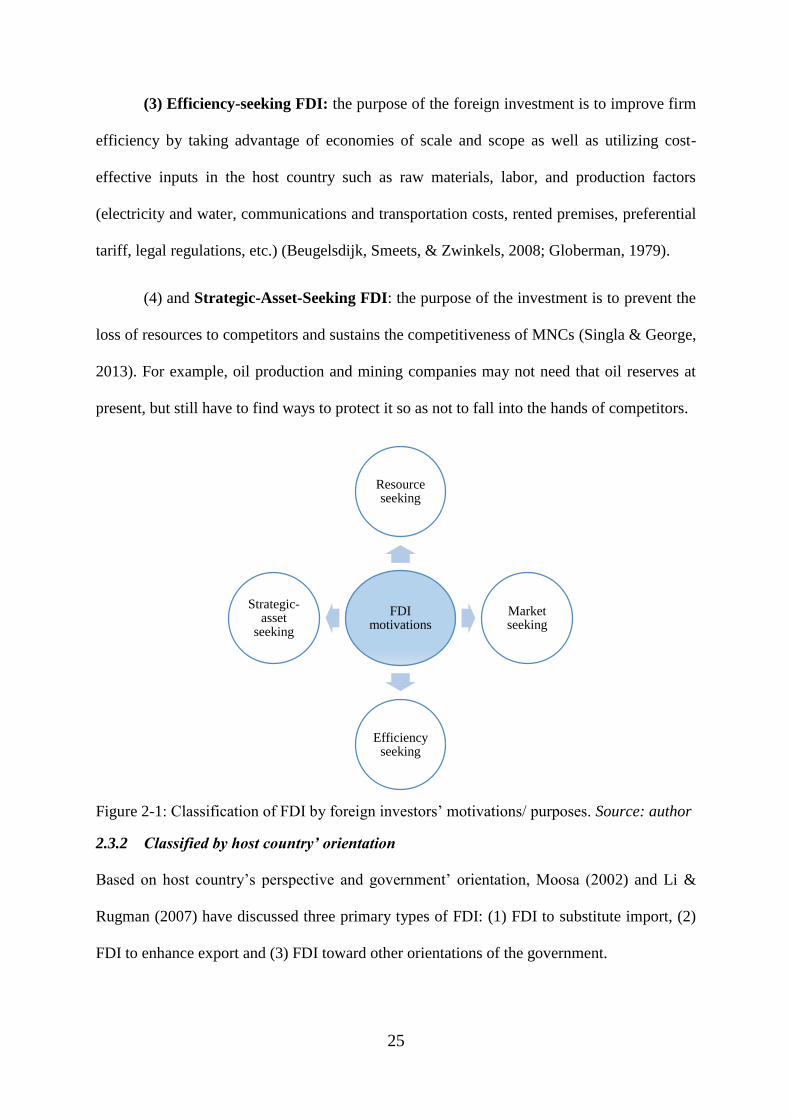
Based on investment motivations, FDI can be categorized by four different types
including resource-seeking FDI, market-seeking FDI, efficiency-seeking FDI, and strategic-
asset-seeking FDI.
(1) Resource-seeking FDI: in this case, the nature of the foreign capital inflows is to
exploit cheap and abundant natural and human resources in the host country, especially
emerging countries (for example; cheap labor in Southeast Asia, oil in Middle Eastern) (Calvet,
2014; Denisia, 2010; Harrison & Aitken, 1999). Importantly, abundant labor resources that
may be poor in skills but at low prices are very attractive for MNCs (Blomstrom & Kokko,
1998). Also, this kind of capital is aimed at exploiting available assets in the host country such
as popular tourist destinations and intellectual properties (Chittoor, 2009; Temiz & Gokmen,
2014). Besides, the dispute for strategic resources from competitors is undeniably a wise
purpose of foreign investors.
(2) Market-seeking FDI: the investment capital is aimed at penetrating new markets
or maintaining existing markets (Contractor, Kumar, & Kundu, 2007; Welch & Welch, 1996).
In addition, the purpose of the investment is to take advantage of economic cooperation
agreements and trade preferential agreements between host countries and other countries and
regions, using the receiving country as a springboard to penetrate regional and global markets
(Ni et al., 2017).
25
(3) Efficiency-seeking FDI: the purpose of the foreign investment is to improve firm
efficiency by taking advantage of economies of scale and scope as well as utilizing cost-
effective inputs in the host country such as raw materials, labor, and production factors
(electricity and water, communications and transportation costs, rented premises, preferential
tariff, legal regulations, etc.) (Beugelsdijk, Smeets, & Zwinkels, 2008; Globerman, 1979).
(4) and Strategic-Asset-Seeking FDI: the purpose of the investment is to prevent the
loss of resources to competitors and sustains the competitiveness of MNCs (Singla & George,
2013). For example, oil production and mining companies may not need that oil reserves at
present, but still have to find ways to protect it so as not to fall into the hands of competitors.
Figure 2-1: Classification of FDI by foreign investors’ motivations/ purposes. Source: author
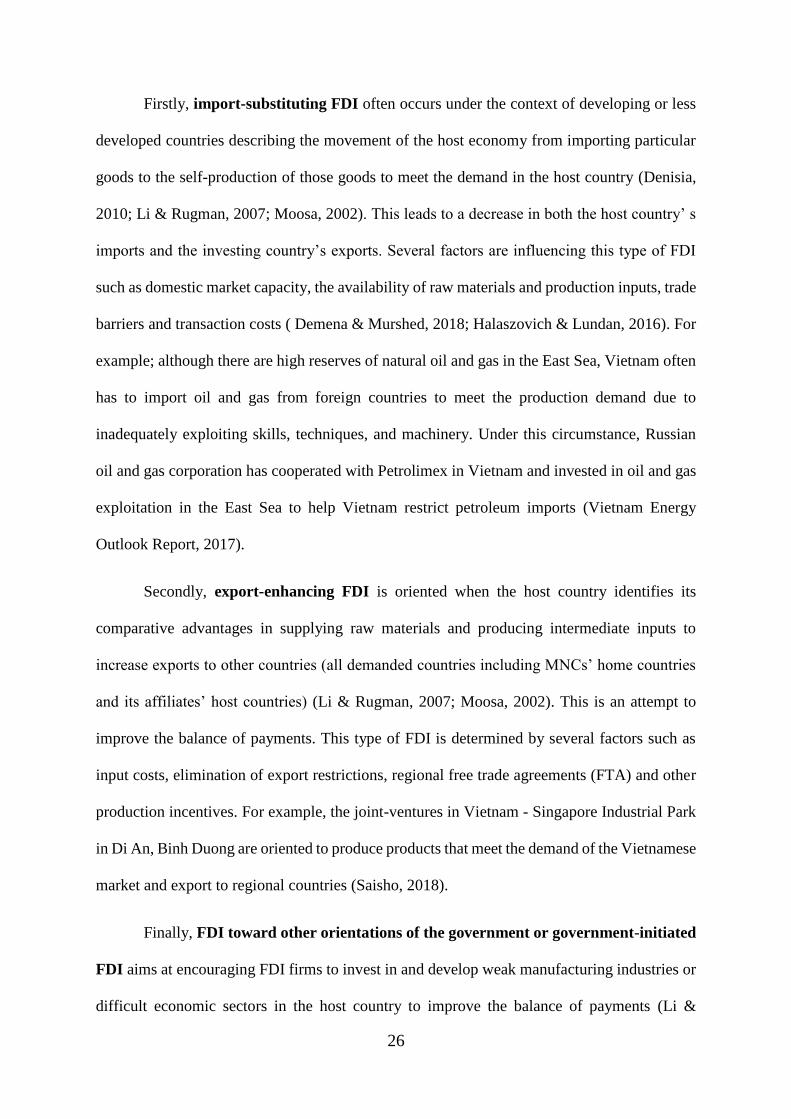
2.3.2 Classified by host country’ orientation
Based on host country’s perspective and government’ orientation, Moosa (2002) and Li &
Rugman (2007) have discussed three primary types of FDI: (1) FDI to substitute import, (2)
FDI to enhance export and (3) FDI toward other orientations of the government.
FDI motivations
Resource seeking
Market seeking
Efficiency seeking
Strategic-asset
seeking
26
Firstly, import-substituting FDI often occurs under the context of developing or less
developed countries describing the movement of the host economy from importing particular
goods to the self-production of those goods to meet the demand in the host country (Denisia,
2010; Li & Rugman, 2007; Moosa, 2002). This leads to a decrease in both the host country’ s
imports and the investing country’s exports. Several factors are influencing this type of FDI
such as domestic market capacity, the availability of raw materials and production inputs, trade
barriers and transaction costs ( Demena & Murshed, 2018; Halaszovich & Lundan, 2016). For
example; although there are high reserves of natural oil and gas in the East Sea, Vietnam often
has to import oil and gas from foreign countries to meet the production demand due to
inadequately exploiting skills, techniques, and machinery. Under this circumstance, Russian
oil and gas corporation has cooperated with Petrolimex in Vietnam and invested in oil and gas
exploitation in the East Sea to help Vietnam restrict petroleum imports (Vietnam Energy
Outlook Report, 2017).
Secondly, export-enhancing FDI is oriented when the host country identifies its
comparative advantages in supplying raw materials and producing intermediate inputs to
increase exports to other countries (all demanded countries including MNCs’ home countries
and its affiliates’ host countries) (Li & Rugman, 2007; Moosa, 2002). This is an attempt to
improve the balance of payments. This type of FDI is determined by several factors such as
input costs, elimination of export restrictions, regional free trade agreements (FTA) and other
production incentives. For example, the joint-ventures in Vietnam - Singapore Industrial Park
in Di An, Binh Duong are oriented to produce products that meet the demand of the Vietnamese
market and export to regional countries (Saisho, 2018).
Finally, FDI toward other orientations of the government or government-initiated
FDI aims at encouraging FDI firms to invest in and develop weak manufacturing industries or
difficult economic sectors in the host country to improve the balance of payments (Li &
27
Rugman, 2007; Moosa, 2002). For example, the Vietnamese government has recently offered
many incentives for foreign investors investing in developing green energy projects such as
solar power plants or biomass-power plants. These projects are environmentally friendly and
contribute to sustaining the energy supply in Vietnam in the long run (Wte, 2018).
Figure 2-2: Classification of FDI by the host country's orientation. Source: author
2.3.3 Classified by FDI ownership
In practice, foreign direct investors can choose the level of control they wish to
maintain in the new establishments (Denisia, 2010; Moosa, 2002). This can be achieved
through full or partial ownership. Ownership indicates the level of control over business
issues - for example, new product decisions, business expansion and profit-sharing (Riahi-
Belkaoui, 1996). Companies can choose between a wholly-owned enterprise or a joint
venture to gain their expected control (Li & Rugman, 2007). This choice will determine the
level of financial commitment or the equity share of the company to foreign ventures.
(1) Wholly owned direct investment establishes an enterprise that foreign investors
hold 100 percent of their assets abroad. In this way, the parent company has
complete control over the operations of the subsidiary.
Ho
st c
ou
ntr
y's
FD
I ori
enta
tion
Import-substituting
Export-increasing
Government-initiated
28
(2) A joint venture describes a cooperation partnership in which an enterprise is
established through joint property or investment of two or more firms. A partner in
a joint venture may hold a majority, 50-50 or hold very little ownership. Ownership
often refers to the level of control; however, how the board of management is
established and how voting rights are distributed among partners will more
accurately reflect the relative strength of partners.
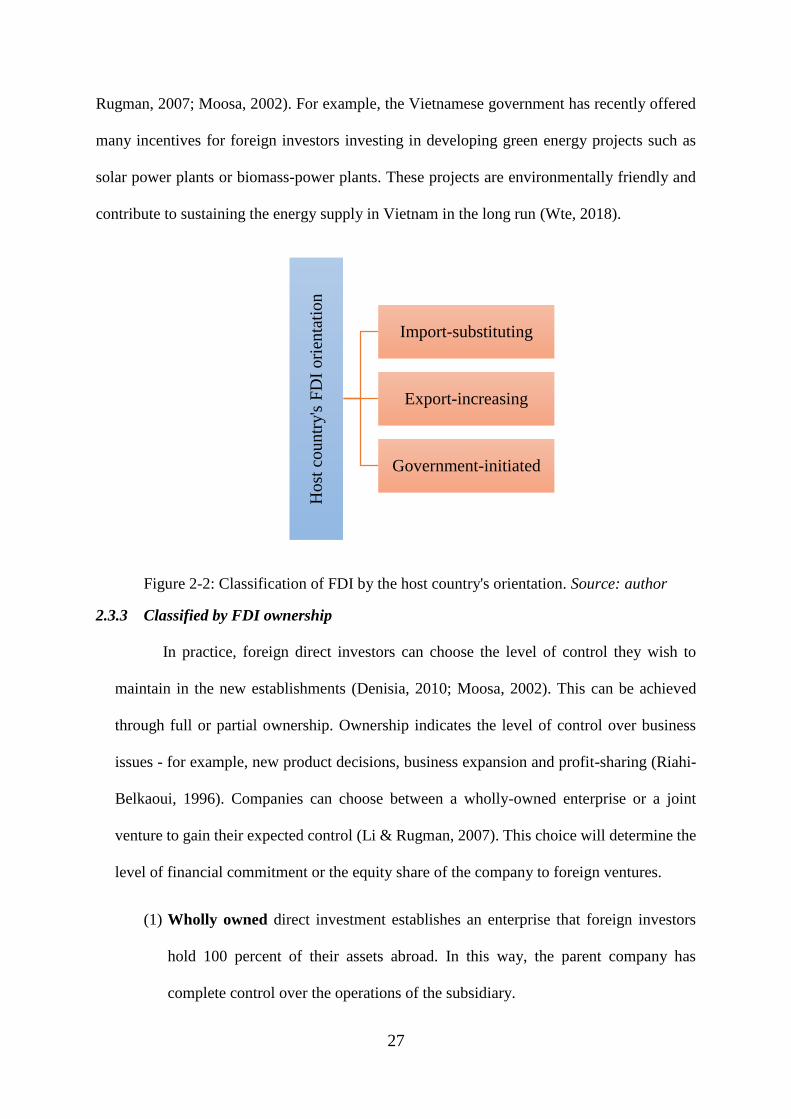
2.3.4 Classified by foreign investors’ orientation and FDI integration level
Based on investors’ orientation and the degree of FDI integration, FDI can be classified
into three types of horizontal FDI, vertical FDI and conglomerate FDI (Caves, 1974; Moosa,
2002).
Firstly, vertical FDI describes firm’s expansion activities to develop the upstream and
downstream sector of its value chain (Blomström & Sjöholm, 1999; Giroud, 2007). Vertical
FDI includes forward vertical integration and backward vertical integration. Forward vertical
integration means that the FDI company develops the ability to sell its outputs by investing in
a downstream value chain – for instance, marketing and sales activities (Behera, 2017). Further,
forward integration is less popular than backward vertical integration, whereby the company
seeks to supply inputs to its own domestic or foreign subsidiaries by investing in value chain’s
upstream sector – for example, factories or assembly plants (Javorcik & Spatareanu, 2011).
Foreign-invested firms can establish both forward and backward FDI activities to enhance their
procurements, production, and distribution. For example, Honda owns both auto parts suppliers
and auto dealers/ distributors in different countries.
Secondly, horizontal FDI describes MNCs’ entry mode to the same industry in a
foreign country and produce the identical products as in the home country (Caves, 1974;
Christophe & Pfeiffer, 2002; Le & Pomfret, 2011). For example, Microsoft's core business is
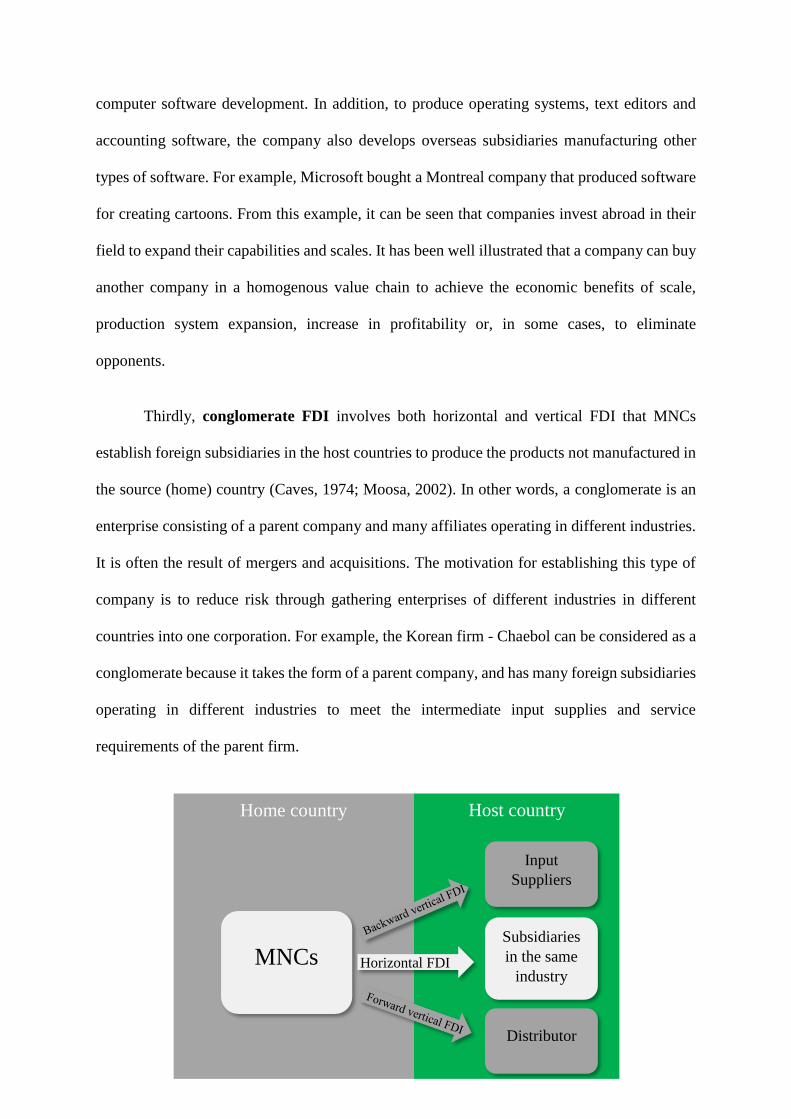
29
computer software development. In addition, to produce operating systems, text editors and
accounting software, the company also develops overseas subsidiaries manufacturing other
types of software. For example, Microsoft bought a Montreal company that produced software
for creating cartoons. From this example, it can be seen that companies invest abroad in their
field to expand their capabilities and scales. It has been well illustrated that a company can buy
another company in a homogenous value chain to achieve the economic benefits of scale,
production system expansion, increase in profitability or, in some cases, to eliminate
opponents.
Thirdly, conglomerate FDI involves both horizontal and vertical FDI that MNCs
establish foreign subsidiaries in the host countries to produce the products not manufactured in
the source (home) country (Caves, 1974; Moosa, 2002). In other words, a conglomerate is an
enterprise consisting of a parent company and many affiliates operating in different industries.
It is often the result of mergers and acquisitions. The motivation for establishing this type of
company is to reduce risk through gathering enterprises of different industries in different
countries into one corporation. For example, the Korean firm - Chaebol can be considered as a
conglomerate because it takes the form of a parent company, and has many foreign subsidiaries
operating in different industries to meet the intermediate input supplies and service
requirements of the parent firm.
Home country Host country
MNCs
Input
Suppliers
Subsidiaries
in the same
industry Horizontal FDI
Distributor
30
Figure 2-3: Vertical FDI and horizontal FDI integration. Source: author, adapted from
Corporate Finance Institute (CFI)
To sum up, the classifications in term of FDI integration and motivations provides a
comprehensive view on how inward FDI integrates into the host economy that may lead to the
tremendous competition, interactions, demonstration, cooperation and linkage relationships
between foreign firms and domestic firms (Aitken, Hanson, & Harrison, 1997). Moreover,
during this process, the unavoidable externalities from foreign presence can be generated and
affect the host economy at both the macro and micro levels (Blomström & Persson, 1983;
Harrison & Aitken, 1999). Therefore, in this dissertation, such types of FDI classifications
are used to investigate and measure the channels of FDI spillovers from MNCs to domestic
owned firms.
2.4 Effect of FDI on the host economy
As the world witnessed a huge wave of globalization and trade liberalization, MNCs
competed to implement FDI to pursue tremendous advantages from efficient production
locations outside its home country’s border (Dominguez & Mayrhofer, 2015). Accordingly,
these companies promote investment abroad to exploit the comparative advantages of the
recipient countries and take advantage of preferential policies, thereby reducing production
costs and improving their competitiveness (Amber, 2014). The growth of MNCs is also an
indicator of important changes in the ongoing political and economic world. Internationally,
MNCs are also considered as pioneers in the research and development of new technologies
and an important source for poverty reduction in Third World countries (Herrera-Echeverri,
Haar, & Estévez-Bretón, 2014). Under the increase of liberal global trade, MNCs are the key
actors conducting trade activities and holding more power in establishing international trade
regulations.
31
On the one hand, MNCs are praised to contribute to the economic growth of recipient
countries and domestic firms’ productivity, especially emerging countries by providing capital,
transferring technology and managerial skills and positive externalities (Blomstrom & Kokko,
1998; Goh, 2005; Javorcik, 2004a; Wang & Blomström, 2002). Moreover, MNCs also create
more jobs, increase gross domestic income, as well as improve standards of living in the host
country (Herrera-Echeverri et al., 2014). By implementing their direct investment and business
activities, MNCs can also help host countries change the economic structures, expand import
and export, and thereby integrate more deeply into the global economy (Beugelsdijk et al.,
2008; Silajdzic & Mehic, 2016).
On the other hand, some scholars criticize FDI enterprises as exploiters of natural
resources, cheap labor and actors of serious pollution in host countries while most of their
profits are repatriated (Chung, 2014; Decreuse & Maarek, 2015; Rugman, 2016). Thus, if the
proportion of FDI accounted for is too large in the total investment capital in a host country,
that country’s economy has become vulnerable, external dependent and unstable in the long
run. Besides, FDI enterprises, by their financial and technological strengths, also exert fierce
competitive pressure on domestic enterprises leading to exit or crowding-out effects (Hamida,
2013; Perri et al., 2013).
There is no doubt that inward FDI affects different aspects of the host country's
economy in both positive and negative ways. Moosa (2002) discussed different direct and
indirect effects of FDI presence including the effects on recipient countries' economic growth,
employment and wage, trade flows, productivity, technology transfer, and linkage
relationships.
32
2.4.1 The effects of FDI on economic growth
Investment is an extremely important factor affecting economic growth. Investment
capital for economic development is mobilized from two main sources, domestic capital, and
foreign capital. Domestic capital is formed through savings and investment. Foreign capital is
formed through commercial loans, indirect investment and foreign direct investment (FDI)
activities. In transition economies, it has been revealed that that FDI is a very important factor
for economic development, especially in an inefficient domestic credit market (Anwar &
Nguyen, 2010; Silajdzic & Mehic, 2016). FDI, by its nature, has created an effective measure
is to raise capital for investment, mobilize resources to develop the host country ’s economy.
Inward FDI in a host economy may stimulate other MNC's capital inflows and even
domestic savings to enhance investments and improve the balance of payments. These inward
financial resources are characterized by long-term commitment and stability in comparison to
other kinds of capital inflows such as ODA or commercial loans (Moosa, 2002). Moreover,
MNCs' presence may not only result in the capital provision but also the spillovers of superior
technology, machinery and intangible assets such as management know-how, innovative
processes, and skills (Blomstrom & Kokko, 1998; Globerman, 1979). As a result, the
combination of sufficient capital stock and efficient utilization of existing resources undeniably
converge the favorable conditions for an increase in labor productivity and output leading to
economic growth in the host country.
2.4.2 The effect of FDI on employment and wage
Inward FDI will lead to the establishment of new businesses or an increase in the size/
scale of existing firms in the host economy; thereby creating more jobs (Denisia, 2010). This
triggers the positive effects on developing countries’ labor market which is characterized by
abundant labor resources. Under the emergence and expansion of FDI enterprises, local
workers employed and trained by the FDI sector also acquire plenty of knowledge to improve
33
their technical skills, working styles (disciplines, work organization) and further bargaining
power (Onaran & Stockhammer, 2008). Interestingly, the workforce at the management level
will acquire a wide range of cross-cultural and regional superior knowledge such as
international market access, negotiation, trade promotion, and human resource management.
To provide a more comprehensive picture of wage spillovers from FDI, Javorcik (2015)
conducted a theoretical and empirical review of previous studies on the effect of FDI on wages
under worker perspective and host-country perspective. The author aims at answering the
question "Does FDI bring good jobs to the host countries?". From a worker perspective, the
author analyses whether and to which extent foreign presence influences wage, training
opportunities and job stability of local workers in the host country (Barnes et al., 2016; Fukase,
2014). From a host-country perspective, knowledge transfer, productivity advantages and FDI
externalities are key points of attention and discussions (Blomstrom & Kokko, 1998; Wang et
al., 2012). To achieve the research objectives, the authors focus on analyzing a wide range of
FDI-related indicators such as TFP, value-added per worker, output, employment, average
wage, intra-industry(horizontal) spillover, investment, export share, import input share, K-L
ratio, skilled labor ratio, capital utilization. To sum up, Javorcik (2015) indicated higher
compensation and better jobs in terms of training and increase in aggregate productivity from
both worker and host-country perspective. Another finding is positive intra-industry spillover
on productivity which is supported by many previous studies (Damijan, Rojec, Majcen, &
Knell, 2013a; Du, Harrison, & Jefferson, 2012).
In addition, FDI inflows also contribute to improving workers' income because wages
paid by FDI enterprises are often greater than wages paid domestic ones (Nguyen, 2015;
Nguyen & Ramstetter, 2017). Moreover, FDI firms often organize onsite or offsite training
courses for local workers; thereby forming a skilled workforce and accumulated human capital
for the recipient country (Görg, Strobl, & Walsh, 2007). It is widely proved that the competition
34
between FDI enterprises and domestic enterprises in the labor market is a factor that motivates
the workforce to raise their qualifications to obtain higher compensations (wages) and
bargaining power.
However, FDI projects lead to the loss in many traditional jobs as a result of land
acquisition for FDI projects. In particular, the worker mobilization of FDI enterprises is more
inclined to exploit cheap and low-skill labor resources and even use a probationary mechanism
to continuously replace labor. Besides, the host country can also bear the "brain drain" effect
because FDI projects often attract talents through high compensation and a professional
working environment (Sampson, 2013). Indeed, FDI enterprises have many strategies to
prevent the turnover of skilled workers from MNCs to domestic firms (Görg et al., 2007).
2.4.3 The effects of FDI on trade flows
The relationship between FDI and trade are substitutes or complements also depends
on host countries and industry-specific characteristics (Moosa, 2002). By identifying host
countries' differences, similarities in terms of factor endowments, foreign investors may decide
to establish vertical FDI or horizontal FDI for implementing their substitute or complement
strategies (Trigeorgis & Reuer, 2017). The substituting production of identical products
implemented by horizontal FDI refers to a decline in host countries' imports. On the other hand,
complementing production implemented by vertical FDI lead to an increase in host countries'
imports of intermediate inputs and exports of finished goods.
Moreover, inward FDI is often motivated by the goals of market and export expansion.
In this way, the comparative advantages of the host country in production input factors are
exploited more effectively in the international division of labor. Because developing countries
are not able to produce at a competitive cost, they still face difficulties in penetrating the
international market (Wang & Blomström, 2002). It is admitted that MNCs play an important
35
role in expanding exports due to their position, prestige, and reputation in the international
market. Therefore, encouraging export-oriented FDI is a special incentive in FDI attraction
policies of these countries. Through FDI, domestic firms in the recipient country can access
the world market and enhance their competitiveness and internationalization experiences over
time.
2.4.4 The effect of FDI on productivity
Previous parts discussed the importance of export-enhancing FDI on stimulating
positive trade flows, economic growth and productivity spillovers (Blomstrom & Kokko, 1998;
Caves, 1974). This part continues to emphasize its power to optimize the economies of scale
leading to lower unit cost and higher productivity. In contrast, import-substituting FDI may
prevent local firms from reaching an optimized production scale and achieving a higher level
of productivity (Schaumburg-Müller, 2003). In such cases, small market size may be a
determinant for production inefficiency.
Nevertheless, besides the impacts of FDI on scale efficiency and unit costs, productivity
of domestic-owned enterprises are more likely affected by other host determinants at firm,
industry and country level such as firm's absorptive capacity and efficient use of resources,
industry characteristics (for example labor-intensive industry versus capital-intensive industry)
and government restrictions or incentives to business practices (Moosa, 2002). Furthermore, it
is worth to note that the process of technology diffusion delivered by FDI is a necessarily
decisive condition for FDI – productivity relationships. This issue will be discussed in the
following part.
2.4.5 FDI and technology transfer
FDI is considered as an important source to promote technology development of the
country receiving FDI. In practice, new technology is introduced by foreign investors through
36
the acquisition of patents or innovations and the improvement and customization of imported
technology for domestic use (as the cases of Japan and Korea) (Forte & Moura, 2013). When
implementing an investment project in a country, foreign investors not only bring capital,
machinery, equipment and raw materials, but also the intellectual and intangible assets such as
technology, scientific knowledge, management know-how, and market access experiences into
the host economy (Denisia, 2010). It is believed that FDI presence not only increases domestic
firms' exposures and opportunities in bolstering technology transfer but also accelerate this
progress (Wang & Blomström, 2002).
Moreover, there is the mobilization of foreign and indigenous experts in the areas
related to the project. This allows local firms in recipient country easily import technology and
be more accessible to MNCs' advanced technology, innovative processes, and knowledge
(Blomstrom & Kokko, 1998). Besides, FDI also contributes to enhancing the host country's
research and development capacity (Calvet, 2014). It is undeniable that most of the R&D
activities of foreign subsidiaries overseas are improving their existing technologies to suit local
use conditions. In this way, foreign investors have created many interrelated linkages to provide
technology services from domestic research and application institutions; thereby strengthening
local capacity in technology development.
2.4.6 FDI and inter-industries linkages
Based on their investing purposes, MNCs attempt to establish inter-linkage relationships
with local enterprises in the receiving country to expand and sustain their production network
and subsidiaries (Blomström & Sjöholm, 1999). In this way, foreign affiliates may trigger the
direct impacts or indirect externalities (spillovers) in terms of productivity and employment on
domestic firms via such kinds of inter-industry linkages. On the one hand, FDI firms are
motivated to build upstream linkages with local manufacturers/ suppliers to ensure a stable and
standardized supply of materials/ inputs. On the other hand, to expand the market and ensure
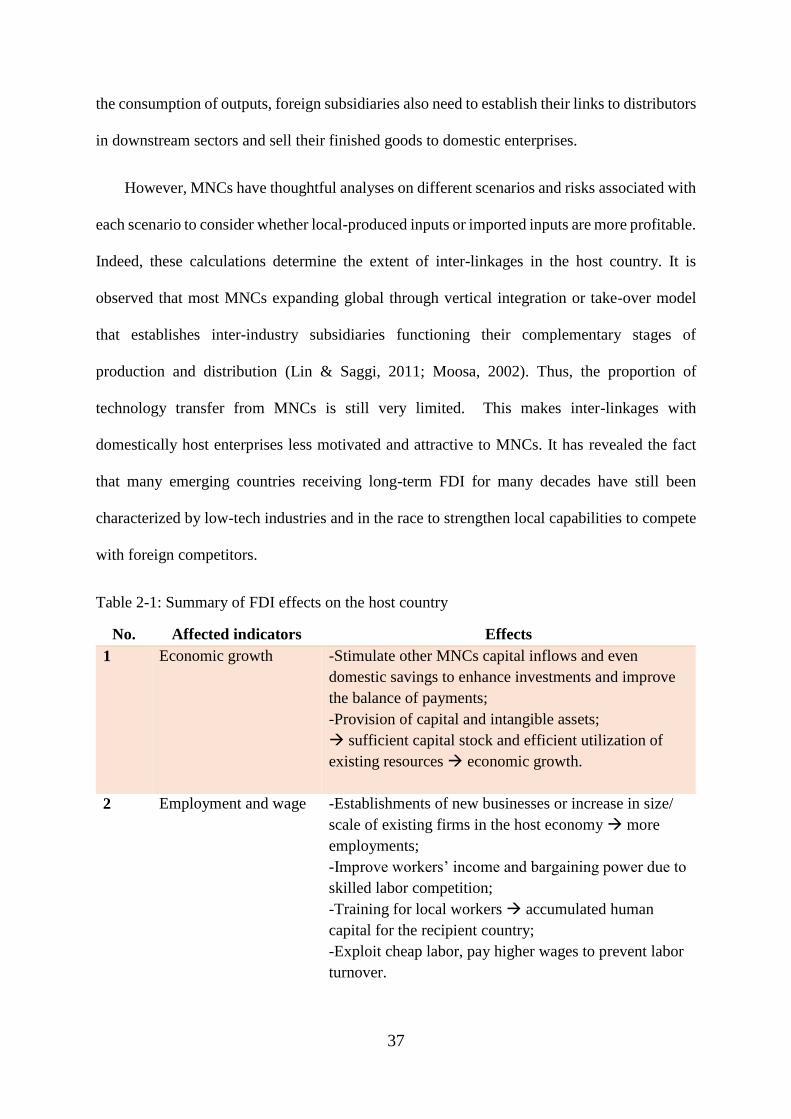
37
the consumption of outputs, foreign subsidiaries also need to establish their links to distributors
in downstream sectors and sell their finished goods to domestic enterprises.
However, MNCs have thoughtful analyses on different scenarios and risks associated with
each scenario to consider whether local-produced inputs or imported inputs are more profitable.
Indeed, these calculations determine the extent of inter-linkages in the host country. It is
observed that most MNCs expanding global through vertical integration or take-over model
that establishes inter-industry subsidiaries functioning their complementary stages of
production and distribution (Lin & Saggi, 2011; Moosa, 2002). Thus, the proportion of
technology transfer from MNCs is still very limited. This makes inter-linkages with
domestically host enterprises less motivated and attractive to MNCs. It has revealed the fact
that many emerging countries receiving long-term FDI for many decades have still been
characterized by low-tech industries and in the race to strengthen local capabilities to compete
with foreign competitors.
Table 2-1: Summary of FDI effects on the host country
No. Affected indicators Effects
1 Economic growth -Stimulate other MNCs capital inflows and even
domestic savings to enhance investments and improve
the balance of payments;
-Provision of capital and intangible assets;
sufficient capital stock and efficient utilization of
existing resources economic growth.
2 Employment and wage -Establishments of new businesses or increase in size/
scale of existing firms in the host economy more
employments;
-Improve workers’ income and bargaining power due to
skilled labor competition;
-Training for local workers accumulated human
capital for the recipient country;
-Exploit cheap labor, pay higher wages to prevent labor
turnover.
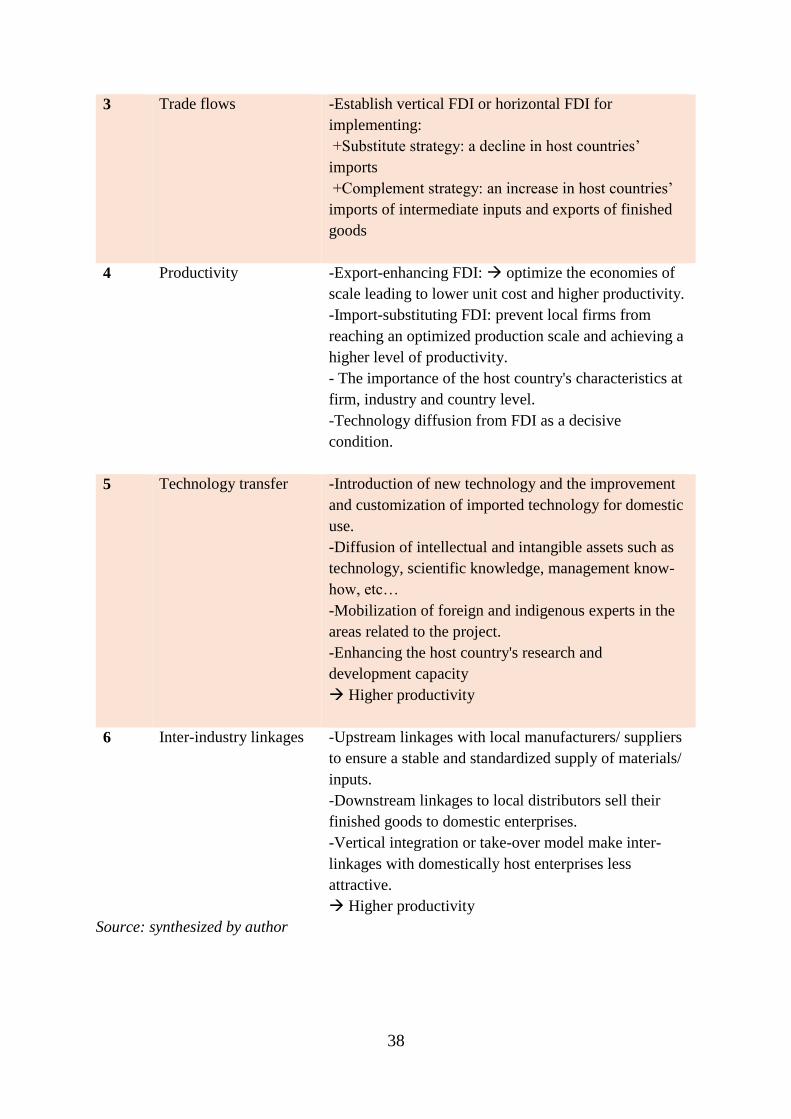
38
3 Trade flows -Establish vertical FDI or horizontal FDI for
implementing:
+Substitute strategy: a decline in host countries’
imports
+Complement strategy: an increase in host countries’
imports of intermediate inputs and exports of finished
goods
4 Productivity -Export-enhancing FDI: optimize the economies of
scale leading to lower unit cost and higher productivity.
-Import-substituting FDI: prevent local firms from
reaching an optimized production scale and achieving a
higher level of productivity.
- The importance of the host country's characteristics at
firm, industry and country level.
-Technology diffusion from FDI as a decisive
condition.
5 Technology transfer -Introduction of new technology and the improvement
and customization of imported technology for domestic
use.
-Diffusion of intellectual and intangible assets such as
technology, scientific knowledge, management know-
how, etc…
-Mobilization of foreign and indigenous experts in the
areas related to the project.
-Enhancing the host country's research and
development capacity
Higher productivity
6 Inter-industry linkages -Upstream linkages with local manufacturers/ suppliers
to ensure a stable and standardized supply of materials/
inputs.
-Downstream linkages to local distributors sell their
finished goods to domestic enterprises.
-Vertical integration or take-over model make inter-
linkages with domestically host enterprises less
attractive.
Higher productivity
Source: synthesized by author
39
2.5 The theories of FDI
Moosa (2002) has synthesized the theories of FDI in a very systematic way to recognize
the main assumptions, drawbacks as well as provide empirical evidence for these theories.
Three categories of FDI theories mentioned in the book include (1) theories assuming perfect
markets, (2) theories assuming imperfect markets and (3) other theories providing different
perspectives to explain why firms invest in a foreign country.
2.5.1 Theories assuming perfect markets
Firstly, the theories of perfect markets assume that no producer or consumer has the
right or ability to control the market and affect the prices (Denisia, 2010). Perfect competition
is expected to lead to high economic efficiency (Li & Rugman, 2007). Studies of the perfect
market provide the basis for the theory of supply and demand. Important assumptions for a
perfectly competitive model can be established as follows:
All exchanged goods are considered the same. That is, goods must be of the
same quality and quantity. Goods sold are not different in terms of
specifications, qualities, and designs. Buyers do not have to care about who they
buy those units of goods from.
All sellers and buyers have a full understanding of the information related to
trading and exchanging.
There is nothing to prevent a buyer or seller from entering or exiting from the
market.
Therefore, to maintain competitive advantages, the firms in the perfect market are
forced to find various ways to reduce costs in terms of FDI or differentiate their products from
competitors. Because the above assumptions rarely occur in practice, perfect market is just an
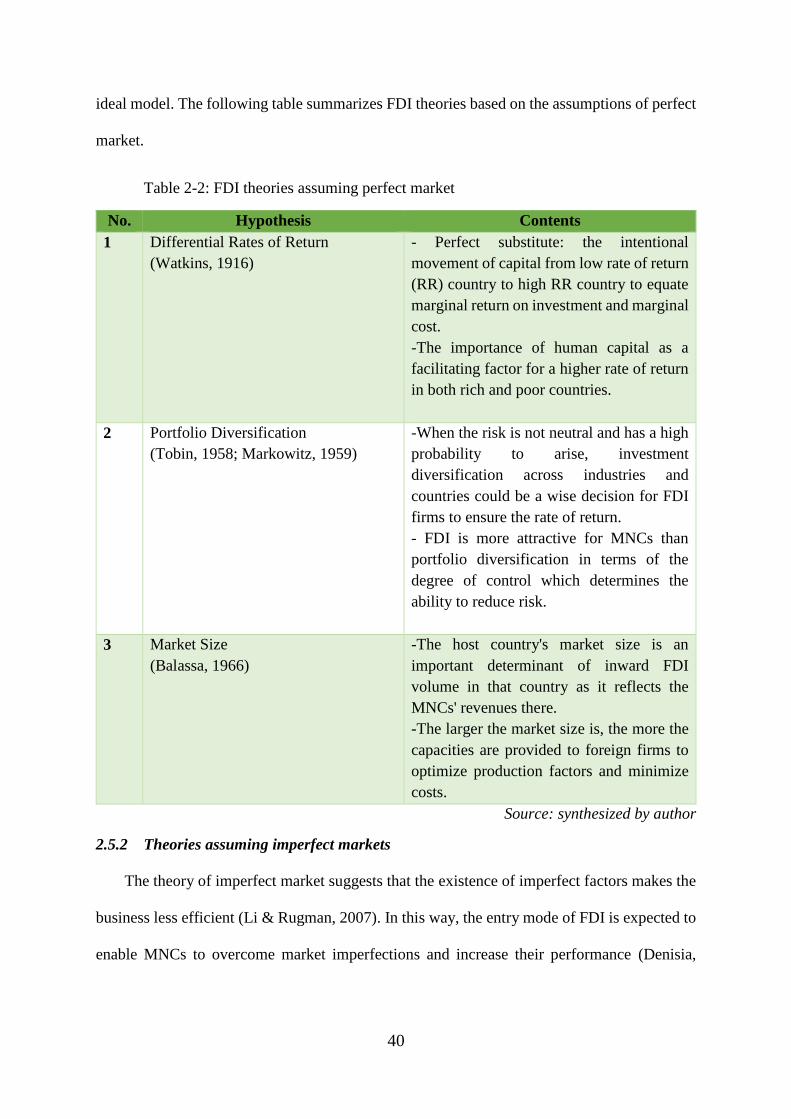
40
ideal model. The following table summarizes FDI theories based on the assumptions of perfect
market.
Table 2-2: FDI theories assuming perfect market
No. Hypothesis Contents
1 Differential Rates of Return
(Watkins, 1916)
- Perfect substitute: the intentional
movement of capital from low rate of return
(RR) country to high RR country to equate
marginal return on investment and marginal
cost.
-The importance of human capital as a
facilitating factor for a higher rate of return
in both rich and poor countries.
2 Portfolio Diversification
(Tobin, 1958; Markowitz, 1959)
-When the risk is not neutral and has a high
probability to arise, investment
diversification across industries and
countries could be a wise decision for FDI
firms to ensure the rate of return.
- FDI is more attractive for MNCs than
portfolio diversification in terms of the
degree of control which determines the
ability to reduce risk.
3 Market Size
(Balassa, 1966)
-The host country's market size is an
important determinant of inward FDI
volume in that country as it reflects the
MNCs' revenues there.
-The larger the market size is, the more the
capacities are provided to foreign firms to
optimize production factors and minimize
costs.
Source: synthesized by author
2.5.2 Theories assuming imperfect markets
The theory of imperfect market suggests that the existence of imperfect factors makes the
business less efficient (Li & Rugman, 2007). In this way, the entry mode of FDI is expected to
enable MNCs to overcome market imperfections and increase their performance (Denisia,
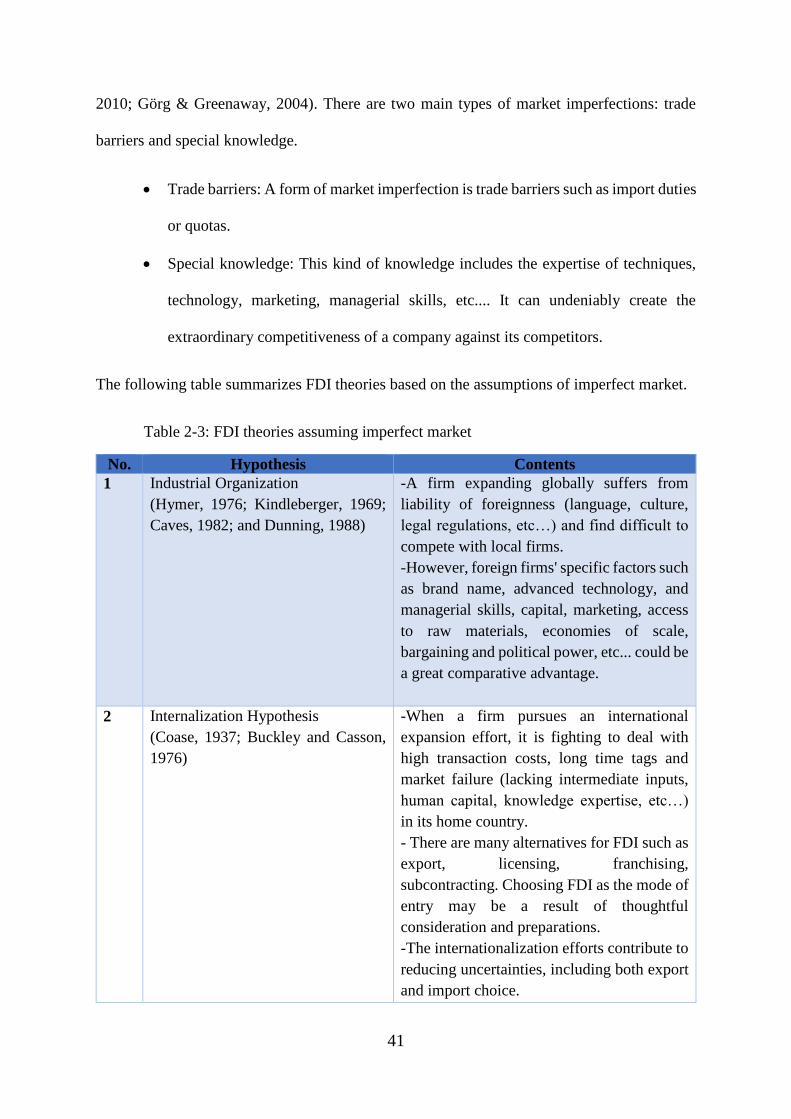
41
2010; Görg & Greenaway, 2004). There are two main types of market imperfections: trade
barriers and special knowledge.
Trade barriers: A form of market imperfection is trade barriers such as import duties
or quotas.
Special knowledge: This kind of knowledge includes the expertise of techniques,
technology, marketing, managerial skills, etc.... It can undeniably create the
extraordinary competitiveness of a company against its competitors.
The following table summarizes FDI theories based on the assumptions of imperfect market.
Table 2-3: FDI theories assuming imperfect market
No. Hypothesis Contents
1 Industrial Organization
(Hymer, 1976; Kindleberger, 1969;
Caves, 1982; and Dunning, 1988)
-A firm expanding globally suffers from
liability of foreignness (language, culture,
legal regulations, etc…) and find difficult to
compete with local firms.
-However, foreign firms' specific factors such
as brand name, advanced technology, and
managerial skills, capital, marketing, access
to raw materials, economies of scale,
bargaining and political power, etc... could be
a great comparative advantage.
2 Internalization Hypothesis
(Coase, 1937; Buckley and Casson,
1976)
-When a firm pursues an international
expansion effort, it is fighting to deal with
high transaction costs, long time tags and
market failure (lacking intermediate inputs,
human capital, knowledge expertise, etc…)
in its home country.
- There are many alternatives for FDI such as
export, licensing, franchising,
subcontracting. Choosing FDI as the mode of
entry may be a result of thoughtful
consideration and preparations.
-The internationalization efforts contribute to
reducing uncertainties, including both export
and import choice.
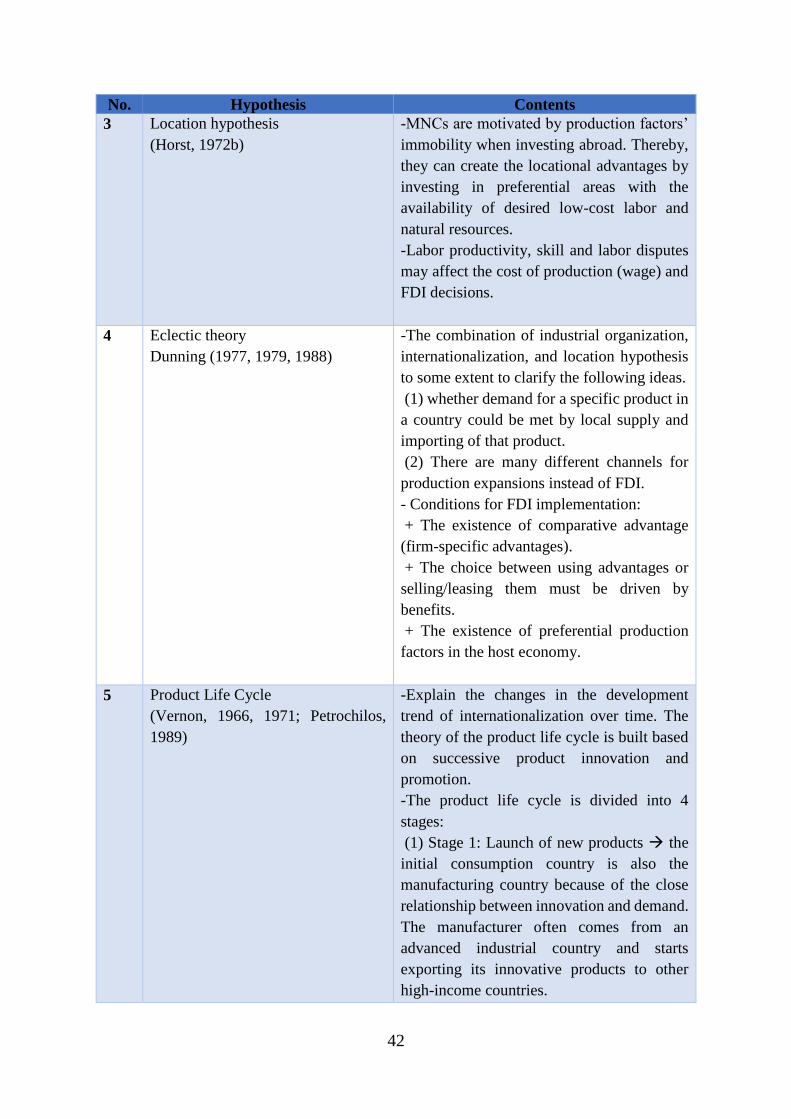
42
No. Hypothesis Contents
3 Location hypothesis
(Horst, 1972b)
-MNCs are motivated by production factors’
immobility when investing abroad. Thereby,
they can create the locational advantages by
investing in preferential areas with the
availability of desired low-cost labor and
natural resources.
-Labor productivity, skill and labor disputes
may affect the cost of production (wage) and
FDI decisions.
4 Eclectic theory
Dunning (1977, 1979, 1988)
-The combination of industrial organization,
internationalization, and location hypothesis
to some extent to clarify the following ideas.
(1) whether demand for a specific product in
a country could be met by local supply and
importing of that product.
(2) There are many different channels for
production expansions instead of FDI.
- Conditions for FDI implementation:
+ The existence of comparative advantage
(firm-specific advantages).
+ The choice between using advantages or
selling/leasing them must be driven by
benefits.
+ The existence of preferential production
factors in the host economy.
5 Product Life Cycle
(Vernon, 1966, 1971; Petrochilos,
1989)
-Explain the changes in the development
trend of internationalization over time. The
theory of the product life cycle is built based
on successive product innovation and
promotion.
-The product life cycle is divided into 4
stages:
(1) Stage 1: Launch of new products the
initial consumption country is also the
manufacturing country because of the close
relationship between innovation and demand.
The manufacturer often comes from an
advanced industrial country and starts
exporting its innovative products to other
high-income countries.
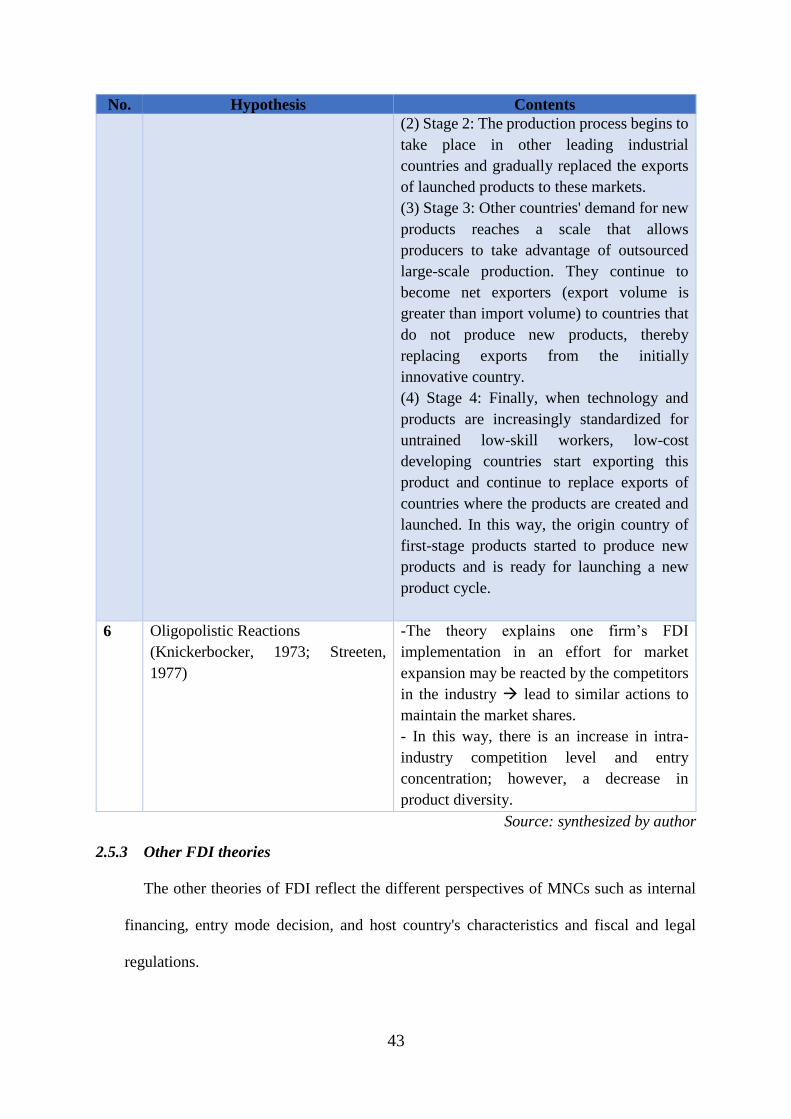
43
No. Hypothesis Contents
(2) Stage 2: The production process begins to
take place in other leading industrial
countries and gradually replaced the exports
of launched products to these markets.
(3) Stage 3: Other countries' demand for new
products reaches a scale that allows
producers to take advantage of outsourced
large-scale production. They continue to
become net exporters (export volume is
greater than import volume) to countries that
do not produce new products, thereby
replacing exports from the initially
innovative country.
(4) Stage 4: Finally, when technology and
products are increasingly standardized for
untrained low-skill workers, low-cost
developing countries start exporting this
product and continue to replace exports of
countries where the products are created and
launched. In this way, the origin country of
first-stage products started to produce new
products and is ready for launching a new
product cycle.
6 Oligopolistic Reactions
(Knickerbocker, 1973; Streeten,
1977)
-The theory explains one firm’s FDI
implementation in an effort for market
expansion may be reacted by the competitors
in the industry lead to similar actions to
maintain the market shares.
- In this way, there is an increase in intra-
industry competition level and entry
concentration; however, a decrease in
product diversity.
Source: synthesized by author
2.5.3 Other FDI theories
The other theories of FDI reflect the different perspectives of MNCs such as internal
financing, entry mode decision, and host country's characteristics and fiscal and legal
regulations.
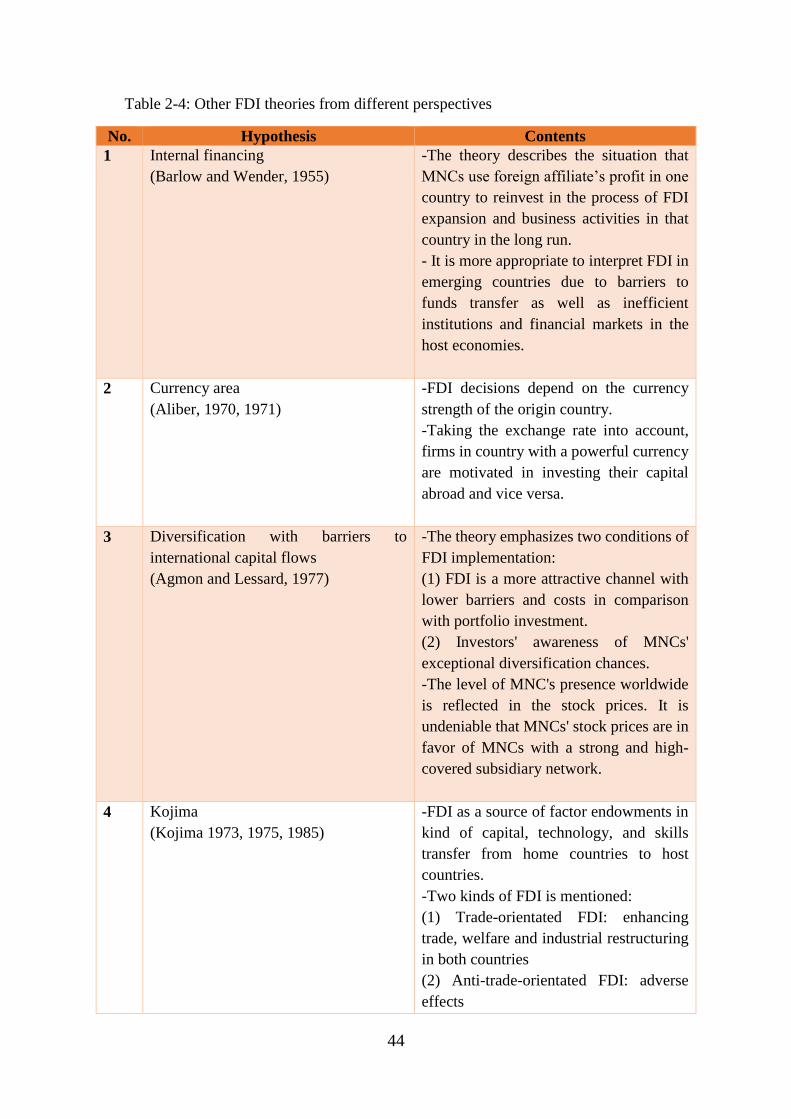
44
Table 2-4: Other FDI theories from different perspectives
No. Hypothesis Contents
1 Internal financing
(Barlow and Wender, 1955)
-The theory describes the situation that
MNCs use foreign affiliate’s profit in one
country to reinvest in the process of FDI
expansion and business activities in that
country in the long run.
- It is more appropriate to interpret FDI in
emerging countries due to barriers to
funds transfer as well as inefficient
institutions and financial markets in the
host economies.
2 Currency area
(Aliber, 1970, 1971)
-FDI decisions depend on the currency
strength of the origin country.
-Taking the exchange rate into account,
firms in country with a powerful currency
are motivated in investing their capital
abroad and vice versa.
3 Diversification with barriers to
international capital flows
(Agmon and Lessard, 1977)
-The theory emphasizes two conditions of
FDI implementation:
(1) FDI is a more attractive channel with
lower barriers and costs in comparison
with portfolio investment.
(2) Investors' awareness of MNCs'
exceptional diversification chances.
-The level of MNC's presence worldwide
is reflected in the stock prices. It is
undeniable that MNCs' stock prices are in
favor of MNCs with a strong and high-
covered subsidiary network.
4 Kojima
(Kojima 1973, 1975, 1985)
-FDI as a source of factor endowments in
kind of capital, technology, and skills
transfer from home countries to host
countries.
-Two kinds of FDI is mentioned:
(1) Trade-orientated FDI: enhancing
trade, welfare and industrial restructuring
in both countries
(2) Anti-trade-orientated FDI: adverse
effects
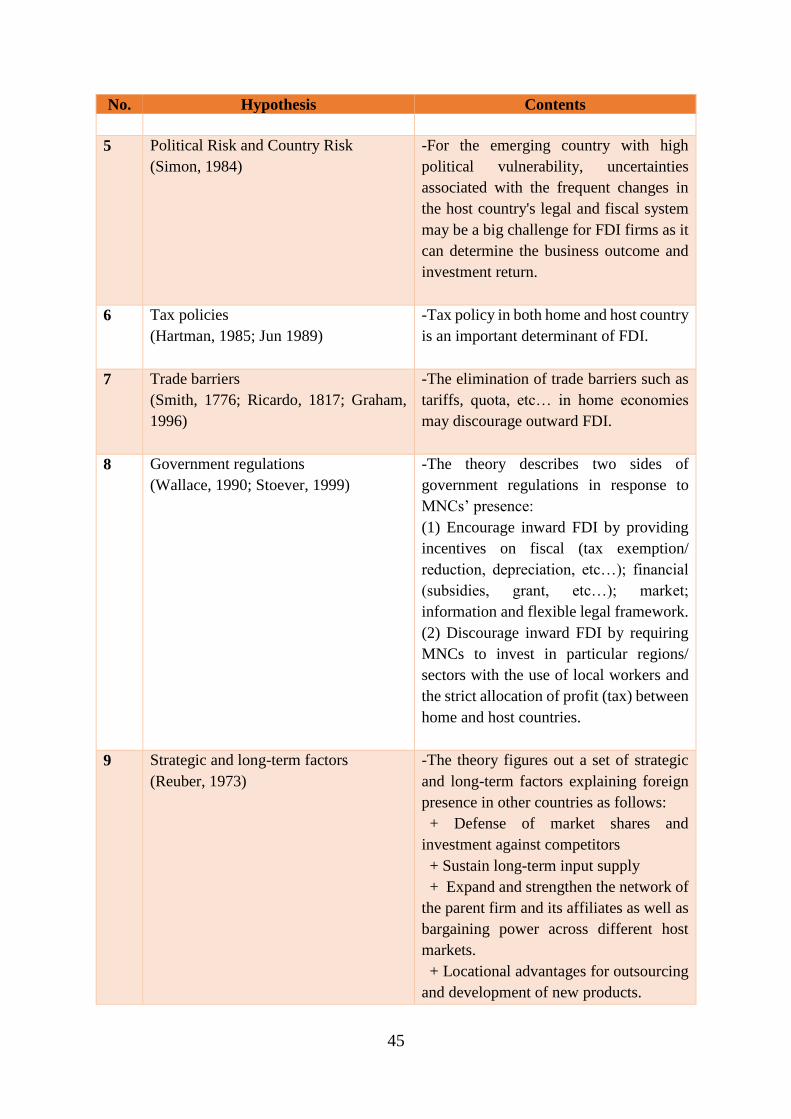
45
No. Hypothesis Contents
5 Political Risk and Country Risk
(Simon, 1984)
-For the emerging country with high
political vulnerability, uncertainties
associated with the frequent changes in
the host country's legal and fiscal system
may be a big challenge for FDI firms as it
can determine the business outcome and
investment return.
6 Tax policies
(Hartman, 1985; Jun 1989)
-Tax policy in both home and host country
is an important determinant of FDI.
7 Trade barriers
(Smith, 1776; Ricardo, 1817; Graham,
1996)
-The elimination of trade barriers such as
tariffs, quota, etc… in home economies
may discourage outward FDI.
8 Government regulations
(Wallace, 1990; Stoever, 1999)
-The theory describes two sides of
government regulations in response to
MNCs’ presence:
(1) Encourage inward FDI by providing
incentives on fiscal (tax exemption/
reduction, depreciation, etc…); financial
(subsidies, grant, etc…); market;
information and flexible legal framework.
(2) Discourage inward FDI by requiring
MNCs to invest in particular regions/
sectors with the use of local workers and
the strict allocation of profit (tax) between
home and host countries.
9 Strategic and long-term factors
(Reuber, 1973)
-The theory figures out a set of strategic
and long-term factors explaining foreign
presence in other countries as follows:
+ Defense of market shares and
investment against competitors
+ Sustain long-term input supply
+ Expand and strengthen the network of
the parent firm and its affiliates as well as
bargaining power across different host
markets.
+ Locational advantages for outsourcing
and development of new products.
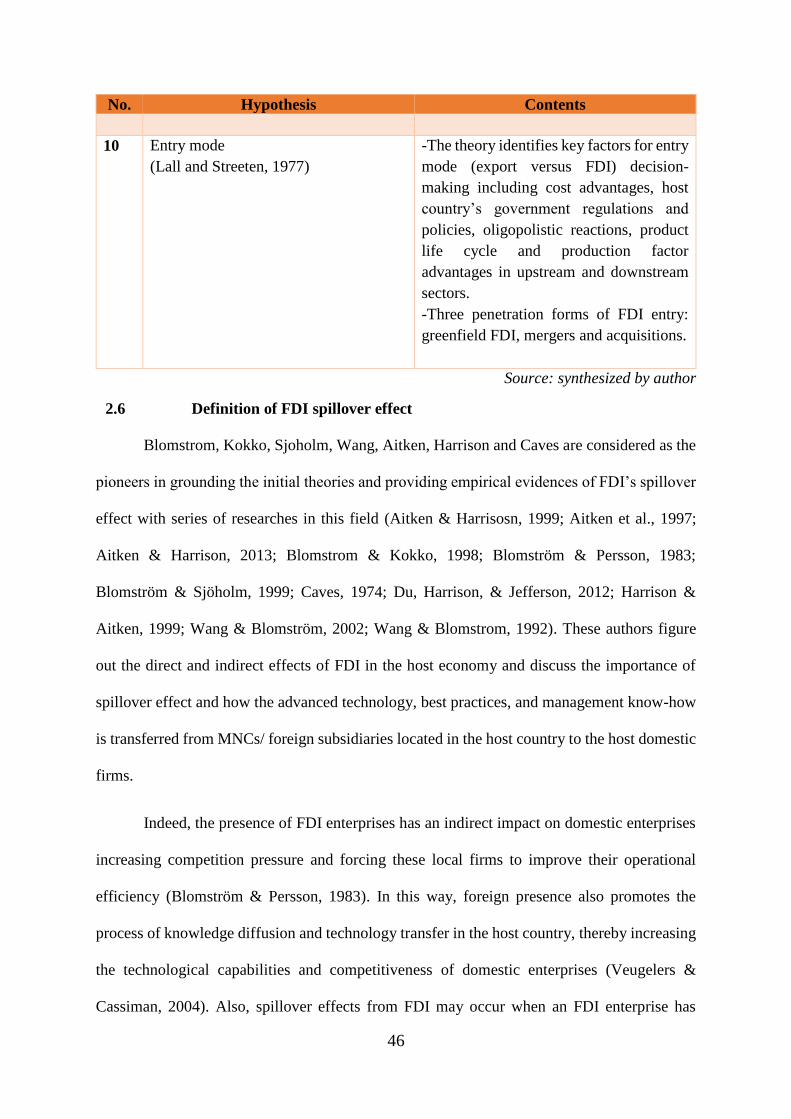
46
No. Hypothesis Contents
10 Entry mode
(Lall and Streeten, 1977)
-The theory identifies key factors for entry
mode (export versus FDI) decision-
making including cost advantages, host
country’s government regulations and
policies, oligopolistic reactions, product
life cycle and production factor
advantages in upstream and downstream
sectors.
-Three penetration forms of FDI entry:
greenfield FDI, mergers and acquisitions.
Source: synthesized by author
2.6 Definition of FDI spillover effect
Blomstrom, Kokko, Sjoholm, Wang, Aitken, Harrison and Caves are considered as the
pioneers in grounding the initial theories and providing empirical evidences of FDI’s spillover
effect with series of researches in this field (Aitken & Harrisosn, 1999; Aitken et al., 1997;
Aitken & Harrison, 2013; Blomstrom & Kokko, 1998; Blomström & Persson, 1983;
Blomström & Sjöholm, 1999; Caves, 1974; Du, Harrison, & Jefferson, 2012; Harrison &
Aitken, 1999; Wang & Blomström, 2002; Wang & Blomstrom, 1992). These authors figure
out the direct and indirect effects of FDI in the host economy and discuss the importance of
spillover effect and how the advanced technology, best practices, and management know-how
is transferred from MNCs/ foreign subsidiaries located in the host country to the host domestic
firms.
Indeed, the presence of FDI enterprises has an indirect impact on domestic enterprises
increasing competition pressure and forcing these local firms to improve their operational
efficiency (Blomström & Persson, 1983). In this way, foreign presence also promotes the
process of knowledge diffusion and technology transfer in the host country, thereby increasing
the technological capabilities and competitiveness of domestic enterprises (Veugelers &
Cassiman, 2004). Also, spillover effects from FDI may occur when an FDI enterprise has
47
difficulties in protecting its intellectual assets through the leak from training and labor turnover
(Blomström & Persson, 1983; Caves, 1974). Furthermore, FDI enterprises can also actively or
intentionally share information as well as transfer technology and managerial skills to domestic
enterprises in their upstream and downstream linkage chain (Görg & Greenaway, 2004).
Spillover effects are defined as foreign influences derived from intentional or
unintentional interactions between economic entities over time (David & Rosenbloom, 1990).
In this way, the FDI spillover effect is a very popular term in the field of international
economics describing the effects of MNCs’ economic activities on domestic host firms’
business activities and performances even though these two business activities are not related
and integrated (Blomstrom & Kokko, 1998). FDI spillover effect can be understood as the
intentional or unintentional externalities on the local firms or the host economy created by the
foreign equity presence in the host country (Caves, 1974). In other words, the FDI spillover
effect occurs when MNCs’ activity has side effects that exceed the initial prediction. For
example, when MNCs invest in a certain country, they may intentionally or unintentionally
help local enterprises in that countries increase their competitiveness by expanding the market,
penetrating new resources, acquiring modern technology, and producing more valuable
products. However, MNCs' presence may also lead to the exits of low-efficient domestic firms
that fail to compete with the giants in the intra-industry.
The two established forms of FDI spillovers include productivity spillover and market
access spillover (Blomstrom & Kokko, 1998). Productivity spillover associated with FDI as
this important phenomenon offers the best opportunities for domestic firms in the host country
observe, imitate and upgrade their existing technology and inherit the advanced business
practices to improve their firm's productivity at a lower cost (Aitken & Harrison, 1999; Aitken
et al., 1997).
48
2.7 Channels of FDI spillovers
To analyze and measure FDI enterprises’ externalities on domestic enterprises,
spillover effects can be classified according to different delivery channels and integration
direction in production supply chains (Blomstrom & Kokko, 1998; Blomström & Sjöholm,
1999; Damijan, Rojec, Majcen, & Knell, 2013b).
2.7.1 Transmission mechanisms of FDI spillovers
FDI may spill over through four primary channels including imitation/ demonstration,
labor turnover, competition and inter-linkage relationships with foreign subsidiaries.
2.7.1.1 Imitation/ Demonstration
Imitation or demonstration is considered the most obvious spillover channel. When a
country that receives a new technology without previous usage experiences and knowledge
transfer will incur huge costs and face greater risks in using such technology (Damijan et al.,
2013a). If the technology has been successfully applied by an MNC, domestic companies will
be more accessible to and use the technology more efficiently (Hamida & Gugler, 2009).
Through FDI, these MNCs will bring advanced technology into the host country by the
establishment of subsidiaries or branches. Besides, the appearance of FDI enterprises will
encourage domestic enterprises to innovate technology through establishing joint ventures with
foreign partners or through technology transfer from FDI enterprises (Blomström & Sjöholm,
1999; Iršová & Havránek, 2013). However, the level of efficient use of technology also
depends on the absorption capacity of domestic firms (Sourafel Girma, 2005; Jacobs et al.,
2017; Marin & Sasidharan, 2010).
2.7.1.2 Labor turnover
The second spillover channel occurs when domestic firms hire workers who have
worked at MNCs (Blomstrom & Kokko, 1998; Fosfuri, Motta, & Rønde, 2001). It is obvious
49
that these workers are knowledgeable about technology and can apply to domestic enterprises.
More important, the spillover effect will even be stronger if these qualified workers use their
accumulated knowledge from MNCs in their own business/ startups (Damijan et al., 2013a).
However, it is difficult to assess the impact of these workers on the productivity of domestic
companies. A good example is when these highly qualified workers from these MNCs have no
conditions to maximize their capabilities. In addition, based on the FDI theory of industrial
organization discussed by Moosa (2002), labor productivity of an enterprise can be determined
by many firms and industry-specific characteristics such as market size, capital intensity,
financial development, and industry concentration. Therefore, the impact of labor mobility on
firm productivity or efficiency is still questioning (Bellak, 2004; Gorodnichenko et al., 2014a;
Peri & Urban, 2006).
2.7.1.3 Competition
The third spillover channel occurs through competition pressure from foreign presence
in the same industry. To survive in the fierce competition market, domestic enterprises are
required to operate more efficiently by using available resources, applying new technology and
improving their productivity (Blomström & Sjöholm, 1999; Malik, Rehman, Ashraf, & Abbas,
2011). However, the competitive process can also lead to negative impacts on domestic
enterprises. For example, FDI enterprises bring into the domestic market a new technology and
create new products to replace existing products produced by domestic enterprises.
Undeniably, this action may affect the existence of domestic enterprises, depending on the
substitution level of this new product. Or another case, FDI enterprises’ penetration of market
shares also reduce the production efficiency of domestic enterprises (Hamida & Gugler, 2009;
Hamida, 2013).
Regarding competition, Salim & Bloch (2009) used firm-level panel data of 568
Indonesian chemical and pharmaceutical firms from 1988 to 2000 surveyed by the Central
50
Board of statistics to explore the relationship productivity growth and spillover using FEM and
REM method. Productivity growth is estimated by the maximum likelihood method of
stochastic production frontier and Malmquist index. The study found evidence for horizontal
spillover. Another finding indicates that competition, R&D are important determinants for
horizontal productivity spillovers. To further complicate the issue, Fatima (2016) attempted to
enrich the analysis on a deeper understanding of the relationship between local firms'
productivity growth and FDI spillovers on different quantiles of productivity growth. The
quantile regression is estimated using panel data of Turkish manufacturing enterprises across
37 industries from 2003 to 2010. In this approach, TFP growth is distributed into five quantiles:
10th, 25th, 50th, 75th, 90th. In addition, absorptive capacity measured by distance from firm
productivity to industry best practice (frontier) is added as a moderator. The findings indicate
that local firms in different quantiles are affected in different ways from horizontal and forward
spillovers. Firms in higher quantile tend to less suffer from the competition (horizontal
spillovers from MNCs) and receive more from forwarding spillover.
2.7.1.4 Inter-linkage relationships with foreign subsidiaries
The FDI theory on the product life cycle emphasizes the gradual movement of home-
country production to production in advantageous locations across different countries in the
world (Vernon, 1960; Moosa, 2002). In the third stage and fourth (final) stage of the product
life cycle, MNCs attempt to take host countries' specific advantages to increase production
scale and expand the export of their innovative product launched at the first stage to other
countries. In this way, MNCs’ export activities in a host country are always associated with the
establishment of local production facilities, distribution networks, transportation infrastructure
or taste adaptation of foreign markets (Kokko, 1994; Wang, 2010). It is undeniable that MNCs,
with their long-term operational experiences and tremendous international influence, are
51
always better than local businesses in recognizing the factors that help increase export and
maximize profits.
Furthermore, the cooperation between FDI enterprises and local businesses in the
supply chain can generate externalities (spillover) effects on host countries' local firms.
Therefore, another spillover channel recognized is through the linkages between domestic
companies and foreign subsidiaries in downstream and upstream sectors of the supply chain
(Havranek & Irsova, 2011; Javorcik & Spatareanu, 2008; Khachoo & Sharma, 2016).
Downstream (forward) linkages relate to domestic enterprises buying production inputs from
FDI enterprises, while upstream (backward) linkages take place when domestic enterprises
provide intermediate inputs for FDI enterprises. Through backward linkage, domestic
enterprises can expand their production scale and improve products’ quality to meet the strict
standards of foreign subsidiaries (Blomstrom & Kokko, 1998; Javorcik & Spatareanu, 2011).
Besides, MNCs’ supplementary services embedded with their supplied products may
generate many opportunities for the diffusion of innovative processes and superior practices
from MNCs to domestic firms (Mariotti, Mutinelli, Nicolini, & Piscitello, 2015). However,
once the quality of the intermediate inputs is enhanced, the production cost will equivalently
increase. Thus, domestic enterprises must prepare themselves ready for absorbing technology
and knowledge spillovers from FDI firms by internal capacity building (Jacobs et al., 2017;
Mariotti et al., 2015).
As the very first study investigating indirect effects of FDI in Vietnam, Giroud (2007)
implemented a semi-structured interview with the target group of MNCs' managers in Vietnam
and Malaysia in 1996 and 2002, then used statistical method of frequency and percentage
estimation to evaluate. The sample is Vietnamese firms operating in two sub-sectors of the
manufacturing industry including electronics/ electrical and textiles & garments. In this way,
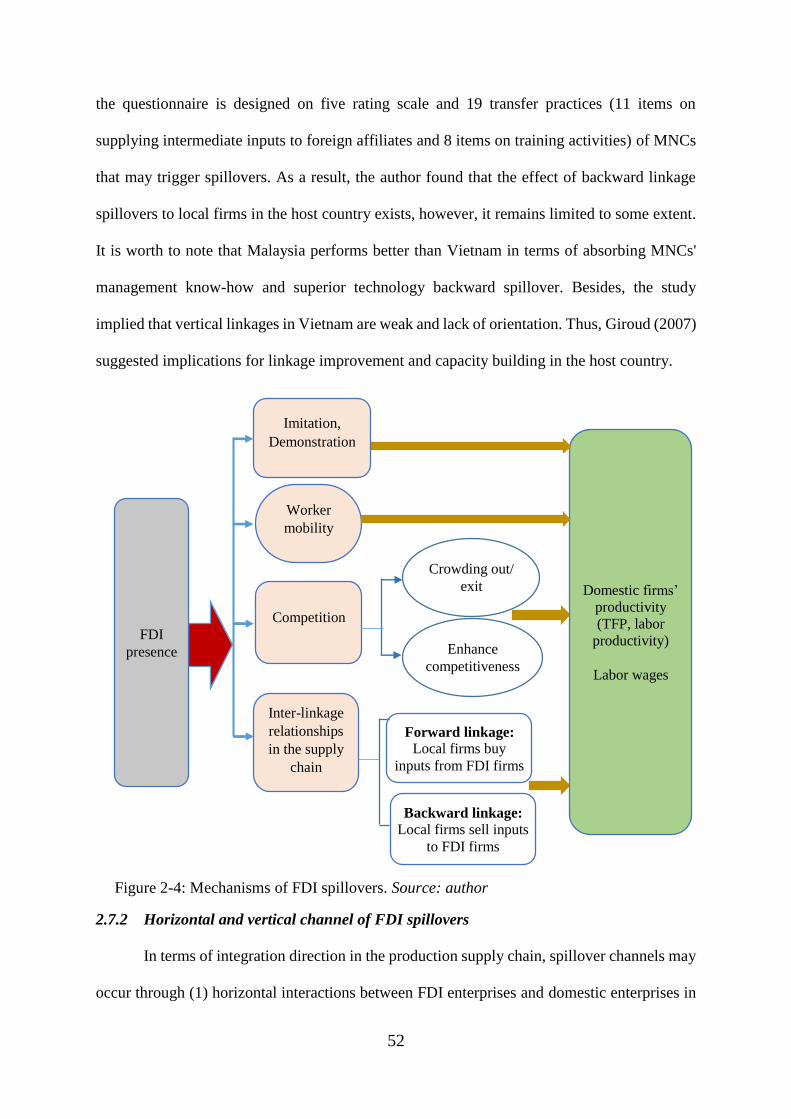
52
the questionnaire is designed on five rating scale and 19 transfer practices (11 items on
supplying intermediate inputs to foreign affiliates and 8 items on training activities) of MNCs
that may trigger spillovers. As a result, the author found that the effect of backward linkage
spillovers to local firms in the host country exists, however, it remains limited to some extent.
It is worth to note that Malaysia performs better than Vietnam in terms of absorbing MNCs'
management know-how and superior technology backward spillover. Besides, the study
implied that vertical linkages in Vietnam are weak and lack of orientation. Thus, Giroud (2007)
suggested implications for linkage improvement and capacity building in the host country.
Figure 2-4: Mechanisms of FDI spillovers. Source: author
2.7.2 Horizontal and vertical channel of FDI spillovers
In terms of integration direction in the production supply chain, spillover channels may
occur through (1) horizontal interactions between FDI enterprises and domestic enterprises in
Crowding out/
exit
Enhance
competitiveness
Imitation,
Demonstration
Worker
mobility
Competition
Inter-linkage
relationships
in the supply
chain
FDI
presence
Domestic firms’
productivity
(TFP, labor
productivity)
Labor wages
Backward linkage: Local firms sell inputs
to FDI firms
Forward linkage: Local firms buy
inputs from FDI firms
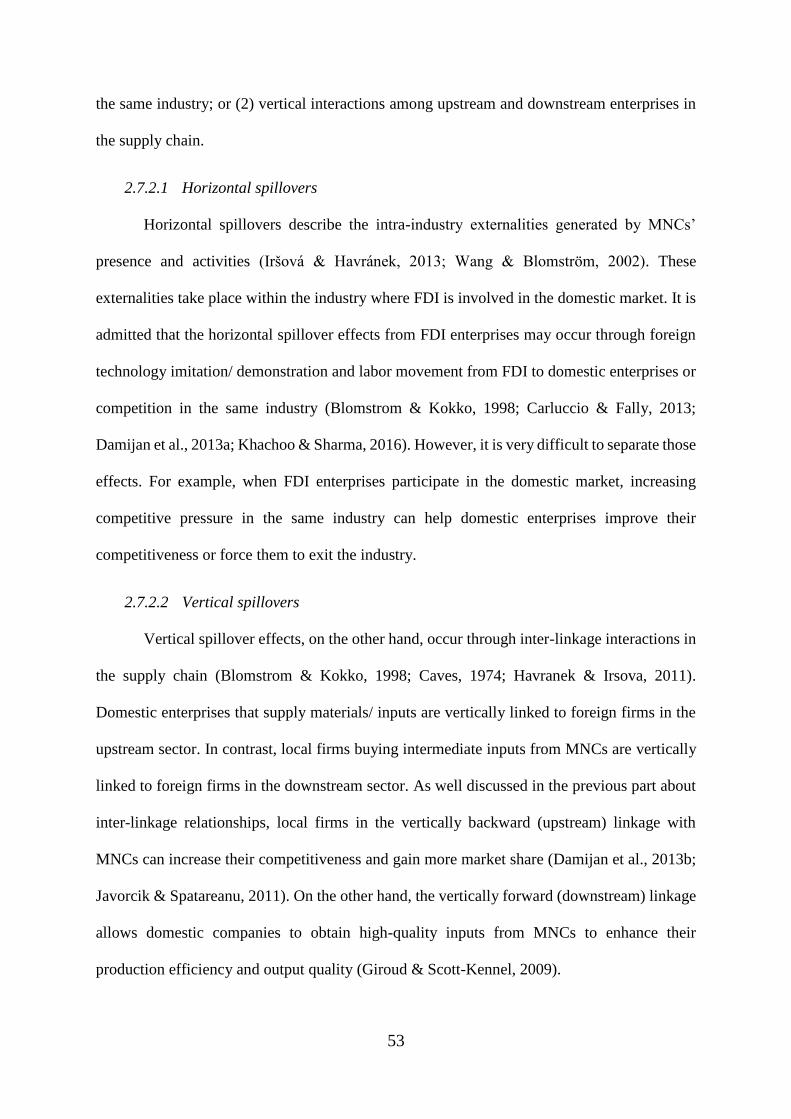
53
the same industry; or (2) vertical interactions among upstream and downstream enterprises in
the supply chain.
2.7.2.1 Horizontal spillovers
Horizontal spillovers describe the intra-industry externalities generated by MNCs’
presence and activities (Iršová & Havránek, 2013; Wang & Blomström, 2002). These
externalities take place within the industry where FDI is involved in the domestic market. It is
admitted that the horizontal spillover effects from FDI enterprises may occur through foreign
technology imitation/ demonstration and labor movement from FDI to domestic enterprises or
competition in the same industry (Blomstrom & Kokko, 1998; Carluccio & Fally, 2013;
Damijan et al., 2013a; Khachoo & Sharma, 2016). However, it is very difficult to separate those
effects. For example, when FDI enterprises participate in the domestic market, increasing
competitive pressure in the same industry can help domestic enterprises improve their
competitiveness or force them to exit the industry.
2.7.2.2 Vertical spillovers
Vertical spillover effects, on the other hand, occur through inter-linkage interactions in
the supply chain (Blomstrom & Kokko, 1998; Caves, 1974; Havranek & Irsova, 2011).
Domestic enterprises that supply materials/ inputs are vertically linked to foreign firms in the
upstream sector. In contrast, local firms buying intermediate inputs from MNCs are vertically
linked to foreign firms in the downstream sector. As well discussed in the previous part about
inter-linkage relationships, local firms in the vertically backward (upstream) linkage with
MNCs can increase their competitiveness and gain more market share (Damijan et al., 2013b;
Javorcik & Spatareanu, 2011). On the other hand, the vertically forward (downstream) linkage
allows domestic companies to obtain high-quality inputs from MNCs to enhance their
production efficiency and output quality (Giroud & Scott-Kennel, 2009).
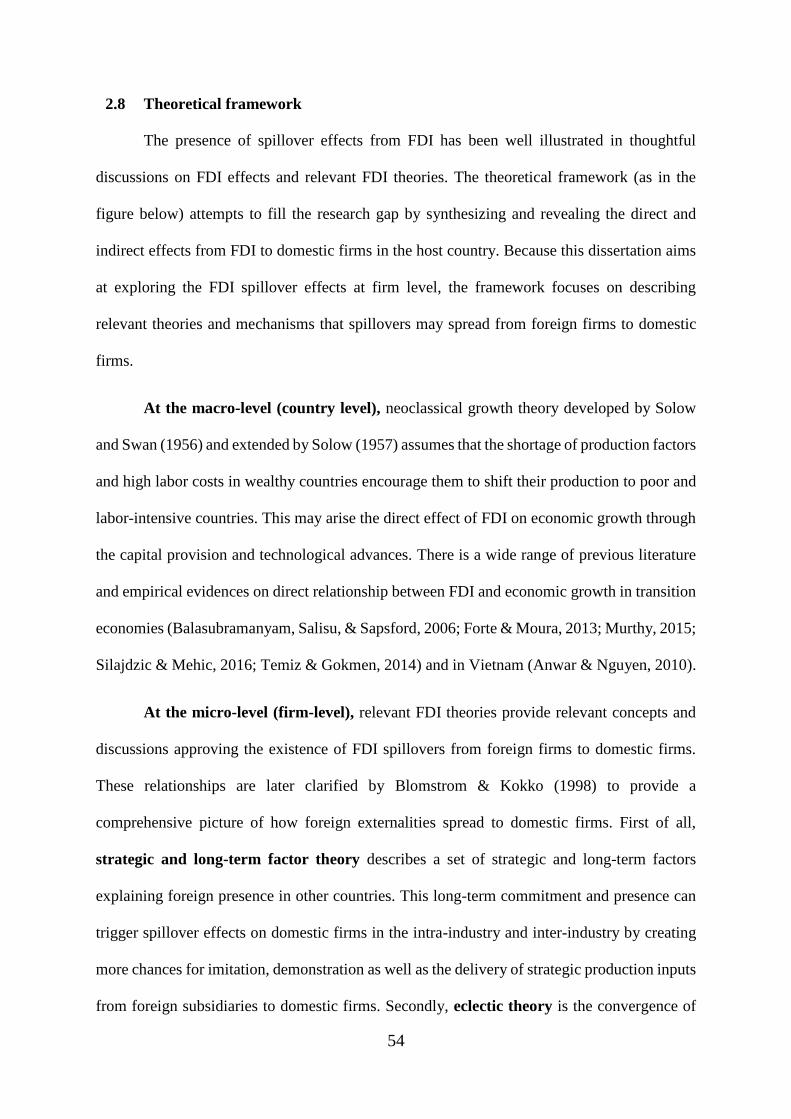
54
2.8 Theoretical framework
The presence of spillover effects from FDI has been well illustrated in thoughtful
discussions on FDI effects and relevant FDI theories. The theoretical framework (as in the
figure below) attempts to fill the research gap by synthesizing and revealing the direct and
indirect effects from FDI to domestic firms in the host country. Because this dissertation aims
at exploring the FDI spillover effects at firm level, the framework focuses on describing
relevant theories and mechanisms that spillovers may spread from foreign firms to domestic
firms.
At the macro-level (country level), neoclassical growth theory developed by Solow
and Swan (1956) and extended by Solow (1957) assumes that the shortage of production factors
and high labor costs in wealthy countries encourage them to shift their production to poor and
labor-intensive countries. This may arise the direct effect of FDI on economic growth through
the capital provision and technological advances. There is a wide range of previous literature
and empirical evidences on direct relationship between FDI and economic growth in transition
economies (Balasubramanyam, Salisu, & Sapsford, 2006; Forte & Moura, 2013; Murthy, 2015;
Silajdzic & Mehic, 2016; Temiz & Gokmen, 2014) and in Vietnam (Anwar & Nguyen, 2010).
At the micro-level (firm-level), relevant FDI theories provide relevant concepts and
discussions approving the existence of FDI spillovers from foreign firms to domestic firms.
These relationships are later clarified by Blomstrom & Kokko (1998) to provide a
comprehensive picture of how foreign externalities spread to domestic firms. First of all,
strategic and long-term factor theory describes a set of strategic and long-term factors
explaining foreign presence in other countries. This long-term commitment and presence can
trigger spillover effects on domestic firms in the intra-industry and inter-industry by creating
more chances for imitation, demonstration as well as the delivery of strategic production inputs
from foreign subsidiaries to domestic firms. Secondly, eclectic theory is the convergence of
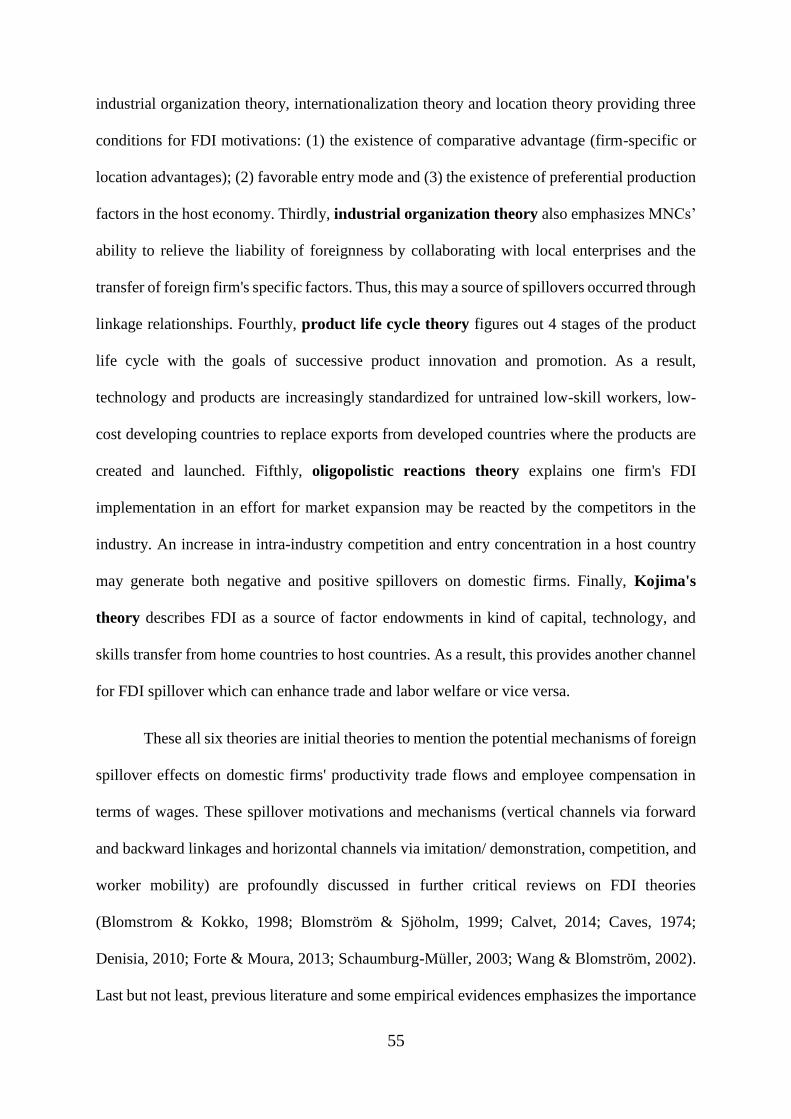
55
industrial organization theory, internationalization theory and location theory providing three
conditions for FDI motivations: (1) the existence of comparative advantage (firm-specific or
location advantages); (2) favorable entry mode and (3) the existence of preferential production
factors in the host economy. Thirdly, industrial organization theory also emphasizes MNCs’
ability to relieve the liability of foreignness by collaborating with local enterprises and the
transfer of foreign firm's specific factors. Thus, this may a source of spillovers occurred through
linkage relationships. Fourthly, product life cycle theory figures out 4 stages of the product
life cycle with the goals of successive product innovation and promotion. As a result,
technology and products are increasingly standardized for untrained low-skill workers, low-
cost developing countries to replace exports from developed countries where the products are
created and launched. Fifthly, oligopolistic reactions theory explains one firm's FDI
implementation in an effort for market expansion may be reacted by the competitors in the
industry. An increase in intra-industry competition and entry concentration in a host country
may generate both negative and positive spillovers on domestic firms. Finally, Kojima's
theory describes FDI as a source of factor endowments in kind of capital, technology, and
skills transfer from home countries to host countries. As a result, this provides another channel
for FDI spillover which can enhance trade and labor welfare or vice versa.
These all six theories are initial theories to mention the potential mechanisms of foreign
spillover effects on domestic firms' productivity trade flows and employee compensation in
terms of wages. These spillover motivations and mechanisms (vertical channels via forward
and backward linkages and horizontal channels via imitation/ demonstration, competition, and
worker mobility) are profoundly discussed in further critical reviews on FDI theories
(Blomstrom & Kokko, 1998; Blomström & Sjöholm, 1999; Calvet, 2014; Caves, 1974;
Denisia, 2010; Forte & Moura, 2013; Schaumburg-Müller, 2003; Wang & Blomström, 2002).
Last but not least, previous literature and some empirical evidences emphasizes the importance
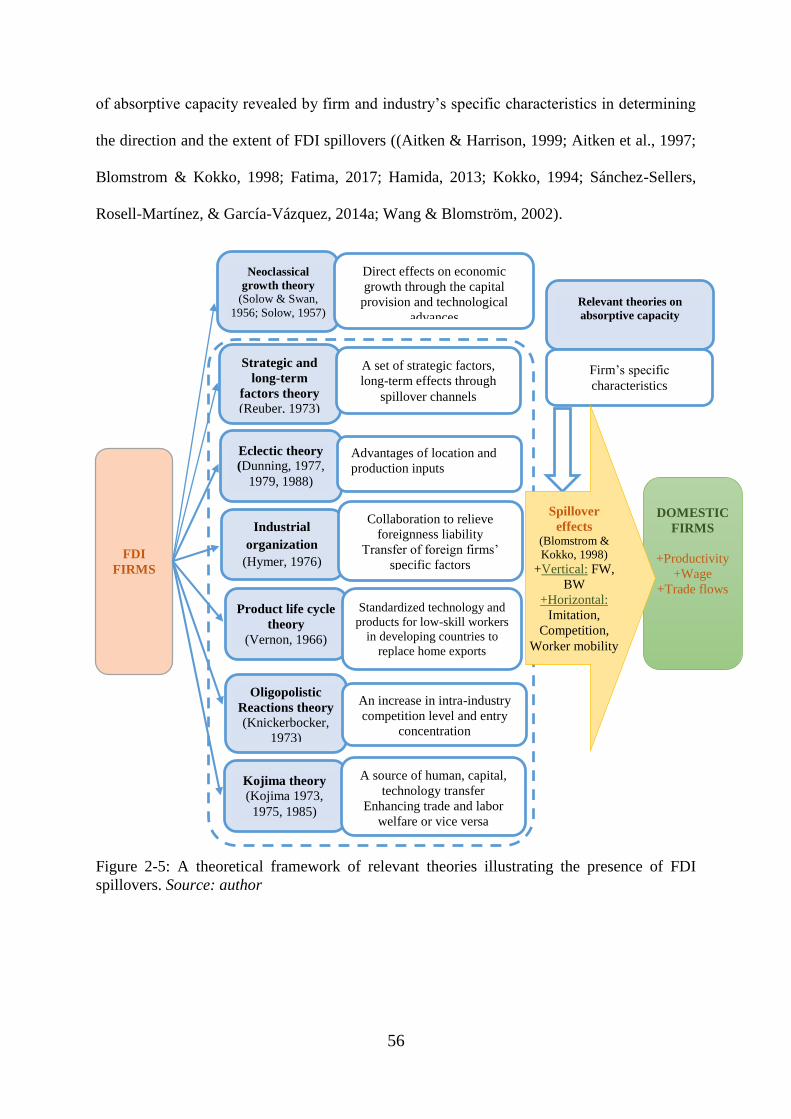
56
of absorptive capacity revealed by firm and industry’s specific characteristics in determining
the direction and the extent of FDI spillovers ((Aitken & Harrison, 1999; Aitken et al., 1997;
Blomstrom & Kokko, 1998; Fatima, 2017; Hamida, 2013; Kokko, 1994; Sánchez-Sellers,
Rosell-Martínez, & García-Vázquez, 2014a; Wang & Blomström, 2002).
Figure 2-5: A theoretical framework of relevant theories illustrating the presence of FDI
spillovers. Source: author
FDI
FIRMS
Neoclassical
growth theory
(Solow & Swan,
1956; Solow, 1957)
Direct effects on economic
growth through the capital
provision and technological
advances
Strategic and
long-term
factors theory
(Reuber, 1973)
A set of strategic factors,
long-term effects through
spillover channels
Eclectic theory
(Dunning, 1977,
1979, 1988)
Advantages of location and
production inputs
Product life cycle
theory
(Vernon, 1966)
Standardized technology and
products for low-skill workers
in developing countries to
replace home exports
Oligopolistic
Reactions theory
(Knickerbocker,
1973)
An increase in intra-industry
competition level and entry
concentration
Kojima theory
(Kojima 1973,
1975, 1985)
A source of human, capital,
technology transfer
Enhancing trade and labor
welfare or vice versa
Relevant theories on
absorptive capacity
Firm’s specific
characteristics
DOMESTIC
FIRMS
+Productivity
+Wage
+Trade flows
Spillover
effects (Blomstrom &
Kokko, 1998)
+Vertical: FW,
BW
+Horizontal:
Imitation,
Competition,
Worker mobility
Industrial
organization
(Hymer, 1976)
Collaboration to relieve
foreignness liability
Transfer of foreign firms’
specific factors
57
2.9 Productivity spillovers from FDI
Productivity spillover describes the phenomenon that the productivity level of local
firms in the FDI receiving country is intentionally or unintentionally affected in both positive
and negative ways as a result of foreign equity entries and their operations in the host country
(Blomstrom & Kokko, 1998). The productivity spillover can be delivered to local receiving
firms in several ways. Firstly, it can occur when foreign firms implement the demonstration of
their existing technology or training their employees (Hamida & Gugler, 2009). In this way,
the local firms in Vietnam can easily imitate or pay higher salaries to attract the workers used
to work or training by MNCs (Fosfuri et al., 2001). Secondly, the local firms in a joint venture
relationship with foreign partners can gain many advantages in this learning and upgrading
process to improve productivity and competitive advantage (Blomström & Sjöholm, 1999).
Thirdly, it is undeniable that competition pressure along with foreign presence is another strong
motivation for domestic firms to make relentless efforts to increase the productivity by
upgrading their technology and reinforcing their human capital stock (Hallin & Holmström
Lind, 2012). Finally, productivity can also spillover through vertical business linkages between
local firms and foreign firms; for example, be local suppliers for MNCs in the upstream sector
or be local customers for MNCs in the downstream sector (Giroud, 2007; Mariotti et al., 2015).
It is worth to note that Blomstrom & Kokko (1998) have expanded previous studies to
provide a relatively completed theoretical background and valuable concepts for further
researches on FDI externalities in both home country and host country. Most recent studies
based on their work to establish their estimation model and further complicate the issue. The
authors use case study methodology and the use of some limited empirical evidences at that
time on MNCs activities and its spillover effects on local firms to provide a conceptual
framework of spillover theories with two branches of productivity spillovers and market access
spillovers.
58
2.9.1 Channels of productivity spillovers from FDI
Many recent authors investigate the productivity spillovers from FDI by two main
spillover channels including horizontal FDI spillover and vertical FDI spillover (Damijan et
al., 2013a; Fatima, 2016; Iršová & Havránek, 2013; Le & Pomfret, 2011).
2.9.1.1 Horizontally productivity spillovers
According to Aitken & Harrison (1999) and Blomstrom & Kokko (1998), horizontally
productivity spillovers is defined as the changes in productivity levels of local competitors
when there are the presences of wholly foreign-owned firms or joint venture subsidiaries
operating in the same industry or intra-industry (as in figure 1). These changes may come from
the positive FDI externalities such as the technology diffusion, superior management and
worker turnover from foreign firms to domestic firms; or negative externalities as competition
and intellectual protection (Carluccio & Fally, 2013). In this way, higher foreign equity in a
particular sector may link to the positive changes the productivity of local competitors if the
local ones in the same sector can inherit the existing or advanced technology which is now less
expensive and more available.
Besides, the domestic players can also benefit from the movement of labor from the
FDI sector to domestic sectors because this labor force has received formal training and
experienced an efficient process (Fosfuri et al., 2001; Hübler, 2015). The attraction of these
workers can facilitate technology transfer and enhance the absorptive capabilities of the local
firms. In contrast, the foreign presence may cause a higher probability of local firms' failure
and exit due to fierce competition and crowding-out effect (Javorcik & Spatareanu, 2008).
Furthermore, foreign firms tend to closely protect their technology from horizontal
competitors. It is not easy to adopt the technology from the foreign sector without a relentless
effort and high learning cost. Thus, the local firms lacking resources, technology, management
59
know-how and slow response to market changes may become the victims of foreign entries
(Huynh, Nguyen, Trieu, & Tran, 2019).
On the contrary, there are many challenges that local firms in the host country have to
confront to benefit from horizontal FDI spillovers. It is admitted that domestic firms with low
competitiveness and absorptive capabilities can’t absorb positive externalities from foreign
competitors for improving their productivity and performance and become unexpected victims
of foreign entries (Jordaan, 2013). It is also important to note that the intra-industry foreign
competitors are the experts in retaining and satisfying their good employees (Caves, 1974).
Thus, the attraction of high-skilled labor from this sector is quite difficult and requires many
resources. As a result, the positive horizontal spillover may be easily outweighed by fierce
competition in the same industry in the host market.
2.9.1.2 Vertically productivity spillovers
Vertical spillover, on other hands, is the result of the backward and forward linkage
created by domestic firms under the agreement of MNCs which enable local firms to become
a stakeholder in the supply or distribution chain with foreign presence firms (Halpern &
Muraközy, 2007). Further, such kinds of linkages contribute to build the domestic firm’s
capabilities and improve productivity in the long run (Iršová & Havránek, 2013). Firstly, the
backward linkage occurs when domestic firms are chosen to be the suppliers of local inputs to
foreign companies. Admittedly, this is considered as the most important channel as it is
believed to generate the positive externalities on the involved native firms; for example, quality
control, product and process innovation to compete and meet the requirements of the foreign
sector. Secondly, the forward linkage comes from the use of foreign inputs in the production
of local firms. These upstream and downstream business activities are no longer strange to
emerging economies where the race to cost minimization is happening lively along with many
potential opportunities for maintain the competitive advantages and expanding the market
60
(Merlevede & Purice, 2016). However, these benefits are delivered selectively to firms with
high absorptive capacities. It is undeniable that those firms' gains are also compensated by
many challenges such as stricter requirements of quality standards, higher operation cost, and
fierce competition.
More comprehensively, this dissertation attempts to combine and illustrate the flows of
FDI spillover channels from foreign firms to domestic firms in the host country as in the figure
below. Within the framework of horizontal spillover, Carluccio & Fally (2013) discussed that
technology could spill over horizontally from FDI firms to domestic firms by three means. The
first channel mentioned is demonstration/ imitation effects that could improve institutional,
managerial, and technological skills, competition effects. The second means for transferring is
competition effect that the existence of FDI firms could increase the competitiveness of the
market, which pushes domestic firms to update skills to improve their productivity (Blomstrom
& Kokko, 1998; Blomström & Sjöholm, 1999). Thirdly, the productivity could spillover via
the movement of employees from FDI firms which have higher technology level to domestic
firms, or via complementary workers (Fosfuri et al., 2001).
It has also been illustrated that vertically backward spillover occurs in the upstream
sector through upstream activities between local suppliers of intermediate goods and foreign
subsidiaries while vertically forward spillover occurs in the downstream sector through
downstream activities between foreign subsidiaries and local customers (Iršová & Havránek,
2013). Backward spillover refers to the effects of foreign firms’ activities on local providers or
local suppliers’ proactive adaptation to ensure the quality and the standardized process of local
inputs supplied (Javorcik & Spatareanu, 2011). In this way, higher foreign standards for
product quality and reliable delivery encourage local suppliers to improve their product and
process to receive stable orders from foreign firms. Besides, the MNCs also have incentives
to transfer their knowledge to local suppliers in the backward linkage chain to control better
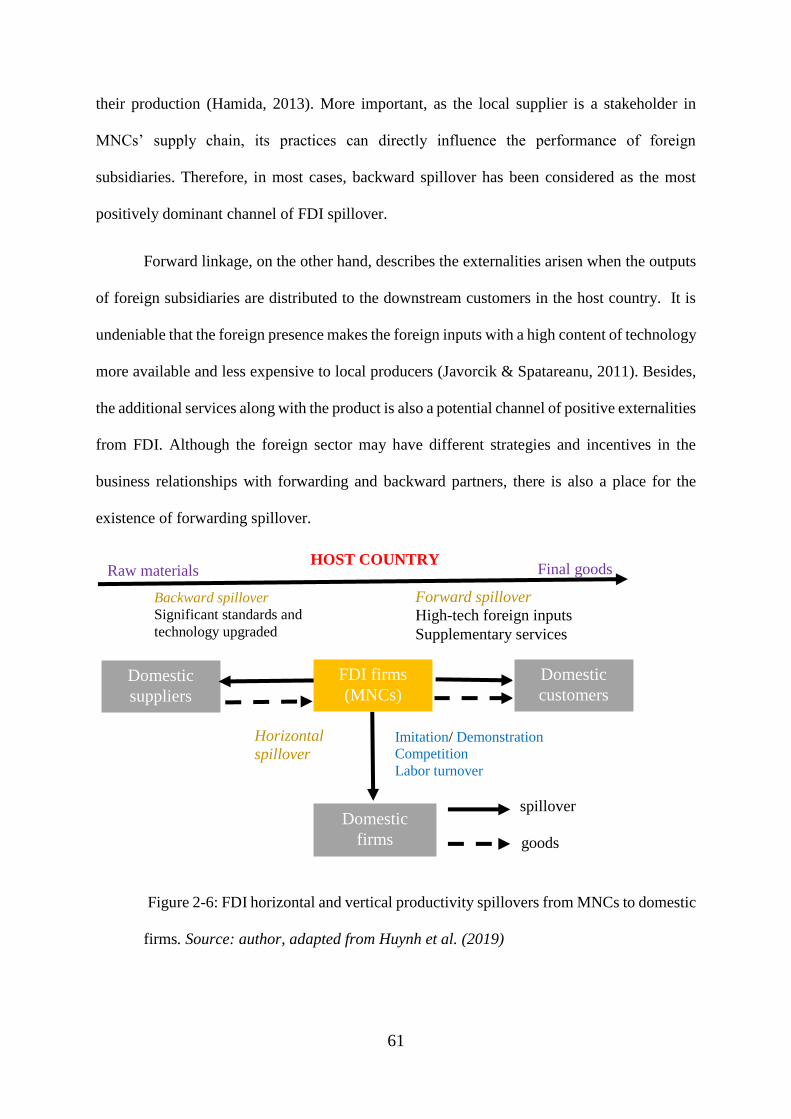
61
their production (Hamida, 2013). More important, as the local supplier is a stakeholder in
MNCs’ supply chain, its practices can directly influence the performance of foreign
subsidiaries. Therefore, in most cases, backward spillover has been considered as the most
positively dominant channel of FDI spillover.
Forward linkage, on the other hand, describes the externalities arisen when the outputs
of foreign subsidiaries are distributed to the downstream customers in the host country. It is
undeniable that the foreign presence makes the foreign inputs with a high content of technology
more available and less expensive to local producers (Javorcik & Spatareanu, 2011). Besides,
the additional services along with the product is also a potential channel of positive externalities
from FDI. Although the foreign sector may have different strategies and incentives in the
business relationships with forwarding and backward partners, there is also a place for the
existence of forwarding spillover.
Figure 2-6: FDI horizontal and vertical productivity spillovers from MNCs to domestic
firms. Source: author, adapted from Huynh et al. (2019)
FDI firms
(MNCs) Domestic
suppliers
Domestic
customers
Raw materials Final goods
Backward spillover
Significant standards and
technology upgraded
Forward spillover
High-tech foreign inputs
Supplementary services
spillover
goods
Domestic
firms
Horizontal
spillover
Imitation/ Demonstration
Competition
Labor turnover
HOST COUNTRY
62
2.9.2 The effect of absorptive capabilities on productivity spillovers
The initial theoretical reviews indicate domestic host firms' motivations in improving
their internal capacities to better absorb positive FDI externalities, especially through backward
linkage relationships with foreign subsidiaries (Blomstrom & Kokko, 1998; Caves, 1974).
They also recognize the factors determining the absorptive capacity of an indigenous firm in
response to foreign presence such as R&D activity and expenditures, internal organization of
innovation, external relationships of innovation, quality of human capital, family management,
business complexity reflected in different levels of technology and processes and market
concentration (Sánchez-Sellers et al., 2014a). However, under the real circumstance of
emerging economies, factors reflecting firm's absorptive capabilities are restricted to several
existing indicators. Because of the lack of R&D and innovation activities and expenditures
devoted to these activities, absorptive capabilities in transition economies can be determined
by three primary indicators including human capital, technology gap and financial development
(Anwar & Nguyen, 2014; Fatima, 2017; Silajdzic & Mehic, 2016). Regardless of the author's
effort in this dissertation to capture the R&D activities and expenditures, it fails to explain the
situation due to an insufficient number of observations.
First of all, technology gaps significantly affect domestic firms' ability to adapt to
MNEs' valuable intangible assets. The majority of studies have provided strong evidence
confirming this relationship. Iršová & Havránek (2013), Javorcik & Spatareanu (2008) and
Kokko (1994) agree that the technology gap is an important determinant of FDI spillover.
However, a recipient country must have a certain level of technology gap to benefit from
spillover; otherwise, there is no gain from technology spillovers. For instance, Hamida (2013)
shows that only domestic firms that have invested predominantly in absorptive capacity gain
from FDI spillovers. Damijan, Rojec, Majcen, & Knell (2013) find significant and positive
horizontal spillover in domestic firms with high and medium absorptive capacity. Girma, Görg,
63
& Pisu (2008) find that if the difference in technology level between recipient firms and MNEs
is too great, spillover is less likely to occur.
Second, human capital is another important channel of spillover absorption as the
successful implementation of this transfer requires the involvement of skilled and well-trained
labor force (Becker, 1975; Liu, Parker, Vaidya, & Wei, 2001). There is no doubt that firms
with experienced managers, experts, qualified technicians, and workers have a better
absorptive capacity and are more ready to receive positive foreign externalities. Furthermore,
the mobility of foreign-trained employees to domestic firms may contribute to knowledge
diffusion and increase the domestic firm's absorptive capabilities (Wang, Deng, Kafouros, &
Chen, 2012).
Third, financial development reflects the financial health and absorptive capacity of a
firms by the availability of organizational slacks for new ventures (Bourgeois, 1981; Nohria &
Gulati, 1996). More important, a stable foundation of financial development provides domestic
firms more incentives to invest in capacity building and the advanced technology to imitate and
relieve the pressure of foreign penetration in their host country. Besides, the availability of
financial resources allows domestic enterprises proactively to reach and get involved in
upstream and downstream linkages with foreign subsidiaries. This brings more chances for
positively vertical FDI externalities.
2.9.3 Regional spillover effects and the impact of geographical proximity
The concentration of FDI inflows in different parts of the recipient country can
determine the magnitude of technology spillover. FDI spillover has regional effects, meaning
that firms located near areas of high FDI concentration are most likely to benefit from the
spillover (Aitken & Harrison, 2013). According to Wei & Liu (2006), a technology from FDI
may transfer to local firms in the same area and then spread to other locations. The magnitude
64
of this spillover, however, depends on the characteristics of each region, such as the availability
of natural resources and labor and the business environment (Perri & Peruffo, 2016; Wang &
Wu, 2016). However, it is also argued that a high density of local firms surrounded by foreign
affiliates within an industry creates higher competition, which may generate an adverse
externality on the host country’s production performance. The extension of benefits from
technology and knowledge spillover to local firms highly depends on their capacity to compete,
maintain their position in the market, and absorb advanced knowledge for application in their
own business (Damijan et al., 2013a; Hamida, 2013; Xu & Sheng, 2012). Otherwise, domestic
companies may suffer from a loss of market share, which will negatively affect the growth of
the whole nation.
Aitken & Harrison (1999) find that there are no FDI externalities at the regional level.
On the other hand, in the United Kingdom (UK), Girma, Görg, & Pisu (2008) identify positive
spillover for intra-industry firms in the same region but negative spillover for intra-industry
firms located in different areas. Similarly, Xu & Sheng (2012) find a significant and positive
relationship between spillovers and the productivity of firms in the same sector and region.
Exploiting panel data on 10,000 Chinese firms, Wei & Liu (2006) find evidence of positive
intra-industry spillover within areas. Aitken & Harrison (1999) argue that, if the benefit of FDI
spillover to the local area is too small to compensate for its negative impact on the whole
country, then it is reasonable to conclude that FDI hurts the development of the host country.
Therefore, more research on the importance of the geographic distribution of FDI spillover is
needed to help governments adopt appropriate policies on investment by foreign countries.
2.9.4 Empirical evidence on productivity spillovers from FDI
Regardless of relentless efforts in clarifying the impact of FDI spillovers, the empirical
evidence on productivity spillovers from FDI is still ambiguous with controversial arguments.
While many authors indicate the importance of inward capital in raising the stock of financial
65
human capital and improving host country’s productivity through vertical and horizontal
spillovers (Aitken et al., 1997; Du et al., 2012; Mariotti et al., 2015; Salim, Razavi, & Afshari-
Mofrad, 2017), some argued that competition incurred by FDI outweigh the positive spillovers
generated by imitation and labor mobility (Decreuse & Maarek, 2015; Hamida, 2013; Javorcik
& Spatareanu, 2008; Le & Pomfret, 2011).
To further complicate the matter, recent studies on emerging economies explore the
importance of absorptive capabilities in term of human capital, technology gap and financial
development (Anwar & Nguyen, 2014; Behera, 2017; Hamida, 2013); distance (Anwar & Sun,
2016; Thang, Pham, & Barnes, 2016); trade orientation (Anwar & Nguyen, 2011b; Ha &
Giroud, 2015; Havranek & Irsova, 2011); firm and industry heterogeneities (Carluccio & Fally,
2013; Damijan et al., 2013b; Fatima, 2016) in determining how these variables influencing the
direction and extent of the productivity spillovers. In addition, a possible explanation for mixed
findings may come from a variety of methodologies and contexts (as in Appendix 1).
Pioneering research by Caves (1974) was conducted on testing the relationship between
MNCs' presence, intra-industry competition, and the productivity in the host economy. The
study aimed at investigating FDI spillovers using the dataset of Canadian and Australian
manufacturing firms across 87 different industries. The author used a simple model to explore
the determinants of domestic firms' profit rate on equity (ROE). The explanatory variables
include foreign share of industry sales, total assets, the ratio of value-added per worker, foreign
ownership share and market concentration. The author found that the presence of MNC's
subsidiaries enhances the efficiency of domestic resource allocation and speed up the
technology transfer to local ones. However, foreign presence negatively affects the profits of
domestic firms. Aitken, Hanson, & Harrison (1997), on the other hand, examined the effects
of FDI spillovers on the export orientation of domestic firms using panel data of 2104 Mexican
manufacturing firms from 1986 to 1990 to estimate two-stage PROBIT regression. The author
66
established the proxies for independent variables such as domestic and foreign output price,
industry concentration, local export concentration, MNC export, proximity to subsidiaries. This
is the first author revealing his concern on whether spillovers are bounded by geographical
distance. As a result, the study comes up with the conclusion that the presence of MNC as
"catalysts" for local export activity. Besides, domestic firm export is positively correlated to
the distance to MNCs and uncorrelated to the concentration of local exporters.
Inheriting the conceptual framework of Blomstrom & Kokko (1998) and the empirical
model of Caves (1974), Blomström & Sjöholm (1999) conducted an empirical analysis of the
effect of foreign presence on labor productivity. The authors used cross-sectional data of more
than 16,000 Indonesian firms from 329 industries surveyed in 1991 by Indonesian Central
bureau statistics. The model is estimated using labor productivity function. The explanatory
variables include capital intensity, labor skill, capital utilization and scale of operation. The
relationship between foreign presence and labor productivity is moderated by foreign
ownership shares: a large percentage owned (major) and minor percentage owned. In
conclusion, the study found that foreign-owned firms are dominant players achieving high
productivity in comparison to local ones. Meanwhile, the degree of foreign ownership doesn't
matter for productivity. Thus, the hypothesis that MNCs facilitate positive labor productivity
spillover to local firms is not supported.
Concerning the ownership structure of FDI firms, Aitken & Harrison (1999) – one of
pioneering researchers used a panel data of 4000 Venezuelan from 1976 to 1989 estimated by
Ordinary Least Square (OLS) and Weighted Least Square (WLS) models to investigate the
effects of foreign presence on domestic firm productivity (log of firm-level real output). The
right-hand side of the equation includes the variables such as skilled labor, unskilled labor,
materials, capital, foreign equity participation in the firm (0 to 100%), foreign ownership in the
sector. It has been found that foreign share in total equity (joint venture) matters for enhancing
67
the productivity of domestic firms. Besides, a higher concentration of foreign ownership in the
sector triggers negative effects on local firms' productivity as a result of scale dominance and
high competitiveness. Nevertheless, there is no signal for technology transfer from foreign
firms to local ones.
Since the early analyses, there are many empirical researchers devoted their efforts to
replicate or expand the empirical models to measure the productivity spillovers associated with
foreign presence across different economies using labor productivity for total factor
productivity as a dependent variable. It is undeniable that these researches contribute to further
complicate the issue and expand the original empirical works by conducting different
methodology and variables. However, the impact of FDI externalities on the economic
indicators of domestic firms appears to contextual bounded and even raises more questions
than answers.
Taking human capital into account, Liu, Parker, Vaidya, & Wei (2001) used log-linear
function to investigate both direct and indirect effect (spillovers) of inward FDI on host
economy’s industry productivity which is later expanded to firm-level spillovers by series of
researches such as Javorcik (2004b), Damijan et al. (2013b) and Anwar & Nguyen (2014). The
authors used cross-sectional data of 47 sub-sectors in the Electronics industry in 1996 and 1997
taken from China's statistical yearbook. For robustness checks, the statistical tests recommend
the use of the WLS model, 3SLS and W2SLS instead of OLS and 2SLS. The authors attempted
to calculate the dependent variable of labor productivity by each sub-sectors and independent
variables including capital intensity, firm size, labor quality (human capital of both local and
foreign firms) and foreign presence (the share of foreign capital in total capital in each sub-
sector). The findings are quite optimistic that MNCs presence explains the rise in labor
productivity. Interestingly, all explanatory variables, especially human capital lead to an
improvement in labor productivity in each sub-sector in the host economy.
68
As regard to absorptive capabilities, Damijan et al. (2013b) used panel data of more
than 90,000 firms across 10 transition economies over the period from 1995 to 2005 for model
estimation. The authors applied the Heckman two-step procedure initiated by Javorcik (2004b)
to calculate TFP (using Olley-Pakes approach), then regress spillover proxies on TFP. The
result indicates 4 over 10 transition economies receive positive direct effects of FDI. However,
without firm absorptive capabilities, there is no signal of horizontal spillover. It is important to
note that the higher the absorptive capacities and productivity level, the higher the probability
the firm benefits from productivity spillover. The finding is also supported by many studies
(Demena & Murshed, 2018; Sánchez-Sellers, Rosell-Martínez, & García-Vázquez, 2014b;
Wang, 2010).
Anwar & Nguyen (2014) once again indicated that productivity spillover varies across
regions with different levels of absorptive capacities measured by three main indicators -
human capital, technology gap, and financial development. The authors used panel data of
Vietnamese manufacturing firms from 23 industries from 2000 to 2005 and the input-output
matrix in 2000 to conduct a two-stage estimation. They firstly calculate TFP using the Cobb-
Douslag model, then estimate the spillover variables and determinants affecting TFP. The
findings emphasize the importance of backward spillovers and absorptive capacity in
determining domestic firms' productivity. From a more supportive perspective, Fatima (2017)
estimated his quantile regression on Turkish firms and come up with the conclusion that
absorptive capacity is a facilitator to enable local firms to become beneficiaries of FDI. Thus,
an increase in absorptive capacity should be supported and accumulated for lower TFP quantile
firms.
By separating the technological level of local firms, Sena (2004) also attempted to find
evidence for productivity spillovers from FDI; however, using a quite different method of Data
Envelopment Analysis (DEA) and firm-specific technical change index (Malmquist) to
69
calculate firm productivity growth. Due to its appropriateness, panel data of 206 Italian
manufacturing firms from 1989 to 1994 is once again used to estimate the model. The sample
data is classified into high-tech and non-high-tech firms. The independent variables of technical
change, investment ratio, the foreign share of equity are added into the model. The results
indicate knowledge diffusion from high-tech to low tech Italian manufacturing firms. Besides,
endogenous problem between FDI and productivity growth may be avoided by the index as it
compares the firm's output/input ratio to the shift of best production possibility.
To further complicate the matter, Le & Pomfret (2011) attempted to differentiate the
spillover effects across different levels of technology gap, ownership structure and trade
orientations using firm-level panel data of Vietnamese enterprises from 2000 to 2006 surveyed
by GSO and 2-digit aggregate IO matrix from VSIC. FEM and REM approaches are conducted
to estimate the regression equations. In conclusion, the effect of vertical spillovers (especially
through backward linkage) on the local firm's productivity is positive. The firm size and
technology gap matter for the effect of backward spillover on labor productivity. Negative
horizontal spillovers to labor productivity of domestic firms occur in the firms with one of the
following characteristics such as private, domestic-oriented, known R&D and low-tech.
Regarding vertical spillovers, Javorcik (2004b) contributed significantly to the existing
literature by initiating a two-stage estimation procedure to explore the effect of foreign capital
share on firm total factor productivity (TFP) in the host country. In the first step, the author
used a panel firm-level data of Lithuanian manufacturing enterprises from 1996 to 2000 to
calculate TFP (Cobb Douglas production function using Olley-Pakes correction). In the second
step, the author regressed FDI spillover variables (foreign share, horizontal spillover, backward
spillover for partially foreign ownership, backward spillover for wholly foreign ownership,
forward spillover). The findings reveal that backward spillover as the dominant channel of
productivity spillover from foreign firms to local firms while the assumption for intra-industry
70
spillover (horizontal spillover) is not supported. Furthermore, partially foreign participation is
found to enhance the process of productivity spillovers.
It is worth to note that the study of Javorcik (2004b) is a significant work orienting and
influencing the later empirical researches on FDI spillovers, especially in term of methodology
(Anwar & Nguyen, 2014; Jacobs et al., 2017; Javorcik, Turco, & Maggioni, 2018). Similar to
the findings of Javorcik (2004b), Barrios, Görg, & Strobl (2011) ) also found significantly
positive backward spillovers from FDI. The authors used firm-level data of Irish enterprises
from 1983 to 1998 surveyed by Irish Economy Expenditure and Input-output table to explore
the effects of three spillover channels (horizontal, forward, backward) on productivity. First,
Levinsohn and Petrin (2003) approach are conducted for productivity estimation. Second, the
GMM approach is used to check whether the result is robust. It is interesting to note that the
authors attempt to use both home country's input-output matrix and host country's one to
separate forward and backward effects generated from these two sources (domestic source and
imported source). It is admitted that MNCs have similar behaviors as local firms in sourcing
inputs for cost minimization implying the potentials for building backward linkage with local
suppliers.
For vertical spillover measurement, Lenaerts & Merlevede (2016) conducted a meta-
analysis differentiating the use of aggregated input-output tables versus a detailed input-output
table using panel data of Romanian service and manufacturing firms from 1996 to 2005.
Similar to Javorcik (2004b), the authors conducted a two-step procedure to calculate TFP and
explore the effects of FDI spillovers on TFP. Besides the use of the Olley-Pakes approach,
Lenaerts & Merlevede (2016) also used alternatives of TFP calculation (LP, 2003) and replaced
the use of Cobb-Douslag production function by Translog production function for robustness
check. The findings explain why previous studies result in a dominant horizontal effect. There
71
is strong evidence toward positive backward spillover using detailed IO while the magnitude
horizontal spillover is in favor of aggregated IO table use.
Investigating the existence of intra-industry (horizontal) spillovers, Du et al., (2012)
also adopted the methodology of Javorcik (2004b) to estimate the effects of intra-regional and
inter-regional FDI spillovers on the productivity of Chinese manufacturing firms from 1998 to
2007. In this way, the foreign share is classified by its origin countries resulting in two regions:
(1) Hongkong – Macau – Taiwan and (2) other countries. Under different firm internal
capacities, foreign shares by other countries (except HK – Macau – Taiwan) positively affect
firm productivity. In addition, while there is no/ weak influence of horizontal spillover on
individual firm productivity, backward and forward spillovers positively affect domestic firms'
productivity. Different from Du et al. (2012), Liu, Agbola, & Dzator (2016) found a positive
effect of horizontal spillover on TFP using panel data of 1328 Chinese firms in the electronics
industry from 2003 to 2008. However, the impact of horizontal FDI in the labor-intensive
industry on TFP is unexpectedly negative. It is admitted that a lower productivity gap between
foreign firms and domestic firms in an economy provides more room for positive spillovers
and local ones' productivity improvement.
Regarding geographical distance, Girma & Wakelin (2007) researched a different
context using UK firm-level data surveyed by the national statistics office in 1980 and 1992.
Firstly, TFP was estimated using Olley – Pake's semiparametric approach. Secondly, the
authors estimated productivity spillovers from regional FDI (FEM, GMM). Besides, twice
lagged values for spillovers, lagged government subsidy, lagged regional and productivity
growth are also added to the model to control endogenous problems. The estimation result
shows consistently signs over OLS and Olley-Pakes TFP estimation approach. Importantly,
there are evidences for both intra-regional and inter-regional externalities. It is worth to note
that distance from local firms to MNCs matters for spillovers. Meanwhile, domestic firms in
72
less-developed regions lacking MNCs concentration receive lower FDI spillovers. The findings
are consistent with Halpern & Muraközy (2007) who also indicate the importance of distance
in triggering negative horizontal spillovers and positive vertical spillovers with large magnitude
using panel data of Hungarian manufacturing firms from 1996 to 2003.
In contrast to Girma & Wakelin (2007) and Halpern & Muraközy (2007), Mariotti,
Mutinelli, Nicolini, & Piscitello (2015) rejected the role of distance as an important facilitator
or barrier of the productivity spillovers using panel data of 1999-2005 Italian firms in both
services and manufacturing industry. The author estimated TFP by the semi-parametric
estimation procedure of Levinsohn and Petrin (2003) to control for the simultaneity problem
of input choice, then used GLS regression to capture FDI spillovers. By focusing on the
colocation factor, Mariotti et al. (2015) found that local suppliers and downstream customers
of foreign subsidiaries in the service sector receive greater productivity spillover compared
with those in the manufacturing sector. Besides, distance is not important in determining
spillovers, especially for the service sector. A recent study on 1998-2007 Chinese
manufacturing firms by Lin & Kwan (2016) used a spatiotemporal autoregressive panel model
and system GMM to consider whether spillovers depend on geographical distance. The authors
once again support findings of Girma & Wakelin (2007) and Halpern & Muraközy (2007) that
FDI presence in surrounding regions of domestic firms’ location is an advantage.
Regarding ownership identities and trade orientation, Newman, Rand, Talbot, & Tarp (2015),
on the other hand, established the econometric model of productivity spillovers using 4000
Vietnamese manufacturing enterprises from 2009 to 2012 surveyed by Vietnam technology
and Competitiveness. The authors also conducted the robustness checks to control for sector-
level concentration and Olley-Pakes approach for controlling the input simultaneity problem
of TFP estimation. Different from Giroud (2007), Newman et al. (2015) found the strong
magnitude of vertical spillovers through both backward and forward channels. This is also
73
different from Barrios et al. (2011) and Javorcik (2004b) who only approve the existence of
backward spillovers. According to Newman et al. (2015), the backward spillovers are
significantly positive while the forward spillovers are significantly negative. Also, the finding
reveals less negative productivity spillover from 100% of foreign-owned firms to local firms
indirect linkages with them. Indeed, this may reflect the inter-industry technology transfer
through a production network. Further, the most recent study by Javorcik, Turco, & Maggioni
(2018) on Turkish manufacturing firms across 22 industries from 2003 to 2011 found a positive
spillover effect on Turkish TFP through both vertical and horizontal channels. It is interesting
to note that firms with export orientation benefit more from all kind of spillovers
The other explanation for mixed empirical findings may come from the firm and industry
heterogeneity. Gorodnichenko, Svejnar, & Terrell (2014) conducted a meta-analysis using
firm-level panel data from 17 countries in Central and Eastern Europe, Turkey and the
Commonwealth of Independent States from 2002 to 2005. Cobb-Douslag revenue function and
Solow residual model are used to estimate the FDI spillover effect on revenue efficiency
controlled by the firm and industry characteristics. There is a wide range of moderating
variables tested on the relationship between FDI spillover and revenue efficiencies such as
bribes, manager's time spent with officials, ownership identity, FDI source of origin, human
capital, distance from the technological frontier and firm-level linkages. Damijan et al. (2013b)
also investigated whether firm heterogeneity influences the productivity spillover from FDI
using panel data of manufacturing firms across 10 developing economies. Their findings reveal
positive backward spillover and insignificant horizontal and forward spillover. It is also
concluded that the institutional variables have little effect on efficiency spillover. Meanwhile,
human capital, distance from the technological frontier, firm, and industry-specific
characteristics can affect productivity spillovers from FDI to some extent (Nguyen & Sun,
2012; Sena, 2004).
74
2.10 Wages spillovers from FDI
2.10.1 The effect of FDI horizontal spillovers on wages:
FDI horizontal spillover is no longer a novel concept for host developing countries
receiving foreign equity from more developed countries. Horizontal spillover from FDI occurs
when foreign entries in terms of inward capital, technology, and senior executives operate in
the same industry as domestic-owned firms and contributing to the industry’s total output
(Blomstrom & Kokko, 1998; Caves, 1974). Based on the theoretical literature and empirical
evidence, horizontal spillovers can trigger positive externalities by offering local firms more
opportunities to adopt new advanced technology and managerial skills through demonstration,
imitation, and worker mobility channels (Blomstrom and Kokko, 1998; Dimelis, 2005;
Gorodnichenko, Svejnar, and Terrell, 2014).
However, at the horizontal level, the positive spillovers from foreign presence may be
compensated by fierce intra-industry competition (Hamida, 2013). In countries like Vietnam
that are characterized by low-tech sectors and unskilled labor, the risks of foreign presence to
local firms and employees are relatively high (Le & Pomfret, 2011). The question of whether
horizontal FDI brings benefits to local workers in terms of wages is even more complicated to
answer. Javorcik (2015) finds a positive impact of foreign affiliates on both domestic workers’
compensation and the country’s benefits by creating good jobs and improving productivity.
The relevant literature has developed two main streams on how horizontal spillovers from
foreign presence affect local wages: (1) competition in the labor market between foreign
affiliates and domestic firms and (2) aggregate productivity improvement (Aitken & Harrison,
1999; Driffield, 2004; Pittiglio, Reganati, & Sica, 2015).
First, under labor competition theory in the host market, the status quo of employee
mobility demands that foreign-based firms pay higher wages than local companies for highly
75
skilled and experienced workers (Becker, 1975). Because multinational enterprises (MNEs)
require highly qualified and committed workers to operate efficient systems, they generally
pay higher wages than local rates to discourage labor turnover of highly skilled workers (Aitken
& Harrison, 1999; Driffield, 2004; Meyer, 2003). Foreign companies tend to protect their
intangible assets (a sunk cost), and high wages are a means of minimizing trade losses and
labor turnover issues (Dunning, 2000; A. Kokko, 2004).
Moreover, new entries into a developing market are always accompanied by foreign
liabilities that require the foreign affiliates to confront a shortage of skilled workers and the
difficulties of recruiting and retaining this kind of labor (Fukase, 2014). Recruiting a majority
of skilled workers and assimilating these employees are essential to not only maintain but also
promote productivity in the long run and ensure the efficient operation of MNCs (Chew & Teo,
2002). Besides, high payments can function as a marketing strategy highlighting the company's
capital, revenue and high adaptability to the new environment.
Furthermore, although local firms’ business practices and wage policies in host
developing countries are very familiar to local workers, highly qualified workers will gradually
realize that their dream jobs are available with greater compensation at foreign firms. This
recognition supports their bargaining power for the wage they expect to receive for a particular
job. Under this labor competition, domestic firms are forced to pay higher wages to attract
qualified workers, leading to an increase in the wage equilibrium (Fukase, 2014; Onaran &
Stockhammer, 2008). Regardless of an MNC's generous wage policy, the labor demand, capital
intensity, firm size, skill intensity requirement, and wage minimum and premium levels in the
host country influence the effect of FDI on salary (Nelson, 2010; Ni et al., 2017).
Second, previous studies have argued that FDI firms bring substantial benefits to the host
country, including advanced technology, management know-how, and productive capital.
76
From the perspective of aggregate productivity improvement, local businesses can absorb
knowledge spillovers from foreign presence through observation, imitation, and demonstration
activities to enhance their labor productivity and produce at more efficient marginal costs
(Hamida & Gugler, 2009; Blomstrom & Kokko, 1998; Caves, 1974). The absorptive capacity
of labor is extremely important for domestic firms to receive positive productivity spillover
from FDI (Huynh et al., 2019). Labor productivity is significantly greater in foreign companies
than in local firms; as a result, the observed wage for foreign companies is also higher than that
of local companies. Due to favorable conditions and a sense of opportunity, the nature of the
horizontal spillover will boost the productivity of local firms and push up the wage equilibrium
of local workers (Aitken et al., 1997). The positive and dramatic effects of horizontal spillover
on the wages of domestic workers are also topics in the literature on skill development and
expansion of knowledge (Blomström & Persson, 1983; Blomström & Sjöholm, 1999;
Globerman, 1979; Liu, 2002).
However, FDI also increases wage inequality in developing countries. The management
skills, market information, technology, know-how, and knowledge development that FDI
brings to developing countries can accelerate technological change, a skill-driven process, and
thus increase income inequality in developing countries (Figini & Görg, 2011; Javorcik, 2015;
Zulfiu-Alili, 2014). First, the importance of spillovers can be most valuable to the industry
because of the implications of high technology for production. Because MNEs tend to employ
higher-skilled labor, they need to enhance production skills in developing countries (Feenstra
& Hanson, 1997). Second, due to the fierce competition with MNEs, domestic firms are
encouraged to adopt new technologies and enhance their research and development (Wood,
1995). Third, these technological changes could skew skills and increase the relative wages of
skilled workers in developing countries (Figini & Görg, 2011). Thus, by allowing capital
appreciation and technological change, FDI not only promotes economic growth by increasing
77
capital accumulation and productivity but also enhances income inequality in developing
countries.
Onaran and Stockhammer (2008) investigate whether foreign presence and trade
openness in terms of export and import orientations affect the average wage in five European
countries using cross-country manufacturing panel data from 2000 to 2004. A wage bargaining
model is estimated with real wage as the dependent variable and a wide range of independent
variables such as labor productivity, unemployment rate, intensity of foreign equity, export and
import ratio to total output. Notably, Onaran and Stockhammer (2008) contribute to the
literature by exploring the effects of both FDI penetration and trade on wages. The authors find
a significantly positive impact of FDI on wages in the short run but a negative impact in the
medium run accounting for skill and capital intensity. The findings also reveal that international
trade does not influence wages in the short run. Nevertheless, in the medium run, there is a
positive relationship between exports and wages, whereas a negative relationship is observed
between imports and wages. Although the effect of FDI on wages may vary across time,
Javorcik (2015) finds an overall positive impact of foreign presence on national aggregate
productivity and employees' salaries by creating good jobs and providing user training.
2.10.2 The relationship between trade openness and wages
Traditional trade theories recognize an effect of trade openness on a country’s welfare,
as the production of each country is based on its comparative advantages using its abundant
resources. However, skilled workers’ benefits may be negatively affected by a lower relative
wage premium if developing countries specialize in producing unskilled labor-intensive
products (Arbache, Dickerson, & Green, 2004). It is undeniable that trade openness is often
accompanied by knowledge spillovers in terms of technological upgrades and inward capital,
leading to higher demand for qualified workers (Marjit, Beladi, & Chakrabarti, 2004).
Compared with industrialized countries, the impact of trade liberalization from the perspective
78
of developing countries is quite different. The premises of international economics emphasize
the effect of international trade on intra-industry and inter-industry wage dispersion and the
change in relative wages due to unbalanced worker mobility, such as increasing demand for
skilled labor in export-intensive industries and a shock to labor demand in import industries
(Martins & Opromolla, 2009; Onaran & Stockhammer, 2008).
The recent literature has reviewed how firm-level trade openness may affect wages in
the formal employment sector in the host country. While trade openness negatively affects the
real wages of both skilled and unskilled workers in the short run, it appears to generate well-
paid jobs for unskilled labor and a decline in wages for skilled labor in developing countries
(Onaran & Stockhammer, 2008). Economists argue that the effect of trade on wages may take
time and is strictly linked to country and firm heterogeneities (Arbache et al., 2004). Therefore,
the effects of trade on wages, in the long run, are better determined by cost efficiency and
productivity improvement than temporary labor demand (Monte, 2011). Furthermore, the
effects of exports and imports on wages should be analyzed separately (Onaran &
Stockhammer, 2008).
Importing high-quality intermediate goods can benefit firms via efficiency and
productivity improvements and generate positive externalities to workers by distributing higher
wages (Martins & Opromolla, 2009). However, increasing imports of new machinery and
technologies will temporarily trigger negative impacts on real output under the initially
imperfect allocation of skilled labor in the short run. In other words, such imports may favor
skill- or capital-biased industries and result in job losses for unqualified individuals (Arbache
et al., 2004). Indeed, this shift will temporarily increase relative wages in favor of skilled
workers. However, after this transition stage is over, the initial reduction in unskilled workers’
wages may be offset as this labor force begins learning and adapting to the new technology.
Therefore, increasing imports may lead to a decline in wages by intensifying the competitive
79
pressure on domestic firms and increasing wage inequality between industries and ownership
sectors (Onaran & Stockhammer, 2008).
Exporters in developing countries, on the other hand, are often characterized by high-capital-
intensity industries and rely on skilled labor. Consequently, workers employed in these
industries have the strong bargaining power to demand their expected wages (Martins &
Opromolla, 2009; Wood et al., 2014). When firms want to go global and sell their products to
other countries, they need to adapt their products to international standards. The higher
compensation associated with exporters is one way to motivate the workers to strive
relentlessly to achieve common goals.
In practice, the measurement of the extent and frequency of FDI spillovers through the
channels of competition, imitation/demonstration, worker mobility, and inter-linkage
cooperation are not possible. Besides lacking information and indicators, these channels' level
of appearance is very different and inconsistent across businesses and economies. That is the
reason why previous researchers in Vietnam and around the world have measured the extent of
FDI spillovers to domestic firms by horizontal (intra-industry) spillover and vertical (inter-
industry) spillover. Therefore, this kind of classification and measurement is used by this thesis
to measure and analyze the spillover effects of FDI on Vietnamese enterprises.
2.10.3 Firm heterogeneity and wage spillovers
Although compensation in foreign subsidiaries and large corporations may be higher in the
early stage of expansion to recruit qualified workers with high absorptive capacity, the average
wages may soon stabilize at a floor labor price that is equal to or slightly higher than that of
local competitors and smaller firms (Decreuse & Maarek, 2015). There is no doubt that these
firms have strong motivations to invest in emerging countries to acquire cheap labor (Chen,
Ku, & Liu, 2018; Kojima, 1973). For example, China, known as the world’s factory and home
80
to many offshoring activities, has an extremely high demand for blue-collar workers, who often
receive low wages (Zhihong Chen, Ge, Lai, & Wan, 2013; Nelson, 2010). Emerging economies
such as Brazil and Indonesia have witnessed similar trends of the size-wage effect in which
foreign presence is positive for skilled labor and negative for unskilled labor (Hijzen, Martins,
Schank, & Upward, 2013). Therefore, under the common circumstances of developing
countries, an increase in firm size may lead to a fall in the average wage, especially for low-
skill labor.
The gender ratio (GR) is essential for assessing whether enterprises with higher rates of
female workers earning the average wage have lower (mainly primary workers) total
employment (Nguyen, 2015). Female workers may be considered more likely to be less skilled
due to differentiated training and education levels (this perspective has been influential since
ancient times in Vietnam). Further impacts may occur when skilled female workers acquire
new views on workplace discrimination, particularly in a male-dominated society such as
Vietnam (Fukase, 2014). However, there are other explanations for the divergent effects on
wages for women and men. Difficulties faced by women during and after pregnancy may also
explain the lagging and decreasing wages of women. Many young mothers decide to sacrifice
and change careers when they have children. In particular, women tend to find flexible jobs
that allow them to earn extra income while caring for their children. As a result, women have
fewer job opportunities and may also be less likely than men to work for a company long-term.
Therefore, in this study, the interaction term between gender ratio and horizontal spillover is
expected to explain whether the share of female workers influences the horizontal effect of FDI
on wages.
Empirical evidence has revealed that encouraging female employment in foreign
subsidiaries and export-oriented firms lead to a reduction of the gender wage gap. However,
foreign presence fails to enhance wage equality in the private sector as a result of gender
81
discrimination against women in developing countries (Chen et al., 2013). Although FDI
inflows and export orientation narrow the gender wage gap, the diverse effects of these
phenomena on wages can be traced to the gender productivity gap and differentiated
employability skills (Chen et al., 2013; Chiu & Chuang, 2016). Research on the inter-industry
gender wage gap also finds that women have several advantages and earn higher relative wages
approaching those of men in non-production industries such as finance and services (H. L.
Chuang, Lin, and Chiu, 2018).
Importantly, the empirical evidence has emphasized the moderating effect of ownership
types such as partially foreign-invested firms, domestic private firms, joint ventures, SOEs, and
wholly foreign-invested firms on the relationship between horizontal spillover and wages
(Earle, 2017; Nguyen, 2015; Nguyen & Ramstetter, 2017). The inherent characteristics of each
ownership type will determine how firms design their wage patterns, respond to competition
in the labor market and adapt to wage policies and government regulations in the host country.
Indeed, wholly foreign-owned firms and joint ventures with foreign affiliates tend to pay higher
wages than SOEs and domestic private firms to employ and retain qualified labor as well as to
prevent the movement of their intangible assets to the domestic sector (Blomstrom & Kokko,
1998; Driffield, 2004).
On the other hand, domestic private, joint-stock and state-owned firms appear to pay lower
wages because they are very familiar with the local labor market and often have a high demand
for unskilled labor. Moreover, foreign entry may restructure the host labor market such that all
types of ownership are on the labor demand side and all kinds of labor are on the labor supply
side (Nelson, 2010). Because the demand for labor differs among skilled and unskilled labor,
wages may be driven by the market to a new wage equilibrium. In this thesis, due to data
availability, ownership identity has been divided into five categories: wholly foreign-invested
82
firms, joint-stock companies, domestic private firms, SOEs and joint ventures with foreign
partners.
Finally, Bhaduri & Marglin (1990) explain that the real wage represents an endogenous
variable because machinery creates favorable conditions for generating demand along with
output, which determines the real wage of the workers. Bhaduri & Marglin also note that it is
difficult to rationalize the extent of the effect of output on wages. However, wages and
productivity simultaneously move in the same direction; this is the indecisive factor that
directly targets wages. Thus, this study explores again how real output predicts the average
wage. Second, capital-intensive production requires an abundant source of human capital and
assumes that efficient wages are paid for human capital. Indeed, companies requiring capital
intensity seek to employ skilled workers, leading to a high correlation between capital intensity
and wages (Nguyen & Ramstetter, 2017). Third, among competitors and spearheads of the
industry, wages go hand in hand with transformed motivations in the Vietnamese economy.
Furthermore, an indispensable concept is that companies with a significant market share will
have the advantage of dominating the market. Loss of market share is accompanied by reduced
competitive advantage, reduced profits, higher costs, and a threat to the market. According to
Nguyen (2015), a higher market share leads to a greater reputation and higher wages.
2.10.4 Ownership structure and FDI spillover:
The level of foreign ownership of affiliates located in the host country is a determinant
of FDI spillover (Buckley, Wang, & Clegg, 2007). Foreign shares can confer benefits to the
recipient firms through technology and knowledge diffusion. In particular, foreign ownership
is considered one of the most important channels of horizontal FDI spillover (Iršová &
Havránek, 2013; Lin, Liu, & Zhang, 2009). During the cooperation, some of the knowledge-
based intangible assets of foreign enterprises may spill over to local companies (Blomström &
Sjöholm, 1999; Javorcik & Spatareanu, 2008). To maintain a competitive advantage, MNEs
83
may try to prevent leakage by investing in only fully-owned foreign projects to ensure greater
control of employee behavior and firm policies (Javorcik & Spatareanu, 2008).
As emphasized by Javorcik (2004) and Javorcik & Spatareanu (2008), MNEs may
transfer advanced technology that may be too complex for domestic firms to learn to wholly-
owned affiliates. In this case, spillover is less likely to happen. In addition, Aitken & Harrison
(1999) and Javorcik & Spatareanu (2008) find strong evidence supporting positive spillover
for joint ventures but negative spillover for wholly-owned affiliates. On the contrary,
Blomström & Sjöholm (1999) analyze cross-sectional data and find that the type of ownership
does not affect firms’ productivity nor generate spillover effects.
2.10.5 Empirical evidence on wage spillovers from FDI
Compared to a rich body of empirical studies investigating productivity spillovers, the
researches related to FDI spillover effect on wages are relatively limited and lacking persuasive
evidence. Therefore, this dissertation aims at providing more evidence and implications on the
existence of wage spillovers in emerging countries receiving inward foreign capital.
Regarding worker mobility, Hijzen, Martins, Schank, & Upward (2013) explored which
extent foreign takeovers and domestic takeovers affect the average wages of domestic workers.
The authors used firm-level data across five countries (two developed and three developing)1.
The approach of propensity-score matching (PSM) and difference-in-differences are
implemented for model estimation. In their study, the average wage is measured by the
logarithm of average worker wage or the logarithm of total wages divided by total employees.
The explanatory variables include foreign ownership, total employees, individual wage, worker
1 Brazil (firm-level data from 1994 to 2005), Germany (establishments data in 1994 and 2004),
Portugal (firm-level from 1997 to 2004), UK (firm-level 1997 1997-2005), Indonesia
(establishment 1997-2005)
84
turnover, sex, age skill, foreign takeovers (t=1, t=2, t=3)2, domestic takeovers (t=1, t=2, t=3)1,
region and industry dummies. The findings indicate that employees working in foreign firms
or after a foreign takeover receive higher average wages. The result is also supported by
Stoyanov & Zubanov (2014). Moreover, as a result of the cherry-picking process, the effect of
foreign takeovers on average wages depends on the skill level of workers which is in favor of
high-skill workers and negatively affects low-skill workers (Hollanders & Weel, 2002; Nelson,
2010). However, there is a tradeoff between positive wage effect and job insecurity under
MNCs’ presence (Shropshire & Kadlec, 2012).
Concerning local workers' benefit under foreign presence, Pittiglio et al. (2015) used firm-
level panel data of Italian manufacturing firms and input-output tables from 2002 to 2007 to
examine the effect of foreign presence in terms of horizontal and vertical spillovers on
domestically – owned firms' average wage. The authors conducted the fixed effect model
(FEM) moderated by the technology gap which is measured by the difference between the
firm's TFP and intra-industry average foreign firms' TFP. The results show that without
controlling for the technology gap, wage spillover doesn't exist. The technology gap is an
important determinant of both productivity spillovers and wage spillovers from FDI (Jacobs et
al., 2017; Kounetas, 2015). In this case, domestic firms with large technology gap receive
positive horizontal spillovers and negative vertical spillovers on wage. In contrast, there is a
positive backward spillover effect on wages in the case of domestic firms with medium
technology gap. Moreover, the impact of foreign presence on wage varies significantly across
industries.
2 Note: t=0: < 12 months after the change in ownership status, t=1: 1-2 years after the change
in ownership status, t=3: 2-3 years after the change in ownership status
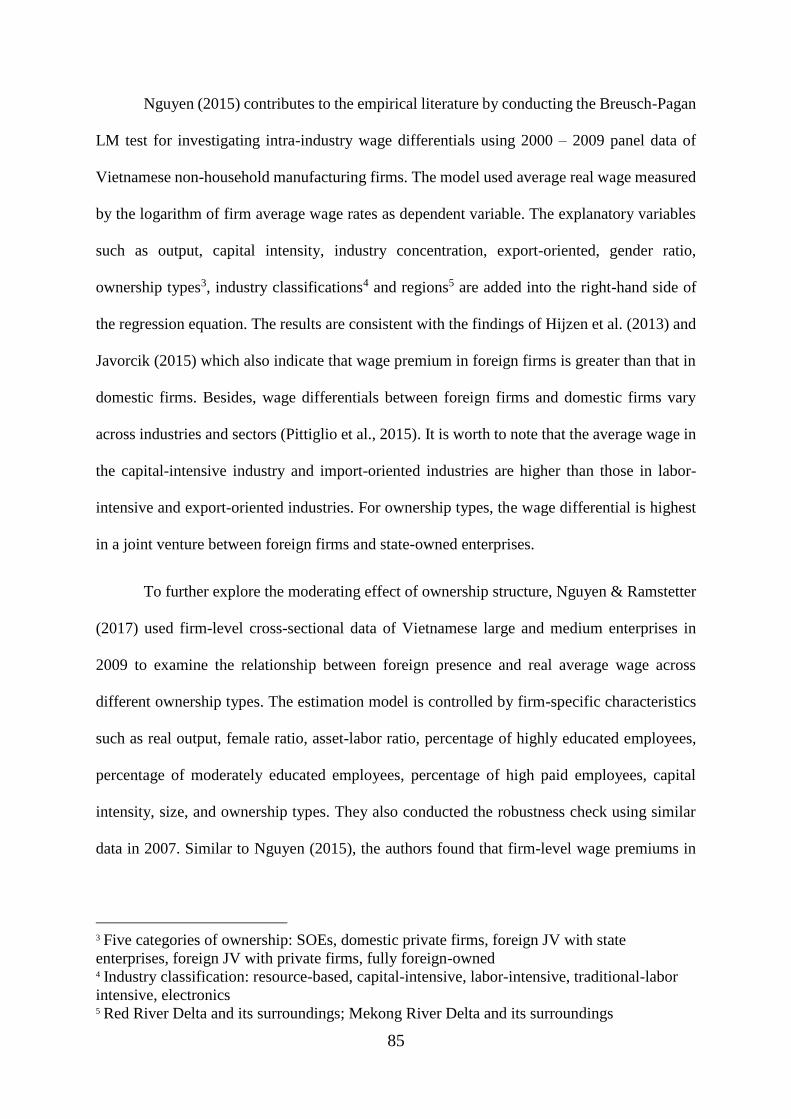
85
Nguyen (2015) contributes to the empirical literature by conducting the Breusch-Pagan
LM test for investigating intra-industry wage differentials using 2000 – 2009 panel data of
Vietnamese non-household manufacturing firms. The model used average real wage measured
by the logarithm of firm average wage rates as dependent variable. The explanatory variables
such as output, capital intensity, industry concentration, export-oriented, gender ratio,
ownership types3, industry classifications4 and regions5 are added into the right-hand side of
the regression equation. The results are consistent with the findings of Hijzen et al. (2013) and
Javorcik (2015) which also indicate that wage premium in foreign firms is greater than that in
domestic firms. Besides, wage differentials between foreign firms and domestic firms vary
across industries and sectors (Pittiglio et al., 2015). It is worth to note that the average wage in
the capital-intensive industry and import-oriented industries are higher than those in labor-
intensive and export-oriented industries. For ownership types, the wage differential is highest
in a joint venture between foreign firms and state-owned enterprises.
To further explore the moderating effect of ownership structure, Nguyen & Ramstetter
(2017) used firm-level cross-sectional data of Vietnamese large and medium enterprises in
2009 to examine the relationship between foreign presence and real average wage across
different ownership types. The estimation model is controlled by firm-specific characteristics
such as real output, female ratio, asset-labor ratio, percentage of highly educated employees,
percentage of moderately educated employees, percentage of high paid employees, capital
intensity, size, and ownership types. They also conducted the robustness check using similar
data in 2007. Similar to Nguyen (2015), the authors found that firm-level wage premiums in
3 Five categories of ownership: SOEs, domestic private firms, foreign JV with state
enterprises, foreign JV with private firms, fully foreign-owned 4 Industry classification: resource-based, capital-intensive, labor-intensive, traditional-labor
intensive, electronics 5 Red River Delta and its surroundings; Mekong River Delta and its surroundings
86
wholly foreign-invested enterprises, joint venture (JV) and state-owned enterprises (SOEs) are
greater than that in domestic private firms. Besides, positive wage differentials are stable for
JV and wholly foreign-owned firms for most sectors, but insignificant for SOEs.
About workers' characteristics, Earle (2017) investigate the effects of MNC's presence on
average wage using firm-level panel data of Hungarian firms from 1992 to 2008 using
Statistical Yearbooks of Hungary. The propensity score matching and linear probability model
(LPM) is used to test the main hypotheses. By separating the effects of FDI across different
worker's characteristics, the author recognizes that the differentials of productivity and wage
are clear with the existence of skill bias as what is found in Monte (2011) and Yunus, Said, &
Azman-Saini (2015). Regardless of worker's characteristics, no one suffers from wage
reduction under FDI presence.
2.11 Research model and hypotheses
2.11.1 Firm productivity spillover under FDI presence
Based on the work of Blomstrom & Kokko (1998) and empirical findings by (Anwar
& Nguyen, 2014; Damijan et al., 2013b; Havranek & Irsova, 2011; Javorcik et al., 2018;
Mariotti et al., 2015), productivity spillover occurs when there is local firms' productivity/
efficiency improvement as a result of foreign presence, may come from: (1) The movement of
some extent of advanced technology and knowledge diffusion from MNCs' origin country to
developing host countries to sustain their competitiveness and (2) Market penetration
threatening local firms' market share and profits and forcing them to change. However, they
also admitted that the evidence for such kind of FDI spillover effects on the host country in
both inter and intra-industry are not strong enough due to limited empirical analysis. To sum
up, the authors emphasize that foreign presence improves "allocative efficiency" and "technical
efficiency" in the host country, thereby enhancing the productivity of domestic host firms.
87
More important, spillovers are positively related to the host country's internal capacity and
competitiveness.
There are a wide range of MNCs’ activities or consequences associated with inward
FDI such as remove or trigger high monopolistic industry in response to the power of local
competitors; transfer of management know-how through training/demonstration activity and
worker turnover; develop backward and forward linkage relationship between subsidiaries and
upstream local suppliers/ subcontractors or downstream customers (techniques transferred:
inventory, standards, quality control, etc…); adaptive management and marketing strategies
and knowledge by local firms in response to a more dynamic and competitive environment
(Blomstrom & Kokko, 1998). Regarding measurable indicators, productivity spillovers occur
through three channels including horizontal spillover, vertically backward spillover and
vertically forward spillover. Therefore, the proposed hypotheses are as follows:
Hypothesis H1: The productivity of Vietnamese domestic companies is negatively
associated with the horizontal technology spillovers from FDI firms.
Hypothesis H2a: The productivity of Vietnamese domestic companies is positively
associated with the vertical backward spillover from FDI firms.
Hypothesis H2b: The productivity of Vietnamese domestic companies is positively
associated with the vertical forward spillover from FDI firms.
2.11.2 The importance of absorptive capabilities
As the foreign firms increase their presence in the host market, a well-trained labor force
with high absorptive capacity can enable the local firms to receive the positive spillovers from
FDI more effectively (Ahmed, 2012). On the contrary, low level of human capital development
can trigger a true obstacle that the domestic firms may realize about it; however, they miss out
and let positive externalities run away. Thus, the acquisition of human capital and the
88
availability of high-skilled labor in local firms are considered as the main key to unlock the
positive FDI spillover and help domestic firms reach a higher level of productivity (Anwar &
Nguyen, 2014). It is interesting to note that the labor turnover from the foreign subsidiaries to
local firms has generated one of the most important FDI spillover channels in many countries
(Demena, 2015; Havranek & Irsova, 2011). Hence, the proposed hypothesis is as follows:
Hypothesis H3: The relationship between FDI spillovers and productivity of domestic
firms is improved with a higher level of human capital.
Studies on technology gap have recognized a role for technological gap between foreign
firms and local firms as a facilitator or sometimes a barrier for technology transfer and
productivity spillovers (Carluccio & Fally, 2013; Sourafel Girma & Wakelin, 2007; Jacobs et
al., 2017; Tsekouras, Chatzistamoulou, Kounetas, & Broadstock, 2015). They demonstrate that
the technology gap is inversely proportional to the successful level of technology transfer.
Indeed, technology upgrade is considered as the most important source of productivity
increase. More comprehensively, Girma & Wakelin (2007) propose three subgroups of
technology gap: the top 20th percentile, the second 20th -80th percentile and the bottom 20th
percentile. Further, if the gap is too small, there is less motivation for local firms to imitate. On
the contrary, the large gap is very difficult for low-technological-frontier firms to reach
(Kounetas, 2015). He indicates that the middle one is the most appropriate gap for technology
transfer and local firms’ adoption. The proposed hypotheses are as below:
Hypothesis H4a: The relationship between FDI spillovers and productivity of domestic
firms is lower at the top 25th and bottom 25th percentile of the technology gap.
Hypothesis H4b: The relationship between FDI spillovers and productivity of
domestic firms is enhanced at the middle 25th-75th percentile of the technology gap.
89
Although financial development does not attract much attention from previous empirical
studies, it is an essential indicator implying the financial health of a firm. The surplus of
financial resources in term of organizational slacks encourage firms to start their new ventures,
deal with uncertainties or get involved in rapid changes by maintaining their competitiveness,
upgrading their technology or investing in human capital accumulation (Lin & Liu, 2012;
Zhang, Yang, & Zhang, 2018). Moreover, the local firms with sufficient financial development
have more capabilities to absorb knowledge diffusion and technology spillovers from FDI.
Therefore, the proposed hypothesis is as below:
Hypothesis H5: The relationship between FDI spillovers and productivity of domestic
firms is improved with a higher level of financial development.
2.11.3 The effect of regional effects and geographical distance on productivity spillovers
The geographic distribution of FDI also has a significant influence on the magnitude
of FDI spillover. Foreign investors select sites of investment based on an assessment of the
advantages and disadvantages of different areas. Specifically, domestic firms that are located
in an export processing zone or industrial zones where foreign investment-preferential policies
are available to have greater potential to receive technology spillover. According to Chen,
Poncet, & Xiong (2017), local firms located near MNEs may benefit from export spillover
since MNEs are likely to have more experience in export activity (Ekholm, Forslid, &
Markusen, 2007; Girma, Görg, & Pisu, 2008; Harding & Javorcik, 2012; Jenkins & Arce,
2015). Dang (2013) suggests that foreign investments tend to be located in highly developed
areas of the recipient country in which a productive workforce and relatively low energy costs
are available. The effects of flows on institutional development or quality have also been
explored (Demir, 2016; Krammer, 2015; Long, Yang, & Zhang, 2015; Ran, Voon, & Li, 2007).
Hence, the study obtains the hypotheses as follows:
90
Hypothesis H6a: FDI spillover effect on domestic firm productivity vary significantly
across geographical regions and higher in more FDI-intensive regions.
Hypothesis H6b: FDI spillover effect on domestic firm productivity vary significantly
across economic regions and higher in more FDI-intensive regions.
There is strong evidence for the negative influences of geographical distance between
foreign firms and local firms on the possible productivity spillover (Halpern & Muraközy,
2007; Thang et al., 2016). On the other words, the distance is inversely proportional to the
spillover effects from foreign affiliates to local ones (Mariotti et al., 2015; Merlevede & Purice,
2016). It is worth that the local firms nearby or surroundings by MNCs have more chances to
observe, imitate the foreign competitors/ partners, hence improve its productivity and
performance (Sourafel Girma & Wakelin, 2007). Furthermore, those firms are more exposed
to the technology and management know-how currently used by foreign ones (Havranek &
Irsova, 2011). This facilitates the process of technology transfer and creates a springboard for
productivity improvement in the long term. Because the data on physical distances between
foreign firms and domestic firms in Vietnam is unavailable, this study attempt to fill the gap
by measuring the provincial distance (within 100km2) from the province that the domestic firms
located to the eight cities/ provinces (Ha Noi, Bac Giang, Hai Phong, Thanh Hoa, Binh Duong,
Dong Nai, Ba Ria – Vung Tau and Ho Chi Minh) with highest concentration of accumulated
FDI capital. Thus, the proposed hypothesis is:
Hypothesis H7: Local firms in provinces located within 100 sq. km. of the most FDI-
intensive provinces/cities receive greater spillover effects than those located in
provinces outside 100 sq. km of these areas.
91
2.11.4 The effect of horizontal spillovers on the average wage
Despite a huge body of researches on productivity spillovers and export spillovers, there
is less evidence on the effects of FDI spillovers on the average wage of local workers. Previous
studies indicate a positive wage differential between foreign firms and domestic firms which
appears to be higher for joint venture ownership (Nguyen, 2015; Nguyen & Ramstetter, 2017).
According to Earle (2017), the effect of intra-industry FDI spillovers on local average wages
can be explained by higher labor productivity under foreign presence, thereby leading to an
increase in wage equilibrium. This is supported by studies on the wage gap and gain distribution
between foreign-employed workers and domestic-hired workers (Huang & Zhang, 2017;
Stoyanov & Zubanov, 2014). It is admitted that FDI firms have the motivation to pay higher
wages to retain their labor to sustain their intangible assets and knowledge. As a result, local
firms surrounded by foreign firms have to follow this wage trend to compete for high-skilled
workers in the host market (Driffield, 2004). Therefore, the proposed hypothesis is as follows:
Hypothesis H8: Horizontal FDI spillovers under foreign presence positively
affect the average wage of local firms in the same industry with foreign firms.
In addition, it is undeniable that the wage patterns and adaptation toward inward FDI
may be determined by ownership types categorized by SOEs, private firms, FDI firms (both
wholly invested and joint venture), joint-stock companies and other types. As a result of skill
bias, there are strong evidences for higher wages paid by wholly foreign-owned firms or joint
ventures between MNCs and SOEs (Hollanders & Weel, 2002; Pittiglio et al., 2015). In
contrast, the private sector is often characterized by lower compensation due to their low
working requirements and cultural familiarities (Nguyen & Ramstetter, 2017). However, it is
believed that foreign presence may generate both direct and indirect influences on restructuring
the labor market in the host country. Thus, the proposed hypothesis is as follows:
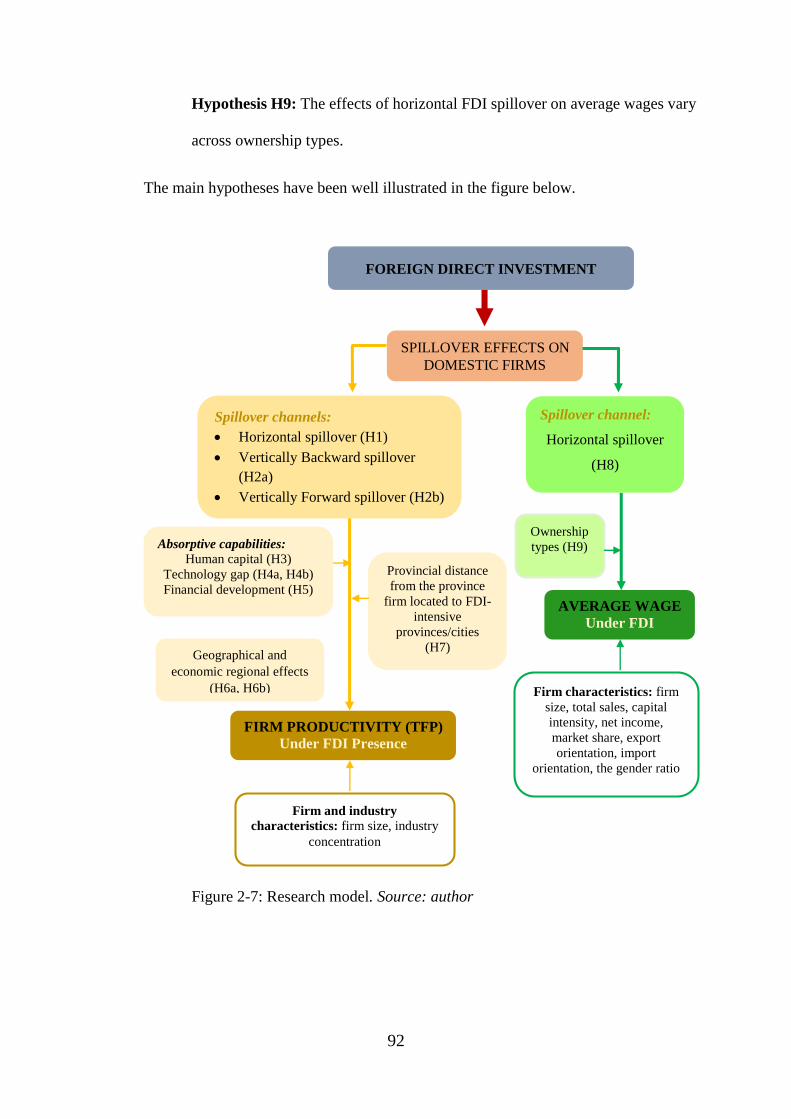
92
Hypothesis H9: The effects of horizontal FDI spillover on average wages vary
across ownership types.
The main hypotheses have been well illustrated in the figure below.
Figure 2-7: Research model. Source: author
FOREIGN DIRECT INVESTMENT
SPILLOVER EFFECTS ON
DOMESTIC FIRMS
FIRM PRODUCTIVITY (TFP)
Under FDI Presence
Provincial distance
from the province
firm located to FDI-
intensive
provinces/cities
(H7)
Absorptive capabilities:
Human capital (H3)
Technology gap (H4a, H4b)
Financial development (H5)
AVERAGE WAGE
Under FDI
Presence
Firm characteristics: firm
size, total sales, capital
intensity, net income,
market share, export
orientation, import
orientation, the gender ratio
Spillover channels:
Horizontal spillover (H1)
Vertically Backward spillover
(H2a)
Vertically Forward spillover (H2b)
Firm and industry
characteristics: firm size, industry
concentration
Ownership
types (H9)
Spillover channel:
Horizontal spillover
(H8)
Geographical and
economic regional effects
(H6a, H6b)
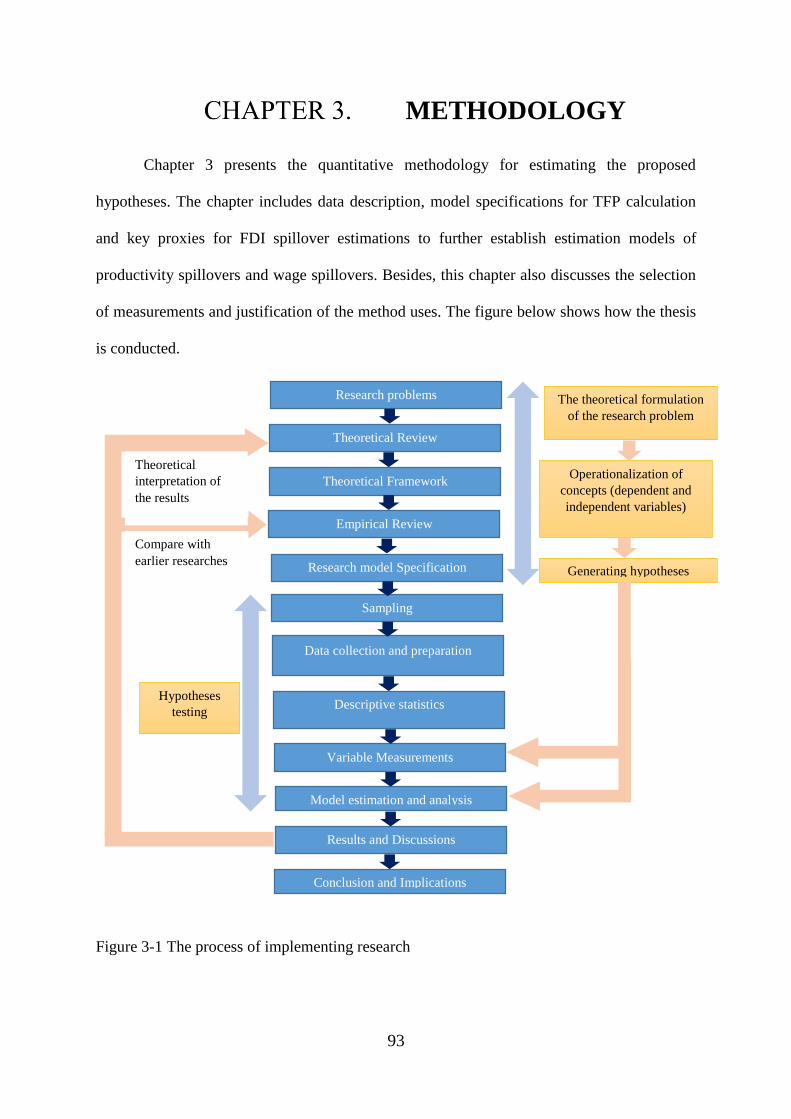
93
METHODOLOGY
Chapter 3 presents the quantitative methodology for estimating the proposed
hypotheses. The chapter includes data description, model specifications for TFP calculation
and key proxies for FDI spillover estimations to further establish estimation models of
productivity spillovers and wage spillovers. Besides, this chapter also discusses the selection
of measurements and justification of the method uses. The figure below shows how the thesis
is conducted.
Figure 3-1 The process of implementing research
Theoretical Review
Research model Specification
Sampling
Data collection and preparation
Descriptive statistics
Variable Measurements
Model estimation and analysis
Results and Discussions
Research problems
Generating hypotheses
Conclusion and Implications
Hypotheses
testing
Operationalization of
concepts (dependent and
independent variables)
Empirical Review
Theoretical Framework
Theoretical
interpretation of
the results
Compare with
earlier researches
The theoretical formulation
of the research problem
94
3.1 Econometric model specifications and estimations
Besides the major contribution of labor and capital inputs, it is found that there are
always unobserved input factors determining the total output. These factors may belong to the
application of scientific and technological advances, modern management knowledge, etc. In
other words, three components contribute to the production of goods and services, namely (1)
labor, (2) capital and (3) other factors such as education, training, science, and technology, etc.
The productivity gains which are not due to an increase in capital and labor is called "total
factor productivity". Therefore, to investigate the productivity spillovers associated with FDI,
the author first estimates firm-level productivity in terms of total factor productivity by
estimating the residual of production function.
The study then regresses the TFP on proxies for FDI spillovers. Also, their interactive
terms associated with other control variables are included in the equation to avoid the problem
of omitted variable bias and explain the movement of the dependent variable more accurately.
This two-stage procedure is widely used to estimate productivity spillovers from FDI (Anwar
& Nguyen, 2014; Lin & Kwan, 2016).
3.1.1 Total Factor Productivity Estimation
There are several functions for TFP estimation such as Cobb-Douslag production
function, translog production function, constant elasticity of substitution (CES) utility function
and other more complicated production functions. Depending on the purpose of FDI spillover
estimation, the Cobb-Douslag production function is widely used as it can reflect the
technological relationship among the inputs and outputs produced which are the most important
concern of productivity improvement under foreign presence (Gorodnichenko et al., 2014a). In
this way, the production function at Cobb-Douslag type is conducted by many recent studies
on FDI spillovers such as (Anwar & Nguyen, 2014; Gorodnichenko et al., 2014a; Lenaerts &
Merlevede, 2016; Newman et al., 2015) to estimate TFP.
95
First, assume that the production function of Vietnamese manufacturing firms is at
Cobb Douslag type, we have:
ln(𝑌𝑖𝑗𝑡) = ln(𝐴𝑖𝑗𝑡𝐿𝑖𝑗𝑡𝛽𝑙 𝐾𝑖𝑗𝑡
𝛽𝑘) (1)
Based on the first equation, the total factor productivity can be estimated as in equation
(2)
ln(𝐴𝑖𝑗𝑡) = ln(𝑌𝑖𝑗𝑡) −βl(𝐿𝑖𝑗𝑡) +β𝑘(𝐾𝑖𝑗𝑡) + ωIit + ε𝑖𝑡 (2)
where Y, L, and K are the logarithm of output, labor, and capital inputs, respectively, ω stands
for the firm’s input demand that researchers do not know, ε represents the stochastic
disturbance of productivity, and i, j, and t denote the firm, industry, and time, respectively.
One of the estimation concerns is to avoid the problem of simultaneous input choices
which lead to the correlation between TFP and covariance (Demena, 2015). As a result,
calculating TFP using the OLS approach is more likely to be biased due to the endogenous
problem. Thus, the study uses the Olley-Pakes method (OP) which allows firm-specific
productivity gap to reveal idiosyncratic changes over time.
The study applies the syntax "opreg" in Stata 14 with an option method developed by
Yasar, Raciborski, and Poi (2008) to estimate TFP, which is considered the residual of the gross
output function contributed by labor and capital input. Labor input is represented by the natural
logarithm of the number of employees at each firm. The natural logarithm of fixed assets is
used to estimate capital input. The natural logarithm of the change in debt is used to estimate
investment. Following Olley and Pakes (1992), to overcome endogeneity, this study use
investment level to proxy for an unobserved time-varying productivity shock (as in Appendix
3). The approach of Olley and Pakes is also recommended as a very appropriate econometric
approach for TFP calculation (Rojec & Knell, 2017).
96
3.1.2 Establishing key proxies for FDI spillovers
3.1.2.1 Horizontal FDI spillovers
Horizontal spillover is estimated by taking the ratio of foreign capital share in industry
j to the share of firm i’s output in that industry. It has been revealed in previous studies that
horizontal FDI is very limited to some extent of spillover as it negatively or insignificantly
affects the domestic firms’ productivity (Gorodnichenko et al., 2014a; Halpern & Muraközy,
2007). Few studies support a positive relationship between horizontal FDI and TFP (Behera,
2017; Iršová & Havránek, 2013). Hamida (2013) suggests a higher probability of negatively
horizontal spillover for low-tech firms. Thus, in the case of Vietnamese manufacturing firms,
horizontal FDI is supposed to be negatively associated with TFP.
H_FDIjt = [∑ 𝐹𝑜𝑟𝑒𝑖𝑔𝑛𝑆ℎ𝑎𝑟𝑒𝑖𝑡×𝑌𝑖𝑡𝑖𝑓𝑜𝑟𝑎𝑙𝑙𝑖𝜖𝑗
∑ 𝑌𝑖𝑡𝑖𝑓𝑜𝑟𝑎𝑙𝑙∈𝑗]
where i, j, and t denote the firm, a four-digit industry, and time, respectively.
3.1.2.2 Vertical FDI spillovers
Vertically backward spillover is considered as an important channel of positive
externalities from FDI in many researches (Anwar & Nguyen, 2014; Anwar & Phi, 2011;
Gorodnichenko et al., 2014a; Thang et al., 2016). Thus, backward spillover is expected to
positively influence the TFP; as a result of greater inputs supplied by the domestic sector to an
industry in the foreign sector (Anwar & Nguyen, 2014). It is calculated in the formulas below:
B_FDIit= ∑ ∝𝑘𝑖 𝐻_𝐹𝐷𝐼𝑘𝑖∀𝑘≠𝑖
where ∝𝑘𝑖 is taken from the input-output matrix (in 2012 and 2015) (GSO). This
proportion stands for the industry i’s output share and is used as inputs in industry k. The input
supplied derived from the input-output table in intra-industry is often omitted in the previous
97
estimation model as it is argued that intermediate input use that already captured by the
horizontal spillover (Javorcik, 2004b).
3.1.2.3 Vertically forward spillover
Vertically forward spillover represents the externalities that come from the
establishment of forward linkage with the foreign presence sector. In other words, the
intermediate goods supplied by foreign firms are the inputs of a specific industry in local firms.
Thus, it is assumed to negatively or insignificantly affect the TFP because it may lead to the
strong dependence on foreign inputs and foreign sector would always control the degree of
forward linkage (Gorodnichenko, Svejnar, & Terrell, 2014b; Havranek & Irsova, 2011;
Javorcik et al., 2018; Javorcik & Spatareanu, 2011; Khachoo & Sharma, 2016).
𝐹_𝐹𝐷𝐼𝑖𝑡 = ∑ 𝛽𝑘𝑖𝐻_𝐹𝐷𝐼𝑘𝑖∀𝑘≠𝑖
where 𝛽𝑘𝑖 comes from the input-output matrix (in 2012 and 2015) (GSO). This proportion
stands for industry k’s output share and is used as inputs in industry i.
Due to data unavailability, most empirical studies calculate vertical spillovers at the
industry-level to reflect the vertical integration between firms (Lenaerts & Merlevede, 2016).
In this study, vertically backward and vertically forward spillovers are also estimated at the
two-digit industry.
3.1.3 Estimating productivity spillovers from FDI
3.1.3.1 Research model
We obtain the TFP regression model as follows:
ln(𝑇𝐹𝑃𝑖𝑗𝑡) = β0 +
β1𝐻_𝐹𝐷𝐼jt+β2𝐵𝐹𝐷𝐼𝑗𝑡+β3𝐹_𝐹𝐷𝐼𝑗𝑡+β4𝐻𝐶𝑖𝑗𝑡+β5𝐹𝑁𝑖𝑗𝑡+β6𝑇𝐺𝑖𝑗𝑡 +𝐷𝑗 + 𝐷𝑡 + μijt (3)
98
where ln(𝑇𝐹𝑃𝑖𝑗𝑡)is the log of firm i’s TFP in industry j at time t; H_FDIjt stands for the
horizontal technology spillover in industry j at time t; B_FDIjt stands for the vertical backward
spillover in industry j at time t; F_FDIjt stands for the vertical forward spillover in industry j at
time t; HCijt stands for firm i’s human capital accumulated in industry j at time t; FNijt stands
for firm i’s financial development; TGijt stands for firm i’s technology gap with the maximum
technology level in industry j at time t; Dj and Dt are industry dummies and time dummies
added to absorb the unobserved effect and disturbance across different industries and time, and
μ𝑖𝑡denotes the idiosyncratic error.
3.1.3.2 The proxies for different transmission channels of FDI spillover effect
The measures for FDI spillovers in the model are empirically adopted from many
previous studies (Du, Harrison, and Jefferson 2012; Gorodnichenko, Svejnar, and Terrell 2014;
Anwar & Nguyen, 2014). These measures are accepted and widely used, because they are well
defined and can capture the externalities from FDI effectively.
Horizontal spillover in four-digit industry j at time t is calculated as the proportion of
foreign equity presence in industry j, weighted by the proportion of firm i’s output in that
industry. Previous studies show that the extent of spillover from horizontal FDI is limited, as
it negatively or insignificantly affects domestic firms’ productivity (Gorodnichenko, Svejnar,
and Terrell 2014; Halpern and Muraközy 2007). Few studies support a positive relationship
between horizontal FDI and TFP. The findings suggest a higher probability of negative
horizontal spillover at low-tech firms (Gorodnichenko et al., 2014a). Thus, at Vietnamese
manufacturing firms, horizontal FDI is assumed to be negatively associated with TFP.
H_FDIjt = [∑ 𝐹𝑜𝑟𝑒𝑖𝑔𝑛𝑆ℎ𝑎𝑟𝑒𝑖𝑡×𝑌𝑖𝑡𝑖𝑓𝑜𝑟𝑎𝑙𝑙𝑖𝜖𝑗
∑ 𝑌𝑖𝑡𝑖𝑓𝑜𝑟𝑎𝑙𝑙∈𝑗]
where i, j, and t denote the firm, a four-digit industry, and time, respectively;
99
FDI spillovers in backward and forward linkages between domestic firms and foreign firms
are calculated as follows: Vertical backward spillover is considered an important channel of
positive externalities from FDI, as in many previous studies. Thus, backward spillover is
expected to positively influence TFP; as a result of greater inputs from the domestic sector to
an industry in the foreign sector (Anwar & Nguyen, 2014; Lenaerts & Merlevede, 2016).
B_FDIit= ∑ ∝𝑘𝑖 𝐻_𝐹𝐷𝐼𝑘𝑖∀𝑘≠𝑖
where ∝𝑘𝑖 is taken from the input-output matrix (in 2012 and 2015) (GSO). This proportion
stands for the industry i’s output share and is used as inputs in industry k.
Vertical forward spillover represents the externalities from the establishment of forward
linkage with the foreign sector. In other words, the intermediate goods supplied by foreign
firms are inputs for local firms in a specific industry. Thus, it is assumed to negatively or
insignificantly affect TFP because it may lead to strong dependence on foreign inputs, and the
foreign sector always controls the degree of forward linkage (Anwar & Nguyen, 2014; Lenaerts
& Merlevede, 2016).
𝐹_𝐹𝐷𝐼𝑖𝑡 = ∑ 𝛽𝑘𝑖𝐻_𝐹𝐷𝐼𝑘𝑖∀𝑘≠𝑖
where 𝛽𝑘𝑖 comes from the input-output matrix (in 2012 and 2015) (GSO). This proportion
stands for industry k’s output share and is used as inputs in industry i.
3.1.3.3 Human capital as a moderating variable
It is admitted that absorptive capacity in terms of human capital can't be immediately
achieved by abundant financial investment; but it is a consequence of long-term accumulation
of knowledge, skill, and experiences through a wide range of activities such as learning,
training, routine practices, and teamwork. Therefore, human capital is an extremely important
factor of production directly affecting the firm's absorptive capacity to relieve external
100
pressures and gain from FDI spillovers (Sampson, 2013). Human capital is calculated as the
natural logarithm of the ratio of firm i’s average wage to industry j’s average wage at time t.
Human capital is expected to enhance the productivity level as well as the relationship between
FDI spillover channels and TFP (Anwar & Nguyen, 2014; Damijan et al., 2013a;
Gorodnichenko et al., 2014a).
𝐻𝐶 = 𝑙𝑛 (𝑤𝑎𝑔𝑒𝑖
𝑤𝑎𝑔𝑒𝑚𝑒𝑎𝑛𝑗)
3.1.3.4 Technology gap as a moderating variable
According to Dimelis (2005), this mixed evidence is related to the catch-up and
absorptive capacity hypotheses. The catch-up hypothesis states that the larger the gap, the
higher the potential to learn new knowledge since domestic firms can catch up with advanced
technology and knowledge in the long run. The results of several studies confirm that a larger
gap provides more room for FDI spillovers due to the potential catch-up effect (Blalock &
Gertler, 2009; Wang & Blomström, 2002). By contrast, the absorptive capacity hypothesis
suggests that a lower gap is needed. In other words, if the gap is too large, domestic firms may
not have enough skilled workforce or physical capital to gain from horizontal spillover.
The study follows Anwar and Nguyen (2014) in computing the level of the technology
gap, which is measured by the difference in the average productivity of domestic and foreign
firms in percentage terms in the same industry. Then, it is divided into three main sub-groups:
the top 25th percentile, the second 25th -75th percentile and the bottom 25th percentile (Sourafel
Girma & Wakelin, 2007). While Girma (2007) divides the technology gap into three main
subgroups—high gap, medium gap, and low gap—to see how TFP responds to different levels
of technology gaps, Carluccio and Fally (2013) found that a high technology gap will make it
difficult for domestic firms to keep pace with foreign firms in the adoption of more advanced
technology. In this thesis, we assume that the gap small gap (bottom 25th percentile) or the large
101
gap (top 25th percentile) between the firms’ technological edge and the industry’s technological
frontier may restrict the positive influence of FDI spillovers on TFP growth. Meanwhile, the
middle technology gap (25th to 75th percentile) is assumed to be in favor of domestic firms’
spillover absorption.
3.1.3.5 Financial development as a moderating variable
This effective accumulation and allocation of the financial resources enable firms to
implement their absorptive strategies more effectively to achieve their long-term and short-
term targets (Lin & Liu, 2012). Under the penetration of foreign firms in the host market, the
financial development helps sustain high-liquidity funds for local firms in absorbing foreign
knowledge and technology diffusion to sustain their competitiveness and productivity growth
(Baloc, Sha, & Panhwar, 2014).
Financial development is a common indicator to demonstrate the financial health and
the readiness to absorb spillovers in each enterprise. In addition, financial development is also
used as a control variable as it reflects the financial health of a company and whether the firms
have enough slack resources to upgrade its existing technology and successfully benefit from
FDI spillover. It is calculated by the ratio of the firm's working capital to total assets as adopted
in (Anwar & Nguyen, 2014). Thus, we assume that it positively affects TFP growth.
𝐹𝑁 =𝑊𝑜𝑟𝑘𝑖𝑛𝑔𝑐𝑎𝑝𝑖𝑡𝑎𝑙𝑖𝑗𝑡
𝑇𝑜𝑡𝑎𝑙𝑎𝑠𝑠𝑒𝑡𝑠𝑖𝑗𝑡
3.1.3.6 The moderating effect of regional and provincial proximity
FDI spillover effect is supposed to be local in scale if the effects are received by nearby firms
only or national in scale if the impact spreads further to other parts of the country. In other
words, firms that are located close to MNEs tend to benefit more from spillover via imitation
and labor turnover compared with firms in more distant areas. The longer the distance, the
102
higher the cost of technology and knowledge diffusion (Aitken & Harrison, 2013; Görg &
Greenaway, 2004).
In short, the possibility of spillover is higher in developed areas than in remote areas
since the advanced technology and knowledge of foreign enterprises are easier to absorb if the
technology gap between MNEs and local firms is not too large (Jeon, Il, & Ghauri, 2013;
Tanaka & Hashiguchi, 2015; Xu & Sheng, 2012). The regional channel is quite important in
the case of Vietnam because FDI is mostly concentrated in highly developed regions, while
remote areas are unable to attract foreign investors. These disparities can affect the magnitudes
of spillover that may occur in different regions (Anwar & Nguyen, 2010; Mao & Yang, 2016).
To investigate how productivity spillovers from FDI vary across different regions, this
study aims at testing whether firm distribution matters or there is any significant differential
among the effects of inward FDI on domestic firm productivity across Vietnamese
geographical and economic regions. Based on the classification of General Statistics Office,
geographical regions in Vietnam include six regions: Red river delta, North East & North West,
North & South Central Coast, Highland, Southeast and Mekong river delta. In terms of
economic development, Vietnam is divided into four economic regions such as North
(including Red river delta, North East and North West), Central (North Central Coast, South
Central Coast, and Highland), South (Southeast) and Mekong River Delta.
Concerning geographical distance, many prior studies indicate that positive
productivity externalities diminish with increases in distance between MNCs and local firms,
especially in the manufacturing sector (Barrios et al., 2011; Halpern & Muraközy, 2007;
Mariotti et al., 2015). However, due to the shortage of data on the exact physical distance
between foreign firms and domestic firms; the study follows Halpern and Muraközy (2007)
measuring provincial proximity by using two distance scopes: within 100 sq. km from
socioeconomic centers with high FDI concentration of Hungary to the province where local
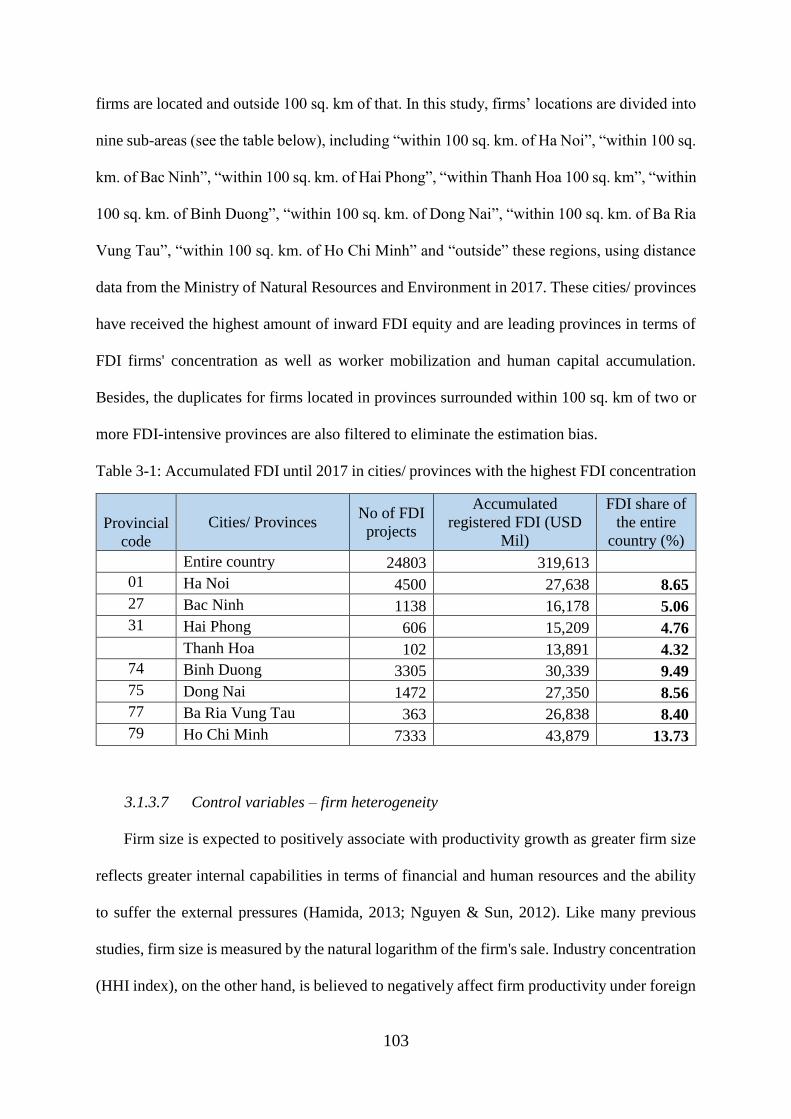
103
firms are located and outside 100 sq. km of that. In this study, firms’ locations are divided into
nine sub-areas (see the table below), including “within 100 sq. km. of Ha Noi”, “within 100 sq.
km. of Bac Ninh”, “within 100 sq. km. of Hai Phong”, “within Thanh Hoa 100 sq. km”, “within
100 sq. km. of Binh Duong”, “within 100 sq. km. of Dong Nai”, “within 100 sq. km. of Ba Ria
Vung Tau”, “within 100 sq. km. of Ho Chi Minh” and “outside” these regions, using distance
data from the Ministry of Natural Resources and Environment in 2017. These cities/ provinces
have received the highest amount of inward FDI equity and are leading provinces in terms of
FDI firms' concentration as well as worker mobilization and human capital accumulation.
Besides, the duplicates for firms located in provinces surrounded within 100 sq. km of two or
more FDI-intensive provinces are also filtered to eliminate the estimation bias.
Table 3-1: Accumulated FDI until 2017 in cities/ provinces with the highest FDI concentration
Provincial
code
Cities/ Provinces No of FDI
projects
Accumulated
registered FDI (USD
Mil)
FDI share of
the entire
country (%)
Entire country 24803 319,613
01 Ha Noi 4500 27,638 8.65
27 Bac Ninh 1138 16,178 5.06
31 Hai Phong 606 15,209 4.76
Thanh Hoa 102 13,891 4.32
74 Binh Duong 3305 30,339 9.49
75 Dong Nai 1472 27,350 8.56
77 Ba Ria Vung Tau 363 26,838 8.40
79 Ho Chi Minh 7333 43,879 13.73
3.1.3.7 Control variables – firm heterogeneity
Firm size is expected to positively associate with productivity growth as greater firm size
reflects greater internal capabilities in terms of financial and human resources and the ability
to suffer the external pressures (Hamida, 2013; Nguyen & Sun, 2012). Like many previous
studies, firm size is measured by the natural logarithm of the firm's sale. Industry concentration
(HHI index), on the other hand, is believed to negatively affect firm productivity under foreign
104
presence due to higher intra-industry competition and smaller market share (Choi & Pyun,
2017). HHI is calculated by the sum of squared market shares of all firms in the industry.
Furthermore, market share is calculated as a proportion of a firm’s total sales in a four-digit
industry. Imports are measured by the natural logarithm of the value of a firm’s imports. Labor
intensity is estimated by the ratio of total labor to a firm’s fixed assets.
3.1.4 Estimating wage spillovers from FDI
3.1.4.1 Research model
The research model is specified as follows:
AWit = β0 + β1*SIZEit + β2*RQit + β3*KLit + β4*GRit + β5*NIit + β6*MSit + β7*HOR_SPjt
+ β9*EX_DUMit + β10*IM_DUMit + β11*GRit_SPjt + εit + ε (1)
where i, j, and t are index firms, industries, and years, respectively; AWit is the average wage
of firm i at time t; SIZEit is the size of firm i at time t; RQit is the total sales of firm i at time t;
KLit is the capital intensity of firm i at time t; GRit is the gender ratio of firm i at time t; NIit is
the net income of firm i at time t; MSit is the market share of firm i at time t; HOR_SPjt
determines horizontal spillover within industry j at time t; EX_DUMit and IM_DUMit indicate
the export and import orientation of firm i at time t; εit is “unobserved effects” and captures
time-invariant firm features; and ε is a stochastic error term.
3.1.4.2 Dependent variable
The dependent variable is the average wage of each employee of an enterprise (Le &
Pomfret, 2011; Nguyen, 2015). The average wage represents the workers' prospective annual
income as well as the payment ability of each enterprise.
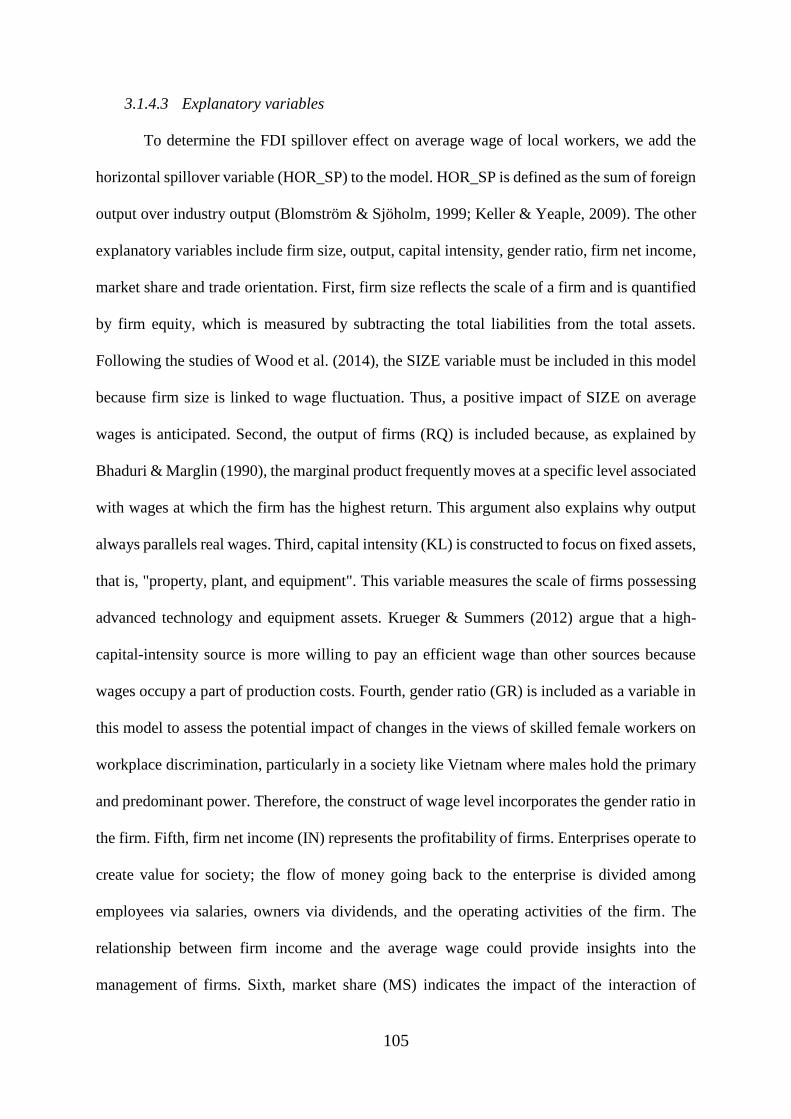
105
3.1.4.3 Explanatory variables
To determine the FDI spillover effect on average wage of local workers, we add the
horizontal spillover variable (HOR_SP) to the model. HOR_SP is defined as the sum of foreign
output over industry output (Blomström & Sjöholm, 1999; Keller & Yeaple, 2009). The other
explanatory variables include firm size, output, capital intensity, gender ratio, firm net income,
market share and trade orientation. First, firm size reflects the scale of a firm and is quantified
by firm equity, which is measured by subtracting the total liabilities from the total assets.
Following the studies of Wood et al. (2014), the SIZE variable must be included in this model
because firm size is linked to wage fluctuation. Thus, a positive impact of SIZE on average
wages is anticipated. Second, the output of firms (RQ) is included because, as explained by
Bhaduri & Marglin (1990), the marginal product frequently moves at a specific level associated
with wages at which the firm has the highest return. This argument also explains why output
always parallels real wages. Third, capital intensity (KL) is constructed to focus on fixed assets,
that is, "property, plant, and equipment". This variable measures the scale of firms possessing
advanced technology and equipment assets. Krueger & Summers (2012) argue that a high-
capital-intensity source is more willing to pay an efficient wage than other sources because
wages occupy a part of production costs. Fourth, gender ratio (GR) is included as a variable in
this model to assess the potential impact of changes in the views of skilled female workers on
workplace discrimination, particularly in a society like Vietnam where males hold the primary
and predominant power. Therefore, the construct of wage level incorporates the gender ratio in
the firm. Fifth, firm net income (IN) represents the profitability of firms. Enterprises operate to
create value for society; the flow of money going back to the enterprise is divided among
employees via salaries, owners via dividends, and the operating activities of the firm. The
relationship between firm income and the average wage could provide insights into the
management of firms. Sixth, market share (MS) indicates the impact of the interaction of
106
competitors and leaders in the industry on wages. Companies that have a significant market
share will have the advantage of dominating the market. In pioneering research, Nguyen (2015)
highlights the market share factor as well as its specific change (increase or decrease) as critical
factors affecting the average wage. Finally, there is another channel for foreign knowledge
spillover via trading activities (Huang & Zhang, 2017). For this reason, we also consider the
impact of the export or import orientation of the firm on the average wage.
3.1.4.4 The moderating effect of ownership type
The level of spillover may depend on the type of ownership (Wang & Wu, 2016). MNEs
tend to transfer technology and knowledge to partially-owned affiliates to enhance efficiency
and product quality. In a joint venture, domestic shareholders also facilitate spillovers. For
instance, local employees may be in charge of key activities or have access to expertise or
special techniques, which may lead to knowledge leakage if these employees leave the
company (Iršová & Havránek, 2013; Javorcik, 2004b; Javorcik & Spatareanu, 2008).
In Vietnam, there are four main types of ownership: SOEs, private firms, joint-stock
companies, and foreign direct investment (FDI) firms (see Appendix 5). Each form of
ownership has distinct management styles that impact the average wage and the relationship of
the average wage with other factors. SOEs operate in a governmental-supportive environment,
whereas private firms and joint-stock companies are managed in contrasting ways determined
by the benefits to managers and owners. Following Nguyen & Ramstetter (2017), the presence
of foreign firms is closely related to the average wage. Differences in qualifications and the
ability to absorb knowledge demanded by foreign employers explain the wage imbalance
between mainly foreign and domestic enterprises (Friedman, 2004).
Table 3-2: Summary of variables according to ownership type
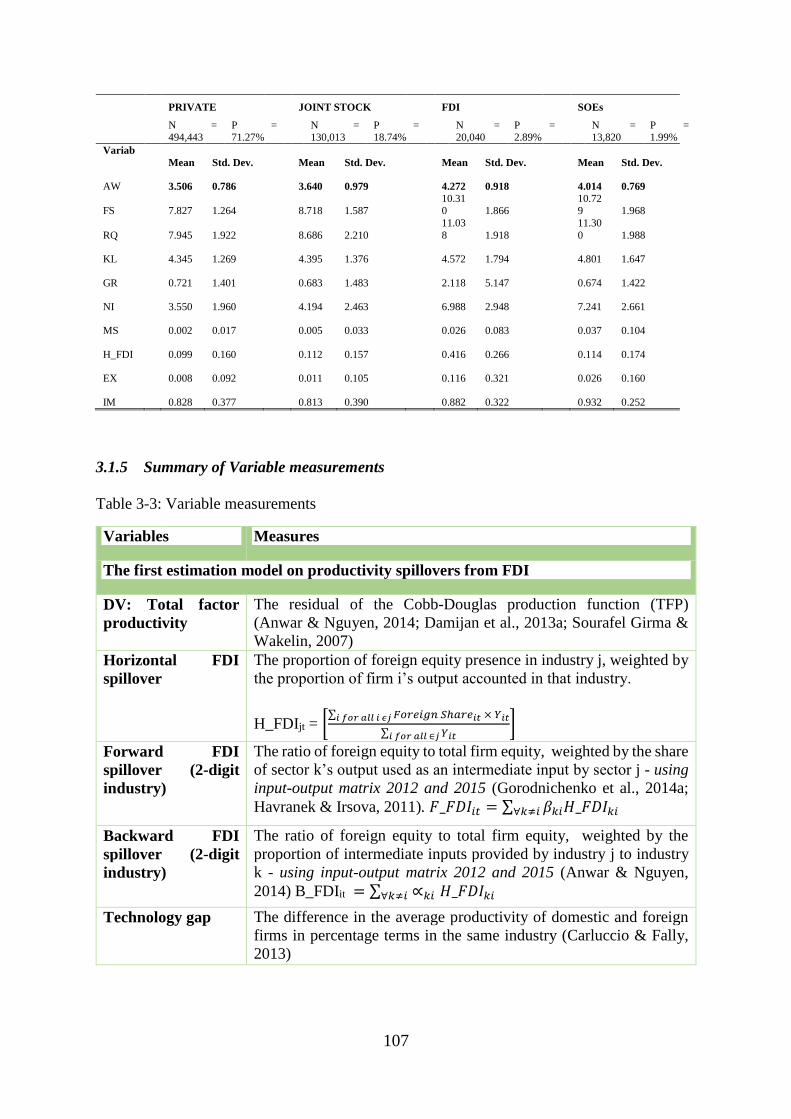
107
PRIVATE
JOINT STOCK
FDI
SOEs
N = 494,443
P = 71.27%
N = 130,013
P = 18.74%
N = 20,040
P = 2.89%
N = 13,820
P = 1.99%
Variab
le Mean Std. Dev. Mean Std. Dev. Mean Std. Dev. Mean Std. Dev.
AW
3.506 0.786
3.640 0.979
4.272 0.918
4.014 0.769
FS
7.827 1.264
8.718 1.587 10.31
0 1.866 10.72
9 1.968
RQ
7.945 1.922
8.686 2.210 11.03
8 1.918 11.30
0 1.988
KL
4.345 1.269
4.395 1.376
4.572 1.794
4.801 1.647
GR
0.721 1.401
0.683 1.483
2.118 5.147
0.674 1.422
NI
3.550 1.960
4.194 2.463
6.988 2.948
7.241 2.661
MS
0.002 0.017
0.005 0.033
0.026 0.083
0.037 0.104
H_FDI
0.099 0.160
0.112 0.157
0.416 0.266
0.114 0.174
EX
0.008 0.092
0.011 0.105
0.116 0.321
0.026 0.160
IM
0.828 0.377
0.813 0.390
0.882 0.322
0.932 0.252
3.1.5 Summary of Variable measurements
Table 3-3: Variable measurements
Variables Measures
The first estimation model on productivity spillovers from FDI
DV: Total factor
productivity
The residual of the Cobb-Douglas production function (TFP)
(Anwar & Nguyen, 2014; Damijan et al., 2013a; Sourafel Girma &
Wakelin, 2007)
Horizontal FDI
spillover
The proportion of foreign equity presence in industry j, weighted by
the proportion of firm i’s output accounted in that industry.
H_FDIjt = [∑ 𝐹𝑜𝑟𝑒𝑖𝑔𝑛 𝑆ℎ𝑎𝑟𝑒𝑖𝑡 × 𝑌𝑖𝑡𝑖 𝑓𝑜𝑟 𝑎𝑙𝑙 𝑖 𝜖𝑗
∑ 𝑌𝑖𝑡𝑖 𝑓𝑜𝑟 𝑎𝑙𝑙 ∈𝑗]
Forward FDI
spillover (2-digit
industry)
The ratio of foreign equity to total firm equity, weighted by the share
of sector k’s output used as an intermediate input by sector j - using
input-output matrix 2012 and 2015 (Gorodnichenko et al., 2014a;
Havranek & Irsova, 2011). 𝐹_𝐹𝐷𝐼𝑖𝑡 = ∑ 𝛽𝑘𝑖𝐻_𝐹𝐷𝐼𝑘𝑖∀𝑘≠𝑖
Backward FDI
spillover (2-digit
industry)
The ratio of foreign equity to total firm equity, weighted by the
proportion of intermediate inputs provided by industry j to industry
k - using input-output matrix 2012 and 2015 (Anwar & Nguyen,
2014) B_FDIit = ∑ ∝𝑘𝑖 𝐻_𝐹𝐷𝐼𝑘𝑖∀𝑘≠𝑖
Technology gap The difference in the average productivity of domestic and foreign
firms in percentage terms in the same industry (Carluccio & Fally,
2013)
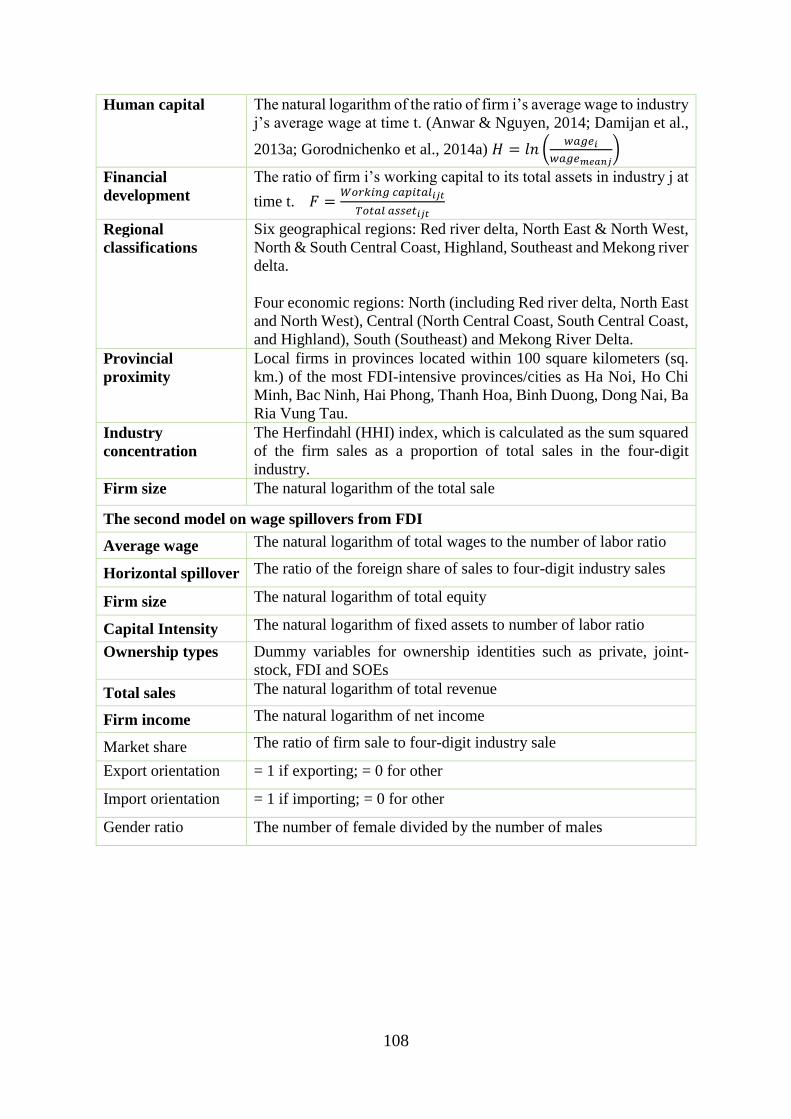
108
Human capital The natural logarithm of the ratio of firm i’s average wage to industry
j’s average wage at time t. (Anwar & Nguyen, 2014; Damijan et al.,
2013a; Gorodnichenko et al., 2014a) 𝐻 = 𝑙𝑛 (𝑤𝑎𝑔𝑒𝑖
𝑤𝑎𝑔𝑒𝑚𝑒𝑎𝑛𝑗)
Financial
development
The ratio of firm i’s working capital to its total assets in industry j at
time t. 𝐹 =𝑊𝑜𝑟𝑘𝑖𝑛𝑔 𝑐𝑎𝑝𝑖𝑡𝑎𝑙𝑖𝑗𝑡
𝑇𝑜𝑡𝑎𝑙 𝑎𝑠𝑠𝑒𝑡𝑖𝑗𝑡
Regional
classifications
Six geographical regions: Red river delta, North East & North West,
North & South Central Coast, Highland, Southeast and Mekong river
delta.
Four economic regions: North (including Red river delta, North East
and North West), Central (North Central Coast, South Central Coast,
and Highland), South (Southeast) and Mekong River Delta.
Provincial
proximity
Local firms in provinces located within 100 square kilometers (sq.
km.) of the most FDI-intensive provinces/cities as Ha Noi, Ho Chi
Minh, Bac Ninh, Hai Phong, Thanh Hoa, Binh Duong, Dong Nai, Ba
Ria Vung Tau.
Industry
concentration
The Herfindahl (HHI) index, which is calculated as the sum squared
of the firm sales as a proportion of total sales in the four-digit
industry.
Firm size The natural logarithm of the total sale
The second model on wage spillovers from FDI
Average wage The natural logarithm of total wages to the number of labor ratio
Horizontal spillover The ratio of the foreign share of sales to four-digit industry sales
Firm size The natural logarithm of total equity
Capital Intensity The natural logarithm of fixed assets to number of labor ratio
Ownership types Dummy variables for ownership identities such as private, joint-
stock, FDI and SOEs
Total sales The natural logarithm of total revenue
Firm income The natural logarithm of net income
Market share The ratio of firm sale to four-digit industry sale
Export orientation = 1 if exporting; = 0 for other
Import orientation = 1 if importing; = 0 for other
Gender ratio The number of female divided by the number of males
109
3.2 Data
3.2.1 The use of panel data
Recent meta-analyses on FDI spillovers have figured out the lack of firm-level panel
analyses in existing researches to better examine and provide more accurate evidence for the
presence of FDI externalities (Jacobs et al., 2017; Rojec & Knell, 2017). The use of panel data
is recommended for estimating FDI spillovers as the most appropriate approach because of its
superior characteristics and the unexpected overstatement of cross-sectional analysis (Rojec &
Knell, 2017). Panel data is a combination of cross-data and time-series data. The combination
of two types of data has many advantages, especially when the author would like to observe
and analyze the fluctuations of the target groups after the events or overtime as well as analyze
the differences between the study groups (Stoker, Berndt, Ellerman, & Schennach, 2005). In
this study, the author attempts to fill this gap of modeling methods and estimation procedures
by using the secondary panel data at the enterprise level for the period from 2007 to 2015
surveyed by GSO.
It is admitted that panel data has several advantages in comparison with cross-sectional
data or time-series data (Holtz-Eakin, Newey, & Rosen, 2006; Rojec & Knell, 2017). First,
because panel data relates to indicators for individuals, businesses, states, countries, etc. over
time, there is certainly heterogeneity in these indicators' units. It is worth to note that estimation
techniques based on panel data can account for the heterogeneity by including individual-
specific variables. This characteristic is quite valuable in this dissertation. Second, by
combining the time series of cross-sectional observations, panel data contains more useful
information and has more variability, less multicollinearity between variables, more degrees of
freedom, thereby increasing estimation efficiency. Third, by studying repeated observations of
cross-sectional units, panel data is more suitable for studying the dynamics of time-varying
variables. Thus, the effects of FDI spillovers are better studied by using panel data. Fourth,
110
panel data can better detect and measure impacts that cannot be observed in pure time-series
or cross-sectional data. Fifth, panel data makes it possible to study more complex behavior
patterns, for example, the technological changes.
Besides simple pooled OLS, the most outstanding techniques for estimating panel data
include the fixed effects model (FEM), the random-effects model (REM) and the Generalized
Method of Moments (GMM) approaches. In FEM, the Y-intercept in the regression model is
allowed to differ among individuals by recognizing the fact that each individual unit may have
some special characteristics of its own. To take into account the different Y-intercepts, dummy
variables can be used. FEM is suitable in situations that Y-intercepts across individuals can
correlate with one or more independent variables. An alternative model for FEM is REM. In
REM, it is assumed that the Y-intercept of an individual is randomly extracted from a larger
population, with a constant mean. After that, the individual's Y-intercept is shown as a
deviation from this constant mean. REM is appropriate in situations that the (random) Y-
intercept of each individual is not correlated with independent variables. The selection of FEM
or REM is determined by the Hausman test.
However, an inaccurate estimation may incur as a result of inappropriate estimation
model, endogenous problem or omission of important variables. In this case, generalized
method of moments (GMM) approach could help. GMM is a general method of many popular
estimation methods such as OLS, GLS, MLE, etc. To estimate the coefficient vector β, the
GMM method will use a set of instrument variables (also known as Moment conditions) and
the number of instrument variables must not be less than the number of variables in the model.
A variable selected as an instrumental variable is that it is not correlated with the residuals.
Even when violating endogenous assumptions, the GMM method still provides stable and
reliable estimates as a result of standardized and efficient distribution.
111
Therefore, in this study, the hypotheses are tested by FEM and REM, then checked the
robustness of the model estimation by using the GMM approach. The concern of unbalanced
panel data in this thesis may not be a problem because the estimation software - STATA
(version 14.0) can well handle both balanced and unbalanced panel data. Besides, the syntax
"xtreg" with "fe" or "re" specification and syntax "xtabond2" are recommended in STATA
instructions to deal with a large N, small T panel dataset.
3.2.2 Data description
The paper uses the latest unbalanced panel data of firm-level surveys in Vietnam from
2007 to 2015. The dataset surveyed annually by General Statistics Office (GSO) includes the
useful financial and internal indicators at firm-level such as firm's general information,
ownership type, capital structure, balance sheet, income statement, etc... for all industries. This
secondary data is quite powerful and used popularly for most recent studies in Vietnam related
to FDI and firm productivity/ performance (Anwar & Nguyen, 2014; Anwar & Phi, 2011; Le
& Pomfret, 2011). Firstly, the firms operating in manufacturing industries at two-digit and four-
digit industry codes are filtered from the whole population. Then, the duplicates and outliers
are removed from the data. The remaining observations in kind of un-balanced panel data are
used for further estimation. Besides, to calculate the vertically backward and vertically forward
spillover, the study uses the input-output matrices in 2012 and 2015 collected by GSO to know
the flows of input and output within the two-digit industry. Because the input-output matrix is
surveyed every three years by GSO, it is impossible to collect input-output matrices for the
whole period 2011-2015 for better matching. However, as discussed by (Lenaerts &
Merlevede, 2016), aggregate input-output matrix at industry level at a certain time are often
used to reflect vertical linkages between firms for the not-far-away period due to data
unavailability.
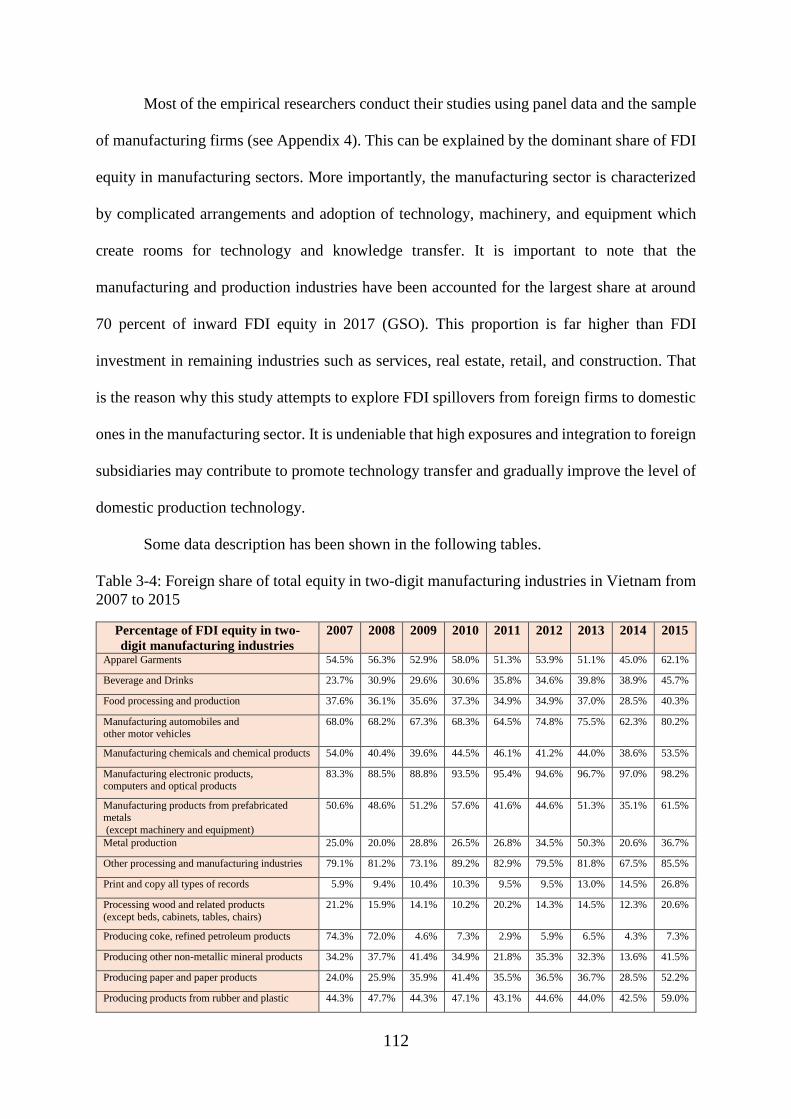
112
Most of the empirical researchers conduct their studies using panel data and the sample
of manufacturing firms (see Appendix 4). This can be explained by the dominant share of FDI
equity in manufacturing sectors. More importantly, the manufacturing sector is characterized
by complicated arrangements and adoption of technology, machinery, and equipment which
create rooms for technology and knowledge transfer. It is important to note that the
manufacturing and production industries have been accounted for the largest share at around
70 percent of inward FDI equity in 2017 (GSO). This proportion is far higher than FDI
investment in remaining industries such as services, real estate, retail, and construction. That
is the reason why this study attempts to explore FDI spillovers from foreign firms to domestic
ones in the manufacturing sector. It is undeniable that high exposures and integration to foreign
subsidiaries may contribute to promote technology transfer and gradually improve the level of
domestic production technology.
Some data description has been shown in the following tables.
Table 3-4: Foreign share of total equity in two-digit manufacturing industries in Vietnam from
2007 to 2015
Percentage of FDI equity in two-
digit manufacturing industries
2007 2008 2009 2010 2011 2012 2013 2014 2015
Apparel Garments 54.5% 56.3% 52.9% 58.0% 51.3% 53.9% 51.1% 45.0% 62.1%
Beverage and Drinks 23.7% 30.9% 29.6% 30.6% 35.8% 34.6% 39.8% 38.9% 45.7%
Food processing and production 37.6% 36.1% 35.6% 37.3% 34.9% 34.9% 37.0% 28.5% 40.3%
Manufacturing automobiles and other motor vehicles
68.0% 68.2% 67.3% 68.3% 64.5% 74.8% 75.5% 62.3% 80.2%
Manufacturing chemicals and chemical products 54.0% 40.4% 39.6% 44.5% 46.1% 41.2% 44.0% 38.6% 53.5%
Manufacturing electronic products, computers and optical products
83.3% 88.5% 88.8% 93.5% 95.4% 94.6% 96.7% 97.0% 98.2%
Manufacturing products from prefabricated metals
(except machinery and equipment)
50.6% 48.6% 51.2% 57.6% 41.6% 44.6% 51.3% 35.1% 61.5%
Metal production 25.0% 20.0% 28.8% 26.5% 26.8% 34.5% 50.3% 20.6% 36.7%
Other processing and manufacturing industries 79.1% 81.2% 73.1% 89.2% 82.9% 79.5% 81.8% 67.5% 85.5%
Print and copy all types of records 5.9% 9.4% 10.4% 10.3% 9.5% 9.5% 13.0% 14.5% 26.8%
Processing wood and related products
(except beds, cabinets, tables, chairs)
21.2% 15.9% 14.1% 10.2% 20.2% 14.3% 14.5% 12.3% 20.6%
Producing coke, refined petroleum products 74.3% 72.0% 4.6% 7.3% 2.9% 5.9% 6.5% 4.3% 7.3%
Producing other non-metallic mineral products 34.2% 37.7% 41.4% 34.9% 21.8% 35.3% 32.3% 13.6% 41.5%
Producing paper and paper products 24.0% 25.9% 35.9% 41.4% 35.5% 36.5% 36.7% 28.5% 52.2%
Producing products from rubber and plastic 44.3% 47.7% 44.3% 47.1% 43.1% 44.6% 44.0% 42.5% 59.0%
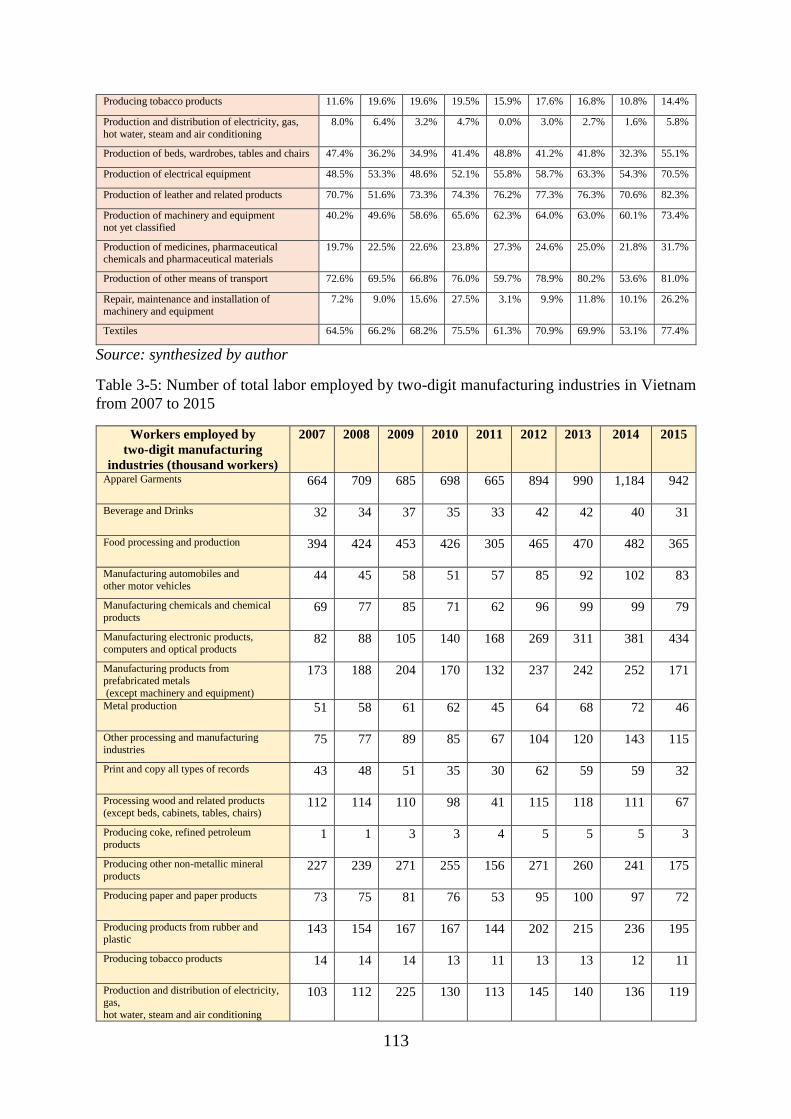
113
Producing tobacco products 11.6% 19.6% 19.6% 19.5% 15.9% 17.6% 16.8% 10.8% 14.4%
Production and distribution of electricity, gas,
hot water, steam and air conditioning
8.0% 6.4% 3.2% 4.7% 0.0% 3.0% 2.7% 1.6% 5.8%
Production of beds, wardrobes, tables and chairs 47.4% 36.2% 34.9% 41.4% 48.8% 41.2% 41.8% 32.3% 55.1%
Production of electrical equipment 48.5% 53.3% 48.6% 52.1% 55.8% 58.7% 63.3% 54.3% 70.5%
Production of leather and related products 70.7% 51.6% 73.3% 74.3% 76.2% 77.3% 76.3% 70.6% 82.3%
Production of machinery and equipment not yet classified
40.2% 49.6% 58.6% 65.6% 62.3% 64.0% 63.0% 60.1% 73.4%
Production of medicines, pharmaceutical chemicals and pharmaceutical materials
19.7% 22.5% 22.6% 23.8% 27.3% 24.6% 25.0% 21.8% 31.7%
Production of other means of transport 72.6% 69.5% 66.8% 76.0% 59.7% 78.9% 80.2% 53.6% 81.0%
Repair, maintenance and installation of machinery and equipment
7.2% 9.0% 15.6% 27.5% 3.1% 9.9% 11.8% 10.1% 26.2%
Textiles 64.5% 66.2% 68.2% 75.5% 61.3% 70.9% 69.9% 53.1% 77.4%
Source: synthesized by author
Table 3-5: Number of total labor employed by two-digit manufacturing industries in Vietnam
from 2007 to 2015
Workers employed by
two-digit manufacturing
industries (thousand workers)
2007 2008 2009 2010 2011 2012 2013 2014 2015
Apparel Garments 664 709 685 698 665 894 990 1,184 942
Beverage and Drinks 32 34 37 35 33 42 42 40 31
Food processing and production 394 424 453 426 305 465 470 482 365
Manufacturing automobiles and
other motor vehicles 44 45 58 51 57 85 92 102 83
Manufacturing chemicals and chemical
products 69 77 85 71 62 96 99 99 79
Manufacturing electronic products,
computers and optical products 82 88 105 140 168 269 311 381 434
Manufacturing products from
prefabricated metals
(except machinery and equipment)
173 188 204 170 132 237 242 252 171
Metal production 51 58 61 62 45 64 68 72 46
Other processing and manufacturing
industries 75 77 89 85 67 104 120 143 115
Print and copy all types of records 43 48 51 35 30 62 59 59 32
Processing wood and related products
(except beds, cabinets, tables, chairs) 112 114 110 98 41 115 118 111 67
Producing coke, refined petroleum
products 1 1 3 3 4 5 5 5 3
Producing other non-metallic mineral
products 227 239 271 255 156 271 260 241 175
Producing paper and paper products 73 75 81 76 53 95 100 97 72
Producing products from rubber and plastic
143 154 167 167 144 202 215 236 195
Producing tobacco products 14 14 14 13 11 13 13 12 11
Production and distribution of electricity, gas,
hot water, steam and air conditioning
103 112 225 130 113 145 140 136 119

114
Production of beds, wardrobes, tables and
chairs 270 261 249 241 156 264 276 304 278
Production of electrical equipment 118 118 123 126 105 139 143 153 143
Production of leather and related products 576 601 561 629 557 773 858 1,001 880
Production of machinery and equipment
not yet classified 46 48 50 46 43 57 60 62 54
Production of medicines, pharmaceutical chemicals and pharmaceutical materials
30 33 35 33 29 39 41 44 38
Production of other means of transport 116 116 120 96 76 90 89 96 80
Repair, maintenance and installation of machinery and equipment
21 22 24 15 14 29 31 31 22
Textiles 163 152 171 153 108 173 190 204 174
Table 3-6: Capital to labor ratio across two-digit manufacturing industries in Vietnam from
2007 to 2015
Capital to labor ratio (Mil VND) 2007 2008 2009 2010 2011 2012 2013 2014 2015
Apparel Garments 28 34 37 42 119 50 55 100 62
Beverage and Drinks 666 544 651 744 1,820 942 1,043 1,392 1,688
Food processing and production 157 178 209 258 873 359 391 808 494
Manufacturing automobiles and other motor vehicles
324 395 356 469 1,091 404 430 670 546
Manufacturing chemicals and chemical products 251 343 428 591 1,561 678 753 1,433 970
Manufacturing electronic products, computers and optical products
213 223 243 230 798 354 488 817 628
Manufacturing products from prefabricated metals (except machinery and equipment)
139 180 214 267 1,017 364 345 737 440
Metal production 341 370 605 631 2,042 687 907 1,832 962
Other processing and manufacturing industries 73 84 121 142 364 201 202 267 223
Print and copy all types of records 169 176 195 255 488 230 252 353 376
Processing wood and related products
(except beds, cabinets, tables, chairs)
67 74 108 198 591 220 231 518 281
Producing coke, refined petroleum products 593 764 10,240 6,726 22,426 5,630 6,963 9,945 10,018
Producing other non-metallic mineral products 199 201 314 278 1,314 360 424 714 568
Producing paper and paper products 161 199 233 261 899 358 372 703 531
Producing products from rubber and plastic 153 186 231 247 715 319 355 572 422
Producing tobacco products 402 483 552 577 1,529 780 900 1,845 1,320
Production and distribution of electricity, gas,
hot water, steam and air conditioning
755 830 1,011 1,377 2,794 2,085 2,655 3,115 1,691
Production of beds, wardrobes, tables and chairs 55 89 105 108 323 126 136 349 136
Production of electrical equipment 195 208 254 260 787 298 324 601 357
Production of leather and related products 29 49 42 43 119 50 52 95 63
Production of machinery and equipment
not yet classified
222 271 300 370 836 413 454 795 549
Production of medicines, pharmaceutical
chemicals and pharmaceutical materials
245 266 307 363 838 454 479 803 694
Production of other means of transport 211 240 257 403 1,374 584 711 1,182 836
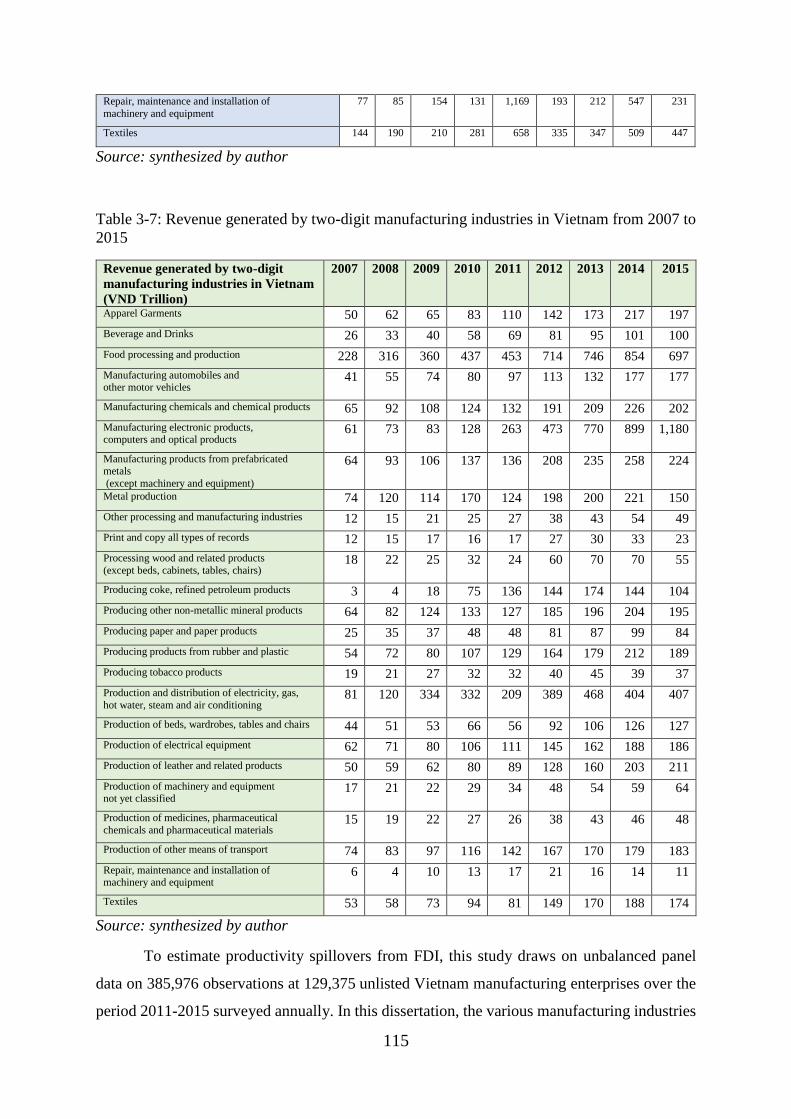
115
Repair, maintenance and installation of
machinery and equipment
77 85 154 131 1,169 193 212 547 231
Textiles 144 190 210 281 658 335 347 509 447
Source: synthesized by author
Table 3-7: Revenue generated by two-digit manufacturing industries in Vietnam from 2007 to
2015
Revenue generated by two-digit
manufacturing industries in Vietnam
(VND Trillion)
2007 2008 2009 2010 2011 2012 2013 2014 2015
Apparel Garments 50 62 65 83 110 142 173 217 197
Beverage and Drinks 26 33 40 58 69 81 95 101 100
Food processing and production 228 316 360 437 453 714 746 854 697
Manufacturing automobiles and other motor vehicles
41 55 74 80 97 113 132 177 177
Manufacturing chemicals and chemical products 65 92 108 124 132 191 209 226 202
Manufacturing electronic products, computers and optical products
61 73 83 128 263 473 770 899 1,180
Manufacturing products from prefabricated metals
(except machinery and equipment)
64 93 106 137 136 208 235 258 224
Metal production 74 120 114 170 124 198 200 221 150
Other processing and manufacturing industries 12 15 21 25 27 38 43 54 49
Print and copy all types of records 12 15 17 16 17 27 30 33 23
Processing wood and related products
(except beds, cabinets, tables, chairs) 18 22 25 32 24 60 70 70 55
Producing coke, refined petroleum products 3 4 18 75 136 144 174 144 104
Producing other non-metallic mineral products 64 82 124 133 127 185 196 204 195
Producing paper and paper products 25 35 37 48 48 81 87 99 84
Producing products from rubber and plastic 54 72 80 107 129 164 179 212 189
Producing tobacco products 19 21 27 32 32 40 45 39 37
Production and distribution of electricity, gas,
hot water, steam and air conditioning 81 120 334 332 209 389 468 404 407
Production of beds, wardrobes, tables and chairs 44 51 53 66 56 92 106 126 127
Production of electrical equipment 62 71 80 106 111 145 162 188 186
Production of leather and related products 50 59 62 80 89 128 160 203 211
Production of machinery and equipment not yet classified
17 21 22 29 34 48 54 59 64
Production of medicines, pharmaceutical
chemicals and pharmaceutical materials 15 19 22 27 26 38 43 46 48
Production of other means of transport 74 83 97 116 142 167 170 179 183
Repair, maintenance and installation of machinery and equipment
6 4 10 13 17 21 16 14 11
Textiles 53 58 73 94 81 149 170 188 174
Source: synthesized by author
To estimate productivity spillovers from FDI, this study draws on unbalanced panel
data on 385,976 observations at 129,375 unlisted Vietnam manufacturing enterprises over the
period 2011-2015 surveyed annually. In this dissertation, the various manufacturing industries
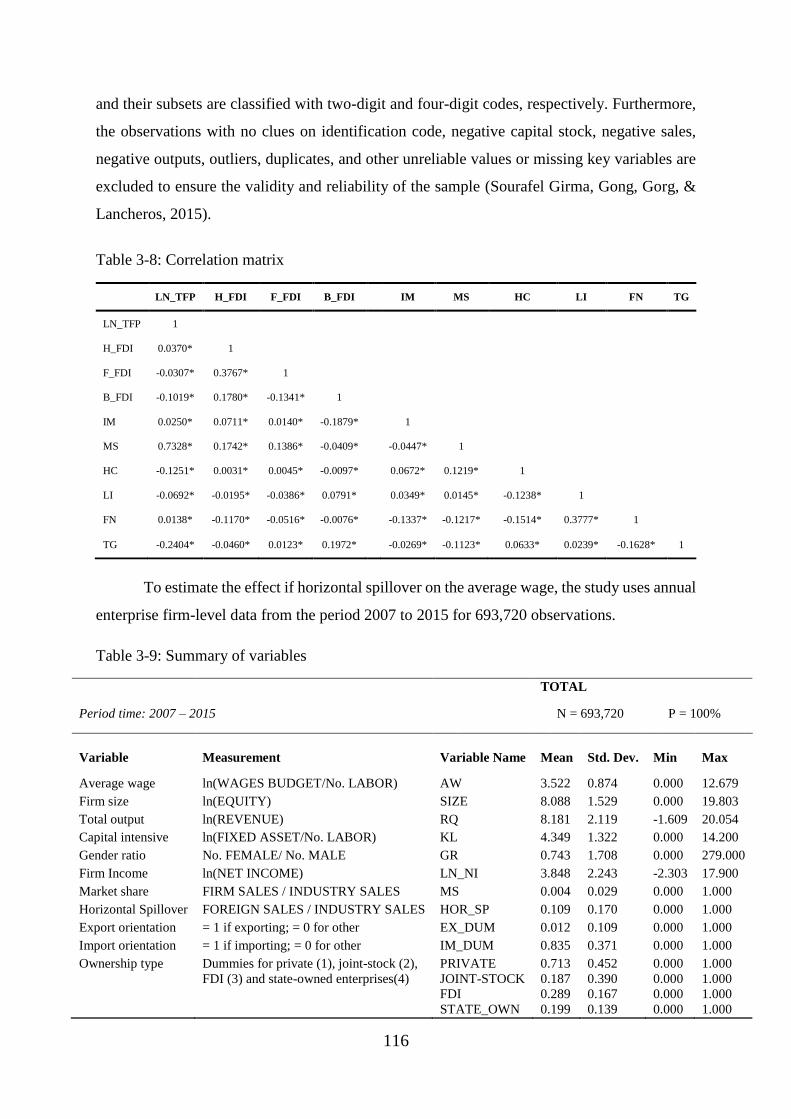
116
and their subsets are classified with two-digit and four-digit codes, respectively. Furthermore,
the observations with no clues on identification code, negative capital stock, negative sales,
negative outputs, outliers, duplicates, and other unreliable values or missing key variables are
excluded to ensure the validity and reliability of the sample (Sourafel Girma, Gong, Gorg, &
Lancheros, 2015).
Table 3-8: Correlation matrix
LN_TFP H_FDI F_FDI B_FDI
IM MS HC LI FN TG
LN_TFP 1
H_FDI 0.0370* 1
F_FDI -0.0307* 0.3767* 1
B_FDI -0.1019* 0.1780* -0.1341* 1
IM 0.0250* 0.0711* 0.0140* -0.1879*
1
MS 0.7328* 0.1742* 0.1386* -0.0409*
-0.0447* 1
HC -0.1251* 0.0031* 0.0045* -0.0097*
0.0672* 0.1219* 1
LI -0.0692* -0.0195* -0.0386* 0.0791*
0.0349* 0.0145* -0.1238* 1
FN 0.0138* -0.1170* -0.0516* -0.0076*
-0.1337* -0.1217* -0.1514* 0.3777* 1
TG -0.2404* -0.0460* 0.0123* 0.1972*
-0.0269* -0.1123* 0.0633* 0.0239* -0.1628* 1
To estimate the effect if horizontal spillover on the average wage, the study uses annual
enterprise firm-level data from the period 2007 to 2015 for 693,720 observations.
Table 3-9: Summary of variables
TOTAL
Period time: 2007 – 2015 N = 693,720 P = 100%
Variable Measurement Variable Name Mean Std. Dev. Min Max
Average wage ln(WAGES BUDGET/No. LABOR) AW 3.522 0.874 0.000 12.679
Firm size ln(EQUITY) SIZE 8.088 1.529 0.000 19.803
Total output ln(REVENUE) RQ 8.181 2.119 -1.609 20.054
Capital intensive ln(FIXED ASSET/No. LABOR) KL 4.349 1.322 0.000 14.200
Gender ratio No. FEMALE/ No. MALE GR 0.743 1.708 0.000 279.000
Firm Income ln(NET INCOME) LN_NI 3.848 2.243 -2.303 17.900
Market share FIRM SALES / INDUSTRY SALES MS 0.004 0.029 0.000 1.000
Horizontal Spillover FOREIGN SALES / INDUSTRY SALES HOR_SP 0.109 0.170 0.000 1.000
Export orientation = 1 if exporting; = 0 for other EX_DUM 0.012 0.109 0.000 1.000
Import orientation = 1 if importing; = 0 for other IM_DUM 0.835 0.371 0.000 1.000
Ownership type Dummies for private (1), joint-stock (2),
FDI (3) and state-owned enterprises(4)
PRIVATE
JOINT-STOCK
FDI
STATE_OWN
0.713
0.187
0.289
0.199
0.452
0.390
0.167
0.139
0.000
0.000
0.000
0.000
1.000
1.000
1.000
1.000
117
EMPIRICAL FINDINGS AND
DISCUSSIONS
By briefly reminding the research objectives and proposed hypotheses, this chapter
provides empirical findings and relevant discussions for two branches of this dissertation: (1)
the effect of inward FDI spillovers on domestic manufacturing firms’ productivity (on other
words, productivity spillovers from FDI) and (2) the effect of inward FDI spillovers on labor’s
average wage in the host economy (on other words, wage spillovers from FDI).
4.1 The effects of inward FDI spillovers on the productivity of Vietnamese
manufacturing firms
Although the government offers foreign investors special incentives, including tax
holidays, tariff reductions or exemptions, and subsidies for infrastructure, the empirical
evidence on productivity spillovers from foreign firms to domestic firms is still ambiguous.
Most studies on Vietnam focus on the direct effect of FDI on economic growth or technology
spillovers from FDI before 2010 and lack of evidence for both vertical and horizontal spillovers
from FDI (Anwar and Nguyen 2014; Anwar and Sun 2012; Le and Pomfret 2011; Thang,
Pham, and Barnes 2016). Thus, this part attempts to find evidence for the following research
objectives and hypotheses (as proposed in Chapter 3 – Empirical Literature Review) using a
large unbalanced panel of data on 332,887 Vietnamese manufacturing firms from 2011 to 2015:
First, the author investigates the effects of FDI spillovers through vertical and
horizontal channels to domestic firms’ productivity (Hypotheses H1, H2a, H2b); secondly
explore the moderating effects of absorptive capabilities in term of human capital, technology
gap and financial development on productivity spillovers from foreign firms to Vietnamese
manufacturing firms. (Hypotheses H3, H4a, H4b, H5); thirdly examine whether productivity
spillovers through vertical and horizontal channels are associated with regional effects
118
(hypothesis H6a, H6b) and finally examine whether local firms in provinces located within 100
square kilometers (sq. km.) of eight cities/ provinces with highest FDI concentration receive
greater FDI spillovers than those located outside 100 sq. km of these areas (hypothesis H7).
4.1.1 FDI spillover effect through vertical and horizontal channels on domestic
manufacturing firm productivity
The table below reveals the findings of productivity spillovers from FDI in Vietnam
from 2011 to 2015 using a large unbalanced panel data of 129,375 manufacturing firms
(385,976 observations). At this stage, the Hausman test rejects the null hypothesis that the
difference in coefficients is not systemic. Thus, it suggests a fixed-effects model should be a
more appropriate option. Further, the problem of heteroskedasticity and autocorrelation are
under control. It has been well illustrated in the table below that the coefficients for FDI
spillover variables are significantly associated with TFP in both fixed effect and random effect
model. In addition, the directions of these spillover indicators are consistent across models.
Concerning the random effect model, the findings are robust with less negative horizontal and
forward FDI spillovers and a larger magnitude of backward spillovers.
Concerning the fixed-effect model, the result indicates a significantly negative impact
of horizontal spillover from MNCs' presence in the recipient country to domestic firms' TFP
(β= -2.156***). It is worth to note that the adverse magnitude of horizontal spillover is quite
large and appears to overwhelm two remaining channels of spillovers. This interesting finding
is supported by the theoretical review of (Blomstrom & Kokko, 1998) and empirical evidences
by (Carluccio & Fally, 2013; Damijan et al., 2013b; Javorcik & Spatareanu, 2008) implying
the existence of dominant horizontal spillovers in challenging the survival of domestic firms
through more fierce competition and stricter intellectual protection. It undeniable that
Vietnamese manufacturing firms haven’t prepared themselves ready for the fighting against
FDI penetration. That is the reason why the opportunities for absorbing positive horizontal
119
spillovers through imitation, demonstration and worker mobility is still limited to some extent.
Thus, the first hypothesis (H1) referring to a negative impact of horizontal FDI spillover on
the domestic firm's productivity is supported.
Regarding backward spillovers, Vietnam witnessed a reverse trend that the greater the
effect of backward spillover is, the higher the productivity local firms can reach (β= 0.611***).
Despite strong evidence for dominant effects of positive backward spillovers, it can't offset the
negative outcome generated by horizontal spillovers. It is optimistic that the nature of
backward spillover allows local firms with a certain level of absorptive capacity to benefit from
the presence of foreign subsidiaries in the host market (Havranek & Irsova, 2011). When
MNCs enter into a host economy, their first attempt is to relieve the foreignness liability by
establishing their linkage relationship with local partners. Thus, they have many motivations
to transfer their knowledge and premium processes to local suppliers in the backward linkage
chain to control better their production (Hamida, 2013). On the other hand, local suppliers have
to learn and adapt to higher foreign requirements. This creates chances and rooms for upgrading
new technology and innovative process; as a result, improve the overall productivity (Javorcik
et al., 2018). Therefore, the hypothesis H2a implying positive backward spillover is supported.
Besides, forward FDI spillover is found as an unfavorable determinant as it negatively
affects domestic firms’ TFP growth (β= -1.085***). The finding is different from the common
perspective of positive externalities generated by forward FDI spillover. The previous studies
discuss that MNCs' presence may benefit local firms' productivity in the downstream sector by
less expensive and more accessible foreign inputs and premium supplementary services
(Blomstrom & Kokko, 1998; Javorcik & Spatareanu, 2011). However, the foreign sector may
implement its market penetration strategy aiming at increasing the dependencies on their
intermediate products and services and weakening the embedded industries in the domestic
host country (Newman et al., 2015; Thang et al., 2016). In this case, the finding fails to support
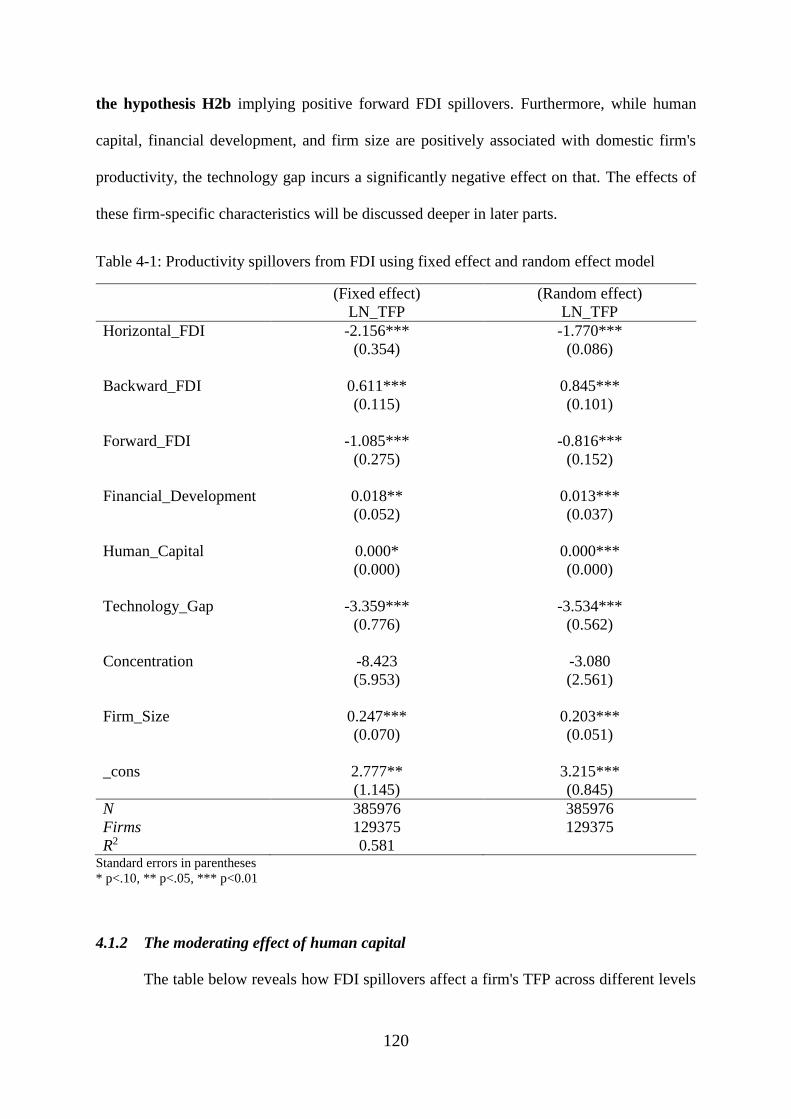
120
the hypothesis H2b implying positive forward FDI spillovers. Furthermore, while human
capital, financial development, and firm size are positively associated with domestic firm's
productivity, the technology gap incurs a significantly negative effect on that. The effects of
these firm-specific characteristics will be discussed deeper in later parts.
Table 4-1: Productivity spillovers from FDI using fixed effect and random effect model
(Fixed effect) (Random effect)
LN_TFP LN_TFP
Horizontal_FDI -2.156*** -1.770***
(0.354) (0.086)
Backward_FDI 0.611*** 0.845***
(0.115) (0.101)
Forward_FDI -1.085*** -0.816***
(0.275) (0.152)
Financial_Development 0.018** 0.013***
(0.052) (0.037)
Human_Capital 0.000* 0.000***
(0.000) (0.000)
Technology_Gap -3.359*** -3.534***
(0.776) (0.562)
Concentration -8.423 -3.080
(5.953) (2.561)
Firm_Size 0.247*** 0.203***
(0.070) (0.051)
_cons 2.777** 3.215***
(1.145) (0.845)
N 385976 385976
Firms 129375 129375
R2 0.581 Standard errors in parentheses
* p<.10, ** p<.05, *** p<0.01
4.1.2 The moderating effect of human capital
The table below reveals how FDI spillovers affect a firm's TFP across different levels
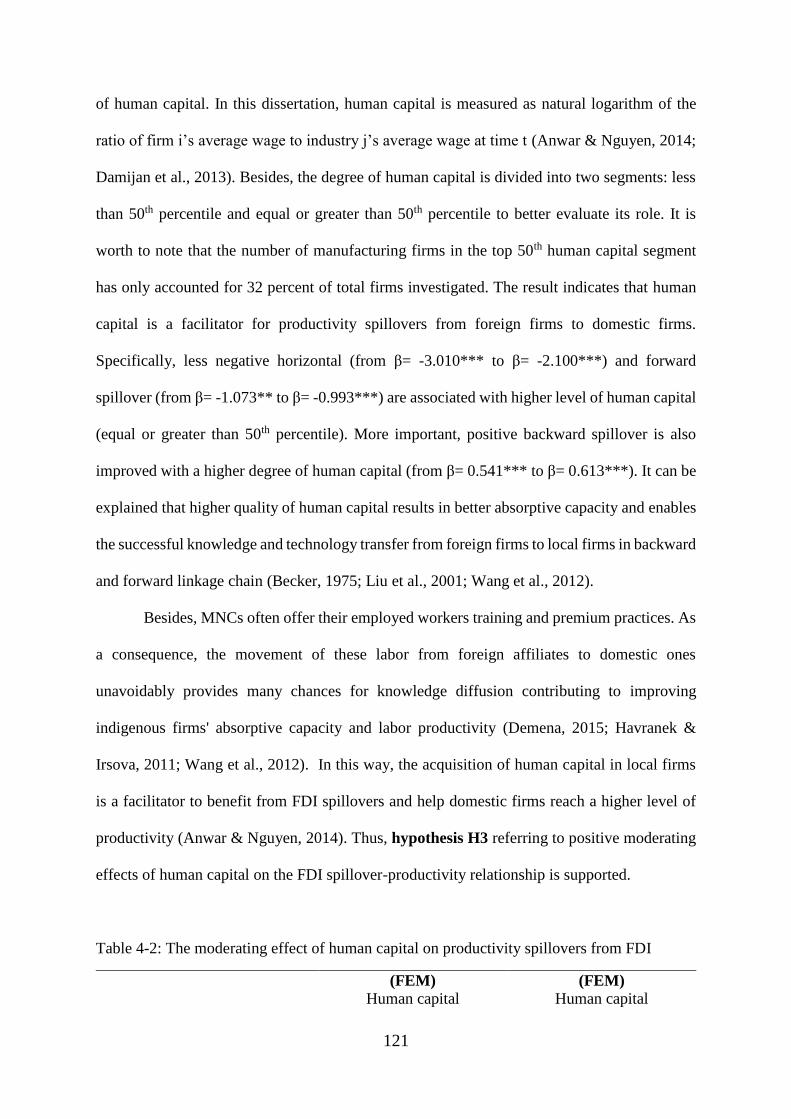
121
of human capital. In this dissertation, human capital is measured as natural logarithm of the
ratio of firm i’s average wage to industry j’s average wage at time t (Anwar & Nguyen, 2014;
Damijan et al., 2013). Besides, the degree of human capital is divided into two segments: less
than 50th percentile and equal or greater than 50th percentile to better evaluate its role. It is
worth to note that the number of manufacturing firms in the top 50th human capital segment
has only accounted for 32 percent of total firms investigated. The result indicates that human
capital is a facilitator for productivity spillovers from foreign firms to domestic firms.
Specifically, less negative horizontal (from β= -3.010*** to β= -2.100***) and forward
spillover (from β= -1.073** to β= -0.993***) are associated with higher level of human capital
(equal or greater than 50th percentile). More important, positive backward spillover is also
improved with a higher degree of human capital (from β= 0.541*** to β= 0.613***). It can be
explained that higher quality of human capital results in better absorptive capacity and enables
the successful knowledge and technology transfer from foreign firms to local firms in backward
and forward linkage chain (Becker, 1975; Liu et al., 2001; Wang et al., 2012).
Besides, MNCs often offer their employed workers training and premium practices. As
a consequence, the movement of these labor from foreign affiliates to domestic ones
unavoidably provides many chances for knowledge diffusion contributing to improving
indigenous firms' absorptive capacity and labor productivity (Demena, 2015; Havranek &
Irsova, 2011; Wang et al., 2012). In this way, the acquisition of human capital in local firms
is a facilitator to benefit from FDI spillovers and help domestic firms reach a higher level of
productivity (Anwar & Nguyen, 2014). Thus, hypothesis H3 referring to positive moderating
effects of human capital on the FDI spillover-productivity relationship is supported.
Table 4-2: The moderating effect of human capital on productivity spillovers from FDI
(FEM)
Human capital (FEM)
Human capital
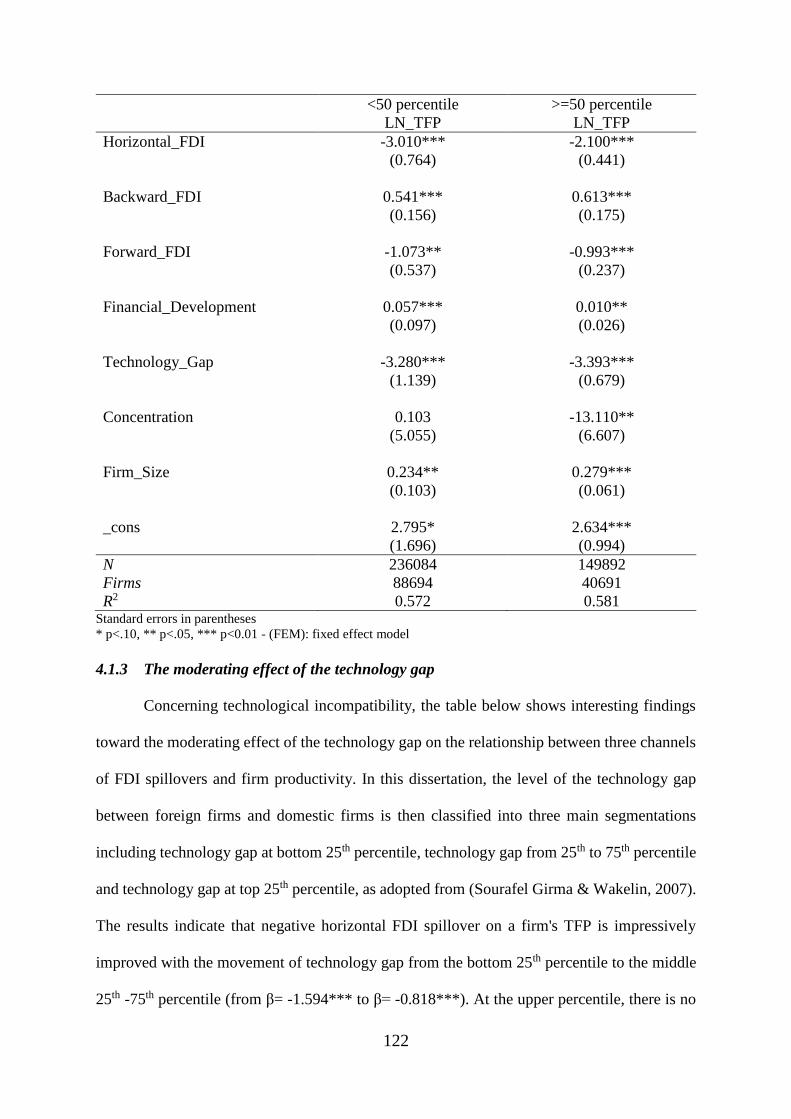
122
<50 percentile >=50 percentile
LN_TFP LN_TFP
Horizontal_FDI -3.010*** -2.100***
(0.764) (0.441)
Backward_FDI 0.541*** 0.613***
(0.156) (0.175)
Forward_FDI -1.073** -0.993***
(0.537) (0.237)
Financial_Development 0.057*** 0.010**
(0.097) (0.026)
Technology_Gap -3.280*** -3.393***
(1.139) (0.679)
Concentration 0.103 -13.110**
(5.055) (6.607)
Firm_Size 0.234** 0.279***
(0.103) (0.061)
_cons 2.795* 2.634***
(1.696) (0.994)
N 236084 149892
Firms 88694 40691
R2 0.572 0.581 Standard errors in parentheses
* p<.10, ** p<.05, *** p<0.01 - (FEM): fixed effect model
4.1.3 The moderating effect of the technology gap
Concerning technological incompatibility, the table below shows interesting findings
toward the moderating effect of the technology gap on the relationship between three channels
of FDI spillovers and firm productivity. In this dissertation, the level of the technology gap
between foreign firms and domestic firms is then classified into three main segmentations
including technology gap at bottom 25th percentile, technology gap from 25th to 75th percentile
and technology gap at top 25th percentile, as adopted from (Sourafel Girma & Wakelin, 2007).
The results indicate that negative horizontal FDI spillover on a firm's TFP is impressively
improved with the movement of technology gap from the bottom 25th percentile to the middle
25th -75th percentile (from β= -1.594*** to β= -0.818***). At the upper percentile, there is no
123
signal for the moderating effect of the technology gap. Productivity associated with forward
FDI spillovers also witnesses the similar trend (from β= -0.845*** at bottom 25th to β= -
0.244*** at the middle one, and insignificant coefficient at the top 25th).
On the other hand, the relationship between backward FDI spillover and firm
productivity is diminished when the technology gap turns from the bottom 25th segment to the
middle one. Besides, an insignificant backward spillover is also found at the top 25th percentile.
Although the technology gap provides more chances for local firms to upgrade their technology
to achieve aggressive productivity growth, its effects on productivity spillover appear to be a
little complicated. While the small gap generates less motivation for local firms to imitate, the
large gap prevents low-technological-frontier firms from reaching more advanced technology
(Sourafel Girma & Wakelin, 2007; Jacobs et al., 2017; Kounetas, 2015). Thus, many previous
studies appreciate the catch-up (middle) technology gap that is in favor of technology transfer
and matches the domestic firm's absorptive capacity. This contributes to explain the
improvement in horizontal and forward externalities in the middle 25th -75th gap. However, as
discussed above, local firms, especially firms in forward and backward linkage with foreign
subsidiaries have to prepare themselves ready for successful technology transfer and enhance
their absorptive capacity to benefit from FDI externalities (Dimelis *, 2005; Jordaan, 2013).
Therefore, the findings support hypothesis H4a and H4b in the case of horizontal and forward
FDI spillovers. Meanwhile, for backward FDI spillover, these hypotheses are partially
supported.
Table 4-3: The moderating effect of technology gap on productivity spillovers
(FEM) (FEM) (FEM)
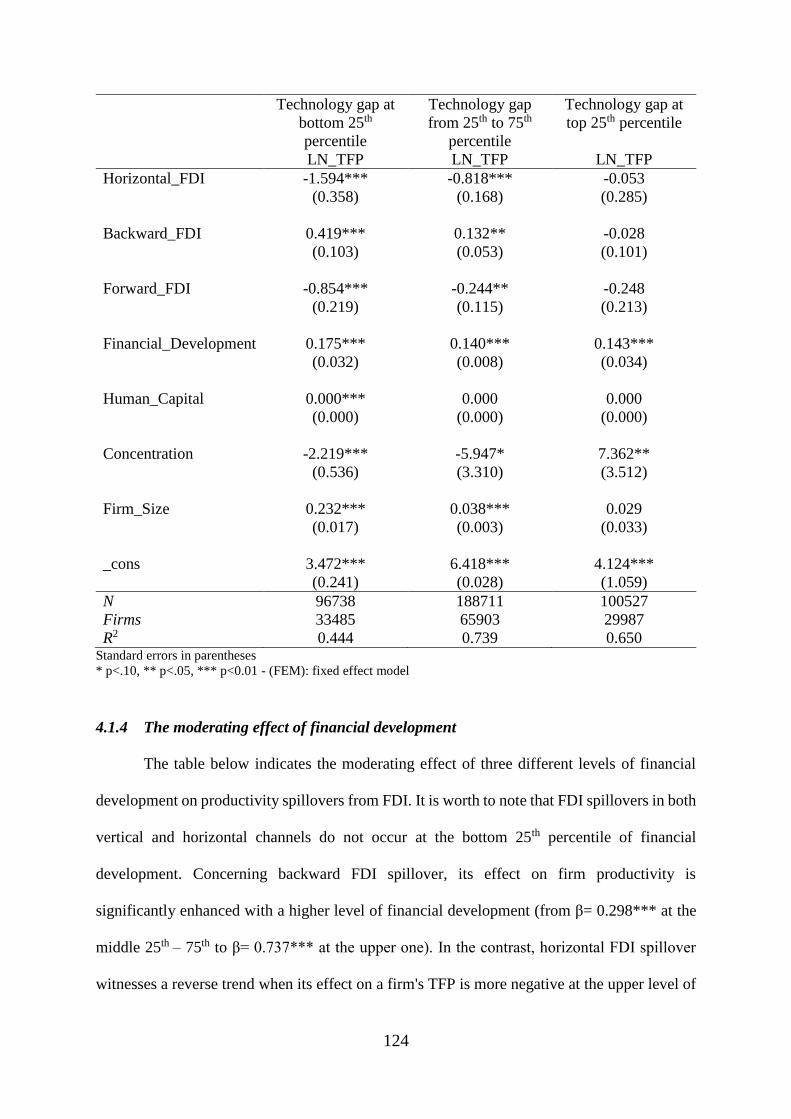
124
Technology gap at
bottom 25th
percentile
Technology gap
from 25th to 75th
percentile
Technology gap at
top 25th percentile
LN_TFP LN_TFP LN_TFP
Horizontal_FDI -1.594*** -0.818*** -0.053
(0.358) (0.168) (0.285)
Backward_FDI 0.419*** 0.132** -0.028
(0.103) (0.053) (0.101)
Forward_FDI -0.854*** -0.244** -0.248
(0.219) (0.115) (0.213)
Financial_Development 0.175*** 0.140*** 0.143***
(0.032) (0.008) (0.034)
Human_Capital 0.000*** 0.000 0.000
(0.000) (0.000) (0.000)
Concentration -2.219*** -5.947* 7.362**
(0.536) (3.310) (3.512)
Firm_Size 0.232*** 0.038*** 0.029
(0.017) (0.003) (0.033)
_cons 3.472*** 6.418*** 4.124***
(0.241) (0.028) (1.059)
N 96738 188711 100527
Firms 33485 65903 29987
R2 0.444 0.739 0.650 Standard errors in parentheses
* p<.10, ** p<.05, *** p<0.01 - (FEM): fixed effect model
4.1.4 The moderating effect of financial development
The table below indicates the moderating effect of three different levels of financial
development on productivity spillovers from FDI. It is worth to note that FDI spillovers in both
vertical and horizontal channels do not occur at the bottom 25th percentile of financial
development. Concerning backward FDI spillover, its effect on firm productivity is
significantly enhanced with a higher level of financial development (from β= 0.298*** at the
middle 25th – 75th to β= 0.737*** at the upper one). In the contrast, horizontal FDI spillover
witnesses a reverse trend when its effect on a firm's TFP is more negative at the upper level of
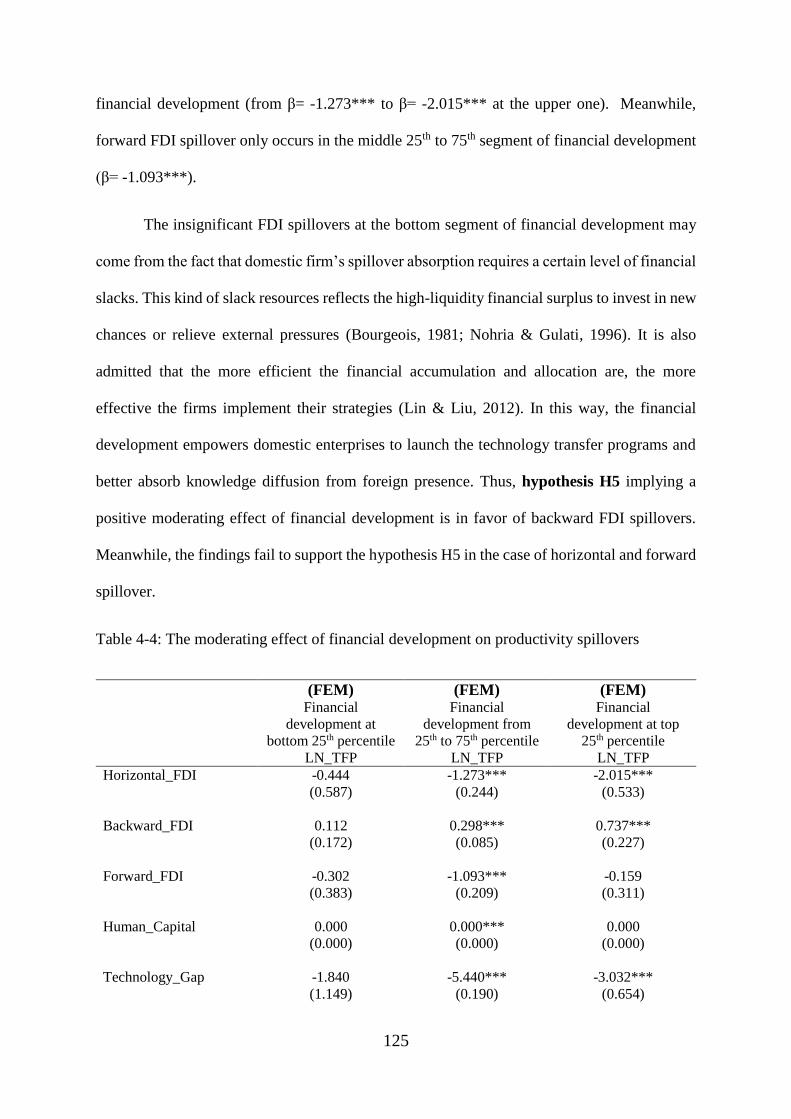
125
financial development (from β= -1.273*** to β= -2.015*** at the upper one). Meanwhile,
forward FDI spillover only occurs in the middle 25th to 75th segment of financial development
(β= -1.093***).
The insignificant FDI spillovers at the bottom segment of financial development may
come from the fact that domestic firm’s spillover absorption requires a certain level of financial
slacks. This kind of slack resources reflects the high-liquidity financial surplus to invest in new
chances or relieve external pressures (Bourgeois, 1981; Nohria & Gulati, 1996). It is also
admitted that the more efficient the financial accumulation and allocation are, the more
effective the firms implement their strategies (Lin & Liu, 2012). In this way, the financial
development empowers domestic enterprises to launch the technology transfer programs and
better absorb knowledge diffusion from foreign presence. Thus, hypothesis H5 implying a
positive moderating effect of financial development is in favor of backward FDI spillovers.
Meanwhile, the findings fail to support the hypothesis H5 in the case of horizontal and forward
spillover.
Table 4-4: The moderating effect of financial development on productivity spillovers
(FEM) Financial
development at
bottom 25th percentile
(FEM) Financial
development from
25th to 75th percentile
(FEM) Financial
development at top
25th percentile
LN_TFP LN_TFP LN_TFP
Horizontal_FDI -0.444 -1.273*** -2.015***
(0.587) (0.244) (0.533)
Backward_FDI 0.112 0.298*** 0.737***
(0.172) (0.085) (0.227)
Forward_FDI -0.302 -1.093*** -0.159
(0.383) (0.209) (0.311)
Human_Capital 0.000 0.000*** 0.000
(0.000) (0.000) (0.000)
Technology_Gap -1.840 -5.440*** -3.032***
(1.149) (0.190) (0.654)
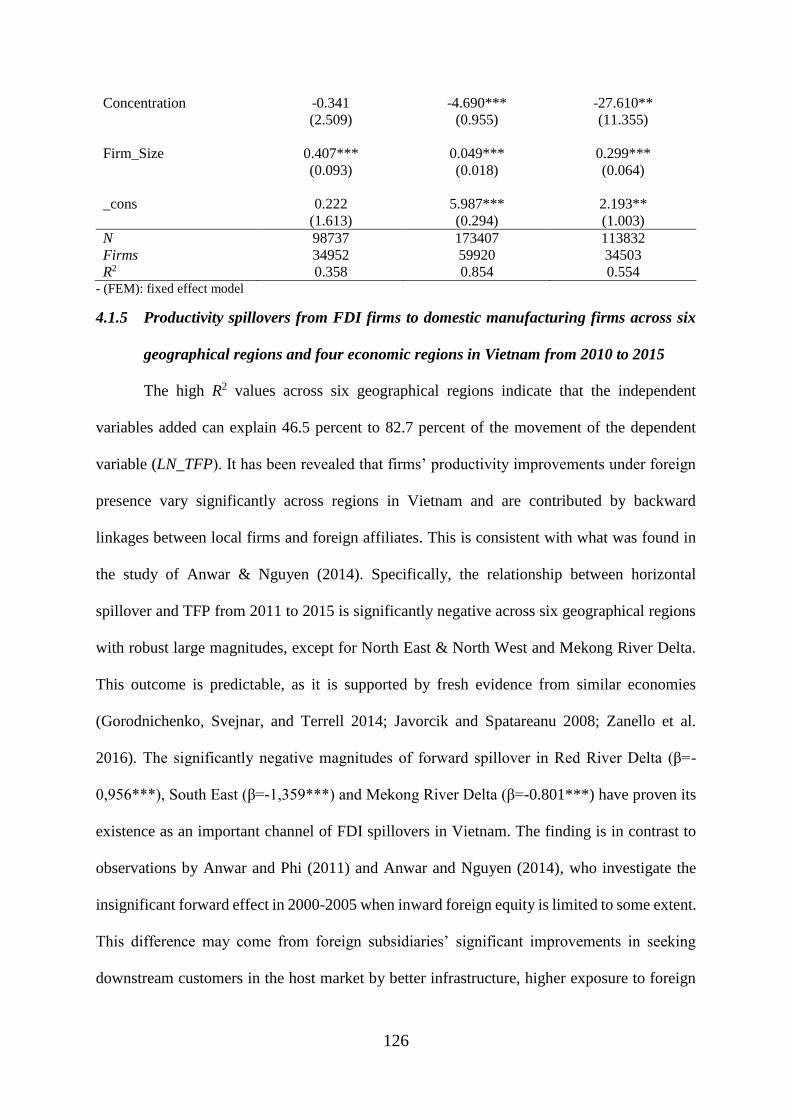
126
Concentration -0.341 -4.690*** -27.610**
(2.509) (0.955) (11.355)
Firm_Size 0.407*** 0.049*** 0.299***
(0.093) (0.018) (0.064)
_cons 0.222 5.987*** 2.193**
(1.613) (0.294) (1.003)
N 98737 173407 113832
Firms 34952 59920 34503
R2 0.358 0.854 0.554 - (FEM): fixed effect model
4.1.5 Productivity spillovers from FDI firms to domestic manufacturing firms across six
geographical regions and four economic regions in Vietnam from 2010 to 2015
The high R2 values across six geographical regions indicate that the independent
variables added can explain 46.5 percent to 82.7 percent of the movement of the dependent
variable (LN_TFP). It has been revealed that firms’ productivity improvements under foreign
presence vary significantly across regions in Vietnam and are contributed by backward
linkages between local firms and foreign affiliates. This is consistent with what was found in
the study of Anwar & Nguyen (2014). Specifically, the relationship between horizontal
spillover and TFP from 2011 to 2015 is significantly negative across six geographical regions
with robust large magnitudes, except for North East & North West and Mekong River Delta.
This outcome is predictable, as it is supported by fresh evidence from similar economies
(Gorodnichenko, Svejnar, and Terrell 2014; Javorcik and Spatareanu 2008; Zanello et al.
2016). The significantly negative magnitudes of forward spillover in Red River Delta (β=-
0,956***), South East (β=-1,359***) and Mekong River Delta (β=-0.801***) have proven its
existence as an important channel of FDI spillovers in Vietnam. The finding is in contrast to
observations by Anwar and Phi (2011) and Anwar and Nguyen (2014), who investigate the
insignificant forward effect in 2000-2005 when inward foreign equity is limited to some extent.
This difference may come from foreign subsidiaries’ significant improvements in seeking
downstream customers in the host market by better infrastructure, higher exposure to foreign
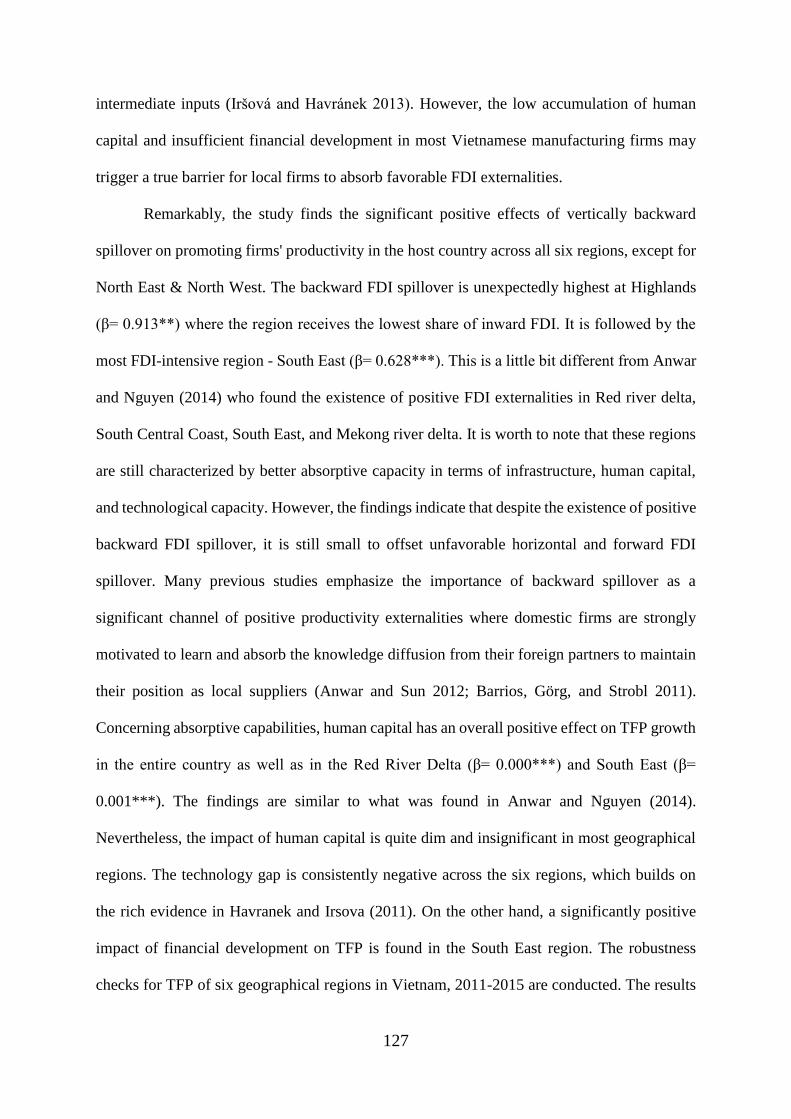
127
intermediate inputs (Iršová and Havránek 2013). However, the low accumulation of human
capital and insufficient financial development in most Vietnamese manufacturing firms may
trigger a true barrier for local firms to absorb favorable FDI externalities.
Remarkably, the study finds the significant positive effects of vertically backward
spillover on promoting firms' productivity in the host country across all six regions, except for
North East & North West. The backward FDI spillover is unexpectedly highest at Highlands
(β= 0.913**) where the region receives the lowest share of inward FDI. It is followed by the
most FDI-intensive region - South East (β= 0.628***). This is a little bit different from Anwar
and Nguyen (2014) who found the existence of positive FDI externalities in Red river delta,
South Central Coast, South East, and Mekong river delta. It is worth to note that these regions
are still characterized by better absorptive capacity in terms of infrastructure, human capital,
and technological capacity. However, the findings indicate that despite the existence of positive
backward FDI spillover, it is still small to offset unfavorable horizontal and forward FDI
spillover. Many previous studies emphasize the importance of backward spillover as a
significant channel of positive productivity externalities where domestic firms are strongly
motivated to learn and absorb the knowledge diffusion from their foreign partners to maintain
their position as local suppliers (Anwar and Sun 2012; Barrios, Görg, and Strobl 2011).
Concerning absorptive capabilities, human capital has an overall positive effect on TFP growth
in the entire country as well as in the Red River Delta (β= 0.000***) and South East (β=
0.001***). The findings are similar to what was found in Anwar and Nguyen (2014).
Nevertheless, the impact of human capital is quite dim and insignificant in most geographical
regions. The technology gap is consistently negative across the six regions, which builds on
the rich evidence in Havranek and Irsova (2011). On the other hand, a significantly positive
impact of financial development on TFP is found in the South East region. The robustness
checks for TFP of six geographical regions in Vietnam, 2011-2015 are conducted. The results
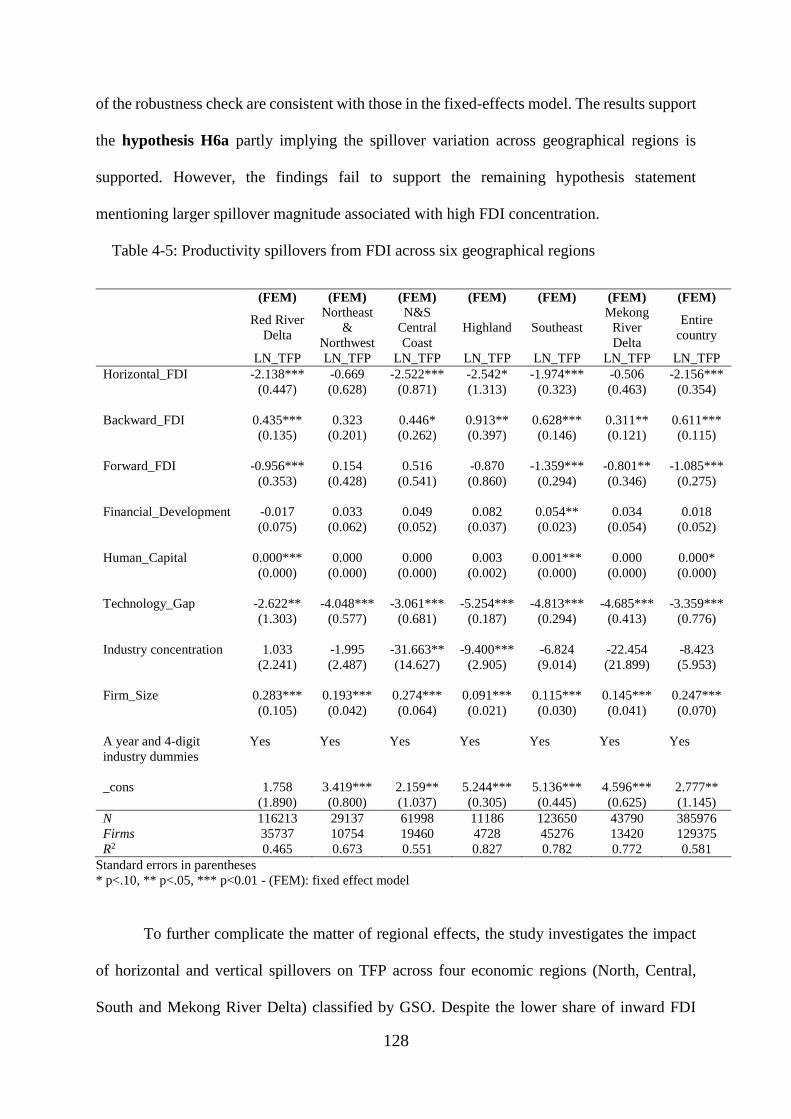
128
of the robustness check are consistent with those in the fixed-effects model. The results support
the hypothesis H6a partly implying the spillover variation across geographical regions is
supported. However, the findings fail to support the remaining hypothesis statement
mentioning larger spillover magnitude associated with high FDI concentration.
Table 4-5: Productivity spillovers from FDI across six geographical regions
(FEM) (FEM) (FEM) (FEM) (FEM) (FEM) (FEM)
Red River
Delta
Northeast
&
Northwest
N&S
Central
Coast
Highland Southeast
Mekong
River
Delta
Entire
country
LN_TFP LN_TFP LN_TFP LN_TFP LN_TFP LN_TFP LN_TFP
Horizontal_FDI -2.138*** -0.669 -2.522*** -2.542* -1.974*** -0.506 -2.156***
(0.447) (0.628) (0.871) (1.313) (0.323) (0.463) (0.354)
Backward_FDI 0.435*** 0.323 0.446* 0.913** 0.628*** 0.311** 0.611***
(0.135) (0.201) (0.262) (0.397) (0.146) (0.121) (0.115)
Forward_FDI -0.956*** 0.154 0.516 -0.870 -1.359*** -0.801** -1.085***
(0.353) (0.428) (0.541) (0.860) (0.294) (0.346) (0.275)
Financial_Development -0.017 0.033 0.049 0.082 0.054** 0.034 0.018
(0.075) (0.062) (0.052) (0.037) (0.023) (0.054) (0.052)
Human_Capital 0.000*** 0.000 0.000 0.003 0.001*** 0.000 0.000*
(0.000) (0.000) (0.000) (0.002) (0.000) (0.000) (0.000)
Technology_Gap -2.622** -4.048*** -3.061*** -5.254*** -4.813*** -4.685*** -3.359***
(1.303) (0.577) (0.681) (0.187) (0.294) (0.413) (0.776)
Industry concentration 1.033 -1.995 -31.663** -9.400*** -6.824 -22.454 -8.423
(2.241) (2.487) (14.627) (2.905) (9.014) (21.899) (5.953)
Firm_Size 0.283*** 0.193*** 0.274*** 0.091*** 0.115*** 0.145*** 0.247***
(0.105) (0.042) (0.064) (0.021) (0.030) (0.041) (0.070)
A year and 4-digit
industry dummies
Yes Yes Yes Yes Yes Yes Yes
_cons 1.758 3.419*** 2.159** 5.244*** 5.136*** 4.596*** 2.777**
(1.890) (0.800) (1.037) (0.305) (0.445) (0.625) (1.145)
N 116213 29137 61998 11186 123650 43790 385976
Firms 35737 10754 19460 4728 45276 13420 129375
R2 0.465 0.673 0.551 0.827 0.782 0.772 0.581
Standard errors in parentheses
* p<.10, ** p<.05, *** p<0.01 - (FEM): fixed effect model
To further complicate the matter of regional effects, the study investigates the impact
of horizontal and vertical spillovers on TFP across four economic regions (North, Central,
South and Mekong River Delta) classified by GSO. Despite the lower share of inward FDI
129
compared to other economic regions, the Central region holds the first position both in
receiving the most negative horizontal FDI spillover (β = - 2.553***) and the highest positive
backward spillover (β = 0.543**). It is followed by South region (βH = - 1.974***, βB =
0.428***, βF = - 1.359***) and North region (βH = - 1.948***, βB = 0.406***, βF = - 0.761***)
which are characterized by highest FDI concentration and human capital accumulation.
Mekong River Delta, on the other hand, does not receive any horizontal spillover. Similarly,
the finding supports the first half of the hypothesis H6b referring to spillover variation across
four economic regions. Nevertheless, it fails to support the second half of the hypothesis
relating to greater spillover effects on more FDI-intensive regions.
Table 4-6: FDI spillover effect on domestic firm productivity across four economic regions
(FEM) (FEM) (FEM) (FEM)
(North) (Central) (South) (Mekong
River Delta)
LN_TFP LN_TFP LN_TFP LN_TFP
Horizontal_FDI -1.948*** -2.553*** -1.974*** -0.506
(0.421) (0.829) (0.323) (0.463)
Backward_FDI 0.406*** 0.543** 0.428*** 0.311**
(0.116) (0.249) (0.146) (0.121)
Forward_FDI -0.761*** 0.269 -1.359*** -0.801**
(0.295) (0.487) (0.294) (0.346)
Financial_Development 0.001 0.037 0.054** 0.034
(0.075) (0.049) (0.023) (0.054)
Human_Capital 0.001*** 0.000 0.003*** 0.000
(0.000) (0.000) (0.000) (0.000)
Technology_Gap -2.800** -3.235*** -4.813*** -4.685***
(1.219) (0.673) (0.294) (0.413)
Concentration 0.547 -32.080** -6.824 -22.454
(2.132) (14.814) (9.014) (21.899)
Firm_Size 0.271*** 0.260*** 0.115*** 0.145***
(0.097) (0.063) (0.030) (0.041)
_cons 1.955 2.426** 5.136*** 4.596***
(1.754) (1.020) (0.445) (0.625)
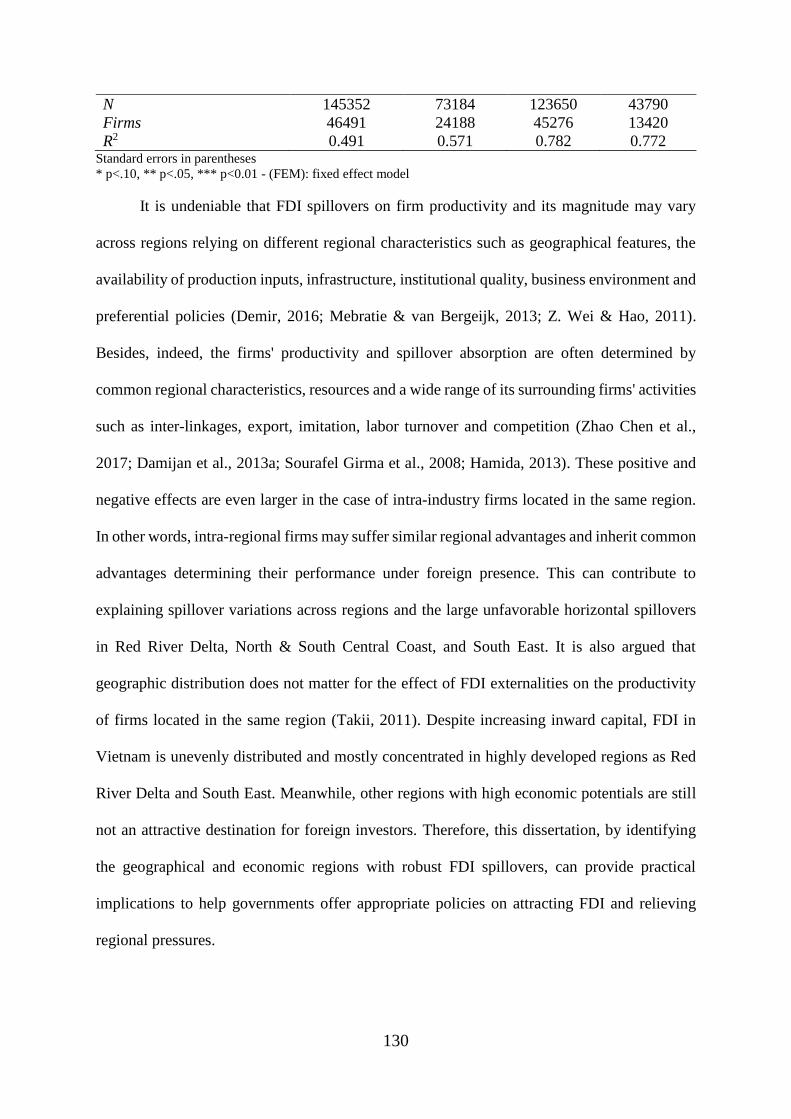
130
N 145352 73184 123650 43790
Firms 46491 24188 45276 13420
R2 0.491 0.571 0.782 0.772 Standard errors in parentheses
* p<.10, ** p<.05, *** p<0.01 - (FEM): fixed effect model
It is undeniable that FDI spillovers on firm productivity and its magnitude may vary
across regions relying on different regional characteristics such as geographical features, the
availability of production inputs, infrastructure, institutional quality, business environment and
preferential policies (Demir, 2016; Mebratie & van Bergeijk, 2013; Z. Wei & Hao, 2011).
Besides, indeed, the firms' productivity and spillover absorption are often determined by
common regional characteristics, resources and a wide range of its surrounding firms' activities
such as inter-linkages, export, imitation, labor turnover and competition (Zhao Chen et al.,
2017; Damijan et al., 2013a; Sourafel Girma et al., 2008; Hamida, 2013). These positive and
negative effects are even larger in the case of intra-industry firms located in the same region.
In other words, intra-regional firms may suffer similar regional advantages and inherit common
advantages determining their performance under foreign presence. This can contribute to
explaining spillover variations across regions and the large unfavorable horizontal spillovers
in Red River Delta, North & South Central Coast, and South East. It is also argued that
geographic distribution does not matter for the effect of FDI externalities on the productivity
of firms located in the same region (Takii, 2011). Despite increasing inward capital, FDI in
Vietnam is unevenly distributed and mostly concentrated in highly developed regions as Red
River Delta and South East. Meanwhile, other regions with high economic potentials are still
not an attractive destination for foreign investors. Therefore, this dissertation, by identifying
the geographical and economic regions with robust FDI spillovers, can provide practical
implications to help governments offer appropriate policies on attracting FDI and relieving
regional pressures.
131
4.1.6 The role of provincial proximity in FDI productivity spillovers
The table below shows the effects of FDI spillovers on firm productivity across
provincial distances. The distance is measured from the province that the firm located to the
border of most FDI-intensive provinces as Ha Noi, Bac Ninh, Hai Phong, Binh Duong, Dong
Nai, Ba Ria Vung Tau and Ho Chi Minh. Although this measure is inadequate to capture the
geographical distance, it appears to be an acceptable choice at this time due to the lack of data
on physical distance. In this way, provincial distance is classified into nine sub-areas including
within 100 sq. km. of Ha Noi, within 100 sq. km. of Bac Ninh, within 100 sq. km. of Hai Phong,
within 100 sq. km. of Binh Duong, within 100 sq. km. of Dong Nai, within 100 sq. km. of Ba
Ria Vung Tau, within 100 sq. km. of Ho Chi Minh and outside 100 sq. km of these regions.
Intuitively, the effect of horizontal FDI spillover on TFP is negatively robust across nine sub-
areas, except the insignificant impacts in two sub-areas “Within Ha Noi 100 km2” and “Within
Hai Phong 100 km2”. The most negative horizontal spillover (β = -3.586***) occurs within
Thanh Hoa 100 km2, followed by within Binh Duong 100 km2 (β = -2.115***) and within BR-
VT 100 km2 (β = -2.050***). The situation is not better for firms located in the provinces
outside 100 km2 of these sub-areas (β = -2.940***). Although greater externalities are believed
to be concentrated in the biggest cities/provinces in terms of foreign capital inflows, the
magnitude of FDI spillovers, in this case, is unpredictable.
Regarding backward spillover, the positive backward externalities occur in most sub-
areas, except "within Bac Giang 100 km2” and “within Hai Phong 100 km2". Regardless of the
highest negative horizontal spillover, sub-area "within Thanh Hoa 100 km2" continues to
absorb the largest positive backward spillover for enhancing the firm's TFP. It is interesting to
note that the outside sub-area (β=0.754***) outperforms than the most FDI-intensive sub-areas
such as within Ho Chi Minh 100 km2, within Ho Chi Minh 100 km2, within Binh Duong 100
km2, within Dong Nai 100 km2, and within Ha Noi 100 km2 in term of positive backward FDI
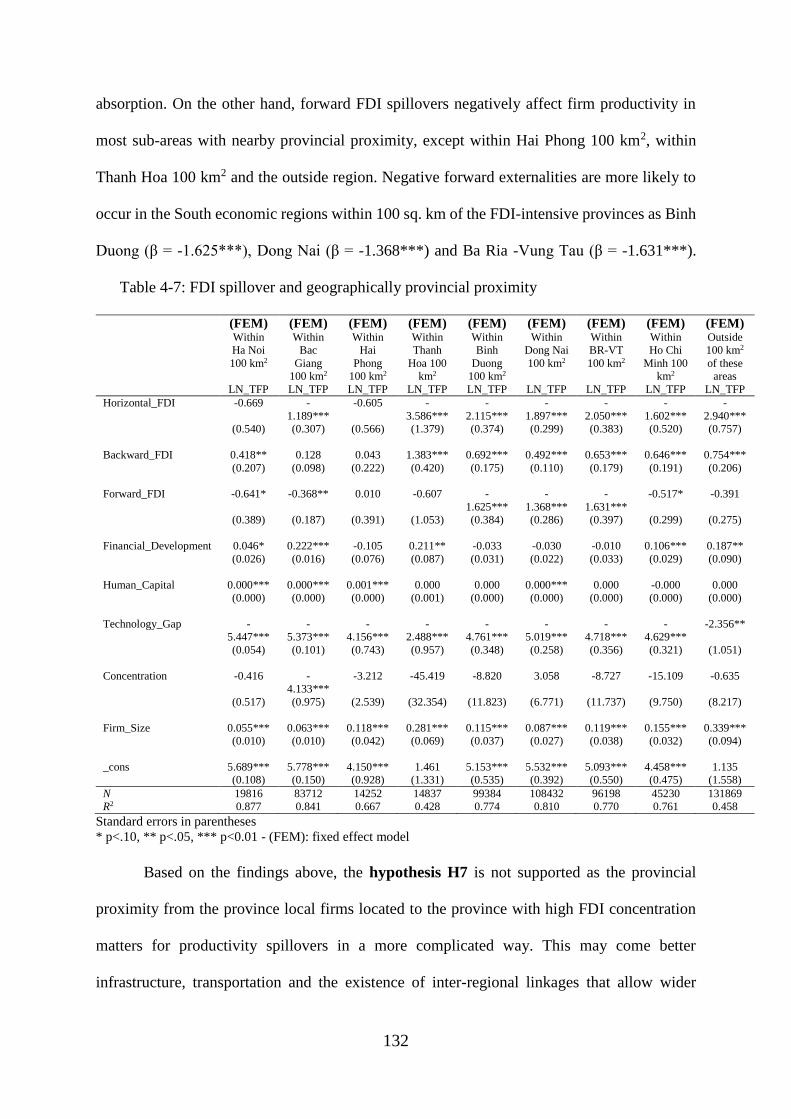
132
absorption. On the other hand, forward FDI spillovers negatively affect firm productivity in
most sub-areas with nearby provincial proximity, except within Hai Phong 100 km2, within
Thanh Hoa 100 km2 and the outside region. Negative forward externalities are more likely to
occur in the South economic regions within 100 sq. km of the FDI-intensive provinces as Binh
Duong (β = -1.625***), Dong Nai (β = -1.368***) and Ba Ria -Vung Tau (β = -1.631***).
Table 4-7: FDI spillover and geographically provincial proximity
(FEM) (FEM) (FEM) (FEM) (FEM) (FEM) (FEM) (FEM) (FEM) Within
Ha Noi
100 km2
Within
Bac
Giang
100 km2
Within
Hai
Phong
100 km2
Within
Thanh
Hoa 100
km2
Within
Binh
Duong
100 km2
Within
Dong Nai
100 km2
Within
BR-VT
100 km2
Within
Ho Chi
Minh 100
km2
Outside
100 km2
of these
areas
LN_TFP LN_TFP LN_TFP LN_TFP LN_TFP LN_TFP LN_TFP LN_TFP LN_TFP
Horizontal_FDI -0.669 -
1.189***
-0.605 -
3.586***
-
2.115***
-
1.897***
-
2.050***
-
1.602***
-
2.940***
(0.540) (0.307) (0.566) (1.379) (0.374) (0.299) (0.383) (0.520) (0.757)
Backward_FDI 0.418** 0.128 0.043 1.383*** 0.692*** 0.492*** 0.653*** 0.646*** 0.754***
(0.207) (0.098) (0.222) (0.420) (0.175) (0.110) (0.179) (0.191) (0.206)
Forward_FDI -0.641* -0.368** 0.010 -0.607 -
1.625***
-
1.368***
-
1.631***
-0.517* -0.391
(0.389) (0.187) (0.391) (1.053) (0.384) (0.286) (0.397) (0.299) (0.275)
Financial_Development 0.046* 0.222*** -0.105 0.211** -0.033 -0.030 -0.010 0.106*** 0.187**
(0.026) (0.016) (0.076) (0.087) (0.031) (0.022) (0.033) (0.029) (0.090)
Human_Capital 0.000*** 0.000*** 0.001*** 0.000 0.000 0.000*** 0.000 -0.000 0.000
(0.000) (0.000) (0.000) (0.001) (0.000) (0.000) (0.000) (0.000) (0.000)
Technology_Gap -
5.447***
-
5.373***
-
4.156***
-
2.488***
-
4.761***
-
5.019***
-
4.718***
-
4.629***
-2.356**
(0.054) (0.101) (0.743) (0.957) (0.348) (0.258) (0.356) (0.321) (1.051)
Concentration -0.416 -
4.133***
-3.212 -45.419 -8.820 3.058 -8.727 -15.109 -0.635
(0.517) (0.975) (2.539) (32.354) (11.823) (6.771) (11.737) (9.750) (8.217)
Firm_Size 0.055*** 0.063*** 0.118*** 0.281*** 0.115*** 0.087*** 0.119*** 0.155*** 0.339***
(0.010) (0.010) (0.042) (0.069) (0.037) (0.027) (0.038) (0.032) (0.094)
_cons 5.689*** 5.778*** 4.150*** 1.461 5.153*** 5.532*** 5.093*** 4.458*** 1.135
(0.108) (0.150) (0.928) (1.331) (0.535) (0.392) (0.550) (0.475) (1.558)
N 19816 83712 14252 14837 99384 108432 96198 45230 131869
R2 0.877 0.841 0.667 0.428 0.774 0.810 0.770 0.761 0.458
Standard errors in parentheses
* p<.10, ** p<.05, *** p<0.01 - (FEM): fixed effect model
Based on the findings above, the hypothesis H7 is not supported as the provincial
proximity from the province local firms located to the province with high FDI concentration
matters for productivity spillovers in a more complicated way. This may come better
infrastructure, transportation and the existence of inter-regional linkages that allow wider
133
spillovers across provinces and regions (Aitken & Harrison, 2013). This makes the distance
not a decisive determinant any more. Indeed, FDI spillovers may freely be absorbed by the
firms in remote regions with the availability of production inputs and strategic assets. However,
it is argued that FDI spillovers are bounded with distance and trigger greater impacts on their
nearby enterprises by diverse mechanisms (Halpern & Muraközy, 2007; Thang et al., 2016).
There is much empirical evidence for the importance of geographical proximity in enabling
successful knowledge and technology transfer between foreign firms and domestic firms
(Sourafel Girma & Wakelin, 2007; Havranek & Irsova, 2011; Mariotti et al., 2015; Merlevede
& Purice, 2016). With provincial proximity, Halpern & Muraközy (2007) also use the scale
within 100 sq. km of Hungarian FDI-intensive centers to capture the moderating effect of
distance. Nevertheless, their finding indicates positive horizontal spillovers on local firms
located close to foreign ones.
4.1.7 Robustness check
The dynamic panel data (DPD) approach was developed to overcome the obstacle in fixed-
effect models with datasets that contain a relatively small number of observed periods
compared to the number of individual units (small T and large N) (Holtz-Eakin et al., 2006).
The issue that the mean of the lagged dependent variables yt-1 contains zero values on
observations at time t because the mean error is subtracted has contemporaneous erroneous
values at time t. Consequently, the bias in calculating the coefficients of the lagged dependent
variable y becomes considerable because it is not mitigated when the number of observations
increases (Baum 2013.).
This bias is not caused by autocorrelation error, so the lagged dependent variable cannot be
independent of the composite error process. The DPD approach improves on the instrumental
variables (IVs) approach, which does not exploit all the information available in the sample.
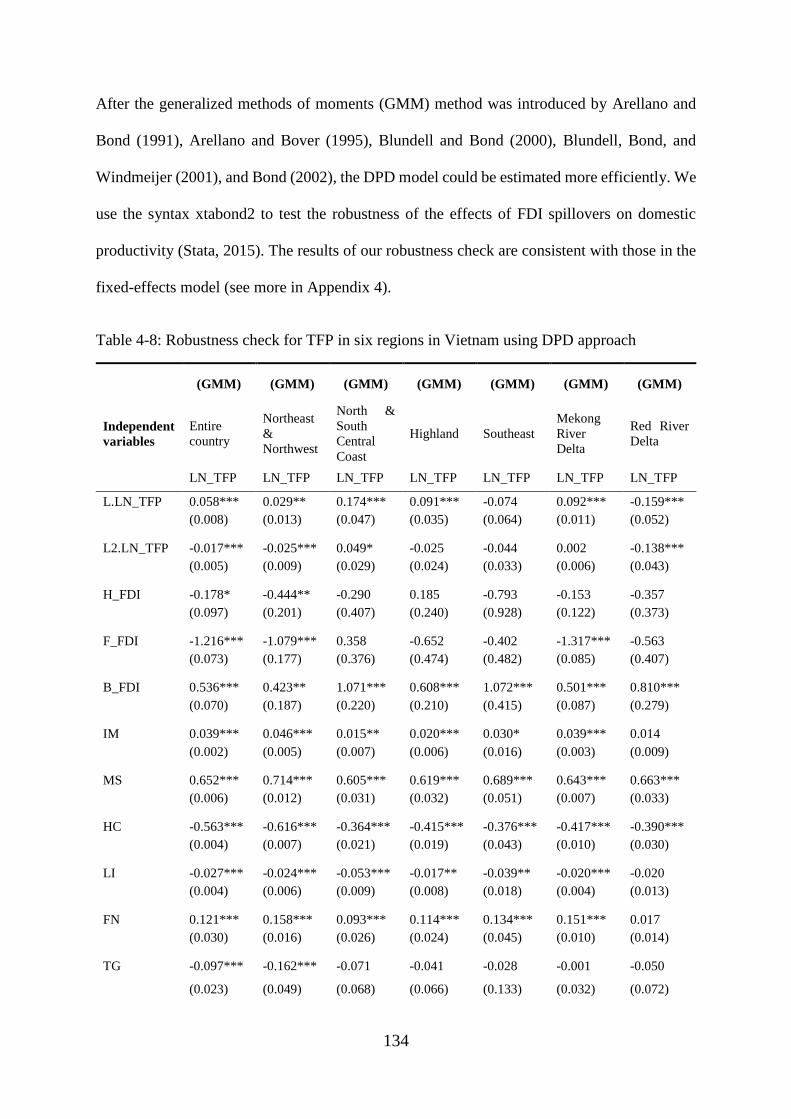
134
After the generalized methods of moments (GMM) method was introduced by Arellano and
Bond (1991), Arellano and Bover (1995), Blundell and Bond (2000), Blundell, Bond, and
Windmeijer (2001), and Bond (2002), the DPD model could be estimated more efficiently. We
use the syntax xtabond2 to test the robustness of the effects of FDI spillovers on domestic
productivity (Stata, 2015). The results of our robustness check are consistent with those in the
fixed-effects model (see more in Appendix 4).
Table 4-8: Robustness check for TFP in six regions in Vietnam using DPD approach
(GMM) (GMM) (GMM) (GMM) (GMM) (GMM) (GMM)
Independent
variables
Entire
country
Northeast
&
Northwest
North &
South
Central
Coast
Highland Southeast
Mekong
River
Delta
Red River
Delta
LN_TFP LN_TFP LN_TFP LN_TFP LN_TFP LN_TFP LN_TFP
L.LN_TFP 0.058*** 0.029** 0.174*** 0.091*** -0.074 0.092*** -0.159***
(0.008) (0.013) (0.047) (0.035) (0.064) (0.011) (0.052)
L2.LN_TFP -0.017*** -0.025*** 0.049* -0.025 -0.044 0.002 -0.138***
(0.005) (0.009) (0.029) (0.024) (0.033) (0.006) (0.043)
H_FDI -0.178* -0.444** -0.290 0.185 -0.793 -0.153 -0.357
(0.097) (0.201) (0.407) (0.240) (0.928) (0.122) (0.373)
F_FDI -1.216*** -1.079*** 0.358 -0.652 -0.402 -1.317*** -0.563
(0.073) (0.177) (0.376) (0.474) (0.482) (0.085) (0.407)
B_FDI 0.536*** 0.423** 1.071*** 0.608*** 1.072*** 0.501*** 0.810***
(0.070) (0.187) (0.220) (0.210) (0.415) (0.087) (0.279)
IM 0.039*** 0.046*** 0.015** 0.020*** 0.030* 0.039*** 0.014
(0.002) (0.005) (0.007) (0.006) (0.016) (0.003) (0.009)
MS 0.652*** 0.714*** 0.605*** 0.619*** 0.689*** 0.643*** 0.663***
(0.006) (0.012) (0.031) (0.032) (0.051) (0.007) (0.033)
HC -0.563*** -0.616*** -0.364*** -0.415*** -0.376*** -0.417*** -0.390***
(0.004) (0.007) (0.021) (0.019) (0.043) (0.010) (0.030)
LI -0.027*** -0.024*** -0.053*** -0.017** -0.039** -0.020*** -0.020
(0.004) (0.006) (0.009) (0.008) (0.018) (0.004) (0.013)
FN 0.121*** 0.158*** 0.093*** 0.114*** 0.134*** 0.151*** 0.017
(0.030) (0.016) (0.026) (0.024) (0.045) (0.010) (0.014)
TG -0.097*** -0.162*** -0.071 -0.041 -0.028 -0.001 -0.050
(0.023) (0.049) (0.068) (0.066) (0.133) (0.032) (0.072)
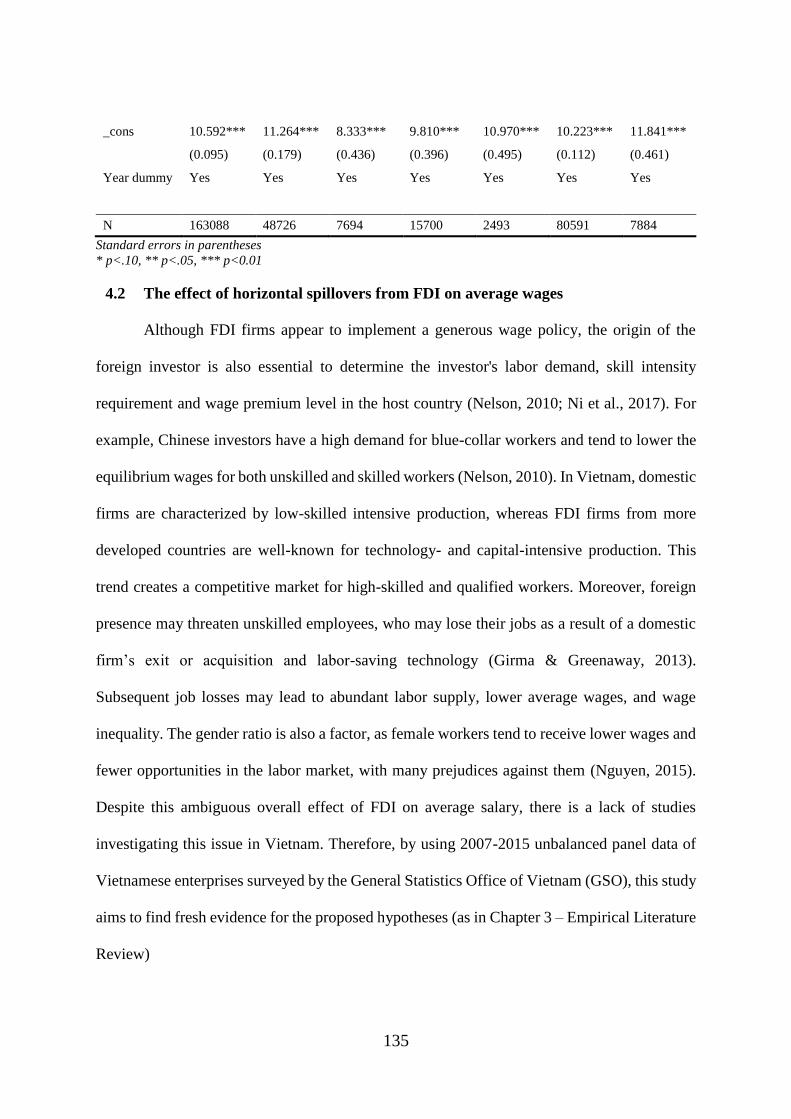
135
_cons 10.592*** 11.264*** 8.333*** 9.810*** 10.970*** 10.223*** 11.841***
(0.095) (0.179) (0.436) (0.396) (0.495) (0.112) (0.461)
Year dummy Yes Yes Yes Yes Yes Yes Yes
N 163088 48726 7694 15700 2493 80591 7884
Standard errors in parentheses
* p<.10, ** p<.05, *** p<0.01
4.2 The effect of horizontal spillovers from FDI on average wages
Although FDI firms appear to implement a generous wage policy, the origin of the
foreign investor is also essential to determine the investor's labor demand, skill intensity
requirement and wage premium level in the host country (Nelson, 2010; Ni et al., 2017). For
example, Chinese investors have a high demand for blue-collar workers and tend to lower the
equilibrium wages for both unskilled and skilled workers (Nelson, 2010). In Vietnam, domestic
firms are characterized by low-skilled intensive production, whereas FDI firms from more
developed countries are well-known for technology- and capital-intensive production. This
trend creates a competitive market for high-skilled and qualified workers. Moreover, foreign
presence may threaten unskilled employees, who may lose their jobs as a result of a domestic
firm’s exit or acquisition and labor-saving technology (Girma & Greenaway, 2013).
Subsequent job losses may lead to abundant labor supply, lower average wages, and wage
inequality. The gender ratio is also a factor, as female workers tend to receive lower wages and
fewer opportunities in the labor market, with many prejudices against them (Nguyen, 2015).
Despite this ambiguous overall effect of FDI on average salary, there is a lack of studies
investigating this issue in Vietnam. Therefore, by using 2007-2015 unbalanced panel data of
Vietnamese enterprises surveyed by the General Statistics Office of Vietnam (GSO), this study
aims to find fresh evidence for the proposed hypotheses (as in Chapter 3 – Empirical Literature
Review)
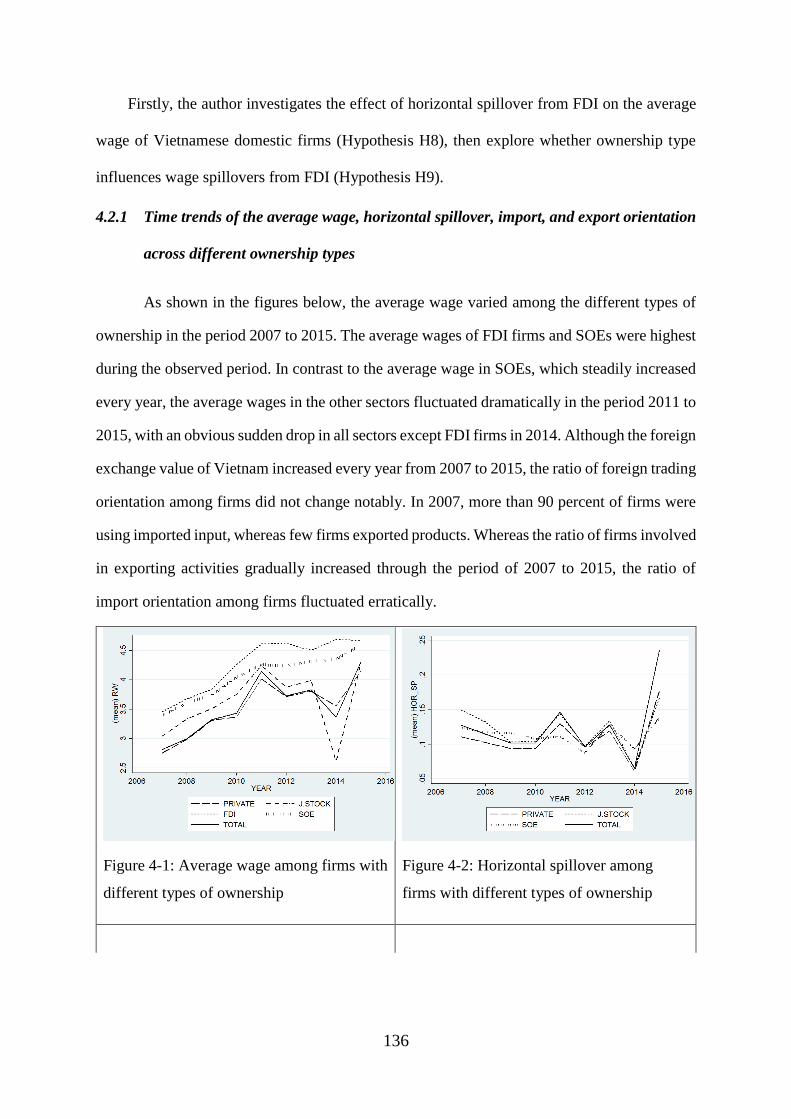
136
Firstly, the author investigates the effect of horizontal spillover from FDI on the average
wage of Vietnamese domestic firms (Hypothesis H8), then explore whether ownership type
influences wage spillovers from FDI (Hypothesis H9).
4.2.1 Time trends of the average wage, horizontal spillover, import, and export orientation
across different ownership types
As shown in the figures below, the average wage varied among the different types of
ownership in the period 2007 to 2015. The average wages of FDI firms and SOEs were highest
during the observed period. In contrast to the average wage in SOEs, which steadily increased
every year, the average wages in the other sectors fluctuated dramatically in the period 2011 to
2015, with an obvious sudden drop in all sectors except FDI firms in 2014. Although the foreign
exchange value of Vietnam increased every year from 2007 to 2015, the ratio of foreign trading
orientation among firms did not change notably. In 2007, more than 90 percent of firms were
using imported input, whereas few firms exported products. Whereas the ratio of firms involved
in exporting activities gradually increased through the period of 2007 to 2015, the ratio of
import orientation among firms fluctuated erratically.
Figure 4-1: Average wage among firms with
different types of ownership
Figure 4-2: Horizontal spillover among
firms with different types of ownership
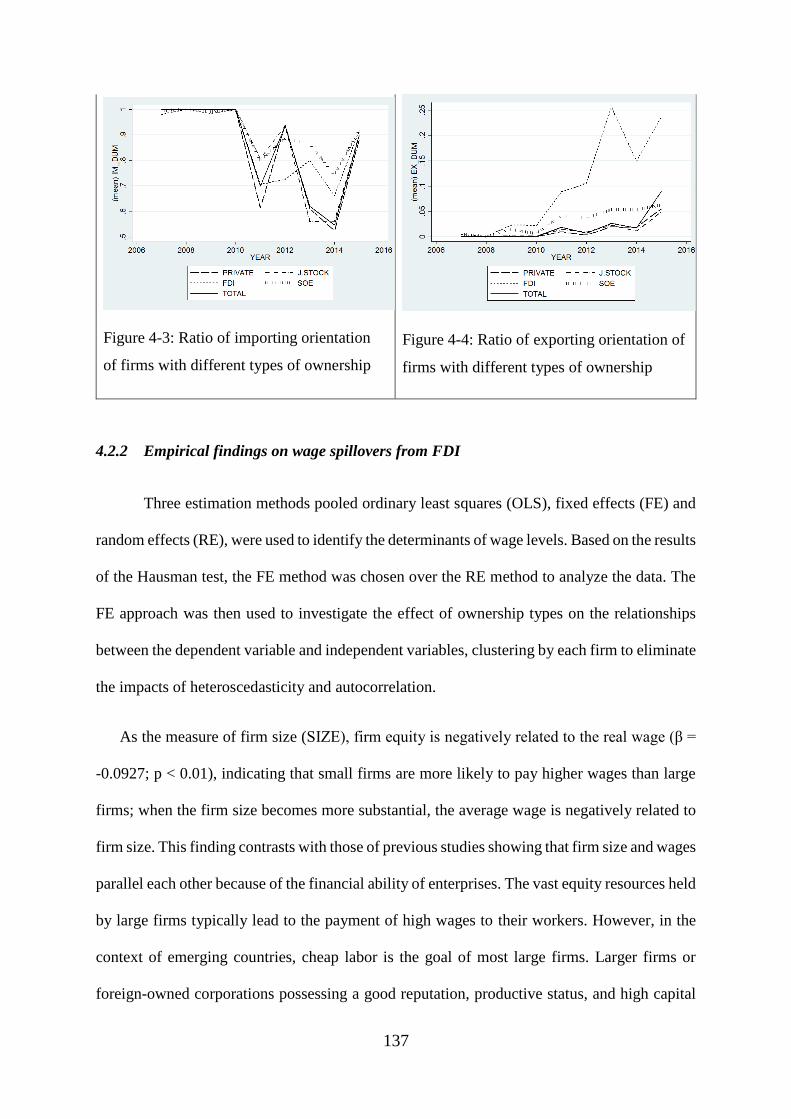
137
Figure 4-3: Ratio of importing orientation
of firms with different types of ownership
Figure 4-4: Ratio of exporting orientation of
firms with different types of ownership
4.2.2 Empirical findings on wage spillovers from FDI
Three estimation methods pooled ordinary least squares (OLS), fixed effects (FE) and
random effects (RE), were used to identify the determinants of wage levels. Based on the results
of the Hausman test, the FE method was chosen over the RE method to analyze the data. The
FE approach was then used to investigate the effect of ownership types on the relationships
between the dependent variable and independent variables, clustering by each firm to eliminate
the impacts of heteroscedasticity and autocorrelation.
As the measure of firm size (SIZE), firm equity is negatively related to the real wage (β =
-0.0927; p < 0.01), indicating that small firms are more likely to pay higher wages than large
firms; when the firm size becomes more substantial, the average wage is negatively related to
firm size. This finding contrasts with those of previous studies showing that firm size and wages
parallel each other because of the financial ability of enterprises. The vast equity resources held
by large firms typically lead to the payment of high wages to their workers. However, in the
context of emerging countries, cheap labor is the goal of most large firms. Larger firms or
foreign-owned corporations possessing a good reputation, productive status, and high capital
138
intensity are always more attractive to local employees (Decreuse & Maarek, 2015). In
addition, the average wage may fall as the firm size increases because most employment
created by large firms and foreign subsidiaries in an emerging economy is unskilled labor-
intensive, with repetitive tasks (Chenet al., 2013; Nelson, 2010). When investigated according
to ownership type, a negative relationship is observed only for domestic private firms and joint-
stock companies.
The output has a significantly positive effect on the average wage (β = 0.0158; p < 0.01).
In terms of labor demand, real output (RQ) demonstrates the need to expend resources in the
market through human capital. This conclusion is consistent with the Lewis-Fei-Ranis model,
which describes the need for a dynamic labor force in an abundant economy. Conversely, the
overall impact of expanded output on wages on the supply side suggests that enterprises are
willing to spend part of their assets on wages and even pay higher than the average industrial
wage.
The capital intensity (KL) variable appears to have a significantly positive effect on the
average wage, and using advanced fixed assets could enhance labor earnings (β = 0.1190; p <
0.01); this result provides extensive empirical evidence of capital-skill complementarity
between workers and advanced technology and equipment as well as absorptive capacity.
Capital-intense production systems demand human capital with the skill to interact with
advanced technology, consistent with the positive correlation between capital intensity and
wages.
Table 4-9: The effects of horizontal FDI spillovers on an average wage from 2007 to 2015
across ownership types
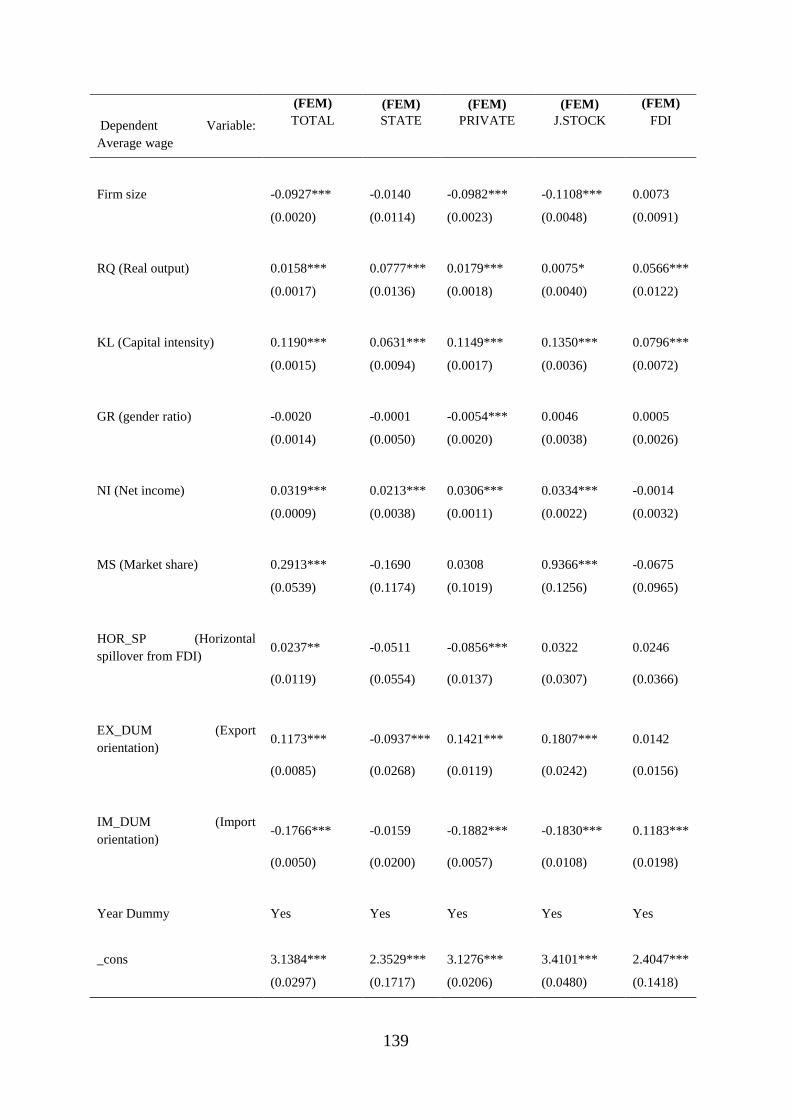
139
(FEM) (FEM) (FEM) (FEM) (FEM)
Dependent Variable:
Average wage
TOTAL STATE PRIVATE J.STOCK FDI
Firm size -0.0927*** -0.0140 -0.0982*** -0.1108*** 0.0073
(0.0020) (0.0114) (0.0023) (0.0048) (0.0091)
RQ (Real output) 0.0158*** 0.0777*** 0.0179*** 0.0075* 0.0566***
(0.0017) (0.0136) (0.0018) (0.0040) (0.0122)
KL (Capital intensity) 0.1190*** 0.0631*** 0.1149*** 0.1350*** 0.0796***
(0.0015) (0.0094) (0.0017) (0.0036) (0.0072)
GR (gender ratio) -0.0020 -0.0001 -0.0054*** 0.0046 0.0005
(0.0014) (0.0050) (0.0020) (0.0038) (0.0026)
NI (Net income) 0.0319*** 0.0213*** 0.0306*** 0.0334*** -0.0014
(0.0009) (0.0038) (0.0011) (0.0022) (0.0032)
MS (Market share) 0.2913*** -0.1690 0.0308 0.9366*** -0.0675
(0.0539) (0.1174) (0.1019) (0.1256) (0.0965)
HOR_SP (Horizontal
spillover from FDI) 0.0237** -0.0511 -0.0856*** 0.0322 0.0246
(0.0119) (0.0554) (0.0137) (0.0307) (0.0366)
EX_DUM (Export
orientation) 0.1173*** -0.0937*** 0.1421*** 0.1807*** 0.0142
(0.0085) (0.0268) (0.0119) (0.0242) (0.0156)
IM_DUM (Import
orientation) -0.1766*** -0.0159 -0.1882*** -0.1830*** 0.1183***
(0.0050) (0.0200) (0.0057) (0.0108) (0.0198)
Year Dummy Yes Yes Yes Yes Yes
_cons 3.1384*** 2.3529*** 3.1276*** 3.4101*** 2.4047***
(0.0297) (0.1717) (0.0206) (0.0480) (0.1418)
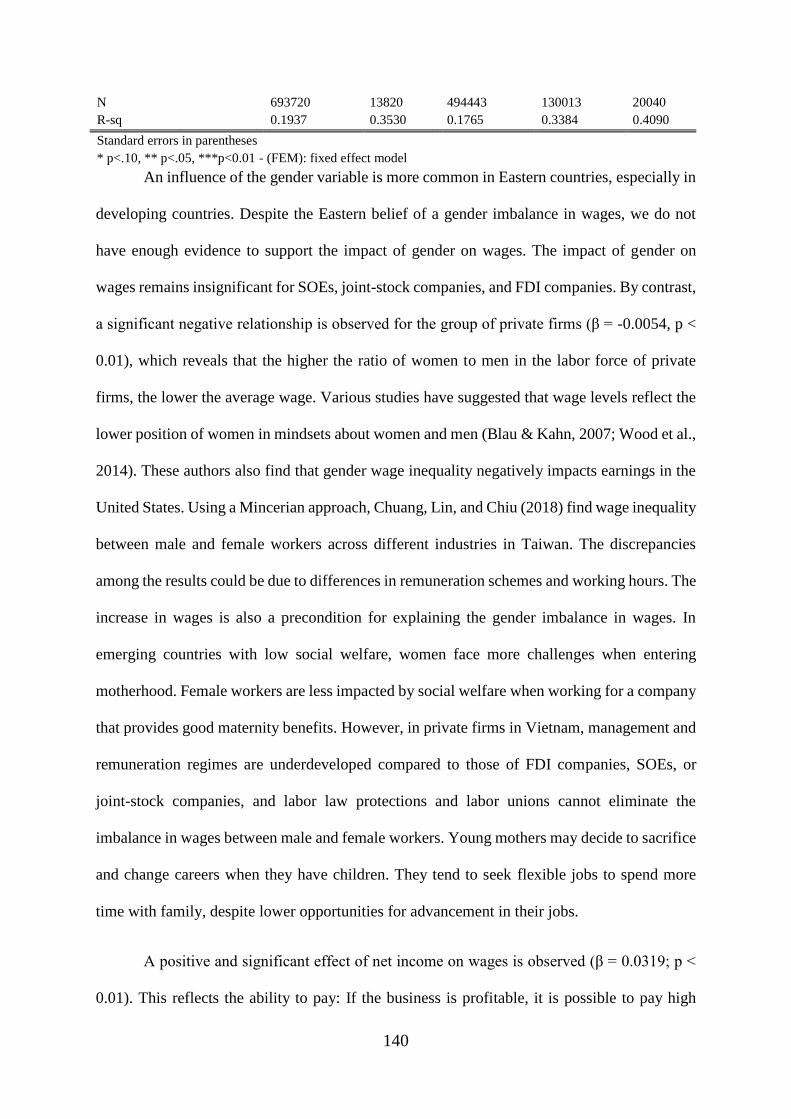
140
N 693720 13820 494443 130013 20040
R-sq 0.1937 0.3530 0.1765 0.3384 0.4090
Standard errors in parentheses
* p<.10, ** p<.05, ***p<0.01 - (FEM): fixed effect model
An influence of the gender variable is more common in Eastern countries, especially in
developing countries. Despite the Eastern belief of a gender imbalance in wages, we do not
have enough evidence to support the impact of gender on wages. The impact of gender on
wages remains insignificant for SOEs, joint-stock companies, and FDI companies. By contrast,
a significant negative relationship is observed for the group of private firms (β = -0.0054, p <
0.01), which reveals that the higher the ratio of women to men in the labor force of private
firms, the lower the average wage. Various studies have suggested that wage levels reflect the
lower position of women in mindsets about women and men (Blau & Kahn, 2007; Wood et al.,
2014). These authors also find that gender wage inequality negatively impacts earnings in the
United States. Using a Mincerian approach, Chuang, Lin, and Chiu (2018) find wage inequality
between male and female workers across different industries in Taiwan. The discrepancies
among the results could be due to differences in remuneration schemes and working hours. The
increase in wages is also a precondition for explaining the gender imbalance in wages. In
emerging countries with low social welfare, women face more challenges when entering
motherhood. Female workers are less impacted by social welfare when working for a company
that provides good maternity benefits. However, in private firms in Vietnam, management and
remuneration regimes are underdeveloped compared to those of FDI companies, SOEs, or
joint-stock companies, and labor law protections and labor unions cannot eliminate the
imbalance in wages between male and female workers. Young mothers may decide to sacrifice
and change careers when they have children. They tend to seek flexible jobs to spend more
time with family, despite lower opportunities for advancement in their jobs.
A positive and significant effect of net income on wages is observed (β = 0.0319; p <
0.01). This reflects the ability to pay: If the business is profitable, it is possible to pay high
141
salaries. Wages are also one of the motivations for workers to work more efficiently and
productively. Many economists expect that rising wages must always go hand in hand with
rising productivity. If labor productivity does not increase, businesses have no reason to raise
wages. However, increasing new salaries in a sustainable manner are necessary to increase
labor productivity. Unless labor productivity increases, raising wages will exceed the capital
and production costs of enterprises (Abugri & Soydemir, 2002). When wages rise without an
increase in labor productivity, the prices of goods and services will increase faster, causing the
real incomes of workers to increase only nominally. Therefore, addressing the root of the
problem requires a specific roadmap that starts with the overall welfare policy and wage
reform.
The positive impact of market shares on real wages (β = 0.2913; p < 0.01) indicates that
companies focused on surpassing competitors and becoming industry leaders will increase
wages with the transformation of motivations in the Vietnamese economy. Furthermore,
companies that have a significant market share will have the advantage of dominating the
market. Loss of market share is accompanied by reduced competitive advantage, reduced
profits, higher costs, and a threat to the market. In this thesis, we emphasize the market share
factor as a critical factor affecting the average wage. Therefore, higher market share will lead
to a greater reputation and, in turn, higher profit in the form of salaries.
Horizontal spillover appears to have a positive effect on the wages of firms in the
Vietnamese economy (β = 0.0237; p < 0.05). Because of the boost to productivity spillover
through human capital, foreign enterprises must pay higher wages than domestic enterprises in
the host country to avoid labor turnover (Blomström & Sjöholm, 1999; Figini & Görg, 2011;
Girma & Greenaway, 2013; Görg et al., 2007; Wood et al., 2014). Access to the advanced
technology and equipment of foreign enterprises as well as their specific knowledge in
management, production, and operation create horizontal spillover in parallel with wage
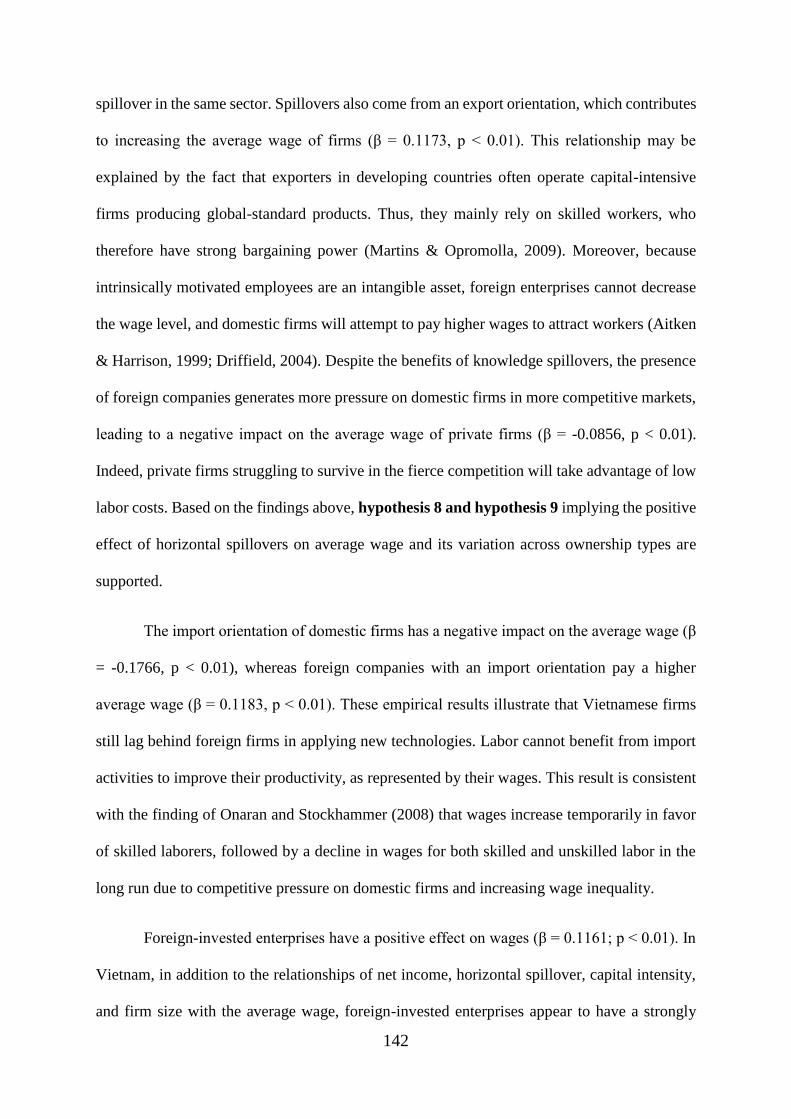
142
spillover in the same sector. Spillovers also come from an export orientation, which contributes
to increasing the average wage of firms (β = 0.1173, p < 0.01). This relationship may be
explained by the fact that exporters in developing countries often operate capital-intensive
firms producing global-standard products. Thus, they mainly rely on skilled workers, who
therefore have strong bargaining power (Martins & Opromolla, 2009). Moreover, because
intrinsically motivated employees are an intangible asset, foreign enterprises cannot decrease
the wage level, and domestic firms will attempt to pay higher wages to attract workers (Aitken
& Harrison, 1999; Driffield, 2004). Despite the benefits of knowledge spillovers, the presence
of foreign companies generates more pressure on domestic firms in more competitive markets,
leading to a negative impact on the average wage of private firms (β = -0.0856, p < 0.01).
Indeed, private firms struggling to survive in the fierce competition will take advantage of low
labor costs. Based on the findings above, hypothesis 8 and hypothesis 9 implying the positive
effect of horizontal spillovers on average wage and its variation across ownership types are
supported.
The import orientation of domestic firms has a negative impact on the average wage (β
= -0.1766, p < 0.01), whereas foreign companies with an import orientation pay a higher
average wage (β = 0.1183, p < 0.01). These empirical results illustrate that Vietnamese firms
still lag behind foreign firms in applying new technologies. Labor cannot benefit from import
activities to improve their productivity, as represented by their wages. This result is consistent
with the finding of Onaran and Stockhammer (2008) that wages increase temporarily in favor
of skilled laborers, followed by a decline in wages for both skilled and unskilled labor in the
long run due to competitive pressure on domestic firms and increasing wage inequality.
Foreign-invested enterprises have a positive effect on wages (β = 0.1161; p < 0.01). In
Vietnam, in addition to the relationships of net income, horizontal spillover, capital intensity,
and firm size with the average wage, foreign-invested enterprises appear to have a strongly

143
positive effect on wages. According to Fukase (2014), due to financial and managerial
advantages, foreign-owned enterprises tend to pay a higher wage than local enterprises to
attract highly skilled workers.
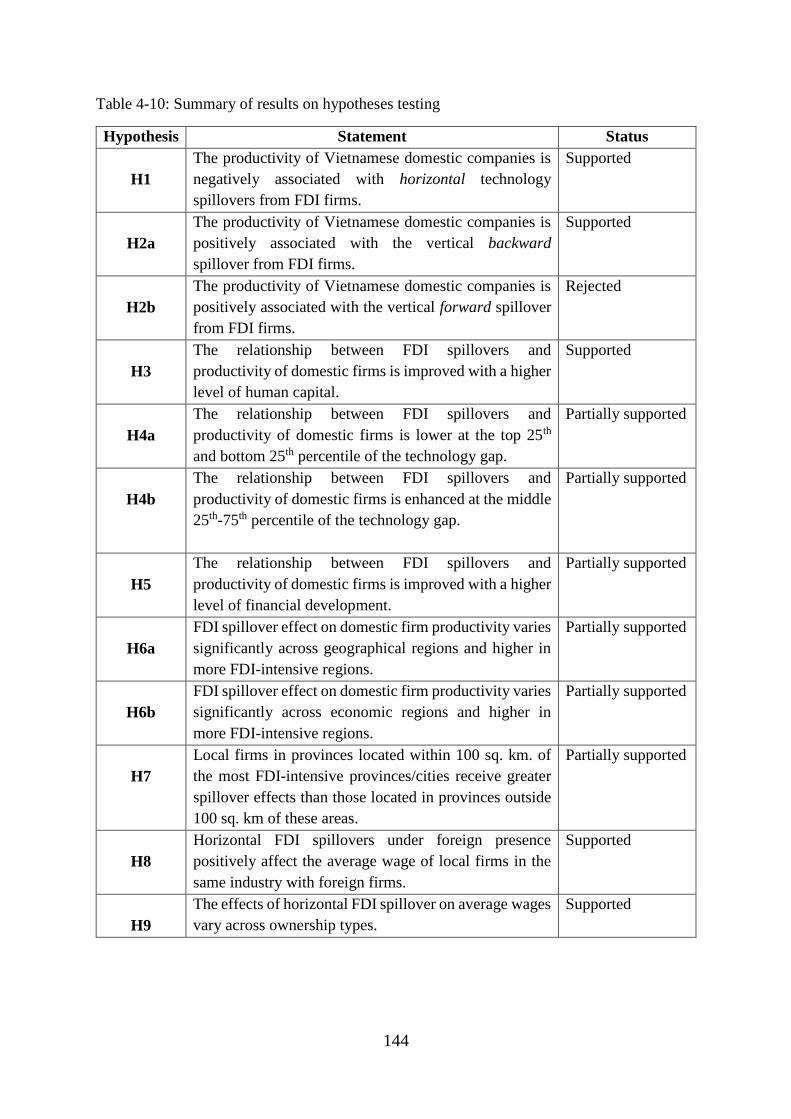
144
Table 4-10: Summary of results on hypotheses testing
Hypothesis Statement Status
H1
The productivity of Vietnamese domestic companies is
negatively associated with horizontal technology
spillovers from FDI firms.
Supported
H2a
The productivity of Vietnamese domestic companies is
positively associated with the vertical backward
spillover from FDI firms.
Supported
H2b
The productivity of Vietnamese domestic companies is
positively associated with the vertical forward spillover
from FDI firms.
Rejected
H3
The relationship between FDI spillovers and
productivity of domestic firms is improved with a higher
level of human capital.
Supported
H4a
The relationship between FDI spillovers and
productivity of domestic firms is lower at the top 25th
and bottom 25th percentile of the technology gap.
Partially supported
H4b
The relationship between FDI spillovers and
productivity of domestic firms is enhanced at the middle
25th-75th percentile of the technology gap.
Partially supported
H5
The relationship between FDI spillovers and
productivity of domestic firms is improved with a higher
level of financial development.
Partially supported
H6a
FDI spillover effect on domestic firm productivity varies
significantly across geographical regions and higher in
more FDI-intensive regions.
Partially supported
H6b
FDI spillover effect on domestic firm productivity varies
significantly across economic regions and higher in
more FDI-intensive regions.
Partially supported
H7
Local firms in provinces located within 100 sq. km. of
the most FDI-intensive provinces/cities receive greater
spillover effects than those located in provinces outside
100 sq. km of these areas.
Partially supported
H8
Horizontal FDI spillovers under foreign presence
positively affect the average wage of local firms in the
same industry with foreign firms.
Supported
H9
The effects of horizontal FDI spillover on average wages
vary across ownership types.
Supported
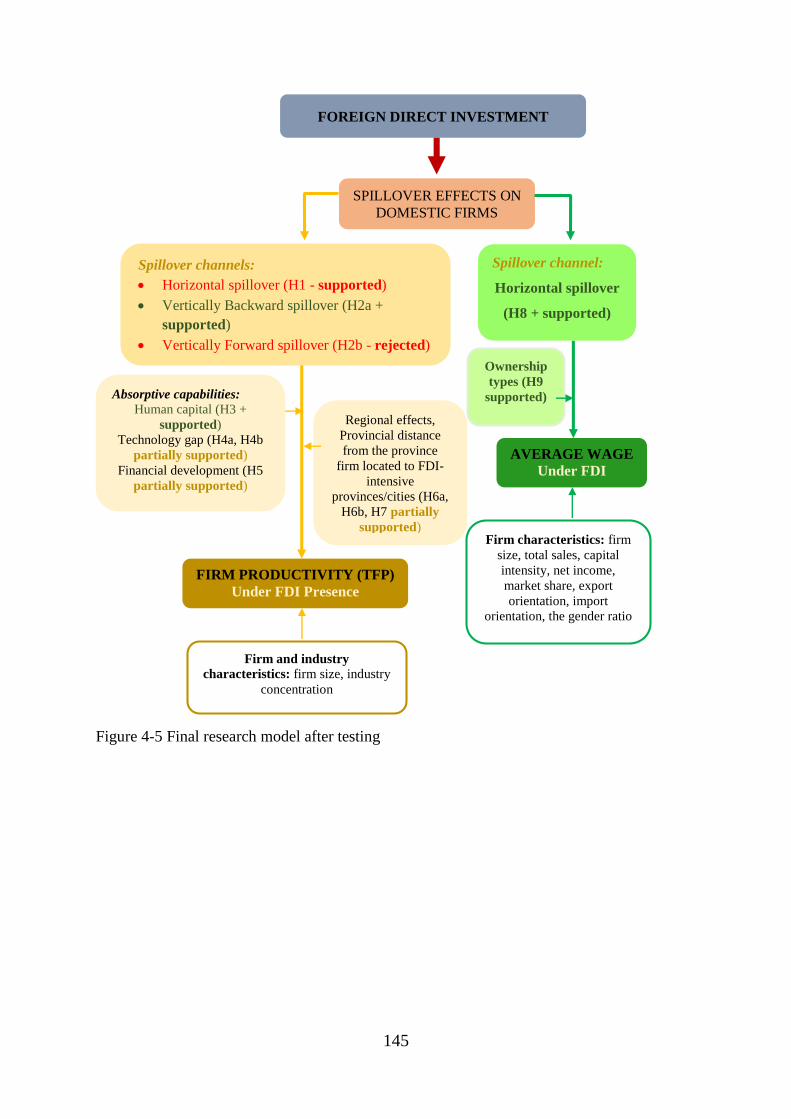
145
Figure 4-5 Final research model after testing
FOREIGN DIRECT INVESTMENT
SPILLOVER EFFECTS ON
DOMESTIC FIRMS
FIRM PRODUCTIVITY (TFP)
Under FDI Presence
Regional effects,
Provincial distance
from the province
firm located to FDI-
intensive
provinces/cities (H6a,
H6b, H7 partially
supported)
Absorptive capabilities:
Human capital (H3 +
supported)
Technology gap (H4a, H4b
partially supported)
Financial development (H5
partially supported)
AVERAGE WAGE
Under FDI
Presence
Firm characteristics: firm
size, total sales, capital
intensity, net income,
market share, export
orientation, import
orientation, the gender ratio
Spillover channels:
Horizontal spillover (H1 - supported)
Vertically Backward spillover (H2a +
supported)
Vertically Forward spillover (H2b - rejected)
Firm and industry
characteristics: firm size, industry
concentration
Ownership
types (H9
supported)
Spillover channel:
Horizontal spillover
(H8 + supported)
146
CONCLUSION AND
IMPLICATIONS
5.1 Conclusion
This thesis attempts to investigate the spillover effects of foreign investment (FDI) in
Vietnam focusing on productivity spillovers and wage spillovers associated with FDI. FDI
spillover effects can be understood as intentional or unintentional interactions among economic
entities over time that generates externalities on the local firms or the host economy under the
foreign equity presence in the host country. The term "FDI spillovers" implies the ability to
leak, disperse and transfer or share information among relevant stakeholders. Under spillover
effects, FDI enterprises can indirectly affect the technological capacity and productivity of
domestic enterprises as well as the local workers' compensation in terms of the average wage.
The externalities generated by foreign subsidiaries may spill over horizontal channels under
the effects of worker mobility, competition, imitation/ demonstration or vertical channel under
the effects of vertical backward and vertically forward linkages. Further, FDI spillovers do not
occur uniformly for all domestic enterprises in intra-industry and inter-industry with MNCs,
but it depends on the absorption capacity or specific characteristics of domestic enterprises.
The FDI spillover effects is a relatively new research topic and has received increasing
attention in recent times, especially in emerging and developing countries. As FDI inflows have
generated unexpected outcomes to the environment and the domestic economy, few researches
on technology diffusion have been conducted to clarify its complicated effects. However, by
using insufficient and obsolete data set, the evidence for productivity spillovers are still limited.
Meanwhile, there are no evidences in Vietnam for wage spillovers from foreign presence
although the theories and some empirical findings in different contexts recognize its existence.
147
In addition, the thesis primarily also focuses on identifying the moderating factors affecting the
spillover effects at firm level which have not yet been explored.
After developing the research model and methodology, the dissertation investigates
productivity spillovers and wage spillovers from foreign firms to domestically manufacturing
firms using a large panel data of Vietnamese manufacturing enterprises. The econometric
model on FDI diffusion on firm productivity (period: 2011-2015; 385,976 observations) and
wage (period: 2007-2015; 693,720 observations) is estimated by the use of the fixed-effect
model (FEM) and random effect model (REM). Hausman test is used to compare and determine
the suitability of FEM or REM. The issue relating to biased TFP estimation by the choice of
endogenous factor input combinations in the same period is overcome by the use of the Olley-
Pakes (OP) methodology. This semi-parameter estimation process allows the firm-specific
productivity gap to represent individual changes over time.
Detailed analysis and discussion of empirical research results are presented in Chapter
4. The main findings of the thesis are summarized below:
5.1.1 Productivity spillovers from FDI in Vietnam across different transmission channels
The author examines unbalanced panel data on 385,976 manufacturing firms in
Vietnam from 2011 to 2015 to find fresh evidence on FDI productivity spillover effects on
Vietnamese manufacturing firms. First, the results indicate that the horizontal and forward
spillovers associated with FDI presence in Vietnam have a negative impact on domestic firms'
TFP. It is worth to note that the adverse magnitude of horizontal spillover is quite large and
overwhelm two remaining channels of spillovers. Regarding backward spillovers, Vietnam
witnessed a reverse trend that the greater the effect of backward spillover is, the higher the
productivity local firms can reach. Despite strong evidence for dominant effects of positive
backward spillovers, it can't offset the negative outcome generated by horizontal spillovers.
148
5.1.2 Barriers and facilitators of productivity spillovers from FDI in Vietnam
Based on the findings, human capital is found as a facilitator for productivity spillovers
from foreign firms to domestic firms. Specifically, less negative horizontal spillover and more
positive backward spillover are associated with a higher level of human capital. In other words,
the acquisition of more qualified labor in local firms is a facilitator to better absorb FDI
spillovers and help domestic firms reach a higher level of productivity.
Another finding reveals that the level of technology gap matters for the productivity
spillovers from foreign firms to domestic firms. Specifically, the negative horizontal spillover
effect on the domestic firm's TFP is impressively improved with the movement of the
technology gap from the bottom 25th percentile to the middle 25th -75th percentile. On the other
hand, the relationship between backward FDI spillover and firm productivity is diminished
when the technology gap turns from the bottom 25th segment to the middle one. At the upper
percentile, there is no signal for the moderating effect of the technology gap.
It is also found that FDI spillovers in both vertical and horizontal channels do not occur
at the bottom 25th percentile of financial development. In regard to backward FDI spillover, its
effect on firm productivity is significantly enhanced with a higher level of financial
development. In contrast, horizontal FDI spillover witnesses a reverse trend when its effect on
firm's TFP is more negative at the upper level of financial development. Meanwhile, forward
FDI spillover only occurs in the middle 25th to 75th segment.
5.1.3 Productivity spillovers vary significantly across geographic and economic regions
In respect to specific regional effects, the relationship between horizontal spillover and
TFP from 2011 to 2015 is significantly negative across six geographical regions with robust
large magnitudes, except for North East & North West and Mekong River Delta. The
significantly negative magnitudes of forward spillover in Red River Delta, South East, and
Mekong River Delta have proven its existence as an important channel of FDI spillovers in
149
Vietnam. Remarkably, the study finds the significant positive effects of vertically backward
spillover on promoting firms' productivity in the host country across all six regions, except for
North East & North West. The backward FDI spillover is unexpectedly highest at Highlands
where the region receives the lowest share of inward FDI. It is followed by the most FDI-
intensive region - South East. However, the findings indicate that despite the existence of
positive backward FDI spillover, it is still small to offset unfavorable horizontal and forward
FDI spillover. Regarding economic regions, the central region holds the first position both in
receiving the most negative horizontal FDI spillover and the highest positive backward
spillover. It is followed by the South region and North region which are characterized by the
highest FDI concentration and human capital accumulation. Mekong River Delta, on the other
hand, does not receive any horizontal spillover.
5.1.4 Productivity spillovers and provincial proximity
The effect of horizontal FDI spillover on TFP is negatively robust across nine sub-areas,
except the insignificant impacts in two sub-areas “Within Ha Noi 100 km2” and “Within Hai
Phong 100 km2”. The most negative horizontal spillover occurs within Thanh Hoa 100 km2,
followed by within Binh Duong 100 and BR-VT 100 km2. The situation is not better for firms
located in the provinces outside 100 km2 of these sub-areas. In regard to backward spillover,
the positive backward externalities occur in most sub-areas, except “within Bac Giang 100
km2” and “within Hai Phong 100 km2”. On the other hand, forward FDI spillovers negatively
affect firm productivity in most sub-areas with nearby provincial proximity, except within Hai
Phong 100 km2, within Thanh Hoa 100 km2 and the outside region.
5.1.5 The effect of horizontal spillovers from FDI on the average wage
This study aims to investigate the effect of horizontal spillover from FDI and trade
openness on the average wage in Vietnam using 2007-2015 unbalanced panel data from
693,720 observations. Ownership type is also added to the econometric model as a moderating
150
variable to examine whether ownership types and their inherent characteristics influence wage
spillovers from foreign presence. Finally, independent variables such as firm size, real output,
net income, capital intensity, gender ratio, and market share are included as important
predictors of the average wage.
The findings indicate that the overall effect of FDI on the average wage in Vietnam is
significantly positive, except for domestic private firms. These results are supported by both
theoretical and empirical evidence of the two mechanisms of wage spillovers from FDI: labor
market competition and productivity improvement. Also, private firms in Vietnam often
employ unskilled workers. Thus, wage policies for unskilled workers in this sector may be
negatively affected by the foreign presence and government regulations on wages.
5.2 Academic contributions
Regarding theoretical contributions, the theoretical reviews in influential research work
by (Aitken et al., 1997; Blomstrom & Kokko, 1998; Caves, 1974; Wang et al., 2012) figure out
two main streams of FDI spillover occurring through productivity spillovers and market access
spillovers. While productivity spillovers are very important for emerging economies to
stimulate economic growth and national better-off, market access spillovers appear to be highly
attached to developed or relatively powerful economies. Some authors also argue that market
access spillovers; for example, export spillovers may almost be absorbed and revealed in better
economies of scale and productivity improvement (Anwar & Sun, 2016; Suyanto, Bloch, &
Salim, 2012).
In addition, the term “technological spillovers from FDI” is often misused by many
researchers to imply the same phenomenon of productivity spillovers (Rojec & Knell, 2017).
Indeed, the positive productivity spillovers associated with FDI is an inevitable consequence
of technological advances and market expansion. Therefore, under the context of Vietnam's
151
economy, this study focuses on productivity spillover associated with FDI as this important
phenomenon offers the best opportunities for domestic firms in the host country observe,
imitate and upgrade their existing technology and inherit the advanced business practices to
improve their firm's productivity at a lower cost. While previous studies in Vietnam, from
worker perspectives, try to figure out the wage differentials between foreign sector and
domestic sector (Nguyen, 2015; Nguyen & Ramstetter, 2017), this study further complicates
the matter and contributes to the current literature by exploring the wage spillovers from FDI
as the channel to increase labor compensation and welfare. To provide a more comprehensive
picture of the direct and indirect effects of inward FDI on firm productivity and wage, the
dissertation has developed a conceptual framework reflecting the relevant theoretical concepts
and the relationships among these elements.
Besides, the author also identifies and figures out the other theoretical and empirical
research gaps reflecting in some biased findings and insufficient discussions in some previous
studies. First, MNCs are not only powerful in sustaining their subsidiaries' comparative
advantage in terms of technological advances and intellectual assets but also effective at
preventing the spillovers of these advantages to other firms. As a result, FDI spillovers,
especially the leakages of sophisticated technology generating outstanding effects on host
firm's productivity less likely to occur (Perri & Andersson, 2014; Perri & Peruffo, 2016). This
contributes to explain why the negative competition effect often outweighs the sum of
imitation, demonstration and worker mobility effects via horizontal spillover channel. Second,
the FDI spillover theories have discussed the high probability that domestic firms’ productivity
will be lower in response to higher competition pressure from superior foreign competitors in
the host market (Görg & Greenaway, 2004; Mollisi & Gabriele, 2017). Third, positive
externalities may only occur in some subgroups of firms with the convergence of specific
characteristics. This has been addressed in the thesis that firm absorptive capacity,
152
heterogeneity, regional and industrial differences matter for the productivity and wage
spillovers from FDI. Fourth, conventional studies on FDI spillovers tend to omit or
underestimate FDI spillovers via vertical channels while the thesis findings indicate robust
vertical spillovers through both upstream and downstream integration. Finally, FDI spillover
presence, as well as its extent and magnitude, are also attached to the host country's macro
factors such as institutional quality, well-functioning markets, undistorted FDI and trade, etc.
As admitted in the limitation part, the thesis does not capture the effects of these macro
determinants. However, this may leave room for further researches exploring more macro
indicators from the host country's perspectives.
Concerning methodological contribution, the thesis firstly builds a research model for
estimating productivity spillovers and wage spillovers from FDI. Besides, instead of using only
one indicator as in most of the previous studies, the thesis further complicates the FDI presence
by measuring three dimensions of spillovers. The use of multi-dimensional indicators can help
to compare and have a more comprehensive assessment of the FDI spillover effects. Besides,
the combination uses of FEM, REM and GMM approaches help reinforce the robustness of
research findings. Secondly, the dissertation explores moderating variables related to firm
absorptive capacity, heterogeneity and geographical proximity that interact with FDI spillovers
to consider whether these variables matter for the different outcomes of productivity spillovers
from foreign firms to domestic firms. It has been shown in the research results that productivity
and wage diffusion vary significantly across firms and regions with specific characteristics.
Finally, the research results from the latest panel data (2007-2015) will provide the up-to-date
empirical findings and implications for FDI spillover effects in Vietnam which is useful for
managers, policy-makers and further researchers concerning inward FDI spillovers.
153
5.3 Implications
5.3.1 Implications at policy-maker level
The role of FDI capital, as well as the operation of FDI enterprises in Vietnam, are
positively recognized by researchers, policymakers, and managers through a wide range of
activities such as interacting, associating, speeding up the process of renovation and boosting
Vietnam's economy. However, the process of attracting FDI as well as the activities of these
enterprises in Vietnam is posing many challenges.
Based on the findings, the study has come up with some practically economic implications.
The findings have provided strong evidence for the important role of backward FDI spillover
in enhancing the productivity level of domestically manufacturing firms in Vietnam. However,
the positive externalities from backward spillovers have unexpectedly been outweighed by
intensively negative horizontal and forward spillovers. It is important to note that FDI inflows
incur both unpredictable costs and benefits. The findings have revealed the role of human
capital and financial development in facilitating productivity spillover from FDI. Therefore,
investing in human capital and financial development is the most important keys to unlock the
door to absorb advanced technology and knowledge.
Firstly, instead of the attempts to increase the volume of FDI inflows, the government
should have proper policies aiming at enhancing the absorptive capacity of local firms. This
may provide an effective tool to protect the new domestically emerging industries in Vietnam
from the fierce competition as a result of foreign presence. Moreover, the government should
create favorable conditions; for example, a better financial system, effective and transparent
administrative services to facilitate local firms' business activities, develop their skills and
absorptive capabilities to sustain the competitiveness or the local supply chains with foreign
subsidiaries. In this way, the government should have appropriate financial incentives for
154
technology transfer activities, especially activities related to the transfer of technology in the
supporting or embedded industry. Besides, more government expenditures on infrastructure,
R&D, education, and training may generate spectacular changes in narrowing down the gap in
human capital and technology level between Vietnam and more developed economies. Another
challenge and opportunity for Vietnam's economy come from the evolution of Industry 4.0.
The speedy development of technological achievements and smart applications in the context
of Industry 4.0 is blurring and rapidly weakening the attractiveness from the production factors
considered to be "advantages" in emerging labor markets such as "cheap labor force" and "in-
kind incentives". In addition, Vietnam needs to take into account the ability to shift investment
back to its home country, which is supported by digital transformation, specialization,
automation, combined with artificial intelligence that combines increasingly efficient use of
labor and machinery.
Secondly, as foreign investors are often motivated by low labor cost and preferential policies
and not every MNCs are sources of knowledge spillovers, Vietnam needs to implement
procedure reforms to compete for higher quality FDI flows with more potentials for managerial
and technological transfer. Thereby, these domestic firms can maintain and attract foreign
investors from higher-income economies which possess advanced technology and process.
Besides, they are more likely to deliver their knowledge to their partners in the backward and
forward linkage chain to upgrade and standardize the local supply for stable production and
sustain their consumption market. Although the presence of FDI enterprises has played an
important role in helping Vietnam maintain a rapid growth rate in the past few decades, it has
also increased the pressure on the environment. Typical negative impacts include water
degradation, soil degradation, and erosion, increasing greenhouse gas emissions and air
pollution, and putting pressure on biodiversity. Therefore, the most challenging duty is to
155
maintain an attractive environment for foreign investors associated with harmonious
development and environmental protection.
Thirdly, it is necessary to create a truly fair business environment for both domestic and
foreign enterprises to compete healthily and cooperate based on a mutually beneficial
relationship. To achieve this goal, the government needs to support domestic enterprises to
increase their capabilities and their scale to reinforce their readiness to participate in the linkage
chain with foreign partners with diversified local advantages in different regions. This may
encourage foreign firms to invest in under-developed regions and make positive FDI
externalities more accessible. Accordingly, it is necessary to ensure the selection of FDI
projects towards high and medium technology industries; promote the connection between FDI
enterprises and domestic enterprises; especially support the development and implementation
of appropriate priority policies and the orientation of supporting industries toward global and
regional production networks and value chains; develop and implement policies to encourage
expert advice, technology solutions and human resource training. At the same time, the
organization’s openness and desires for innovation may be the drivers for the spread of
advanced technologies and knowledge from foreign-invested enterprises to domestic ones.
Fourthly, the impetus for attracting FDI of Vietnam in the coming time will be
maintained by Vietnam's efforts to persistently international integration, strong commitment to
opening markets, elimination of trade and investment barriers through FTAs such as the
Comprehensive and Progressive Agreement for Trans-Pacific Partnership (CPTPP) and the
Free Trade Agreement - EU (EVFTA). It is also admitted that trade tensions between the US
and China may affect investor sentiment and may accelerate the trend of shifting investment to
other potential markets. Vietnam is an attractive destination in that context. Hence, the
renovation of Vietnam should continue to be reinforced, aim at reducing many business
conditions, improving the transparency of administrative procedures as well as supporting
156
entrepreneurship and private sector development. On the other hand, Vietnam needs to take
into account the risk of becoming an out-of-date technological transfer point of investors,
especially with capital inflows from China. The roadmap for implementing China's Made in
China 2025 will inevitably lead to the need to replace and renew technology, putting pressure
on obsolete technologies to less developed countries, especially neighboring countries like
Vietnam. Under these circumstances, Vietnam must consistently promote reform, reduce
barriers, eliminate unreasonable business conditions, and create an environment that promotes
innovation. In addition to investment in infrastructure development, to maintain attractiveness
to investors, it is necessary to increase investment in scientific and technological research to
"catch up" with technology trends; at the same time, create a platform to attract and retain
talents, create dynamic and attractive competitive forces with high-tech FDI industries.
Finally, wage development is sustainable if it is based on productivity improvement
and cost efficiency rather than temporary labor demand. Increasing inward foreign equity and
international trade may have different or even strongly negative impacts on wages in the short
and long run depending on the movement from labor-intensive production to capital and
technology-intensive production. In this context, the abundant resources of unskilled labor in
Vietnam are no longer an advantage but a threat to the survival of local firms and worker
benefits. Therefore, policymakers need to take advantage of foreign presence and trade to
create favorable conditions for preparing and training the existing labor force in Vietnam. In
this way, local workers are proactive and ready in absorbing knowledge and productivity
spillovers as well as improving their income and bargaining power.
5.3.2 Implications at managerial level
From the managerial perspectives, the study raises some practical implications for local
firms’ top management in Vietnam. In the context of regional and international expansion,
businesses have no other way to invest in technological innovation, improve the quality of the
157
workforce, build business strategies, brands and gradually accumulate capital to increase
production capacity, labor productivity and competitiveness. Especially, firms operating in
upstream sectors (input supply) need to improve the quality of their products, standardize their
supply chain to meet the requirements of foreign firms, and gradually increase their
competitiveness from the local scale to a world scale. In addition, Vietnamese firms in direct
competition with foreign subsidiaries can increase the value of their products, brand names,
and reputations for market expansion and learn and achieve long-term benefits of inward FDI
by investing in absorptive capability.
Furthermore, as Vietnam has been becoming a destination for international investors,
changing the orientation and policies to attract FDI will surely bring more MNCs to invest and
do business in our country. It is a great opportunity for Vietnamese enterprises to participate in
the global product supply chain. However, the ability to turn that opportunity into reality
depends on the capacity of the management staff, especially the head of the business. The
business leaders should be confident and proactive in approaching large enterprises and MNCs
to create cooperation relationships in signing and implementing contracts, gradually creating a
foothold in the product supply chain of each corporation. It is worth to note that CEOs must
approach management thinking in a modern way, attempt to operate toward both quality and
efficiency, build trust with partners and build the reputation of the business, even in terms of
paying salaries and income. In the long run, businesses must rely on higher labor productivity
and better product quality to raise income for employees.
Last but not least, a professional business association could play an important role in
the distribution and cooperation of product supply chains. Many associations such as textiles,
footwear, handbags, food, seafood, pepper have gained positive outcomes in developing
business strategies, building and promoting brands, finding partners, promoting trade and
investment as well as recommending preferential policies to the State. However, the supply
158
chain linkages still confront technology, quality, price and process issues that need to be
addressed. Besides, business associations have a supportive relationship to facilitate business
development under foreign presence and provide a wide range of solutions for a better global
expansion strategy. Therefore, business executives should be proactive in participating in
professional associations to build networking, looking for opportunities, getting solutions and
adapting more quickly to the industry and business environment changes.
5.4 Limitations and Future Research
Although the author has made plenty of efforts in the thesis implementation process to
achieve the research objectives, this research still has certain limitations. Later studies can
inherit and expand this study by overcoming some of the following limitations. Firstly, due to
data limitations, the econometric model in this thesis does not control the impact of host macro
factors (such as exchange rate, growth, inflation), explore whether the level of these macro
factors affecting productivity and wage spillovers from FDI as well as the subsidiaries'
heterogeneities and origins of inward FDI volumes. This generates rooms for further researches
in addressing the impact of the host country's macro factors and foreign affiliates'
characteristics to enrich the literature of FDI spillovers.
Secondly, subsequent studies can access and use longer panel data sets to control late
impacts and provide more comprehensive assessments of spillover effects from FDI over time.
The study also has several limitations in estimation capacity and access to a larger dataset.
Although STATA software and proper data treatment syntaxes can handle large unbalanced
datasets with no problem, some proxies cannot be calculated as initial expectations due to
insufficient observations. The proxy for absorptive capacity could be improved with the
inclusion of R&D expenditures. Furthermore, data on the physical distance between foreign
firms’ locations and local firms are not available. Thus, the scale “within 100 sq. km.” is to
some extent inadequate for capturing geographical proximity.

159
Finally, although the model of FEM with the robustness check by GMM has many
advantages in estimating panel data, especially in studying the productivity diffusion from FDI,
there are still some limitations in overcoming the endogenous issue. Therefore, subsequent
studies may employ additional methods with instrument variables such as 3SLS to more
effectively control the possibility of endogenous problems.
I
LIST OF RELEVANT PUBLICATIONS
ISI Indexed publications
ISI/SSCI: Huynh, T. N. Hien, Nguyen, P. V., Trieu, H. D., & Tran, K. T. (2019). Productivity
Spillover from FDI to Domestic Firms across Six Regions in Vietnam. Emerging Markets
Finance and Trade, 1-17.
Accepted paper (ISI/ESCI): Nguyen V. Phuong, Huynh T. N. Hien, Trieu D. X. Hoa, Khoa
T. Tran, Nguyen H. P. Dung (Confirmed: June, 2020). Horizontal spillovers from FDI, trade
and average wages: Evidence from Vietnamese enterprises. Review of Pacific Basin Financial
Markets and Policies.
Peer-reviewed international journals or SCOPUS
Nguyen, P. V., Tran, K. T., Le, H. C. P., Trieu, H. D. X., & Huynh, H. T. N. (2019). Technology
spillovers in the electronics and mechanical industries: the roles of ownership structure and
wage and training costs in Vietnam. Journal for Global Business Advancement, 12(2), 212-
231.
Huynh, H. T., Tran, K. T., Nguyen, P. V., Le, N. T., & Trieu, H. D. (2019). Estimating inward
regional FDI spillover in Vietnamese manufacturing firms: ownership structure and firm
characteristics. Journal for Global Business Advancement, 12(4), 542-563.
ESCI indexed:
Thi Ngoc Huynh, H., V Nguyen, P., & T Tran, K. (2018). Internationalization and Performance
of Vietnamese Manufacturing Firms: Does Organizational Slack Matter? Administrative
Sciences, 8(4), 64.
Nguyen, P. V., Huynh, H. T. N., Trieu, H. D. X., & Tran, K. T. (2019). Internationalization,
Strategic Slack Resources, and Firm Performance: The Case Study of Vietnamese
Enterprises. Journal of Risk and Financial Management, 12(3), 144.
II
REFERENCES
Abugri, B. A., & Soydemir, G. A. (2002). The U.S. Productivity Figures and Foreign Direct
Investment in Japan. Review of Pacific Basin Financial Markets and Policies, 05(01),
53–69. https://doi.org/10.1142/s0219091502000699
Ahmed, E. M. (2012). Are the FDI inflow spillover effects on Malaysia’s economic growth
input driven? Economic Modelling, 29(4), 1498–1504.
https://doi.org/10.1016/j.econmod.2012.04.010
Aitken, B. B. J., & Harrison, A. N. N. E. (1999). Do Domestic Firms Benefit from Direct
Foreign Investment ? Evidence from Venezuela. The American Economic Review,
89(3), 605–618.
Aitken, B., Hanson, G., & Harrison, A. (1997). Spillovers, foreign investment, and export
behavior. Journal of International Economics, 43, 103–132.
https://doi.org/10.1016/S0022-1996(96)01464-X
Aitken, B. J., & Harrison, A. E. (2013). Do Domestic Firms Benefit from Direct Foreign
Investment ? Evidence from Venezuela, 89(3), 605–618.
Amber, Y. (2014). Borders and distance in knowledge spillovers : Dying over time or dying
with age ? — Evidence from patent citations. European Economic Review, 71, 152–
172. https://doi.org/10.1016/j.euroecorev.2014.07.005
Anwar, S., & Nguyen, L. P. (2010). Foreign direct investment and economic growth in
Vietnam. Asia Pacific Business Review, 16(1–2), 183–202.
https://doi.org/10.1080/10438590802511031
Anwar, S., & Nguyen, L. P. (2011a). Foreign direct investment and export spillovers:
Evidence from Vietnam. International Business Review, 20(2), 177–193.
https://doi.org/10.1016/j.ibusrev.2010.11.002
Anwar, S., & Nguyen, L. P. (2011b). Foreign direct investment and trade: The case of
III
Vietnam. Research in International Business and Finance, 25(1), 39–52.
https://doi.org/10.1016/j.ribaf.2010.05.004
Anwar, S., & Nguyen, L. P. (2014). Is foreign direct investment productive? A case study of
the regions of Vietnam. Journal of Business Research, 67(7), 1376–1387.
https://doi.org/10.1016/j.jbusres.2013.08.015
Anwar, S., & Phi, L. (2011). Foreign direct investment and export spillovers : Evidence
from Vietnam. International Business Review, 20(2), 177–193.
https://doi.org/10.1016/j.ibusrev.2010.11.002
Anwar, S., & Sun, S. (2012). FDI and market entry/exit: Evidence from China. Journal of
Asian Economics, 23(5), 487–498. https://doi.org/10.1016/j.asieco.2012.04.003
Anwar, S., & Sun, S. (2014). Heterogeneity and curvilinearity of FDI-related productivity
spillovers in China’s manufacturing sector. Economic Modelling, 41, 23–32.
https://doi.org/10.1016/j.econmod.2014.03.021
Anwar, S., & Sun, S. (2016). Foreign direct investment, domestic sales and exports of local
firms: a regional perspective from China. Journal of the Asia Pacific Economy, 21(3),
325–338. https://doi.org/10.1080/13547860.2016.1176640
Anwar, S., Sun, S., & Anwar, S. (2018). Firm heterogeneity and FDI-related productivity
spillovers : A theoretical investigation Firm heterogeneity and FDI-related productivity
spillovers : A theoretical investigation. The Journal of International Trade &Economic
Development, 0(0), 1–10. https://doi.org/10.1080/09638199.2018.1482947
Arbache, J. S., Dickerson, A., & Green, F. (2004). Trade Liberalisaztion and Wages in
Developing Countries. Society, 114, 73–96. https://doi.org/10.1111/j.0013-
0133.2004.00188.x
Arellano, M., & Bond, S. (1991). Some tests of specification for panel data: Monte Carlo
evidence and an application to employment equations. The Review of Economic Studies,
IV
58(2), 277–297.
Arellano, M., & Bover, O. (1995). Another look at the instrumental variable estimation of
error-components models. Journal of Econometrics, 68(1), 29–51.
Assembly, T. H. E. N., Republic, S., & Investment, L. A. W. O. N. (2014). Vietnam 67-2014
Law on investment, (67), 1–50.
Balasubramanyam, V. N., Salisu, M., & Sapsford, D. (2006). Foreign Direct Investment and
Growth in EP and is Countries. The Economic Journal, 106(434), 92.
https://doi.org/10.2307/2234933
Baloc, R. A., Sha, N., & Panhwar, K. N. (2014). The relationship of slack resources with
subjective wellbeing at work: empirical study of sugar mills from Pakistan. International
Strategic Management Review, 2(2), 89–97. https://doi.org/10.1016/j.ism.2014.10.002
Barnes, T., Roose, J. M., Heap, L., & Turner, B. S. (2016). Employment, spillovers and
“decent work”: Challenging the Productivity Commission’s auto industry narrative.
Economic and Labour Relations Review, 27(2), 215–230.
https://doi.org/10.1177/1035304616649303
Barrios, S., Görg, H., & Strobl, E. (2011). Spillovers through backward linkages from
multinationals: Measurement matters! European Economic Review, 55(6), 862–875.
https://doi.org/10.1016/j.euroecorev.2010.10.002
Baum, C. F. (2013). Dynamic panel data estimators. Applied Econometrics, EC823, 88.
Becker, G. S. (1975). Human Capital. A Theoretical and Empirical Analysis with special
Reference to Education. The National Bureau of Economic Research, 3, 1–22.
Behera, S. R. (2017). Regional foreign direct investment and technology spillover: evidence
across different clusters in India. Economics of Innovation and New Technology, 26(7),
596–620. https://doi.org/10.1080/10438599.2016.1254850
Bellak, C. (2004). How domestic and foreign firms differ and why does it matter? Journal of
V
Economic Surveys, 18(4), 483–514. https://doi.org/10.1111/j.0950-0804.2004.00228.x
Ben Hamida, L., & Gugler, P. (2009). Are there demonstration-related spillovers from FDI?.
Evidence from Switzerland. International Business Review, 18(5), 494–508.
https://doi.org/10.1016/j.ibusrev.2009.06.004
Beugelsdijk, S., Smeets, R., & Zwinkels, R. (2008). The impact of horizontal and vertical
FDI on host’s country economic growth. International Business Review, 17(4), 452–472.
https://doi.org/10.1016/j.ibusrev.2008.02.004
Bhaduri, A., & Marglin, S. (1990). Unemployment and the real wage: the economic basis for
contesting political ideologies. Cambridge Journal of Economic, 14(4), 375–393.
https://doi.org/bhaduri
Blalock, G., & Gertler, P. J. (2009). How firm capabilities affect who benefits from foreign
technology. Journal of Development Economics, 90(2), 192–199.
https://doi.org/10.1016/j.jdeveco.2008.11.011
Blau, F. D., & Kahn, L. M. (2007). The Gender Earnings Gap : Learning from International
Comparisons The Gender Earnings Gap : Learning from International Comparisons,
82(2), 533–538.
Blomstrom, M., & Kokko, A. (1998). Multinational Corporations and Spillovers. Journal of
Economic Surveys, 12(3), 247–277. https://doi.org/10.1111/1467-6419.00056
Blomström, M., & Persson, H. (1983). Foreign investment and spillover efficiency in an
underdeveloped economy: Evidence from the Mexican manufacturing industry. World
Development, 11(6), 493–501. https://doi.org/10.1016/0305-750X(83)90016-5
Blomström, M., & Sjöholm, F. (1999). Technology transfer and spillovers: Does local
participation with multinationals matter? European Economic Review, 43(4–6), 915–
923. https://doi.org/10.1016/S0014-2921(98)00104-4
Blundell, R., & Bond, S. (2000). GMM estimation with persistent panel data: an application
VI
to production functions. Econometric Reviews, 19(3), 321–340.
Blundell, R., Bond, S., & Windmeijer, F. (2001). Estimation in dynamic panel data models:
improving on the performance of the standard GMM estimator. In Nonstationary panels,
panel cointegration, and dynamic panels (pp. 53–91). Emerald Group Publishing
Limited.
Boddewyn, J. J. (1985). Theories of Foreign Direct Investment and Divestment: A
Classificatory Note. Management International Review, 25(1), 57–65. Retrieved from
http://search.ebscohost.com/login.aspx?direct=true&db=bth&AN=12249329&site=ehost
-live
Bond, S. R. (2002). Dynamic panel data models: a guide to micro data methods and practice.
Portuguese Economic Journal, 1(2), 141–162.
Bourgeois, L. J. (1981). On the measurement of organizational slack. Academy of
Management Review, 6(1), 29–39.
Brewer, T. L. (1992). GOVERNMENT POLICIES, MARKET IMPERFECTIONS, AND
FOREIGN DIRECT INVESTMENT Thomas L. Brewer* Georgetown University,
(April), 101–120.
Buckley, P. J., Wang, C., & Clegg, J. (2007). The impact of foreign ownership, local
ownership and industry characteristics on spillover benefits from foreign direct
investment in China. International Business Review, 16(2), 142–158.
https://doi.org/10.1016/j.ibusrev.2006.12.006
Byun, H.-Y., & Wang, Y. (1995). Technology transfer and multinational corporations: The
case of South Korea. Journal of Asian Economics, 6(2), 201–216.
https://doi.org/10.1016/1049-0078(95)90012-8
Calvet, A. L. (2014). A synthesis of foreign direct investment theories and theories of the
multinational firm**A. L. Calvet is Assistant Professor at the Faculty of Administration
VII
at the University of Ottawa. This paper is based upon his doctoral dissertation
completed at M.I. International Accounting and Transnational Decisions. Butterworth &
Co. (Publishers) Ltd. https://doi.org/10.1016/b978-0-408-10841-6.50026-9
Carluccio, J., & Fally, T. (2013). Foreign entry and spillovers with technological
incompatibilities in the supply chain ☆. Journal of International Economics, 90(1), 123–
135. https://doi.org/10.1016/j.jinteco.2012.08.004
Caves, R. E. (1974). Multinational Firms, Competition, and Productivity in Host-Country
Markets. Economica, 41(162), 176–193. https://doi.org/10.2307/2553765
Chen, T., Ku, Y.-H., & Liu, M.-C. (2018). Direct investment in low-wage and high-wage
countries: The case of Taiwan. In Corporate links and foreign direct investment in Asia
and the Pacific (pp. 262–274). Routledge.
Chen, Zhao, Poncet, S., & Xiong, R. (2017). Inter-industry relatedness and industrial-policy
efficiency: Evidence from China’s export processing zones. Journal of Comparative
Economics, 45(4), 809–826. https://doi.org/10.1016/j.jce.2016.01.003
Chen, Zhihong, Ge, Y., Lai, H., & Wan, C. (2013). Globalization and Gender Wage
Inequality in China. World Development, 44, 256–266.
https://doi.org/10.1016/j.worlddev.2012.11.007
Chew, S. B., & Teo, C. (2002). A Causality Study of the Relations between Wage and
Employment in Specific OECD Countries. Review of Pacific Basin Financial Markets
and Policies, 04(01), 45–68. https://doi.org/10.1142/s0219091501000310
Chittoor, R. (2009). Internationalization Need for New Theorizing Economy Emergence of
Third World MNCs. Indian Journal of Industrial Relations, 45(1), 27–40.
Chiu, S. Y., & Chuang, H. L. (2016). Employability and Wage Compensation in an Asian
Economy: Evidence for Female College Graduates in Taiwan. Emerging Markets
Finance and Trade, 52(4), 853–868. https://doi.org/10.1080/1540496X.2015.1117844
VIII
Choi, B. Y., & Pyun, J. H. (2017). Industry FDI and the Distribution of Plant Productivity:
Analysis Using Korean Plant-Level Data. Developing Economies, 55(2), 105–129.
https://doi.org/10.1111/deve.12127
Christophe, S. E., & Pfeiffer, R. J. (2002). The valuation of MNC international operations
during the 1990s. Review of Quantitative Finance and Accounting, 18(2), 119–138.
https://doi.org/10.1023/A:1014513001321
Chuang, H.-L., Lin, E. S., & Chiu, S.-Y. (2018). The gender wage gap in the financial
industry: Evidence from the interindustry ranking. International Review of Economics &
Finance, 55, 246–258. https://doi.org/https://doi.org/10.1016/j.iref.2017.07.016
Chuang, H. L., Lin, E. S., & Chiu, S. Y. (2018). The gender wage gap in the financial
industry: Evidence from the interindustry ranking. International Review of Economics
and Finance, 55, 246–258. https://doi.org/10.1016/j.iref.2017.07.016
Chung, S. (2014). Environmental regulation and foreign direct investment: Evidence from
South Korea. Journal of Development Economics, 108, 222–236.
https://doi.org/10.1016/j.jdeveco.2014.01.003
Conti, G., Lo Turco, A., & Maggioni, D. (2014). Spillovers through backward linkages and
the export performance of business services. Evidence from a sample of Italian firms.
International Business Review, 23(3), 552–565.
https://doi.org/10.1016/j.ibusrev.2013.09.003
Contractor, F. J., Kumar, V., & Kundu, S. K. (2007). Nature of the relationship between
international expansion and performance: The case of emerging market firms. Journal of
World Business. https://doi.org/10.1016/j.jwb.2007.06.003
Damijan, J. P., Rojec, M., Majcen, B., & Knell, M. (2013a). Impact of firm heterogeneity on
direct and spillover effects of FDI: Micro-evidence from ten transition countries.
Journal of Comparative Economics, 41(3), 895–922.
IX
https://doi.org/10.1016/j.jce.2012.12.001
Damijan, J. P., Rojec, M., Majcen, B., & Knell, M. (2013b). Impact of firm heterogeneity on
direct and spillover effects of FDI: Micro-evidence from ten transition countries.
Journal of Comparative Economics, 41(3), 895–922.
https://doi.org/https://doi.org/10.1016/j.jce.2012.12.001
Dang, D. A. (2013). How foreign direct investment promote institutional quality: Evidence
from Vietnam. Journal of Comparative Economics, 41(4), 1054–1072.
https://doi.org/10.1016/j.jce.2013.05.010
David, P. A., & Rosenbloom, J. L. (1990). Marshallian factor market externalities and the
dynamics of industrial localization. Journal of Urban Economics.
https://doi.org/10.1016/0094-1190(90)90033-J
Decreuse, & Maarek. (2015). FDI and the Labor Share in Developing Countries: A Theory
and Some Evidence. Annals of Economics and Statistics, (119/120), 289.
https://doi.org/10.15609/annaeconstat2009.119-120.289
Demena, Binyam A., & van Bergeijk, P. A. G. (2017). a Meta-Analysis of Fdi and
Productivity Spillovers in Developing Countries. Journal of Economic Surveys, 31(2),
546–571. https://doi.org/10.1111/joes.12146
Demena, Binyam Afewerk. (2015). Publication bias in FDI spillovers in developing
countries: a meta-regression analysis. Applied Economics Letters, 22(14), 1170–1174.
https://doi.org/10.1080/13504851.2015.1013604
Demena, Binyam Afewerk, & Bergeijk, P. A. G. Van. (2019). Observing FDI spillover
transmission channels : evidence from firms in Uganda Observing FDI spillover
transmission channels : evidence from firms in Uganda. Third World Quarterly, 0(0),
1–22. https://doi.org/10.1080/01436597.2019.1596022
Demena, Binyam Afewerk, & Murshed, S. M. (2018a). Transmission channels matter :
X
Identifying spillovers from FDI Transmission channels matter : Identifying spillovers
from FDI, 8199. https://doi.org/10.1080/09638199.2018.1439083
Demena, Binyam Afewerk, & Murshed, S. M. (2018b). Transmission channels matter:
Identifying spillovers from FDI. Journal of International Trade and Economic
Development, 27(7), 701–728. https://doi.org/10.1080/09638199.2018.1439083
Demir, F. (2016). Effects of FDI Flows on Institutional Development: Does It Matter Where
the Investors are from? World Development, 78, 341–359.
https://doi.org/10.1016/j.worlddev.2015.10.001
Denisia, V. (2010). Foreign Direct Investment Theories: An Overview of the Main FDI
Theories. 8-15 From International Trade to Firm …, 53–59. Retrieved from
http://papers.ssrn.com/sol3/papers.cfm?abstract_id=1804514
DIMELIS *, S. P. (2005). Spillovers from foreign direct investment and firm growth:
technological, financial and market structure effects. International Journal of the
Economics of Business, 12(1), 85–104. https://doi.org/10.1080/1357151042000323094
Dominguez, N., & Mayrhofer, U. (2015). Internationalization stages of traditional SMEs:
Increasing, decreasing and re-increasing commitment to foreign markets. International
Business Review, (2016). https://doi.org/10.1016/j.ibusrev.2017.03.010
Driffield, N. (2004). Regional policy and spillovers from FDI in the UK. Annals of Regional
Science, 38(4), 579–594. https://doi.org/10.1007/s00168-003-0174-5
Du, L., Harrison, A., & Jefferson, G. H. (2012). Testing for horizontal and vertical foreign
investment spillovers in China, 1998-2007. Journal of Asian Economics, 23(3), 234–
243. https://doi.org/10.1016/j.asieco.2011.01.001
Dunning, J. H. (2000). The eclectic paradigm as an envelope for economic and business
theories of MNE activity, 9, 163–190.
Earle, J. S. (2017). Foreign ownership and wages: evidence from hungary, 1986–2008 ´, (X),
XI
1–34. https://doi.org/10.1177/0019793917700087.
Ekholm, K., Forslid, R., & Markusen, J. R. (2007). Export-platform foreign direct
investment. Journal of the European Economic Association, 5(4), 776–795.
https://doi.org/10.1162/JEEA.2007.5.4.776
Fatima, S. T. (2016). Productivity spillovers from foreign direct investment: Evidence from
turkish micro-level data. Journal of International Trade and Economic Development,
25(3), 291–324. https://doi.org/10.1080/09638199.2015.1050057
Fatima, S. T. (2017). Absorptive Capacity and FDI Spillovers: Evidence from Quantile
Regressions. International Trade Journal, 31(4), 360–385.
https://doi.org/10.1080/08853908.2017.1301277
Feenstra, R. C., & Hanson, G. H. (1997). Foreign direct investment and relative wages:
Evidence from Mexico’s maquiladoras. Journal of International Economics, 42(3–4),
371–393. https://doi.org/10.1016/S0022-1996(96)01475-4
Figini, P., & Görg, H. (2011). Does foreign direct investment affect wage inequality? An
empirical investigation. World Economy, 34(9), 1455–1475.
https://doi.org/10.1111/j.1467-9701.2011.01397.x
FORTE, R., & MOURA, R. (2013). the Effects of Foreign Direct Investment on the Host
Country’S Economic Growth: Theory and Empirical Evidence. The Singapore
Economic Review, 58(03), 1350017. https://doi.org/10.1142/s0217590813500173
Fosfuri, A., Motta, M., & Rønde, T. (2001). Foreign direct investment and spillovers through
workers’ mobility. Journal of International Economics, 53(1), 205–222.
https://doi.org/10.1016/S0022-1996(00)00069-6
Friedman, J. (2004). Firm ownership and internal labour practices in a transition economy:
An exploration of worker skill acquisition in Vietnam. Economics of Transition, 12(2),
333–366. https://doi.org/10.1111/j.0967-0750.2004.00181.x
XII
Fukase, E. (2014). Foreign wage premium, gender and education: Insights from Vietnam
household surveys. World Economy, 37(6), 834–855.
https://doi.org/10.1111/twec.12103
Girma, S, & Greenaway, D. (2013). “Who Benefits from Foreign Direct Investment in the
United Kingdom?” more than 10 Years on. Scottish Journal of Political Economy,
60(5), 575–577. https://doi.org/10.1111/sjpe.12030
Girma, Sourafel. (2005). Absorptive capacity and productivity spillovers from FDI: A
threshold regression analysis. Oxford Bulletin of Economics and Statistics, 67(3), 281–
306. https://doi.org/10.1111/j.1468-0084.2005.00120.x
Girma, Sourafel, Gong, Y., G??rg, H., & Lancheros, S. (2015). Estimating direct and indirect
effects of foreign direct investment on firm productivity in the presence of interactions
between firms. Journal of International Economics, 95(1), 157–169.
https://doi.org/10.1016/j.jinteco.2014.11.007
Girma, Sourafel, Görg, H., & Pisu, M. (2008). Exporting, linkages and productivity spillovers
from foreign direct investment. Canadian Journal of Economics, 41(1), 320–340.
https://doi.org/10.1111/j.1365-2966.2008.00465.x
Girma, Sourafel, & Wakelin, K. (2007). Local productivity spillovers from foreign direct
investment in the U . K . electronics industry, 37, 399–412.
https://doi.org/10.1016/j.regsciurbeco.2006.11.006
Giroud, A. (2007). MNEs vertical linkages: The experience of Vietnam after Malaysia.
International Business Review, 16(2), 159–176.
https://doi.org/10.1016/j.ibusrev.2006.11.003
Giroud, A., & Scott-Kennel, J. (2009). MNE linkages in international business: A framework
for analysis. International Business Review, 18(6), 555–566.
https://doi.org/10.1016/j.ibusrev.2009.07.004
XIII
Globerman, S. (1979). Foreign direct investment and ’ spillover ’ efficiency benefits in
Canadian manufacturing industries. Canadian Journal of Economics, 12(1), 42–56.
https://doi.org/10.2307/134570
Goh, A. T. (2005). Knowledge diffusion, input supplier’s technological effort and technology
transfer via vertical relationships. Journal of International Economics, 66(2), 527–540.
https://doi.org/10.1016/j.jinteco.2004.06.010
Görg, H., & Greenaway, D. (2004). Much ado about nothing? Do domestic firms really
benefit from foreign direct investment? World Bank Research Observer, 19(2), 171–
197. https://doi.org/10.1093/wbro/lkh019
Görg, H., Strobl, E., & Walsh, F. (2007). Why do foreign-owned firms pay more? the role of
on-the-job training. Review of World Economics, 143(3), 464–482.
https://doi.org/10.1007/s10290-007-0117-9
Gorodnichenko, Y., Svejnar, J., & Terrell, K. (2014a). When does FDI have positive
spillovers? Evidence from 17 transition market economies. Journal of Comparative
Economics, 42(4), 954–969. https://doi.org/10.1016/j.jce.2014.08.003
Gorodnichenko, Y., Svejnar, J., & Terrell, K. (2014b). When does FDI have positive
spillovers? Evidence from 17 transition market economies. Journal of Comparative
Economics, 42(4), 954–969. https://doi.org/10.1016/j.jce.2014.08.003
Ha, Y. J., & Giroud, A. (2015). Competence-creating subsidiaries and FDI technology
spillovers. International Business Review, 24(4), 605–614.
https://doi.org/10.1016/j.ibusrev.2014.11.001
Halaszovich, T. F., & Lundan, S. M. (2016). The moderating role of local embeddedness on
the performance of foreign and domestic firms in emerging markets. International
Business Review, 25(5), 1136–1148. https://doi.org/10.1016/j.ibusrev.2016.02.003
Hallin, C., & Holmström Lind, C. (2012). Revisiting the external impact of MNCs: An
XIV
empirical study of the mechanisms behind knowledge spillovers from MNC
subsidiaries. International Business Review, 21(2), 167–179.
https://doi.org/10.1016/j.ibusrev.2010.12.003
Halpern, L., & Muraközy, B. (2007). Does distance matter in spillover? Economics of
Transition, 15(4), 781–805. https://doi.org/10.1111/j.1468-0351.2007.00308.x
Hamida, L. Ben. (2013). Are there regional spillovers from FDI in the Swiss manufacturing
industry? International Business Review, 22(4), 754–769.
https://doi.org/10.1016/j.ibusrev.2012.08.004
Harding, T., & Javorcik, B. S. (2012). Foreign direct investment and export upgrading.
Review of Economics and Statistics, 94(4), 964–980.
https://doi.org/10.1162/REST_a_00226
Harrison, A. E., & Aitken, B. J. (1999). Do Domestic Firms Benefit from Direct Foreign
Investment ? Evidence from Venezuela. American Economic Review, 89(3), 605–618.
https://doi.org/10.1257/aer.89.3.605
Havranek, T., & Irsova, Z. (2011). Estimating vertical spillovers from FDI: Why results vary
and what the true effect is. Journal of International Economics, 85(2), 234–244.
https://doi.org/10.1016/j.jinteco.2011.07.004
Havranek, T., & Irsova, Z. (2012). Survey Article: Publication Bias in the Literature on
Foreign Direct Investment Spillovers. Journal of Development Studies, 48(10), 1375–
1396. https://doi.org/10.1080/00220388.2012.685721
Herrera-Echeverri, H., Haar, J., & Estévez-Bretón, J. B. (2014). Foreign direct investment,
institutional quality, economic freedom and entrepreneurship in emerging markets.
Journal of Business Research, 67(9), 1921–1932.
https://doi.org/10.1016/j.jbusres.2013.11.020
Hijzen, A., Martins, P. S., Schank, T., & Upward, R. (2013). Foreign-owned firms around the
XV
world: A comparative analysis of wages and employment at the micro-level. European
Economic Review, 60, 170–188. https://doi.org/10.1016/j.euroecorev.2013.02.001
Hollanders, H., & Weel, B. (2002). Technology , knowledge spillovers and changes in
employment structure : evidence from six OECD countries, 9, 579–599.
Holtz-Eakin, D., Newey, W., & Rosen, H. S. (2006). Estimating Vector Autoregressions with
Panel Data. Econometrica, 56(6), 1371. https://doi.org/10.2307/1913103
Huang, Y., & Zhang, Y. (2017). Wage, foreign-owned firms, and productivity spillovers via
labour turnover: a non-linear analysis based on Chinese firm-level data. Applied
Economics, 49(20), 1994–2010. https://doi.org/10.1080/00036846.2016.1231899
Hübler, M. (2015). Labor mobility and technology diffusion: A new concept and its
application to rural Southeast Asia. Journal of Asian Economics, 39, 137–151.
https://doi.org/10.1016/j.asieco.2015.06.007
Huynh, H. T. N., Nguyen, P. V, Trieu, H. D. X., & Tran, K. T. (2019). Productivity Spillover
from FDI to Domestic Firms across Six Regions in Vietnam Productivity Spillover from
FDI to Domestic Firms across Six Regions in Vietnam, 0938.
Iršová, Z., & Havránek, T. (2013). Determinants of Horizontal Spillovers from FDI:
Evidence from a Large Meta-Analysis. World Development, 42(1), 1–15.
https://doi.org/10.1016/j.worlddev.2012.07.001
Jacobs, E. J., Zámborský, P., & Sbai, E. (2017). Mutual Productivity Spillovers in Slovakia:
Absorptive Capacity, the Technology Gap, and Nonlinear Effects. Eastern European
Economics, 55(4), 291–323. https://doi.org/10.1080/00128775.2017.1291306
Javorcik, B. S. (2015). Does FDI Bring Good Jobs to Host Countries? The World Bank
Research Observer, 30(1), 74–94. https://doi.org/10.1093/wbro/lku010
Javorcik, Beata S., Lo Turco, A., & Maggioni, D. (2018). New and Improved: Does FDI
Boost Production Complexity in Host Countries? Economic Journal, 128(614), 2507–
XVI
2537. https://doi.org/10.1111/ecoj.12530
Javorcik, Beata S., & Spatareanu, M. (2011). Does it matter where you come from? Vertical
spillovers from foreign direct investment and the origin of investors. Journal of
Development Economics, 96(1), 126–138. https://doi.org/10.1016/j.jdeveco.2010.05.008
Javorcik, Beata Smarzynska. (2004a). Does Foreign Direct Investment Increase the
Productivity of Domestic Firms ? In Search of Spillovers through Backward Linkages
Does Foreign Direct lnvestment Increase the Productivity of Domestic Firms ? In
Search of Spillovers Through Backward Linkages, 94(3), 605–627.
https://doi.org/10.1257/0002828041464605
Javorcik, Beata Smarzynska. (2004b). Does foreign direct investment increase the
productivity of domestic firms? in search of spillovers through backward linkages.
American Economic Review. https://doi.org/10.1257/0002828041464605
Javorcik, Beata Smarzynska, & Spatareanu, M. (2008). To share or not to share: Does local
participation matter for spillovers from foreign direct investment? Journal of
Development Economics, 85(1–2), 194–217.
https://doi.org/10.1016/j.jdeveco.2006.08.005
Jenkins, M., & Arce, R. (2015). Do backward linkages in export processing zones increase
dynamically? Firm-level evidence from Costa Rica. Journal of Business Research.
https://doi.org/10.1016/j.jbusres.2015.06.045
Jeon, Y., Il, B., & Ghauri, P. N. (2013). China Economic Review Foreign direct investment
spillover effects in China : Are they different across industries with different
technological levels ? ☆. China Economic Review, 26, 105–117.
https://doi.org/10.1016/j.chieco.2013.05.001
Jordaan, J. A. (2013). Firm heterogeneity and technology transfers to local suppliers:
Disentangling the effects of foreign ownership, technology gap and absorptive capacity.
XVII
Journal of International Trade and Economic Development, 22(1), 71–93.
https://doi.org/10.1080/09638199.2013.745282
Kee, H. L. (2015). Local intermediate inputs and the shared supplier spillovers of foreign
direct investment. Journal of Development Economics, 112, 56–71.
https://doi.org/10.1016/j.jdeveco.2014.09.007
Keller, W., & Yeaple, S. (2009). Multinational enterprises, international trade, and
productivity growth: Firm level evidence from the United States. Review of Economics
and Statistics, 91(4), 821–831.
Khachoo, Q., & Sharma, R. (2016). FDI and Innovation: An Investigation into Intra- and
Inter-industry Effects. Global Economic Review, 45(4), 311–330.
https://doi.org/10.1080/1226508X.2016.1218294
Kojima, K. (1973). A macroeconomic approach to foreign direct investment. Hitotsubashi
Journal of Economics, 14(1), 1–21.
Kokko, A. (2004). Markusen, J. R.: Multinational Firms and the Theory of International
Trade . Journal of Economics, 81(3), 284–287. https://doi.org/10.1007/s00712-003-
0035-9
Kokko, Ari. (1994). Technology, markets, characteristics and spillovers. Journal of
Development Economics, 43(1994), 279–293.
Kounetas, K. (2015). Heterogeneous technologies , strategic groups and environmental ef fi
ciency technology gaps for European countries. Energy Policy, 1–11.
https://doi.org/10.1016/j.enpol.2015.01.036
Krammer, S. M. S. (2015). Do good institutions enhance the effect of technological spillovers
on productivity? Comparative evidence from developed and transition economies.
Technological Forecasting and Social Change, 94, 133–154.
https://doi.org/10.1016/j.techfore.2014.09.002
XVIII
Krueger, B. Y. A. B., & Summers, L. H. (2012). Efficiency Wages and the Inter-Industry
Wage Structure Author ( s ): Alan B . Krueger and Lawrence H . Summers Reviewed
work ( s ): Published by : The Econometric Society Stable URL :
http://www.jstor.org/stable/1911072 . EFFICIENCY WAGES AND THE INTER-IN,
56(2), 259–293.
Le, H. Q., & Pomfret, R. (2011). Technology spillovers from foreign direct investment in
Vietnam: Horizontal or vertical spillovers? Journal of the Asia Pacific Economy, 16(2),
183–201. https://doi.org/10.1080/13547860.2011.564746
Lenaerts, K., & Merlevede, B. (2016). Supply chain fragmentation, input–output tables and
spillovers from foreign direct investment. Economic Systems Research, 28(3), 315–332.
https://doi.org/10.1080/09535314.2016.1187118
Li, J., & Rugman, A. M. (2007). Real options and the theory of foreign direct investment.
International Business Review, 16(6), 687–712.
https://doi.org/10.1016/j.ibusrev.2007.08.004
Liao, H., Liu, X., & Wang, C. (2012). Knowledge spillovers, absorptive capacity and total
factor productivity in China’s manufacturing firms. International Review of Applied
Economics, 26(4), 533–547. https://doi.org/10.1080/02692171.2011.619970
Lin, M., & Kwan, Y. K. (2016). FDI technology spillovers , geography , and spatial
diffusion. International Review of Economics and Finance.
https://doi.org/10.1016/j.iref.2016.02.014
Lin, P., Liu, Z., & Zhang, Y. (2009). Do Chinese domestic firms benefit from FDI inflow?
China Economic Review, 20(4), 677–691. https://doi.org/10.1016/j.chieco.2009.05.010
Lin, P., & Saggi, K. (2011). Foreign direct investment in a two-tier oligopoly: Coordination,
vertical integration, and welfare. International Economic Review, 52(4), 1271–1290.
https://doi.org/10.1111/j.1468-2354.2011.00667.x
XIX
Lin, W.-T., & Liu, Y. (2012). Successor characteristics, organisational slack, and change in
the degree of firm internationalisation. International Business Review, 21(1), 89–101.
Lin, W. T., & Liu, Y. (2012). Successor characteristics, organisational slack, and change in
the degree of firm internationalisation. International Business Review, 21(1), 89–101.
https://doi.org/10.1016/j.ibusrev.2011.01.001
Liu, W. S., Agbola, F. W., & Dzator, J. A. (2016). The impact of FDI spillover effects on
total factor productivity in the Chinese electronic industry: a panel data analysis. Journal
of the Asia Pacific Economy, 21(2), 217–234.
https://doi.org/10.1080/13547860.2015.1137473
Liu, X., Parker, D., Vaidya, K., & Wei, Y. (2001). The impact of foreign direct investment on
labour productivity in the Chinese electronics industry. International Business Review,
10(4), 421–439. https://doi.org/10.1016/S0969-5931(01)00024-5
Liu, Z. (2002). Foreign direct investment and technology spillover: Evidence from China.
Journal of Comparative Economics, 30(3), 579–602.
https://doi.org/10.1006/jcec.2002.1789
Long, C., Yang, J., & Zhang, J. (2015). Institutional impact of foreign direct investment in
China. World Development, 66, 31–48. https://doi.org/10.1016/j.worlddev.2014.08.001
Malik, M. A. R., Rehman, C. A., Ashraf, M., & Abbas, R. Z. (2011). Exploring the Link
between Foreign Direct Investment, Multinational Enterprises and Spillover Effects in
Developing Economies. International Journal of Business and Management, 7(1), 230–
240. https://doi.org/10.5539/ijbm.v7n1p230
Managi, S., & Bwalya, S. M. (2010). Foreign direct investment and technology spillovers in
sub-Saharan Africa. Applied Economics Letters, 17(6), 605–608.
https://doi.org/10.1080/13504850802167173
Mao, Z. E., & Yang, Y. (2016). FDI spillovers in the Chinese hotel industry: The role of
XX
geographic regions, star-rating classifications, ownership types, and foreign capital
origins. Tourism Management, 54, 1–12. https://doi.org/10.1016/j.tourman.2015.10.011
Marin, A., & Sasidharan, S. (2010). Heterogeneous MNC subsidiaries and technological
spillovers : Explaining positive and negative effects in India. Research Policy, 39(9),
1227–1241. https://doi.org/10.1016/j.respol.2010.06.001
Mariotti, S., Mutinelli, M., Nicolini, M., & Piscitello, L. (2015). Productivity Spillovers from
Foreign Multinational Enterprises to Domestic Manufacturing Firms: To What Extent
Does Spatial Proximity Matter? Regional Studies, 49(10), 1639–1653.
https://doi.org/10.1080/00343404.2013.867428
Marjit, S., Beladi, H., & Chakrabarti, A. (2004). Trade and wage inequality in developing
countries. Economic Inquiry, 42(2), 295–303. https://doi.org/10.1093/ei/cbh061
Martins, P. S., & Opromolla, L. D. (2009). Exports , Imports and Wages : Evidence from
Matched Firm-Worker-Product Panels, (4646), 1–54.
Mebratie, A. D., & van Bergeijk, P. A. G. (2013). Firm heterogeneity and development: A
meta-analysis of FDI productivity spillovers. Journal of International Trade and
Economic Development, 22(1), 52–70. https://doi.org/10.1080/09638199.2013.745281
Merlevede, B., & Purice, V. (2016). Distance, time since foreign entry, and productivity
spillovers from foreign direct investment. Papers in Regional Science, 95(4), 775–800.
https://doi.org/10.1111/pirs.12159
Meyer, K. E. (2003). DRC Working Papers Foreign Direct Investment in Emerging Markets
CENTRE FOR NEW AND EMERGING MARKETS FDI Spillovers in Emerging
Markets : A Literature Review and New Perspectives By Draft , March 2003 Do not
quote CNEM is a Development Research Centre sup. Business, (15), 1–55.
Mollisi, V., & Gabriele, R. (2017). Theory and Practice of TFP Estimation: the Control
Function Approach Using Stata. Social Science Research Network Electronic Paper
XXI
Collection, 15(2). https://doi.org/http://dx.doi.org/10.2139/ssrn.2916753
Monte, F. (2011). Skill bias, trade, and wage dispersion. Journal of International Economics,
83(2), 202–218. https://doi.org/10.1016/j.jinteco.2010.11.004
Murthy, B. K. V. (2015). Outward Foreign Direct Investment and Economic Development.
Transnational Corporations Review, 7(3), 279–296.
https://doi.org/10.5148/tncr.2015.7303
Nelson, C. (2010). Don’t mourn, organize. Academe, 96(1), 10–14.
https://doi.org/10.1002/jid
Newman, C., Page, J., Rand, J., Shimeles, A., & Söderbom, M. (2019). Linked-in by FDI :
The Role of Firm-Level Relationships for Knowledge Transfers in Africa and Asia
Linked-in by FDI : The Role of Firm-Level Relationships for Knowledge Transfers in
Africa and Asia. The Journal of Development Studies, 0(0), 1–18.
https://doi.org/10.1080/00220388.2019.1585813
Newman, C., Rand, J., Talbot, T., & Tarp, F. (2015). Technology transfers, foreign
investment and productivity spillovers. European Economic Review, 76, 168–187.
https://doi.org/10.1016/j.euroecorev.2015.02.005
Newton, H. J., Baum, C. F., Beck, N., Cameron, A. C., Epstein, D., Hardin, J., … Kohler, U.
(n.d.). The Stata Journal.
Nguyen, D. T. H., & Sun, S. (2012). FDI and Domestic Firms’ Export Behaviour: Evidence
from Vietnam*. Economic Papers: A Journal of Applied Economics and Policy, 31(3),
380–390. https://doi.org/10.1111/j.1759-3441.2012.00180.x
Nguyen, K. T. (2015). Wage differentials between foreign invested and domestic enterprises
in the manufacturing. Journal of Economic Studies, 42(6), 1056–1077.
https://doi.org/10.1108/JES-05-2014-0075
Nguyen, K. T., & Ramstetter, E. D. (2017). Wage Differentials among Ownership Groups
XXII
and Worker Quality in Vietnamese Manufacturing. Global Economic Review, 46(3),
232–250. https://doi.org/10.1080/1226508X.2017.1298459
Ni, B., Spatareanu, M., Manole, V., Otsuki, T., & Yamada, H. (2017). The origin of FDI and
domestic firms’ productivity—Evidence from Vietnam. Journal of Asian Economics, 52,
56–76. https://doi.org/10.1016/j.asieco.2017.08.004
Nohria, N., & Gulati, R. (1996). Is slack good or bad for innovation? Academy of
Management Journal, 39(5), 1245–1264. https://doi.org/10.2307/256998
Olley, G. S., & Pakes, A. (1992). The dynamics of productivity in the telecommunications
equipment industry. National Bureau of Economic Research.
Onaran, Ö., & Stockhammer, E. (2008). The effect of FDI and foreign trade on wages in the
Central and Eastern European Countries in the post-transition era: A sectoral analysis for
the manufacturing industry. Structural Change and Economic Dynamics, 19(1), 66–80.
https://doi.org/10.1016/j.strueco.2007.11.003
Parman, J. (2012). Explorations in Economic History Good schools make good neighbors :
Human capital spillovers in early 20th century agriculture. YEXEH, 49(3), 316–334.
https://doi.org/10.1016/j.eeh.2012.04.002
Peri, G., & Urban, D. (2006). Catching-up to foreign technology? Evidence on the “Veblen-
Gerschenkron” effect of foreign investments. Regional Science and Urban Economics,
36(1), 72–98. https://doi.org/10.1016/j.regsciurbeco.2005.09.001
Perri, A., & Andersson, U. (2014). Knowledge outflows from foreign subsidiaries and the
tension between knowledge creation and knowledge protection: Evidence from the
semiconductor industry. International Business Review, 23(1), 63–75.
https://doi.org/10.1016/j.ibusrev.2013.08.007
Perri, A., Andersson, U., Nell, P. C., & Santangelo, G. D. (2013). Balancing the trade-off
between learning prospects and spillover risks : MNC subsidiaries ’ vertical linkage
XXIII
patterns in developed countries. Journal of World Business, 48(4), 503–514.
https://doi.org/10.1016/j.jwb.2012.09.006
Perri, A., & Peruffo, E. (2016). Knowledge Spillovers from FDI: A Critical Review from the
International Business Perspective. International Journal of Management Reviews,
18(1), 3–27. https://doi.org/10.1111/ijmr.12054
Pittiglio, R., Reganati, F., & Sica, E. (2015). Do multinational enterprises push up the wages
of domestic firms in the italian manufacturing sector? Manchester School, 83(3), 346–
378. https://doi.org/10.1111/manc.12076
Ran, J., Voon, J. P., & Li, G. (2007). How does FDI affect China? Evidence from industries
and provinces. Journal of Comparative Economics, 35(4), 774–799.
https://doi.org/10.1016/j.jce.2007.05.001
Report, E. O. (n.d.). Overview of the energy sector.
Riahi-Belkaoui, A. (1996). Internationalization, diversification strategy and ownership
structure: Implications for French MNE performance. International Business Review,
5(4), 367–376. https://doi.org/10.1016/0969-5931(96)00018-2
Rojec, M., & Knell, M. (2017). Why is there a lack of evidence on knowledge spillovers from
foreign direct investment? Journal of Economic Surveys, 00(0), 1–34.
https://doi.org/10.1111/joes.12207
Rugman, A. M. (2016). Internalization as a General Theory of Foreign Direct Investment.
Inside the Multinationals 25th Anniversary Edition, 18–33.
https://doi.org/10.1057/9780230625167_2
Saisho, T. (n.d.). Promotion of Smart Community Strategy in Vietnam ’ s Binh Duong
Province Promotion of Smart Community Strategy in Vietnam ’ s Binh Duong Province.
https://doi.org/10.5772/intechopen.73102
Salim, A., Razavi, M. R., & Afshari-Mofrad, M. (2017). Foreign direct investment and
XXIV
technology spillover in Iran: The role of technological capabilities of subsidiaries.
Technological Forecasting and Social Change, 122, 207–214.
https://doi.org/10.1016/j.techfore.2015.09.012
Salim, R. A., & Bloch, H. (2009). Does Foreign Direct Investment Lead to Productivity
Spillovers ? Firm Level Evidence from Indonesia. World Development, 37(12), 1861–
1876. https://doi.org/10.1016/j.worlddev.2009.05.009
Sampson, T. (2013). Brain drain or brain gain? Technology diffusion and learning on-the-job.
Journal of International Economics, 90(1), 162–176.
https://doi.org/10.1016/j.jinteco.2012.10.004
Sánchez-Sellero, P., Rosell-Martínez, J., & García-Vázquez, J. M. (2014a). Absorptive
capacity from foreign direct investment in Spanish manufacturing firms. International
Business Review, 23(2), 429–439. https://doi.org/10.1016/j.ibusrev.2013.06.006
Sánchez-Sellero, P., Rosell-Martínez, J., & García-Vázquez, J. M. (2014b). Spillovers from
foreign direct investment in Spanish manufacturing firms. Review of International
Economics, 22(2), 342–351. https://doi.org/10.1111/roie.12115
Schaumburg-Müller, H. (2003). Rise and fall of foreign direct investment in Vietnam and its
impact on local manufacturing upgrading. European Journal of Development Research,
15(2), 44–66. https://doi.org/10.1080/09578810312331287475
Schneider, F., & Frey, B. S. (1985). Economic and political determinants of foreign direct
investment. World Development, 13(2), 161–175. https://doi.org/10.1016/0305-
750X(85)90002-6
Sena, V. (2004). Total factor productivity and the spillover hypothesis: Some new evidence.
International Journal of Production Economics, 92(1), 31–42.
https://doi.org/10.1016/j.ijpe.2003.10.003
Shropshire, J., & Kadlec, C. (2012). Where are you going? A comparative analysis of job and
XXV
career change intentions among USA it workers. Journal of Internet Banking and
Commerce, 17(2), 1–20. https://doi.org/10.1002/job
Silajdzic, S., & Mehic, E. (2016). Absorptive Capabilities, FDI, and Economic Growth in
Transition Economies. Emerging Markets Finance and Trade, 52(4), 904–922.
https://doi.org/10.1080/1540496X.2015.1056000
Singla, C., & George, R. (2013). Internationalization and performance: A contextual analysis
of Indian firms. Journal of Business Research, 66(12), 2500–2506.
https://doi.org/10.1016/j.jbusres.2013.05.041
Stata, A. (2015). Stata Base Reference Manual Release 14.
Stoker, T., Berndt, E., Ellerman, D., & Schennach, S. (2005). Panel Data Analysis. Journal of
Econometrics. https://doi.org/10.1016/j.jeconom.2004.06.006
Stoyanov, A., & Zubanov, N. (2014). The distribution of the gains from spillovers through
worker mobility between workers and firms. European Economic Review, 70, 17–35.
https://doi.org/10.1016/j.euroecorev.2014.03.011
Suyanto, Bloch, H., & Salim, R. A. (2012). Foreign Direct Investment Spillovers and
Productivity Growth in Indonesian Garment and Electronics Manufacturing. Journal of
Development Studies, 48(10), 1397–1411.
https://doi.org/10.1080/00220388.2011.646992
Takii, S. (2011). Do FDI spillovers vary among home economies?: Evidence from Indonesian
manufacturing. Journal of Asian Economics, 22(2), 152–163.
https://doi.org/10.1016/j.asieco.2010.12.002
Tanaka, K., & Hashiguchi, Y. (2015). Spatial Spillovers from Foreign Direct Investment:
Evidence from the Yangtze River Delta in China. China and World Economy, 23(2), 40–
60. https://doi.org/10.1111/cwe.12106
Temiz, D., & Gokmen, A. (2014). FDI inflow as an international business operation by
XXVI
MNCs and economic growth: An empirical study on Turkey. International Business
Review, 23(1), 145–154. https://doi.org/10.1016/j.ibusrev.2013.03.003
Thang, T. T., Pham, T. S. H., & Barnes, B. R. (2016). Spatial Spillover Effects from Foreign
Direct Investment in Vietnam. Journal of Development Studies, 52(10), 1431–1445.
https://doi.org/10.1080/00220388.2016.1166205
Trigeorgis, L., & Reuer, J. J. (2017). Real options theory in strategic management. Strategic
Management Journal, 38(1), 42–63. https://doi.org/10.1002/smj
Tsekouras, K., Chatzistamoulou, N., Kounetas, K., & Broadstock, D. C. (2015).
Technological Forecasting & Social Change Spillovers , path dependence and the
productive performance of European transportation sectors in the presence of technology
heterogeneity. Technological Forecasting & Social Change.
https://doi.org/10.1016/j.techfore.2015.09.008
Veugelers, R., & Cassiman, B. (2004). Foreign subsidiaries as a channel of international
technology diffusion: Some direct firm level evidence from Belgium. European
Economic Review, 48(2), 455–476. https://doi.org/10.1016/S0014-2921(02)00327-6
Wang, C. C., & Wu, A. (2016). Geographical FDI knowledge spillover and innovation of
indigenous firms in China. International Business Review, 25(4), 895–906.
https://doi.org/10.1016/j.ibusrev.2015.12.004
Wang, C., Deng, Z., Kafouros, M. I., & Chen, Y. (2012). Reconceptualizing the spillover
effects of foreign direct investment: A process-dependent approach. International
Business Review, 21(3), 452–464. https://doi.org/10.1016/j.ibusrev.2011.05.006
Wang, J.-Y., & Blomstrom, M. (1992). Foreign Investment and Technology Transfer. A
simple Model. European Economic Review, 36, 135–175. https://doi.org/10.1016/0014-
2921(92)90021-N
Wang, J.-Y., & Blomström, M. (2002). Foreign investment and technology transfer.
XXVII
European Economic Review, 36(1), 137–155. https://doi.org/10.1016/0014-
2921(92)90021-n
Wang, Y. (2010). FDI and productivity growth: the role of inter-industry linkages. Canadian
Journal of Economics/Revue Canadienne d’économique, 43(4), 1243–1272.
https://doi.org/10.1111/j.1540-5982.2010.01613.x
Wei, Y., & Liu, X. (2006). Productivity spillovers from R and D, exports and FDI in China’s
manufacturing sector. Journal of International Business Studies, 37(4), 544–557.
https://doi.org/10.1057/palgrave.jibs.8400209
Wei, Z., & Hao, R. (2011). The role of human capital in china’s total factor productivity
growth: A cross-province analysis. Developing Economies, 49(1), 1–35.
https://doi.org/10.1111/j.1746-1049.2010.00120.x
Welch, D. E., & Welch, L. S. (1996). The Internationalization Process and Networks: A
Strategic Management Perspective. Journal of International Marketing, 4(3), 11–28.
https://doi.org/10.2307/25048656
Wen, Y. (2014). The spillover effect of FDI and its impact on productivity in high economic
output regions: A comparative analysis of the Yangtze River Delta and the Pearl River
Delta, China. Papers in Regional Science, 93(2), 341–365.
https://doi.org/10.1111/pirs.12086
Willem, D. (2019). ENHANCING SPILLOVERS FROM FOREIGN DIRECT
INVESTMENT, (March).
Wood, A. (1995). How Trade Hurt Unskilled Workers. Journal of Economic Perspectives,
9(3), 57–80. https://doi.org/10.1257/jep.9.3.57
Wood, A., Walter, Y., Nguyen, K. T., Ramstetter, E. D., Authors, F., Economy, P., …
Aftermath, T. (2014). Unemployment and the real wage: the economic basis for
contesting political ideologies. World Economy, 12(2), 333–366.
XXVIII
https://doi.org/10.1111/twec.12103
Wte, W. (2020). VIETNAM – 2018 Renewable Energy, 1–4.
Xu, X., & Sheng, Y. (2012). Are FDI spillovers regional? Firm-level evidence from China.
Journal of Asian Economics, 23(3), 244–258.
https://doi.org/10.1016/j.asieco.2010.11.009
Yasar, M., Raciborski, R., & Poi, B. (2008). Production function estimation in Stata using the
Olley and Pakes method. Stata Journal, 8(2), 221.
Yunus, N. M., Said, R., & Azman-Saini, W. N. W. (2015). Spillover effects of FDI and trade
on demand for skilled labour in Malaysian manufacturing industries. Asian Academy of
Management Journal, 20(2), 1–27.
Zanello, G., Fu, X., Mohnen, P., & Ventresca, M. (2016). the Creation and Diffusion of
Innovation in Developing Countries: a Systematic Literature Review. Journal of
Economic Surveys, 30(5), 884–912. https://doi.org/10.1111/joes.12126
Zhang, Yi, & Shang, Q. (2018). FDI Spillovers on Corporate Social Responsibility : The
Channel of Labor Mobility, 8–10. https://doi.org/10.3390/su10114265
Zhang, Yufeng, Yang, Z., & Zhang, T. (2018). Strategic resource decisions to enhance the
performance of global engineering services. International Business Review, 27(3), 678–
700. https://doi.org/10.1016/j.ibusrev.2017.11.004
Zulfiu-Alili, M. (2014). Inward Foreign Direct Investment and Wage Inequality in
Macedonia. Eastern European Economics, 52(5), 56–86.
https://doi.org/10.1080/00128775.2014.1004265
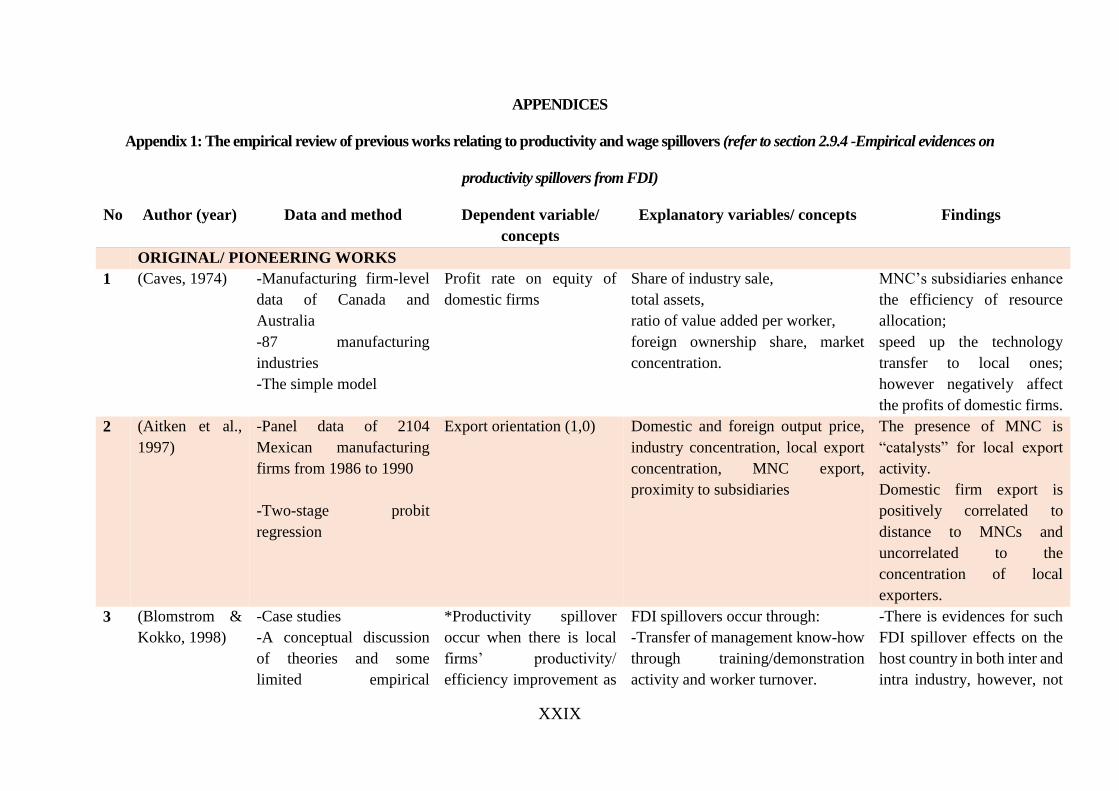
XXIX
APPENDICES
Appendix 1: The empirical review of previous works relating to productivity and wage spillovers (refer to section 2.9.4 -Empirical evidences on
productivity spillovers from FDI)
No Author (year) Data and method Dependent variable/
concepts
Explanatory variables/ concepts Findings
ORIGINAL/ PIONEERING WORKS
1 (Caves, 1974) -Manufacturing firm-level
data of Canada and
Australia
-87 manufacturing
industries
-The simple model
Profit rate on equity of
domestic firms
Share of industry sale,
total assets,
ratio of value added per worker,
foreign ownership share, market
concentration.
MNC’s subsidiaries enhance
the efficiency of resource
allocation;
speed up the technology
transfer to local ones;
however negatively affect
the profits of domestic firms.
2 (Aitken et al.,
1997)
-Panel data of 2104
Mexican manufacturing
firms from 1986 to 1990
-Two-stage probit
regression
Export orientation (1,0) Domestic and foreign output price,
industry concentration, local export
concentration, MNC export,
proximity to subsidiaries
The presence of MNC is
“catalysts” for local export
activity.
Domestic firm export is
positively correlated to
distance to MNCs and
uncorrelated to the
concentration of local
exporters.
3 (Blomstrom &
Kokko, 1998)
-Case studies
-A conceptual discussion
of theories and some
limited empirical
*Productivity spillover
occur when there is local
firms’ productivity/
efficiency improvement as
FDI spillovers occur through:
-Transfer of management know-how
through training/demonstration
activity and worker turnover.
-There is evidences for such
FDI spillover effects on the
host country in both inter and
intra industry, however, not
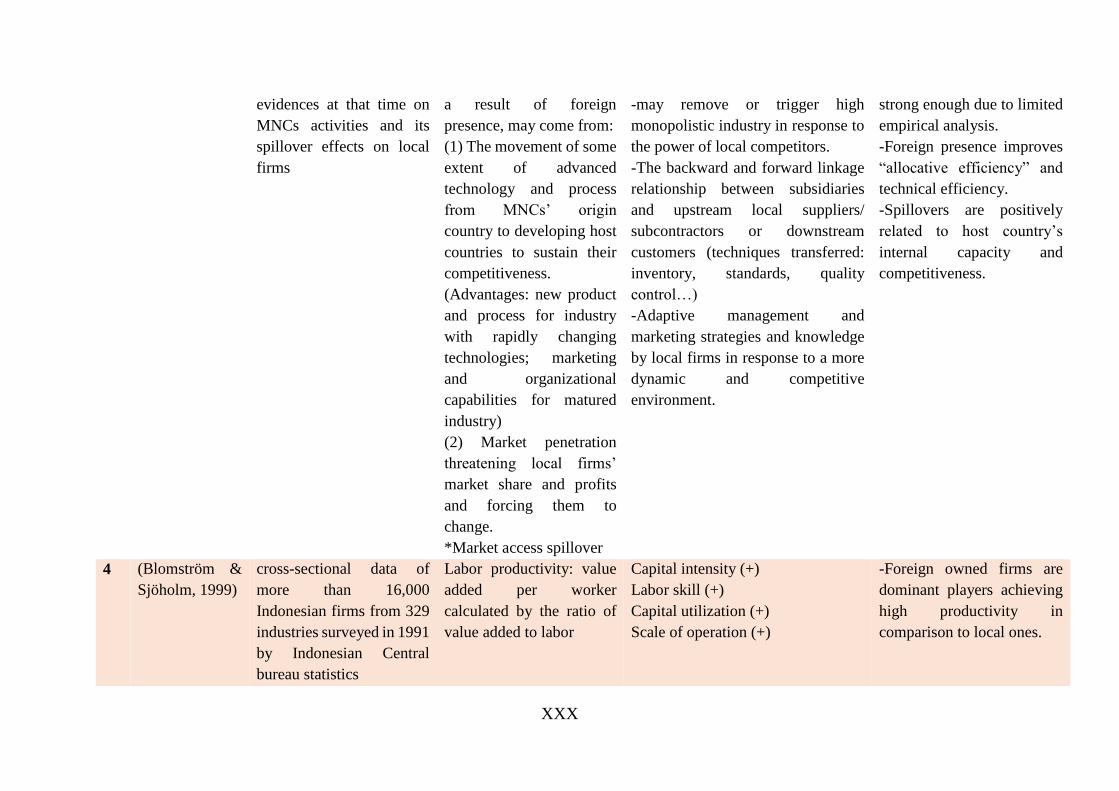
XXX
evidences at that time on
MNCs activities and its
spillover effects on local
firms
a result of foreign
presence, may come from:
(1) The movement of some
extent of advanced
technology and process
from MNCs’ origin
country to developing host
countries to sustain their
competitiveness.
(Advantages: new product
and process for industry
with rapidly changing
technologies; marketing
and organizational
capabilities for matured
industry)
(2) Market penetration
threatening local firms’
market share and profits
and forcing them to
change.
*Market access spillover
-may remove or trigger high
monopolistic industry in response to
the power of local competitors.
-The backward and forward linkage
relationship between subsidiaries
and upstream local suppliers/
subcontractors or downstream
customers (techniques transferred:
inventory, standards, quality
control…)
-Adaptive management and
marketing strategies and knowledge
by local firms in response to a more
dynamic and competitive
environment.
strong enough due to limited
empirical analysis.
-Foreign presence improves
“allocative efficiency” and
technical efficiency.
-Spillovers are positively
related to host country’s
internal capacity and
competitiveness.
4 (Blomström &
Sjöholm, 1999)
cross-sectional data of
more than 16,000
Indonesian firms from 329
industries surveyed in 1991
by Indonesian Central
bureau statistics
Labor productivity: value
added per worker
calculated by the ratio of
value added to labor
Capital intensity (+)
Labor skill (+)
Capital utilization (+)
Scale of operation (+)
-Foreign owned firms are
dominant players achieving
high productivity in
comparison to local ones.
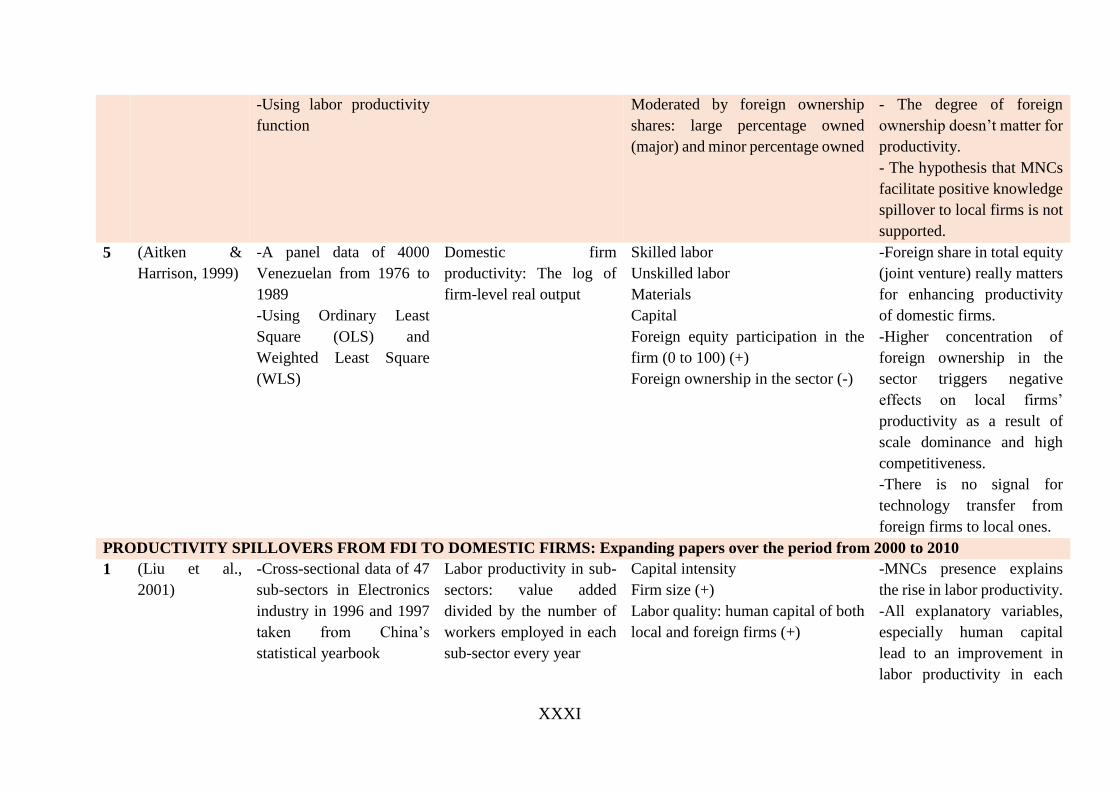
XXXI
-Using labor productivity
function
Moderated by foreign ownership
shares: large percentage owned
(major) and minor percentage owned
- The degree of foreign
ownership doesn’t matter for
productivity.
- The hypothesis that MNCs
facilitate positive knowledge
spillover to local firms is not
supported.
5 (Aitken &
Harrison, 1999)
-A panel data of 4000
Venezuelan from 1976 to
1989
-Using Ordinary Least
Square (OLS) and
Weighted Least Square
(WLS)
Domestic firm
productivity: The log of
firm-level real output
Skilled labor
Unskilled labor
Materials
Capital
Foreign equity participation in the
firm (0 to 100) (+)
Foreign ownership in the sector (-)
-Foreign share in total equity
(joint venture) really matters
for enhancing productivity
of domestic firms.
-Higher concentration of
foreign ownership in the
sector triggers negative
effects on local firms’
productivity as a result of
scale dominance and high
competitiveness.
-There is no signal for
technology transfer from
foreign firms to local ones.
PRODUCTIVITY SPILLOVERS FROM FDI TO DOMESTIC FIRMS: Expanding papers over the period from 2000 to 2010
1 (Liu et al.,
2001)
-Cross-sectional data of 47
sub-sectors in Electronics
industry in 1996 and 1997
taken from China’s
statistical yearbook
Labor productivity in sub-
sectors: value added
divided by the number of
workers employed in each
sub-sector every year
Capital intensity
Firm size (+)
Labor quality: human capital of both
local and foreign firms (+)
-MNCs presence explains
the rise in labor productivity.
-All explanatory variables,
especially human capital
lead to an improvement in
labor productivity in each
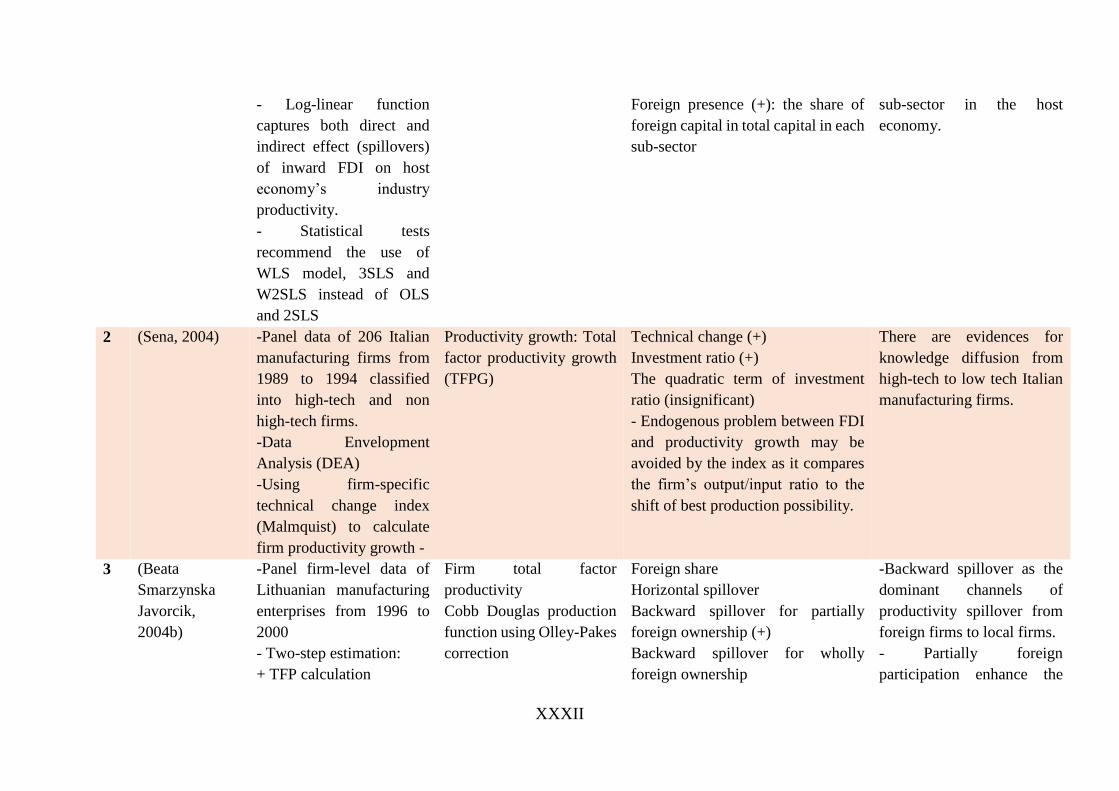
XXXII
- Log-linear function
captures both direct and
indirect effect (spillovers)
of inward FDI on host
economy’s industry
productivity.
- Statistical tests
recommend the use of
WLS model, 3SLS and
W2SLS instead of OLS
and 2SLS
Foreign presence (+): the share of
foreign capital in total capital in each
sub-sector
sub-sector in the host
economy.
2 (Sena, 2004) -Panel data of 206 Italian
manufacturing firms from
1989 to 1994 classified
into high-tech and non
high-tech firms.
-Data Envelopment
Analysis (DEA)
-Using firm-specific
technical change index
(Malmquist) to calculate
firm productivity growth -
Productivity growth: Total
factor productivity growth
(TFPG)
Technical change (+)
Investment ratio (+)
The quadratic term of investment
ratio (insignificant)
- Endogenous problem between FDI
and productivity growth may be
avoided by the index as it compares
the firm’s output/input ratio to the
shift of best production possibility.
There are evidences for
knowledge diffusion from
high-tech to low tech Italian
manufacturing firms.
3 (Beata
Smarzynska
Javorcik,
2004b)
-Panel firm-level data of
Lithuanian manufacturing
enterprises from 1996 to
2000
- Two-step estimation:
+ TFP calculation
Firm total factor
productivity
Cobb Douglas production
function using Olley-Pakes
correction
Foreign share
Horizontal spillover
Backward spillover for partially
foreign ownership (+)
Backward spillover for wholly
foreign ownership
-Backward spillover as the
dominant channels of
productivity spillover from
foreign firms to local firms.
- Partially foreign
participation enhance the
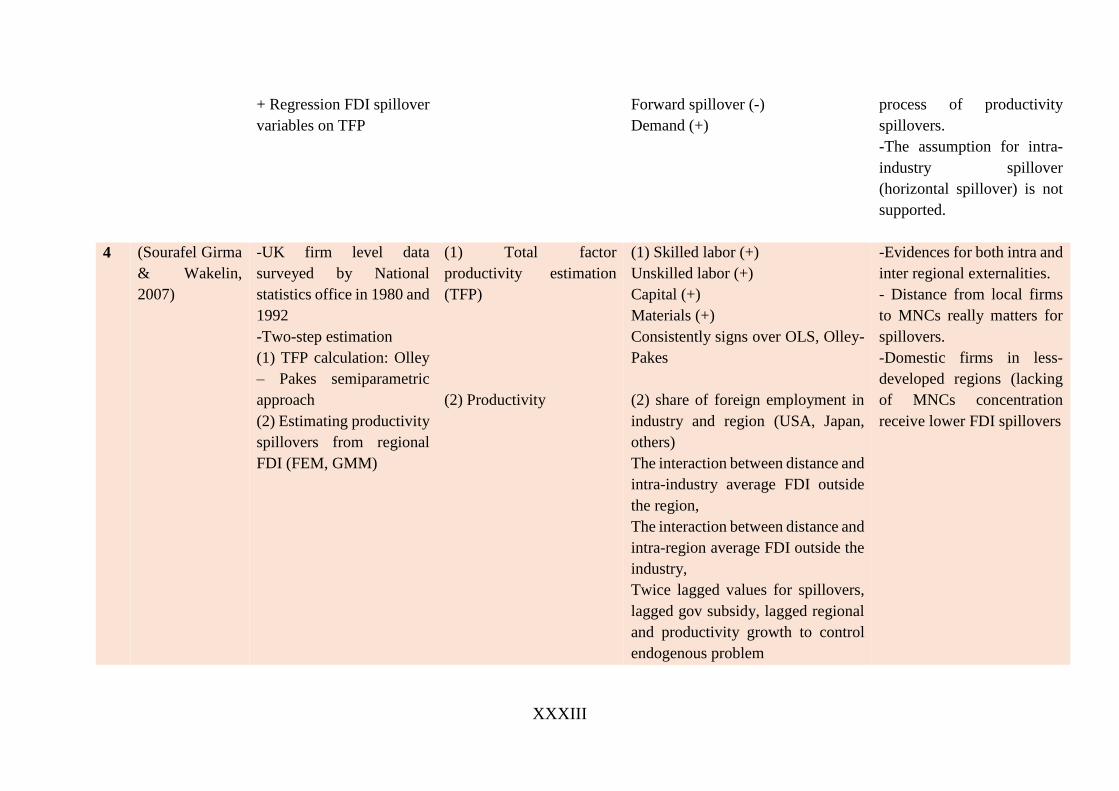
XXXIII
+ Regression FDI spillover
variables on TFP
Forward spillover (-)
Demand (+)
process of productivity
spillovers.
-The assumption for intra-
industry spillover
(horizontal spillover) is not
supported.
4 (Sourafel Girma
& Wakelin,
2007)
-UK firm level data
surveyed by National
statistics office in 1980 and
1992
-Two-step estimation
(1) TFP calculation: Olley
– Pakes semiparametric
approach
(2) Estimating productivity
spillovers from regional
FDI (FEM, GMM)
(1) Total factor
productivity estimation
(TFP)
(2) Productivity
(1) Skilled labor (+)
Unskilled labor (+)
Capital (+)
Materials (+)
Consistently signs over OLS, Olley-
Pakes
(2) share of foreign employment in
industry and region (USA, Japan,
others)
The interaction between distance and
intra-industry average FDI outside
the region,
The interaction between distance and
intra-region average FDI outside the
industry,
Twice lagged values for spillovers,
lagged gov subsidy, lagged regional
and productivity growth to control
endogenous problem
-Evidences for both intra and
inter regional externalities.
- Distance from local firms
to MNCs really matters for
spillovers.
-Domestic firms in less-
developed regions (lacking
of MNCs concentration
receive lower FDI spillovers
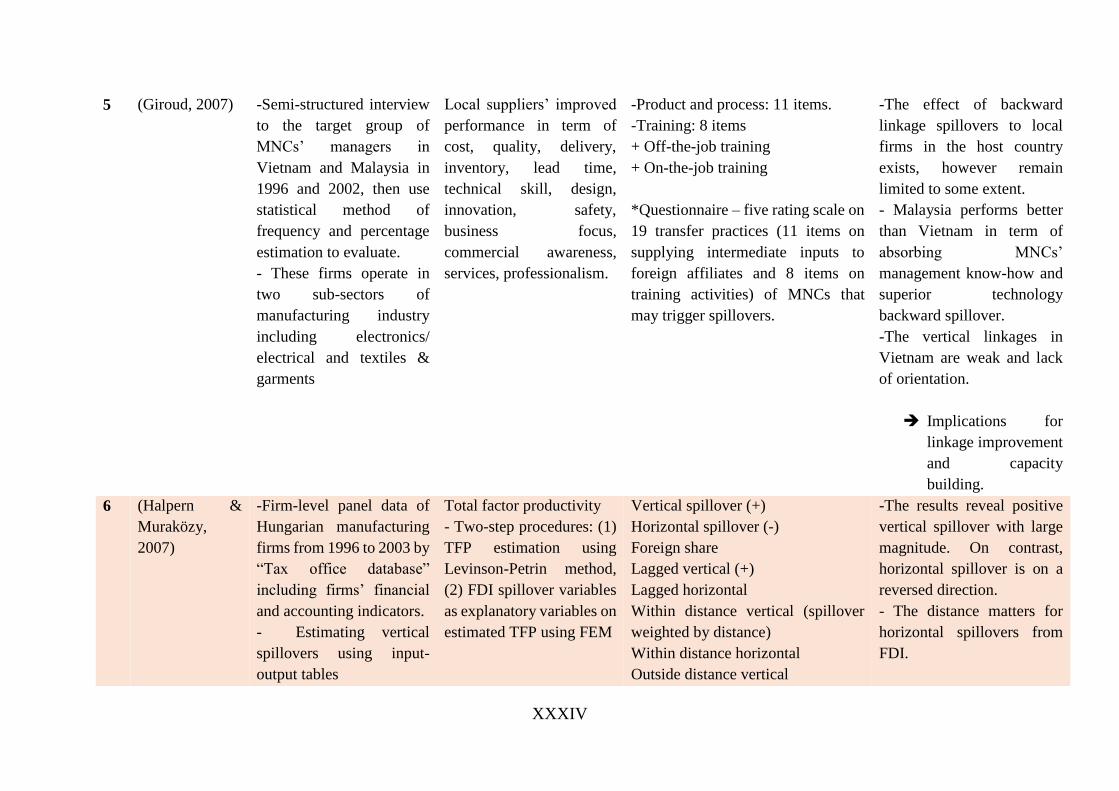
XXXIV
5 (Giroud, 2007) -Semi-structured interview
to the target group of
MNCs’ managers in
Vietnam and Malaysia in
1996 and 2002, then use
statistical method of
frequency and percentage
estimation to evaluate.
- These firms operate in
two sub-sectors of
manufacturing industry
including electronics/
electrical and textiles &
garments
Local suppliers’ improved
performance in term of
cost, quality, delivery,
inventory, lead time,
technical skill, design,
innovation, safety,
business focus,
commercial awareness,
services, professionalism.
-Product and process: 11 items.
-Training: 8 items
+ Off-the-job training
+ On-the-job training
*Questionnaire – five rating scale on
19 transfer practices (11 items on
supplying intermediate inputs to
foreign affiliates and 8 items on
training activities) of MNCs that
may trigger spillovers.
-The effect of backward
linkage spillovers to local
firms in the host country
exists, however remain
limited to some extent.
- Malaysia performs better
than Vietnam in term of
absorbing MNCs’
management know-how and
superior technology
backward spillover.
-The vertical linkages in
Vietnam are weak and lack
of orientation.
Implications for
linkage improvement
and capacity
building.
6 (Halpern &
Muraközy,
2007)
-Firm-level panel data of
Hungarian manufacturing
firms from 1996 to 2003 by
“Tax office database”
including firms’ financial
and accounting indicators.
- Estimating vertical
spillovers using input-
output tables
Total factor productivity
- Two-step procedures: (1)
TFP estimation using
Levinson-Petrin method,
(2) FDI spillover variables
as explanatory variables on
estimated TFP using FEM
Vertical spillover (+)
Horizontal spillover (-)
Foreign share
Lagged vertical (+)
Lagged horizontal
Within distance vertical (spillover
weighted by distance)
Within distance horizontal
Outside distance vertical
-The results reveal positive
vertical spillover with large
magnitude. On contrast,
horizontal spillover is on a
reversed direction.
- The distance matters for
horizontal spillovers from
FDI.
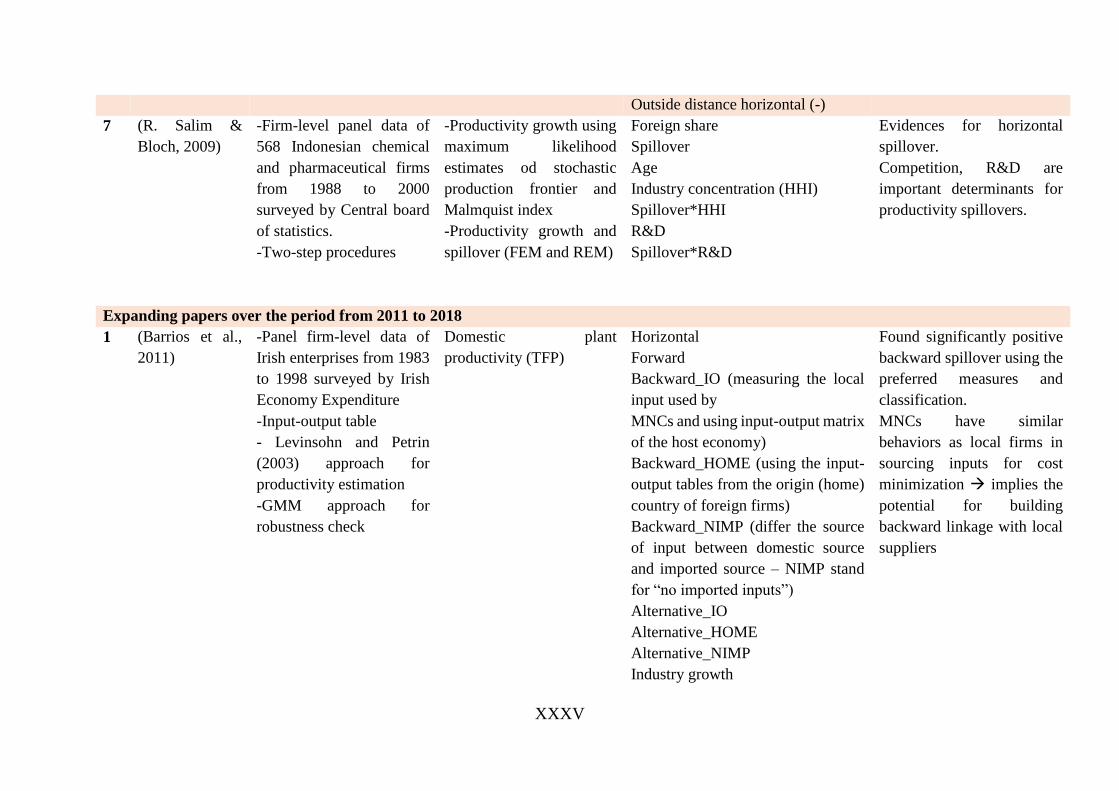
XXXV
Outside distance horizontal (-)
7 (R. Salim &
Bloch, 2009)
-Firm-level panel data of
568 Indonesian chemical
and pharmaceutical firms
from 1988 to 2000
surveyed by Central board
of statistics.
-Two-step procedures
-Productivity growth using
maximum likelihood
estimates od stochastic
production frontier and
Malmquist index
-Productivity growth and
spillover (FEM and REM)
Foreign share
Spillover
Age
Industry concentration (HHI)
Spillover*HHI
R&D
Spillover*R&D
Evidences for horizontal
spillover.
Competition, R&D are
important determinants for
productivity spillovers.
Expanding papers over the period from 2011 to 2018
1 (Barrios et al.,
2011)
-Panel firm-level data of
Irish enterprises from 1983
to 1998 surveyed by Irish
Economy Expenditure
-Input-output table
- Levinsohn and Petrin
(2003) approach for
productivity estimation
-GMM approach for
robustness check
Domestic plant
productivity (TFP)
Horizontal
Forward
Backward_IO (measuring the local
input used by
MNCs and using input-output matrix
of the host economy)
Backward_HOME (using the input-
output tables from the origin (home)
country of foreign firms)
Backward_NIMP (differ the source
of input between domestic source
and imported source – NIMP stand
for “no imported inputs”)
Alternative_IO
Alternative_HOME
Alternative_NIMP
Industry growth
Found significantly positive
backward spillover using the
preferred measures and
classification.
MNCs have similar
behaviors as local firms in
sourcing inputs for cost
minimization implies the
potential for building
backward linkage with local
suppliers
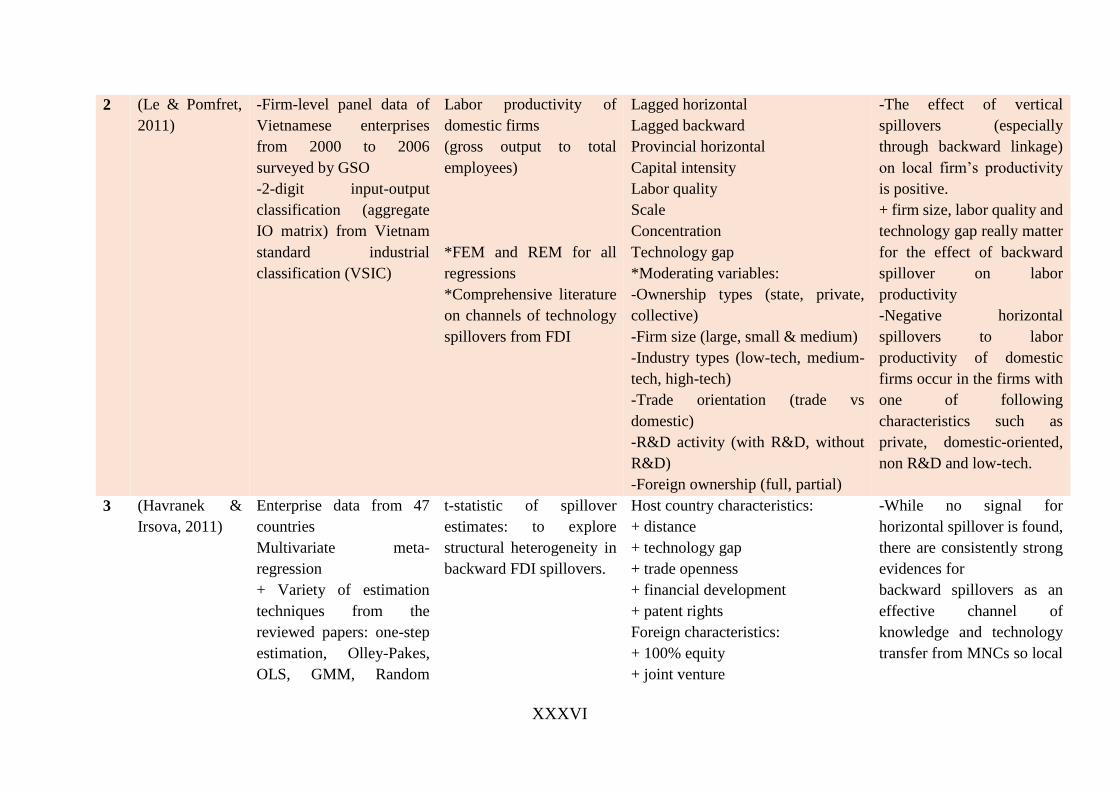
XXXVI
2 (Le & Pomfret,
2011)
-Firm-level panel data of
Vietnamese enterprises
from 2000 to 2006
surveyed by GSO
-2-digit input-output
classification (aggregate
IO matrix) from Vietnam
standard industrial
classification (VSIC)
Labor productivity of
domestic firms
(gross output to total
employees)
*FEM and REM for all
regressions
*Comprehensive literature
on channels of technology
spillovers from FDI
Lagged horizontal
Lagged backward
Provincial horizontal
Capital intensity
Labor quality
Scale
Concentration
Technology gap
*Moderating variables:
-Ownership types (state, private,
collective)
-Firm size (large, small & medium)
-Industry types (low-tech, medium-
tech, high-tech)
-Trade orientation (trade vs
domestic)
-R&D activity (with R&D, without
R&D)
-Foreign ownership (full, partial)
-The effect of vertical
spillovers (especially
through backward linkage)
on local firm’s productivity
is positive.
+ firm size, labor quality and
technology gap really matter
for the effect of backward
spillover on labor
productivity
-Negative horizontal
spillovers to labor
productivity of domestic
firms occur in the firms with
one of following
characteristics such as
private, domestic-oriented,
non R&D and low-tech.
3 (Havranek &
Irsova, 2011)
Enterprise data from 47
countries
Multivariate meta-
regression
+ Variety of estimation
techniques from the
reviewed papers: one-step
estimation, Olley-Pakes,
OLS, GMM, Random
t-statistic of spillover
estimates: to explore
structural heterogeneity in
backward FDI spillovers.
Host country characteristics:
+ distance
+ technology gap
+ trade openness
+ financial development
+ patent rights
Foreign characteristics:
+ 100% equity
+ joint venture
-While no signal for
horizontal spillover is found,
there are consistently strong
evidences for
backward spillovers as an
effective channel of
knowledge and technology
transfer from MNCs so local
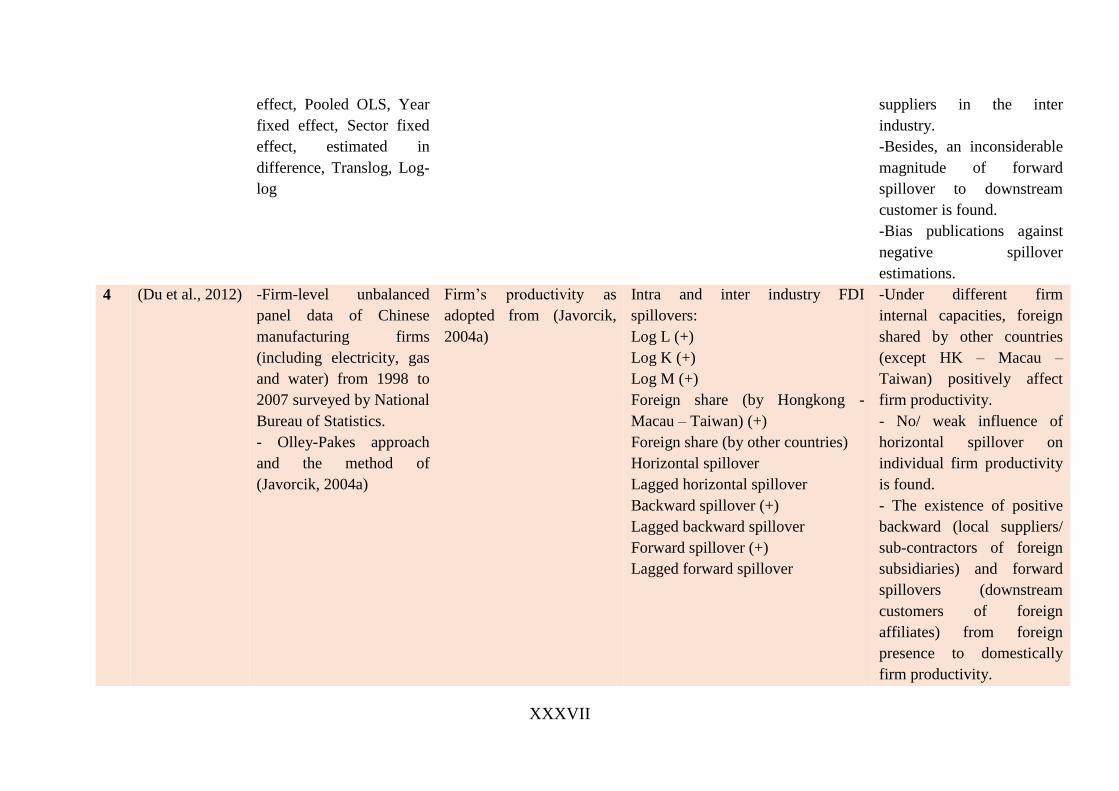
XXXVII
effect, Pooled OLS, Year
fixed effect, Sector fixed
effect, estimated in
difference, Translog, Log-
log
suppliers in the inter
industry.
-Besides, an inconsiderable
magnitude of forward
spillover to downstream
customer is found.
-Bias publications against
negative spillover
estimations.
4 (Du et al., 2012) -Firm-level unbalanced
panel data of Chinese
manufacturing firms
(including electricity, gas
and water) from 1998 to
2007 surveyed by National
Bureau of Statistics.
- Olley-Pakes approach
and the method of
(Javorcik, 2004a)
Firm’s productivity as
adopted from (Javorcik,
2004a)
Intra and inter industry FDI
spillovers:
Log L (+)
Log K (+)
Log M (+)
Foreign share (by Hongkong -
Macau – Taiwan) (+)
Foreign share (by other countries)
Horizontal spillover
Lagged horizontal spillover
Backward spillover (+)
Lagged backward spillover
Forward spillover (+)
Lagged forward spillover
-Under different firm
internal capacities, foreign
shared by other countries
(except HK – Macau –
Taiwan) positively affect
firm productivity.
- No/ weak influence of
horizontal spillover on
individual firm productivity
is found.
- The existence of positive
backward (local suppliers/
sub-contractors of foreign
subsidiaries) and forward
spillovers (downstream
customers of foreign
affiliates) from foreign
presence to domestically
firm productivity.
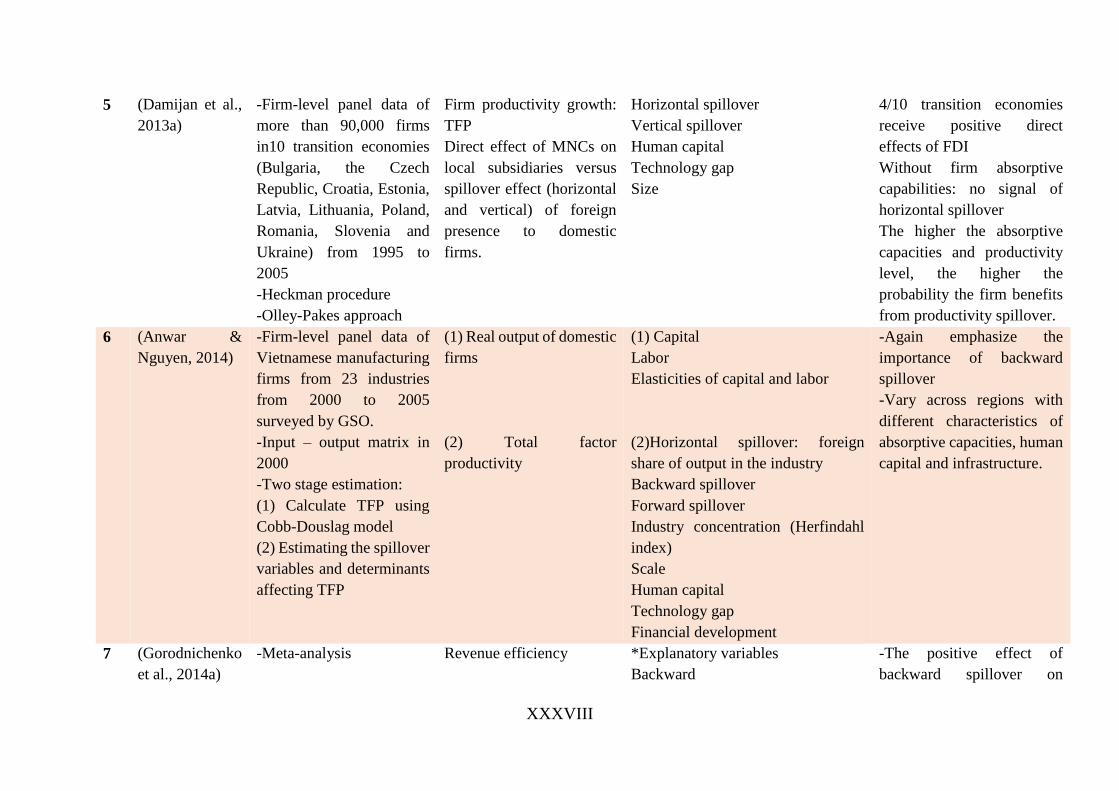
XXXVIII
5 (Damijan et al.,
2013a)
-Firm-level panel data of
more than 90,000 firms
in10 transition economies
(Bulgaria, the Czech
Republic, Croatia, Estonia,
Latvia, Lithuania, Poland,
Romania, Slovenia and
Ukraine) from 1995 to
2005
-Heckman procedure
-Olley-Pakes approach
Firm productivity growth:
TFP
Direct effect of MNCs on
local subsidiaries versus
spillover effect (horizontal
and vertical) of foreign
presence to domestic
firms.
Horizontal spillover
Vertical spillover
Human capital
Technology gap
Size
4/10 transition economies
receive positive direct
effects of FDI
Without firm absorptive
capabilities: no signal of
horizontal spillover
The higher the absorptive
capacities and productivity
level, the higher the
probability the firm benefits
from productivity spillover.
6 (Anwar &
Nguyen, 2014)
-Firm-level panel data of
Vietnamese manufacturing
firms from 23 industries
from 2000 to 2005
surveyed by GSO.
-Input – output matrix in
2000
-Two stage estimation:
(1) Calculate TFP using
Cobb-Douslag model
(2) Estimating the spillover
variables and determinants
affecting TFP
(1) Real output of domestic
firms
(2) Total factor
productivity
(1) Capital
Labor
Elasticities of capital and labor
(2)Horizontal spillover: foreign
share of output in the industry
Backward spillover
Forward spillover
Industry concentration (Herfindahl
index)
Scale
Human capital
Technology gap
Financial development
-Again emphasize the
importance of backward
spillover
-Vary across regions with
different characteristics of
absorptive capacities, human
capital and infrastructure.
7 (Gorodnichenko
et al., 2014a)
-Meta-analysis Revenue efficiency
*Explanatory variables
Backward
-The positive effect of
backward spillover on
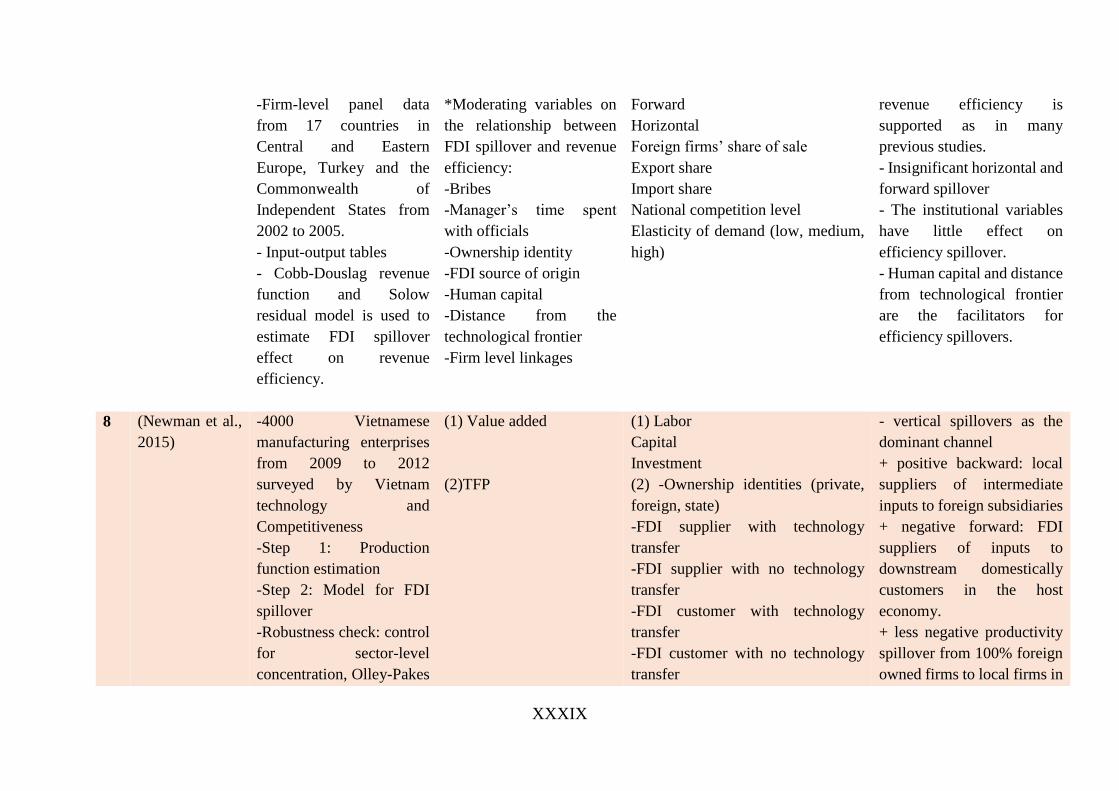
XXXIX
-Firm-level panel data
from 17 countries in
Central and Eastern
Europe, Turkey and the
Commonwealth of
Independent States from
2002 to 2005.
- Input-output tables
- Cobb-Douslag revenue
function and Solow
residual model is used to
estimate FDI spillover
effect on revenue
efficiency.
*Moderating variables on
the relationship between
FDI spillover and revenue
efficiency:
-Bribes
-Manager’s time spent
with officials
-Ownership identity
-FDI source of origin
-Human capital
-Distance from the
technological frontier
-Firm level linkages
Forward
Horizontal
Foreign firms’ share of sale
Export share
Import share
National competition level
Elasticity of demand (low, medium,
high)
revenue efficiency is
supported as in many
previous studies.
- Insignificant horizontal and
forward spillover
- The institutional variables
have little effect on
efficiency spillover.
- Human capital and distance
from technological frontier
are the facilitators for
efficiency spillovers.
8 (Newman et al.,
2015)
-4000 Vietnamese
manufacturing enterprises
from 2009 to 2012
surveyed by Vietnam
technology and
Competitiveness
-Step 1: Production
function estimation
-Step 2: Model for FDI
spillover
-Robustness check: control
for sector-level
concentration, Olley-Pakes
(1) Value added
(2)TFP
(1) Labor
Capital
Investment
(2) -Ownership identities (private,
foreign, state)
-FDI supplier with technology
transfer
-FDI supplier with no technology
transfer
-FDI customer with technology
transfer
-FDI customer with no technology
transfer
- vertical spillovers as the
dominant channel
+ positive backward: local
suppliers of intermediate
inputs to foreign subsidiaries
+ negative forward: FDI
suppliers of inputs to
downstream domestically
customers in the host
economy.
+ less negative productivity
spillover from 100% foreign
owned firms to local firms in
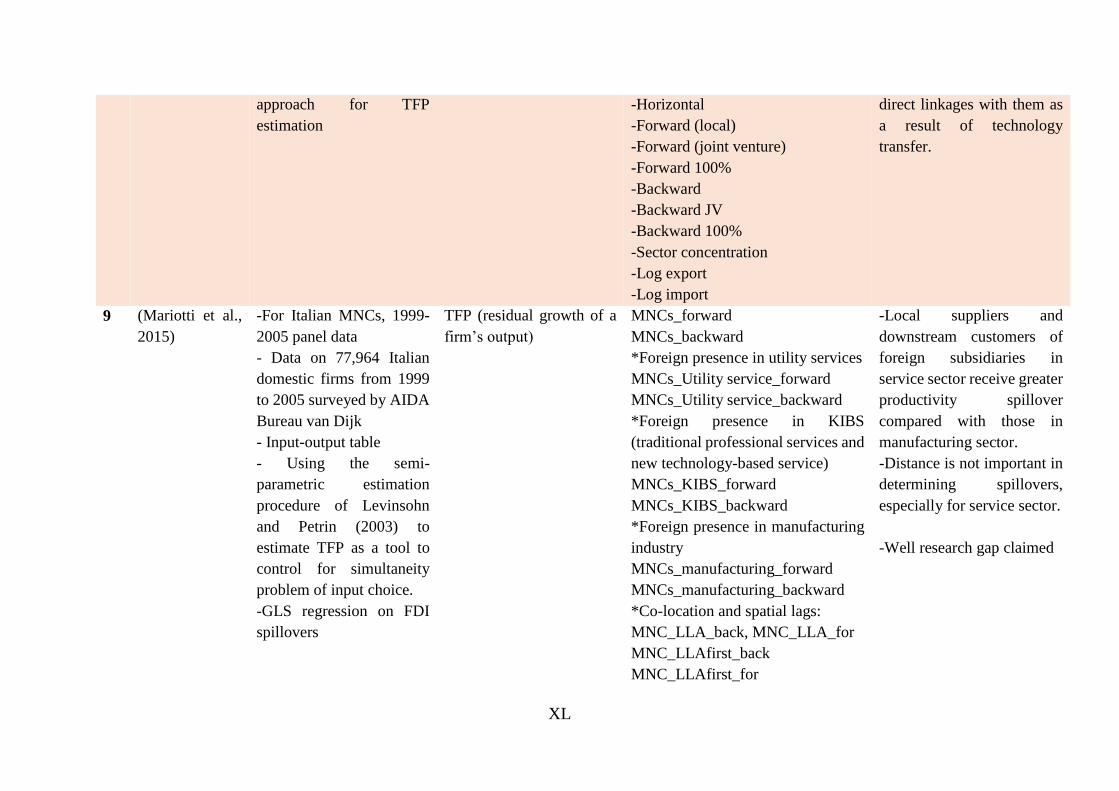
XL
approach for TFP
estimation
-Horizontal
-Forward (local)
-Forward (joint venture)
-Forward 100%
-Backward
-Backward JV
-Backward 100%
-Sector concentration
-Log export
-Log import
direct linkages with them as
a result of technology
transfer.
9 (Mariotti et al.,
2015)
-For Italian MNCs, 1999-
2005 panel data
- Data on 77,964 Italian
domestic firms from 1999
to 2005 surveyed by AIDA
Bureau van Dijk
- Input-output table
- Using the semi-
parametric estimation
procedure of Levinsohn
and Petrin (2003) to
estimate TFP as a tool to
control for simultaneity
problem of input choice.
-GLS regression on FDI
spillovers
TFP (residual growth of a
firm’s output)
MNCs_forward
MNCs_backward
*Foreign presence in utility services
MNCs_Utility service_forward
MNCs_Utility service_backward
*Foreign presence in KIBS
(traditional professional services and
new technology-based service)
MNCs_KIBS_forward
MNCs_KIBS_backward
*Foreign presence in manufacturing
industry
MNCs_manufacturing_forward
MNCs_manufacturing_backward
*Co-location and spatial lags:
MNC_LLA_back, MNC_LLA_for
MNC_LLAfirst_back
MNC_LLAfirst_for
-Local suppliers and
downstream customers of
foreign subsidiaries in
service sector receive greater
productivity spillover
compared with those in
manufacturing sector.
-Distance is not important in
determining spillovers,
especially for service sector.
-Well research gap claimed
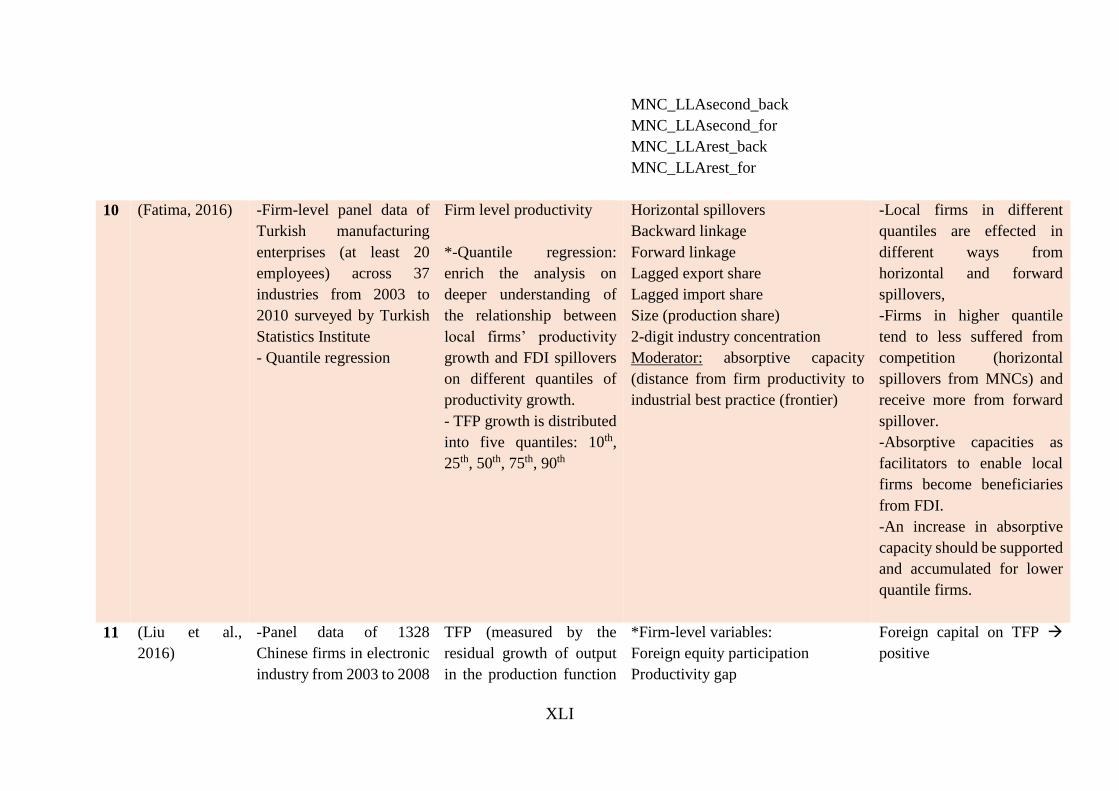
XLI
MNC_LLAsecond_back
MNC_LLAsecond_for
MNC_LLArest_back
MNC_LLArest_for
10 (Fatima, 2016) -Firm-level panel data of
Turkish manufacturing
enterprises (at least 20
employees) across 37
industries from 2003 to
2010 surveyed by Turkish
Statistics Institute
- Quantile regression
Firm level productivity
*-Quantile regression:
enrich the analysis on
deeper understanding of
the relationship between
local firms’ productivity
growth and FDI spillovers
on different quantiles of
productivity growth.
- TFP growth is distributed
into five quantiles: 10th,
25th, 50th, 75th, 90th
Horizontal spillovers
Backward linkage
Forward linkage
Lagged export share
Lagged import share
Size (production share)
2-digit industry concentration
Moderator: absorptive capacity
(distance from firm productivity to
industrial best practice (frontier)
-Local firms in different
quantiles are effected in
different ways from
horizontal and forward
spillovers,
-Firms in higher quantile
tend to less suffered from
competition (horizontal
spillovers from MNCs) and
receive more from forward
spillover.
-Absorptive capacities as
facilitators to enable local
firms become beneficiaries
from FDI.
-An increase in absorptive
capacity should be supported
and accumulated for lower
quantile firms.
11 (Liu et al.,
2016)
-Panel data of 1328
Chinese firms in electronic
industry from 2003 to 2008
TFP (measured by the
residual growth of output
in the production function
*Firm-level variables:
Foreign equity participation
Productivity gap
Foreign capital on TFP
positive
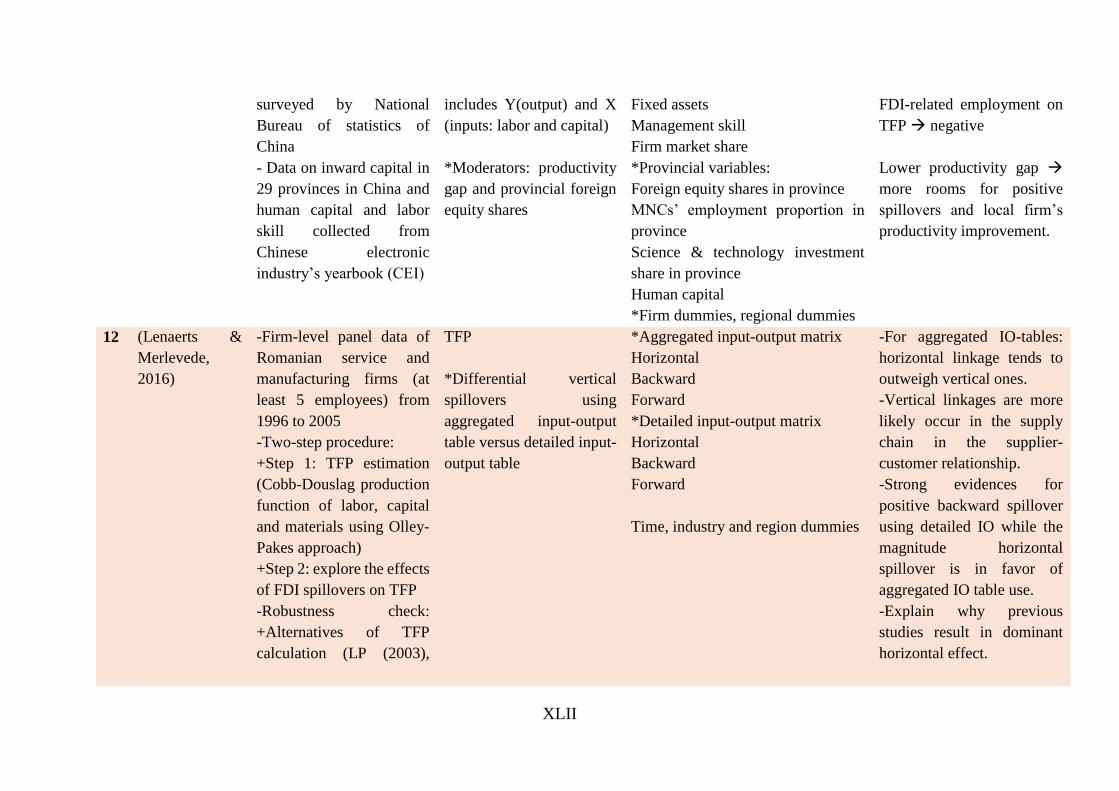
XLII
surveyed by National
Bureau of statistics of
China
- Data on inward capital in
29 provinces in China and
human capital and labor
skill collected from
Chinese electronic
industry’s yearbook (CEI)
includes Y(output) and X
(inputs: labor and capital)
*Moderators: productivity
gap and provincial foreign
equity shares
Fixed assets
Management skill
Firm market share
*Provincial variables:
Foreign equity shares in province
MNCs’ employment proportion in
province
Science & technology investment
share in province
Human capital
*Firm dummies, regional dummies
FDI-related employment on
TFP negative
Lower productivity gap
more rooms for positive
spillovers and local firm’s
productivity improvement.
12 (Lenaerts &
Merlevede,
2016)
-Firm-level panel data of
Romanian service and
manufacturing firms (at
least 5 employees) from
1996 to 2005
-Two-step procedure:
+Step 1: TFP estimation
(Cobb-Douslag production
function of labor, capital
and materials using Olley-
Pakes approach)
+Step 2: explore the effects
of FDI spillovers on TFP
-Robustness check:
+Alternatives of TFP
calculation (LP (2003),
TFP
*Differential vertical
spillovers using
aggregated input-output
table versus detailed input-
output table
*Aggregated input-output matrix
Horizontal
Backward
Forward
*Detailed input-output matrix
Horizontal
Backward
Forward
Time, industry and region dummies
-For aggregated IO-tables:
horizontal linkage tends to
outweigh vertical ones.
-Vertical linkages are more
likely occur in the supply
chain in the supplier-
customer relationship.
-Strong evidences for
positive backward spillover
using detailed IO while the
magnitude horizontal
spillover is in favor of
aggregated IO table use.
-Explain why previous
studies result in dominant
horizontal effect.
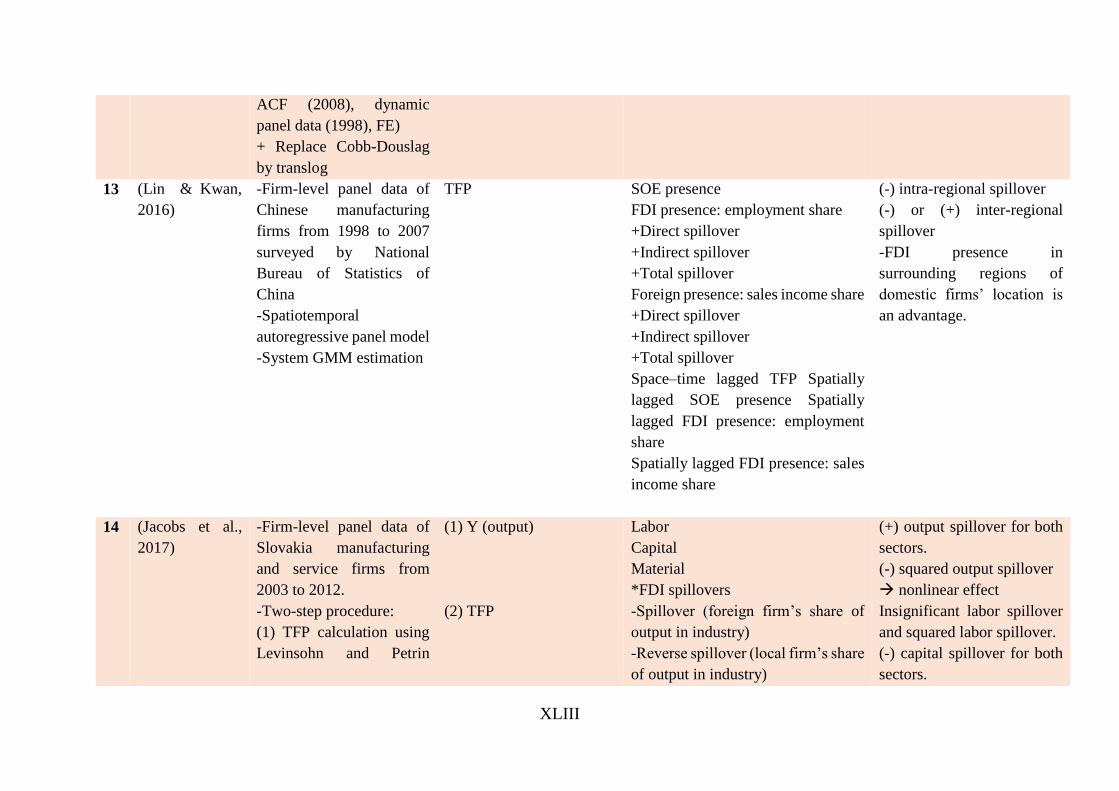
XLIII
ACF (2008), dynamic
panel data (1998), FE)
+ Replace Cobb-Douslag
by translog
13 (Lin & Kwan,
2016)
-Firm-level panel data of
Chinese manufacturing
firms from 1998 to 2007
surveyed by National
Bureau of Statistics of
China
-Spatiotemporal
autoregressive panel model
-System GMM estimation
TFP SOE presence
FDI presence: employment share
+Direct spillover
+Indirect spillover
+Total spillover
Foreign presence: sales income share
+Direct spillover
+Indirect spillover
+Total spillover
Space–time lagged TFP Spatially
lagged SOE presence Spatially
lagged FDI presence: employment
share
Spatially lagged FDI presence: sales
income share
(-) intra-regional spillover
(-) or (+) inter-regional
spillover
-FDI presence in
surrounding regions of
domestic firms’ location is
an advantage.
14 (Jacobs et al.,
2017)
-Firm-level panel data of
Slovakia manufacturing
and service firms from
2003 to 2012.
-Two-step procedure:
(1) TFP calculation using
Levinsohn and Petrin
(1) Y (output)
(2) TFP
Labor
Capital
Material
*FDI spillovers
-Spillover (foreign firm’s share of
output in industry)
-Reverse spillover (local firm’s share
of output in industry)
(+) output spillover for both
sectors.
(-) squared output spillover
nonlinear effect
Insignificant labor spillover
and squared labor spillover.
(-) capital spillover for both
sectors.
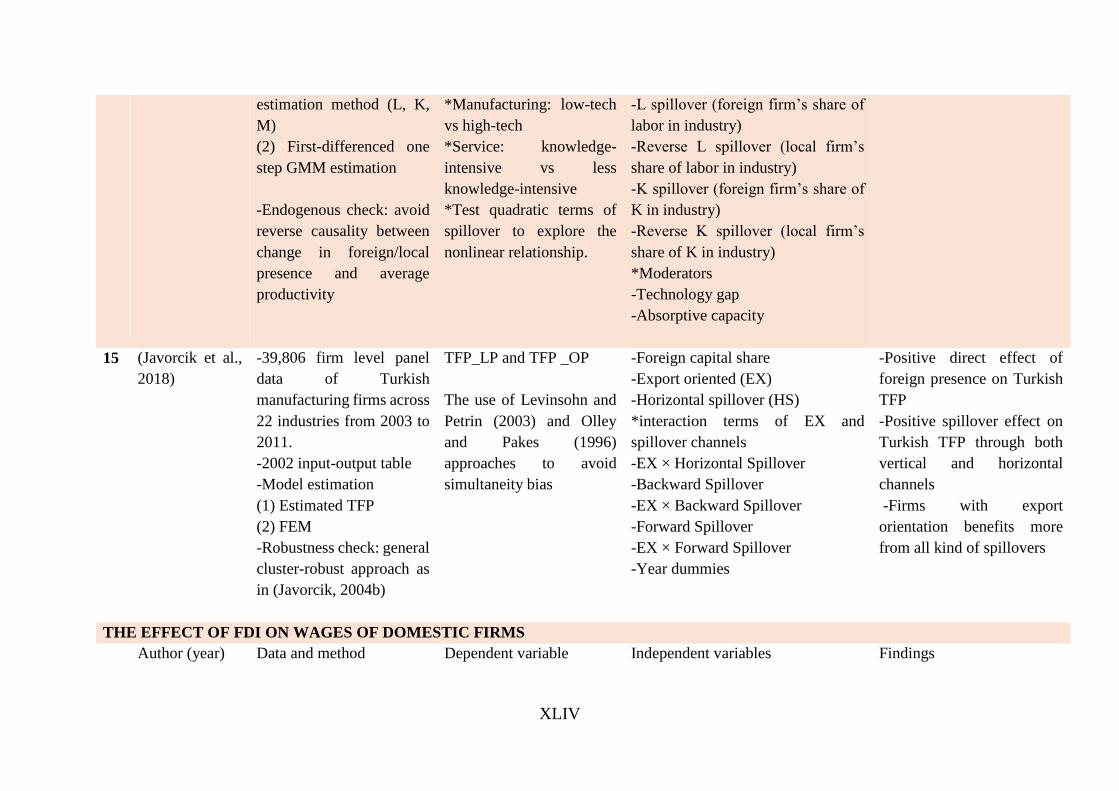
XLIV
estimation method (L, K,
M)
(2) First-differenced one
step GMM estimation
-Endogenous check: avoid
reverse causality between
change in foreign/local
presence and average
productivity
*Manufacturing: low-tech
vs high-tech
*Service: knowledge-
intensive vs less
knowledge-intensive
*Test quadratic terms of
spillover to explore the
nonlinear relationship.
-L spillover (foreign firm’s share of
labor in industry)
-Reverse L spillover (local firm’s
share of labor in industry)
-K spillover (foreign firm’s share of
K in industry)
-Reverse K spillover (local firm’s
share of K in industry)
*Moderators
-Technology gap
-Absorptive capacity
15 (Javorcik et al.,
2018)
-39,806 firm level panel
data of Turkish
manufacturing firms across
22 industries from 2003 to
2011.
-2002 input-output table
-Model estimation
(1) Estimated TFP
(2) FEM
-Robustness check: general
cluster-robust approach as
in (Javorcik, 2004b)
TFP_LP and TFP _OP
The use of Levinsohn and
Petrin (2003) and Olley
and Pakes (1996)
approaches to avoid
simultaneity bias
-Foreign capital share
-Export oriented (EX)
-Horizontal spillover (HS)
*interaction terms of EX and
spillover channels
-EX × Horizontal Spillover
-Backward Spillover
-EX × Backward Spillover
-Forward Spillover
-EX × Forward Spillover
-Year dummies
-Positive direct effect of
foreign presence on Turkish
TFP
-Positive spillover effect on
Turkish TFP through both
vertical and horizontal
channels
-Firms with export
orientation benefits more
from all kind of spillovers
THE EFFECT OF FDI ON WAGES OF DOMESTIC FIRMS
Author (year) Data and method Dependent variable Independent variables Findings
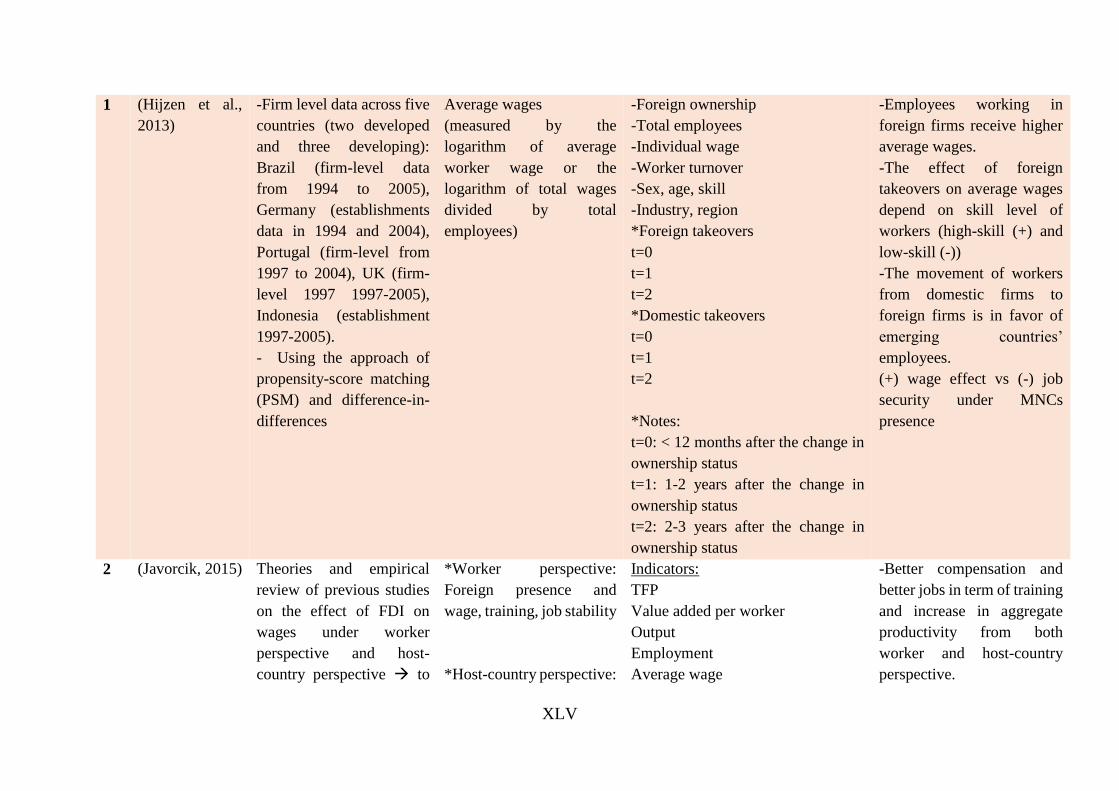
XLV
1 (Hijzen et al.,
2013)
-Firm level data across five
countries (two developed
and three developing):
Brazil (firm-level data
from 1994 to 2005),
Germany (establishments
data in 1994 and 2004),
Portugal (firm-level from
1997 to 2004), UK (firm-
level 1997 1997-2005),
Indonesia (establishment
1997-2005).
- Using the approach of
propensity-score matching
(PSM) and difference-in-
differences
Average wages
(measured by the
logarithm of average
worker wage or the
logarithm of total wages
divided by total
employees)
-Foreign ownership
-Total employees
-Individual wage
-Worker turnover
-Sex, age, skill
-Industry, region
*Foreign takeovers
t=0
t=1
t=2
*Domestic takeovers
t=0
t=1
t=2
*Notes:
t=0: < 12 months after the change in
ownership status
t=1: 1-2 years after the change in
ownership status
t=2: 2-3 years after the change in
ownership status
-Employees working in
foreign firms receive higher
average wages.
-The effect of foreign
takeovers on average wages
depend on skill level of
workers (high-skill (+) and
low-skill (-))
-The movement of workers
from domestic firms to
foreign firms is in favor of
emerging countries’
employees.
(+) wage effect vs (-) job
security under MNCs
presence
2 (Javorcik, 2015) Theories and empirical
review of previous studies
on the effect of FDI on
wages under worker
perspective and host-
country perspective to
*Worker perspective:
Foreign presence and
wage, training, job stability
*Host-country perspective:
Indicators:
TFP
Value added per worker
Output
Employment
Average wage
-Better compensation and
better jobs in term of training
and increase in aggregate
productivity from both
worker and host-country
perspective.
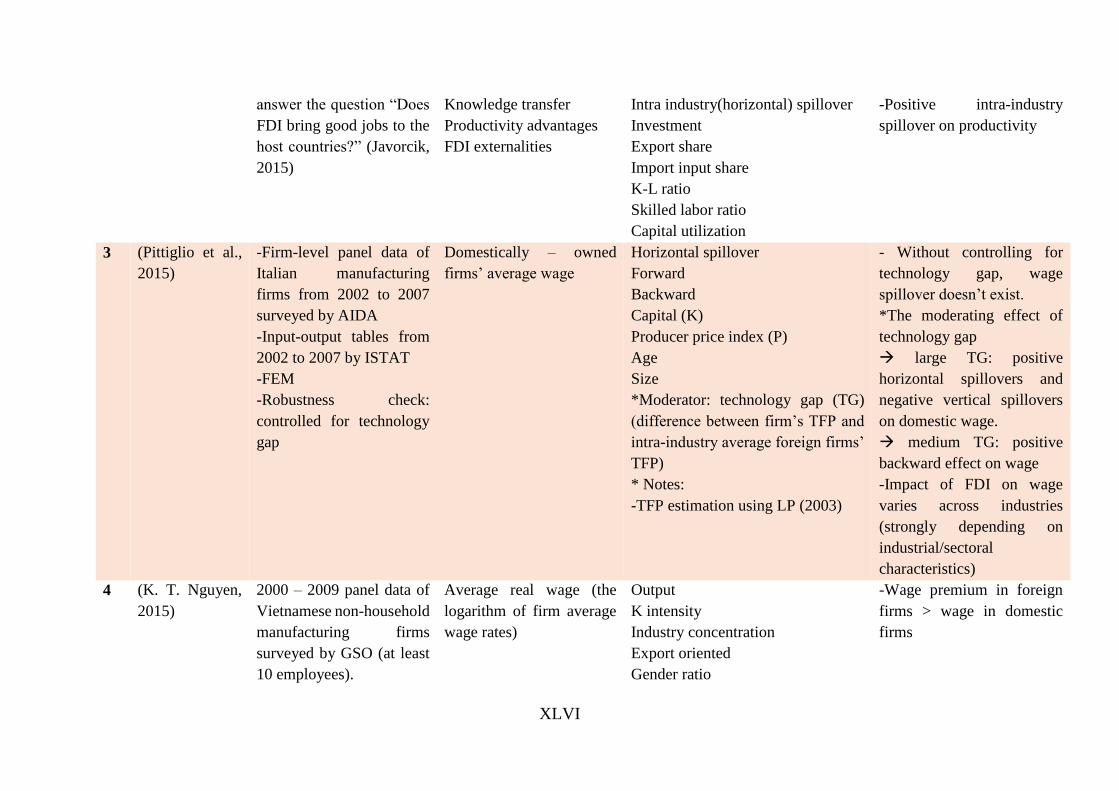
XLVI
answer the question “Does
FDI bring good jobs to the
host countries?” (Javorcik,
2015)
Knowledge transfer
Productivity advantages
FDI externalities
Intra industry(horizontal) spillover
Investment
Export share
Import input share
K-L ratio
Skilled labor ratio
Capital utilization
-Positive intra-industry
spillover on productivity
3 (Pittiglio et al.,
2015)
-Firm-level panel data of
Italian manufacturing
firms from 2002 to 2007
surveyed by AIDA
-Input-output tables from
2002 to 2007 by ISTAT
-FEM
-Robustness check:
controlled for technology
gap
Domestically – owned
firms’ average wage
Horizontal spillover
Forward
Backward
Capital (K)
Producer price index (P)
Age
Size
*Moderator: technology gap (TG)
(difference between firm’s TFP and
intra-industry average foreign firms’
TFP)
* Notes:
-TFP estimation using LP (2003)
- Without controlling for
technology gap, wage
spillover doesn’t exist.
*The moderating effect of
technology gap
large TG: positive
horizontal spillovers and
negative vertical spillovers
on domestic wage.
medium TG: positive
backward effect on wage
-Impact of FDI on wage
varies across industries
(strongly depending on
industrial/sectoral
characteristics)
4 (K. T. Nguyen,
2015)
2000 – 2009 panel data of
Vietnamese non-household
manufacturing firms
surveyed by GSO (at least
10 employees).
Average real wage (the
logarithm of firm average
wage rates)
Output
K intensity
Industry concentration
Export oriented
Gender ratio
-Wage premium in foreign
firms > wage in domestic
firms
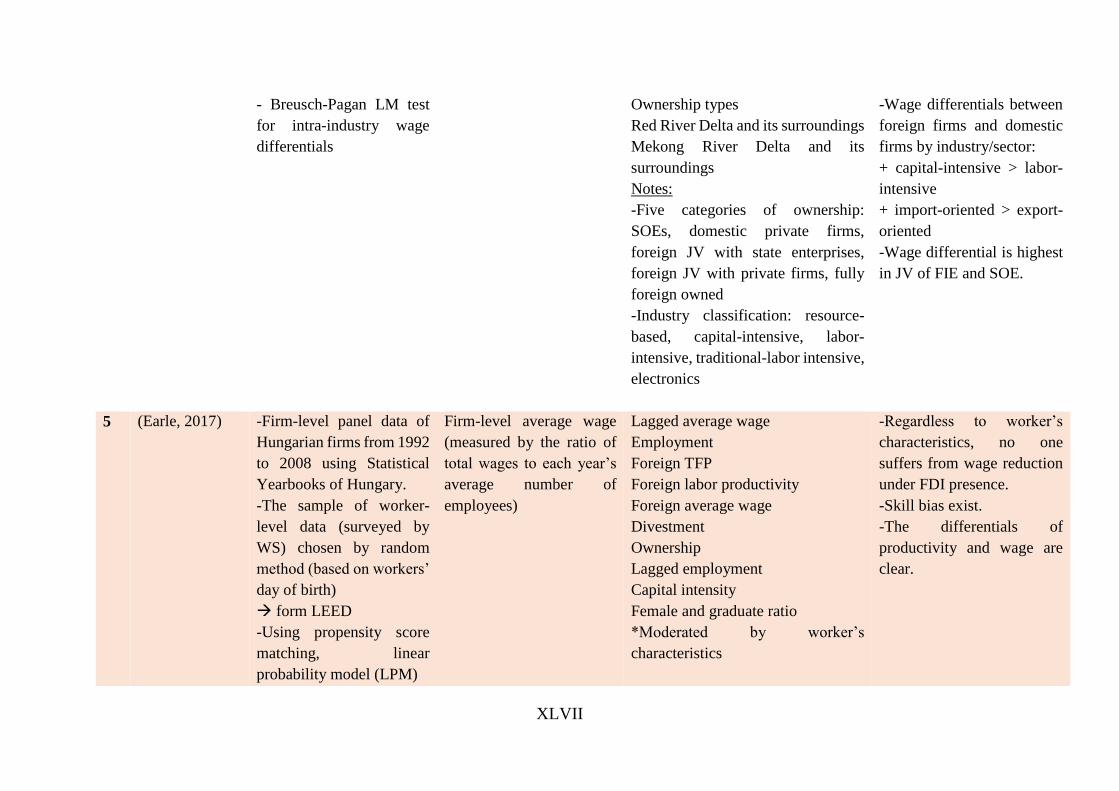
XLVII
- Breusch-Pagan LM test
for intra-industry wage
differentials
Ownership types
Red River Delta and its surroundings
Mekong River Delta and its
surroundings
Notes:
-Five categories of ownership:
SOEs, domestic private firms,
foreign JV with state enterprises,
foreign JV with private firms, fully
foreign owned
-Industry classification: resource-
based, capital-intensive, labor-
intensive, traditional-labor intensive,
electronics
-Wage differentials between
foreign firms and domestic
firms by industry/sector:
+ capital-intensive > labor-
intensive
+ import-oriented > export-
oriented
-Wage differential is highest
in JV of FIE and SOE.
5 (Earle, 2017) -Firm-level panel data of
Hungarian firms from 1992
to 2008 using Statistical
Yearbooks of Hungary.
-The sample of worker-
level data (surveyed by
WS) chosen by random
method (based on workers’
day of birth)
form LEED
-Using propensity score
matching, linear
probability model (LPM)
Firm-level average wage
(measured by the ratio of
total wages to each year’s
average number of
employees)
Lagged average wage
Employment
Foreign TFP
Foreign labor productivity
Foreign average wage
Divestment
Ownership
Lagged employment
Capital intensity
Female and graduate ratio
*Moderated by worker’s
characteristics
-Regardless to worker’s
characteristics, no one
suffers from wage reduction
under FDI presence.
-Skill bias exist.
-The differentials of
productivity and wage are
clear.
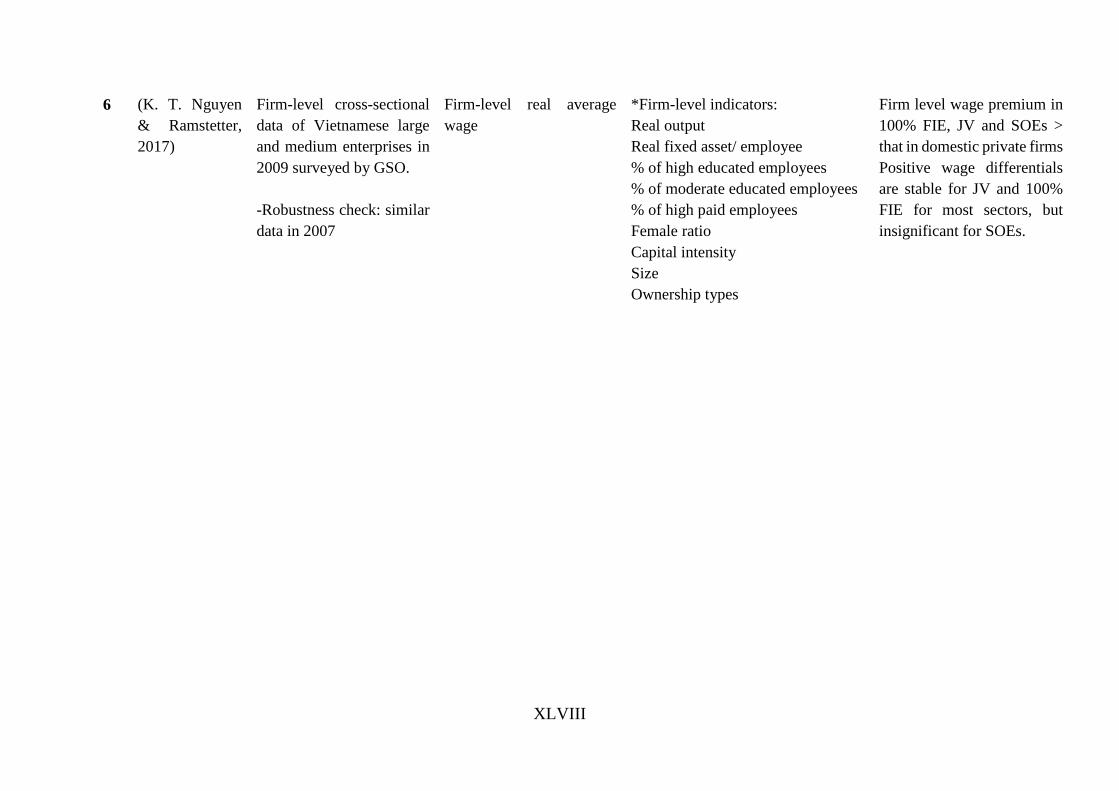
XLVIII
6 (K. T. Nguyen
& Ramstetter,
2017)
Firm-level cross-sectional
data of Vietnamese large
and medium enterprises in
2009 surveyed by GSO.
-Robustness check: similar
data in 2007
Firm-level real average
wage
*Firm-level indicators:
Real output
Real fixed asset/ employee
% of high educated employees
% of moderate educated employees
% of high paid employees
Female ratio
Capital intensity
Size
Ownership types
Firm level wage premium in
100% FIE, JV and SOEs >
that in domestic private firms
Positive wage differentials
are stable for JV and 100%
FIE for most sectors, but
insignificant for SOEs.
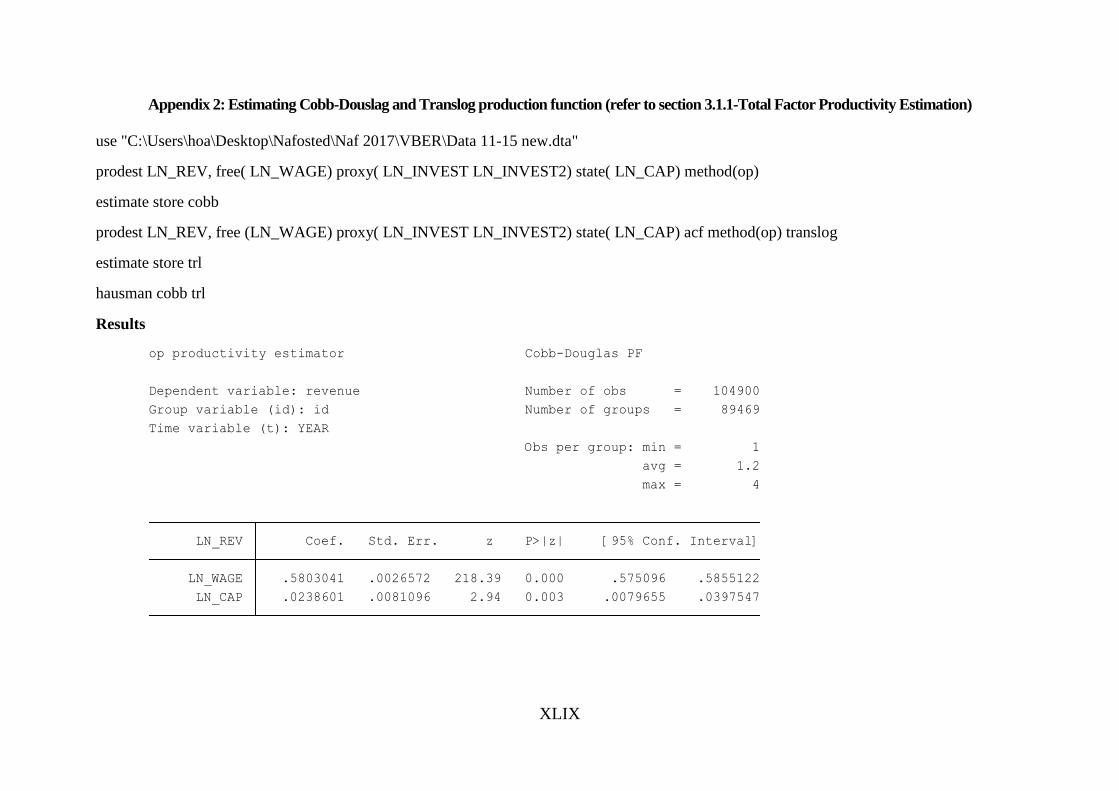
XLIX
Appendix 2: Estimating Cobb-Douslag and Translog production function (refer to section 3.1.1-Total Factor Productivity Estimation)
use "C:\Users\hoa\Desktop\Nafosted\Naf 2017\VBER\Data 11-15 new.dta"
prodest LN_REV, free( LN_WAGE) proxy( LN_INVEST LN_INVEST2) state( LN_CAP) method(op)
estimate store cobb
prodest LN_REV, free (LN_WAGE) proxy( LN_INVEST LN_INVEST2) state( LN_CAP) acf method(op) translog
estimate store trl
hausman cobb trl
Results
LN_CAP .0238601 .0081096 2.94 0.003 .0079655 .0397547
LN_WAGE .5803041 .0026572 218.39 0.000 .575096 .5855122
LN_REV Coef. Std. Err. z P>|z| [95% Conf. Interval]
max = 4
avg = 1.2
Obs per group: min = 1
Time variable (t): YEAR
Group variable (id): id Number of groups = 89469
Dependent variable: revenue Number of obs = 104900
op productivity estimator Cobb-Douglas PF
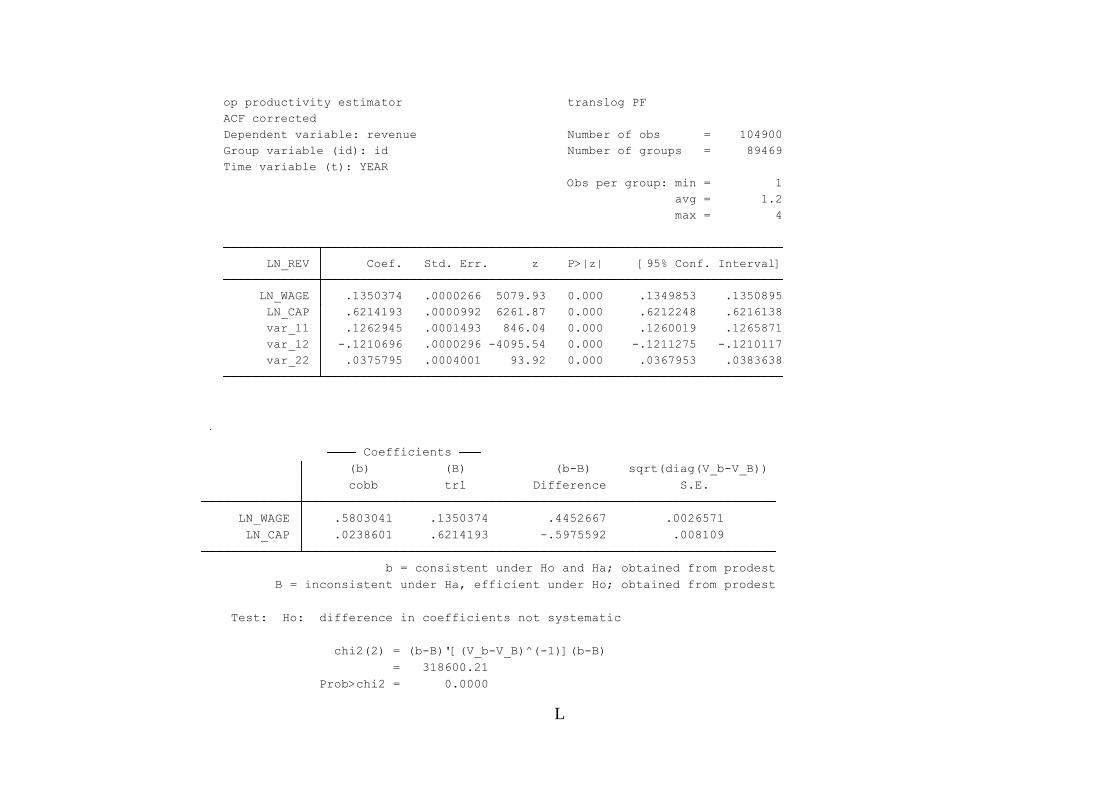
L
var_22 .0375795 .0004001 93.92 0.000 .0367953 .0383638
var_12 -.1210696 .0000296 -4095.54 0.000 -.1211275 -.1210117
var_11 .1262945 .0001493 846.04 0.000 .1260019 .1265871
LN_CAP .6214193 .0000992 6261.87 0.000 .6212248 .6216138
LN_WAGE .1350374 .0000266 5079.93 0.000 .1349853 .1350895
LN_REV Coef. Std. Err. z P>|z| [95% Conf. Interval]
max = 4
avg = 1.2
Obs per group: min = 1
Time variable (t): YEAR
Group variable (id): id Number of groups = 89469
Dependent variable: revenue Number of obs = 104900
ACF corrected
op productivity estimator translog PF
Prob>chi2 = 0.0000
= 318600.21
chi2(2) = (b-B)'[(V_b-V_B)^(-1)](b-B)
Test: Ho: difference in coefficients not systematic
B = inconsistent under Ha, efficient under Ho; obtained from prodest
b = consistent under Ho and Ha; obtained from prodest
LN_CAP .0238601 .6214193 -.5975592 .008109
LN_WAGE .5803041 .1350374 .4452667 .0026571
cobb trl Difference S.E.
(b) (B) (b-B) sqrt(diag(V_b-V_B))
Coefficients
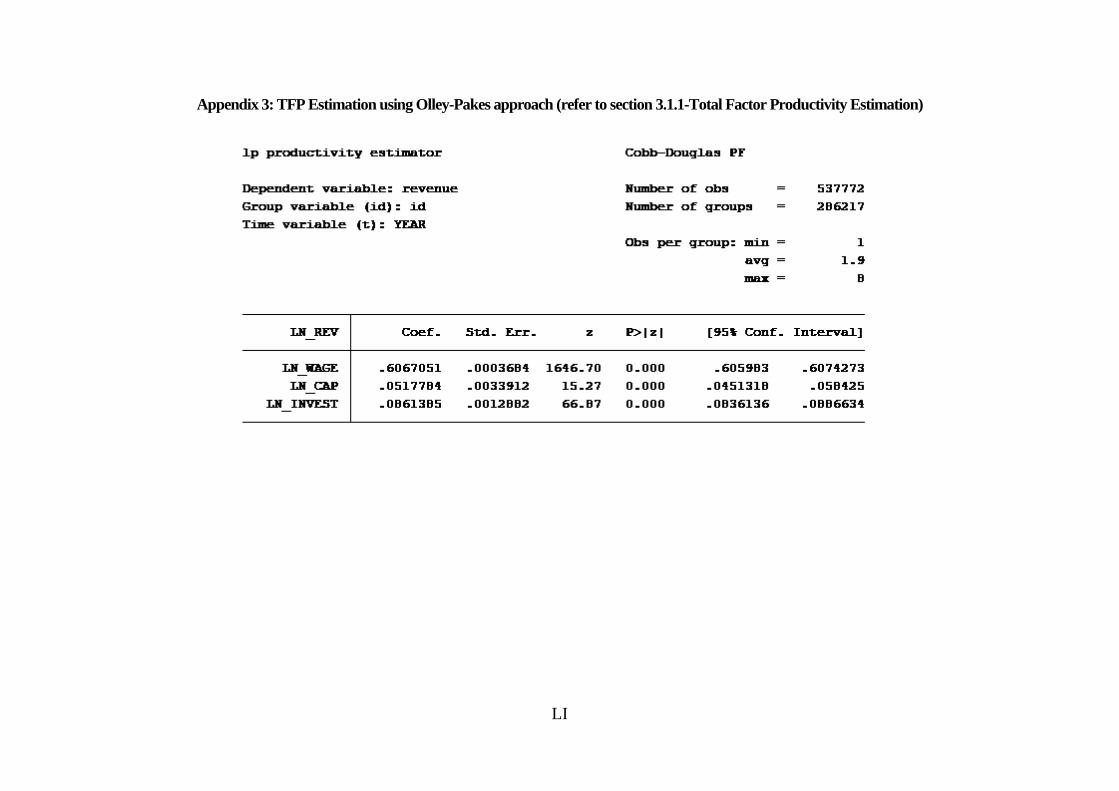
LI
Appendix 3: TFP Estimation using Olley-Pakes approach (refer to section 3.1.1-Total Factor Productivity Estimation)
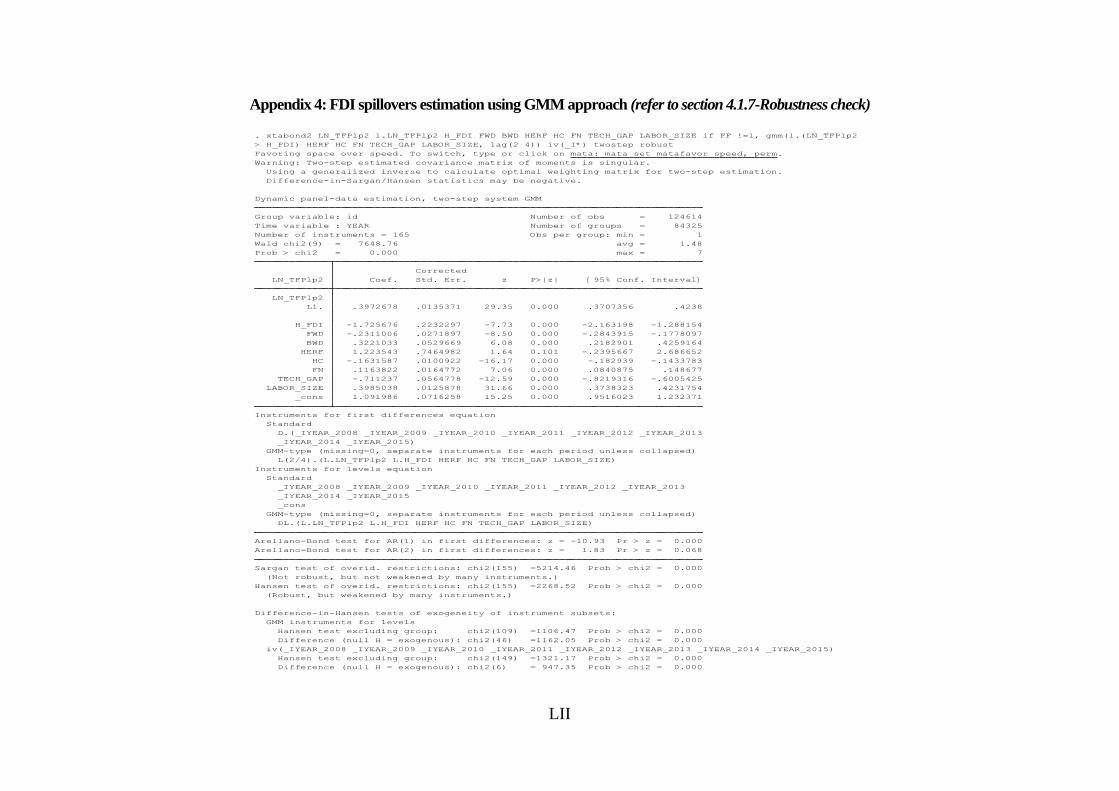
LII
Appendix 4: FDI spillovers estimation using GMM approach (refer to section 4.1.7-Robustness check)
Difference (null H = exogenous): chi2(6) = 947.35 Prob > chi2 = 0.000
Hansen test excluding group: chi2(149) =1321.17 Prob > chi2 = 0.000
iv(_IYEAR_2008 _IYEAR_2009 _IYEAR_2010 _IYEAR_2011 _IYEAR_2012 _IYEAR_2013 _IYEAR_2014 _IYEAR_2015)
Difference (null H = exogenous): chi2(46) =1162.05 Prob > chi2 = 0.000
Hansen test excluding group: chi2(109) =1106.47 Prob > chi2 = 0.000
GMM instruments for levels
Difference-in-Hansen tests of exogeneity of instrument subsets:
(Robust, but weakened by many instruments.)
Hansen test of overid. restrictions: chi2(155) =2268.52 Prob > chi2 = 0.000
(Not robust, but not weakened by many instruments.)
Sargan test of overid. restrictions: chi2(155) =5214.46 Prob > chi2 = 0.000
Arellano-Bond test for AR(2) in first differences: z = 1.83 Pr > z = 0.068
Arellano-Bond test for AR(1) in first differences: z = -10.93 Pr > z = 0.000
DL.(L.LN_TFPlp2 L.H_FDI HERF HC FN TECH_GAP LABOR_SIZE)
GMM-type (missing=0, separate instruments for each period unless collapsed)
_cons
_IYEAR_2014 _IYEAR_2015
_IYEAR_2008 _IYEAR_2009 _IYEAR_2010 _IYEAR_2011 _IYEAR_2012 _IYEAR_2013
Standard
Instruments for levels equation
L(2/4).(L.LN_TFPlp2 L.H_FDI HERF HC FN TECH_GAP LABOR_SIZE)
GMM-type (missing=0, separate instruments for each period unless collapsed)
_IYEAR_2014 _IYEAR_2015)
D.(_IYEAR_2008 _IYEAR_2009 _IYEAR_2010 _IYEAR_2011 _IYEAR_2012 _IYEAR_2013
Standard
Instruments for first differences equation
_cons 1.091986 .0716258 15.25 0.000 .9516023 1.232371
LABOR_SIZE .3985038 .0125878 31.66 0.000 .3738323 .4231754
TECH_GAP -.711237 .0564778 -12.59 0.000 -.8219316 -.6005425
FN .1163822 .0164772 7.06 0.000 .0840875 .148677
HC -.1631587 .0100922 -16.17 0.000 -.182939 -.1433783
HERF 1.223543 .7464982 1.64 0.101 -.2395667 2.686652
BWD .3221033 .0529669 6.08 0.000 .2182901 .4259164
FWD -.2311006 .0271897 -8.50 0.000 -.2843915 -.1778097
H_FDI -1.725676 .2232297 -7.73 0.000 -2.163198 -1.288154
L1. .3972678 .0135371 29.35 0.000 .3707356 .4238
LN_TFPlp2
LN_TFPlp2 Coef. Std. Err. z P>|z| [95% Conf. Interval]
Corrected
Prob > chi2 = 0.000 max = 7
Wald chi2(9) = 7648.76 avg = 1.48
Number of instruments = 165 Obs per group: min = 1
Time variable : YEAR Number of groups = 84325
Group variable: id Number of obs = 124614
Dynamic panel-data estimation, two-step system GMM
Difference-in-Sargan/Hansen statistics may be negative.
Using a generalized inverse to calculate optimal weighting matrix for two-step estimation.
Warning: Two-step estimated covariance matrix of moments is singular.
Favoring space over speed. To switch, type or click on mata: mata set matafavor speed, perm.
> H_FDI) HERF HC FN TECH_GAP LABOR_SIZE, lag(2 4)) iv(_I*) twostep robust
. xtabond2 LN_TFPlp2 l.LN_TFPlp2 H_FDI FWD BWD HERF HC FN TECH_GAP LABOR_SIZE if FF !=1, gmm(l.(LN_TFPlp2
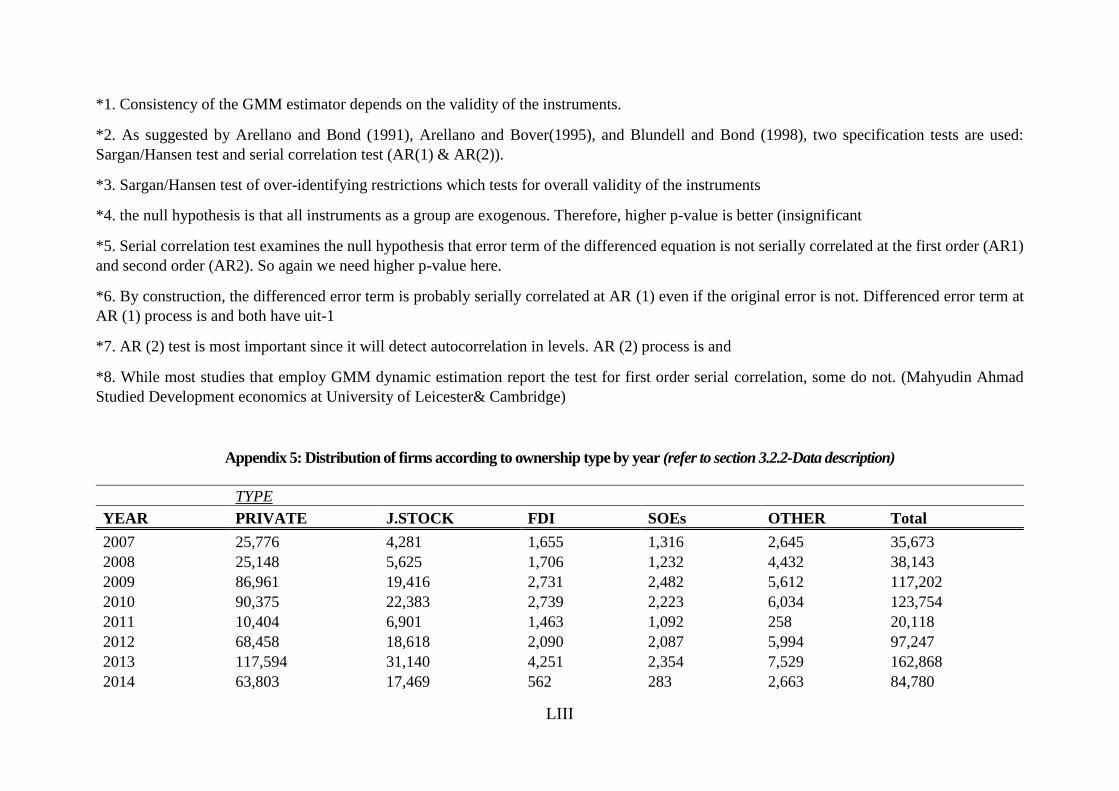
LIII
*1. Consistency of the GMM estimator depends on the validity of the instruments.
*2. As suggested by Arellano and Bond (1991), Arellano and Bover(1995), and Blundell and Bond (1998), two specification tests are used:
Sargan/Hansen test and serial correlation test (AR(1) & AR(2)).
*3. Sargan/Hansen test of over-identifying restrictions which tests for overall validity of the instruments
*4. the null hypothesis is that all instruments as a group are exogenous. Therefore, higher p-value is better (insignificant
*5. Serial correlation test examines the null hypothesis that error term of the differenced equation is not serially correlated at the first order (AR1)
and second order (AR2). So again we need higher p-value here.
*6. By construction, the differenced error term is probably serially correlated at AR (1) even if the original error is not. Differenced error term at
AR (1) process is and both have uit-1
*7. AR (2) test is most important since it will detect autocorrelation in levels. AR (2) process is and
*8. While most studies that employ GMM dynamic estimation report the test for first order serial correlation, some do not. (Mahyudin Ahmad
Studied Development economics at University of Leicester& Cambridge)
Appendix 5: Distribution of firms according to ownership type by year (refer to section 3.2.2-Data description)
TYPE
YEAR PRIVATE J.STOCK FDI SOEs OTHER Total
2007 25,776 4,281 1,655 1,316 2,645 35,673
2008 25,148 5,625 1,706 1,232 4,432 38,143
2009 86,961 19,416 2,731 2,482 5,612 117,202
2010 90,375 22,383 2,739 2,223 6,034 123,754
2011 10,404 6,901 1,463 1,092 258 20,118
2012 68,458 18,618 2,090 2,087 5,994 97,247
2013 117,594 31,140 4,251 2,354 7,529 162,868
2014 63,803 17,469 562 283 2,663 84,780
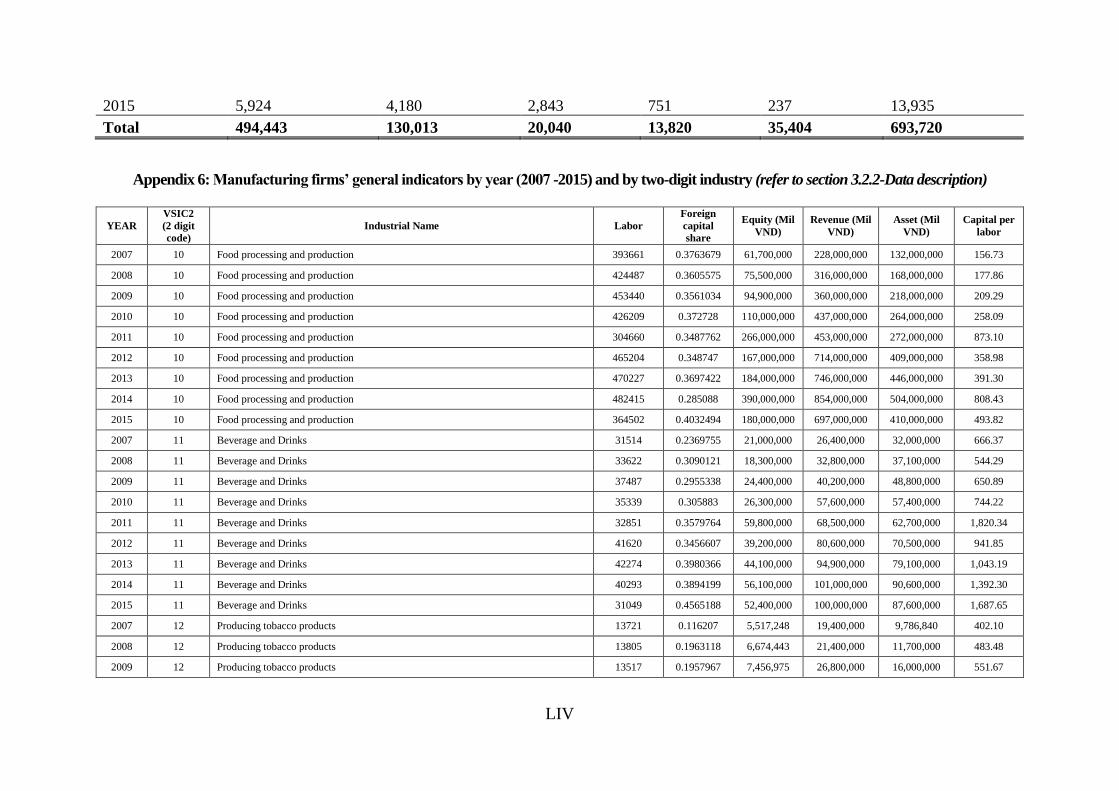
LIV
2015 5,924 4,180 2,843 751 237 13,935
Total 494,443 130,013 20,040 13,820 35,404 693,720
Appendix 6: Manufacturing firms’ general indicators by year (2007 -2015) and by two-digit industry (refer to section 3.2.2-Data description)
YEAR
VSIC2
(2 digit
code)
Industrial Name Labor
Foreign
capital
share
Equity (Mil
VND)
Revenue (Mil
VND)
Asset (Mil
VND)
Capital per
labor
2007 10 Food processing and production 393661 0.3763679 61,700,000 228,000,000 132,000,000 156.73
2008 10 Food processing and production 424487 0.3605575 75,500,000 316,000,000 168,000,000 177.86
2009 10 Food processing and production 453440 0.3561034 94,900,000 360,000,000 218,000,000 209.29
2010 10 Food processing and production 426209 0.372728 110,000,000 437,000,000 264,000,000 258.09
2011 10 Food processing and production 304660 0.3487762 266,000,000 453,000,000 272,000,000 873.10
2012 10 Food processing and production 465204 0.348747 167,000,000 714,000,000 409,000,000 358.98
2013 10 Food processing and production 470227 0.3697422 184,000,000 746,000,000 446,000,000 391.30
2014 10 Food processing and production 482415 0.285088 390,000,000 854,000,000 504,000,000 808.43
2015 10 Food processing and production 364502 0.4032494 180,000,000 697,000,000 410,000,000 493.82
2007 11 Beverage and Drinks 31514 0.2369755 21,000,000 26,400,000 32,000,000 666.37
2008 11 Beverage and Drinks 33622 0.3090121 18,300,000 32,800,000 37,100,000 544.29
2009 11 Beverage and Drinks 37487 0.2955338 24,400,000 40,200,000 48,800,000 650.89
2010 11 Beverage and Drinks 35339 0.305883 26,300,000 57,600,000 57,400,000 744.22
2011 11 Beverage and Drinks 32851 0.3579764 59,800,000 68,500,000 62,700,000 1,820.34
2012 11 Beverage and Drinks 41620 0.3456607 39,200,000 80,600,000 70,500,000 941.85
2013 11 Beverage and Drinks 42274 0.3980366 44,100,000 94,900,000 79,100,000 1,043.19
2014 11 Beverage and Drinks 40293 0.3894199 56,100,000 101,000,000 90,600,000 1,392.30
2015 11 Beverage and Drinks 31049 0.4565188 52,400,000 100,000,000 87,600,000 1,687.65
2007 12 Producing tobacco products 13721 0.116207 5,517,248 19,400,000 9,786,840 402.10
2008 12 Producing tobacco products 13805 0.1963118 6,674,443 21,400,000 11,700,000 483.48
2009 12 Producing tobacco products 13517 0.1957967 7,456,975 26,800,000 16,000,000 551.67
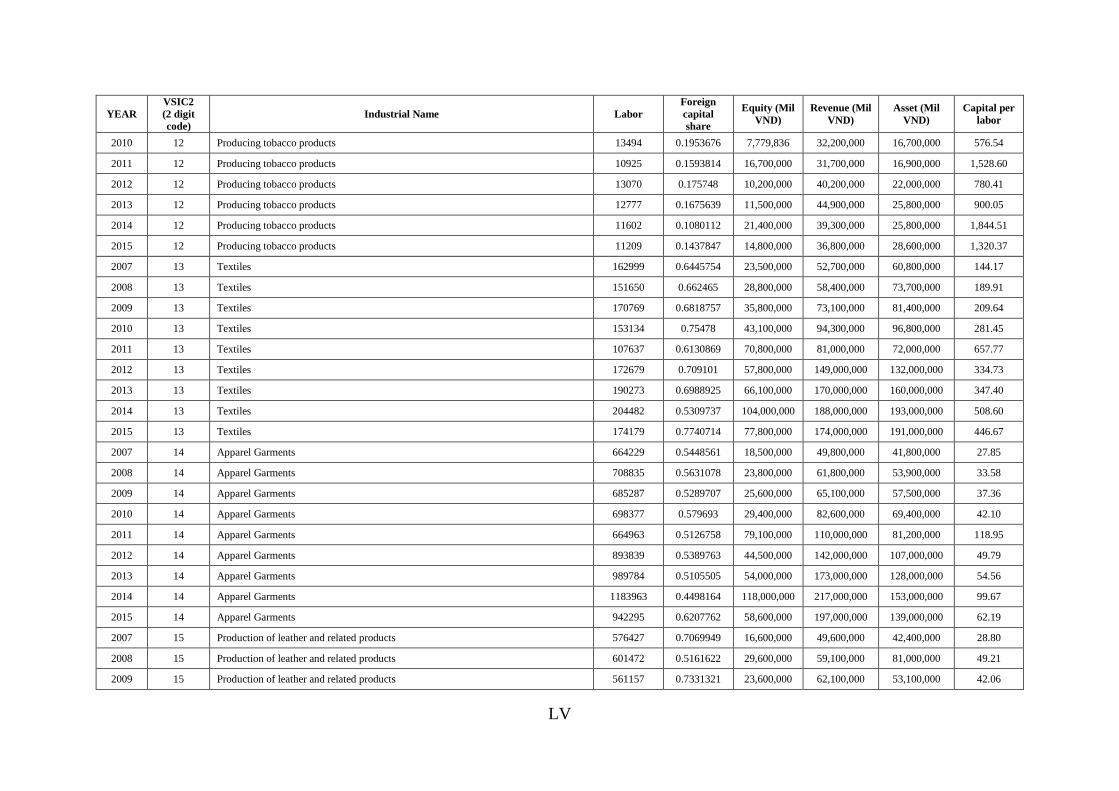
LV
YEAR
VSIC2
(2 digit
code)
Industrial Name Labor
Foreign
capital
share
Equity (Mil
VND)
Revenue (Mil
VND)
Asset (Mil
VND)
Capital per
labor
2010 12 Producing tobacco products 13494 0.1953676 7,779,836 32,200,000 16,700,000 576.54
2011 12 Producing tobacco products 10925 0.1593814 16,700,000 31,700,000 16,900,000 1,528.60
2012 12 Producing tobacco products 13070 0.175748 10,200,000 40,200,000 22,000,000 780.41
2013 12 Producing tobacco products 12777 0.1675639 11,500,000 44,900,000 25,800,000 900.05
2014 12 Producing tobacco products 11602 0.1080112 21,400,000 39,300,000 25,800,000 1,844.51
2015 12 Producing tobacco products 11209 0.1437847 14,800,000 36,800,000 28,600,000 1,320.37
2007 13 Textiles 162999 0.6445754 23,500,000 52,700,000 60,800,000 144.17
2008 13 Textiles 151650 0.662465 28,800,000 58,400,000 73,700,000 189.91
2009 13 Textiles 170769 0.6818757 35,800,000 73,100,000 81,400,000 209.64
2010 13 Textiles 153134 0.75478 43,100,000 94,300,000 96,800,000 281.45
2011 13 Textiles 107637 0.6130869 70,800,000 81,000,000 72,000,000 657.77
2012 13 Textiles 172679 0.709101 57,800,000 149,000,000 132,000,000 334.73
2013 13 Textiles 190273 0.6988925 66,100,000 170,000,000 160,000,000 347.40
2014 13 Textiles 204482 0.5309737 104,000,000 188,000,000 193,000,000 508.60
2015 13 Textiles 174179 0.7740714 77,800,000 174,000,000 191,000,000 446.67
2007 14 Apparel Garments 664229 0.5448561 18,500,000 49,800,000 41,800,000 27.85
2008 14 Apparel Garments 708835 0.5631078 23,800,000 61,800,000 53,900,000 33.58
2009 14 Apparel Garments 685287 0.5289707 25,600,000 65,100,000 57,500,000 37.36
2010 14 Apparel Garments 698377 0.579693 29,400,000 82,600,000 69,400,000 42.10
2011 14 Apparel Garments 664963 0.5126758 79,100,000 110,000,000 81,200,000 118.95
2012 14 Apparel Garments 893839 0.5389763 44,500,000 142,000,000 107,000,000 49.79
2013 14 Apparel Garments 989784 0.5105505 54,000,000 173,000,000 128,000,000 54.56
2014 14 Apparel Garments 1183963 0.4498164 118,000,000 217,000,000 153,000,000 99.67
2015 14 Apparel Garments 942295 0.6207762 58,600,000 197,000,000 139,000,000 62.19
2007 15 Production of leather and related products 576427 0.7069949 16,600,000 49,600,000 42,400,000 28.80
2008 15 Production of leather and related products 601472 0.5161622 29,600,000 59,100,000 81,000,000 49.21
2009 15 Production of leather and related products 561157 0.7331321 23,600,000 62,100,000 53,100,000 42.06
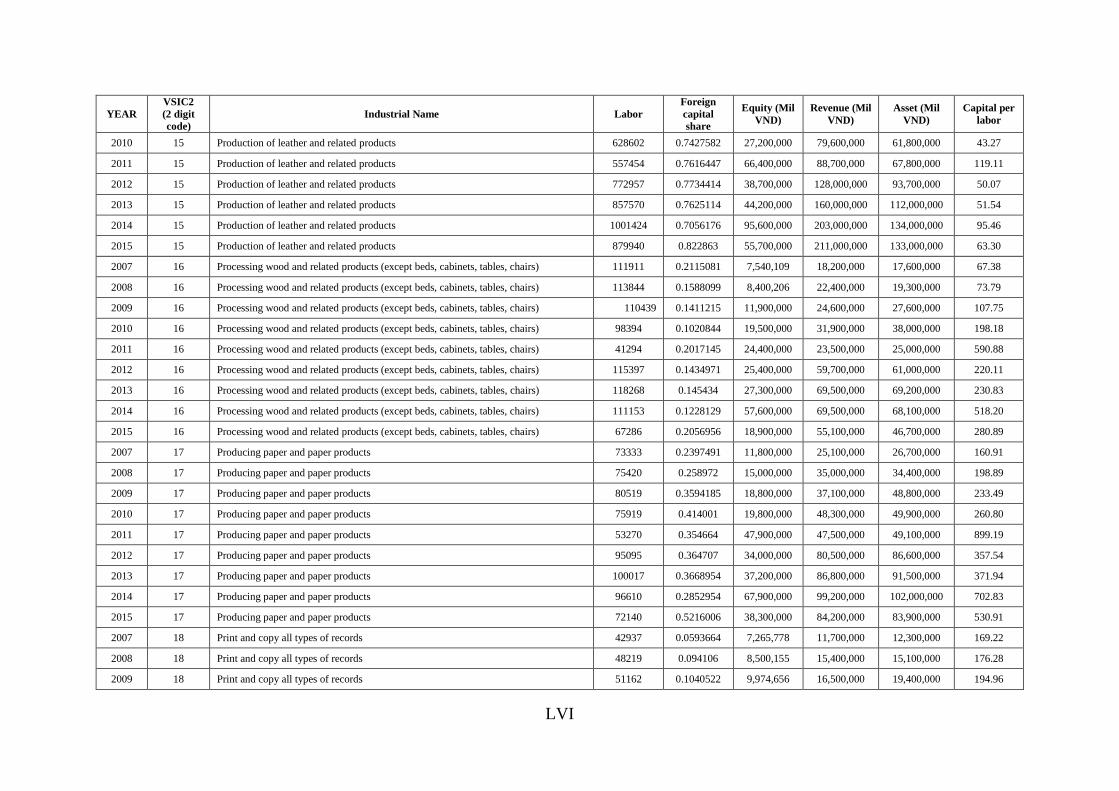
LVI
YEAR
VSIC2
(2 digit
code)
Industrial Name Labor
Foreign
capital
share
Equity (Mil
VND)
Revenue (Mil
VND)
Asset (Mil
VND)
Capital per
labor
2010 15 Production of leather and related products 628602 0.7427582 27,200,000 79,600,000 61,800,000 43.27
2011 15 Production of leather and related products 557454 0.7616447 66,400,000 88,700,000 67,800,000 119.11
2012 15 Production of leather and related products 772957 0.7734414 38,700,000 128,000,000 93,700,000 50.07
2013 15 Production of leather and related products 857570 0.7625114 44,200,000 160,000,000 112,000,000 51.54
2014 15 Production of leather and related products 1001424 0.7056176 95,600,000 203,000,000 134,000,000 95.46
2015 15 Production of leather and related products 879940 0.822863 55,700,000 211,000,000 133,000,000 63.30
2007 16 Processing wood and related products (except beds, cabinets, tables, chairs) 111911 0.2115081 7,540,109 18,200,000 17,600,000 67.38
2008 16 Processing wood and related products (except beds, cabinets, tables, chairs) 113844 0.1588099 8,400,206 22,400,000 19,300,000 73.79
2009 16 Processing wood and related products (except beds, cabinets, tables, chairs) 110439 0.1411215 11,900,000 24,600,000 27,600,000 107.75
2010 16 Processing wood and related products (except beds, cabinets, tables, chairs) 98394 0.1020844 19,500,000 31,900,000 38,000,000 198.18
2011 16 Processing wood and related products (except beds, cabinets, tables, chairs) 41294 0.2017145 24,400,000 23,500,000 25,000,000 590.88
2012 16 Processing wood and related products (except beds, cabinets, tables, chairs) 115397 0.1434971 25,400,000 59,700,000 61,000,000 220.11
2013 16 Processing wood and related products (except beds, cabinets, tables, chairs) 118268 0.145434 27,300,000 69,500,000 69,200,000 230.83
2014 16 Processing wood and related products (except beds, cabinets, tables, chairs) 111153 0.1228129 57,600,000 69,500,000 68,100,000 518.20
2015 16 Processing wood and related products (except beds, cabinets, tables, chairs) 67286 0.2056956 18,900,000 55,100,000 46,700,000 280.89
2007 17 Producing paper and paper products 73333 0.2397491 11,800,000 25,100,000 26,700,000 160.91
2008 17 Producing paper and paper products 75420 0.258972 15,000,000 35,000,000 34,400,000 198.89
2009 17 Producing paper and paper products 80519 0.3594185 18,800,000 37,100,000 48,800,000 233.49
2010 17 Producing paper and paper products 75919 0.414001 19,800,000 48,300,000 49,900,000 260.80
2011 17 Producing paper and paper products 53270 0.354664 47,900,000 47,500,000 49,100,000 899.19
2012 17 Producing paper and paper products 95095 0.364707 34,000,000 80,500,000 86,600,000 357.54
2013 17 Producing paper and paper products 100017 0.3668954 37,200,000 86,800,000 91,500,000 371.94
2014 17 Producing paper and paper products 96610 0.2852954 67,900,000 99,200,000 102,000,000 702.83
2015 17 Producing paper and paper products 72140 0.5216006 38,300,000 84,200,000 83,900,000 530.91
2007 18 Print and copy all types of records 42937 0.0593664 7,265,778 11,700,000 12,300,000 169.22
2008 18 Print and copy all types of records 48219 0.094106 8,500,155 15,400,000 15,100,000 176.28
2009 18 Print and copy all types of records 51162 0.1040522 9,974,656 16,500,000 19,400,000 194.96
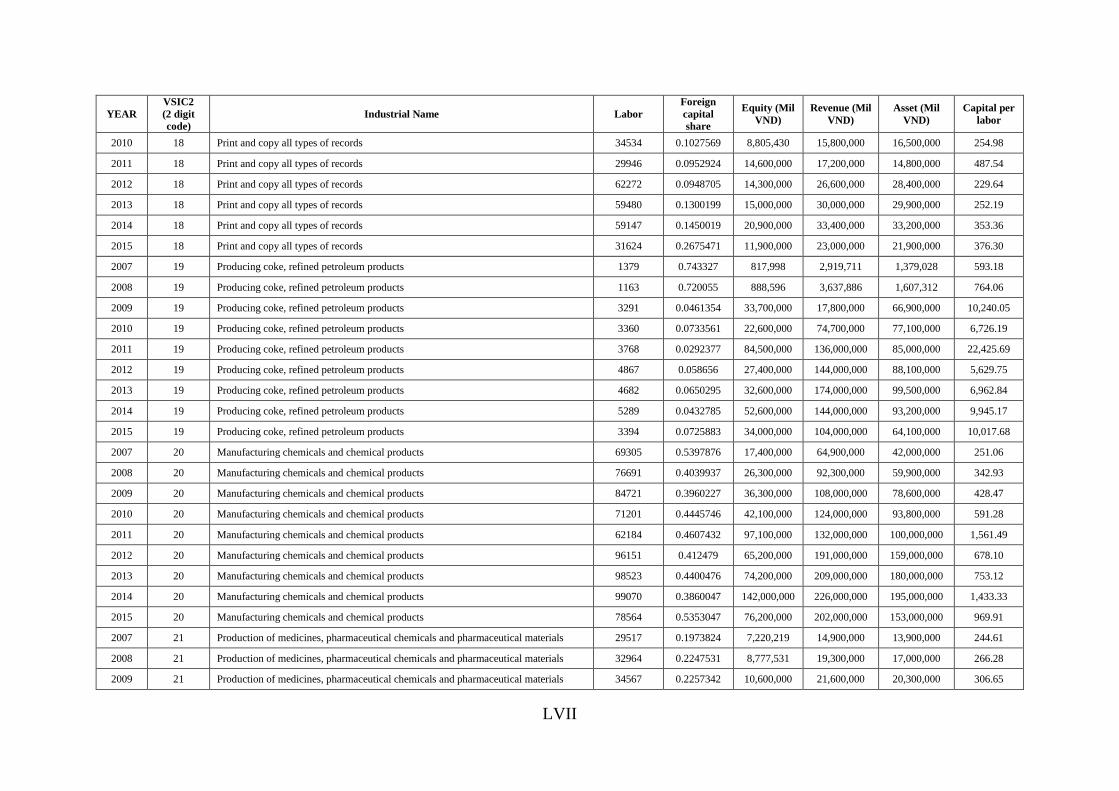
LVII
YEAR
VSIC2
(2 digit
code)
Industrial Name Labor
Foreign
capital
share
Equity (Mil
VND)
Revenue (Mil
VND)
Asset (Mil
VND)
Capital per
labor
2010 18 Print and copy all types of records 34534 0.1027569 8,805,430 15,800,000 16,500,000 254.98
2011 18 Print and copy all types of records 29946 0.0952924 14,600,000 17,200,000 14,800,000 487.54
2012 18 Print and copy all types of records 62272 0.0948705 14,300,000 26,600,000 28,400,000 229.64
2013 18 Print and copy all types of records 59480 0.1300199 15,000,000 30,000,000 29,900,000 252.19
2014 18 Print and copy all types of records 59147 0.1450019 20,900,000 33,400,000 33,200,000 353.36
2015 18 Print and copy all types of records 31624 0.2675471 11,900,000 23,000,000 21,900,000 376.30
2007 19 Producing coke, refined petroleum products 1379 0.743327 817,998 2,919,711 1,379,028 593.18
2008 19 Producing coke, refined petroleum products 1163 0.720055 888,596 3,637,886 1,607,312 764.06
2009 19 Producing coke, refined petroleum products 3291 0.0461354 33,700,000 17,800,000 66,900,000 10,240.05
2010 19 Producing coke, refined petroleum products 3360 0.0733561 22,600,000 74,700,000 77,100,000 6,726.19
2011 19 Producing coke, refined petroleum products 3768 0.0292377 84,500,000 136,000,000 85,000,000 22,425.69
2012 19 Producing coke, refined petroleum products 4867 0.058656 27,400,000 144,000,000 88,100,000 5,629.75
2013 19 Producing coke, refined petroleum products 4682 0.0650295 32,600,000 174,000,000 99,500,000 6,962.84
2014 19 Producing coke, refined petroleum products 5289 0.0432785 52,600,000 144,000,000 93,200,000 9,945.17
2015 19 Producing coke, refined petroleum products 3394 0.0725883 34,000,000 104,000,000 64,100,000 10,017.68
2007 20 Manufacturing chemicals and chemical products 69305 0.5397876 17,400,000 64,900,000 42,000,000 251.06
2008 20 Manufacturing chemicals and chemical products 76691 0.4039937 26,300,000 92,300,000 59,900,000 342.93
2009 20 Manufacturing chemicals and chemical products 84721 0.3960227 36,300,000 108,000,000 78,600,000 428.47
2010 20 Manufacturing chemicals and chemical products 71201 0.4445746 42,100,000 124,000,000 93,800,000 591.28
2011 20 Manufacturing chemicals and chemical products 62184 0.4607432 97,100,000 132,000,000 100,000,000 1,561.49
2012 20 Manufacturing chemicals and chemical products 96151 0.412479 65,200,000 191,000,000 159,000,000 678.10
2013 20 Manufacturing chemicals and chemical products 98523 0.4400476 74,200,000 209,000,000 180,000,000 753.12
2014 20 Manufacturing chemicals and chemical products 99070 0.3860047 142,000,000 226,000,000 195,000,000 1,433.33
2015 20 Manufacturing chemicals and chemical products 78564 0.5353047 76,200,000 202,000,000 153,000,000 969.91
2007 21 Production of medicines, pharmaceutical chemicals and pharmaceutical materials 29517 0.1973824 7,220,219 14,900,000 13,900,000 244.61
2008 21 Production of medicines, pharmaceutical chemicals and pharmaceutical materials 32964 0.2247531 8,777,531 19,300,000 17,000,000 266.28
2009 21 Production of medicines, pharmaceutical chemicals and pharmaceutical materials 34567 0.2257342 10,600,000 21,600,000 20,300,000 306.65
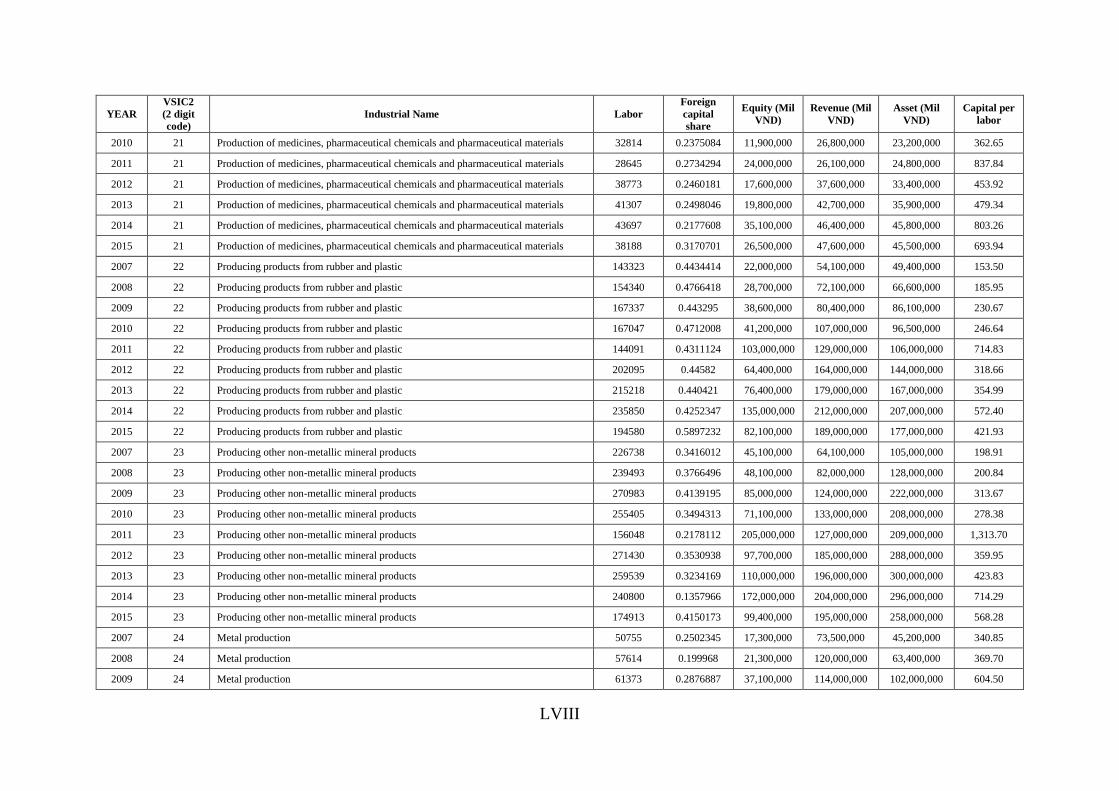
LVIII
YEAR
VSIC2
(2 digit
code)
Industrial Name Labor
Foreign
capital
share
Equity (Mil
VND)
Revenue (Mil
VND)
Asset (Mil
VND)
Capital per
labor
2010 21 Production of medicines, pharmaceutical chemicals and pharmaceutical materials 32814 0.2375084 11,900,000 26,800,000 23,200,000 362.65
2011 21 Production of medicines, pharmaceutical chemicals and pharmaceutical materials 28645 0.2734294 24,000,000 26,100,000 24,800,000 837.84
2012 21 Production of medicines, pharmaceutical chemicals and pharmaceutical materials 38773 0.2460181 17,600,000 37,600,000 33,400,000 453.92
2013 21 Production of medicines, pharmaceutical chemicals and pharmaceutical materials 41307 0.2498046 19,800,000 42,700,000 35,900,000 479.34
2014 21 Production of medicines, pharmaceutical chemicals and pharmaceutical materials 43697 0.2177608 35,100,000 46,400,000 45,800,000 803.26
2015 21 Production of medicines, pharmaceutical chemicals and pharmaceutical materials 38188 0.3170701 26,500,000 47,600,000 45,500,000 693.94
2007 22 Producing products from rubber and plastic 143323 0.4434414 22,000,000 54,100,000 49,400,000 153.50
2008 22 Producing products from rubber and plastic 154340 0.4766418 28,700,000 72,100,000 66,600,000 185.95
2009 22 Producing products from rubber and plastic 167337 0.443295 38,600,000 80,400,000 86,100,000 230.67
2010 22 Producing products from rubber and plastic 167047 0.4712008 41,200,000 107,000,000 96,500,000 246.64
2011 22 Producing products from rubber and plastic 144091 0.4311124 103,000,000 129,000,000 106,000,000 714.83
2012 22 Producing products from rubber and plastic 202095 0.44582 64,400,000 164,000,000 144,000,000 318.66
2013 22 Producing products from rubber and plastic 215218 0.440421 76,400,000 179,000,000 167,000,000 354.99
2014 22 Producing products from rubber and plastic 235850 0.4252347 135,000,000 212,000,000 207,000,000 572.40
2015 22 Producing products from rubber and plastic 194580 0.5897232 82,100,000 189,000,000 177,000,000 421.93
2007 23 Producing other non-metallic mineral products 226738 0.3416012 45,100,000 64,100,000 105,000,000 198.91
2008 23 Producing other non-metallic mineral products 239493 0.3766496 48,100,000 82,000,000 128,000,000 200.84
2009 23 Producing other non-metallic mineral products 270983 0.4139195 85,000,000 124,000,000 222,000,000 313.67
2010 23 Producing other non-metallic mineral products 255405 0.3494313 71,100,000 133,000,000 208,000,000 278.38
2011 23 Producing other non-metallic mineral products 156048 0.2178112 205,000,000 127,000,000 209,000,000 1,313.70
2012 23 Producing other non-metallic mineral products 271430 0.3530938 97,700,000 185,000,000 288,000,000 359.95
2013 23 Producing other non-metallic mineral products 259539 0.3234169 110,000,000 196,000,000 300,000,000 423.83
2014 23 Producing other non-metallic mineral products 240800 0.1357966 172,000,000 204,000,000 296,000,000 714.29
2015 23 Producing other non-metallic mineral products 174913 0.4150173 99,400,000 195,000,000 258,000,000 568.28
2007 24 Metal production 50755 0.2502345 17,300,000 73,500,000 45,200,000 340.85
2008 24 Metal production 57614 0.199968 21,300,000 120,000,000 63,400,000 369.70
2009 24 Metal production 61373 0.2876887 37,100,000 114,000,000 102,000,000 604.50
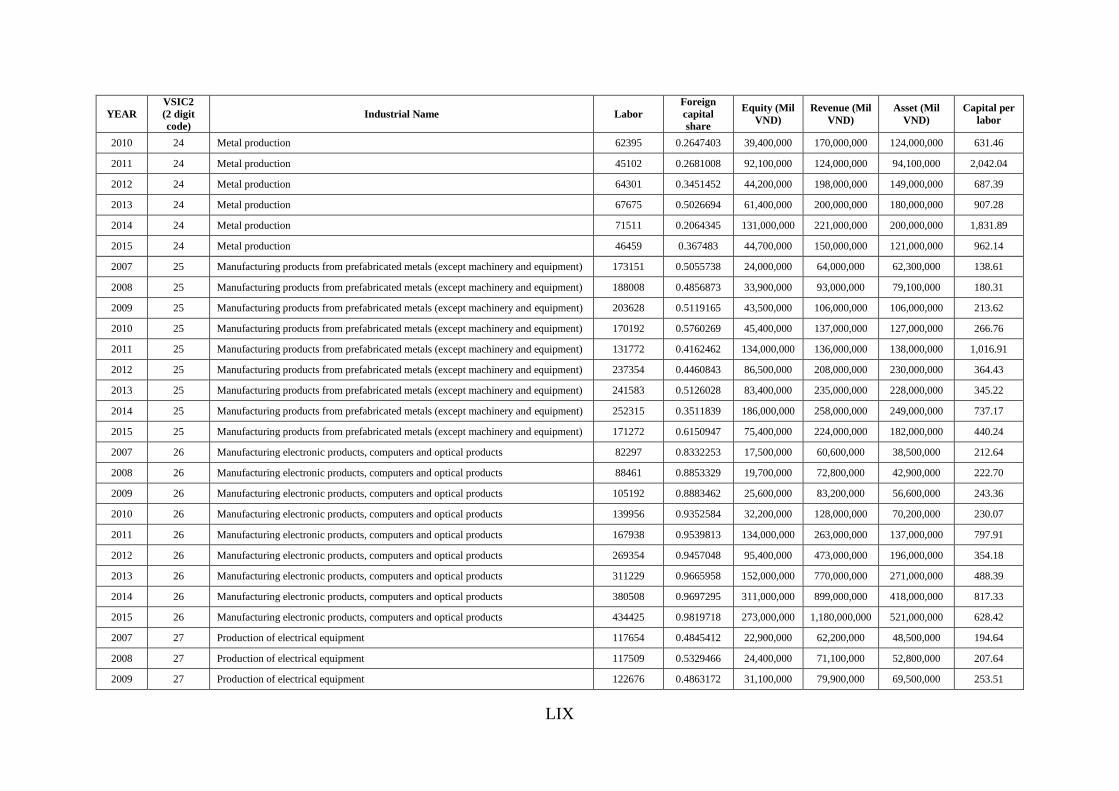
LIX
YEAR
VSIC2
(2 digit
code)
Industrial Name Labor
Foreign
capital
share
Equity (Mil
VND)
Revenue (Mil
VND)
Asset (Mil
VND)
Capital per
labor
2010 24 Metal production 62395 0.2647403 39,400,000 170,000,000 124,000,000 631.46
2011 24 Metal production 45102 0.2681008 92,100,000 124,000,000 94,100,000 2,042.04
2012 24 Metal production 64301 0.3451452 44,200,000 198,000,000 149,000,000 687.39
2013 24 Metal production 67675 0.5026694 61,400,000 200,000,000 180,000,000 907.28
2014 24 Metal production 71511 0.2064345 131,000,000 221,000,000 200,000,000 1,831.89
2015 24 Metal production 46459 0.367483 44,700,000 150,000,000 121,000,000 962.14
2007 25 Manufacturing products from prefabricated metals (except machinery and equipment) 173151 0.5055738 24,000,000 64,000,000 62,300,000 138.61
2008 25 Manufacturing products from prefabricated metals (except machinery and equipment) 188008 0.4856873 33,900,000 93,000,000 79,100,000 180.31
2009 25 Manufacturing products from prefabricated metals (except machinery and equipment) 203628 0.5119165 43,500,000 106,000,000 106,000,000 213.62
2010 25 Manufacturing products from prefabricated metals (except machinery and equipment) 170192 0.5760269 45,400,000 137,000,000 127,000,000 266.76
2011 25 Manufacturing products from prefabricated metals (except machinery and equipment) 131772 0.4162462 134,000,000 136,000,000 138,000,000 1,016.91
2012 25 Manufacturing products from prefabricated metals (except machinery and equipment) 237354 0.4460843 86,500,000 208,000,000 230,000,000 364.43
2013 25 Manufacturing products from prefabricated metals (except machinery and equipment) 241583 0.5126028 83,400,000 235,000,000 228,000,000 345.22
2014 25 Manufacturing products from prefabricated metals (except machinery and equipment) 252315 0.3511839 186,000,000 258,000,000 249,000,000 737.17
2015 25 Manufacturing products from prefabricated metals (except machinery and equipment) 171272 0.6150947 75,400,000 224,000,000 182,000,000 440.24
2007 26 Manufacturing electronic products, computers and optical products 82297 0.8332253 17,500,000 60,600,000 38,500,000 212.64
2008 26 Manufacturing electronic products, computers and optical products 88461 0.8853329 19,700,000 72,800,000 42,900,000 222.70
2009 26 Manufacturing electronic products, computers and optical products 105192 0.8883462 25,600,000 83,200,000 56,600,000 243.36
2010 26 Manufacturing electronic products, computers and optical products 139956 0.9352584 32,200,000 128,000,000 70,200,000 230.07
2011 26 Manufacturing electronic products, computers and optical products 167938 0.9539813 134,000,000 263,000,000 137,000,000 797.91
2012 26 Manufacturing electronic products, computers and optical products 269354 0.9457048 95,400,000 473,000,000 196,000,000 354.18
2013 26 Manufacturing electronic products, computers and optical products 311229 0.9665958 152,000,000 770,000,000 271,000,000 488.39
2014 26 Manufacturing electronic products, computers and optical products 380508 0.9697295 311,000,000 899,000,000 418,000,000 817.33
2015 26 Manufacturing electronic products, computers and optical products 434425 0.9819718 273,000,000 1,180,000,000 521,000,000 628.42
2007 27 Production of electrical equipment 117654 0.4845412 22,900,000 62,200,000 48,500,000 194.64
2008 27 Production of electrical equipment 117509 0.5329466 24,400,000 71,100,000 52,800,000 207.64
2009 27 Production of electrical equipment 122676 0.4863172 31,100,000 79,900,000 69,500,000 253.51
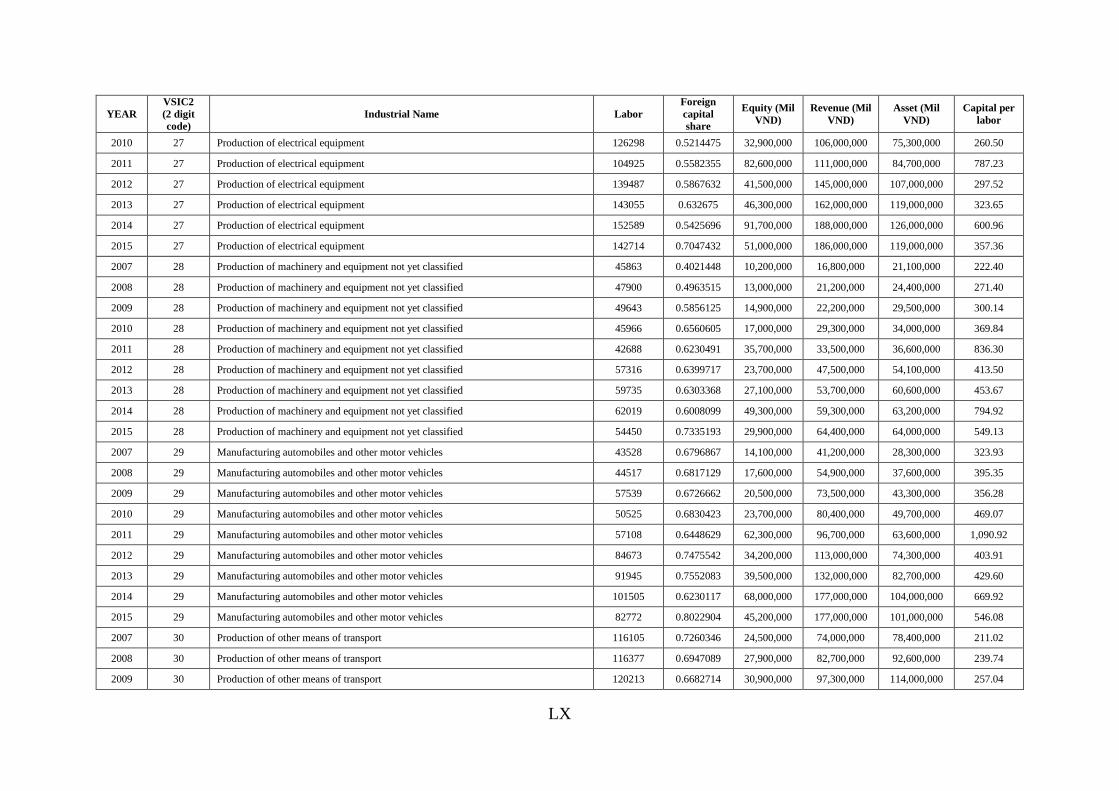
LX
YEAR
VSIC2
(2 digit
code)
Industrial Name Labor
Foreign
capital
share
Equity (Mil
VND)
Revenue (Mil
VND)
Asset (Mil
VND)
Capital per
labor
2010 27 Production of electrical equipment 126298 0.5214475 32,900,000 106,000,000 75,300,000 260.50
2011 27 Production of electrical equipment 104925 0.5582355 82,600,000 111,000,000 84,700,000 787.23
2012 27 Production of electrical equipment 139487 0.5867632 41,500,000 145,000,000 107,000,000 297.52
2013 27 Production of electrical equipment 143055 0.632675 46,300,000 162,000,000 119,000,000 323.65
2014 27 Production of electrical equipment 152589 0.5425696 91,700,000 188,000,000 126,000,000 600.96
2015 27 Production of electrical equipment 142714 0.7047432 51,000,000 186,000,000 119,000,000 357.36
2007 28 Production of machinery and equipment not yet classified 45863 0.4021448 10,200,000 16,800,000 21,100,000 222.40
2008 28 Production of machinery and equipment not yet classified 47900 0.4963515 13,000,000 21,200,000 24,400,000 271.40
2009 28 Production of machinery and equipment not yet classified 49643 0.5856125 14,900,000 22,200,000 29,500,000 300.14
2010 28 Production of machinery and equipment not yet classified 45966 0.6560605 17,000,000 29,300,000 34,000,000 369.84
2011 28 Production of machinery and equipment not yet classified 42688 0.6230491 35,700,000 33,500,000 36,600,000 836.30
2012 28 Production of machinery and equipment not yet classified 57316 0.6399717 23,700,000 47,500,000 54,100,000 413.50
2013 28 Production of machinery and equipment not yet classified 59735 0.6303368 27,100,000 53,700,000 60,600,000 453.67
2014 28 Production of machinery and equipment not yet classified 62019 0.6008099 49,300,000 59,300,000 63,200,000 794.92
2015 28 Production of machinery and equipment not yet classified 54450 0.7335193 29,900,000 64,400,000 64,000,000 549.13
2007 29 Manufacturing automobiles and other motor vehicles 43528 0.6796867 14,100,000 41,200,000 28,300,000 323.93
2008 29 Manufacturing automobiles and other motor vehicles 44517 0.6817129 17,600,000 54,900,000 37,600,000 395.35
2009 29 Manufacturing automobiles and other motor vehicles 57539 0.6726662 20,500,000 73,500,000 43,300,000 356.28
2010 29 Manufacturing automobiles and other motor vehicles 50525 0.6830423 23,700,000 80,400,000 49,700,000 469.07
2011 29 Manufacturing automobiles and other motor vehicles 57108 0.6448629 62,300,000 96,700,000 63,600,000 1,090.92
2012 29 Manufacturing automobiles and other motor vehicles 84673 0.7475542 34,200,000 113,000,000 74,300,000 403.91
2013 29 Manufacturing automobiles and other motor vehicles 91945 0.7552083 39,500,000 132,000,000 82,700,000 429.60
2014 29 Manufacturing automobiles and other motor vehicles 101505 0.6230117 68,000,000 177,000,000 104,000,000 669.92
2015 29 Manufacturing automobiles and other motor vehicles 82772 0.8022904 45,200,000 177,000,000 101,000,000 546.08
2007 30 Production of other means of transport 116105 0.7260346 24,500,000 74,000,000 78,400,000 211.02
2008 30 Production of other means of transport 116377 0.6947089 27,900,000 82,700,000 92,600,000 239.74
2009 30 Production of other means of transport 120213 0.6682714 30,900,000 97,300,000 114,000,000 257.04
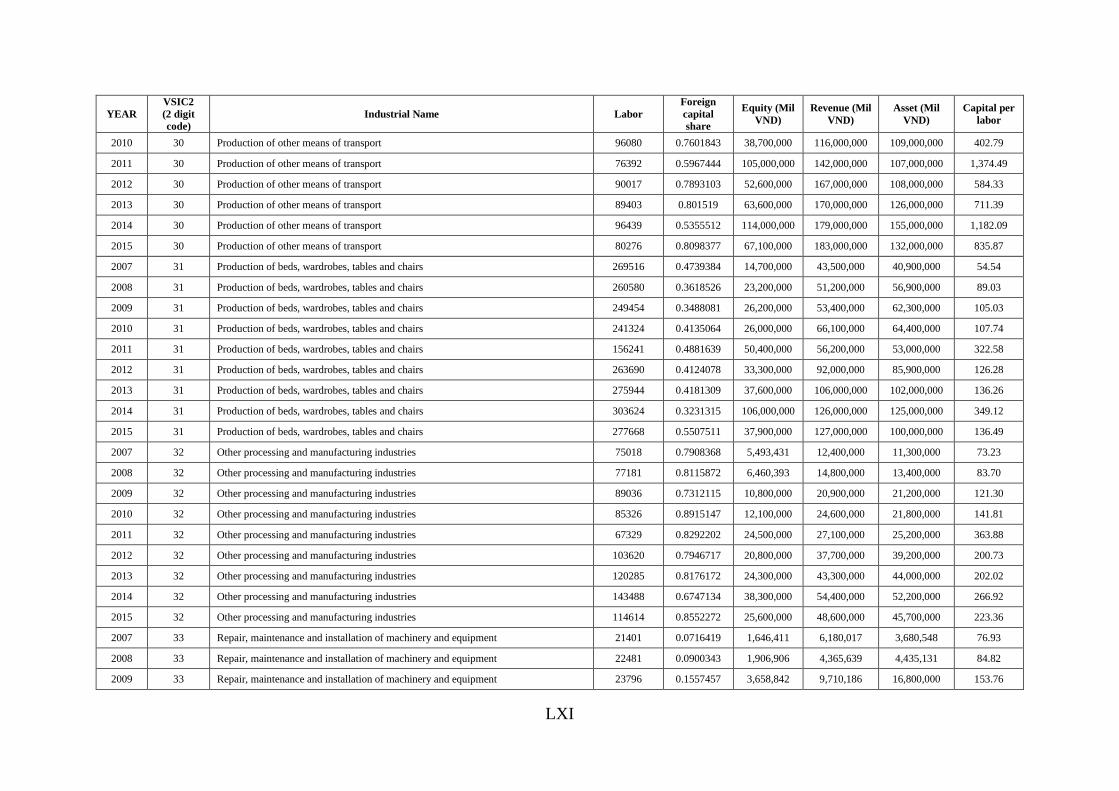
LXI
YEAR
VSIC2
(2 digit
code)
Industrial Name Labor
Foreign
capital
share
Equity (Mil
VND)
Revenue (Mil
VND)
Asset (Mil
VND)
Capital per
labor
2010 30 Production of other means of transport 96080 0.7601843 38,700,000 116,000,000 109,000,000 402.79
2011 30 Production of other means of transport 76392 0.5967444 105,000,000 142,000,000 107,000,000 1,374.49
2012 30 Production of other means of transport 90017 0.7893103 52,600,000 167,000,000 108,000,000 584.33
2013 30 Production of other means of transport 89403 0.801519 63,600,000 170,000,000 126,000,000 711.39
2014 30 Production of other means of transport 96439 0.5355512 114,000,000 179,000,000 155,000,000 1,182.09
2015 30 Production of other means of transport 80276 0.8098377 67,100,000 183,000,000 132,000,000 835.87
2007 31 Production of beds, wardrobes, tables and chairs 269516 0.4739384 14,700,000 43,500,000 40,900,000 54.54
2008 31 Production of beds, wardrobes, tables and chairs 260580 0.3618526 23,200,000 51,200,000 56,900,000 89.03
2009 31 Production of beds, wardrobes, tables and chairs 249454 0.3488081 26,200,000 53,400,000 62,300,000 105.03
2010 31 Production of beds, wardrobes, tables and chairs 241324 0.4135064 26,000,000 66,100,000 64,400,000 107.74
2011 31 Production of beds, wardrobes, tables and chairs 156241 0.4881639 50,400,000 56,200,000 53,000,000 322.58
2012 31 Production of beds, wardrobes, tables and chairs 263690 0.4124078 33,300,000 92,000,000 85,900,000 126.28
2013 31 Production of beds, wardrobes, tables and chairs 275944 0.4181309 37,600,000 106,000,000 102,000,000 136.26
2014 31 Production of beds, wardrobes, tables and chairs 303624 0.3231315 106,000,000 126,000,000 125,000,000 349.12
2015 31 Production of beds, wardrobes, tables and chairs 277668 0.5507511 37,900,000 127,000,000 100,000,000 136.49
2007 32 Other processing and manufacturing industries 75018 0.7908368 5,493,431 12,400,000 11,300,000 73.23
2008 32 Other processing and manufacturing industries 77181 0.8115872 6,460,393 14,800,000 13,400,000 83.70
2009 32 Other processing and manufacturing industries 89036 0.7312115 10,800,000 20,900,000 21,200,000 121.30
2010 32 Other processing and manufacturing industries 85326 0.8915147 12,100,000 24,600,000 21,800,000 141.81
2011 32 Other processing and manufacturing industries 67329 0.8292202 24,500,000 27,100,000 25,200,000 363.88
2012 32 Other processing and manufacturing industries 103620 0.7946717 20,800,000 37,700,000 39,200,000 200.73
2013 32 Other processing and manufacturing industries 120285 0.8176172 24,300,000 43,300,000 44,000,000 202.02
2014 32 Other processing and manufacturing industries 143488 0.6747134 38,300,000 54,400,000 52,200,000 266.92
2015 32 Other processing and manufacturing industries 114614 0.8552272 25,600,000 48,600,000 45,700,000 223.36
2007 33 Repair, maintenance and installation of machinery and equipment 21401 0.0716419 1,646,411 6,180,017 3,680,548 76.93
2008 33 Repair, maintenance and installation of machinery and equipment 22481 0.0900343 1,906,906 4,365,639 4,435,131 84.82
2009 33 Repair, maintenance and installation of machinery and equipment 23796 0.1557457 3,658,842 9,710,186 16,800,000 153.76
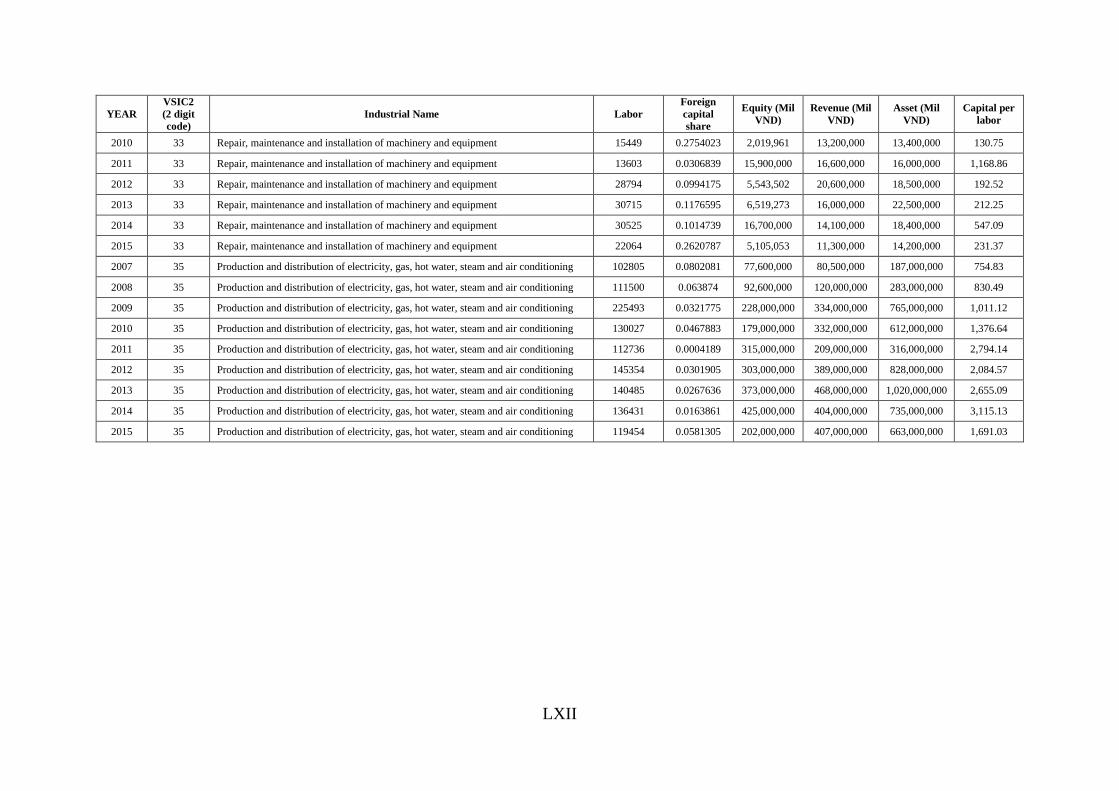
LXII
YEAR
VSIC2
(2 digit
code)
Industrial Name Labor
Foreign
capital
share
Equity (Mil
VND)
Revenue (Mil
VND)
Asset (Mil
VND)
Capital per
labor
2010 33 Repair, maintenance and installation of machinery and equipment 15449 0.2754023 2,019,961 13,200,000 13,400,000 130.75
2011 33 Repair, maintenance and installation of machinery and equipment 13603 0.0306839 15,900,000 16,600,000 16,000,000 1,168.86
2012 33 Repair, maintenance and installation of machinery and equipment 28794 0.0994175 5,543,502 20,600,000 18,500,000 192.52
2013 33 Repair, maintenance and installation of machinery and equipment 30715 0.1176595 6,519,273 16,000,000 22,500,000 212.25
2014 33 Repair, maintenance and installation of machinery and equipment 30525 0.1014739 16,700,000 14,100,000 18,400,000 547.09
2015 33 Repair, maintenance and installation of machinery and equipment 22064 0.2620787 5,105,053 11,300,000 14,200,000 231.37
2007 35 Production and distribution of electricity, gas, hot water, steam and air conditioning 102805 0.0802081 77,600,000 80,500,000 187,000,000 754.83
2008 35 Production and distribution of electricity, gas, hot water, steam and air conditioning 111500 0.063874 92,600,000 120,000,000 283,000,000 830.49
2009 35 Production and distribution of electricity, gas, hot water, steam and air conditioning 225493 0.0321775 228,000,000 334,000,000 765,000,000 1,011.12
2010 35 Production and distribution of electricity, gas, hot water, steam and air conditioning 130027 0.0467883 179,000,000 332,000,000 612,000,000 1,376.64
2011 35 Production and distribution of electricity, gas, hot water, steam and air conditioning 112736 0.0004189 315,000,000 209,000,000 316,000,000 2,794.14
2012 35 Production and distribution of electricity, gas, hot water, steam and air conditioning 145354 0.0301905 303,000,000 389,000,000 828,000,000 2,084.57
2013 35 Production and distribution of electricity, gas, hot water, steam and air conditioning 140485 0.0267636 373,000,000 468,000,000 1,020,000,000 2,655.09
2014 35 Production and distribution of electricity, gas, hot water, steam and air conditioning 136431 0.0163861 425,000,000 404,000,000 735,000,000 3,115.13
2015 35 Production and distribution of electricity, gas, hot water, steam and air conditioning 119454 0.0581305 202,000,000 407,000,000 663,000,000 1,691.03