Embed Size (px)
Citation preview
Foreign direct investment and productivity spillovers: a firm‑level analysis of Bangladesh in comparison with VietnamMd Arif‑Ur‑Rahman* and Kazuo Inaba
1 IntroductionThe general belief regarding multinational corporations (MNCs) is that they possess superior production technologies and organizational techniques and tend to be more productive compared to domestic firms (Hymer 1976). MNCs allow local subsidiaries with foreign equity to get access to advanced technologies and techniques. This pro-cess in turn makes the local subsidiaries more productive while using a reduced level of input, and thus a higher level of total factor productivity (TFP) than other fully domes-tically owned firms. Foreign direct investment (FDI) is believed to be the preferred means through which technology transfers, as it can internalize better technologies at minimum or no additional cost (Rugman and Caves 1983). The potential of FDI to ini-tiate technology transfer to local firms through productivity spillovers may be derived from the semi-public nature of technology and the way it is disseminated between firms. These are all neo-classical thoughts about spillover effects regarding FDI. Theoretically, it is proven that host-country firms gain from the externalities associated with foreign
Abstract
Foreign direct investment (FDI) is expected to generate external effects—usually termed FDI spillovers—for a host country, and these spillovers are thought to have consequences on the productivity of domestic firms. Despite this strong expectation, the empirical findings on FDI spillover are still indecisive. This study examines firm‑level panel data to determine the effects of FDI spillover on firms’ productivity in Bangladesh in comparison to Vietnam. We consider both the horizontal and vertical (backward and forward) spillover effects of FDI. We find evidence that Bangladeshi firms gain produc‑tivity improvement through intra‑industry or horizontal linkages, whereas Vietnamese firms gain through backward linkages. Our findings suggest that increases in foreign presence in the same industry for Bangladesh and in downstream industries for Viet‑nam are related with increase in output of domestic firms.
Keywords: Foreign direct investments, Horizontal spillover, Vertical spillover, Bangladesh, Vietnam
JEL Classification: F2, O1, O3
Open Access
© The Author(s), 2021. Open Access This article is licensed under a Creative Commons Attribution 4.0 International License, which permits use, sharing, adaptation, distribution and reproduction in any medium or format, as long as you give appropriate credit to the original author(s) and the source, provide a link to the Creative Commons licence, and indicate if changes were made. The images or other third party material in this article are included in the article’s Creative Commons licence, unless indicated otherwise in a credit line to the mate‑rial. If material is not included in the article’s Creative Commons licence and your intended use is not permitted by statutory regulation or exceeds the permitted use, you will need to obtain permission directly from the copyright holder. To view a copy of this licence, visit http:// creat iveco mmons. org/ licen ses/ by/4. 0/.
RESEARCH
Arif‑Ur‑Rahman and Inaba Economic Structures (2021) 10:17 https://doi.org/10.1186/s40008‑021‑00248‑2
*Correspondence: [email protected] Graduate School of Economics, Ritsumeikan University, Noji Higashi 1‑1‑1, Kusatsu, Shiga 525‑8577, Japan
Page 2 of 23Arif‑Ur‑Rahman and Inaba Economic Structures (2021) 10:17
investment through productivity improvement and international integration (Costa and de Queiroz 2002). However, empirically there is no consensus regarding the externalities generated by foreign firms. Theoretical works suggest various channels through which knowledge and technology are transferred to domestic firms. The complexities associ-ated with unraveling diverse effects in practice as well as data limitations have prevented researchers from providing influential empirical evidence of externalities resulting from FDI.
There are ample number of studies on FDI spillover. However, among empirical stud-ies, comparative firm-level analyses across countries have received relatively limited focus. The main reason behind this limited focus is the lack of comparable firm-level data for a set of countries. This study examines the influence of FDI spillover effects on firm productivity in Bangladesh in comparison to Vietnam. Both countries are emerg-ing economies in Asia. Their economic development and constant changes in improving their FDI policy frameworks have enabled these economies to become important desti-nations for investment.
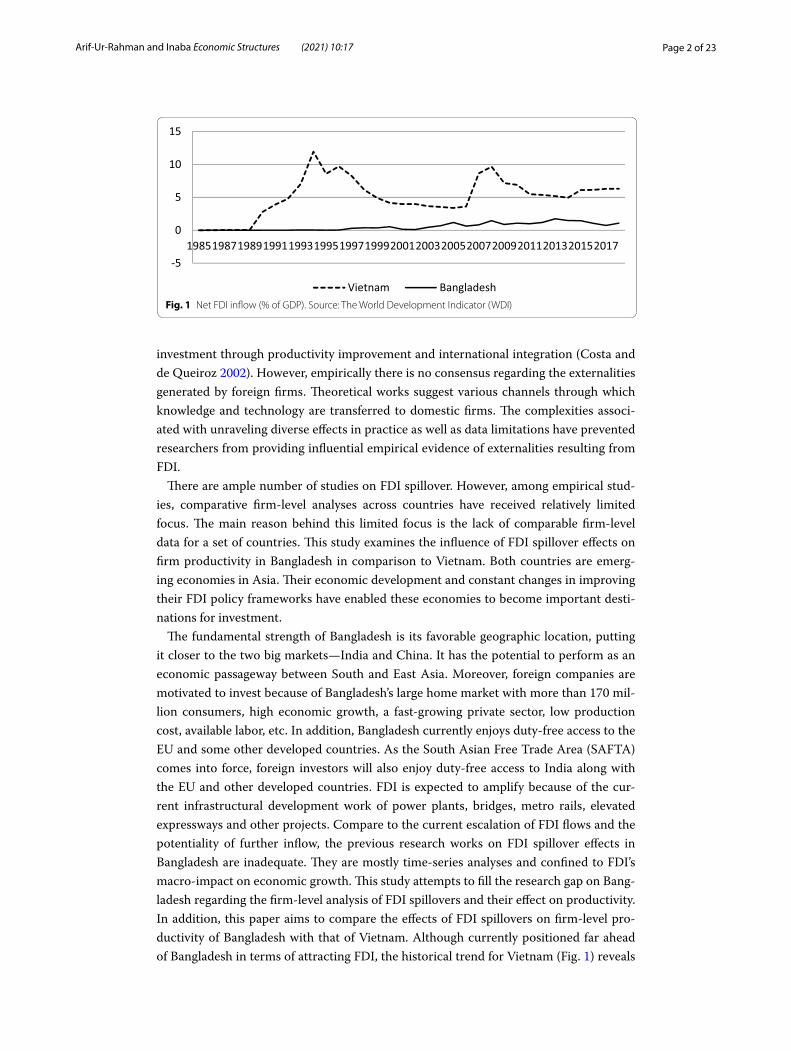
The fundamental strength of Bangladesh is its favorable geographic location, putting it closer to the two big markets—India and China. It has the potential to perform as an economic passageway between South and East Asia. Moreover, foreign companies are motivated to invest because of Bangladesh’s large home market with more than 170 mil-lion consumers, high economic growth, a fast-growing private sector, low production cost, available labor, etc. In addition, Bangladesh currently enjoys duty-free access to the EU and some other developed countries. As the South Asian Free Trade Area (SAFTA) comes into force, foreign investors will also enjoy duty-free access to India along with the EU and other developed countries. FDI is expected to amplify because of the cur-rent infrastructural development work of power plants, bridges, metro rails, elevated expressways and other projects. Compare to the current escalation of FDI flows and the potentiality of further inflow, the previous research works on FDI spillover effects in Bangladesh are inadequate. They are mostly time-series analyses and confined to FDI’s macro-impact on economic growth. This study attempts to fill the research gap on Bang-ladesh regarding the firm-level analysis of FDI spillovers and their effect on productivity. In addition, this paper aims to compare the effects of FDI spillovers on firm-level pro-ductivity of Bangladesh with that of Vietnam. Although currently positioned far ahead of Bangladesh in terms of attracting FDI, the historical trend for Vietnam (Fig. 1) reveals
-5
0
5
10
15
19851987198919911993199519971999200120032005200720092011201320152017
Vietnam BangladeshFig. 1 Net FDI inflow (% of GDP). Source: The World Development Indicator (WDI)
Page 3 of 23Arif‑Ur‑Rahman and Inaba Economic Structures (2021) 10:17
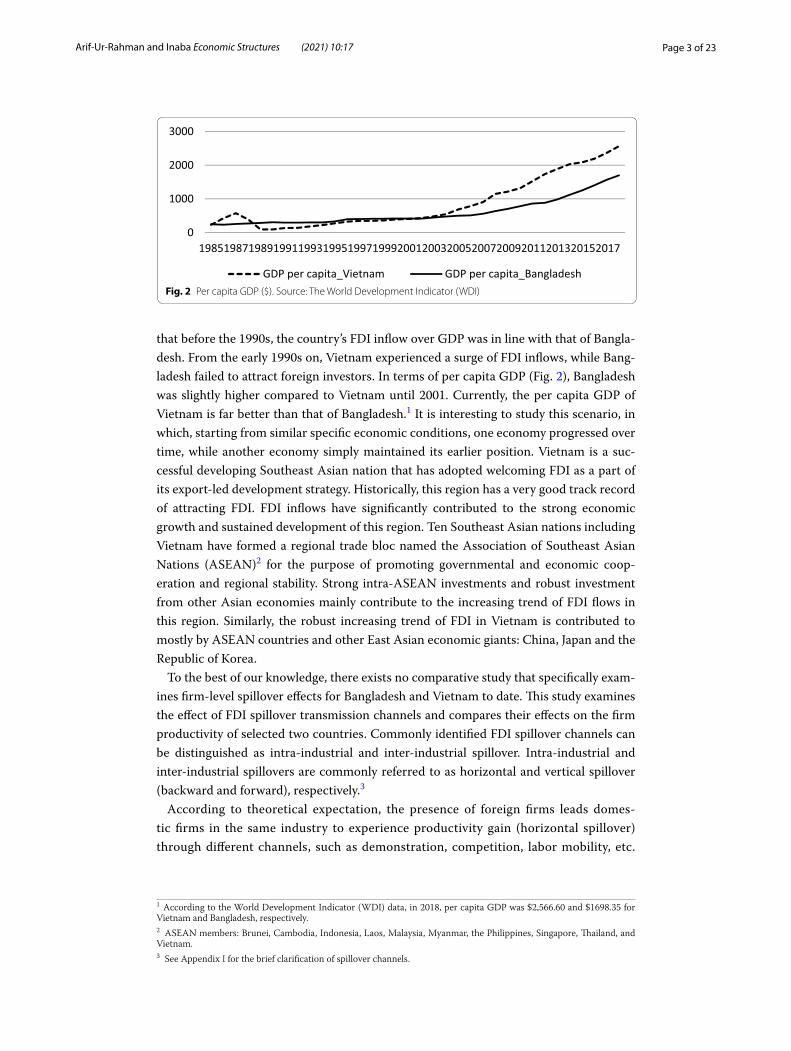
that before the 1990s, the country’s FDI inflow over GDP was in line with that of Bangla-desh. From the early 1990s on, Vietnam experienced a surge of FDI inflows, while Bang-ladesh failed to attract foreign investors. In terms of per capita GDP (Fig. 2), Bangladesh was slightly higher compared to Vietnam until 2001. Currently, the per capita GDP of Vietnam is far better than that of Bangladesh.1 It is interesting to study this scenario, in which, starting from similar specific economic conditions, one economy progressed over time, while another economy simply maintained its earlier position. Vietnam is a suc-cessful developing Southeast Asian nation that has adopted welcoming FDI as a part of its export-led development strategy. Historically, this region has a very good track record of attracting FDI. FDI inflows have significantly contributed to the strong economic growth and sustained development of this region. Ten Southeast Asian nations including Vietnam have formed a regional trade bloc named the Association of Southeast Asian Nations (ASEAN)2 for the purpose of promoting governmental and economic coop-eration and regional stability. Strong intra-ASEAN investments and robust investment from other Asian economies mainly contribute to the increasing trend of FDI flows in this region. Similarly, the robust increasing trend of FDI in Vietnam is contributed to mostly by ASEAN countries and other East Asian economic giants: China, Japan and the Republic of Korea.
To the best of our knowledge, there exists no comparative study that specifically exam-ines firm-level spillover effects for Bangladesh and Vietnam to date. This study examines the effect of FDI spillover transmission channels and compares their effects on the firm productivity of selected two countries. Commonly identified FDI spillover channels can be distinguished as intra-industrial and inter-industrial spillover. Intra-industrial and inter-industrial spillovers are commonly referred to as horizontal and vertical spillover (backward and forward), respectively.3
According to theoretical expectation, the presence of foreign firms leads domes-tic firms in the same industry to experience productivity gain (horizontal spillover) through different channels, such as demonstration, competition, labor mobility, etc.
0
1000
2000
3000
19851987198919911993199519971999200120032005200720092011201320152017
GDP per capita_Vietnam GDP per capita_BangladeshFig. 2 Per capita GDP ($). Source: The World Development Indicator (WDI)
1 According to the World Development Indicator (WDI) data, in 2018, per capita GDP was $2,566.60 and $1698.35 for Vietnam and Bangladesh, respectively.2 ASEAN members: Brunei, Cambodia, Indonesia, Laos, Malaysia, Myanmar, the Philippines, Singapore, Thailand, and Vietnam.3 See Appendix I for the brief clarification of spillover channels.
Page 4 of 23Arif‑Ur‑Rahman and Inaba Economic Structures (2021) 10:17
First, the demonstration effect works through the copying of foreign firms’ advanced technology, production strategies and organizational skills by domestic firms, thereby improving their productivity (Das 1987; Wang and Blomstrom 1992). Second, com-petition refers to a situation in which domestic firms are forced to improve produc-tion efficiency as foreign rivals enter the domestic market. Market concentration may reduce via the process of competition, but the competition effect can also be negative. Fierce competition with foreign firms sometimes forces several domestic firms to exit the market, as they can no longer compete at all (Wang and Blomström, 1992; Glass and Saggi, 2002). Aitken and Harrison (1999) also term such an effect the “market stealing effect”, stating that foreign firms actually switch demand from the domes-tic firms. Third, the migration of skilled and trained employees from foreign firms to domestic firms may result in positive knowledge spillover. Potential technological know-how and managerial skills spread to domestic firms. On the other hand, com-paratively high salaries persuade skilled employees to switch from domestic firms to foreign firms, and thus, create productivity losses (Fosfuri et al., 2001; Glass and Saggi, 2002). Foreign firms usually prevent employee turnover by paying higher wages, as well. Many recent studies do not find robust empirical evidence of productivity bene-fits through horizontal or intra-industry spillovers to domestic firms. Javorcik (2004), Bwalya (2006), Barrios et al. (2004), Blalock and Gertler (2008), Damijan et al. (2008), and Kugler (2006) do not find evidence of horizontal FDI spillovers.
Inter-industry, or vertical, spillover mainly results from the upstream–downstream business relationship between foreign firms and domestic firms. The vertical spillover mechanism works through backward and forward linkages. Backward spillover takes place when a domestic firm in an upstream sector experiences productivity gains through the process of supplying inputs to a downstream sector’s foreign-owned firms. This can happen as foreign firms deliberately transfer knowledge to domestic input suppliers. To achieve better input supply, foreign-owned firms provide tech-nological assistance as well as training for employees of host-country supplier firms (Lall, 1978). High demands for locally produced intermediates and increased com-pletion for foreign customers persuade domestic suppliers to improve their product quality and efficiency (Javorcik 2004). Forward linkages are not given much atten-tion in the literature. Spillovers through forward linkages may occur from upstream foreign-invested suppliers of inputs supplying downstream domestic firms. A domes-tic firm can learn from its supplier (a foreign-invested firm), which is embodied in advanced technologies (Grossman and Helpman 1993). Increase in foreign invest-ment in upstream industry boosts competition and forces other suppliers of the same industry to improve their production efficiency in order to survive in business. As a consequence, downstream domestic firms might experience productivity improve-ments due to more efficiently produced inputs by all upstream firms (Newman et al. 2015). Researchers are now more interested in searching for the possibility of FDI spillover across industries. Schoors and van der Tol (2002) for Hungary, Javorick (2004) for Lithuania, and Blalock (2002) for Indonesia all find positive spillover effects through backward and forward linkages. Similarly, Merlevede and Schoors (2005) find evidence of positive forward spillovers, but found backward spillover only in the case of the export-oriented sectors of Romanian firms.
Page 5 of 23Arif‑Ur‑Rahman and Inaba Economic Structures (2021) 10:17
Several studies focus on more than one economy. Konings (2001) and Barrios et al. (2004) find contrasting results on different European countries’ economies. While Kon-ings (2001) finds negative FDI spillover effects on local firms in Bulgaria and Romania and no effect on Polish firms, Barrios et al. (2004) found positive spillover effects on firms in Spain and Ireland. Using the World Bank’s firm-level survey data for five tran-sitional economies (Poland, Moldova, Tajikistan, Uzbekistan, and the Kyrgyz Republic) Yasar and Morrison (2007) find positive intra-industry spillover effects from foreign presence in domestic industries. Tondl and Forneo (2010) and Muhlen (2013) study spillover effects on Latin American economies. Tondl and Forneo (2010) find evidence for positive horizontal spillovers, whereas Muhlen (2013) finds negative spillover effects from foreign presence within industries.
This study utilizes firm-level panel data to estimate productivity spillover effects from FDI. Comparable Bangladeshi and Vietnamese firm-level data for different years is taken from the Enterprise Surveys provided by the World Bank. The findings of this study sug-gest the channels through which domestic firms gain productivity by the presence of for-eign firms differ between the two countries. Our empirical findings support the presence of an intra-industry FDI spillover effect in Bangladeshi firms, while among Vietnamese firms, there is evidence of productivity spillovers through inter-industry backward link-ages. Spillover through backward linkages can be explained as the firms’ productivity being positively associated with the degree of potential contacts with foreign customers of the downstream sector.
The next section of the paper discusses FDI positions and prospects in Bangladesh and Vietnam. Section 3 explains the dynamics of our dataset and its sources. Section 4 deals with the empirical framework and estimation issues of different spillover variables. Sec-tion 5 reports the empirical findings and discusses the results. This paper concludes with a brief summary of the findings in Sect. 6.
2 FDI in Bangladesh and Vietnam2.1 Contemporary FDI environment
Bangladesh gained independence in 1971from Pakistan. During that time of war for liberation, a nationalist movement appeared among the people of Bangladesh that con-ferred on them the fortitude for freedom. However, the consequence of this nationalistic attitude resulted in a snobbish position in terms of economic policy. At that time, access by foreign companies was viewed negatively by policymakers. Because of this negative view, foreign companies were discouraged; until 1980, FDI in Bangladesh was very insig-nificant. Then, in the 1990s, this approach changed and the government began encour-aging FDI. Since then, a series of policy incentives has been offered to FDI investors from time to time. These incentives include tax holidays for a number of years, 100% foreign ownership, full profit repatriation, duty-free import of capital machinery, reinvestment of profits or dividends as FDI, work permits for foreign executives, export processing zone (EPZ) facilities, special economic zones (SEZs), flexible exit facilities, etc.
FDI has tripled in Bangladesh over the past decade, from USD 1.086 billion in the year 2008 to USD 3.613 billion in 2018. However, this inflow of FDI only represents about 1% of Bangladesh’s GDP, one of the lowest rates among emerging economies. Though the FDI inflow is rising, considering the current growth and size of the economy of
Page 6 of 23Arif‑Ur‑Rahman and Inaba Economic Structures (2021) 10:17
Bangladesh, it has still lagged behind the desired level. Possible barriers to attracting for-eign investors may include political unrest, scarcity of power and energy, lack of nec-essary land and infrastructure, lack of comprehensive policies regarding FDI, valuation challenges, repatriation restrictions, lack of institutional capacity to serve foreign inves-tors, an underdeveloped financial market, etc. Despite such regulatory and institutional obstacles, Bangladesh has the opportunity to attract substantial FDI flows. Geographi-cally, Bangladesh is located in advantageous position between India, China and the ASEAN region. In 2018, JETRO’s survey on Business Conditions of Japanese Compa-nies in Asia and Oceania ranked Bangladesh above India and Myanmar. Now, foreign companies are showing interest in investing because of Bangladesh’s large domestic mar-ket, high economic growth, low production cost, etc. In addition, Bangladesh currently enjoys duty-free access to the EU and some other developed countries. The government’s current infrastructure development work (power plants, bridges, metro rails, and ele-vated expressways) and easing of FDI policy will increase the flow of FDI to Bangladesh.
Adopting the strategy of welcoming FDI as a part of export-led development, Vietnam is a booming country. In 1986, through several economic and political reforms, the gov-ernment of Vietnam opened the country to the global economy in a process known as Doi Moi (renovation). During the Doi Moi period of economic development, Vietnam aggressively sought international trade and foreign investment inflows. Initially, as part of the policy in the early 1990s, the Vietnam extensively strengthened trade relations with Asian countries. In addition, with its available low-cost labor, Vietnam attracted attention from other regional economies as a promising new production site at that time. However, due to Asian currency crisis of the late 1990s, FDI in Vietnam declined (see Fig. 1). After the crisis, bureaucratic and structural problems in its investment envi-ronment caused Vietnam to face difficulties in attracting and utilizing FDI effectively. By 2008, Vietnam’s accession to the WTO in the previous year had raised the interest of foreign investors; thus, the country experienced a sharp increase in FDI. The recorded FDI in 2008 included a few large projects, such as a software park, a tourism complex, a petrochemical complex, etc. However, because of the severe 2008 global financial crisis, many of these registered projects were deferred or cancelled. In 2015, Vietnam ranked as the world’s fourth-highest attractor of FDI in terms of total investment capital behind India, China and Indonesia.4 Vietnam’s achievement in attracting FDI has had a positive effect on the country’s economic development. The contribution of FDI to its GDP was about 18% in 2015. Moreover, FDI contributed to about 4.2% of Vietnam’s labor force in 2015 (Thuy Nguyen, 2016). This contribution is likely to be even larger if indirect effects are taken into account.
Recent participation in several bilateral and multilateral trade agreements has attracted a large amount of FDI into Vietnam. Its tax incentive framework, transpar-ency and commitments with international trading partners influence foreign investors. The government of Vietnam actively works on market liberalization and other reforms as well. The recent reforms include a state-owned enterprise (SOE) sector, intellectual
4 The 2016 FDI Report published by fDi Intelligence.
Page 7 of 23Arif‑Ur‑Rahman and Inaba Economic Structures (2021) 10:17
property rights, government procurement, e-commerce and the digital economy.5 These reforms are important to maintaining Vietnam’s economic competitiveness as a lucra-tive investment destination. Currently, labor is becoming expensive in China. Vietnam is enjoying the benefit of China’s high labor cost as investors are considering Vietnam as the go-to place for manufacturing.
2.2 FDI inflows in major sectors
In 2019, the power, gas and petroleum sector attracted a maximum FDI share in Bang-ladesh. This sector accounted for 36.9% of total FDI inflow, amounting to USD 1.061 billion. This was followed by manufacturing and then by the trade and commerce sec-tor, which contributed 29.6 and 16.4%, respectively, toward total FDI inflows. According to the World Bank and the Bangladesh Power Development Board, the growth of the power sector in terms of capacity addition is notable and increased from 5 to 28% in the period from 2012 to 2018. In South Asia, Bangladesh’s power sector is one of the fastest growing. It is expected that in the near future, Bangladesh’s demand for electric power consumption will increase more in line with its GDP growth and the government’s master plan to generate 24,000 MW of electricity by 2021, 40,000 MW by 2030, and 60,000 MW by 2041. Considering these issues, foreign investment is increasing in the power sector. Among manufacturing-sector industries, the textiles and clothing industry comprises the largest share of inward FDI. Currently, Bangladesh is the second-largest garment exporter in the world. This South Asian country enjoys tariff-free access to the EU, Canada, Australia and other major textile and garment markets. Motivated by the country’s cheap labor, preferential location and government support, many international investors and famous fashion brands are investing in Bangladesh.
In Vietnam’s case, the manufacturing and processing sector accounts for 65% of total registered foreign investment capital, topping the list with a total capital of USD 24.6 billion. This industry is followed by real estate, then by retail and wholesale. As in previ-ous years, manufacturing and processing industries continue to account for the major share of FDI. Industry experts say that Vietnam has gained the advantage due to MNCs shifting manufacturing to Vietnam as costs in China began to increase. This process has accelerated because of the ongoing US–China trade war as well. As in past years, Viet-nam’s real estate market continues to catch the attention of foreign and domestic inves-tors. Increased tourism and mega-infrastructure projects are pushing the demand for real estate. Different tourist spots such as Da Nang, Nha Trang, and Phu Quoc Island are becoming popular, and construction of many hotels and residential projects is ongoing. In addition, mega-projects such as the Hanoi and Ho Chi Minh City metros’ construc-tion are further expected to drive the demand for real estate. A fast-growing middle class is the core reason expediting the growth of investment in retail and the wholesale sector in Vietnam. Moreover, relaxation of certain restrictions such as participation in the dis-tribution system by foreign investors has also aided growth.
5 ASEAN Business Guide: The economies of ASEAN and the opportunities they present, 2018 edition.Available at: https:// assets. kpmg/ conte nt/ dam/ kpmg/ sg/ pdf/ 2018/ 07/ ASEAN- Busin ess- Guide- COMPL ETE. pdf.
Page 8 of 23Arif‑Ur‑Rahman and Inaba Economic Structures (2021) 10:17
3 Data analysisThe data for empirical analysis are collected from the Enterprise Surveys provided by the World Bank. The sample provides firm-level data from different periods6 for Bangla-desh and Vietnam. The datasets include firm-level information from the manufacturing, retail, wholesale and service industries. We assembled a sample from individual panel datasets of the two individual countries. The World Bank used a standardized question-naire to conduct the Enterprise Survey for all interviewed firms from various countries. This standardization gives us the opportunity to compare the firm-level data for two different Asian countries. The dataset contains roughly similar and related firm-level information for all firms, enabling us to collect comparable firm-level information across countries. The dataset provides information on companies’ foreign ownership, size, age, sales, exports, imports, wages, materials costs, fixed costs, employees, financial obliga-tions, etc. In addition to the World Bank Enterprise Survey, to estimate backward FDI spillover variables, we also used the input–output table provided by the Asian Develop-ment Bank.
The sample includes 2917 and 3196 firms over 21 two-digit industrial classifications for Bangladesh and Vietnam, respectively. Our empirical analyses are not always based on all the firms’ data, because depending on the particular model setting, the number of firms with complete data varies. In the original datasets, all monetary values were given in local currency units. For the purpose of our analysis, we standardize the monetary values by converting them into US dollars. To convert the local currencies, we use the purchasing power parity (PPP) conversion factor7 (source: World Development Indica-tors, the World Bank). Unbalanced panel data have been used for empirical analysis.
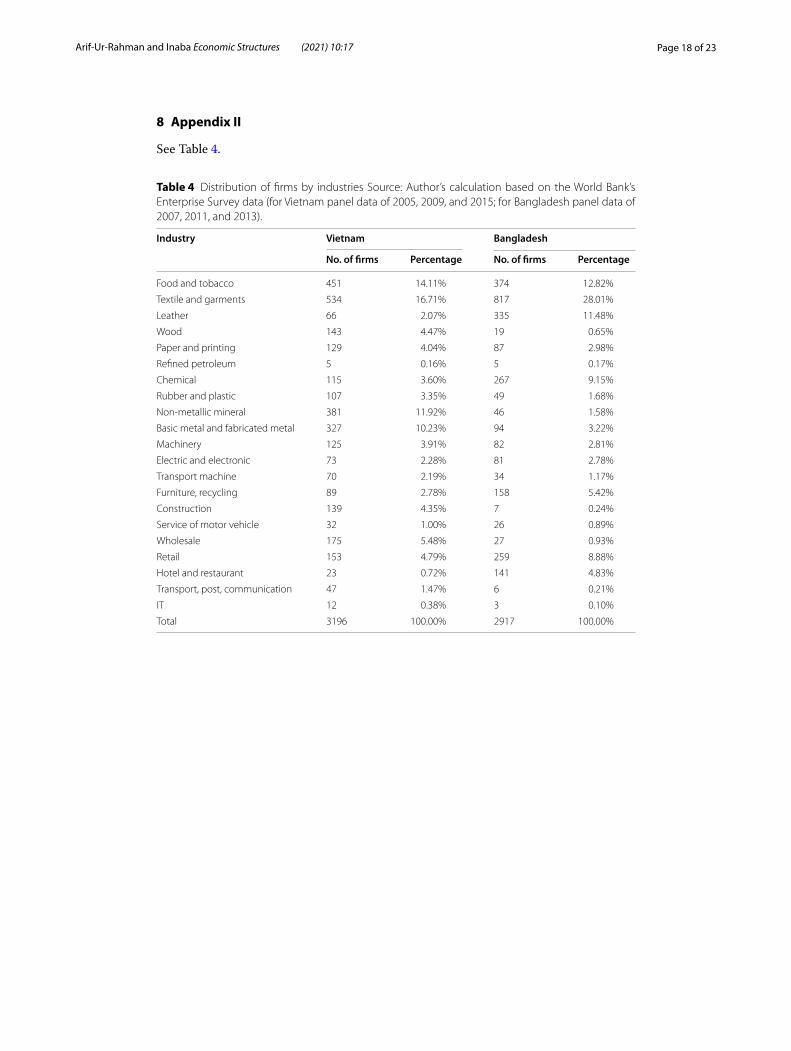
As the study examines both inter- and intra-industry spillovers, the allocation of the firms across industries are very important. Appendix II illustrates the distribution of firms over industries. The distribution of interviewed firms across industries roughly shows that the food and textiles and garments industries are the two major industries, together encompassing around 40 and 30% of total firms in the samples of Bangladesh and Vietnam, respectively. The textiles and garments industry comprises the greatest number of interviewed firms in both countries’ samples, about 28% in Bangladesh and 17% in Vietnam.
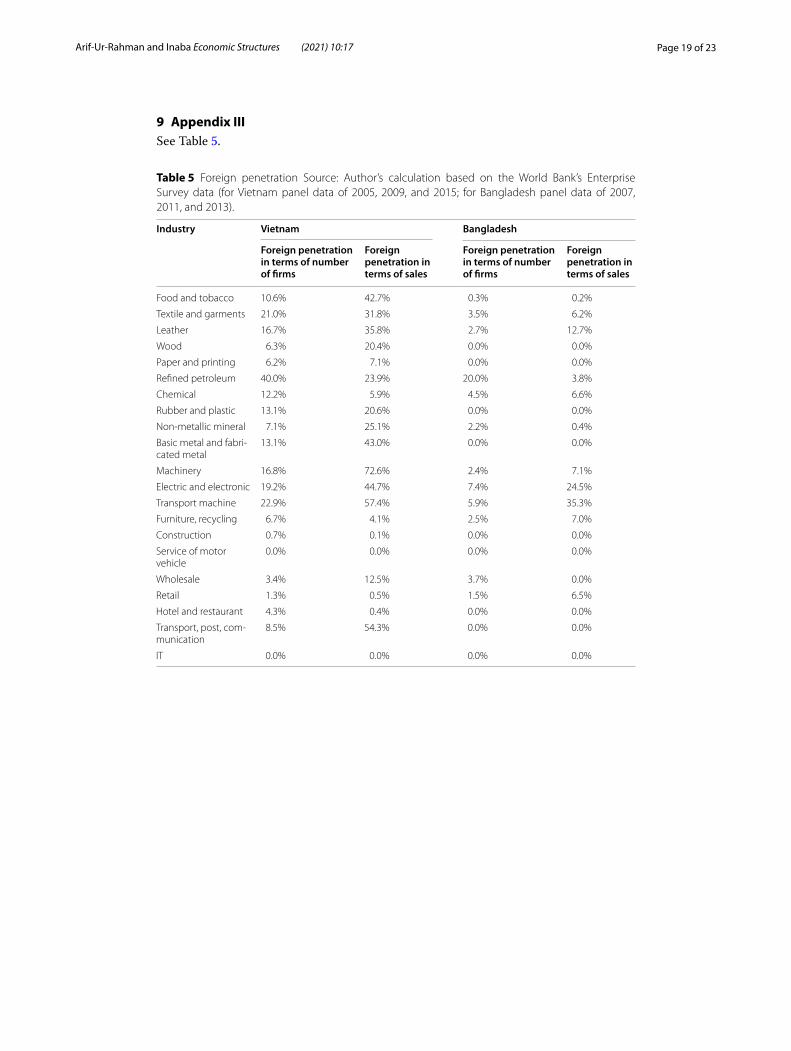
Having assessed the industrial structure of firms within the two countries, now we turn to discussion of foreign ownership in the sample. For this study, we considered firms foreign-owned in which at least a 10% share of capital is owned by foreign inves-tors. Only 2.5% (72 out of 2917) of firms in the Bangladeshi sample and 11.2% (359 out of 2196) of firms in the Vietnamese sample met this classification. Appendix III shows the industry-wise presence of foreign ownership in terms of numbers of firms and sales shares for both countries. According to the number of firms, foreign presence is highest in the refined petroleum industry for both countries’ samples. In Vietnam, this is followed by transport machines, textiles and garments, and electric and electronics industries. In Bangladesh’s case, no industry has a significant number of foreign-owned
7 Definition given by the World Bank: “PPP conversion factor is the number of units of a country’s currency required to buy the same amounts of goods and services in the domestic market as a US dollar would buy in the United States”.
6 Survey Periods: Vietnam 2005, 2009 and 2015; Bangladesh 2007, 2011 and 2013.
Page 9 of 23Arif‑Ur‑Rahman and Inaba Economic Structures (2021) 10:17
firms. In terms of sales, the machinery industry has the highest contribution from for-eign investment in Vietnam. 72.6% of total sales in this industry have come from foreign-owned firms. Similarly transport, transport machine, electric and electronics, textiles, food, and leather industries also show significant shares of total sales are contributed by foreign firms. Despite the number of foreign firms in each industry, foreign penetration in terms of sales is very notable. For example, in the Vietnamese sample, foreign firms contribute about 42.7% of total sales in the food industry, though only 10.6% of firms have foreign presence in that industry. In comparison to Vietnam, Bangladeshi foreign penetration seems lower both in terms of numbers and sales shares.
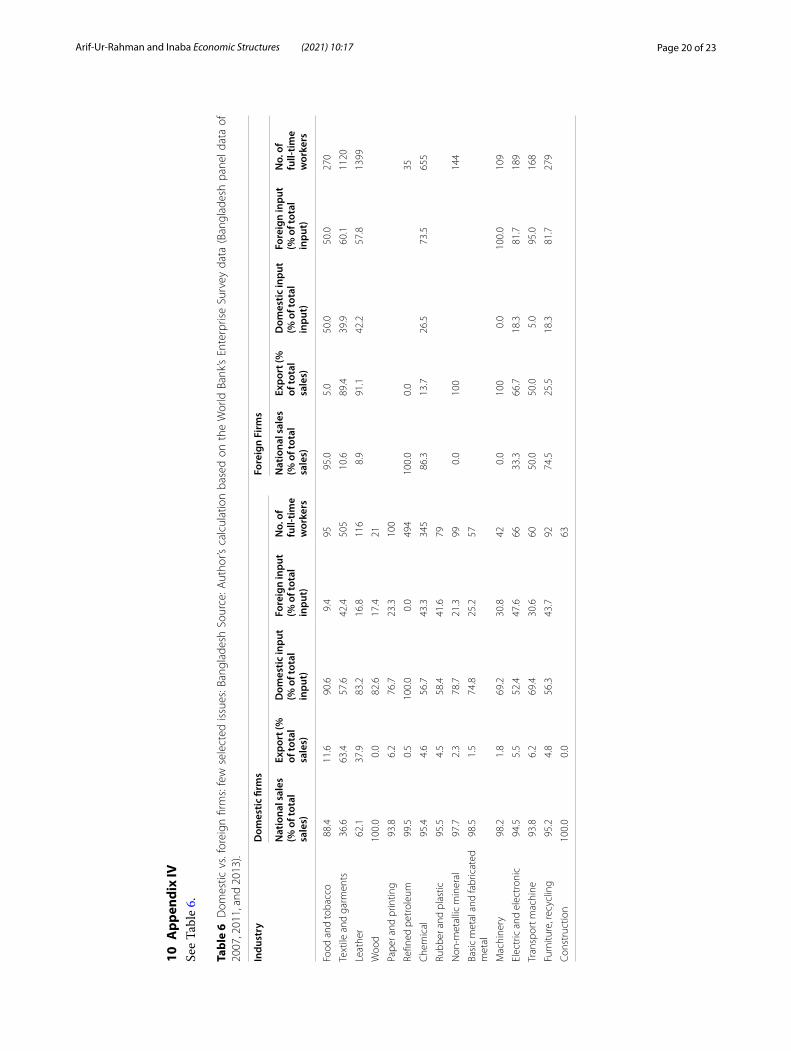
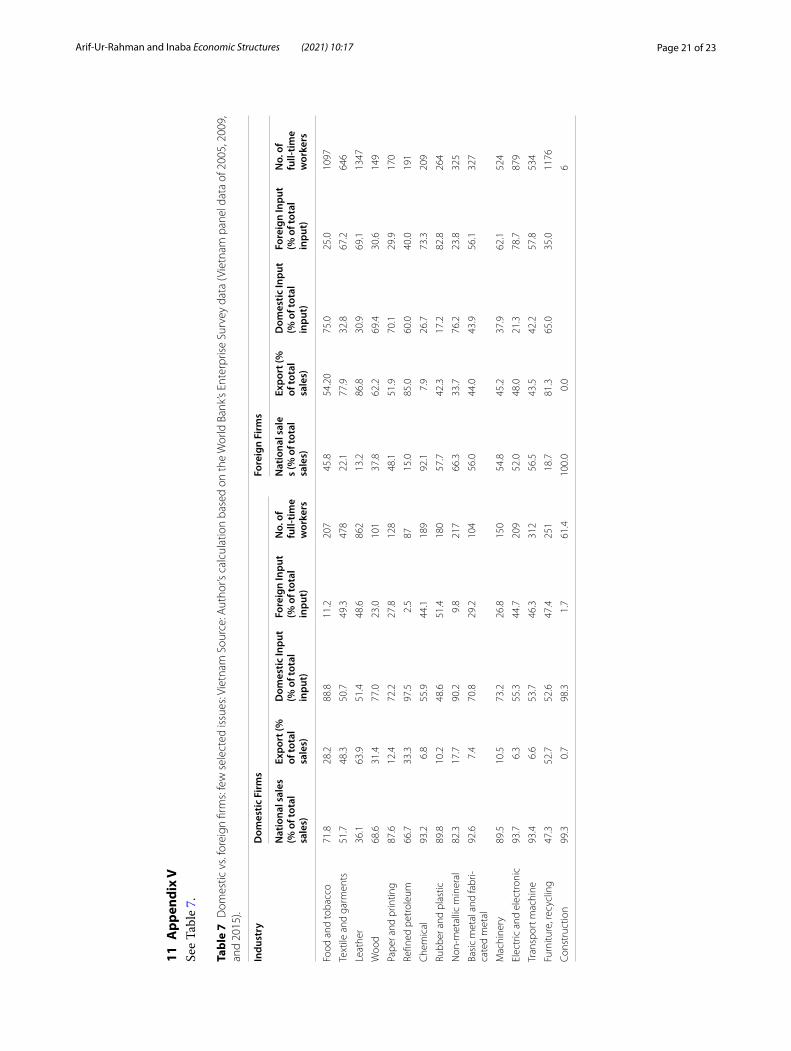
Appendices IV and V illustrate industry-wide comparisons of domestic and foreign firms’ export intensity, use of foreign input and size for Bangladesh and Vietnam, respec-tively. Within both countries’ samples, the export intensity of foreign-owned firms seems high compared to that of domestic firms. For most industries, the export share of total sales is high for foreign-owned firms. Similarly, in terms of input sources, we find that in contrast to the domestic firms, foreign firms use more foreign input than domestic input. Finally, firms with foreign presence tended to be large in size. The average num-bers of full-time workers are higher for foreign-owned firms compare to domestically owned firms.
4 Empirical model and estimation strategyOur empirical goal is to examine the correlation between firm productivity and foreign presence within and across industry. We follow the conventional model used by previ-ous studies on FDI spillover effects by estimating a log linear Cobb–Douglas production function. The production function is amplified with several variations apart from the regular input variables. The model is as follows:
where i, j, and t index for firm, sector, and year, respectively. Dependent variable Yijt represents the real output, which is defined as total annual sales of firm i operating in sector j at time t. L, M, and K correspond to labor, materials, and capital, respectively, which are considered a firm’s inputs for production procedure. Annual cost of labor is used to measure labor (L). Material (M) is proxied by the total cost of raw materials and intermediate goods. Capital (K) is measured by the total costs of purchasing individual firm’s machinery, vehicles, equipment, land, and buildings. The above baseline regres-sion specification includes the share of foreign ownership of a firm to control for the specific effect of foreign presence. To estimate intra-industry and inter-industry spillo-ver effects of FDI, horizontal and vertical (backward and forward)8 spillover variables are estimated by following the specifications in Javorcik (2004) and Kim (2015).
Javorcik (2004) defines horizontal spillover as foreign equity participation averaged over all firms in a sector, weighted by each firm’s share in sectoral output. Thus, in the
ln Yijt = δ0 + δ1 ln Lijt + δ2 lnMijt + δ3 lnKijt + δ4Foreign Shareijt
+ δ5Horizontaljt + δ6Backwardjt + δ7Forwardjt + δ8Fin_obstacleijt
+ δ9Sizeijt + δ10 ln Ageijt + δ11Dummyj + δ12Dummyt + εijct ,
8 The horizontal and vertical linkage variables are time-varying sector-specific.
Page 10 of 23Arif‑Ur‑Rahman and Inaba Economic Structures (2021) 10:17
following equation, Horizontaljt represents the degree of foreign share of the total out-put of an industry j at time t. Foreign Shareijt and Yit denote the percentage share of for-eign ownership and total sales of firm i at time t, respectively. Therefore, the numerator can be termed as total output of firms that is weighted by their foreign share portion in industry j at time t. In addition, the denominator is the total output of industry j at time t.
The backward spillover captus the backward linkages between foreign buyers and domestic input suppliers. In the following equation, Backwardjt signifies the share of domestic firms’ output in industry j supplied to foreign-owned firms in industry h. In other words, Backwardjt connotes the presence of foreign firms in the downstream industries that are supplied by upstream industry j at time t (Kim, 2015):
where αjht indicates the proportion of industry j’s output supplied to industry h at time t. The data for backward linkage calculation are obtained from input–output matrices of each year of each individual country provided by the Asian Development Bank.9 Prod-ucts supplied for final consumption and import are excluded to calculate the value of αjht. This exclusion will provide better measure of backward production linkage (Javorcik 2004). Within-industry input is also excluded because this effect is already considered while measuring horizontal spillover. A higher backward variable value indicates large foreign presence in downstream industries supplied by upstream industry j and that the extent of intermediates supplied to industries with a foreign presence is larger.Forwardjt represents the weighted share of domestic firms’ inputs in industry j pur-
chased from foreign firms in industry x. Exportit indicates the export of intermediate goods by firm i at time t. Like Javorcik (2004), we also exclude exports from total output produced by foreign firms as only intermediates sold in the local market are pertinent to this study.
Here, σjxt is the portion of intermediate inputs that industry x supplied to industry j in total inputs purchased by industry j at time t. This value is also constructed by using the same input–output matrices used for backward spillover. Similar to before, within-industry inputs purchased are excluded.
Finally, as other control variables, the financial obstacle10 (fin_obstacle), size, and age of a firm are included in the regression to control for the effect on productivity. Financial
Horizontaljt =
∑
i for all i∈j(Foreign shareit ∗ Yit)∑
i for all i∈j Yit.
Backwardjt =∑
h if h�=j
αjht*Horizontalht ,
Forwardjt =∑
x if x �=j
σjxt
[
∑
i for all i∈x foreign shareit ∗(
Yit − Exportit)
∑
i for all i∈x
(
Yit − Exportit)
]
.
10 Financial obstacles are measured on a scale of 0 to 4 (0 = no obstacle; 1 = minor obstacle; 2 moderate obstacle; 4 = severe obstacle).
9 Input–output matrices 2010 is used for the samples earlier to 2010 because Asian Development Bank provides input–output tables from 2010.
Page 11 of 23Arif‑Ur‑Rahman and Inaba Economic Structures (2021) 10:17
obstacle measures the degree of obstacles a firm faces to accessing finance for its current operations. Additionally, industry dummy variables are included to control for industry-specific effect because an industry may be more productive than others. Time dummy variables will control for time variance and macroeconomic shocks. The above regres-sion estimation is performed on the full sample for all firms (domestic and foreign owned) and on the sample of domestic firms, which is defined as firms that have less than 10% foreign capital share.
5 Empirical findings5.1 Basic findings on FDI spillovers and productivity
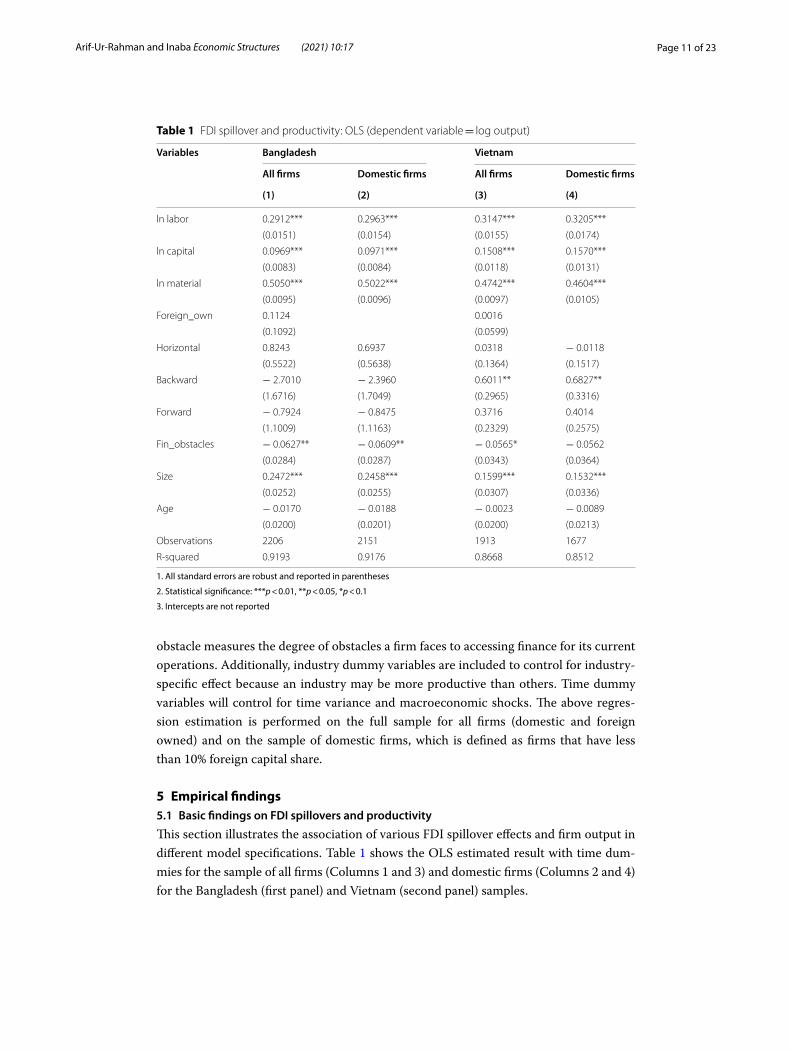
This section illustrates the association of various FDI spillover effects and firm output in different model specifications. Table 1 shows the OLS estimated result with time dum-mies for the sample of all firms (Columns 1 and 3) and domestic firms (Columns 2 and 4) for the Bangladesh (first panel) and Vietnam (second panel) samples.
Table 1 FDI spillover and productivity: OLS (dependent variable = log output)
1. All standard errors are robust and reported in parentheses
2. Statistical significance: ***p < 0.01, **p < 0.05, *p < 0.1
3. Intercepts are not reported
Variables Bangladesh Vietnam
All firms Domestic firms All firms Domestic firms
(1) (2) (3) (4)
ln labor 0.2912*** 0.2963*** 0.3147*** 0.3205***
(0.0151) (0.0154) (0.0155) (0.0174)
ln capital 0.0969*** 0.0971*** 0.1508*** 0.1570***
(0.0083) (0.0084) (0.0118) (0.0131)
ln material 0.5050*** 0.5022*** 0.4742*** 0.4604***
(0.0095) (0.0096) (0.0097) (0.0105)
Foreign_own 0.1124 0.0016
(0.1092) (0.0599)
Horizontal 0.8243 0.6937 0.0318 − 0.0118
(0.5522) (0.5638) (0.1364) (0.1517)
Backward − 2.7010 − 2.3960 0.6011** 0.6827**
(1.6716) (1.7049) (0.2965) (0.3316)
Forward − 0.7924 − 0.8475 0.3716 0.4014
(1.1009) (1.1163) (0.2329) (0.2575)
Fin_obstacles − 0.0627** − 0.0609** − 0.0565* − 0.0562
(0.0284) (0.0287) (0.0343) (0.0364)
Size 0.2472*** 0.2458*** 0.1599*** 0.1532***
(0.0252) (0.0255) (0.0307) (0.0336)
Age − 0.0170 − 0.0188 − 0.0023 − 0.0089
(0.0200) (0.0201) (0.0200) (0.0213)
Observations 2206 2151 1913 1677
R‑squared 0.9193 0.9176 0.8668 0.8512
Page 12 of 23Arif‑Ur‑Rahman and Inaba Economic Structures (2021) 10:17
As expected, inputs for production process (i.e., labor, capital, and material) exhibit a significant positive effect on firms’ outputs. In Columns 1 and 3, the coefficient of foreign ownership implies that a higher percentage of foreign shares in a firm’s capital do not have a significant effect on firm output for both samples. Now for spillover variables, in the Bangladeshi case none of the spillover variables seemed to have a significant effect on firm sales. In comparison with the Vietnamese sample, the hori-zontal spillover shows a higher coefficient though it is statistically insignificant. The coefficients of inter-industry spillovers are negative and statistically insignificant for the Bangladeshi sample. In Vietnam’s case, evidence shows spillovers take place through backward linkages. A positive significant (at 5% level of significance) coef-ficient of backward spillover constitutes evidence of productivity spillovers through contacts between domestic firms and their foreign customers in downstream sectors. Horizontal and forward linkages are not significant to firm output. Among other con-trol variables, financial obstacles have negative effects on a firm’s real output. Nar-row access to finance for a firm’s current operation hampers the productivity of that firm. Larger firms enjoy high productivity because the size variable exhibits a positive significant coefficient. Firm age is not significant to the firm output for both of the countries.
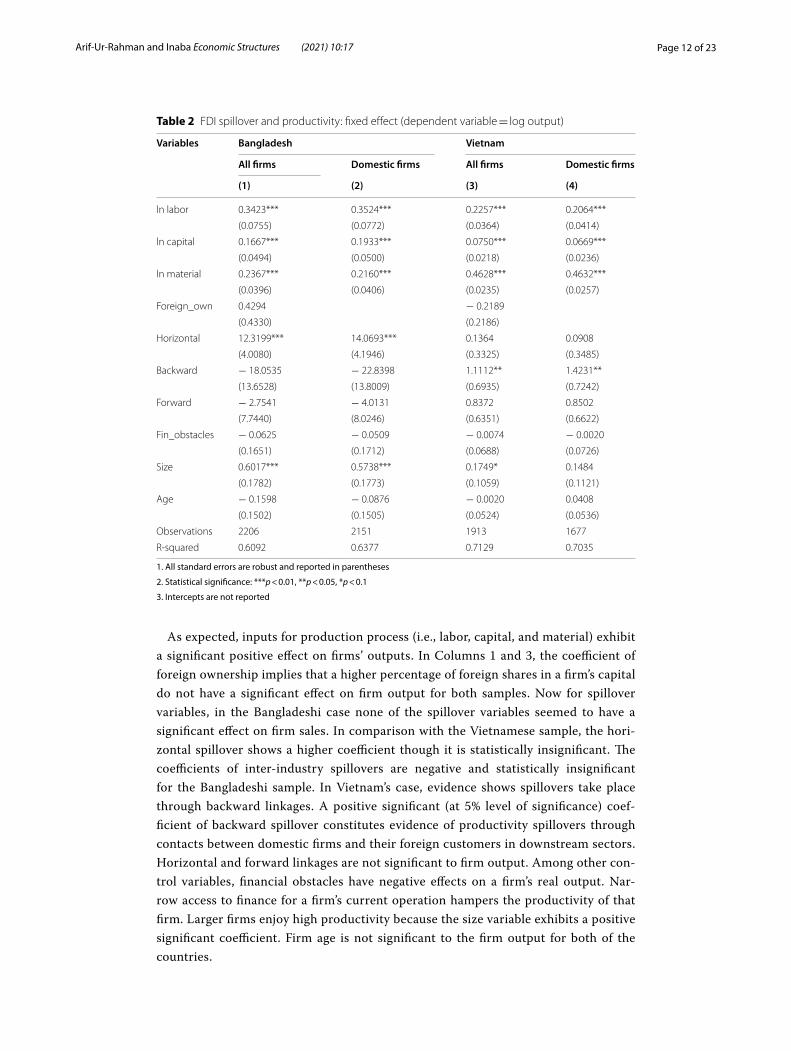
Table 2 FDI spillover and productivity: fixed effect (dependent variable = log output)
1. All standard errors are robust and reported in parentheses
2. Statistical significance: ***p < 0.01, **p < 0.05, *p < 0.1
3. Intercepts are not reported
Variables Bangladesh Vietnam
All firms Domestic firms All firms Domestic firms
(1) (2) (3) (4)
ln labor 0.3423*** 0.3524*** 0.2257*** 0.2064***
(0.0755) (0.0772) (0.0364) (0.0414)
ln capital 0.1667*** 0.1933*** 0.0750*** 0.0669***
(0.0494) (0.0500) (0.0218) (0.0236)
ln material 0.2367*** 0.2160*** 0.4628*** 0.4632***
(0.0396) (0.0406) (0.0235) (0.0257)
Foreign_own 0.4294 − 0.2189
(0.4330) (0.2186)
Horizontal 12.3199*** 14.0693*** 0.1364 0.0908
(4.0080) (4.1946) (0.3325) (0.3485)
Backward − 18.0535 − 22.8398 1.1112** 1.4231**
(13.6528) (13.8009) (0.6935) (0.7242)
Forward − 2.7541 − 4.0131 0.8372 0.8502
(7.7440) (8.0246) (0.6351) (0.6622)
Fin_obstacles − 0.0625 − 0.0509 − 0.0074 − 0.0020
(0.1651) (0.1712) (0.0688) (0.0726)
Size 0.6017*** 0.5738*** 0.1749* 0.1484
(0.1782) (0.1773) (0.1059) (0.1121)
Age − 0.1598 − 0.0876 − 0.0020 0.0408
(0.1502) (0.1505) (0.0524) (0.0536)
Observations 2206 2151 1913 1677
R‑squared 0.6092 0.6377 0.7129 0.7035
Page 13 of 23Arif‑Ur‑Rahman and Inaba Economic Structures (2021) 10:17
The OLS estimation is criticized because it poses the problem of consistency. The assumption of exogeneity is an imperative condition to estimate the productivity model. Griliches and Mairesse (1998) noted that the exogeneity assumption of the production function estimation is usually violated in the case of an OLS estimation model. In the production model, capital is treated as a fixed factor, but the labor and material variables are endogenous in nature. As a consequence, there is possibility of correlation between the unobserved productivity shock and the inputs.
To alleviate the drawbacks of OLS, we use fixed-effect model. Table 2 exhibits the results of the fixed-effect11 model for both samples. Similar to OLS estimation, the coef-ficients of inputs for production process (labor, capital and material) exhibit significant positive effect on firms’ output. Though the coefficient of foreign ownership is insignifi-cant for both countries’ samples, it is positive for Bangladesh and negative for Vietnam. Positive coefficient of foreign ownership implies a higher percentage of foreign share in firms’ capital has an effect on firm output.
Among the spillover variables, only horizontal spillover significantly effects firm out-put in the Bangladesh case. Positive significant coefficient is found for the horizontal spillover variables in both the full sample (Column 1) and the subsample of domestic firms (Column 2). The coefficients of inter-industry spillover variables are negative and statistically insignificant to firm output. The positive significant coefficient of horizontal spillover variable implies that the presence of foreign firms leads domestic firms in the same industry to realize productivity gains, which can be experienced through different channels. Domestic firms can improve productivity by copying foreign firms’ advanced technology, production strategies and organizational skills. Migrating skilled and trained employees from foreign firms to domestic firms may result in positive knowledge spill-over. Potential technological know-how and managerial skills may spread to domestic firms. In the case of Bangladesh, inter-industry or vertical spillovers that result from the upstream–downstream business relationship between foreign firms and domestic firms are not effective.
In terms of the Vietnamese sample, among the spillover variables only backward spillover significantly effects firm output. A positive significant coefficient is found for the backward spillover variables in both the full sample (Column 3) and the subsam-ple of domestic firms (Column 4). This finding strengthens the evidence that domestic firms that supply multinational firms are able to reap productivity improvements in the upstream sectors. The findings of productivity gain through backward linkage validate the recent debate that intra-industry rather inter-industry spillovers occur. However, the horizontal and forward spillover shows a positive coefficient, but appears to be statisti-cally insignificant in all regression specifications of the Vietnamese sample. The insignifi-cant coefficient of the horizontal spillover variable implies a lack of evidence of spillovers taking place through intra-industry channels. This finding on horizontal spillover is con-sistent with the existing studies that found either negative or insignificant results (Aitken and Harrison 1999; Kathuria 2001; Javorcik 2004).
11 The Hausman test indicates fixed-effect model is appropriate.
Page 14 of 23Arif‑Ur‑Rahman and Inaba Economic Structures (2021) 10:17
The findings of the OLS and fixed-effect models suggest that Bangladeshi firms gain productivity improvement through horizontal linkages and Vietnamese firms gain pro-ductivity spillover through backward linkages. By nature, foreign firms try to set bar-riers to check the leakage of technology and management skills to its same-industry competitors. Javorcik (2004) states foreign-invested firms within sectors compete with domestic firms and they have every incentive to prevent their embodied knowledge and technologies from leaking to their domestic competitors. Therefore, it is tricky to gain productivity for a long time through intra-industry or horizontal linkage. For example, by imposing patents on new technology, foreign firms prevent technology leakages. Similarly, by paying higher salaries they prevent employee turnover and loss of manage-ment skill thereby. Conversely, foreign firms have no reason to check the technology dispersion to its suppliers. To have better input supply, foreign firms deliberately trans-fer knowledge to domestic input suppliers. Moreover, foreign-owned firms are willing to provide technological assistance and training for employees of host-country supplier firms (Lall 1978).
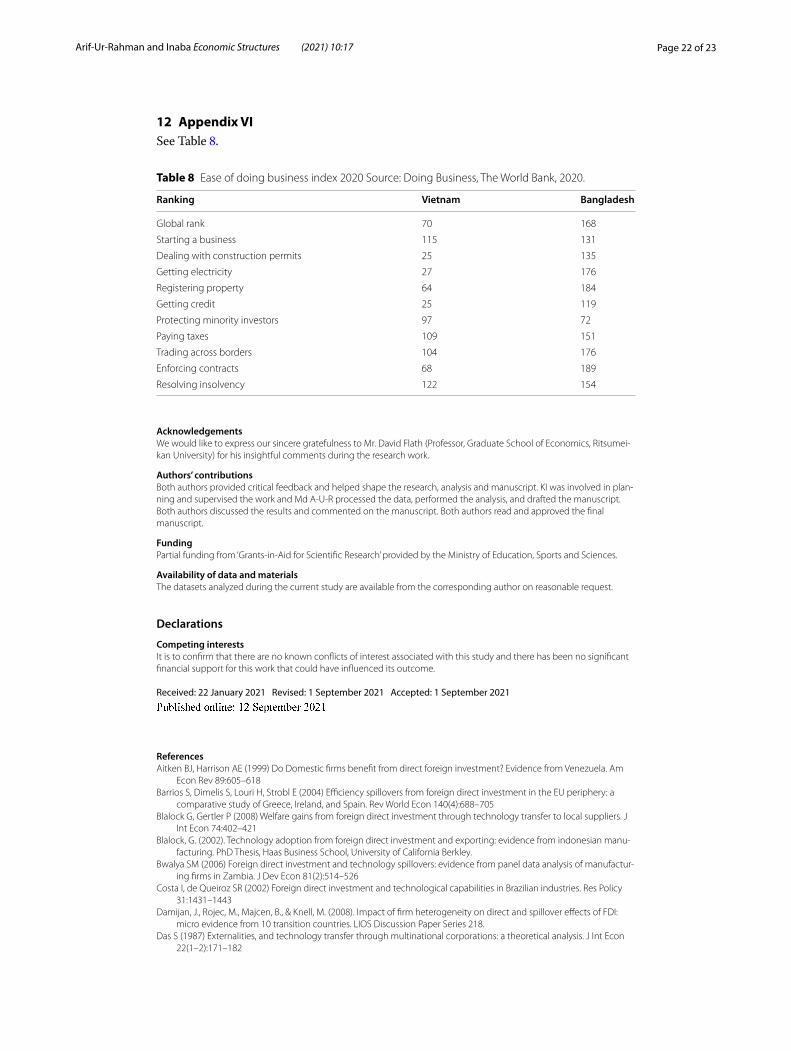
The empirical findings might be influenced by the number of foreign firms in the sam-ple. This sample represents the actual circumstances in which there are a minimum number of foreign firms in different industries of Bangladesh. If there are noteworthy numbers of foreign firms in different industries, then the business relationship with the upstream or downstream industries might result in vertical spillovers. One of main chal-lenges for attracting FDI in Bangladesh is its position in the World Bank’s “ease of doing business”12 index. Despite the prospect, Bangladesh is still among the least-demanding places to do business. Evidently, this depressing and unappealing business condition fails to achieve investor confidence. In overall global rankings of the World Bank’s ease of doing business index, Vietnam is far better positioned compared to Bangladesh. In 2020, Bangladesh ranked 168th among 190 economies with a total score of 45, whereas Viet-nam ranked 70th with a total score of 69.8. In 2019, Bangladesh ranked 176th and Viet-nam ranked 69th out of 190 countries. Among the 10 areas of assessment, Vietnam did extremely well in credit availability (ranked 25th out of 190 economies), paying taxes (ranked 25th) and providing electricity (ranked 27th). The weakest performance was in resolving insolvency, for which it ranked 122nd. Among the 10 assessment topics, Bang-ladesh was far behind Vietnam in all criteria except protecting minority investors. Even among South Asian countries, Bangladesh was ranked the second lowest, just above Afghanistan (173).
5.2 Using TFP as proxy of firm productivity
We changed the basic model by replacing the dependent variable, using TFP as the proxy of firm productivity instead of total output. To estimate the TFP, first we estimate a production function and use the resulting coefficients corresponding to a firm’s inputs to compute a firm’s TFP. We start with the standard Cobb–Douglas production function with constant returns to scale:
12 The World Bank ranks 190 economies on their ease of doing business. The rankings are measured by sorting the aggregate scores in 10 assessment areas. The rankings for Vietnam and Bangladesh in 2020 in the assessment areas are presented in Appendix VI.
Page 15 of 23Arif‑Ur‑Rahman and Inaba Economic Structures (2021) 10:17
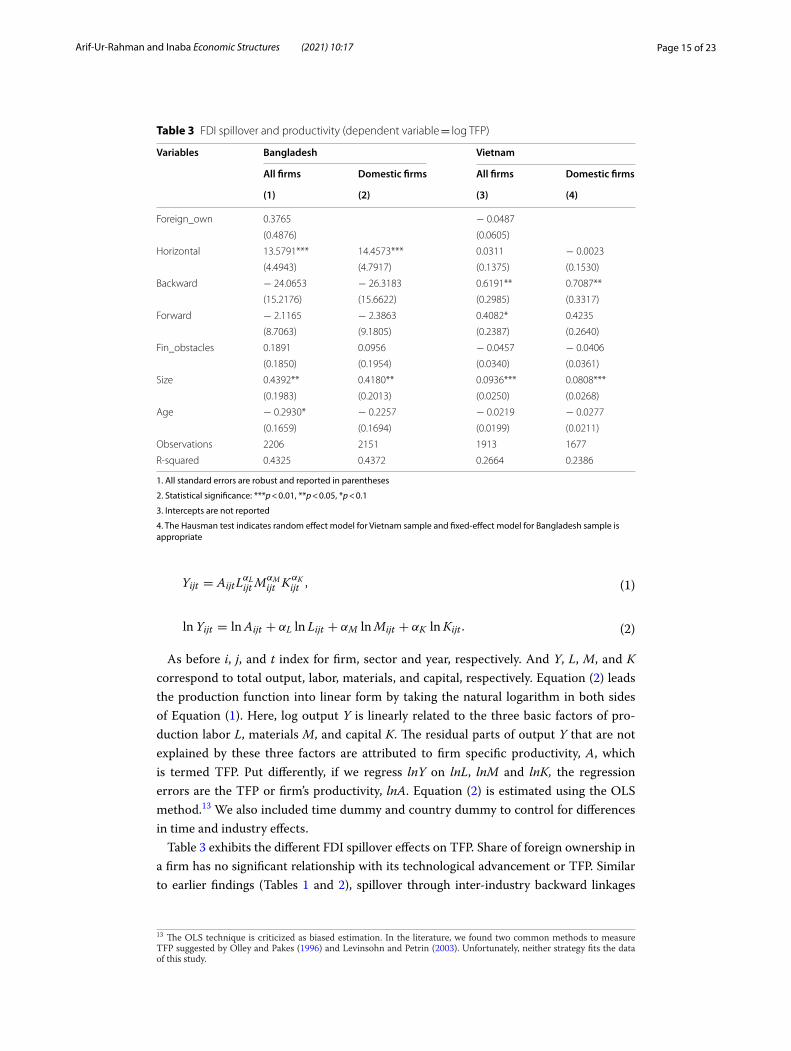
As before i, j, and t index for firm, sector and year, respectively. And Y, L, M, and K correspond to total output, labor, materials, and capital, respectively. Equation (2) leads the production function into linear form by taking the natural logarithm in both sides of Equation (1). Here, log output Y is linearly related to the three basic factors of pro-duction labor L, materials M, and capital K. The residual parts of output Y that are not explained by these three factors are attributed to firm specific productivity, A, which is termed TFP. Put differently, if we regress lnY on lnL, lnM and lnK, the regression errors are the TFP or firm’s productivity, lnA. Equation (2) is estimated using the OLS method.13 We also included time dummy and country dummy to control for differences in time and industry effects.
Table 3 exhibits the different FDI spillover effects on TFP. Share of foreign ownership in a firm has no significant relationship with its technological advancement or TFP. Similar to earlier findings (Tables 1 and 2), spillover through inter-industry backward linkages
(1)Yijt = AijtLαLijt M
αMijt K
αKijt ,
(2)ln Yijt = lnAijt + αL ln Lijt + αM lnMijt + αK lnKijt .
Table 3 FDI spillover and productivity (dependent variable = log TFP)
1. All standard errors are robust and reported in parentheses
2. Statistical significance: ***p < 0.01, **p < 0.05, *p < 0.1
3. Intercepts are not reported
4. The Hausman test indicates random effect model for Vietnam sample and fixed‑effect model for Bangladesh sample is appropriate
Variables Bangladesh Vietnam
All firms Domestic firms All firms Domestic firms
(1) (2) (3) (4)
Foreign_own 0.3765 − 0.0487
(0.4876) (0.0605)
Horizontal 13.5791*** 14.4573*** 0.0311 − 0.0023
(4.4943) (4.7917) (0.1375) (0.1530)
Backward − 24.0653 − 26.3183 0.6191** 0.7087**
(15.2176) (15.6622) (0.2985) (0.3317)
Forward − 2.1165 − 2.3863 0.4082* 0.4235
(8.7063) (9.1805) (0.2387) (0.2640)
Fin_obstacles 0.1891 0.0956 − 0.0457 − 0.0406
(0.1850) (0.1954) (0.0340) (0.0361)
Size 0.4392** 0.4180** 0.0936*** 0.0808***
(0.1983) (0.2013) (0.0250) (0.0268)
Age − 0.2930* − 0.2257 − 0.0219 − 0.0277
(0.1659) (0.1694) (0.0199) (0.0211)
Observations 2206 2151 1913 1677
R‑squared 0.4325 0.4372 0.2664 0.2386
13 The OLS technique is criticized as biased estimation. In the literature, we found two common methods to measure TFP suggested by Olley and Pakes (1996) and Levinsohn and Petrin (2003). Unfortunately, neither strategy fits the data of this study.
Page 16 of 23Arif‑Ur‑Rahman and Inaba Economic Structures (2021) 10:17
positively affect firm’s productivity improvement in the case of Vietnam. In the case of Bangladesh, intra-industry or horizontal spillover causes increased productivity. Among the other control variables, firm size has a positive association with firm productivity.
6 ConclusionThis study assesses the relationship of FDI spillover on firm productivity for two emerg-ing economies in Asia, Bangladesh and Vietnam. The disparity of different spillover channels of FDI to improve productivity of these countries are analyzed in firm-level.
The empirical findings imply that Bangladeshi firms gain productivity improvement through intra-industry or horizontal linkages, and Vietnamese firms gain productivity through inter-industry spillover, specifically through backward linkages. So, Bangladeshi firms realize productivity gain through the presence of foreign-owned firms in the same industry; whereas, for Vietnamese firms, an increase in foreign presence in downstream industries is related to a rise in the output of domestic firms in upstream industries. This significant effects of backward spillover on productivity of Vietnamese firms is in con-gruence with the results of previous studies (Schoors & van der Tol 2002; Javorick 2004; Blalock 2002) focused on vertical spillovers. This finding suggests that an increase in for-eign presence in downstream industries is related to an increase in output of domes-tic firms in upstream industries. We do not find intra-industry horizontal spillovers for Vietnamese firms, which support earlier studies carried out for other developing and transition economies (Aitken and Harrison 1999; Djankov and Hoekman 2000; Konings 2001; Javorick 2004).
In terms of vertical linkages, particularly for backward linkage, the foreign firms have no reason to check the technology spreading to their suppliers. To have a better input supply, foreign firms purposely transfer knowledge to domestic input suppliers. By this process of sharing advanced knowledge, domestic firms gain productivity. In contrast, foreign firms within a sector compete with domestic firms and set barriers to prevent their embodied knowledge and technologies from leaking to their domestic competitors. Moreover, competing with foreign firms can lead to crowding out of domestic firms. Domestic firms, which are unable to compete with foreign firms, are forced to leave their businesses. In fact, by competition within the same industry, foreign firms redirect demand from domestic firms. Bear in mind the above challenging facts, once it might be difficult for Bangladeshi firms to gain productivity through the foreign presence in the same industry. Furthermore, compared to the technologically advanced foreign firms, the domestic firms of Bangladesh are far behind in terms of technological advancement.
To gain from the current surge of foreign investment in Bangladesh, the government should patronize firms from upstream or downstream industries. Then the business relationships with the foreign firms of upstream or downstream industries might result in vertical spillovers.
Data unavailability is the main limitation in conducting firm-level analysis of FDI spillover on productivity. The same firm’s information for consecutive years is highly required to measure different sophisticated measures of firm productivity. As men-tioned earlier, several related studies use the measures of productivity suggested by Olley and Pakes (1996) and Levinsohn and Petrin (2003). Unfortunately, we could not fit both strategies due to the unavailability of firm-level information of several consecutive
Page 17 of 23Arif‑Ur‑Rahman and Inaba Economic Structures (2021) 10:17
financial years. Again, the non-response to the specific vital questions by firms also cre-ates difficulty in analysis. For example, many firms seem reluctant to report sales/out-put, capital information, etc. Without such information, it is challenging to measure firm productivity. In addition, the number of foreign firms is very minimum in the sample of few industries. The failure to represent the actual situation of foreign presence in a coun-try by sample might provide incorrect empirical likelihood.
Indeed, to obtain a complete understanding of the effect of FDI on sampled countries, more research is required. In particular, confirming the findings of this study using dif-ferent sophisticated alternative measures of firm productivity would be useful. Only improved data availability can help to ease this limitation. Moreover, deeper analysis of host country and investor characteristics will add variation in the context of determining the extent of FDI spillovers through different channels.
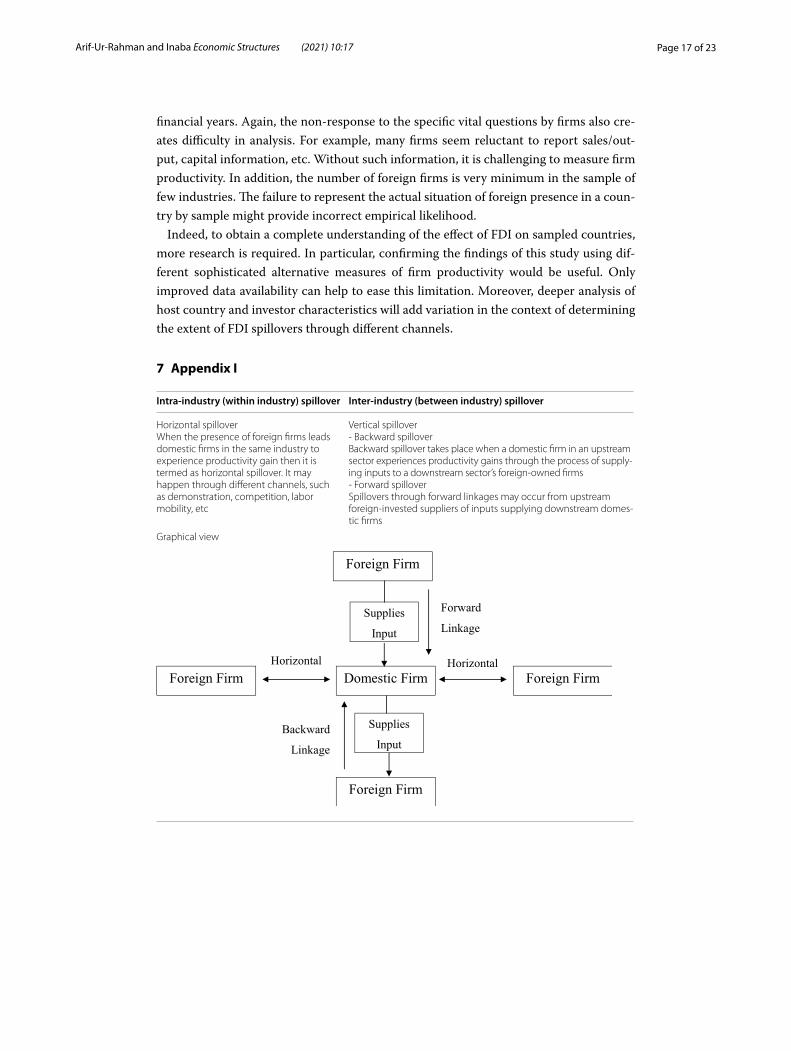
7 Appendix I
Intra-industry (within industry) spillover Inter-industry (between industry) spillover
Horizontal spilloverWhen the presence of foreign firms leads domestic firms in the same industry to experience productivity gain then it is termed as horizontal spillover. It may happen through different channels, such as demonstration, competition, labor mobility, etc
Vertical spillover‑ Backward spilloverBackward spillover takes place when a domestic firm in an upstream sector experiences productivity gains through the process of supply‑ing inputs to a downstream sector’s foreign‑owned firms‑ Forward spilloverSpillovers through forward linkages may occur from upstream foreign‑invested suppliers of inputs supplying downstream domes‑tic firms
Graphical view
Page 18 of 23Arif‑Ur‑Rahman and Inaba Economic Structures (2021) 10:17
8 Appendix II
See Table 4.
Table 4 Distribution of firms by industries Source: Author’s calculation based on the World Bank’s Enterprise Survey data (for Vietnam panel data of 2005, 2009, and 2015; for Bangladesh panel data of 2007, 2011, and 2013).
Industry Vietnam Bangladesh
No. of firms Percentage No. of firms Percentage
Food and tobacco 451 14.11% 374 12.82%
Textile and garments 534 16.71% 817 28.01%
Leather 66 2.07% 335 11.48%
Wood 143 4.47% 19 0.65%
Paper and printing 129 4.04% 87 2.98%
Refined petroleum 5 0.16% 5 0.17%
Chemical 115 3.60% 267 9.15%
Rubber and plastic 107 3.35% 49 1.68%
Non‑metallic mineral 381 11.92% 46 1.58%
Basic metal and fabricated metal 327 10.23% 94 3.22%
Machinery 125 3.91% 82 2.81%
Electric and electronic 73 2.28% 81 2.78%
Transport machine 70 2.19% 34 1.17%
Furniture, recycling 89 2.78% 158 5.42%
Construction 139 4.35% 7 0.24%
Service of motor vehicle 32 1.00% 26 0.89%
Wholesale 175 5.48% 27 0.93%
Retail 153 4.79% 259 8.88%
Hotel and restaurant 23 0.72% 141 4.83%
Transport, post, communication 47 1.47% 6 0.21%
IT 12 0.38% 3 0.10%
Total 3196 100.00% 2917 100.00%
Page 19 of 23Arif‑Ur‑Rahman and Inaba Economic Structures (2021) 10:17
9 Appendix IIISee Table 5.
Table 5 Foreign penetration Source: Author’s calculation based on the World Bank’s Enterprise Survey data (for Vietnam panel data of 2005, 2009, and 2015; for Bangladesh panel data of 2007, 2011, and 2013).
Industry Vietnam Bangladesh
Foreign penetration in terms of number of firms
Foreign penetration in terms of sales
Foreign penetration in terms of number of firms
Foreign penetration in terms of sales
Food and tobacco 10.6% 42.7% 0.3% 0.2%
Textile and garments 21.0% 31.8% 3.5% 6.2%
Leather 16.7% 35.8% 2.7% 12.7%
Wood 6.3% 20.4% 0.0% 0.0%
Paper and printing 6.2% 7.1% 0.0% 0.0%
Refined petroleum 40.0% 23.9% 20.0% 3.8%
Chemical 12.2% 5.9% 4.5% 6.6%
Rubber and plastic 13.1% 20.6% 0.0% 0.0%
Non‑metallic mineral 7.1% 25.1% 2.2% 0.4%
Basic metal and fabri‑cated metal
13.1% 43.0% 0.0% 0.0%
Machinery 16.8% 72.6% 2.4% 7.1%
Electric and electronic 19.2% 44.7% 7.4% 24.5%
Transport machine 22.9% 57.4% 5.9% 35.3%
Furniture, recycling 6.7% 4.1% 2.5% 7.0%
Construction 0.7% 0.1% 0.0% 0.0%
Service of motor vehicle
0.0% 0.0% 0.0% 0.0%
Wholesale 3.4% 12.5% 3.7% 0.0%
Retail 1.3% 0.5% 1.5% 6.5%
Hotel and restaurant 4.3% 0.4% 0.0% 0.0%
Transport, post, com‑munication
8.5% 54.3% 0.0% 0.0%
IT 0.0% 0.0% 0.0% 0.0%
Page 20 of 23Arif‑Ur‑Rahman and Inaba Economic Structures (2021) 10:17
Tabl
e 6
Dom
estic
vs.
fore
ign
firm
s: fe
w s
elec
ted
issu
es: B
angl
ades
h So
urce
: Aut
hor’s
cal
cula
tion
base
d on
the
Wor
ld B
ank’
s En
terp
rise
Surv
ey d
ata
(Ban
glad
esh
pane
l dat
a of
20
07, 2
011,
and
201
3).
Indu
stry
Dom
estic
firm
sFo
reig
n Fi
rms
Nat
iona
l sal
es
(% o
f tot
al
sale
s)
Expo
rt (%
of
tota
l sa
les)
Dom
estic
inpu
t (%
of t
otal
in
put)
Fore
ign
inpu
t (%
of t
otal
in
put)
No.
of
full-
time
wor
kers
Nat
iona
l sal
es
(% o
f tot
al
sale
s)
Expo
rt (%
of
tota
l sa
les)
Dom
estic
inpu
t (%
of t
otal
in
put)
Fore
ign
inpu
t (%
of t
otal
in
put)
No.
of
full-
time
wor
kers
Food
and
toba
cco
88.4
11.6
90.6
9.4
9595
.05.
050
.050
.027
0
Text
ile a
nd g
arm
ents
36.6
63.4
57.6
42.4
505
10.6
89.4
39.9
60.1
1120
Leat
her
62.1
37.9
83.2
16.8
116
8.9
91.1
42.2
57.8
1399
Woo
d10
0.0
0.0
82.6
17.4
21
Pape
r and
prin
ting
93.8
6.2
76.7
23.3
100
Refin
ed p
etro
leum
99.5
0.5
100.
00.
049
410
0.0
0.0
35
Che
mic
al95
.44.
656
.743
.334
586
.313
.726
.573
.565
5
Rubb
er a
nd p
last
ic95
.54.
558
.441
.679
Non
‑met
allic
min
eral
97.7
2.3
78.7
21.3
990.
010
014
4
Basi
c m
etal
and
fabr
icat
ed
met
al98
.51.
574
.825
.257
Mac
hine
ry98
.21.
869
.230
.842
0.0
100
0.0
100.
010
9
Elec
tric
and
ele
ctro
nic
94.5
5.5
52.4
47.6
6633
.366
.718
.381
.718
9
Tran
spor
t mac
hine
93.8
6.2
69.4
30.6
6050
.050
.05.
095
.016
8
Furn
iture
, rec
yclin
g95
.24.
856
.343
.792
74.5
25.5
18.3
81.7
279
Cons
truc
tion
100.
00.
063
10 A
ppen
dix
IVSe
e Ta
ble
6.
Page 21 of 23Arif‑Ur‑Rahman and Inaba Economic Structures (2021) 10:17
Tabl
e 7
Dom
estic
vs.
fore
ign
firm
s: fe
w s
elec
ted
issu
es: V
ietn
am S
ourc
e: A
utho
r’s c
alcu
latio
n ba
sed
on th
e W
orld
Ban
k’s
Ente
rpris
e Su
rvey
dat
a (V
ietn
am p
anel
dat
a of
200
5, 2
009,
an
d 20
15).
Indu
stry
Dom
estic
Fir
ms
Fore
ign
Firm
s
Nat
iona
l sal
es
(% o
f tot
al
sale
s)
Expo
rt (%
of
tota
l sa
les)
Dom
estic
Inpu
t (%
of t
otal
in
put)
Fore
ign
Inpu
t (%
of t
otal
in
put)
No.
of
full-
time
wor
kers
Nat
iona
l sal
e s
(% o
f tot
al
sale
s)
Expo
rt (%
of
tota
l sa
les)
Dom
estic
Inpu
t (%
of t
otal
in
put)
Fore
ign
Inpu
t (%
of t
otal
in
put)
No.
of
full-
time
wor
kers
Food
and
toba
cco
71.8
28.2
88.8
11.2
207
45.8
54.2
075
.025
.010
97
Text
ile a
nd g
arm
ents
51.7
48.3
50.7
49.3
478
22.1
77.9
32.8
67.2
646
Leat
her
36.1
63.9
51.4
48.6
862
13.2
86.8
30.9
69.1
1347
Woo
d68
.631
.477
.023
.010
137
.862
.269
.430
.614
9
Pape
r and
prin
ting
87.6
12.4
72.2
27.8
128
48.1
51.9
70.1
29.9
170
Refin
ed p
etro
leum
66.7
33.3
97.5
2.5
8715
.085
.060
.040
.019
1
Che
mic
al93
.26.
855
.944
.118
992
.17.
926
.773
.320
9
Rubb
er a
nd p
last
ic89
.810
.248
.651
.418
057
.742
.317
.282
.826
4
Non
‑met
allic
min
eral
82.3
17.7
90.2
9.8
217
66.3
33.7
76.2
23.8
325
Basi
c m
etal
and
fabr
i‑ca
ted
met
al92
.67.
470
.829
.210
456
.044
.043
.956
.132
7
Mac
hine
ry89
.510
.573
.226
.815
054
.845
.237
.962
.152
4
Elec
tric
and
ele
ctro
nic
93.7
6.3
55.3
44.7
209
52.0
48.0
21.3
78.7
879
Tran
spor
t mac
hine
93.4
6.6
53.7
46.3
312
56.5
43.5
42.2
57.8
534
Furn
iture
, rec
yclin
g47
.352
.752
.647
.425
118
.781
.365
.035
.011
76
Cons
truc
tion
99.3
0.7
98.3
1.7
61.4
100.
00.
06
11 A
ppen
dix
VSe
e Ta
ble
7.
Page 22 of 23Arif‑Ur‑Rahman and Inaba Economic Structures (2021) 10:17
12 Appendix VISee Table 8.
AcknowledgementsWe would like to express our sincere gratefulness to Mr. David Flath (Professor, Graduate School of Economics, Ritsumei‑kan University) for his insightful comments during the research work.
Authors’ contributionsBoth authors provided critical feedback and helped shape the research, analysis and manuscript. KI was involved in plan‑ning and supervised the work and Md A‑U‑R processed the data, performed the analysis, and drafted the manuscript. Both authors discussed the results and commented on the manuscript. Both authors read and approved the final manuscript.
FundingPartial funding from ‘Grants‑in‑Aid for Scientific Research’ provided by the Ministry of Education, Sports and Sciences.
Availability of data and materialsThe datasets analyzed during the current study are available from the corresponding author on reasonable request.
Declarations
Competing interestsIt is to confirm that there are no known conflicts of interest associated with this study and there has been no significant financial support for this work that could have influenced its outcome.
Received: 22 January 2021 Revised: 1 September 2021 Accepted: 1 September 2021
ReferencesAitken BJ, Harrison AE (1999) Do Domestic firms benefit from direct foreign investment? Evidence from Venezuela. Am
Econ Rev 89:605–618Barrios S, Dimelis S, Louri H, Strobl E (2004) Efficiency spillovers from foreign direct investment in the EU periphery: a
comparative study of Greece, Ireland, and Spain. Rev World Econ 140(4):688–705Blalock G, Gertler P (2008) Welfare gains from foreign direct investment through technology transfer to local suppliers. J
Int Econ 74:402–421Blalock, G. (2002). Technology adoption from foreign direct investment and exporting: evidence from indonesian manu‑
facturing. PhD Thesis, Haas Business School, University of California Berkley.Bwalya SM (2006) Foreign direct investment and technology spillovers: evidence from panel data analysis of manufactur‑
ing firms in Zambia. J Dev Econ 81(2):514–526Costa I, de Queiroz SR (2002) Foreign direct investment and technological capabilities in Brazilian industries. Res Policy
31:1431–1443Damijan, J., Rojec, M., Majcen, B., & Knell, M. (2008). Impact of firm heterogeneity on direct and spillover effects of FDI:
micro evidence from 10 transition countries. LIOS Discussion Paper Series 218.Das S (1987) Externalities, and technology transfer through multinational corporations: a theoretical analysis. J Int Econ
22(1–2):171–182
Table 8 Ease of doing business index 2020 Source: Doing Business, The World Bank, 2020.
Ranking Vietnam Bangladesh
Global rank 70 168
Starting a business 115 131
Dealing with construction permits 25 135
Getting electricity 27 176
Registering property 64 184
Getting credit 25 119
Protecting minority investors 97 72
Paying taxes 109 151
Trading across borders 104 176
Enforcing contracts 68 189
Resolving insolvency 122 154
Page 23 of 23Arif‑Ur‑Rahman and Inaba Economic Structures (2021) 10:17
Djankov S, Hoekman B (2000) Foreign investment and productivity growth in Czech enterprises. World Bank Econ Rev 14(1):49–64
Fosfuri A, Motta M, Ronde T (2001) Foreign direct investment and spillovers through worker mobility. J Int Econ 53(1):205–222
Glass AJ, Saggi K (2002) Multinational firms and technology transfer. Scand J Econ 104(4):495–513Griliches Z, Mairesse J (1998) Production function; search for identification. In: Strom S (ed) Econometrics and economic
theory in the 20th century. Cambridge University Press, CambridgeGrossman G, Helpman E (1993) Innovation and growth in the global economy. MIT Press Books. The MIT Press, Cam‑
bridge, MAHymer S (1976) The international operations of national firms: a study of foreign direct investment. MIT Press, Cambridge,
MAJavorick BS (2004) Does foreign direct investment increase the productivity of domestic firms? In search of spillovers
through backward linkages. Am Econ Rev l.94:605–627Kathuria V (2001) Foreign firms, technology transfer and knowledge spillovers to indian manufacturing firms—a stochas‑
tic frontier analysis. Appl Econ 33(5):625–642Kim M (2015) Productivity spillovers from FDI and the role of domestic firm’s absorptive capacity in south korean manu‑
facturing industries. Empirical Econ 48(2):807–827Konings J (2001) The effects of Direct foreign investment on domestic firms: evidence from firm level panel data in
emerging economies. Econ Transit 9(3):619–633Kugler, M. (2006). The diffusion of externalities from foreign direct investment: the sectoral pattern of technological spillo‑
vers. mimeo, University of Southampton.Lall S (1978) Transnational, Domestic enterprises and industrial structure in host LDCs: a survey. Oxf Econ Pap
30(2):217–248Levinsohn J, Petrin A (2003) Estimating production functions using inputs to control for unobservables. Rev Econ Stud
70(2):317–342Merlevede B, Schoors K (2005) Conditional spillovers from FDI within and between sectors: evidence from romania.
Department of Economics and CERISE, University of GhentMühlen, H. (2013). Firm‑level productivity spillovers from FDI in Latin American Countries. Institute of Development
Research and Development Policy, Ruhr‑Universitat Bochum, IEE Working Paper Series, No. 196.Newman C, Rand J, Talbot T, Tarp F (2015) Technology transfers, foreign investment and productivity spillovers. Eur Econ
Rev 76:168–187Nguyen T (2016) A review of foreign direct investment in Vietnam and implications for improvements. international trade
and economic series. https:// www. trade econo mics. com/ wp‑ conte nt/ uploa ds/ 2019/ 07/A‑ review‑ of‑ forei gn‑ direct‑ inves tments‑ in‑ Vietn am‑ and‑ impli catio ns‑ for‑ impro vement‑ min. pdf
Olley S, Pakes A (1996) The dynamics of productivity in the telecommunications equipment industry. Econometrica 64(6):1263–1297
Rugman A, Caves R (1983) Multinational enterprises and economic analysis. Can J Econ 16(4):742–744Schoors K, Van Der Tol B (2002) Foreign Direct Investment Spillovers within and between Sectors: evidence from Hungar‑
ian Data. Ghent University Working Paper 02/157, Belgium.Tondl G, Fornero JA (2010) Sectoral productivity and spillover effects in Latin America. Austrian Institute for International
Economics, FIW Working Paper Series, No. 53,Wang J‑Y, Blomstrom M (1992) Foreign investment and technology transfer: a simple model. Eur Econ Rev 36(1):137–155Yasar M, Morrison Paul CJ (2007) Firm performance and foreign direct investment: evidence from transition economies.
Econ Bull 15(21):1–11
Publisher’s NoteSpringer Nature remains neutral with regard to jurisdictional claims in published maps and institutional affiliations.