Embed Size (px)
Citation preview

The Impact of
Deferred Taxes on Firm Value
Three Empirical Studies on the Cash Flow and Value
Relevance of Deferred Taxes and Related Disclosures
Inauguraldissertation
zur Erlangung des Doktorgrades
der Wirtschafts- und Sozialwissenschaftlichen Fakultät
der Universität zu Köln
2011
vorgelegt von
Dipl.-Volksw. Astrid K. Chludek
aus Aachen

Referent: Prof. Dr. Norbert Herzig
Coreferent: Prof. Dr. Christoph Kuhner
Day of Promotion: November 09, 2011

The Impact of
Deferred Taxes on Firm Value
Three Empirical Studies on the Cash Flow and Value
Relevance of Deferred Taxes and Related Disclosures
Astrid K. Chludek
Cologne Graduate School in Management, Economics and Social Sciences
University of Cologne
August 2011


i
Contents
Introduction
1. Purpose of this dissertation
2. Motivation, Research Questions, Main Findings, and Contribution
1
2
7
Chapter I – Accounting for Deferred Taxes
1. Accounting for Deferred Taxes under IFRS/IAS (IAS 12)
2. Accounting for Deferred Taxes under US GAAP (ASC 740-10, formerly SFAS No. 109)
3. Single-Step Approach versus Two-Step Approach of Deferred Tax Asset Recognition
17
18
22
24
Chapter II – Perceived versus Actual Cash Flow Implications of
Deferred Taxes – An Analysis of Value Relevance
and Reversal under IFRS
1. Introduction
2. The Value Relevance of Deferred Taxes: Theories and Literature Review
3. Value Relevance Analysis 3.1. Regression Model and Estimation Method 3.2. Data and Sample Selection 3.3. Empirical Results
4. Reversal Analysis
5. Robustness Tests and Supplemental Analysis
6. Conclusion
Appendix A – Feltham-Ohlson Firm Valuation Model Appendix B – Deferred Tax Components
31
33
36
39 39 41 44
51
57
61
62 63
Chapter III – On the Relation of Deferred Taxes and Tax Cash
Flow
1. Introduction
2. Motivation and Literature Review
3. Regression Model and Estimation Methods
65
66
69
72

ii
3.1. Models 3.2. Estimation Methods
4. Empirical Evidence 4.1. Data and Sample Selection 4.2. Descriptive Statistics 4.3. Regression Results
4.3.1. Regression Results – Pooled Sample 4.3.2. Regression Results – By Industry 4.3.3. Regression Results – By Firm
5. Forecast Analysis
6. Robustness Tests and Supplemental Analysis
7. Conclusion
72 77
79 79 81 85 85 91 93
95
99
105
Chapter IV – The Impact of Corporate Governance on
Accounting Choice – The Case of Deferred Tax
Accounting under IFRS
1. Introduction
2. Motivation, Model, and Hypotheses
3. Data and Sample
4. Analysis of Disclosure
5. Analysis of Determinants of Deferred Tax Assets for Tax Loss Carryforwards 5.1. Empirical Results 5.2. Sensitivity Analysis
5.2.1. Dependent Variable 5.2.2. Endogeneity
6. Summary and Conclusion
107
108
110
118
122
127 127 130 130 131
134
References 157
Acknowledgements 143

iii
Tables
Chapter I
Table I.1 – Scenarios 1 and 2 Table I.2 – Scenarios 3, 4, and 5 Table I.3 – Inter-Temporal
26
29 30
Chapter II
Table II.1 – Variable Definitions Table II.2 – Sample Selection Table II.3 – Industry Composition Table II.4 – Descriptive Statistics Table II.5 – Pearson Correlation Coeffcients Table II.6 – Value Relevance Analysis Table II.7 – Value Relevance Analysis – Reversal Table II.8 – Profit versus Loss Observations
40 42 43 44 46 47 56 59
Chapter III
Table III.1 – Variable Definitions Table III.2 – Sample Table III.3 – Descriptive Statistics Table III.4 – Regression Results – Basic Model Table III.5 – Regression Results – Extended Model Table III.6 – Regression Results – By Industry Table III.7 – Sector Distribution of Significant Deferred Tax Coefficients of Firm-Specific Regressions Table III.8 – Forecast Analysis Table III.9 – CASH ETR
74 80 82 86 88 92
93 96 102
Chapter IV
Table IV.1 – Variable Definitions Table IV.2 – Descriptive Statistics Table IV.3 – Determinants of Disclosure Table IV.4 – Determinants of Deferred Tax Assets for Tax Loss Carryforwards Table IV.5 – Sensitivity Analysis
112 119 125
128 132

iv
Figures
Chapter II
Figure II.1 – Deferred Taxes to Total Assets by Industry Figure II.2 – Annual Changes Figure II.3 – Medium-Term Development Appendix B – Deferred Tax Components
45 52 53 63
Chapter III
Figure III.1 – Average Deferred Taxes relative to Total Assets by Sector Figure III.2 – Annual Changes in Deferred Taxes
83 84

v
Chapter II of this dissertation is published under the title Perceived versus Actual Cash Flow
Implications of Deferred Taxes – An Analysis of Value Relevance and Reversal under IFRS in the
Journal of International Accounting Research, Vol. 10 (1), 2011, pp. 1-25. Chapters III and IV
are submitted for review at two international journals. Parts of Chapter I are used in an article,
which is accepted for publication in a national journal.

vi

1 © Astrid K. Chludek
INTRODUCTION

2 © Astrid K. Chludek
1. Purpose of this Dissertation
According to IASB and FASB, “Financial reporting should provide information that is useful to
present and potential investors and creditors and other users in making rational investment,
credit, and similar decisions“ (Statement of Financial Accounting Concepts (SFAC) No. 1, para.
34), in particular by helping them in assessing the amounts, timing, and probability of future cash
flow (SFAC No. 1, para.37). The decision usefulness of provided information is therefore
assessed along the criteria: understandability, comparability, relevance, reliability, predictive
value, and materiality, among others (SFAC No. 2 and IASB’s Conceptual Framework).
However, when developing accounting standards, “a standard-setting body […] must also be
aware constantly of the calculus of costs and benefits” (SFAC No. 2, para. 133) and “safeguard
the cost-effectiveness of its standards” (SFAC No. 2, para. 143).
Regarding the special case of deferred tax accounting, it is common knowledge that
accounting for deferred taxes is relatively effort- and time-consuming and, hence, relatively
costly.1 The Commission of the European Communities, for example, concludes in its
Communication from the Commission on a simplified business environment for companies in the
areas of company law, accounting and auditing in 2007 (COM(2007) 394 final, p. 18) that “[…]
accounting for deferred taxes […] is very burdensome for companies in general”. The high
accounting costs arise due to the fact that accounting for deferred taxes is rather complex and
requires a high level of coordination. It is necessary, for instance, to prepare the tax report within
a narrow time frame and to assess the future realizability of deferred tax assets. Latter includes
estimating future taxable income as well as assessing the reversal of taxable temporary
differences. Moreover, it is necessary to determine the expected manner of recovery/settlement of
assets/liabilities if the manner of recovery/settlement affects the applicable tax rate. Hence,
accountants name deferred tax allocation as one of the most complex and costly provisions to
comply with.2
Because of the relatively high costs involved, it is of economic significance to determine
the benefits of deferred tax accounting. While the cost to produce deferred tax information are
rather easily assessable, there is an ongoing controversy among preparers, standard setters, and
financial statement users about whether there is any (adequate) benefit in deferred tax
1 See Eierle et al. (2007) or Colley et al. (2009), for example. 2 See, for instance, Eierle et al. (2007), COM(2007) 394 final.

Introduction
3 © Astrid K. Chludek
information that could justify the rather high accounting costs involved.3 Survey results of Eierle
et al. (2007) give an impression about the perceived cost-benefit ratio: While 54 percent of the
respondents (directors in charge of the annual accounts of 401 German small and medium-sized
enterprises (SMEs)) and even 64 percent of the accounting directors of larger firms (i.e., firms
with annual sales of larger than €100 million) classify the cost of deferred tax accounting as high
or very high, 48 percent of the respondents assess deferred tax information to be not or only
moderately useful for external financial statement user. Additional 21 percent of the respondents
are not even able to assess the informational benefit of deferred tax disclosures at all.
Referring to the general objectives and purposes of financial reporting, stated in IASB’s
Conceptual Framework and FASB’s SFAC No. 1 and No. 2, to define benefit, the core purpose
of the analyses presented in this dissertation is therefore to assess the benefit of deferred tax
accounting with regard to the relevance and decision-usefulness of disclosed deferred tax
information for financial statement users. In detail, the dissertation investigates in three separate
empirical studies the cash flow relevance (materiality and predictive value) of disclosed deferred
taxes and the impact of deferred taxes on firm value.
Since firm value equals the present value of expected firm cash flows, quantification of
deferred tax cash flow is particularly important in order to determine the relevance of deferred
taxes for firm value and, thus, to determine the decision relevance and usefulness of provided
deferred tax information for financial statement users. This is the first study, however, that
systematically tries to quantify deferred tax cash flow and that empirically investigates the
economic significance of this deferred tax cash flow. Furthermore, this is the first study analyzing
the information content of disclosed deferred taxes with respect to future tax cash flow. Since the
primary purpose of deferred tax accounting is to inform about future tax benefits and future tax
liabilities, an analysis of the relation of currently disclosed deferred taxes to actual future tax cash
flow is crucial for assessing whether deferred tax accounting actually meets its intended purpose.
I assess the impact of deferred taxes on firm value first directly, by conducting a classical
value relevance analysis. Second, I use several methods to quantify deferred tax cash flow in
order to determine the cash flow implications and cash flow relevance of disclosed deferred tax
information. Specifically, the reversal behavior of deferred tax balances in the short- and in the
medium-term is analyzed, and deferred tax cash flow is estimated as it is implied by balance
3 See, for instance, Colley et al. (2009) and Beechy (2007).

Introduction
4 © Astrid K. Chludek
reversal (Chapter II). In addition, the relation of deferred taxes and actual tax cash flow is
determined by using regression analysis. Deferred tax cash flow is quantified, then, by using the
estimated coefficients (Chapter III). Furthermore, the relevance of current deferred tax
information for future tax cash flow is assessed by means of a forecasting analysis (Chapter III).
In the last part of this dissertation (Chapter IV), which was produced in collaboration with Duc
Hung Tran (Seminar of Financial Accounting & Auditing, University of Cologne), underlying
factors, which are not directly related to deferred tax cash flow, but which might influence value
relevance as correlated omitted variables through recognition decisions in the context of deferred
tax asset recognition, are analyzed.
The main results of the empirical analyses suggest that
(a) except for large net deferred tax assets, deferred taxes are generally not reflected in
firm value, i.e., investors do in general not expect deferred taxes to result in material
cash flow in the near future.
(b) there is some reversal in the balances in the short-run. The magnitude of these
reversals, however, is rather small, suggesting that large implied deferred tax cash
flows are rare.
(c) reversal as well as regression analyses suggest that deferred taxes have indeed timely
cash flow implications. Yet, the economic significance of implied deferred tax cash
flow seems to be rather small. Estimations of deferred tax cash flow based on
regression analyses suggest that deferred tax cash flow constitutes less than 5 percent
of total tax cash flow for the majority of observations.
(d) the analysis of the long-term development of deferred tax balances clearly shows that
deferred tax balances continuously increase in the long-run.
(e) deferred taxes are not (materially) informative about future tax cash flow for the
majority of observations.
Hence, the results of the cash flow and reversal analyses (Chapter II and III), largely
suggesting no material deferred tax cash flow, provide a rationale for the largely found
irrelevance of deferred taxes for firm value (Chapter II). The empirical analysis of Chapter IV
deals with the hypothesis that the found value relevance of certain (net) deferred tax assets in the
value relevance analysis of Chapter II might be caused by underlying factors (correlated omitted

Introduction
5 © Astrid K. Chludek
variables) that influence the deferred tax asset recognition decision and that, at the same time, are
value-relevant on their own.
Accounting for deferred taxes is under permanent criticism from the user and preparer
community, arguing that, on the one hand, recognition and disclosure requirements of deferred
tax accounting are extensive and complex and, thus, very costly to implement, while, on the other
hand, deferred taxes are not considered to be decision-useful by financial statement users because
of lacking cash flow relevance and information content of disclosed deferred tax amounts, and
because of lacking understanding of the concept of deferred taxes and the related disclosures. The
empirical analyses of this dissertation aim at shedding more light on this perceived gap of cost
versus benefits of deferred tax accounting, focusing on the cash flow relevance and value
relevance of deferred taxes.
The results of the empirical analyses suggest that disclosed deferred taxes indeed lack
material cash flow implications and are generally not informative about future tax cash flow for
the majority of firms, which is consistent with and would explain lacking value relevance and
lacking decision usefulness of disclosed deferred taxes. For one thing, these results are of
relevance for standard setters, who deal with the most appropriate way to account for deferred
taxes, thereby considering information content, predictive ability, cash flow and value relevance,
as well as cost-benefit ratios of the numbers and information produced by the respective
accounting standards. The findings of this study should help standard setters to assess the
usefulness of inter-period tax allocation and of the currently required method of accounting for
deferred taxes. In particular, the largely found cash flow and value irrelevance of disclosed
deferred taxes in this study point toward a flow-through approach of tax recognition in financial
reporting, according to which only current tax expenses and current taxes payable, respectively,
are recognized.
For another thing, the results of this study should be helpful for financial statement users.
The knowledge whether and how disclosed deferred tax balances are related to actual future tax
cash flow, i.e., to what extent deferred taxes will translate into actual cash flow in the near future,
is important to assess whether deferred tax information should be considered in their decision
making process.

Introduction
6 © Astrid K. Chludek
Last but not least, additional evidence on the value (ir)relevance of deferred taxes might
be of interest to preparers of financial statements: Knowledge on how capital markets interpret
and value their deferred taxes might help them, in particular, in their decision on how much of
their potential deferred tax assets to recognize.
The next section presents motivation, research questions, main findings, and contribution
of this dissertation in more detail.

Introduction
7 © Astrid K. Chludek
2. Motivation, Research Questions, Main Findings, and Contribution
Since the 1980s, disclosure requirements for deferred taxes have been enhanced considerably in
US GAAP, IFRS/IAS, and in national accounting standards. The most recent instance is the
reform of national accounting law in Germany (BilMoG, generally applicable for fiscal years
beginning after December 31, 2009), which materially increases recognition, disclosure, and
documentation requirements for deferred taxes of medium-sized and large corporations.
Meanwhile, the overall usefulness of deferred tax accounting is on debate continuously.
Critics argue that the informative value of deferred taxes is only low due to highly
uncertain cash flow implications, which results in most financial statement users ignoring
deferred tax disclosures as they do not consider them to provide relevant information for decision
making. The EFRAG even has started a general project dealing with the financial reporting of
corporate income taxes because “[t]he accounting for corporate income taxes has been subject to
much criticism from the user and preparer community, who have questioned the decision-
usefulness of the numbers produced by the existing IAS 12 Income Taxes, and claim that the
standard is too difficult to apply and understand.”4 The Commission of the European
Communities specifies in its communication on a simplified business environment in 2007 that “it
has been confirmed by preparers and users, e.g. credit institutions and rating agencies, that
deferred tax information (whether recognised in the balance sheet or provided in the notes) often
is not considered a relevant input for the decisions to be taken.”5
Providing interview-evidence on this, Haller et al. (2008) report that most of the
interviewees in their study (59 employees of 32 credit institutions, who work in the area of credit
analysis and scoring of medium-sized enterprises) declared to offset deferred tax assets against
equity because of doubtful value. Alternatively, deferred tax information is ignored because of
lacking knowledge about and understanding of deferred tax accounting.6 Illustrating this point,
accounting analyst Robert Willens summarizes financial analysts’ idea of deferred tax accounting
4 http://www.efrag.org/Front/p177-1-272/Proactive---Financial-Reporting-for-Corporate-Income-Taxes.aspx.
Accessed: 07/15/2011. 5 Communication from the Commission on a simplified business environment for companies in the areas of company
law, accounting and auditing, Commission of the European Communities, COM(2007) 394 final, p. 18. 6 Chen and Schoderbek (2000), for example, report that deferred tax adjustments as a consequence of a change in the corporate tax rate were reflected in share prices at the same rate as recurring earnings, despite their different implications for future cash flows, which suggests that investors are not familiar with the accounting rules for and/or the concept of deferred taxes, or that they ignore deferred taxes altogether.

Introduction
8 © Astrid K. Chludek
as “[…] a total black box. I’ve never met a stock analyst who has any idea what it is.” (see
Carnahan and Novack 2002). In any case, there is a lot of anecdotal evidence suggesting that
banks and other lenders as well as credit and financial analysts routinely reverse out the impact of
inter-period tax allocation, adding deferred tax expense back to net income and treating deferred
tax balances as equity. Beechy 2007, Carnahan and Novack 2002, and Cheung et al. 1997, for
example, provide additional anecdotal evidence and Chen and Schoderbek 2000, Amir and
Sougiannis 1999, and Chattopadhyay et al. 1997 find empirical evidence that analysts and lenders
do not consider deferred tax information in their decision making process.
With respect to consideration of deferred tax information by investors (value relevance
studies), empirical results are highly mixed. While early studies, based on the first fiscal years
after implementation of SFAS No. 109, find significant valuation coefficients of deferred taxes
(Amir et al. 1997 and Ayers 1998), more recent studies based on US GAAP-data (Raedy et al.
2011), as well as studies based on non-US GAAP-data (Citron 2001 and Chang et al. 2009) find
no consistent evidence for value relevance. Therefore, Chapter II of this dissertation provides
additional empirical evidence regarding the value relevance of deferred taxes, by investigating as
first study the value relevance of deferred taxes under IFRS/IAS.7
The relevance and information content of deferred tax disclosures under IFRS/IAS is of
common international interest because IFRS affect the accounting and reporting practice of a
continuously increasing number of companies worldwide. Besides more than 100 countries
already requiring or at least allowing some or all of their companies to report in accordance with
IFRS/IAS,8 national accounting standards worldwide are converging to IFRS/IAS. This
convergence is likely to cause material additional costs for firms with respect to deferred tax
accounting because recognition and disclosure requirements are typically much more extensive
7 In detail, a sample of German firms, covering fiscal-years 2005 to 2008, is used. 8 The SEC (SEC Release No. 33-8879 “Acceptance From Foreign Private Issuers of Financial Statements Prepared
In Accordance With International Financial Reporting Standards Without Reconciliation To U.S. GAAP”, p.6, available at http://www.sec.gov/rules/final/2007/22-8879.pdf, accessed: 07/17/2010) estimates in 2007 that “[a]pproximately 100 countries now require or allow the use of IFRS”, among others all EU Member States. Besides, Canada is planning to require IFRS for domestic publicly accountable profit-oriented enterprises, and the SEC, already allowing foreign private issuers to include in their filings financial statements prepared in accordance with IFRS without reconciliation to US GAAP, considers to require the use of IFRS by U.S. issuers, too, (see SEC Release No. 33-8982 “Roadmap for the Potential Use of Financial Statements Prepared in Accordance with
International Financial Reporting Standards by U.S. Issuers,” available at http://www.sec.gov/rules/final/2007/33-8982.pdf, accessed: 07/17/2010 ).

Introduction
9 © Astrid K. Chludek
under IFRS/IAS than under national accounting standards.9 Specifically, empirical evidence on
the relevance of IFRS/IAS-deferred tax disclosures should be of particular interest to the IASB
and the FASB since the most appropriate way to account for deferred taxes and to disclose
deferred tax information are discussed topics in the context of the convergence of IFRS/IAS and
US GAAP.10
Moreover, in consideration of the ambiguous results of previous empirical studies
analyzing consideration, interpretation, and understanding of deferred tax disclosures, it is
important to cover other data sources and time horizons in order to be able to draw general
conclusions. In particular, there is a general interest for empirical evidence based on non-U.S.
data in tax research, see for instance Graham et al. (2011). In his talk at the JAE Conference in
October 2009, Mihir Desai actually identified provincialism, i.e., the almost-exclusive emphasis
on U.S./Compustat data, as one of the key empirical challenges in tax research.
Moreover, the value relevance analysis of Chapter II provides some methodological
improvements, in comparison to prior studies. By using fixed effects estimation with Huber-
White robust standard errors clustered at firm level, standard error estimation is adjusted for
potential serial correlation, and correlated omitted variable bias in the estimated coefficients is
mitigated by controlling for unobserved heterogeneity.
The results of the value relevance analysis (Chapter II.3.3) suggest that investors – similar
to other financial statement users – do not include deferred taxes into their valuation of the firm,
i.e., deferred taxes are generally not systematically related to a firm’s market value, with the
exception being large net deferred tax assets. In particular, the results suggest that the
composition of deferred taxes is largely irrelevant for their value (ir)relevance. These findings
suggest that investors perceive the cash flows deferred taxes account for generally as highly
uncertain and do not expect them to be substantially realized in the near future.
9 The most recent instance of convergence is the reform of national accounting law (BilMoG) in Germany. Key features of the reform with respect to deferred tax accounting are the change from the income statement method (timing concept) to the balance sheet method (temporary concept) and the requirement to recognize deferred tax assets for tax loss carryforwards to the extent that future taxable profits are expected to be generated within the next five years against which the unused tax losses can be offset. Because of the necessity to prepare a tax balance sheet as the basis for determining deferred taxes according to the balance sheet method and the requirement to disclose deferred tax components in the notes, as well as because of the necessity of five-year tax planning to be able to assess the realizable amount of tax loss carryforwards, both novelties will presumably cause material additional costs for firms. Other jurisdictions with converging national accounting standards are, for instance, Australia, Brazil, Canada, Hong Kong, Japan, and Singapore. 10 For the latest development, see the Amendment to IAS 12 – Income Taxes Exposure Draft ED/2009/2.

Introduction
10 © Astrid K. Chludek
These results are of relevance for standard setters, who deal with the most appropriate
way to account for deferred taxes, thereby considering information content, cash flow and value
relevance, as well as cost-benefit ratios of the numbers and information produced by the
respective accounting standards.
Besides standard setters, the results should also be of interest to firms because many
auditing and accounting service companies promote tools and planning instruments for assessing
and enhancing the intrinsic value of deferred tax assets, arguing this would provide a positive
signal to capital markets. The empirical analysis of Chapter II, however, shows that, except for
case when deferred tax assets materially exceed deferred tax liabilities, deferred tax assets do not
seem to be of relevance for a firm’s market value.
The analysis of value relevance is complemented by an analysis of deferred tax balance
reversal (Chapter II.4) in order to examine whether perceived lacking cash flow implications
coincide with actual lacking reversal. The only other study analyzing deferred tax reversal seems
to be a study conducted by Price Waterhouse in 1967 that covers years 1954 to 1965 and focuses
exclusively on deferred taxes arising from timing differences due to depreciation and installment
sales.11 Hence, empirical evidence on reversal rates is not only rare but also pretty outdated. Yet,
information on the reversal behavior of deferred tax balances is of crucial interest in the realm of
cost-benefit and value relevance considerations, since lacking reversals imply a present value of
deferred tax cash flow of zero, thus challenging the informativeness of deferred tax allocation and
rationalizing the value irrelevance of deferred taxes. Studies dealing with deferred taxes usually
only hypothesize about reversal behavior, so that the results of Chapter II.4 are also of interest to
other researchers by giving an impression of the actual reversal behavior.
The analysis of balance reversal reveals that deferred tax assets show a higher rate of
balance reversal than deferred tax liabilities, suggesting that deferred tax assets tend to translate
more timely into tax cash flow than deferred tax liabilities. Rough quantifications of deferred tax
cash flow based on reversal rates imply that, despite the distributions showing a considerable rate
of balance reversal in the short-term, average cash flow implications of these reversals are only
small. Overall, the results of the value relevance analysis are broadly consistent with the
balances’ reversal structure and cash flow implications.
11 See Chaney and Jeter (1989).

Introduction
11 © Astrid K. Chludek
The drawback of prior studies dealing with consideration, interpretation, and understanding of
deferred tax disclosures is that these studies always (have to) hypothesize about implied deferred
tax cash flow or indirectly deduct cash flow implications from observed (non-)consideration.
Although the tax cash flow implications of deferred taxes are crucial for the value and decision
relevance of deferred taxes, research directly addressing the cash flow implications of deferred
taxes is very scarce, so that the empirical relation of deferred taxes and tax cash flow is still an
open question, though. Therefore, Chapter III investigates the relation of deferred tax balance
amounts and actual (future) tax cash flow. Thereby, Chapter III takes a more direct, in-depth, and
methodologically much more sophisticated approach to identify deferred tax cash flow, as
compared to the reversal analysis of Chapter II.4. Among other things, the study presented in
Chapter III assesses the economic significance of deferred tax cash flow and investigates whether
disclosed deferred taxes serve their primary purpose, to provide useful information with respect
to future tax cash flow, by investigating whether consideration of deferred tax information
improves forecasts of future tax cash flow.
The results of the study should be of interest for at least two groups. For one thing, the
findings of this study should help standard setters to assess the usefulness of inter-period tax
allocation and of the currently required method of accounting for deferred taxes. For another
thing, the results of this study should be helpful for financial statement users. The knowledge
whether and how disclosed deferred tax balances are related to actual future tax cash flow, i.e., to
what extent deferred taxes will translate into actual cash flow in the near future, is important to
assess whether deferred taxes should be considered in the decision making process. Moreover, by
determining the exact cash flow implications of disclosed deferred tax balances, the study
provides a basis for the ongoing debates concerning (lacking) value relevance of deferred taxes.
Besides, this study provides additional insights concerning the predictive ability of financial
reporting.
The analyses are based on a sample of 449 S&P 500-firms, with observations covering
fiscal years 1994 to 2009. Resulting in a final sample of 4956 firm-year observations, this study
uses one of the largest samples in the deferred tax research. The selected sample has several
advantages. For one thing, by replicating the economy’s sector composition of companies with
market cap in excess of $3.5 billion, the S&P 500’s sector-balanced composition facilitates

Introduction
12 © Astrid K. Chludek
industry-specific analysis, and sector effects in the empirical results replicate sector effects as
present in the total economy. For another thing, the particularly long time-series available allow
an analysis by firm, which is important because deferred tax cash flow may be very firm-specific.
Moreover, long time-series enable to analyze the development of deferred tax balances over time.
Descriptive results reveal that, in line with the equity view of value relevance of deferred taxes,
deferred tax balances do indeed increase consistently over time, yet not proportionally to firm
growth, with about 40 percent of the observations exhibiting a decreasing ratio of deferred taxes
to total assets over time (Chapter III.4.2).
By estimating static as well as dynamic models, I find that only deferred tax balances
lagged by one and two years, respectively, are significantly related to current tax cash flow as
measured by cash taxes paid; farther lags are insignificant. Consistently, deferred taxes are only
incrementally useful in predicting future tax cash flow up to two years ahead. While the model
explains 86.53 percent of the variation in cash taxes paid, inclusion of deferred tax information
adds only negligible 0.05 to 0.37 percentage points in explanatory power (Chapter III.4.3).
Concerning the economic significance of implied deferred tax cash flow, the estimated
coefficients suggest that, on average, 2 percent of the disclosed deferred tax balance amount
translates into tax cash flow on an annual basis, which implies that deferred tax cash flow
constitutes less than 5 percent of actual tax cash flow for the majority of observations (Chapter
III.4.3). The economic significance of deferred tax cash flow is, thus, rather moderate.
Furthermore, deferred taxes are not significantly related to actual tax cash flow for 67.25
percent of the sample firms. Firms with significant deferred tax information tend to be
underperformers in terms of showing, on average, less growth (of sales, operating cash flow, and
total assets), lower ROA, and significantly less multinational activity (as measured by percent of
foreign to total pre-tax income) as compared to the total sample. Moreover, results of industry-
specific analyses suggest that deferred tax information is relatively more informative about future
tax cash flow for firms belonging to the Industrial, Financial, IT, or Telecommunication Services
sector (for Financials, particularly deferred tax asset information is useful). Yet, there are no
dominating industry effects identifiable in deferred tax cash flow (Chapter III.4.3).
Regarding forecasting performance (Chapter III.5), I find only limited evidence for
deferred tax information improving tax cash flow forecasts. For one thing, MAPE, RMSE, and
rank tests suggest that the forecast model that excludes deferred tax information outperforms the
Introduction
13 © Astrid K. Chludek
model that includes deferred tax information in terms of average forecast accuracy. For another
thing, consideration of deferred tax information does not decrease the forecast error for the
majority of forecasts. Moreover, the observed reductions in forecast error due to consideration of
deferred tax information are rather small for their most part: the observed reduction in forecast
error is smaller than 10 percent for 75 percent of the forecasts, for which consideration of
deferred tax information improves the forecast.
Thus, although the core purpose of inter-temporal tax allocation is to inform about future
tax payments and tax benefits, the overall results of the analysis presented in Chapter III rather
indicate lacking relevance of recognized deferred taxes for (future) tax cash flow. Hence, the
results of the study provide an empirical rationale for deferred taxes being not considered value-
and decision-relevant by financial statement users. Moreover, since the estimated coefficients
imply only small tax cash flow effects of deferred taxes for the majority of the sample firms, this
study provides in particular empirical support for the equity view of deferred tax value relevance,
which attributes only low present value to deferred tax cash flows.
Overall, the benefit of deferred tax balance information in terms of informing about future
tax cash flow seems to be rather low, so that the findings of this study further contribute to
questioning the usefulness of (extensive) recognition and disclosure requirements for deferred
taxes.
Chapter IV finally provides a more in-depth analysis with focus on deferred tax assets. Since the
results of the previous chapters suggest a slightly higher cash flow and value relevance of
deferred tax assets, as compared to deferred tax liabilities, Chapter IV deals with the underlying
factors that determine disclosure and recognition of deferred tax assets.
Under IFRS/IAS, deferred tax assets are only recognized to the extent that the realization
of the related tax benefit is probable, this is, to the extent that it is probable that future taxable
profit will be available against which the tax benefit can be utilized (IAS 12.24 and IAS 12.34).
Particularly concerning deferred tax assets that account for the future tax benefits of tax loss
carryforwards, IAS 12.36 specifies four criteria to be considered when assessing the probably
realizable amount: (1) reversing deferred tax liabilities, (2) expected future taxable income, (3)
the sources of the unused tax losses, and (4) available tax planning strategies. On the one hand,

Introduction
14 © Astrid K. Chludek
these four criteria provide a quite objective guideline for assessing the probably realizable
amount of tax loss carryforwards. On the other hand, management yet has still significant scope
within the range of these four criteria to determine the amount of recognized deferred tax assets.
Since, furthermore, changes in deferred tax assets generally flow through income tax expense,
thus directly affecting net income, deferred tax assets may be an attractive account to manage
earnings. Therefore, research on recognition of deferred tax assets has primarily focused on
whether discretion in recognition is used for earnings management purposes (Visvanathan 1998,
Bauman et al. 2001, Burgstahler et al. 2002, Schrand and Wong 2003, Frank and Rego 2006,
Christensen et al. 2008).
Yet, earnings management incentives are dependent on specific earnings situations (e.g.,
incentives to manage earnings upward to meet analysts’ forecasts, to avoid losses, to avoid a
decline in earnings, or incentives to manage earnings downward to take big baths, to create
cookie jar reserves, etc.), while subjectivity in recognition of deferred tax assets has to be
exercised on a regular basis, even when there are no specific earnings management incentives or
the intention to manage earnings present. The empirical analysis presented in Chapter IV of this
dissertation is the first study trying to capture the general subjective influence determining the
recognized amount of deferred tax assets, apart from situational incentives for earnings
management.
Thereby, we12 do not only analyze the determinants of recognized deferred tax assets in
more depth, but we also contribute to the stream of research investigating the variety of
underlying forces that shape the quality of the financial reporting outcome. As long as managers
can elect to use their discretion over financial reporting, the effect of accounting standards alone
may turn out to be weak relative to the effects of forces such as managerial incentives, auditor
quality, enforcement, internal and external governance structures, and other institutional features
of the economy (Holthausen 2009, Leuz and Wysocki 2008).
Set against this background, we extend possible determinants of recognized deferred tax
assets beyond the guidelines provided by the accounting standard IAS 12 and earnings
management incentives, and analyze the effects of certain corporate governance attributes, like
executive compensation schemes and ownership, to differentiate between different types of
12 Chapter IV was produced in collaboration with Duc Hung Tran, Seminar of Financial Accounting & Auditing, University of Cologne.

Introduction
15 © Astrid K. Chludek
managers and their differing incentives, which possibly systematically affect the discretion
exercised in recognition and, thus, possibly the value relevance of deferred tax assets. In addition,
we investigate the effects different auditors might have.
Based on a sample of DAX30-, MDAX-, TecDAX-, and SDAX-firms over fiscal years 2006
to 2009, we examine in a first step of the analysis the heterogeneity in disclosures of
unrecognized amounts of deferred tax assets (Chapter IV.4).13 The findings document, in
particular, inter-temporal consistency in reporting even across accounting standards. Moreover,
we can identify some auditor effects on disclosure.
The empirical results of our main analysis (Chapter IV.5) confirm that deferred tax assets
for tax loss carryforwards are generally recognized in accordance with the guidelines provided by
IAS 12.36. With respect to earnings management, we find some limited evidence that firms might
tend to recognize higher deferred tax assets for tax loss carryforwards if this helps them to meet
analysts’ EPS forecasts.
Regarding corporate governance attributes, we find that firms with large shares of the firm
held by the founding family tend to recognize c.p. a significantly lower amount of deferred tax
assets for tax loss carryforwards. Evidence on the influence of differing incentives as they are set
by diverse compensation schemes is only modest, though.14 The recognized amount of deferred
tax assets is, in particular, unaffected by equity-based compensation components (like stock
options) in the manager’s compensation package. This finding suggests that managers do
generally not assume deferred tax assets to be considered value-relevant by investors, which is in
line with the findings of Chapter II.
Regarding auditor effects for recognized amounts, we find some limited evidence that
firms audited by smaller audit firms and by Pricewaterhouse Coopers are able to recognize c.p.
higher amounts of deferred tax assets for tax loss carryforwards. Furthermore, the overall quality
of a firm’s financial statements, which we measure by using a transparency and quality score
extracted from the yearly annual report contest Deutsche Investor Relations Preis (German
13 Disclosures of unrecognized amounts of deferred tax assets are characterized by a high degree of heterogeneity under the currently effective version of IAS 12: The majority of firms disclose the amount of tax loss carryforwards for which no deferred tax asset has been recognized to meet the disclosure requirements in accordance with IAS 12.81(e), 27.52 percent of the sample firms disclose a valuation allowance, and about 50 percent of the firms (additionally) disclose the total amount of tax loss carryforwards as a voluntary disclosure. The IASB plans to make establishment and disclosure of a valuation allowance mandatory, similar to ASC 740-10 (see IASB Exposure Draft ED/2009/2, becoming effective at January 1, 2012). This amendment will enhance comparability and information content of income tax disclosures under IFRS/IAS considerably (see Chapter I.3). 14 See Jensen (2000) for the incentives set by different forms of compensation.

Introduction
16 © Astrid K. Chludek
Investor Relations Award) of the German business magazine Capital, is highly significantly
related to the recognized amount of deferred tax assets for tax loss carryforwards. To exclude
potential endogeneity problems, which might arise by use of this transparency score, we employ
a 2SLS-approach (Hail 2002), modeling in a first step a firm’s transparency choice (Chapter
IV.5.2.2).
Besides providing useful additional insights for standard setting boards and regulators that
not the accounting standard alone but other factors (such as certain corporate governance
structures) shape the outcome of the financial reporting process, we reveal in the analysis of
Chapter IV significant factors (beyond IAS 12-guidelines and earnings management incentives)
that influence the recognition decision and might cause value relevance of deferred tax assets,
potentially as correlated omitted variables.
Before turning by now to the empirical analyses of Chapters II to IV, Chapter I summarizes the
key features of deferred tax accounting. Thereby, the chapter is not intended to provide a full
picture of all deferred tax accounting rules. Instead, it shall expose the concept of deferred tax
accounting and the most important accounting rules, to the extent that these are addressed in the
subsequently following research analyses, to readers that are largely unfamiliar with deferred
taxes, in order to enhance understanding and comprehension of the research questions, problems,
and contributions presented in the subsequent chapters.
Besides providing the key features of deferred tax accounting under IFRS (IAS 12 –
Income Taxes) in Section 1 of Chapter I, Section 2 concisely depicts the main differences of
deferred tax accounting under US GAAP (ASC 740-10, formerly SFAS No. 109) as compared to
the relevant accounting rules under IFRS/IAS. Section 3 of Chapter I finally deals with one point
of the next step in the convergence project between IFRS/IAS and US GAAP: the proposed
change from the single-step approach to the two-step approach of deferred tax asset recognition
under IFRS/IAS.

17 © Astrid K. Chludek
CHAPTER I
Accounting for Deferred Taxes

18 © Astrid K. Chludek
1. Accounting for Deferred Taxes under IFRS/IAS (IAS 12)
Deferred taxes are a construct of financial reporting. The purpose of deferred tax accounting is to
account for future tax effects that will arise due to different recognition and measurement
principles of accounting standards versus tax law. Thus, deferred taxes represent future tax
consequences of items and business transactions that have been recognized differently in the
financial statement than in the tax report. Specifically, deferred taxes reflect the taxes that would
be payable or receivable if the entity’s assets and liabilities were recovered / settled at their
present carrying amount.
Deferred tax accounting is an outcome of the matching principle, aiming at recognizing
the tax consequences of an item reported within the financial statements in the same accounting
period as the item itself. Thereby, total tax expense reflects the tax expenses / tax benefits that are
attributable to pre-tax book income but that are not reflected in current tax expense of the period.
Recognition and Measurement:
IFRS/IAS and US GAAP follow the liability method of deferred tax accounting. Thereby,
deferred tax liabilities (deferred tax assets) account for the amounts of income taxes payable
(recoverable) in future periods that arise from temporary book-tax differences, i.e., differences
between the book value of an asset or a liability and its tax base that will result in taxable (tax
deductible) amounts when the book value of the asset / liability is recovered / settled.15
Recognition of and changes in deferred taxes generally affect book income through deferred tax
expense. Yet, (changes in) deferred taxes are recognized directly in equity, i.e., are income-
neutral, if the underlying transaction or event, which causes the book-tax difference, is
recognized outside profit or loss (IAS 12.58).
Deferred tax liabilities arise generally from financially recorded income that has not yet
been taxed, for example in the case of accelerated tax depreciation, where taxable income is
deferred into the future (as compared to book income) by tax depreciation rates that exceed book
depreciation rates. Conversely, deferred tax assets arise generally as a result of earlier expensing
for financial accounting than for tax purposes. Thereby, deferred tax components can reflect
15 As an exception, IAS 12.15 and IAS 12.24 explicitly prohibit the recognition of deferred taxes arising from temporary differences due to the initial recognition of goodwill and in certain cases of business combinations.

I – Accounting for Deferred Taxes
19 © Astrid K. Chludek
book-tax differences that arise automatically due to differences in tax law versus accounting
principles, as well as book-tax differences that inform about choices made for book purposes.
Deferred tax assets arising from book-tax differences in pension provisions, for example, imply
that firms usually use a lower discount rate in the calculation of the pension provision for book
purposes than for tax purposes. For instance, Stadler (2010) reports that the average (median)
pension discount rate used in consolidated financial statements of German firms is 5.24 (5.50)
percent, whereas German tax law requires a fixed discount rate of 6 percent (§ 6a (3) EStG). In
contrast, temporary book-tax differences in provisions reflect fixed differences in tax law versus
accounting principles, since provisions are recognized under IFRS/IAS (IAS 37.10) for liabilities
of uncertain timing or amount, whereas these liabilities are generally not relevant for tax purposes
until payable amounts are actually fixed. Book-tax differences in current assets, as another
example, may give rise to either deferred tax assets or deferred tax liabilities (for example,
inventory may be written down for book purposes but not for tax purposes, resulting in a deferred
tax asset; valuation of inventory according to FIFO for book purposes versus average value for
tax purposes may give rise to either a deferred tax asset or a deferred tax liability). These
examples illustrate that main parts of deferred taxes are generally due to recurring operating
activities.
Beside deductible temporary differences, deferred tax assets also have to be recognized
for unused tax loss carryforwards and unused tax credit carryforwards (IAS 12.34). Thereby,
deferred tax assets are only allowed to be recognized to the extent that the realization of the
related tax benefits is “probable”, i.e., to the extent that it is probable that taxable profit will be
available against which the deductible temporary difference, the unused tax losses and tax credits
can be utilized (IAS 12.24 and IAS 12.34). The key criterion is a probability threshold of at least
50 percent likelihood of realization.16 Yet, since the existence of unused tax losses and tax
credits, as well as a recent history of losses might indicate that future taxable profit may not be
available (IAS 12.35), IAS 12.36 offers additional guidelines concerning the recognition of
deferred tax assets for tax loss and tax credit carryforwards. According to IAS 12.36, an entity
should in particular consider (1) the availability of reversing deferred tax liabilities, (2) expected
16 Since there was disagreement among preparers on the exact meaning of “probable”, the IASB clarified in 2003 a probability threshold of 50 percent („The Board agreed that the threshold for recognition should be ‘more likely than
not’. IAS 12 should be amended to clarify that, consistent with FAS 109, ‘probable’ means ‘more likely than not’ for
the purposes of this Standard.“, Board Decisions on International Accounting Standards – IASB Update April 2003, p.3).

I – Accounting for Deferred Taxes
20 © Astrid K. Chludek
future taxable income, (3) the sources of the unused tax losses, and (4) available tax planning
strategies when assessing the probably utilizable share of unused tax losses and tax credits.
Since deferred taxes shall represent future tax effects, they shall be measured at the tax
rates that are expected to apply when the underlying asset / liability is realized / settled. Yet, since
future tax rates are not known, current tax rates are applied for measurement, i.e., “tax rates (and
tax laws) that have been enacted or substantively enacted by the end of the reporting period”
(IAS 12.47).17
The following example shall illustrate procedure and idea behind deferred tax
accounting.18 We assume that a firm owns an asset, which had a purchase price of 150€, with a
carrying amount of 100€. Since the cumulative deprecation for tax purposes is 90€, the tax base
of the asset is 60€ (150€ - 90€). The applicable tax rate is 25%, so that the firm recognizes a
deferred tax liability of 10€ ((100€ - 60€)*0.25). The rationale behind this deferred tax liability is
that if the firm recovers the carrying amount of the asset (for example, by sale of the asset), it
earns taxable income of 100€. With a tax base of 60€, this would result in a taxable profit of 40€,
i.e., a tax liability of 10€ (40€*0.25) that would be payable at the time of recovery of the asset’s
carrying amount. As long as the firm will continuously replace the asset, to keep its operating
capacity constant at a carrying amount of 100€, the firm will have an unchanging deferred tax
liability of 10€.
Disclosure and Presentation in Financial Statements:
Deferred tax assets and deferred tax liabilities are classified as non-current assets and liabilities,
respectively, on the balance sheet (IAS 1.56). Moreover, deferred tax assets and deferred tax
liabilities are only offset if “the entity has a legally enforceable right to set off current tax assets
against current tax liabilities” and to the extent that the deferred taxes relate to the same taxation
authority and the same taxable entity (or different taxable entities that intend a simultaneous
clearing of the relevant positions) (IAS 12.74). Discounting deferred taxes is prohibited (IAS
12.53).
17 In the case of a change in applicable tax rates, deferred taxes are adjusted and re-measured at the new tax rates. To the extent that the recognition of the deferred taxes was included in net income, the adjustments flow through income, too. 18 The example is taken from IAS 12.16.

I – Accounting for Deferred Taxes
21 © Astrid K. Chludek
Concerning unrecognized amounts of deferred tax assets, i.e., the share of deferred tax
assets that has an expected realization probability of less than 50 percent, IAS 12.81(e) specifies
to disclose “the amount (and expiry date, if any) of deductible temporary differences, unused tax
losses, and unused tax credits for which no deferred tax asset is recognised in the statement of
financial position.”

I – Accounting for Deferred Taxes
22 © Astrid K. Chludek
2. Accounting for Deferred Taxes under US GAAP (ASC 740-10, formerly SFAS No.
109)
The key features of deferred tax accounting are very similar under IFRS/IAS (IAS 12) and under
US GAAP (ASC 740-10, formerly SFAS No. 109). However, the standards include different
exceptions to the temporary difference approach. Furthermore, differences between the standards
concern the recognition and measurement of deferred taxes, as well as the allocation of deferred
taxes to the components of comprehensive income and equity. Specifically, main differences
concern
• the classification of deferred taxes,19
• the area of application of the exemption of deferred tax recognition for permanently
reinvested earnings,20
• backwards tracing,21
• the recognition of deferred taxes on initial differences if both, taxable income and book
income are not affected,22
• guidelines with respect to determination of the probably realizable amount of deferred tax
assets,23, 24
• the approach to determine the recognized amount of deferred tax assets and related
disclosures:
US GAAP require a two-step approach for the recognition of deferred tax assets, whereas
IFRS/IAS take a single-step approach. According to ASC 740-10-30-5 (formerly SFAS No. 109,
para. 17), deferred tax assets are established under US GAAP, in a first step, for all deductible
19 While deferred taxes are classified into current and non-current components under US GAAP (ASC 740-10-45-4), all deferred taxes are classified as non-current under IFRS/IAS (IAS 1.56). 20 While IFRS/IAS allow to omit recognition of a deferred tax liability for undistributed earnings of foreign and domestic subsidiaries as long as these earnings are declared to be permanently reinvested (IAS 12.40), US GAAP allow this recognition exemption only in the case of foreign subsidiaries (ASC 740-10-55-209 and APB 23). 21 While IFRS/IAS require backwards tracing, US GAAP prohibit backwards tracing, i.e., while the effect of changes in deferred taxes that have originally been recognized outside continuing operations also has to be recognized outside continuing operations under IAS, US GAAP require that the effects of subsequent changes in recognized deferred taxes are always allocated to continuing operations (see, for example, ASC 740-10-45-15 versus IAS 12.60). 22 IAS 12.33 and ASC 740-10-50-20 (SFAS No. 109, para. 11). 23 See, for instance, ASC 740-10-30-17 to 30-25 versus IAS 12.30 and 12.36. 24 Other differences relate to the areas of subsequent recognition of a deferred tax asset after a business combination, the calculation of tax benefits related to share-based payments, measurement of deferred taxes on undistributed earnings of a subsidiary, and specific exemptions from the temporary approach under US GAAP, that do not exist under IFRS/IAS (for example, concerning temporary differences arising from leveraged leases, intra-group inventories, changes in exchange rates).

I – Accounting for Deferred Taxes
23 © Astrid K. Chludek
temporary differences, operating loss and tax credit carryforwards. In a second step, a valuation
allowance is established against this account, subsuming the portion of deferred tax assets that is
not more likely than not to be realized, i.e., that is not likely to be realized with a probability of at
least 50 percent. Moreover, US GAAP require to disclose the recognized amount of deferred tax
assets, the valuation allowance (subsuming the unrecognized amount of deferred tax assets), and
the total amount of operating loss and tax credit carryforwards (ASC 740-10-50-2 and 50-3). By
contrast, IAS 12 only requires to disclose directly the probably realizable amount of deferred tax
assets, in a single step (IAS 12.24 and 12.34). Thus, IAS 12 does not require to disclose the
unrecognized amount of deferred tax assets. Neither is a disclosure of the total amount of tax loss
carryforwards required.
The next section of this chapter will compare both recognition approaches, single-step and
two-step approach, in more detail.
I – Accounting for Deferred Taxes
24 © Astrid K. Chludek
3. Single-Step Approach versus Two-Step Approach of Deferred Tax Asset
Recognition
The IASB proposes currently in its Amendment to IAS 12 – Exposure Draft ED/2009/2 – to
adopt US GAAP’s two-step approach for the recognition of deferred tax assets. This is, the
existing single-step recognition of the portion of deferred tax assets for which realization is
probable (probability threshold of at least 50 percent) shall be replaced by a two-step approach,
where deferred tax assets are recognized in full in a first step and are reduced in a second step, by
establishment of a valuation allowance against the full account, to “the highest amount that is
more likely than not to be realizable against taxable profit” (ED/2009/2.5 and 2.23).
The proposed change will considerably increase comparability and informativeness of
disclosed deferred taxes. For one thing, the disaggregated presentation of the total amount of
possible deferred tax assets into the probably realizable share of deferred tax assets and the
valuation allowance (i.e., the share of deferred tax assets for which the probability of realization
is less than 50 percent) increases transparency. The information provided will be enhanced, so
that users of financial statements will obtain a more transparent picture of the underlying
economics, as compared to the current net presentation of deferred tax assets. In particular,
financial statement users will get more transparent information about a) the overall situation of
the firm (future performance expectations, etc.) and b) how the recognized deferred tax asset
amount has been determined. Latter should encourage preparers to be more careful and precise in
calculating the recognized amount of deferred tax assets.25
For another thing (and most notably), the new approach will substantially increase the
comparability of the disclosures with respect to unrecognized deferred tax benefits and, hence,
improve the informativeness of the disclosures. Regarding unrecognized amounts, the current
version of IAS 12 only requires to disclose the unrecognized amounts of deductible temporary
differences, unused tax loss and tax credit carryforwards (IAS 12.81(e)), i.e., the amounts that
will be deductible from taxable income, whereas disclosed recognized amounts reflect tax
benefits, i.e., the deductible temporary differences and carryforwards after multiplication with the
applicable tax rates, so that, first, it is difficult for financial statement users to relate recognized to
25 Yet, a higher visibility of unrecognized amounts could also have the opposite effect. Since an increasing valuation allowance implies rather negative future performance expectations, it might be valued negatively by financial statement users (Kumar and Visvanathan 2003). This might result in firms being more reluctant to decrease the amount of recognized deferred tax assets to the actually probably realizable amount.

I – Accounting for Deferred Taxes
25 © Astrid K. Chludek
unrecognized amounts, in order to achieve a percentage of probably realizable tax benefits, since
both amounts are disclosed in different units. Second, current IAS 12-disclosures regarding
unrecognized amounts show a high degree of heterogeneity: While most firms disclose only the
amount of tax loss carryforwards for which no deferred tax asset is recognized, others already
disclose a valuation allowance, whereas few other firms only disclose the total amount of their
unused tax loss carryforwards, so that a comparison of unrecognized amounts across firms is
difficult.26 Mandatory recognition and disclosure of a valuation allowance would eliminate this
heterogeneity and substantially facilitate assessment of a firm’s capability to utilize its potential
tax benefits.
The following examples illustrate the advantages of the two-step approach as compared to
the single-step approach.
Scenario 1:
We focus on two firms, A and B. Both firms have unused tax loss carryforwards of €100m. The
tax loss carryforwards of firm A are assigned to the domestic parent company (applicable tax rate
of 30%), while the tax loss carryforwards of firm B are assigned to its foreign subsidiary
(applicable tax rate of 12%). Based on its medium-term business planning and tax planning, firm
A estimates that €40m of its tax loss carryforwards are probable to be realized, while firm B
assesses that €60m of its tax loss carryforwards are probable to be realized. Besides, both firms
have no other deductible temporary differences, which could give rise to a deferred tax asset.
In accordance with the current IAS 12, firm A would recognize a deferred tax asset of
€12m (€40m * 30%) and additionally disclose unrecognized tax loss carryforwards of €60m (see
Table I.1). Firm B would disclose a deferred tax asset of €7.2m (€60m * 12%) and unrecognized
tax loss carryforwards of €40m. The question, which arises now, is: What do these disclosures
tell us about the relative capability of both firms to use their potential tax benefits and about their
respective future firm performance prospects (to the extent that these are reflected in the
recognition ratio of deferred tax assets; see Gordon and Joos 2003, Legoria and Sellers 2005,
Herbohn et al. 2010)?
26 See Chapter IV of this dissertation for an empirical analysis of the heterogeneity in IAS 12-dislcosures.

© Astrid K. Chludek
Table I.1 – Scenarios 1 and 2
Scenario 1 Scenario 2
Firm A Firm B Firm A Firm B
unused tax loss
carryforwards
total 100 100 100 100
realization
probability < 50% 60 40 40 40
applicable tax rate 30% 12% 30% 12%
disclosures acc. to
IAS 12
recognized deferred
tax assets 12 7,2 18 7,2
unrecognized tax loss
carryforwards 60 40 40 40
disclosures acc. to
ED/2009/2
gross deferred tax
assets 30 12 30 12
valuation allowance 18 4,8 12 4,8
recognized deferred
tax assets 12 7,2 18 7,2
realization ratio 2:3 3:2 3:2 3:2
The realization ratio displays the ratio of deferred tax assets that are expected to be realizable with a probability of at least 50 percent to deferred tax assets that have an expected realization probability of less than 50 percent.
26
I – A
ccountin
g fo
r Deferred
Tax
es

I – Accounting for Deferred Taxes
27 © Astrid K. Chludek
The amount of tax loss carryforwards for which no deferred tax asset is recognized is
indeed higher for firm A (€60m for firm A versus €40m for firm B). Yet, firm A also shows
higher recognized deferred tax assets (€12m for firm A versus €7.2m for firm B). If we relate
recognized deferred tax assets to disclosed unrecognized amounts (thereby implicitly assuming a
single applicable tax rate within the corporate group), we get that firm A even shows a higher tax
benefit realization-coefficient (€12m/€60m = 0.2) than firm B (€7.2m/€40m = 0.18), although
firm A assesses a lower amount of its future tax benefits to be probably realizable (40 percent
(firm A) versus 60 percent (firm B)). These difficulties in comparison arise due the fact that
recognized and unrecognized amounts are disclosed in different units – after and before,
respectively, applicable tax rates. It is nearly impossible, however, for financial statement users to
determine the tax rate effects on unrecognized amounts. This is because, for one thing, only the
range of applicable tax rates is generally disclosed. For another thing, the firm’s effective tax rate
may also be little informative, depending on the tax rates applicable to the main operating
activities of the firm.
Recognition and disclosure of a valuation allowance, by contrast, enables to directly relate
recognized to unrecognized amounts of tax benefits, obtaining a realization ratio. In the example,
firm A would additionally disclose a valuation allowance of €18m (€60m * 30%) and firm B
would disclose a valuation allowance of €4.8m (€40m * 12%) (see Table I.1). If we relate
deferred tax assets to the valuation allowance amount, the disclosures directly reveal that firm A
expects (with a probability of at least 50 percent) to realize only 40 percent (12/(12 + 18)) of its
potential tax benefits, while firm B expects to be able to realize 60 percent (4.8/(4.8 + 7.2)) of its
potential tax benefits.27 To put it differently, we get an expected realization rate of 2:3 for firm A,
while firm B shows a realization rate of 3:2. Thus, the disclosures clearly reveal that firm B is in
a relatively better position, expecting to realize a larger percentage of its potential tax benefits
(with a probability of at least 50 percent) than firm A. Hence, the two-step approach improves the
comparability and, hence, informativeness of deferred tax disclosures substantially.
27 We also get these percentages if we relate the unrecognized amount of tax loss carryforwards to the total amount of tax loss carryforwards. However, firms generally do not disclose both items (see Chapter IV). Moreover, such calculation does not take into account amounts of recognized and unrecognized deferred tax assets arising from deductible temporary differences.

I – Accounting for Deferred Taxes
28 © Astrid K. Chludek
Scenario 2:
Future performance expectations for firm A improve, so that firm A increases the amount of
probably utilizable tax losses to €60m. While firm A shows a larger deferred tax assets balance
than firm B because of its higher applicable tax rate, disclosures according to ED/2009/2 reveal
that both firms have the same realization ratio of tax benefits (see Table I.1).
Scenarios 3, 4, and 5:
Now, firm B’s foreign subsidiary records only tax loss carryforwards of €60m, while the
domestic parent company records the other €40m of tax loss carryforwards. Besides, still €40m
of firm B’s total tax loss carryforwards do not meet the recognition threshold of 50 percent
probability. These €40m of probably non-realizable tax losses are recorded at the parent company
(Scenario 3), €20m at the parent company and €20m at the foreign subsidiary (Scenario 4), at the
foreign subsidiary (Scenario 5). In all three scenarios, firms A and B show the same amount of
unrecognized tax loss carryforwards: €40m (see Table I.2). The amount of recognized deferred
tax assets, however, varies for firm B between €7.2m and €14.4m, according to different
applicable tax rates. The two-step approach enables to compute realization ratios, which
significantly facilitate comparison of the tax benefit realization potential of the firms across the
scenarios, revealing that firm B shows in Scenario 5) the best ratio of probably realizable to
probably foregone tax benefits by allocating non-utilizable tax loss carryforwards in low-tax
countries (see Table I.2).
Inter-Temporal Comparison:
Besides improving inter-firm comparison, the two-step approach also facilitates analysis of inter-
temporal development. For example, a firm has unused tax loss carryforwards of €100m in
Period 1 and estimates €60m of these to be probably utilizable. Assuming a tax rate of 30%, this
results in a recognized deferred tax asset of €18m in Period 1 (see Table I.3). The firm accrues
additional €50m of tax losses in Period 2. Based on its medium-term business and tax planning,
the firm still expects a ratio of 60 percent of its total tax losses to be utilizable, so that additional
deferred tax assets of €9m ((€50m * 60%)*30%) are recognized in Period 2, resulting in total

© Astrid K. Chludek
Table I.2 – Scenarios 3, 4, and 5
Scenario 3 Scenario 4 Scenario 5 Firm A Firm B Firm B Firm B
unused tax loss
carryforwards
total domestic 100 40 40 40
foreign 0 60 60 60
realization
probability < 50% domestic 40 40 20 0
foreign 0 0 20 40
applicable tax rate domestic 30% 30% 30% 30%
foreign 12% 12% 12% 12%
disclosures acc. to
IAS 12
recognized deferred tax assets 18 7,2 10,8 14,4
unrecognized tax loss carryforwards 40 40 40 40
disclosures acc. to
ED/2009/2
gross deferred tax assets 30 19,2 19,2 19,2
valuation allowance 12 12 8,4 4,8
recognized deferred tax assets 18 7,2 10,8 14,4
realization ratio 1,5:1 0,6:1 1,29:1 3:1
The realization ratio displays the ratio of deferred tax assets that are expected to be realizable with a probability of at least 50 percent to deferred tax assets that have an expected realization probability of less than 50 percent.
29
I – A
ccountin
g fo
r Deferred
Tax
es

I – Accounting for Deferred Taxes
30 © Astrid K. Chludek
Table I.3 – Inter-Temporal
Period 1 Period 2
unused tax loss
carryforwards
total 100 150
realization probability < 50%
40 60
applicable tax rate 30% 30%
disclosures acc. to
IAS 12
recognized deferred
tax assets 18 27
unrecognized tax loss
carryforwards 40 60
disclosures acc. to
ED/2009/2
gross deferred tax
assets 30 45
valuation allowance 12 18
recognized deferred
tax assets 18 27
realization ratio 3:2 3:2
The realization ratio displays the ratio of deferred tax assets that are expected to be realizable with a probability of at least 50 percent to deferred tax assets that have an expected realization probability of less than 50 percent.
deferred tax assets of €27m. Moreover, tax loss carryforwards, for which no deferred tax
assets are recognized, of €60m are disclosed in Period 2 in accordance with IAS 12.
According to ED/2009/2, by contrast, the firm would disclose a deferred tax asset of
€18m and a valuation allowance of €12m in Period 1, and a deferred tax asset of €27m and a
valuation allowance of €18m in Period 2 (see Table I.3). Relating deferred tax assets to the
valuation allowance reveals to financial statement users at first glance that the ratio of
recognized to unrecognized tax benefits has not changed from Period 1 to Period 2. This is not
determinable based on current IAS 12-disclosures.
Hence, the two-step approach of deferred tax asset recognition results in enhanced
transparency, comparability, and informativeness as compared to the single-step approach.
Recognition of a valuation allowance requires determination and application of relevant tax
rates to unrecognized amounts, which might cause additional costs for firms, however.

31
CHAPTER II
Perceived versus Actual Cash Flow Implications
of Deferred Taxes
- An Analysis of Value Relevance and Reversal
under IFRS
This paper provides the first value relevance analysis of deferred tax disclosures under IFRS/IAS. The comprehensive analysis, taking into account the different deferred tax components, shows that investors generally do not consider deferred taxes to convey
relevant information for assessing firm value, with the exception being large net deferred tax assets. In order to examine whether the general value irrelevance of deferred tax
information may be due to lacking cash flow implications, the value relevance analysis is complemented by an analysis of deferred tax balance reversal. This supplemental analysis reveals that about 70 percent of the deferred tax balance persists over time, with increasing
accounts dominating decreasing accounts over a four-year horizon, and that deferred tax assets are more reversing than deferred tax liabilities. Further, quantifications reveal that
the majority of balance reversals have rather negligible cash flow implications.

32
The following article
Perceived versus Actual Cash Flow Implications of Deferred Taxes
- An Analysis of Value Relevance and Reversal under IFRS
by Astrid K. Chludek
is published in the Journal of International Accounting Research, Vol. 10 (1), 2011, pp. 1-25.
The copyright of this article belongs to the American Accounting Association.
The author thanks the American Accounting Association for granting permission to reprint the
article in her dissertation.

33 © American Accounting Association
1. Introduction
Since the 1980s, disclosure requirements for deferred taxes have been enhanced considerably
in U.S. GAAP, IFRS/IAS, and in national accounting standards. The most recent instance is
the reform of national accounting law in Germany (BilMoG, generally applicable for fiscal
years beginning after December 31, 2009), which materially increases recognition, disclosure,
and documentation requirements for deferred taxes of medium-sized and large corporations.
Meanwhile, the overall usefulness of deferred tax accounting is on debate continuously.
Critics argue that the informative value of deferred taxes is only low due to highly uncertain
cash flow implications, which results in most financial statement users ignoring deferred tax
disclosures, since these are not considered to provide relevant information for decision
making.28
The reported lack of consideration of disclosed deferred tax information is opposed to
rather high accounting costs that arise due to the fact that accounting for deferred taxes is
quite complex and requires a high level of coordination. It is necessary, for instance, to
prepare the tax report within a narrow time frame and to assess the future realizability of
deferred tax assets. The latter includes estimating future taxable income, as well as assessing
the reversal of taxable temporary differences. Accordingly, accountants name deferred tax
allocation as one of the most complex and costly provisions with which to comply, so that
there is an ongoing controversy about whether there is any (adequate) benefit that could
justify the rather high accounting costs involved.29
This paper contributes to the cost-benefit controversy in two ways. In the first place, I
investigate the use of under-IFRS disclosed deferred tax information by the primary
consolidated financial statement addressees – equity investors. Specifically, I analyze whether
deferred taxes, representing part of future tax cash flow, are considered relevant for assessing
firm value. In the second place, I complement the value relevance analysis by an analysis of
deferred tax balance reversal by this quantifying deferred tax cash flow.
The analyses are based on a unique set of German firm data for two reasons. First, to
the best of my knowledge, this is the first study explicitly analyzing the value relevance of
disclosed deferred tax information on IFRS-based data. Yet, the relevance and information
28 See the Communication from the Commission of the European Communities (2007) and Beechy (2007) for anecdotal evidence, and Amir and Sougiannis (1999), Chattopadhyay et al. (1997), Chen and Schoderbek (2000), and Haller et al. (2008) for empirical evidence. Alternatively, deferred tax information may be ignored because
of lacking knowledge about and understanding of deferred tax accounting (see Carnahan and Novack 2002). 29 See Cheung et al. (1997), the Communication from the Commission of the European Communities (2007), as
well as survey evidence of Eierle et al. (2007).

II – Value Relevance of Deferred Taxes
34 © American Accounting Association
content of deferred tax disclosures under IFRS is of common international interest. Since
recognition and disclosure requirements are typically much more extensive under IFRS than
under national accounting standards, convergence to and adoption of IFRS are likely to cause
material additional costs for firms with respect to deferred tax accounting. Second, the major
studies in this field cover similar data by analyzing U.S. data of the middle of the 1990s. It is
important to cover other data sources and time horizons in order to be able to draw general
conclusions, in particular given the divergent and inconclusive results of these prior studies.
Using fixed effects estimation with Huber-White robust standard errors clustered at
firm level, by this means not only adjusting standard error estimation for potential serial
correlation, but also mitigating correlated omitted variable bias in the estimated coefficients
by controlling for unobserved heterogeneity, I find that investors do not include deferred taxes
into their valuation of the firm, i.e., deferred taxes are generally not systematically related to a
firm’s market value, with the exception being large net deferred tax assets. The results are
robust to different estimation methods and model specifications; they are neither industry-
specific nor do I find material evidence for the composition of deferred taxes being
considered relevant. These findings suggest that investors perceive the cash flows deferred
taxes account for as highly uncertain and do not expect them to be substantially realized in the
near future.
The analysis of value relevance is complemented by an analysis of deferred tax
balance reversal in order to examine whether perceived lacking cash flow implications
coincide with actual lacking reversal. To the best of my knowledge, the only other study
analyzing deferred tax reversal is a study conducted by Price Waterhouse in 1967, so that
empirical evidence on reversal behavior is not only rare, but also outdated. Yet, information
on the reversal behavior of deferred tax balances is of crucial interest in the context of cost-
benefit considerations, since lacking reversals imply a present value of deferred tax cash flow
of zero, thus challenging the informativeness of deferred tax allocation. The results suggest
that in the short run, deferred tax balances oscillate as a consequence of normal variation in
the firm’s operating activities, whereas increasing accounts dominate decreasing accounts in
the medium term. Furthermore, I find that deferred tax assets show a higher rate of balance
reversal than deferred tax liabilities, suggesting that deferred tax assets tend to translate more
timely into cash flow than deferred tax liabilities.
Additionally, this study provides an estimation of deferred tax cash flow as it is
implied by balance reversal. Quantifications assessing the economic significance of deferred
tax cash flow have been lacking so far. The quantifications reveal that despite the distributions

II – Value Relevance of Deferred Taxes
35 © American Accounting Association
showing a considerable rate of balance reversal, average cash flow implications of these
reversals are only small. Overall, the results of the value relevance analysis are broadly
consistent with the balances’ reversal structure and cash flow implications.
The proceeding of this chapter is organized as follows: Section 2 covers theories
regarding the value relevance of deferred taxes and reviews related research. Section 3
describes data and sample selection, the regression model and estimation method, and
discusses the results of the value relevance analysis. The analysis of balance reversal and
quantifications of implied deferred tax cash flow are presented in Section 4. Robustness tests
and results of supplemental analysis are reported in Section 5. Finally, Section 6 concludes.

II – Value Relevance of Deferred Taxes
36 © American Accounting Association
2. The Value Relevance of Deferred Taxes: Theories and Literature Review
There are two opposed theories with respect to the value relevance of deferred taxes: liability
view versus equity view. While proponents of the liability view argue that deferred tax
liabilities (deferred tax assets) account for future tax liabilities (future tax benefits) and should
therefore contribute negatively (positively) to firm value, proponents of the equity view
reason that associated cash flows are highly uncertain, with a present value close to zero, and
deferred taxes should therefore be of no value relevance.
IFRS and US GAAP follow the liability view by classifying deferred tax liabilities
(deferred tax assets) as liabilities (assets).30 According to IAS 12.5, deferred tax liabilities
(deferred tax assets) account for the amounts of income taxes payable (recoverable) in future
periods that arise from temporary book-tax differences, i.e., differences between the book
value of an asset or a liability and its tax base that will result in taxable (tax deductible)
amounts when the book value of the liability (asset) is settled (recovered).31 Deferred tax
liabilities arise, for example, from accelerated tax depreciation or from financially recorded
income that has not yet been taxed. Deferred tax assets are recognized for the probably
realizable tax benefits of tax loss carryforwards and arise, for example, from provisions for
warranty costs or bad debts, which are already expensed for book purposes, but which are not
tax deductible until the provision is utilized.
Critics of the liability view argue that, for one thing, the major part of deferred taxes is
not expected to be realized in the near future as a consequence of arising from operating, and
therefore periodically recurring, activities, so that single reversing temporary differences are
offset by newly created temporary differences in the same fiscal year, in sum deferring the
reversal of the aggregate temporary differences and the associated tax cash flow indefinitely.
For another thing, uncertainty does not only exist concerning the timing of the associated tax
cash flow, but also concerning the realizability of implied tax payments and tax benefits, since
realization of these cash flows depends on the firm’s development and future operations.32
Particularly, if large parts of temporary differences reverse due to ceasing recurring operating
30 Deferred tax accounting is very similar under IFRS/IAS (IAS 12) and under US GAAP (SFAS No. 109). Differences concern, for instance, reporting requirements like the disclosure of the valuation allowance and the extent to which deferred taxes are allowed to be included in other positions on the balance sheet. 31 Deferred tax accounting is an outcome of the matching principle, aiming at recognizing the tax consequences of an item reported within the financial statements in the same accounting period as the item itself. 32 This applies primarily to deferred tax liabilities, since deferred tax assets are only recognized to the extent that their associated benefits are “probable” (IAS 12.24, 12.27) to be realized. Yet, “probable” amounts can only be estimates, therefore containing uncertainty per definitionem. Besides, firms have an incentive to defer a downwards adjustment of their deferred tax assets in case of decreasing realization probability because such an adjustment would result in income-decreasing deferred tax expense and might be interpreted as a negative private signal concerning future firm performance.

II – Value Relevance of Deferred Taxes
37 © American Accounting Association
activities, the firm will most likely be in severe financial difficulties, with the consequence
that accruing tax benefits (tax liabilities) cannot be used (paid) because of lacking taxable
income (cash inflow), such that deferred tax cash flow will not be realized even in case of
reversing temporary differences. For these reasons, proponents of the equity view argue that
deferred taxes account principally for distant and – in several dimensions – uncertain cash
flows, being of no or only little relevance for the amount of tax payments in the next years,
the associated cash flows having a present value that is close to zero. Therefore, deferred
taxes are effectively part of equity according to this view.
Empirical evidence on whether financial statement users take deferred tax information
into account is rather inconclusive. Using similar data,33 Amir et al. (1997) and Ayers (1998)
provide evidence consistent with the liability view and the market discounting deferred tax
components according to their expected time and likelihood of reversal, while Chang et al.
(2009), using Australian data, find only deferred tax assets to be value relevant. By contrast,
Chandra and Ro (1997) provide evidence consistent with the equity view by showing that
deferred taxes and stock risk are related negatively. Chen and Schoderbek (2000) report that
deferred tax adjustments as a consequence of a change in the corporate tax rate were reflected
in share prices at the same rate as recurring earnings, despite their different implications for
future cash flows.34 Apparently, investors did not expect the income effects due to tax rate
change-induced deferred tax adjustments, which suggests either that investors are not familiar
with deferred tax accounting rules, the concept of deferred taxes, or that they ignore deferred
taxes altogether.35 Consistent with the latter, Lev and Nissim (2004) find no significant
relation between deferred tax expense and annual returns, which suggests that investors do not
consider deferred taxes to be relevant.
Regarding other financial statement users, Amir and Sougiannis (1999) and Chen and
Schoderbek (2000) report empirical evidence of financial analysts not including deferred tax
information in their earnings forecasts. Likewise, several empirical studies report that deferred
33 Amir et al. (1997) use data of Fortune 500 companies, years 1992 to 1994, and Ayers (1998) uses data of NYSE and AMEX firms, years 1992 and 1993. 34 Deferred taxes are calculated by multiplying the temporary difference (the difference between book value and tax base) with the tax rate that is expected to apply at the time of its reversal. Since future tax rates are not known, current tax rates are used with the consequence that deferred tax balances have to be adjusted as soon as changes in income tax rates are enacted (IAS 12.47–49 and SFAS No. 109, para. 27). To the extent that the recognition of these deferred taxes was included in net income, the adjustments flow through income, too. 35 Amir et al. (1997), as well as Weber (2009), suggest that lacking consideration of disclosed (deferred) tax information may be due to its complexity. In line with Plumlee’s (2003) finding of market participants being less likely to incorporate complex information due to either inability or cost-benefit considerations, Chen and Schoderbek (2000) attribute their finding to investors possibly rationally deciding to not become informed of specific accounting rules based on cost-benefit considerations and/or considering estimation of the tax adjustments not cost-beneficial.

II – Value Relevance of Deferred Taxes
38 © American Accounting Association
taxes are not reflected in bond ratings (see Huss and Zhao 1991, Chattopadhyay et al. 1997).
In line, a German survey study by Haller et al. (2008) reports that the vast majority of their
interviewees (59 employees of 32 credit institutions, who work in the area of credit analysis
and scoring of medium-sized enterprises) declared to add deferred tax assets back to equity
because of doubtful value.36
Reviewing the literature reveals that empirical evidence concerning the use and
interpretation of disclosed deferred tax information is rather inconclusive. While some studies
focusing on investors find evidence supportive of the liability view, others do not. Moreover,
some of these studies have econometric issues, not properly controlling for serial correlation
and possible correlated omitted variable bias, as indicated by unexpectedly high deferred tax
coefficients. Furthermore, these studies are largely based on similar data, such that significant
findings might be driven by observations of the implementation year of SFAS No. 109,
1992.37 Studies examining the use of deferred tax information by other financial statement
users – lenders, bond raters, and financial analysts – suggest that those typically ignore
deferred taxes in their decision-making process and eventually reverse out the inter-period tax
allocation by adding deferred taxes back to equity and earnings, respectively.
36 See also Chaney and Jeter (1989), Carnahan and Novack (2002), and Beechy (2007), who report anecdotal evidence suggesting that banks and other lenders, as well as credit and financial analysts, routinely reverse out the impact of inter-period tax allocation, adding deferred tax expense back to net income and treating deferred tax balances as equity. 37 Besides, many companies include under U.S. GAAP at least part of their deferred taxes in other balance sheet positions like other (current) assets, other (current) liabilities, accrued liabilities, or even in income taxes
payable. If investors do not check the notes for deferred tax information, deferred taxes might be included automatically in firm value, although they are not deliberately considered by investors as future tax benefits and payments, respectively. Using IFRS/IAS data avoids this problem, since IAS require deferred taxes to be reported as separate positions on the balance sheet.

II – Value Relevance of Deferred Taxes
39 © American Accounting Association
3. Value Relevance Analysis
3.1. Regression Model and Estimation Method
In order to assess whether and how investors consider disclosed deferred tax information, I
base my regression model on the valuation model by Feltham and Ohlson (1995).38 Consistent
with Feltham and Ohlson (1995), I relate market value of equity (P) to net operating assets,
net financial assets (NFA), and current abnormal operating earnings (AOE), with operating
assets being disaggregated into net operating assets before deferred taxes (NOA), deferred tax
assets (DTA), and deferred tax liabilities (DTL). This gives the following basic regression
model:
Pit = ß0 + ß1 NOAit + ß2 NFAit + ß3 AOEit + ß4 DTAit + ß5 DTLit + ∑ ������������ yearτ + eit
The variable definitions can be found in Table II.1. i is the firm identifier (i = 1,…,183) and t
is the period identifier (t = 2005,…,2008). e is the error term.
P denotes share price three months after fiscal year-end, three months being a common
time-lag to ensure that financial statements are already published and all available information
is priced. In line with Feltham and Ohlson (1995), net financial assets (NFA) are defined as
cash, cash equivalents, and short-term investments less total debt and preferred stock. Net
operating assets before deferred taxes (NOA) are computed as book value of shareholders’
equity less net financial assets less deferred tax assets plus deferred tax liabilities. DTA and
DTL represent deferred tax assets and deferred tax liabilities, respectively, with DTL being
coded as positive numbers. Current abnormal operating earnings (AOE) are calculated as
after-tax operating earnings (approximated by tax-adjusted EBIT, i.e., EBIT multiplied with
one minus income tax expense divided by EBT) less expected normal operating earnings (12
percent of lagged net operating assets).39 I choose 12 percent as estimate of the required rate
of return because the average annual return of the German stock market for the ten-year
period preceding the sample period is 12.13 percent. 40 The distributional properties of the
38 For a derivation of the Feltham-Ohlson model, see Appendix A. 39 The empirical results are not sensitive to the way of tax adjustment. I checked different possible adjustments; among others, adjusting for current tax expense only, with unchanging results. 40 Calculations are based on data provided by Strehle and Hartmond, Humboldt University, Berlin, available at: http://lehre.wiwi.hu-berlin.de/Professuren/bwl/bb/aktien/DatenReihen. For years 1955 to 2009, Strehle and Hartmond report an average (median) annual return of 12.21 (11.77) percent for the German stock market and of 12.68 (10.83) percent for the 30 largest firms.
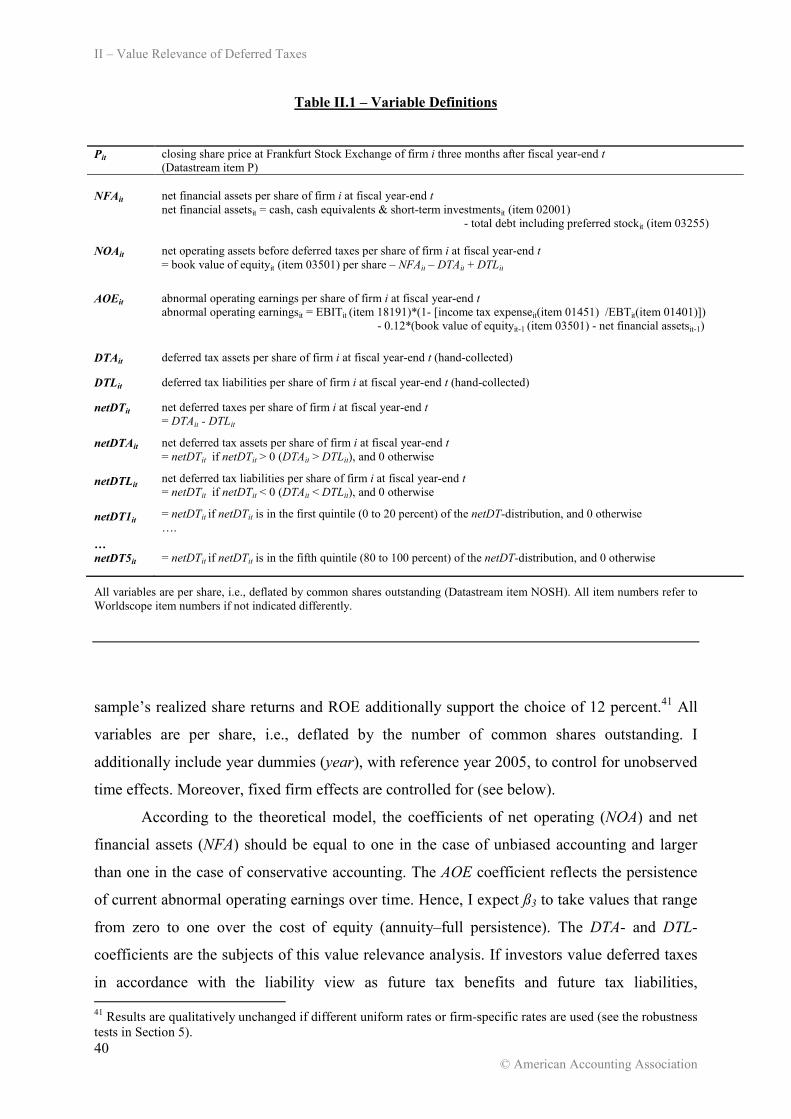
II – Value Relevance of Deferred Taxes
40 © American Accounting Association
Table II.1 – Variable Definitions
Pit closing share price at Frankfurt Stock Exchange of firm i three months after fiscal year-end t (Datastream item P)
NFAit
net financial assets per share of firm i at fiscal year-end t
net financial assetsit = cash, cash equivalents & short-term investmentsit (item 02001) - total debt including preferred stockit (item 03255)
NOAit net operating assets before deferred taxes per share of firm i at fiscal year-end t = book value of equityit (item 03501) per share – NFAit – DTAit + DTLit
AOEit abnormal operating earnings per share of firm i at fiscal year-end t
abnormal operating earningsit = EBITit (item 18191)*(1- [income tax expenseit(item 01451) /EBTit(item 01401)]) - 0.12*(book value of equityit-1 (item 03501) - net financial assetsit-1)
DTAit deferred tax assets per share of firm i at fiscal year-end t (hand-collected)
DTLit deferred tax liabilities per share of firm i at fiscal year-end t (hand-collected)
netDTit net deferred taxes per share of firm i at fiscal year-end t = DTAit - DTLit
netDTAit net deferred tax assets per share of firm i at fiscal year-end t = netDTit if netDTit > 0 (DTAit > DTLit), and 0 otherwise
netDTLit net deferred tax liabilities per share of firm i at fiscal year-end t = netDTit if netDTit < 0 (DTAit < DTLit), and 0 otherwise
netDT1it
…
= netDTit if netDTit is in the first quintile (0 to 20 percent) of the netDT-distribution, and 0 otherwise ….
netDT5it = netDTit if netDTit is in the fifth quintile (80 to 100 percent) of the netDT-distribution, and 0 otherwise
All variables are per share, i.e., deflated by common shares outstanding (Datastream item NOSH). All item numbers refer to Worldscope item numbers if not indicated differently.
sample’s realized share returns and ROE additionally support the choice of 12 percent.41 All
variables are per share, i.e., deflated by the number of common shares outstanding. I
additionally include year dummies (year), with reference year 2005, to control for unobserved
time effects. Moreover, fixed firm effects are controlled for (see below).
According to the theoretical model, the coefficients of net operating (NOA) and net
financial assets (NFA) should be equal to one in the case of unbiased accounting and larger
than one in the case of conservative accounting. The AOE coefficient reflects the persistence
of current abnormal operating earnings over time. Hence, I expect ß3 to take values that range
from zero to one over the cost of equity (annuity–full persistence). The DTA- and DTL-
coefficients are the subjects of this value relevance analysis. If investors value deferred taxes
in accordance with the liability view as future tax benefits and future tax liabilities, 41 Results are qualitatively unchanged if different uniform rates or firm-specific rates are used (see the robustness tests in Section 5).

II – Value Relevance of Deferred Taxes
41 © American Accounting Association
respectively, the DTA-coefficient should be positive and the DTL-coefficient negative.
Further, if the market discounts deferred taxes depending on timing and likelihood of their
associated cash flows, ß4 and ß5 could be smaller than one. By contrast, DTA- and DTL-
coefficients are expected to be not different from zero if investors do not consider deferred
taxes to provide relevant information on future tax cash flow.
I estimate the model using fixed firm effects, thereby controlling for time-constant
unobserved heterogeneity, i.e., time-constant firm-specific factors.42 These factors bias
estimated coefficients in case they are determinants of the dependent variable and correlated
with one or more of the regressors, so that fixed effects estimation mitigates correlated
omitted variable bias in the estimated coefficients. Further, the source of serial correlation due
to time-constant factors is thereby eliminated. I additionally employ Huber-White robust
standard errors clustered by firm, which are heteroscedasticity-consistent and corrected for
any potentially remaining serial correlation in the error terms.
3.2. Data and Sample Selection
Market prices are obtained from Thomson Reuters’ Datastream database, accounting data
from Thomson Reuters’ Worldscope database, while deferred tax data, being not available in
the databases, are hand-collected from the notes to consolidated financial statements. Hand-
collected data are matched with the database data by using firm name and year. The match is
validated by total assets and net income.43
The observation period covers fiscal years 2005 to 2008. 2005 is chosen as starting
point because the adoption of IFRS for consolidated financial statements became mandatory
for all listed European companies for fiscal years beginning at or after January 1, 2005.
Before 2005, listed German companies were allowed to prepare their consolidated financial
statements according to either German GAAP (HGB), IFRS, or US GAAP. To ensure
consistent reporting rules, 2005 is hence chosen as the first observation year.
Given that deferred tax data have to be hand-collected, the sample has to be restricted
to a manageable size. Therefore, the initial sample consists of all 160 firms that compose the
indices DAX, MDAX, TecDAX, and SDAX, and additional 50 firms listed in CDAX index
42 The Hausman test rejects the null hypothesis of unobserved heterogeneity being uncorrelated with the regressors. Hence, random effects estimation would generate inconsistent coefficient estimates and, thus, I use fixed effects estimation. 43 For 14 observations, database data did not correspond to the hand-collected data, so that I replaced the database data by hand-collected data for these observations. Results are unchanged if these observations are dropped.

II – Value Relevance of Deferred Taxes
42 © American Accounting Association
Table II.2 - Sample Selection
Firms Observations
DAX 30
MDAX 50 TecDAX 30 SDAX 50 other CDAX 50
210
excluded: firms without legal domicile in Germany -11 banks, insurance companies, REITs (NACE 1.1 codes 6500-6799)
-15
184 736
missing variable data for the basic regression -79 outliers -1 -31
Total 183 626
on August 31, 2007; all in all, the 210 firms with the highest free float market capitalization
and exchange turnover on Frankfurt Stock Exchange in August 2007.44 I exclude 11 firms
without legal domicile in Germany, and 15 banks, insurance companies, and real estate
investment trusts (NACE 1.1 codes 6500–6799) because of their different economic and
financial regulatory environment, the difficulty of separating their financial assets from
operating assets, their different asset composition, and their tax specificities. This leaves the
sample with 184 firms and 736 firm-year observations. I lose 79 observations due to variable
construction and missing variable data.45 To minimize the effects of outliers on the inferences,
I delete another 31 observations with an absolute value of the R-Student statistic of greater
44 Including the shares of all listed domestic companies, the CDAX index represents the German equity market in its entirety, i.e., all companies listed on FWB Frankfurter Wertpapierbörse (Frankfurt Stock Exchange). The indices DAX, MDAX, TecDAX, and SDAX are subsets of the CDAX, containing the largest companies in terms of order book volume and free float market capitalization. These firms are chosen for the analysis because they are, on average, larger, more diversified, and more involved in international activities than the remainder of German firms, which may give rise to more significant deferred taxes from different sources. Mills et al. (2002), for instance, report that the largest 20 percent of their sample firms account for virtually all of their sample’s book-tax income and balance sheet differences. For further information on the indices, see deutsche-boerse.com. The strike date August 31, 2007, is chosen randomly. 45 For not losing the first observation year, 2005, as a consequence of the construction of abnormal operating earnings, AOE, including lagged net operating assets, I additionally collected the data necessary to compute net operating assets from all sample firms that already prepared consolidated financial statements according to IFRS in 2004 (125 of 184 firms). If I only use after-tax operating earnings as AOE or drop fiscal year 2005 from the analysis, results are qualitatively unchanged.

II – Value Relevance of Deferred Taxes
43 © American Accounting Association
than three.46 This results in a final sample of 183 firms and 626 firm-year observations over
fiscal years 2005 to 2008. Table II.2 summarizes the sample selection procedure and Table
II.3 reveals the sample’s industry composition.
Table II.3 – Industry Composition
Industry Number of
Firms
NACE 1.1
Manufacturing
114
Apparel & Leather Products 6 1800-1999
Automobile 8 3400-3599
Basic Resources 4 2500-2799
Chemicals 14 2400-2439, 2450-2499
Food & Beverages 1 1500-1599
Industrial & Technology 65 2800-3399
Pharmaceuticals 16 2440-2449, 7310
Business & Management Consultancy, Personel Services, Investment Consultancy, Holdings
12
7400-7499 Construction 5 4500-4599
Healthcare 1 8500-8599
Media 7 2200-2299, 9200-9299
Real Estate 8 7000-7099
Software 12 7200-7299
Telecommunication 4 6400-6499
Transportation & Logistics 6 6000-6399
Utilities 3 4000-4199
Wholesale & Retail 11 5100-5299
Total 183
46 The R-Student statistic is measured as the regression residual divided by the residuals’ standard error. A cutoff of three is commonly used and implies that observations with a regression residual farther than three standard deviations from zero are considered as outliers.

II – Value Relevance of Deferred Taxes
44 © American Accounting Association
3.3. Empirical Results
Table II.4 presents descriptive statistics of the basic regression variables, as well as some
other statistics characterizing the sample. On average, deferred tax assets (DTA) and deferred
tax liabilities (DTL) account for 3.18 and 2.74 percent, respectively, of total assets, and
amount to approximately 10 percent of book equity, with nearly 30 percent of firm-year
observations featuring even larger deferred tax balances. Further, deferred tax expense
amounts to a substantial 17 percent of EBT, on average. Three hundred six firm-years exhibit
net deferred tax assets (DTA in excess of DTL), whereas 320 exhibit net deferred tax
liabilities (DTL in excess of DTA).
Table II.4 – Descriptive Statistics
mean median std. dev. min max obs.
P 28.56 20.01 25.74 0.25 130.50 626
NOA 25.29 12.75 50.29 -117.79 920.97 626
NFA -9.28 -2.22 30.22 -558.03 34.49 626
AOE 0.16 0.26 4.47 -70.97 24.18 626
DTA 1.31 0.48 2.80 0.00 43.80 626
DTL 1.59 0.48 3.02 0.00 22.15 626
netDT
netDT1
netDT2
netDT3
netDT4
netDT5
-0.03 -3.33 -0.33 0.00 0.28 2.50
-0.01 -2.01 -0.30 0.00 0.26 1.58
2.98 3.67 0.21 0.05 0.16 3.97
-18.54 -18.54 -0.81 -0.08 0.10 0.78
37.40 -0.96 -0.11 0.09 0.60
37.40
626 126 125 125 125 125
TA 8.8479 0.86 28.2 0.018 189.22 626
MV 3.9133 0.59 10.5 0.005 99.10 626
EBT 3.10 1.96 4.73 -9.53 32.26 626
EPS 1.71 1.27 3.23 -10.26 28.46 626
CF 6.23 3.73 9.29 -8.75 56.04 614
DTA/TA 0.0318 0.0186 0.05 0.00 0.2598 626
DTL/TA 0.0274 0.0191 0.03 0.00 0.1974 626
DTA/EK 0.0987 0.0487 0.24 0.00 1.8383 626
DTL/EK 0.0918 0.0503 0.17 0.00 1.1762 626
dte -0.0005 0.0108 0.64 -4.46 7.00 572
dte/EBT 0.1686 -0.0070 2.01 -3.33 29.90 572
TA: total assets (Worldscope item 02999); MV: market value of equity (common shares outstanding*price (Datastream items NOSH*P)); TA and MV are in billion €uro. EBT: EBT (Worldscope item 01401) per share. EPS: earnings per share (Worldscope item 18209); CF: cash flow (Worldscope item 05501) per share. DTA/TA (DTL/TA): ratio of deferred tax assets (deferred tax liabilities) to total assets; DTA/EK (DTL/EK): ratio of deferred tax assets (deferred tax liabilities) to book equity (Worldscope item 03501); dte: deferred tax expense (hand-collected) per share; dte/EBT: ratio of deferred tax expense to EBT. For all other variable definitions, see Table II.1.

II – Value Relevance of Deferred Taxes
45 © American Accounting Association
Figure II.1 displays average DTA and DTL relative to total assets separately by
industry, revealing that the average amounts of deferred taxes, as well as the rate of average
DTA to DTL, vary noticeably across industries. In particular, PPE-intensive industries (Basic
Resources, Construction, Real Estate, Transportation and Logistics, Utilities) exhibit
relatively larger shares of DTL, which is consistent with DTL arising from depreciation
differences being one of the main DTL components.
Pairwise correlation coefficients of the main regression variables are presented in
Table II.5. The relatively high correlation coefficient of deferred taxes and net operating
assets reflects the underlying character of operating assets for deferred taxes. Furthermore,
DTA and DTL are significantly positively correlated, implying that DTA and DTL arise
complementarily to a certain extent.
Figure II.1 – Deferred Taxes to Total Assets by Industry
0
0,01
0,02
0,03
0,04
0,05
0,06
0,07
Ind
ust
ry M
ean
Based on 626 observations.
DTA/TA
DTL/TA

II – Value Relevance of Deferred Taxes
46 © American Accounting Association
Table II.5 – Pearson Correlation Coefficients
P NOA NFA AOE DTA DTL netDT netDT1 netDT2 netDT3 netDT4 netDT5
P 1.00
NOA 0.26 1.00
NFA -0.10 -0.76 1.00
AOE 0.28 -0.48 0.58 1.00
DTA 0.20 0.49 -0.42 -0.36 1.00
DTL 0.14 0.34 -0.28 -0.04 0.48 1.00
netDT -0.00 -0.08 -0.07 -0.12 0.17 -0.26 1.00
netDT1 -0.15 -0.38 0.24 0.00 -0.08 -0.83 0.34 1.00
netDT2 -0.00 0.01 0.00 -0.04 0.10 0.06 0.03 -0.14 1.00
netDT3 -0.01 0.01 -0.01 0.01 0.02 0.01 0.00 -0.01 0.01 1.00
netDT4 -0.04 -0.11 0.11 0.03 -0.08 0.16 0.02 0.14 0.18 0.01 1.00
netDT5 0.08 0.04 -0.16 -0.13 0.20 0.00 0.95 0.04 0.05 0.00 -0.05 1.00
Correlation coefficients that are significantly different from zero at the 5 percent level are in boldface. Based on 626 observations. For variable definitions, see Table 1.
Table II.6 presents the results of the regression analysis. By explaining 50.34 percent
of the variance in share prices, the model explains a substantial part of share price variation.
Furthermore, NOA, NFA, and AOE coefficients are highly significant in each of the model
specifications and show the expected signs and magnitudes. In accordance with the theoretical
model, NOA- and NFA-coefficients are statistically not different from one in nearly all of the
model specifications. Regarding deferred taxes, I find, in general, no systematic relation
between deferred taxes and firm value. Inconsistent with the liability view, the coefficients of
separately included DTA and DTL balances, as well as the coefficient of net deferred taxes
(netDT, defined as DTA minus DTL), are not significantly different from zero (Table II.6
Models (1) and (2)). Besides, deferred tax coefficients remain insignificant if I allow
valuation coefficients to differ in net deferred tax assets (netDTA) versus net deferred tax
liabilities (netDTL) (Table 6 Model (3)).
According to IAS 12.74, an entity is allowed to offset DTA against DTL if it has a
“legally enforceable right to set off current tax assets against current tax liabilities; and the
deferred tax assets and the deferred tax liabilities relate to income taxes levied by the same
taxation authority”; hence, firms generally set off DTA against DTL to the extent that these
relate to the same taxation authority and the same taxpayer. However, since additional tax

© American Accounting Association
Table II.6 – Value Relevance Analysis
intercept NOA NFA AOE DTA DTL
within
R²
obs. / cross-
sections
(1) 24.9029*** (7.86)
0.6013*** (2.91)
0.9428*** (3.60)
1.2748*** (2.79)
0.6759 (0.86)
1.5838 (1.47)
0.5034 626 / 183
netDT
(2) 24.6543*** (7.27)
0.8328*** (3.49)
1.1554*** (3.87)
1.1414** (2.52)
0.3802 (1.03)
0.4941 626 / 183
netDTA netDTL
(3) 24.0823*** (7.83)
0.7464*** (3.22)
1.0903*** (3.79)
1.1712** (2.61)
1.1199 (0.93)
-1.7444 (-1.46)
0.5028 626 / 183
netDT1 netDT2 netDT3 netDT4 netDT5
(4) 24.2654*** (6.66)
0.7421*** (3.06)
1.0815*** (3.58)
1.1739** (2.55)
-1.7284 (-1.45)
-0.7545 (-0.15)
-6.3068 (-0.29)
7.2189 (1.45)
0.6853*** (2.93)
0.5049 626 / 183
DTA_TLC
DTA_current
assets DTA_provisions DTA_liabilities DTA_other
(5) 16.0338***
(6.92) 0.6300***
(4.62) 0.7084***
(3.34) 1.5121***
(3.06) -3.5429 (-1.38)
-0.0123 (-0.18)
4.5879 (1.33)
0.6078 (0.27)
0.5247 (0.82)
DTL_current
assets DTL_PPE DTL_intang DTL_other
1.7143 (0.82)
-1.8717 (-1.08)
0.3934 (0.44)
0.3478 (0.39)
0.5012 564 / 166 47
II – V
alue R
elevan
ce of D
eferred T
axes

II – Value Relevance of Deferred Taxes
48 © American Accounting Association
Table II.6 – Value Relevance Analysis (continued)
***, **, *: significantly different from zero at the 0.01, 0.05, and 0.1 level, respectively. Fixed effects estimation with t-statistics (reported in parentheses) calculated using Huber-White robust standard errors clustered by firm. Year dummies not reported. The number of available observations declines for this regression as a consequence of varying deferred tax disclosures, so that it is not possible to decompose all deferred tax balances unambiguously into these seven components. DTA_TLC: DTA for tax loss and tax credit carryforwards. DTA_current assets: DTA arising from current assets. DTA_provisions: DTA arising from pension provisions and other provisions. DTA_liabilities: DTA arising from liabilities. DTA_other: DTA arising from other deductible temporary differences. DTL_current assets: DTL arising from current assets. DTL_PPE: DTL arising from PPE. DTL_intang: DTL arising from intangible assets. DTL_other: DTL arising from other taxable temporary differences. All variables are per share. For all other variable definitions, see Table II.1.
(1) Pit = ß0 + ß1 NOAit + ß2 NFAit + ß3 AOEit + ß4 DTAit + ß5 DTLit + ∑ ������������ yearτ + eit
(2) Pit = ß0 + ß1 NOAit + ß2 NFAit + ß3 AOEit + ß4 netDTit + ∑ ������������ yearτ + eit
(3) Pit = ß0 + ß1 NOAit + ß2 NFAit + ß3 AOEit + ß4 netDTAit + ß5 netDTLit + ∑ ������������ yearτ + eit
(4) Pit = ß0 + ß1 NOAit + ß2 NFAit + ß3 AOEit + ß4 netDT1it + ß5 netDT2it + ß6 netDT3it + ß7 netDT4it
+ ß8 netDT5it + ∑ ������������ yearτ + eit
(5) Pit = ß0 + ß1 NOAit + ß2 NFAit + ß3 AOEit + ß4 DTA_TLCit + ß5 DTA_current assetsit
+ ß6 DTA_provisionsit + ß7 DTA_liabilitiesit + ß8 DTA_otherit + ß9 DTL_current assetsit
+ ß10 DTL_PPEit + ß11 DTL_intangit + ß12 DTL_otherit + ∑ ������������ yearτ + eit
payments to one taxation authority are offset by the utilization of tax benefits granted by
another taxation authority on group level, being included on a net basis over all tax authorities
and taxpayers in the corporate group’s total tax payments, the market could offset the total
deferred tax balances, assuming that DTA and DTL will largely reverse in common patterns
and value, hence, only notable surplus of DTA (DTL) over DTL (DTA). I examine, therefore,
the value relevance of net deferred taxes separately by quintiles. Table II.6 Model (4) reveals
that the coefficient of net deferred taxes in the highest quintile (netDT5), that is, the amount of
DTA notably exceeding DTL, is significantly different from zero at the 1 percent level. It is
not significantly different from the coefficient of net operating assets (NOA), and both
coefficients are not significantly different from one.
What might cause this asymmetry in value relevance, large net deferred tax assets
being value relevant, but large net deferred tax liabilities being not reflected in firm value?47
Prior empirical evidence (see Legoria and Sellers 2005), as well as the reversal analysis
presented in Section 4, suggest that DTA are more likely to be realized (in the near future)
than DTL, so that the surplus of DTA over DTL is the minimum amount of likely to be
47 Note that the value relevance of netDT5 is not simply due to large DTA being value relevant, but to the surplus of DTA over DTL. If I separately test for the value relevance of DTA in the highest quintile of the DTA-per-share or the DTA-to-total-assets distribution, those (not tabulated) coefficients are not significantly different from zero. The significance of the netDT5 coefficient is robust to slightly different model specifications, as well as to different estimation methods (see the robustness tests in Section 5).

II – Value Relevance of Deferred Taxes
49 © American Accounting Association
realized net cash inflow, even in case of reversing DTL.48 In other words, material surplus of
DTA over DTL represents the amount of deferred taxes that is most likely to be realized in the
sense that it involves the lowest risk of nonrealization and might, therefore, be value relevant.
To further explore whether the asymmetry in value relevance could be explained by
deferred taxes arising from different sources, therefore entailing different cash flow timings, I
examine the composition of deferred tax balances in detail. Examination reveals that the
quintiles of net deferred taxes are relatively homogeneous with respect to balance
composition.49 Main differences are that DTA in the highest net deferred tax quintile feature,
on average, significantly larger parts in DTA for tax loss carryforwards, while DTL in the
highest quintile comprise a significantly lesser portion of DTL arising from book-tax
differences in property, plant, and equipment (PPE) and intangible assets than the other four
quintiles. DTA for tax loss carryforwards is certainly the deferred tax component that is least
likely to be permanently recurring. Since (tax) losses are not expected to persist – either the
loss-generating entity turns profitable again or it is shut down – and since tax losses are only
capitalized via DTA to the extent that they are probable to be used – the utilizable amount
typically being assessed based on the firm’s medium-term business and tax planning – DTA
for tax loss carryforwards may indeed account for tax benefits that will be realized within the
next years. However, if I disaggregate deferred tax balances into their main components
according to magnitude and recognition frequency – DTA for tax loss and tax credit
carryforwards, DTA arising from temporary book-tax differences in pension and other
provisions, in liabilities, in current assets, and other, and DTL arising from temporary book-
tax differences in PPE, in intangible assets, in current assets, and other – and analyze the
value relevance of the single components, all coefficients of the separate deferred tax
components are not significantly different from zero (Table II.6 Model (5)).50 Hence, the
results suggest that (lacking) value relevance is independent of the balance’s composition.
48 Legoria and Sellers (2005) report that DTA are significantly positively related to future operating cash flow, while DTL-coefficients are insignificant. Moreover, the reversal analysis in Section IV shows that DTA balances exhibit a higher rate of reversal than DTL balances, suggesting that DTA tend to translate more timely into cash flow than DTL. Additionally, Section 4 shows that the net effect of simultaneously reversing DTA and DTL is positive, i.e., reversing DTA outweigh simultaneously reversing DTL, so that, on average, net deferred tax assets are realized. 49 Moreover, there is no industry clustering present in the highest quintile of the netDT distribution, with 71 percent of the industries featuring observations in this quintile and only three industries (Apparel and Leather Products, Pharmaceuticals, Wholesale and Retail) being overrepresented, i.e., exhibiting a percentage of observations that is significantly greater than 20 percent. If I drop those industries from the sample, results are unchanged. Hence, the consideration of deferred tax information is not attributable to industry. 50 The average DTA balance composes of 19 percent DTA for tax loss and tax credit carryforwards, 34 percent DTA arising from pension and other provisions, 23 percent DTA from liabilities, 11 percent DTA from current assets, and 13 percent other DTA. The average DTL balance composes of 38 percent DTL arising from PPE, 25

II – Value Relevance of Deferred Taxes
50 © American Accounting Association
The overall results of the value relevance analysis show that deferred taxes are, for the
most part, not reflected in firm value, which suggests that investors – similar to other financial
statement users – generally do not consider deferred taxes to reflect valuable information on
future tax payments.51 Because of the high uncertainties involved in disclosed deferred tax
balances, disclosed amounts probably bear hardly any relationship to the present value of
what will ultimately be paid, and the costs of estimating deferred tax cash flow are very likely
to outweigh any benefit of such estimates. Hence, investors may rationally decide to ignore
deferred tax cash flow implications based on cost-benefit considerations.
percent DTL from intangible assets, 16 percent DTL from current assets, and 21 percent other DTL. For a graphical presentation, see Appendix B. 51 The finding of general value irrelevance of deferred taxes is consistent with the findings of Beckman et al. (2007), who analyze the value relevance of reconciling items to net income and stockholders’ equity from financial statements prepared according to German GAAP (HGB) to either IFRS or U.S. GAAP. Because of substantial differences in disclosure and capitalization requirements and firms straying further from German tax law when adjusting to IFRS or US GAAP, virtually all of their sample firms record reconciliations with respect to deferred taxes. Yet, the reconciling item deferred taxes turns out to be not value relevant.

II – Value Relevance of Deferred Taxes
51 © American Accounting Association
4. Reversal Analysis
An analysis of deferred tax balance reversal allows an estimation of the magnitude and,
therefore, economic significance of deferred tax cash flow. Particularly since lacking reversals
imply a present value of deferred tax cash flow of zero, thus challenging the informativeness
of deferred tax allocation, evidence about the actual development of deferred taxes is of
crucial interest. Therefore, this section provides first, a descriptive analysis of the
development of deferred tax balances, and second, a quantification of deferred tax cash flow
as it is implied by balance reversal.
Figure II.2, Panels A and B, displays the distributions of the annual percentage
changes in DTA and DTL balances.52 The distributions basically resemble a normal
distribution with zero mean, the distribution of annual changes in DTA peaking in the interval
of -10 to +10 percent, and the distribution of annual changes in DTL peaking in the interval of
0 to +10 percent. In total, about 30 percent of the annual changes are concentrated in the 10
percent interval around zero, with 15 percent of all changes being smaller than 3 percent in
absolute values. The majority of accounts increase over time, with 53.40 (62.74) percent of
the annual changes in DTA (DTL) being positive.
Regarding medium-term development (fiscal years 2005 to 2008; Figure II.3 Panels A
and B), both DTA and DTL show quite high amounts of balance increases that are larger than
100 percent: 18.75 (31.08) percent of the sample firms show DTA (DTL) that more than
doubled from 2005 to 2008. Still, the DTA balance is relatively reversing: while 68.21 percent
of the sample firms report a higher DTL balance in 2008 than in 2005, only 51.65 percent of
the sample firms show an increased DTA balance in 2008 compared to 2005,53 thus implying
a higher realization frequency of deferred tax benefits than of deferred tax liabilities in the
medium term.54
52 The reversal analysis, as well as the subsequent cash flow estimations, is based on a subset of the sample, excluding annual changes from fiscal year 2006 to 2007. The reason for this exclusion is that the tax reform of 2008 in Germany involved a decrease in the statutory corporate tax rate, so that deferred tax balances had to be revalued with the lower tax rate in the financial statements of fiscal year 2007. Consequently, inclusion of annual changes from year 2006 to 2007 would bias the analysis toward finding a higher rate of reversal, including non-cash-flow-entailing reversals attributable to revaluation. 53 The percentages of in the medium-term increasing balances are actually understated for both DTA and DTL
because deferred taxes were recognized at a higher tax rate in 2005 than in 2008 as a consequence of a decrease in the corporate tax rate in 2008. 54 A decrease in DTA can also be caused by a (non-cash-flow-entailing) downwards adjustment of the probably realizable amount of future tax benefits instead of the (cash-flow-entailing) realization of these benefits. Yet, changes in DTA are generally not determined by changes in the future realizability of tax benefits. If I adjust DTA for changes in the valuation allowance as disclosed in the rate reconciliation, the percentage of in the medium-term increasing DTA rises to 55.00 percent, which is still considerably less than for DTL, thus actually implying a higher likelihood of realizing deferred tax benefits than deferred tax liabilities in the medium term.

II – Value Relevance of Deferred Taxes
52 © American Accounting Association
Figure II.2 – Annual Changes
Panel A – Annual Changes in Deferred Tax Assets
X-axis: Annual percentage change in the DTA balance. Y-axis: Percentage of observations, based on 340 observations.
Panel B – Annual Changes in Deferred Tax Liabilities
X-axis: Annual percentage change in the DTL balance. Y-axis: Percentage of observations, based on 340 observations.
Distributions of changes in and cash flow implications of adjusted and unadjusted DTA are very similar, with the main difference being that annual changes in adjusted DTA are even more concentrated in the 10 percent interval
around zero (39.77 percent of the annual changes are between -10 and +10 percent).
-1 0.4-0.8 0.6-0.6 0.8-0.4 -0.2 10 0.2 2 3 <0
0,02
0,04
0,06
0,08
0,1
0,12
0,14
0,16
-1 0.4-0.8 0.6-0.6 0.8-0.4 -0.2 10 0.2 2 3 <0
0,02
0,04
0,06
0,08
0,1
0,12
0,14
0,16
0,18
0,2
percentage of
observations
percentage of
observations

II – Value Relevance of Deferred Taxes
53 © American Accounting Association
Figure II.3 – Medium-Term Development
Panel A – Medium-Term Development of Deferred Tax Assets
X-axis: Percentage change in the DTA balance from year 2005 to year 2008. Y-axis: Percentage of observations, based on 183 observations.
Panel B – Medium-Term Development of Deferred Tax Liabilities
X-axis: Percentage change in the DTL balance from year 2005 to year 2008. Y-axis: Percentage of observations, based on 183 observations.
The distributions of changes in the single deferred tax components (not reported)
resemble the ones of the aggregated balances: annual changes peak in the 10 percent interval
around zero and, generally, more than 60 percent of annual changes are positive. The
distribution of DTA for tax loss carryforwards is slightly right skewed, with only 40.51
percent of the firms reporting increasing DTA for tax loss carryforwards in the medium term.
This is significantly less than for the aggregated DTA account and suggests, thus, that DTA
for tax loss carryforwards tend to translate more timely into cash flow than the other deferred
tax components. Besides, I find that DTL from PPE are, with 53.1 percent of annual changes,
far more concentrated in the interval of -10 to +20 percent than the other DTL components.
This is in line with most of the firms maintaining quite stable, tendentiously growing PPE
accounts and deferred taxes from PPE and supportive evidence for the literature that presents
-1 0.4-0.8 0.6-0.6 0.8-0.4 -0.2 10 0.2 2 3 <0
0,05
0,1
0,15
-1 0.4-0.8 0.6-0.6 0.8-0.4 -0.2 10 0.2 2 3 <0
0,05
0,1
0,15
0,2
percentage of
observations
percentage of
observations

II – Value Relevance of Deferred Taxes
54 © American Accounting Association
DTL arising from depreciation differences as the prime example of nonreversing deferred
taxes as a consequence of continuous reinvestment (see, for example, Amir et al. 1997,
Chandra and Ro 1997).
23.1 (35.8) percent of the firms report continuously increasing DTA (DTL) balances
during the observation period. Conversely, this means that 76.9 (64.2) percent of the firms
show, at least once, a decreasing DTA (DTL) balance. Yet, decreases are rather small in
magnitude, with up to 44.91 percent (67.44 percent) of the annual balance reductions being
smaller than 10 (20) percent. To illustrate the economic significance of such reductions: for
reductions of less than 20 percent, tax benefits (tax payments), as implied by reversing
balances, amount to 2.57 (2.56) percent of total cash flow and 0.84 (1.11) percent of share
price, on average. Median values are about 1 percent of cash flow and 0.3 percent of share
price, which emphasizes that relative cash flow implications are only small. For decreases of
more than 20 percent, though, deferred tax cash flow may amount to a substantial 10 percent
of total cash flow and more than 4 percent of share price. However, median ratios are far
below these values (about 1.4 percent of share price), suggesting that large implied cash flows
are rare. If I further take into account that in 34 percent of the cases DTA and DTL reverse
simultaneously, so that tax payments due to reversing DTL are offset – on group level at the
latest – by realized deferred tax benefits, the net cash flow effect declines further. The average
(median) net effect of simultaneously reversing deferred taxes is a net tax benefit of 16.71
(2.00) cents per share, which is 2.68 (0.54) percent of total cash flow per share and only 0.59
(0.10) percent of mean (median) share price. Accordingly, aggregated implied cash flows are
quite negligible for the most part.
Hence, I do find evidence of reversing deferred tax balances, but the implied cash
flows are only small, on average. The distributions peaking around zero point out that
deferred tax balances do not change much on an annual basis, small changes rather being
caused by the normal variability in operating activities, with small decreases in one year being
offset by increases in the next years and the majority of firms featuring increasing deferred tax
balances in the medium term. These findings are, on the one hand, consistent with lacking
value relevance due to deferred taxes arising predominantly from recurring operating
activities, larger reversals and associated cash flows, thus, being deferred into the remote
future. On the other hand, the findings of DTA being more reversing than DTL and of net
deferred tax assets being realized, on average, support the hypothesis of large net deferred tax
assets being most likely to translate into actual cash flow and, therefore, being considered

II – Value Relevance of Deferred Taxes
55 © American Accounting Association
value relevant. The results of the preceding analysis of value relevance are, hence, consistent
with the actual development of deferred tax balances.
To further explore the relevance of reversal, I allow in the valuation model of Section
3 for asymmetric valuation coefficients depending on the development of the deferred tax
balance. Specifically, I decompose the total deferred tax balance into its last year’s value
(lagDT) and current positive (pos∆DT) and negative changes (neg∆DT). Table II.7 Model (6)
shows that all coefficients of the deferred tax variables are, again, not significantly different
from zero.
In addition, I decompose deferred tax balances into a persistent part (DT_persist)
being defined as the minimum amount of the balance within the four-year observation period,
and a possibly less-persistent part (DT_variable) being defined as the residual of the actual
balance amount of year t less the minimum amount, in order to investigate whether investors
distinguish between a “hard core” of deferred tax balances arising from periodically recurring
activities and a possibly more variable part. The persistent part represents effectively
permanent differences that are not very likely to reverse in the near future as long as a certain
minimum level of operating activities is maintained. Therefore, I expect this part to be of no
value relevance. The nonpersistent part is more likely to translate into tax cash flow in the
near future and, hence, might be valued positively in the case of DTA and negatively in the
case of DTL.
On average, the DTA (DTL) balance never falls below 65.75 (63.46) percent of the
current balance’s amount, with DTA arising from pension and other provisions and DTL
arising from PPE being the least variable components in terms of this measure, which is
consistent with the underlying accounts being quite stable, tendentiously growing accounts.
The regression analysis (Table II.7 Models (7) and (8)) shows that the valuation coefficients
of the persistent, as well as of the variable, part are not significantly different from zero. Thus,
the overall results of the value relevance analyses imply that investors assume deferred tax
balances to be largely persistent/nonreversing. This seems to be a cost-beneficial
generalization given the largely minor cash flow implications of reversing deferred tax
balances.

© American Accounting Association
Table II.7 – Value Relevance Analysis – Reversal
***, **, *: significantly different from zero at the 0.01, 0.05, and 0.1 level, respectively. Fixed effects estimation in Models (6) and (7). Since variables DTA_persist and DTL_persist are fixed over
time, their coefficients are not estimable using fixed effects estimation, so that Model (8) is estimated using random effects estimation. t-statistics (reported in parentheses) are calculated using
Huber-White robust standard errors clustered by firm. Year dummies not reported. lagDTAit = DTAit-1. pos∆DTAit = DTAit - DTAit-1, if DTAit - DTAit-1 > 0, and 0 otherwise. neg∆DTAit = DTAit - DTAit-1, if DTAit - DTAit-1 < 0, and 0 otherwise. DTA_persist: minimum amount of the DTA balance within the four-year observation period. DTA_variableit = DTAit - DTA_persisti. Analogous for DTL. All variables are per share. For all other variable definitions, see Table II.1.
(6) Pit = ß0 + ß1 NOAit + ß2 NFAit + ß3 AOEit + ß4 lagDTAit + ß5 pos∆DTAit + ß6 neg∆DTAit + ß7 lagDTLit + ß8 pos∆DTLit + ß9 neg∆DTLit + ∑ ����������� yearτ + eit
(7) Pit = ß0 + ß1 NOAit + ß2 NFAit + ß3 AOEit + ß4 DTA_variableit + ß5 DTL_variableit + ∑ ������������ yearτ + eit
(8) Pit = ß0 + ß1 NOAit + ß2 NFAit + ß3 AOEit + ß4 DTA_variableit + ß5 DTA_persisti + ß6 DTL_variableit + ß7 DTL_persisti + ∑ ������������ yearτ + eit
intercept NOA NFA AOE lagDTA pos∆DTA neg∆DTA lagDTL pos∆DTL neg∆DTL within R²
obs. / cross-
sections
(6) 24.0420***
(3.87) 0.4894* (1.94)
0.7303*** (2.64)
1.6903*** (3.94)
-0.0001 (-0.02)
-0.9965 (-0.25)
1.5633 (0.38)
0.7933 (1.08)
3.0862 (0.87)
2.8212 (0.77)
0.5622 493 / 178
DTA_var DTL_var
(7) 25.0350***
(8.69) 0.8357***
(4.15) 1.1372***
(4.51) 1.0872**
(2.59) -0.5028 (-0.44)
-0.8269 (-0.63)
0.4958 626 / 183
DTA_var DTA_persist DTL_var DTL_persist
(8) 24.0718***
(14.29) 0.2644**
(2.37) 0.4862***
(2.97) 1.0123***
(3.60) -0.5414 (-0.70)
2.6842 (1.40)
1.2132 (1.43)
-0.3463 (-0.45)
0.4105 626 / 183
56
II – V
alue R
elevan
ce of D
eferred T
axes

II – Value Relevance of Deferred Taxes
57 © American Accounting Association
5. Robustness Tests and Supplemental Analysis
To check whether the regression results are robust to different variable definitions, model
specifications, and estimation methods, I perform several robustness tests with largely
unchanged results.
First, results are qualitatively unchanged if share price four months after fiscal year-
end, instead of price three months after fiscal year-end, is used as dependent variable.
Second, the results are robust to different definitions of abnormal operating earnings.
In detail, results are robust to abnormal operating earnings being derived by adding tax-
adjusted net nonoperating interest expense back to earnings and subtracting expected normal
operating earnings, to different forms of tax adjustment, as well as to different uniform
expected rates of return (8, 10, and 14 percent). Since the sample firms likely have different
expected rates of return, assuming a uniform rate may introduce measurement error.
Therefore, I replicated the analysis using a firm-specific rate calculated as moving average of
the firm’s realized annual share returns of the preceding five years, with qualitatively same
results.
Third, the results are robust to slightly different model specifications. Specifically, an
Ohlson (1995)-based regression model that disaggregates book value of equity into total
assets and total liabilities and includes an extension by expected next year’s abnormal net
income per share (defined as median analysts’ EPS forecast from I/B/E/S less 12 percent of
current book value of equity per share) leads to similar results, as well as a reduced model that
includes only book equity before deferred taxes, deferred tax variables, and net income per
share.
Fourth, regression results are similar to the results of the fixed effects estimation if I
apply instead first differences estimation, OLS estimation, or random effects estimation
including industry controls and heteroscedasticity-consistent standard errors clustered by firm.
Moreover, while large net deferred tax assets are significantly related to share price if the
regressions are run separately by year, DTA- and DTL-coefficients remain insignificant in
each of the four yearly regressions.
Fifth, although the average amount of deferred taxes is quite heterogeneous across
industries (see Figure II.1), the results are not industry-specific. This is additional evidence
against deferred tax composition mattering to the market, since deferred tax composition
differs across industries to the extent that asset composition differs.

II – Value Relevance of Deferred Taxes
58 © Astrid K. Chludek
Sixth, I distinguish between profit and loss firm-year observations. Hayn (1995) finds
evidence consistent with her hypothesis that because of shareholders’ liquidation option,
investors perceive losses as being temporary, i.e., less persistent than positive earnings,
resulting in a weaker association between negative earnings and returns as compared to the
association between positive earnings and returns. Burgstahler and Dichev (1997) and Barth
et al. (1998) report further evidence suggesting that valuation coefficients of book equity and
earnings differ between profit versus loss observations. Besides, the market could assume
loss-making firms to be less likely to realize deferred taxes because of lacking taxable income
and cash inflow, possibly causing the insignificance of the deferred tax coefficients. Yet, if I
exclude the sample’s 84 loss observations (13.42 percent of total observations; loss being
defined as pre-tax loss, i.e., EBT < 0), regression results are qualitatively unchanged. Hence,
insignificant results are not attributable to loss observations.
To further investigate possible valuation differences of profit versus loss observations,
I interact each independent variable with a dummy variable labeled lossit that takes a value of
1 if firm i reports a pre-tax loss (EBT < 0) at fiscal year-end t, and 0 otherwise. The results are
reported in Table II.8. In line with the literature, the significantly negative coefficient of
loss*AOE (Table II.8 Model (9)) shows that losses affect a firm’s market value to a lesser
extent than positive earnings. In addition, loss-making firms are generally of lower value than
profitable firms, as indicated by the significantly negative loss-coefficient. Deferred tax
valuation coefficients remain insignificant with one exception: DTA for tax loss
carryforwards of loss-reporting firms (loss*DTA_TLC) are significantly negatively related to
market value. Since DTA for tax loss carryforwards and the total amount of tax loss
carryforwards are highly correlated, with a pairwise correlation coefficient of 0.7575 for all
observations and of 0.4383 for loss observations, a significant loss*DTA_TLC-coefficient
could capture the effect of the underlying tax loss carryforwards as correlated omitted
variable.
Accordingly, if I additionally control for the total amount of tax loss carryforwards
(TLC), which is only available for 333 of the 626 observations, its coefficient is significantly
negative, in line with past tax losses, signaling a higher probability of future losses resulting
in a lower market valuation, while the coefficients of DTA for tax loss carryforwards are
insignificant (Table II.8 Model (10)). Conversely, DTA for tax loss carryforwards show
significantly negative coefficients for this subsample if the total amount of tax loss
carryforwards is not controlled for (Table II.8 Model (11)), as well as for the subsample with
nondisclosed information on the total amount of tax loss carryforwards (Table II.8 Model

II – Value Relevance of Deferred Taxes
59 © American Accounting Association
Table II.8 – Profit versus Loss Observations
(9) (10) (11) (12)
intercept 22.7433*** (11.47)
20.6136*** (8.90)
19.8034*** (8.59)
25.9517*** (8.48)
NOA 0.7664***
(6.21) 0.9577***
(6.18) 0.9701***
(6.33) 0.6524***
(4.24)
NFA 1.0457*** (5.42)
1.3101*** (7.23)
1.3334*** (7.43)
0.9091*** (3.69)
AOE 1.5589*** (3.44)
1.5069** (2.41)
1.3594** (2.17)
1.5433*** (2.92)
DTA_excl.TLC 0.6694 (1.50)
1.3836** (2.16)
1.4928** (2.34)
0.5355 (1.04)
DTA_TLC -0.4699 (-0.30)
-0.3660 (-0.15)
-3.4109* (-1.67)
1.1054 (0.50)
DTL 0.4979 (1.40)
-0.1397 (-0.24)
-0.0736 (-0.13)
0.5498 (1.03)
loss -3.3135** (-2.01)
-5.8144** (-2.03)
-5.3050* (-1.89)
-3.0177 (-1.19)
loss*NOA -0.2255 (-1.58)
0.1370 (0.47)
0.1025 (0.35)
-0.1108 (-0.57)
loss*NFA -0.3228 (-1.62)
0.2773 (0.79)
0.2357 (0.58)
-0.3595* (-1.70)
loss*AOE -1.2223** (-2.11)
-1.2281* (-1.75)
-0.9908** (-2.03)
-1.7234** (-2.20)
loss*DTA_excl.TLC 1.6446 (1.44)
5.6145 (1.14)
5.6134 (1.03)
0.5933 (0.39)
loss*DTA_TLC -3.3794* (-1.95)
-5.5132 (-1.31)
-1.2472 (-0.33)
-6.2241*** (-2.76)
loss*DTL -0.3880 (-0.33)
-2.5163 (-0.92)
-2.8327 (-1.05)
-0.9005 (-0.48)
TLC
-0.2904** (-2.43)
loss*TLC
0.2484 (1.45)
within R² 0.5016 0.6056 0.5962 0.5064
obs. / cross-sections 626 / 183 333 / 107 333 / 107 293 / 80

II – Value Relevance of Deferred Taxes
60 © Astrid K. Chludek
Table II.8 – Profit versus Loss Observations (continued)
***, **, *: significantly different from zero at the 0.01, 0.05, and 0.1 level, respectively. Fixed effects estimation with t-statistics (reported in parentheses) calculated using Huber-White robust standard errors clustered by firm. Year dummies not reported. Estimation of Models (10) and (11) uses only observations with available data on the total amount of tax loss and tax credit carryforwards. Estimation of Model (12) uses only observations without disclosed information on the total amount of tax loss and tax credit carryforwards. DTA_excl.TLC: gross DTA excluding DTA for tax loss and tax credit carryforwards. DTA_TLC: DTA for tax loss and credit carryforwards. TLC: total amount of tax loss and tax credit carryforwards (hand-collected). loss: dummy variable that takes a value of 1 if firm i reports a pre-tax loss (EBT < 0) in t, and 0 otherwise. All variables are per share. For all other variable definitions, see Table II.1.
(9, 11, 12) Pit = ß0 + ß1 NOAit + ß2 NFAit + ß3 AOEit + ß4 DTA_excl.TLCit + ß5 DTA_TLCit + ß6 DTLit
+ ß7 lossit + ß8 lossit*NOAit + ß9 lossit*NFAit + ß10 lossit*AOEit
+ ß11 lossit*DTA_excl.TLCit + ß12 lossit*DTA_TLCit + ß13 lossit*DTLit
+ ∑ ������������ yearτ + eit
(10) Pit = ß0 + ß1 NOAit + ß2 NFAit + ß3 AOEit + ß4 DTA_excl.TLCit + ß5 DTA_TLCit + ß6 DTLit
+ ß7 lossit + ß8 lossit*NOAit + ß9 lossit*NFAit + ß10 lossit*AOEit + ß11 lossit*DTA_excl.TLCit
+ ß12 lossit*DTA_TLCit + ß13 lossit*DTLit + ß14 TLCit+ ß15 lossit*TLCit + ∑ ������������ yearτ + eit
(12)).55 Hence, the results indicate that DTA for tax loss carryforwards might serve as a proxy
for the total amount of tax loss carryforwards in case the total amount is not disclosed.
Besides, these findings are supportive evidence for the information effect of tax loss
carryforwards as identified by Amir and Sougiannis (1999).56
55 The significance of DTA excluding DTA for tax loss carryforwards (DTA_excl.TLC, Models (10) and (11)) is attributable to netDT5 observations. 56 Amir and Sougiannis (1999) identify two conflicting effects that determine the effect of tax loss carryforwards on market value. On the one hand, tax loss carryforwards may have a positive effect on market value to the extent that they represent future tax savings (measurement effect). On the other hand, the existence of tax loss carryforwards may signal a higher probability of future losses, implying a negative effect on market value (information effect). Hence, the significantly negative coefficient of tax loss carryforwards indicates a dominating information effect.

II – Value Relevance of Deferred Taxes
61 © American Accounting Association
6. Conclusion
As acknowledged by the Commission of the European Communities (2007, p. 18),
“accounting for deferred taxes […] is very burdensome for companies in general,” whereas
“it has been confirmed by preparers and users, e.g. credit institutions and rating agencies,
that deferred tax information (whether recognised in the balance sheet or provided in the
notes) often is not considered a relevant input for the decisions to be taken.” This empirical
analysis underlines the general lack of relevance of deferred tax information by revealing that
investors – the primary financial statement addressees – do generally not consider deferred tax
balances to provide relevant information for assessing firm value, i.e., to provide relevant
information about future tax cash flow.
Lacking consideration may be due to uncertainties concerning timing and realization
probability of deferred tax cash flow and the perception that the majority of deferred taxes
arise from operating, and therefore recurring, activities, associated cash flows, hence, being
deferred into the remote future, so that the balance sheet amount of deferred taxes bears
hardly any relationship to the present value of what will ultimately be paid. In particular, the
actual medium-term development of DTL balances is consistent with passed criticism on the
liability view that deferred tax balances generally increase over time. Yet, the analysis also
reveals that there is a nonnegligible rate of reversals present, which suggests at first glance
that assuming no deferred tax cash flow in the near future underestimates actual cash flow.
However, quantifications illustrate that the reversals’ implied cash flows are minor for the
most part.
All in all, the largely found value irrelevance of disclosed deferred tax balance
information, in sum with the reported lack of consideration of disclosed deferred tax
information for decision making by other external financial statement users and the numerous
statements of practitioners who doubt any intrinsic value in deferred taxes, challenge the
benefit of extensive deferred tax recognition and disclosure requirements. This should be
particularly taken into consideration when amending IAS 12, since the IASB’s latest
amendment proposal, ED/2009/2, included, again, increased recognition and disclosure
requirements compared to both current IFRS and US GAAP.

II – Value Relevance of Deferred Taxes
62 © Astrid K. Chludek
Appendix A
Feltham-Ohlson Firm Valuation Model
In order to assess whether and how investors consider disclosed deferred tax information, I
base my regression model on the valuation model by Feltham and Ohlson (1995), which
models linearly the relation between a firms’ market value of equity and its accounting data.
Starting from the neoclassical standard model of security valuation, which states that a
firm’s equity value equals the net present value of expected dividends, Ohlson (1995) shows
that under clean surplus accounting market value of equity equals book value of shareholders’
equity plus net present value of expected future abnormal earnings, labeled as unrecorded
goodwill.
Feltham and Ohlson (1995) refine the Ohlson (1995) model by distinguishing between
financial and operating assets. Under the assumption that “perfect” accounting (i.e., the book
value of an asset or a liability coincides with its market value) applies rather to financial than
to operating assets, it is important to separate financial from operating assets in the valuation
equation as they may have different valuation coefficients. Hence, Feltham and Ohlson
decompose book value of equity into the sum of net operating assets and net financial assets
(defined as marketable securities less debt). Incorporating the Modigliani-Miller theorem of
capital structure irrelevance for firm value, they further assume that financing (borrowing and
lending) activities yield zero net present value. Taken together with the “perfect”-accounting
assumption, this implies that the difference between market and book value, i.e., a firm’s
unrecorded goodwill, is solely attributable to its operating activities, so that only net operating
assets generate abnormal earnings. Therefore, unrecorded goodwill equals the present value of
the firm’s expected future abnormal operating earnings in their model, abnormal operating
earnings being defined as actual operating income less an interest charge for the use of
operating assets that equals the firm’s cost of equity times lagged net operating assets.57
Consistent with Feltham and Ohlson, I relate market value of equity (P) to net
operating assets (NOA), net financial assets (NFA), deferred tax assets (DTA), deferred tax
liabilities (DTL), and current abnormal operating earnings (AOE), obtaining the following
basic regression model:
Pit = ß0 + ß1 NOAit + ß2 NFAit + ß3 AOEit + ß4 DTAit + ß5 DTLit + ∑ ������������ yearτ + eit
57 Since both valuation expressions originate from the neoclassical firm valuation model of discounted dividends, the Feltham-Ohlson model, expressing firm value as the sum of net operating assets, net financial assets, and the present value of expected abnormal operating earnings, is equivalent to firm value equaling the net present value of expected cash flows (see Feltham and Ohlson 1995).

II – Value Relevance of Deferred Taxes
63 © Astrid K. Chludek
Appendix B
Deferred Tax Components
Panel A – Average Deferred Tax Assets Composition
Average composition of deferred tax assets, based on 544 observations.
Panel B – Average Deferred Tax Liabilities Composition
Average composition of deferred tax liabilities, based on 544 observations.
current assets11%
financial assets2%
liabilities23%
other2%
pension + other provisions
34%
intangible assets3%
PPE6%
tax loss + tax credit
carryforwards 19%
PPE38%
other5%
financial assets4%
current assets16%
pension + other provisions
6%
liabilities6%
intangible assets25%

II – Value Relevance of Deferred Taxes
64 © Astrid K. Chludek

65 © Astrid K. Chludek
CHAPTER III
On the Relation of Deferred Taxes
and Tax Cash Flow
Using panel data over 16 years of observations, this study investigates whether deferred tax information serves its main purpose: to inform about future tax cash flow. The results show that deferred taxes in fact have short-term cash flow implications. Yet, the estimated
magnitude of these implied cash flows is rather small. While the model explains 86.53 percent of the variation in cash taxes paid, inclusion of deferred tax information adds only negligible 0.14 percent in explanatory power. Furthermore, deferred tax coefficients are insignificant for explaining future tax cash flow for 67.25 percent of the sample firms. Consistently, MAPE, RMSE, and differences in forecast errors suggest that the model
excluding deferred tax information outperforms the model including deferred tax information in terms of average forecast accuracy. Overall, the economic significance of
deferred tax cash flow seems to be very small.

66 © Astrid K. Chludek
1. Introduction
Accounting for the (estimated) future tax effects attributable to temporary book-tax
differences, tax loss and tax credit carryforwards, deferred taxes are supposed to represent
part of future tax cash flow. Yet, critics argue that disclosed deferred tax balances lack timely
cash flow implications as a consequence of predominantly arising from periodically recurring
operating activities, so that reversals and, therefore, deferred tax cash flow are continuously
deferred in the aggregate as long as the firm is at least maintaining its operating capacity.
In this case, disclosed amounts of deferred tax balances would hardly bear any relationship to
the present value of what will ultimately be paid, so that the decision and value relevance of
disclosed deferred taxes would be only minimal because of not providing relevant and reliable
information concerning future tax cash flow. Accordingly, anecdotal as well as empirical
evidence suggest that deferred tax information is considered irrelevant for decision making by
analysts and lenders.58
The empirical relation of deferred taxes and tax cash flow is still an open question,
though. Therefore, this study investigates whether disclosed deferred taxes serve their primary
purpose: to provide useful information with respect to future tax cash flow. The results of this
study should be of interest for at least two groups. For one thing, the findings of this study
should help standard setters to assess the usefulness of inter-period tax allocation and of the
currently required method of accounting for deferred taxes. For another thing, the results of
this study should be helpful for financial statement users. The knowledge whether and how
disclosed deferred tax balances are related to actual future tax cash flow, i.e., to what extent
deferred taxes will translate into actual cash flow in the near future, is important to assess
whether deferred taxes should be considered the decision making process.
Moreover, by determining the exact cash flow implications of disclosed deferred tax
balances, this study provides a basis for the ongoing debates concerning (lacking) value
relevance of deferred taxes. Besides, this study provides additional insights concerning the
predictive ability of financial reporting.
In order to investigate, whether deferred tax balances provide useful information on
future tax cash flow and how disclosed deferred tax balances are related to actual future tax
cash flow, this study examines (a) whether deferred tax information is significantly related to
actual future tax cash flow as measured by cash taxes paid and (b) whether consideration of
deferred tax information decreases forecast error of future tax cash flow forecasts.
58 See Beechy (2007), Carnahan and Novack (2002), and Cheung et al. (1997) for anecdotal evidence and Chen and Schoderbek (2000), Amir and Sougiannis (1999), and Chattopadhyay et al. (1997) for empirical evidence.

III – Deferred Taxes and Tax Cash Flow
67 © Astrid K. Chludek
Descriptive results, based on panel data over fiscal years 1994 to 2009, reveal that
deferred tax balances do indeed increase consistently over time, yet not proportionally to firm
growth, with about 40 percent of the observations exhibiting a decreasing ratio of deferred
taxes to total assets over time.
Estimating static as well as dynamic models, I find that only deferred tax balances
lagged by one and two years, respectively, are significantly related to current tax cash flow as
measured by cash taxes paid; farther lags are insignificant. Consistently, deferred taxes are
only incrementally useful in predicting future tax cash flow up to two years ahead. While the
model explains 86.53 percent of the variation in cash taxes paid, inclusion of deferred tax
information adds only negligible 0.14 percent in explanatory power.
The estimated coefficients suggest that, on average, 2 percent of the disclosed deferred
tax balance amount translates into tax cash flow on an annual basis, which implies that
deferred tax cash flow constitutes less than 5 percent of actual tax cash flow for the majority
of observations. The economic significance of deferred tax cash flow is, thus, rather moderate.
Furthermore, deferred taxes are not significantly related to actual tax cash flow for
67.25 percent of the sample firms. Firms with significant deferred tax information tend to be
underperformers in terms of showing, on average, less growth (of sales, operating cash flow,
and total assets), lower ROA, and significantly less multinational activity (as measured by
percent of foreign to total pre-tax income) as compared to the total sample. Moreover, results
of industry-specific analyses suggest that deferred tax information is relatively more
informative about future tax cash flow for firms belonging to the Industrial, Financial, IT, or
Telecommunication Services sector (for Financials, particularly deferred tax asset information
is useful).
Regarding forecasting performance, I find only limited evidence for deferred tax
information improving tax cash flow forecasts. For one thing, MAPE, RMSE, and rank tests
suggest that the forecast model that excludes deferred tax information outperforms the model
that includes deferred tax information in terms of average forecast accuracy. For another
thing, consideration of deferred tax information does not decrease the forecast error for the
majority of forecasts, and observed reductions are rather small for their most part: 75 percent
of the observed reductions in forecast error due to deferred tax consideration are smaller than
10 percent.
Using a dynamic model, I confirm in a multivariate setting Dyreng et al.’s (2008)
observation that low CASH ETR are more persistent than high CASH ETR, so that, overall,
this study also adds to the emerging stream of research focusing on actual tax payments.

III – Deferred Taxes and Tax Cash Flow
68 © Astrid K. Chludek
Moreover, this study confirms that current tax expense is highly correlated with actual tax
cash flow and may therefore serve as a reasonable proxy for tax cash flow (see also Frank,
2009). In addition, findings support the usefulness of the required “more likely than not”-
realization adjustment of deferred tax assets by a valuation allowance. The adjustment
definitely increases the informativeness of disclosed deferred tax assets (i.e., it improves their
relation to future tax cash flow).
The proceeding of this chapter is organized as follows: The second section motivates the
research question and reviews related research. Section 3 presents the models and estimation
methods. Subsequently, Section 4 describes the sample and presents descriptive and
multivariate findings. Section 5 presents the forecast analysis. Section 6 provides robustness
tests and supplemental analyses. Section 7 finally concludes.

III – Deferred Taxes and Tax Cash Flow
69 © Astrid K. Chludek
2. Motivation and Literature Review
According to ASC 740-10 (formerly SFAS No. 109), deferred tax assets and liabilities are
recognized for the estimated future tax effects of events that have been recognized differently
in a firm’s financial statements than in its tax returns. Specifically, deferred tax liabilities
(DTL) are recognized for temporary differences between book value and tax basis of assets
and liabilities, which will result in taxable amounts in future years. Deferred tax assets (DTA)
are recognized for temporary differences that will result in tax deductible amounts in future
years as well as for tax loss and tax credit carryforwards. Hence, deferred taxes are supposed
to inform about future tax payments. Yet, it is not clear to what extent recognized deferred tax
balances are actually related to future tax payments.
Critics argue that the informative value of deferred taxes is only low due to highly
uncertain cash flow implications. Specifically, it is argued that the major part of deferred
taxes is not expected to be realized in the near future as a consequence of arising from
operating and, therefore, periodically recurring activities, which results in an effectively
permanent deferral of the associated tax cash flow.59 Lacking relevance of deferred tax
information as a consequence of lacking cash flow implications would challenge the
usefulness of deferred tax accounting, which is routinely named by accountants as one of the
most complex and costly provisions to comply with.60
Although the tax cash flow implications of deferred taxes are crucial for the value and
decision relevance of deferred taxes, research directly addressing the cash flow implications
of deferred taxes is scarce. Instead, research focuses on whether financial statement users
consider deferred taxes in their decision making process, thereby implicitly deducing (by
financial statement users presumed) cash flow relevance from decision relevance. Regarding
analysts and lenders, empirical as well as anecdotal evidence concludes that these do not
consider deferred tax information in their decision making process (see Chen and Schoderbek
2000, Amir and Sougiannis 1999, and Chattopadhyay et al. 1997 for empirical and Beechy
2007, Carnahan and Novack 2002, and Cheung et al. 1997 for anecdotal evidence), which
implies no relevant (information about) deferred tax cash flows.
59 See Beechy (2007), Colley et al. (2009), or Johnson (2010). 60 The relatively high costs arise due to the fact that accounting for deferred taxes is complex and requires a high level of coordination. It is necessary, for instance, to prepare the tax report within a narrow time frame and to assess the future realizability of deferred tax assets. The latter includes, among other things, estimating future taxable income. Moreover, it is necessary to determine the expected manner of recovery/settlement if the manner of recovery/settlement affects the applicable tax rate. Accordingly, accountants name deferred tax allocation as one of the most complex and costly provisions to comply with, so that there is an ongoing controversy about whether there is adequate benefit that justifies the high accounting costs involved.

III – Deferred Taxes and Tax Cash Flow
70 © Astrid K. Chludek
With respect to deferred tax consideration by investors (value relevance studies),
empirical results are mixed. While early studies, based on the first fiscal years after
implementation of SFAS No. 109, find significant valuation coefficients of deferred taxes
(Amir et al. 1997 and Ayers 1998), more recent studies based on US GAAP-data (Raedy et al.
2011) as well as studies based on non-US GAAP-data (Citron 2001, Chang et al. 2009, and
Chludek 2011) find no consistent evidence for value relevance.
Research directly addressing the relation of deferred taxes and future tax payments is
scarce, however, so that there is hardly any evidence on (a) the actual relation of deferred
taxes and tax cash flow and (b) whether the required method of accounting for deferred taxes
is informative about future tax cash flows. Cheung et al. (1997) report that deferred tax
information improves the prediction of one-period-ahead tax payments by decreasing the
mean absolute percentage error (MAPE) of their forecasts by roughly 2.78 percent. Moreover,
they report that deferred tax information reduces average forecast error of forecasting
operating cash flow for 16 of 30 industries. Yet, the study has several shortcomings
concerning data, estimation method, and variables.61
Using the actual U.S. tax liability as it is reported on the corporate tax return Form
1120, Lisowsky (2009) finds that deferred tax expense is not related to the actual U.S. tax
liability.
In contrast to these two studies, which basically analyze the relation of deferred tax
expense and tax payments, Legoria and Sellers (2005) focus in cross-sectional regression
analyses on the effect of deferred taxes on operating cash flow of up to four periods ahead.
Inclusion of deferred tax balance information increases the explanatory power of their model,
as measured by adjusted R-squared, by 0.49 to 1.42 percentage points. They report a
significantly positive (negative) relation of deferred tax assets (the valuation allowance for
deferred tax assets) and future operating cash flow. The effect of the valuation allowance,
however, is dominating. Moreover, deferred tax liabilities show an unexpectedly significantly
positive coefficient estimate in their basic model specification, which becomes insignificant
61 First, by using data of years 1975 to 1994, their sample covers a period when a total of three different accounting standards on deferred taxes were in force – APB No. 11, SFAS No. 96, and SFAS No. 109 –, which might cause some inconsistency in the data. Second, Cheung et al. (1997) do not comment at all on the estimation method used to estimate their dynamic panel models, for which estimation issues might arise easily, possibly biasing their results. Third, by including either deferred tax expense or the annual change in noncurrent deferred tax liabilities in their models, they only take into account changes in deferred tax balances, thus ignoring significant parts of deferred tax information. Because of the high degree of aggregation in their deferred tax variables, they can neither distinguish between deferred tax expense due to reversing versus growing accounts, nor between possible asymmetric effects of deferred tax assets versus deferred tax liabilities, nor do they investigate the long-term information embedded in deferred tax balances, which should be of most interest with regards to the concept, idea, and purpose of deferred tax accounting. Fourth, they only approximate actual tax cash flow by using current tax expense less the annual change in income taxes payable.
III – Deferred Taxes and Tax Cash Flow
71 © Astrid K. Chludek
as soon as other financial statement information is controlled for. Hence, their findings rather
suggest a future performance indicating effect of deferred taxes (this is, deferred taxes
anticipating future firm performance via underlying assets and recognition constraints), than a
tax cash flow effect.62
This study, by contrast, has the advantage that it uses a direct measure, to assess the
relation of deferred taxes on future tax payments, by focusing on the implications of
recognized deferred tax balances for (future) cash taxes paid. Furthermore, I am able to
analyze a considerably longer time-period than most prior studies. Time-series data of up to
16 observation years allow to estimate models by firm, which is very important, since
deferred tax composition, reversal behavior and, therefore, translation into tax cash flow may
be very firm-specific. Moreover, the long time-series enable to assess whether deferred tax
balances contain long-term information about future tax payments.
62 A significant relation between deferred taxes and future operating cash flow does not necessarily have to stem from tax cash flow. Instead, deferred taxes may be related to future cash flow via underlying assets and recognition constraints. On the one hand, deferred taxes increase in their underlying assets. To the extent that growing operating assets produce higher operating cash flow, deferred taxes are positively related to future operating cash flow via the underlying assets, if other factors are not controlled for. In line, Legoria and Sellers (2005) report a significantly positive coefficient estimate also for deferred tax liabilities, which contradicts the tax effect and which becomes insignificant as soon as other financial statement information is controlled for. On the other hand, deferred tax assets are reduced by a valuation allowance to the amount that is more likely than not to be realized. Thus, a ceteris paribus larger deferred tax asset balance (larger valuation allowance) suggests management expectations of higher (lower) taxable income, so that deferred tax assets (the valuation allowance) may be positively (negatively) related to future operating cash flow because of anticipating improved (decreased) future firm performance, instead of being related via lower (higher) tax payments. In particular the finding of a dominating influence of the valuation allowance by Legoria and Sellers (2005) may be a hint that their model rather captures performance indicating effects than tax cash flow effects of deferred taxes. Empirical results by Gordon and Joos (2004), showing that basically only changes in unrecognized deferred taxes are significantly related to future firm performance, while changes in recognized deferred taxes are largely insignificant, suggest a dominance of the performance over the tax effect on total cash flow.

III – Deferred Taxes and Tax Cash Flow
72 © Astrid K. Chludek
3. Regression Models and Estimation Methods
3.1. Models
The main regression analysis is based on two models – a basic model and its extended
version. The basic model relates cash taxes paid (tax_paid) to the main determinants of the
current amount of cash taxes paid – current tax expense (curr_tax_exp) and the annual change
in income taxes payable (∆tax_payable) – as well as to the variables of interest – deferred tax
assets (DTA) and deferred tax liabilities (DTL).
Basic Model:
(1) tax_paidit = ß0 + ß1*curr_tax_expit + ß2*curr_tax_expit-1 + ß3*∆tax_payableit +
ß4*DTAit-1 + ß5*DTLit-1 + ß6*DTAit-2 + ß7*DTLit-2 + ∑ � * Yeark + εit
Variable definitions are given in Table III.1.
Current tax expense (curr_tax_exp) should be the main explanator of cash taxes paid
(tax_paid). Estimating taxes payable or refundable on tax returns for the current year, current
tax expense should exhibit a strong positive relation to actual cash taxes paid. Including
lagged current tax expense accounts for timing differences between the recognition of current
tax expense and the assessment of the actual tax liability. The annual change in the income tax
liability (∆tax_payable) is directly negatively related to current tax payments.
The focus of this paper is on the relationship of deferred tax information and actual tax
cash flow. Since deferred tax assets (DTA) account for temporary book-tax differences that
will results in tax deductible amounts in future years, DTA should be negatively related to
future tax payments, while deferred tax liabilities (DTL), being recognized for temporary
book-tax differences that will result in taxable amounts in future years, should be positively
related to future tax payments.63 Yet, if recognized deferred tax balances lack (systematic)
cash flow implications, DTA- and DTL-coefficient estimates should turn out to be
insignificant. Inclusion of DTA and DTL lagged by up to ten periods in the model shows that
only deferred tax information of the previous two periods is significantly related to current tax
63 In case of a dominating performance effect, coefficient estimates of both, DTA and DTL, should show positive signs. This is because, for one thing, a higher ratio of recognized deferred tax assets implies positive performance expectations and, consequently, possibly higher tax payments. For another thing, deferred tax assets as well as deferred tax liabilities increase in their underlying assets. To the extent that these underlying assets produce taxable income, deferred taxes should be positively related to future tax cash flow. Controlling for performance and deflating by total assets, though, should mitigate performance effects captured by deferred taxes.
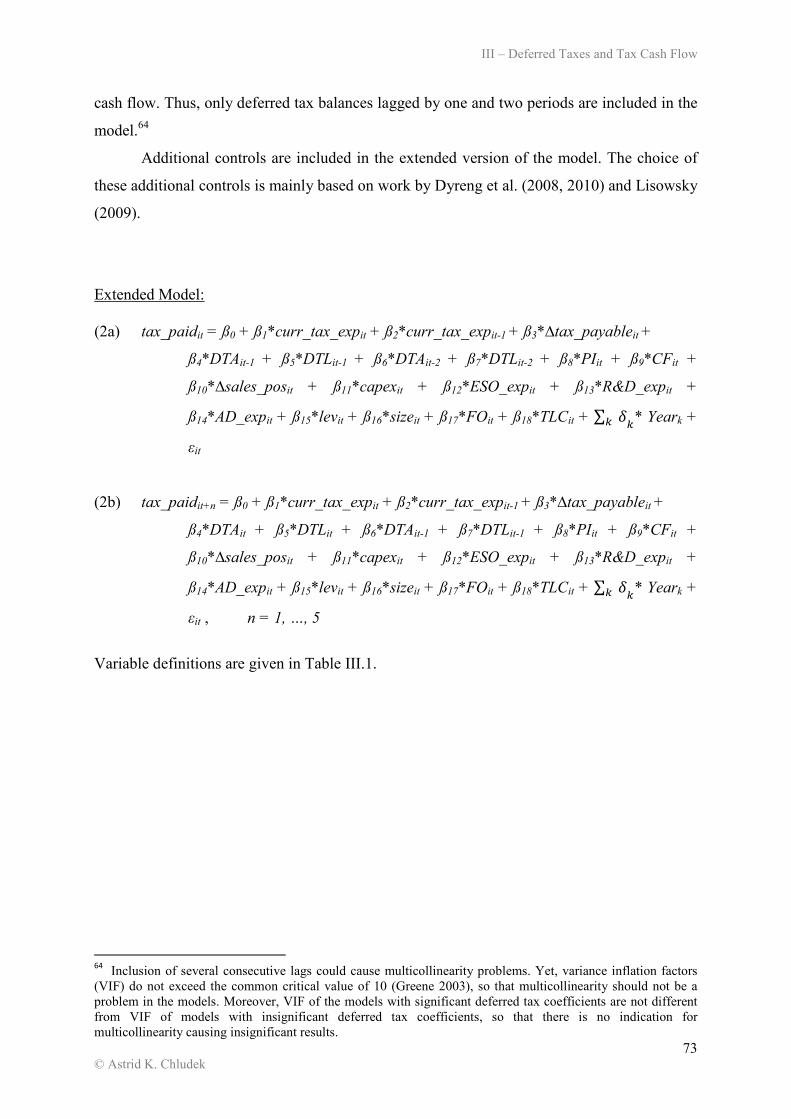
III – Deferred Taxes and Tax Cash Flow
73 © Astrid K. Chludek
cash flow. Thus, only deferred tax balances lagged by one and two periods are included in the
model.64
Additional controls are included in the extended version of the model. The choice of
these additional controls is mainly based on work by Dyreng et al. (2008, 2010) and Lisowsky
(2009).
Extended Model:
(2a) tax_paidit = ß0 + ß1*curr_tax_expit + ß2*curr_tax_expit-1 + ß3*∆tax_payableit +
ß4*DTAit-1 + ß5*DTLit-1 + ß6*DTAit-2 + ß7*DTLit-2 + ß8*PIit + ß9*CFit +
ß10*∆sales_posit + ß11*capexit + ß12*ESO_expit + ß13*R&D_expit +
ß14*AD_expit + ß15*levit + ß16*sizeit + ß17*FOit + ß18*TLCit + ∑ � * Yeark +
εit
(2b) tax_paidit+n = ß0 + ß1*curr_tax_expit + ß2*curr_tax_expit-1 + ß3*∆tax_payableit +
ß4*DTAit + ß5*DTLit + ß6*DTAit-1 + ß7*DTLit-1 + ß8*PIit + ß9*CFit +
ß10*∆sales_posit + ß11*capexit + ß12*ESO_expit + ß13*R&D_expit +
ß14*AD_expit + ß15*levit + ß16*sizeit + ß17*FOit + ß18*TLCit + ∑ � * Yeark +
εit , n = 1, …, 5
Variable definitions are given in Table III.1.
64
Inclusion of several consecutive lags could cause multicollinearity problems. Yet, variance inflation factors (VIF) do not exceed the common critical value of 10 (Greene 2003), so that multicollinearity should not be a problem in the models. Moreover, VIF of the models with significant deferred tax coefficients are not different from VIF of models with insignificant deferred tax coefficients, so that there is no indication for multicollinearity causing insignificant results.

III – Deferred Taxes and Tax Cash Flow
74 © Astrid K. Chludek
Table III.1 – Variable Definitions
tax_paid cash taxes paid (TXPD) divided by total assets (AT)
curr_tax_exp current income tax expense (TXC) divided by total assets (AT); if TXC is missing, curr_tax_exp is calculated as total income tax expense less deferred income tax expense divided by total assets ((TXT-TXDI)/AT)
DTA deferred tax assets (hand-collected) divided by total assets (AT)
DTL deferred tax liabilities (hand-collected) divided by total assets (AT)
∆tax_payable annual change in income taxes payable (TXP) divided by total assets (AT)
PI pre-tax book income (PI) divided by total assets (AT)
CF operating cash flow (OANCF) divided by total assets (AT)
∆sales_pos = 1 if the annual change in net sales (SALE) is positive; = 0 otherwise
capex capital expenditure (CAPX) divided by gross property, plant, and equipment (PPEGT); = 0 if missing
ESO_exp implied stock option expense (XINTOPT) divided by total assets (AT); = 0 if XINTOPT is missing
R&D_exp R&D expense (XRD) divided by total assets (AT); = 0 if XRD is missing
AD_exp advertising expense (XAD) divided by net sales (SALE); = 0 if XAD is missing
lev sum of long-term debt (DLTT) and long-term debt in current liabilities (DLC) divided by total assets (AT)
size natural logarithm of market value (ln(price*CSHO))
FO = 1 if foreign pre-tax income (PIFO) is non-zero and non-missing; = 0 otherwise
TLC = 1 if the firm has non-missing, non-zero tax loss carryforwards (TLCF); = 0 otherwise
cashETR = cash taxes paid divided by pre-tax income less special items (TXPD/(PI-SPI)); observations with negative nominator or denominator and with cashETR greater than 1 are excluded
Li.variable = variablet-i, variable lagged by i periods
Compustat mnemonics are in parentheses.

III – Deferred Taxes and Tax Cash Flow
75 © Astrid K. Chludek
The additional controls are particularly included for forecasting purposes, to control
for performance effects and general trends in tax cash flow, but also for capturing tax effects
(for example arising from permanent book-tax differences) that are not included in current tax
expense and deferred taxes.
Pre-tax income (PI) and operating cash flow (CF) are included to control for
performance effects. To the degree that these are persistent, I expect positive coefficients for
both variables in regressions on future cash taxes paid. In the same vein, growth indicators
like sales growth (∆sales_pos) and capital expenditure (capex) should be positively related to
future tax payments. Yet, a negative relation of capex and tax_paid may also be possible due
to investment tax credits and accelerated tax depreciation. Therefore, I leave the expected
coefficient sign of capex open. R&D expense (R&D_exp) is included to control for the
Research & Experimentation Tax Credit in accordance with I.R.C. §41, which has a tax
reducing effect.
Another factor which causes the actual tax liability to differ from current tax expense
are employee stock options (ESOs), which are treated differently for tax than for financial
reporting purposes. While tax code differentiates between two classes of options – non-
qualified stock options (NQSOs), which are tax-deductible when exercised, and incentive
stock options (ISOs), which are not deductible –, accounting standards do not differentiate
these two classes of options. Instead, options granted to employees were generally not
required to be expensed for fiscal years beginning before June 2005 (SFAS No. 123).
Currently, they have to be expensed (over the vesting period, if applicable, starting) in the
fiscal year the options are granted (ASC 718, formerly SFAS No. 123(R)). These different
treatments, resulting in permanent differences in the case of ISOs and in temporary book-tax
differences in the case of NQSOs and, give rise to DTA for NQSOs. Thus, differences
between the actual tax liability and current tax expense due to NQSOs are controlled for by
DTA for fiscal years 2006 to 2009.
Before 2006, only few firms made use of expensing stock option compensation
voluntarily at fair value (see Hanlon, 2003), but rather applied APB No. 25, according to
which compensation expense equals the intrinsic value of the option (which is zero for most
firms), so that ESOs caused effectively permanent book-tax differences for most of the firms
before fiscal year 2006. Controlling for the tax benefits of NQSOs for fiscal years before 2006
is difficult, in general.65 Several approximations have been used in the literature (see, for
65 See Hanlon and Shevlin (2002) for a discussion. Yet, NQSO tax benefits have also been included in DTA before 2006 if the NQSO tax deduction resulted in a tax loss carryforward (Hanlon and Shevlin, 2002). Furthermore, APB No. 25 (para. 16, 17) required that the tax benefits related to NQSOs are accounted for as a

III – Deferred Taxes and Tax Cash Flow
76 © Astrid K. Chludek
example, Lisowsky 2009 and Blouin and Tuna 2009). All of these approximations, however,
have to rely on various assumptions and may introduce measurement error. Therefore, I only
include implied stock option expense (ESO_exp), which represents the amount that would
have been expensed if the company had reported under the fair value method before 2006.66
Advertising expense (AD_exp) is included because findings of Dyreng et al. (2008)
suggest that firms that spend more on advertising (thus being more susceptible to public
perception and, therefore, punishment in case of excessive tax avoidance) seem to avoid taxes
to a lesser extent, exhibiting a higher CASH ETR. Leverage (lev) is included to control for the
tax advantages of higher leverage (debt tax shield), implying a negative coefficient.
Multinational activity, as implied by the existence of foreign income (FO), may have a
decreasing effect on tax payments due to multinationals being able to distribute their activities
across jurisdictions so as to minimize their overall tax burden (via cross-jurisdictional interest
stripping, income shifting, transfer pricing schemes, etc.; see Rego 2003 and Lisowsky
2009).67 Findings on the relation of firm size and effective tax rates, tax avoidance, and tax
planning behavior are highly mixed across studies.68 Therefore, I make no prediction with
respect to the sign of the size-coefficient. The existence of tax loss carryforwards (TLC)
should be negatively related to tax payments.
Variables are deflated by total assets because total assets are the basis for producing
taxable income as well as for the book-tax differences that give rise to deferred taxes.
credit to Additional Paid-in Capital with an offsetting debit to income taxes payable, so that controlling for changes in income taxes payable includes this effect. 66 Actually, implied stock option expense represents an after-tax amount, since it is equal to the difference in actual net income less net income if ESOs had been expensed. Grossing up to get the pre-tax value and subsequently multiplying with the statutory tax rate to get the tax benefit amount, like it is done by Lisowsky (2009) for example, is not necessary, since this factor (0.35/0.65) is constant across firms and time and, therefore, included in the coefficient estimate. Using only implied stock option expense actually equals the approximation employed by Lisowsky (2009) under the assumption that either the relation of ISO- to NQSO-expense is constant across firms and time or that virtually all options granted are NQSOs. Since, first, “it is tax-favored to grant ISOs over NQOs to individuals
whose personal income tax rates and capital gains rates are higher than the corporation’s tax rate” (Lisowsky 2009, p. 40), such that executives should be the main receivers of a firm’s ISOs, and since, second, Hall and Liebman (2000) report that still about 95 percent of ESOs granted to CEOs are NQSOs, it is not unreasonable to assume that the percentage of granted ISOs is negligibly small. Yet, to ensure that employee stock options do not drive the inferences, I additionally estimate the models separately on pre- versus post-2006 observations and estimate the models excluding ESO_exp. Both robustness checks lead to unchanged inferences. 67 Leverage and foreign operations will probably not be incrementally informative as far as current tax cash flow is concerned, since tax deductible interest expense and lower foreign tax rates are already included in current tax expense. Yet, current capital structure as well as multinational activity may be informative with respect to future tax payments. 68 For an excellent summary of the divergent findings, see Rego (2003).
Even the latest studies based on actual
tax cash flow show divergent results with respect to firm size: While descriptive statistics by Dyreng et al. (2008) suggest a negative relation of firm size and CASH ETR, that is, long-run tax avoiders tend to be larger firms, Lisowsky (2009) reports a positive relation of firm size and the actual tax liability reported on the tax return.

III – Deferred Taxes and Tax Cash Flow
77 © Astrid K. Chludek
Alternative deflators do not affect the inferences (see the robustness tests in Section 6).
Moreover, year- and firm-fixed effects are controlled for.
3.2. Estimation Methods
The static models are estimated using fixed effects estimation with Huber-White robust
standard errors clustered at firm level.69 By this, standard error estimation is adjusted for
potential serial correlation between multiple observations per firm. Moreover, correlated
omitted variable bias in the estimated coefficients is mitigated by controlling for unobserved
heterogeneity by using firm-fixed effects.
In addition to the static models, I estimate dynamic models, including the lagged
dependent variable as explanatory variable, to further control for unobserved differences in
tax cash flow levels. Since OLS estimation yields biased and inconsistent estimates in such a
case (Nickell 1981, Stocker 2007), the dynamic models are estimated using Arellano-
Bover/Blundell-Bond two-step system GMM (Arellano and Bover 1995, Blundell and Bond
1998). Windmeijer (2005) finite-sample correction is employed to obtain accurate two-step
standard error estimates that are robust to heteroskedasticity and serial correlation in the
errors.70
System GMM estimates a system of the regression equation in first differences and the
regression equation in levels. For the regression equation in first differences, endogenous
explanatory variables (here: the lagged dependent variable) are instrumented with second and
higher lags of their own levels, while the levels equation employs instruments in lagged
differences.71 For system GMM estimators to be consistent, the chosen instruments have to be
exogenous, i.e., uncorrelated with the error term. Two tests are performed to check the
validity of the instruments used in the estimation: the Arellano-Bond test for zero
autocorrelation and the Hansen test of overidentifying restrictions.
Lags of the endogenous variable greater than or equal to two are valid instruments for
the differenced equation if they are not correlated with the first-differenced errors. This is the
69 The Hausman test approves the choice of fixed effects estimation. 70
While the one-step GMM estimator uses the identity matrix as weighting matrix, the two-step estimator
weights the instruments asymptotically efficient using the residuals of the one-step estimation to construct a sandwich proxy, so that two-step GMM performs somewhat better than one-step GMM in estimating coefficients, with lower bias and standard errors (Windmeijer 2005). Yet, two-step standard error estimates are downward biased (Blundell and Bond 1998). Therefore, Windmeijer (2005) finite-sample correction is employed. 71 The Difference-in-Hansen test does not reject the null hypothesis of valid additional moment conditions imposed by the system estimator. Besides, estimation with Arellano-Bond (1991) difference GMM does not change the inferences.

III – Deferred Taxes and Tax Cash Flow
78 © Astrid K. Chludek
case if there is no autocorrelation in the idiosyncratic errors. By construction, the residuals of
the differenced equation should exhibit first-order autocorrelation. Yet, if the assumption of
serial independence in the idiosyncratic errors is warranted, the differenced errors should not
exhibit second-order autocorrelation. Otherwise, second lags of the dependent variable are not
appropriate instruments and the instrument set has to be restricted to levels deeper than the
second lag (Arellano and Bond 1991, Roodman 2006).72 The results of the Arellano-Bond test
for zero autocorrelation show that the first-differenced errors of the models used in this study
are consistently negatively first-order autocorrelated, while the null hypothesis of no second-
order autocorrelation cannot be rejected.
The Hansen test of overidentifying restrictions tests the null hypothesis that the
instruments are jointly exogenous. Except for one model specification, the null cannot be
rejected. Thus, the instruments used are generally valid.73
72 The error term εit is composed of a fixed firm effect αi and the idiosyncratic error term uit (εit = αi + uit). The full error term εit is presumed to be autocorrelated because of the fixed effect. The idiosyncratic term uit is assumed to be independently and identically distributed (i.i.d.). First-differencing eliminates the fixed effect, leaving ∆εit = uit – uit-1. Since ∆εit-1 = uit-1 – uit-2, ∆εit and ∆εit-1, the residuals of the first-differenced equation, are mathematically related via the shared uit-1-term. Therefore, negative first-order serial correlation in the first-differenced errors is expected. But first-differenced errors are not second-order autocorrelated as long as the idiosyncratic errors uit are serially independent. 73 The Sargan test of overidentifying restrictions, not robust to heteroskedasticity but, in contrast to the Hansen test, not weakened by many instruments, leads to qualitatively identical results.

III – Deferred Taxes and Tax Cash Flow
79 © Astrid K. Chludek
4. Empirical Evidence
4.1. Data and Sample Selection
Data are obtained from Compustat, except for the deferred tax data, which are hand-collected
from the firms’ 10-K SEC filings. Matches are validated by using firm name, fiscal year,
ticker code, total assets, and deferred tax balances if available on Compustat.
Deferred tax data are hand-collected because of two reasons: First, Compustat
provides deferred tax balances as they are disclosed on the balance sheet, i.e., amounts netted
by tax jurisdiction, so that 15.72 (25.91) percent of the provided DTA (DTL) equal zero as a
consequence of netting. Furthermore, annual amounts can change only due to netting,
distorting the development of deferred taxes and the empirical analysis. Second, the time
series provided by Compustat are rather incomplete. While complete deferred tax data,
covering the total observation period of 16 years, are only available for 200 of the 500 sample
firms, hand-collecting provides complete time series for 359 of the 500 firms.
Hand-collected data, yet, has the drawback that sample size is limited. Therefore, I
conduct the analyses using data of the S&P 500 firms.74 Replicating the economy’s sector
composition of companies with market cap in excess of $3.5 billion, the S&P 500’s sector-
balanced composition facilitates industry-specific analysis and offers the advantage that sector
effects reflected in the empirical results replicate sector effects as present in the total
economy.
Since SFAS No. 109 (ASC 740, according to FASB’s new codification system), in
effect since 1992, modified and extended the requirements for deferred tax accounting and
disclosures considerably, I allow a time lag of two years for firms to adapt to the modified
accounting requirements. The observation period covers therefore fiscal years 1994 to 2009.
Table III.2 Panel A summarizes the sample selection procedure. Starting from a sample of
500 firms and 7985 firm-year observations over fiscal years 1994 to 2009, I lose 606
observations either due to missing deferred tax disclosures or due to only net deferred tax
balances being disclosed.75 Furthermore, I exclude 356 observations with pre-merger data or
lacking match validation. All in all, gross deferred tax data are available for 474 firms and
7023 firm-year observations.
74 Studies analyzing the value relevance of deferred taxes use generally similar data by using data of Fortune 500 firms (Amir et al., 1997, Raedy et al., 2011) and large Industrial firms listed on NYSE and AMEX (Ayers, 1998). 75 The reasons for missing deferred tax disclosures are lacking materiality of deferred taxes or income-tax exempt operations. Among others, 12 real estate investment trusts (GICS 40401010) are dropped from the sample.

III – Deferred Taxes and Tax Cash Flow
80 © Astrid K. Chludek
Table III.2 - Sample
Panel A: Sample Selection
firms observations
S&P 500, years 1994-2009 500 7985
gross deferred tax data not available (14) (606)
excluded: pre-merger data or lacking match validation (12) (356)
Observations with available gross deferred tax data 474 7023
missing variable data for estimation of the basic model (20) (881)
lost due to inclusion of lagged variables (5) (798)
excluded: 1st and 99th percentile of dependent variable, 99th percentile of deferred tax variables
(288)
excluded: observations with an R-student statistic of larger than |3|
(100)
Observations for basic regression analysis 449 4956
missing variable data for extended model (1) (29)
Observations for extended model estimation 448 4927
Panel B: Sector Composition
GICS code % of observations observations (firms)
Energy 10 8.91 439 (38)
Materials 15 6.43 317 (30)
Industrials 20 13.68 674 (57)
Consumer Discretionary 25 17.54 864 (76)
Consumer Staples 30 9.74 480 (39)
Health Care 35 11.61 572 (51)
Financials 40 8.12 400 (43)
Information Technology 45 15.59 768 (73)
Telecommunication Services 50 1.56 77 (9)
Utilities 55 6.82 336 (32)
Total 100% 4927 (448)

III – Deferred Taxes and Tax Cash Flow
81 © Astrid K. Chludek
The number of available observations for the regression and forecasting analyses is
further reduced due to missing variable data and inclusion of lagged variables in the models.
The dependent variable is truncated at 1st and 99th percentile and the deferred tax variables,
being naturally truncated at zero, are truncated at 99th percentile of their respective
distributions to minimize the effect of outliers on the inferences (288 observations).
Additionally, observations with an absolute value of the R-student statistic of larger than 3 are
excluded (100 observations),76 so that the basic regression and forecasting analyses are based
on 4956 firm-year observations across 449 firms.
Table III.2 Panel B displays the sector composition of the sample, showing that
firms and observations are distributed quite evenly on industries; only one sector
(Telecommunication Services) is underrepresented with 77 observations and no sector
features more than 864 observations for the main analysis.
4.2. Descriptive Statistics
Table III.3 Panel A presents descriptive statistics of the regression variables. In line with the
findings by Lisowsky (2009), mean as well as median current tax expense exceed cash taxes
paid, indicating that, in a multivariate setting, the coefficient of current tax expense
(curr_tax_exp) should be less than 1. Moreover, mean and median total tax expense
(significantly) exceed both, cash taxes paid and current tax expense, implying considerable
permanent differences as well as non-reversing temporary differences.
DTA (DTL) represent 4.83 (5.86) percent of total assets on average. While mean DTA
are quite homogenous across industries, mean DTL are more diverse. Particularly PPE-
intensive sectors like Energy, Telecommunication Services, and Utilities feature significantly
larger mean DTL balances (Figure III.1), which is consistent with DTL largely arising from
book-tax depreciation differences in PPE.
76 Inferences are basically unchanged if these observations are included.

III – Deferred Taxes and Tax Cash Flow
82 © Astrid K. Chludek
Table III.3 – Descriptive Statistics
Panel A: Descriptive Statistics
mean median std. dev. min max obs.
tax_paid 0.0266 0.0206 0.0239 -0.0106 0.1285 4956 curr_tax_exp 0.0304 0.0245 0.0271 -0.0770 0.1657 4956
tot_tax_exp 0.0315 0.0280 0.0298 -0.2889 0.4386 4956
DTA 0.0483 0.0415 0.0335 0 0.2098 4956
DTL 0.0586 0.0420 0.0526 0 0.2599 4956
∆tax_payable 0.0004 0 0.0090 -0.0942 0.0827 4956
PI 0.0867 0.0864 0.1547 -5.7760 0.5337 4927 CF 0.1102 0.1065 0.0827 -2.4167 0.4803 4927
∆sales_pos 0.7749 1 0.4177 0 1 4927
capex 0.0542 0.0403 0.0542 0 0.7362 4927
ESO_exp 0.0086 0.0025 0.0230 0 0.2969 4927
R&D_exp 0.0420 0 0.2484 0 15.4902 4927
AD_exp 0.0128 0 0.0285 0 0.2763 4927
lev 0.2401 0.2265 0.1700 0 0.9888 4927
ln(MV) 8.9936 8.9336 1.3545 3.1669 13.0417 4927
ln(TA) 8.9309 8.8394 1.4481 2.4789 14.5983 4927
FO 0.6359 1 0.4812 0 1 4927
TLC 0.6627 1 0.4728 0 1 4927
cashETR 0.2418 1 0.2446 0 0.9721 4525
Variable definitions are given in Table III.1.
Panel B: Pairwise Correlation Coefficients
tax_paid curr_tax_exp L1.curr_tax ∆tax_payable L1.DTA L1.DTL L2.DTA
tax_paid
curr_tax_exp 0.889
L1.curr_tax_exp 0.814 0.805
∆tax_payable -0.095 0.166 -0.012
L1.DTA -0.005 -0.001 0.012 -0.009
L1.DTL -0.164 -0.198 -0.218 -0.001 0.103
L2.DTA 0.012 0.020 0.001 0.011 0.851 0.108
L2.DTL -0.148 -0.189 -0.201 -0.008 0.089 0.946 0.133
Based on 4956 observations. Coefficients significant at 5 percent level are in bold face. Variable definitions are given in Table III.1.

III – Deferred Taxes and Tax Cash Flow
83 © Astrid K. Chludek
Figure III.1 – Average Deferred Taxes relative to Total Assets by Sector
The exceptionally long-time series of deferred tax data available for this study allow
an investigation of the short- as well as long-term development of deferred tax balances.
Regarding the long-term development of deferred tax balances, analysis reveals that 92.1
(87.0) percent of the DTA (DTL) balances increase over a 13-year horizon. This confirms the
core proposition of the equity view, postulating a continuous deferral of deferred tax related
cash flows. Growth of deferred tax balances, however, is not consistently linked to firm
growth: While mean and median of deferred taxes relative to total assets increase over time,
36.3 (41.1) percent of the observations exhibit a decreasing DTA (DTL) to total assets ratio
over the 13-year horizon.
Displaying annual changes in deferred tax balances, Panel A and B of Figure III.277
show that – consistent with in the long-run increasing balances – the majority of annual
changes in deferred tax balances are positive. Yet, there is, in fact, a considerable rate of
reversal present on an annual basis, with 34.41 (32.58) percent of annual changes in DTA
(DTL) being negative. Annual reversals are rather small, though, with nearly 50 percent
of annual
Figure III.2 – Annual Changes in Deferred Taxes
77 The Figure 2, Panel A and B, are based on 6735 observations. Graphs are truncated at 100% (6.84 percent [7.81] of annual changes in deferred tax assets [deferred tax liabilities] are larger than 100%). Interval length: 5 percentage points. Blue line: Normal distribution based on mean and standard deviation of the distribution of annual changes.
0
0,02
0,04
0,06
0,08
0,1
0,12
0,14
0,16
DTA
DTL

III – Deferred Taxes and Tax Cash Flow
84 © Astrid K. Chludek
Panel A: Annual Change in Deferred Tax Assets
Panel B: Annual Change in Deferred Tax Liabilities
reductions being smaller than 10 percent. The annual oscillation in the balances is presumably
caused by normal variation in operating activities and accrual reversals.
0
5
10
15
-100 -50 0 50 100
annual percent change in deferred tax liabilities (%)
per
cen
t o
f obse
rvat
ions
(%)
0
5
10
15
-100 -50 0 50 100
annual percent change in deferred tax assets (%)
per
cen
t o
f obse
rvat
ions
(%)

III – Deferred Taxes and Tax Cash Flow
85 © Astrid K. Chludek
With regards to sector differences in reversal rates, descriptive statistics reveal that
frequency as well as average magnitude of reversal is quite homogenous across sectors. While
the sectors Consumer Discretionary, Information Technology, and Telecommunication
Services show a higher percentage of reversing deferred tax balances as well as a higher
average reduction in the accounts, Energy and Industrial firms show reversal rates that are
significantly below average.
Pairwise correlation coefficients are presented in Panel B of Table III.3. The
correlation coefficient between cash taxes paid and current tax expense is 0.889. Hence,
current tax expense approximates actual tax payments very well, suggesting that curr_tax_exp
should be the main explanator of tax_paid in the multivariate setting. High correlation
coefficients between lagged values of deferred taxes confirm high persistence in deferred tax
balances. Moreover, significantly positive correlation between DTA and DTL confirm that
DTA and DTL develop synchronously to a certain extent.78
4.3. Regression Results
4.3.1. Regression Results - Pooled Sample
Estimation results based on the pooled sample are presented in Table III.4 (basic model) and
Table 5 (extended model). The basic model has considerable explanatory power with an
adjusted R-squared of 0.8641 if deferred tax variables are excluded and of 0.8653 if deferred
tax variables are included (Table III.4 Models (2) and (3)). Thereby, variation in current tax
expense alone explains the major share of variation in cash taxes paid (adjusted R-squared of
0.8175, see Model (1)). Moreover, the dynamic versions of the basic model, including one to
two lags of the dependent variable as explanatory variables, reveal that time-series
information on tax cash flow does not add incremental information beyond current tax
expense, leaving past tax cash flow insignificant as soon as current tax expense is controlled
for (Table III.4 Models (7) and (8)). According to the regression results, every reported dollar
of current tax expense corresponds to approximately $0.65 paid in taxes.79
78 One reason for synchronous development is that the probably realizable (and, therefore, recognized) amount of DTA depends positively on the amount of existing DTL (see ASC 740-10-30-18 (formerly SFAS No. 109, para. 21) and Behn et al., 1998, for empirical evidence). 79 The findings are highly consistent with findings reported by Lisowsky (2009), who reports an adjusted R-squared of 0.88 and a highly significant coefficient estimate of current tax expense of 0.727 for his model, explaining the actual tax liability as reported on the tax return.

© Astrid K. Chludek
Table III.4 – Regression Results – Basic Model
predicted
sign (1) (2) (3) (4) (5) (6) (7) (8)
constant 0.0015*** (4.25)
0.0049*** (5.08)
0.0047*** (4.44)
0.0064*** (3.72)
0.0045*** (4.17)
0.0005 (0.59)
-0.0001 (-0.02)
-0.0042 (-0.22)
L1.tax_paid +
0.0436 (1.58)
0.5042*** (11.32)
L2.tax_paid +
0.0991*** (3.57)
curr_tax_exp + 0.5857*** (33.55)
0.6496*** (34.71)
0.6482*** (34.91)
0.6426*** (33.36)
0.6393*** (32.50)
0.6395*** (30.87)
0.6548*** (30.32)
L1.curr_tax_exp + 0.2417*** (15.92)
0.1416*** (8.66)
0.1416*** (8.58)
0.1457*** (8.48)
0.1418*** (7.64)
0.2081*** (8.67)
0.1149*** (4.88)
∆tax_payable - -0.5554*** (-21.19)
-0.5552*** (-21.23)
-0.5551*** (-20.57)
-0.5407*** (-20.46)
-0.6387*** (-17.36)
-0.5776*** (-18.06)
-0.4384*** (-13.93)
L1.DTA -
-0.0194** (-2.17)
-0.0195** (-2.03)
-0.0161* (-1.93)
-0.0367** (-2.45)
-0.0322*** (-2.75)
-0.0559*** (-2.81)
L1.DTL +
-0.0092 (-1.15)
-0.0093 (-1.05)
-0.0076 (-0.95)
0.0046 (0.45)
0.0114 (1.35)
0.0243 (1.35)
L2.DTA -
0.0029 (0.35)
0.0036 (0.41)
-0.0135* (-1.67)
-0.0117 (-0.89)
-0.0071 (-0.53)
0.0132 (0.77)
L2.DTL +
0.0258*** (3.03)
0.0236** (2.42)
0.0158** (2.38)
0.0462*** (4.72)
0.0273*** (3.06)
0.0538*** (3.32)
adj. R² 0.8175 0.8641 0.8653 0.8514 0.7252 0.4800
adj. R² excl. DT a 0.8641 0.8498 0.7244 0.4763
F-test b 4.48*** 3.13** 4.49*** 9.58*** 26.65*** 25.06***
86
III – D
eferred T
axes an
d T
ax C
ash F
low

© Astrid K. Chludek
Table III.4 – Regression Results – Basic Model (continued)
(1) (2) (3) (4) (5) (6) (7) (8)
# IV 156 154
AR(1) c -9.83*** -8.13***
AR(2) d -0.82 -1.52
Hansen test e (p-value)
110.00 (0.69)
136.68 (0.11)
obs./cross-sections
4956 / 449 4956 / 449 4956 / 449 4216 / 374 4486 / 445 4396 / 443 4891 / 448 4945 / 448
fixed effects none
firm- and year-fixed effects
firm- and year-fixed effects
firm- and year-fixed effects
firm- and year-fixed effects
sector- and year-fixed effects
sector- and year-fixed effects
sector- and year-fixed effects
***, **, and * indicate significance at 0.01, 0.05, and 0.1 level, respectively. Dependent variable is tax_paid. See Table III.1 for variable definitions. The prefix Li. denotes that the variable is lagged by i periods. Model (4) excludes Financials and Utilities (GISC 40 and 55). Model (5) uses changes in deferred taxes instead of levels. Model (6) uses first differences of the variables instead of levels. For Models (1) to (6), t-statistics calculated using Huber-White robust standard errors clustered at firm level are reported in parentheses. Models (7) and (8) are estimated using two-step system GMM with z-statistics, calculated using Windmeijer-corrected robust standard errors, reported in parentheses. a Adjusted R² of model excluding deferred tax variables. b F-test of joint significance of the deferred tax variables. c The Arellano-Bond test tests the null hypothesis of no first-order autocorrelation in first-differenced errors. dThe Arellano-Bond test tests the null hypothesis of no second-order autocorrelation in first-differenced errors. e The Hansen test tests the null hypothesis that the instruments are jointly exogenous.
87
III – D
eferred T
axes an
d T
ax C
ash F
low

III – Deferred Taxes and Tax Cash Flow
88 © Astrid K. Chludek
Table III.5 – Regression Results – Extended Model
(1) (2) (3) (4) (5) (6)
tax_paidt+n +0 +1 +2 +3 +4 +5
constant 0.0140***
(4.66) 0.0134***
(3.45) 0.0027 (0.50)
0.0251*** (4.21)
0.0052 (0.83)
0.0132** (2.14)
curr_tax_exp + 0.6522*** (31.94)
0.4178*** (13.00)
0.2062*** (8.51)
0.0574** (2.54)
-0.0045 (-0.21)
0.0114 (0.57)
L1.curr_tax_
exp
+ 0.1478*** (8.42)
0.0204 (1.09)
-0.0274 (-1.45)
-0.0025 (-0.12)
-0.0033 (-0.16)
-0.0241 (-1.45)
∆tax_payable - -0.5497*** (-21.50)
-0.1457*** (-3.94)
-0.0457 (-1.64)
0.027 (0.92)
0.0305 (1.04)
-0.0113 (-0.32)
DTA - -0.0561*** (-4.31)
-0.0477*** (-3.23)
-0.0198 (-0.99)
-0.0081 (-0.44)
-0.0125 (-0.69)
DTL + -0.0148 (-1.20)
0.0273* (1.76)
0.0084 (0.51)
0.0024 (0.13)
0.0099 (0.48)
L1.DTA - -0.02139** (-2.44)
0.0208 (1.53)
0.0301* (1.67)
0.0149 (0.99)
0.0124 (0.82)
0.0221 (1.29)
L1.DTL + -0.0049 (-0.62)
0.0232** (2.06)
-0.0211 (-1.24)
-0.0141 (-0.94)
-0.0046 (-0.26)
-0.0062 (-0.37)
L2.DTA - 0.0050 (0.61)
L2.DTL + 0.0257*** (3.19)
PI + -0.0001 (-0.06)
-0.0013 (-0.80)
-0.0013 (-0.74)
-0.0015 (-0.97)
0.0009 (0.57)
0.0030* (1.85)
CF + -0.0030 (-0.69)
0.0238*** (4.29)
0.0329*** (3.50)
0.0249*** (3.49)
0.0189*** (2.74)
0.0010 (0.15)
∆sales_pos + -0.0006 (-1.38)
0.0003 (0.59)
0.0010* (1.74)
0.0015** (2.16)
0.0016** (2.50)
0.0006 (0.94)
capex ? 0.0035 (0.68)
-0.0323*** (-4.73)
-0.0329*** (-3.50)
-0.0242*** (-2.80)
-0.0127 (-1.29)
-0.0072 (-0.87)
ESO_exp - -0.0226 (-1.18)
-0.0518* (-1.79)
-0.0570* (-1.77)
-0.0551* (-1.70)
-0.0652** (-2.03)
-0.0350 (-1.14)
R&D_exp - 0.0120 (1.45)
0.0298*** (3.15)
0.0403*** (3.15)
0.0383*** (2.80)
0.0260** (2.18)
-0.0054 (-0.42)
AD_exp + 0.0321** (2.23)
-0.0047 (-0.21)
0.0118 (0.42)
0.0041 (0.15)
0.0240 (0.65)
0.0124 (0.29)
lev - -0.0025 (-1.27)
-0.0028 (-1.05)
0.0002 (0.07)
0.0009 (0.22)
0.0072 (1.62)
0.0076 (1.57)
size ? -0.0012*** (-3.88)
0.0007** (2.16)
0.0018*** (3.46)
0.0013** (2.44)
0.0011** (2.05)
0.0005 (0.92)

III – Deferred Taxes and Tax Cash Flow
89 © Astrid K. Chludek
Table III.5 – Regression Results – Extended Model (continued)
(1) (2) (3) (4) (5) (6)
tax_paidt+n +0 +1 +2 +3 +4 +5
FO - 0.0001 (0.14)
-0.0005 (-0.42)
-0.0004 (-0.28)
0.0007 (0.45)
0.0001 (0.08)
0.0011 (0.57)
TLC - 0.0009* (1.94)
0.0009 (1.20)
-0.0003 (-0.27)
-0.0003 (-0.25)
0.0006 (0.51)
0.0009 (0.86)
obs./cross-sections
4927 / 448 4923 / 448 4521 / 448 4122 / 440 3731 / 438 3345 / 428
adj. R²
0.8711 0.6994 0.5533 0.4721 0.1074 0.1107
adj. R² excl. DT a
0.8706 0.6981 0.5519
F-test b 5.26*** 6.83*** 2.99** 0.50 0.18 0.46
***, **, and * indicate significance at 0.01, 0.05, and 0.1 level, respectively. Dependent variable is current tax_paid (Model (1)) and tax_paid of one (+1) to five (+5) periods ahead (Models (2) to (6)), respectively. Variable definitions are given in Table III.1. The prefix Li. denotes that the variable is lagged by i periods. All models include firm- and year-fixed effects. t-statistics calculated using Huber-White robust standard errors clustered at firm level are reported in parentheses. a Adjusted R² of model excluding deferred tax variables. b F-test of joint significance of the deferred tax variables.
The deferred tax variables show the expected coefficient signs across all model
specifications. Consistent with the tax effect, the coefficient of DTA lagged by one period
(L1.DTA) is significantly negative, in line with deferred tax benefits reducing future tax
payments, and the coefficient of DTL lagged by two periods (L2.DTL) is significantly
positive, in line with deferred tax liabilities increasing future tax payments. F-tests confirm
joint significance of the deferred tax variables across all model specifications. Deferred tax
variables lagged by more than two periods are insignificant, though. The results are
unaffected by excluding Financials and Utilities (GISC 40 and 55) from the sample (Table
III.4 Model (4)), by examining changes in deferred taxes (Table III.4 Model (5)), by using
first-differenced variables instead of levels (Table III.4 Model (6)), by using a dynamic model
specification (Table III.4 Models (7) and (8)), and by including additional control variables
into the model (Table III.5 Model (1)).
The estimated coefficients of the control variables generally show the expected signs.
While income (persistence) effects are fully captured by current tax expense, operating cash
flow (CF) is incrementally useful to explain future tax payments, with more profitable firms,
i.e., firms with higher operating cash flow exhibiting c.p. higher tax payments for the next

III – Deferred Taxes and Tax Cash Flow
90 © Astrid K. Chludek
four periods. Furthermore, growing sales (∆sales_pos) also imply c.p. higher tax payments for
the next years. Capital expenditure (capex) is significantly negatively related to future tax
payments, indicating that (tax reducing) investment credits and accelerated tax depreciation
effects dominate (tax increasing) growth effects. Implied stock option expense (ESO_exp) is,
as expected, negatively related to future tax payments, accounting for tax deductions
occurring when respective non-qualified stock options are exercised. In contrast to
expectations, R&D expense (R&D_exp) is positively related to future tax payments, possibly
also capturing growth effects. Moreover, advertising expense (AD_exp) is positively related to
current tax payments as suggested by Dyreng et al. (2008). Reflecting the divergent results
with respect to the effect of firm size on tax burden, size is negatively related to current cash
taxes paid, while it is positively related to future cash taxes paid. I do not find significant
effects of leverage (lev), foreign operations (FO), or the presence of tax loss carryforwards
(TLC).80
The core purpose of inter-temporal tax allocation is to inform about future tax
payments and tax benefits. Therefore, the inclusion of deferred tax information should
improve the explanatory power and forecasting ability of a model explaining (future) tax cash
flow. Although deferred tax balance information is indeed significantly related to actual tax
cash flow, the increase in explanatory power of the models due to deferred tax inclusion is
rather negligible: Inclusion of deferred tax information leads to an increase in explanatory
power of only 0.05 to 0.37 percentage points.81 Hence, the benefit of deferred tax information
consideration is considerably low in statistical terms.
Therefore, I additionally try to assess the economic significance of deferred tax-related
cash flow. According to the regression results, every additional dollar of DTA results in a tax
benefit of approximately 1.61 to 3.67 cents in the next year, while every additional dollar of
DTL will translate into additional tax payments of approximately 1.58 to 4.62 cents within the
next two years, assuming constant total assets. Since almost all of the estimated deferred tax
coefficients are not significantly different from 0.02 in absolute values, this implies that
roughly 2 percent of the disclosed deferred tax balances translate into actual tax cash flow
within the next two years.
80 Since lev exhibits relatively low within-firm variation, its effect on future tax cash flow is probably included in current tax expense and the firm-fixed effects. Likewise, exhibiting low within-firm variation, the effects of FO and TLC may also be captured by firm-fixed effects. Moreover, indicator variables might be a very imprecise measure to control for multinational activity and the effects of tax loss carryforwards. If I use instead the percentage of foreign to total pre-tax income and changes in the total amount of tax loss carryforwards, respectively, inferences with respect to deferred tax effects are unchanged. 81 Reported differences in R-squareds are significantly different from zero at 10 percent level at least.

III – Deferred Taxes and Tax Cash Flow
91 © Astrid K. Chludek
However, since DTA and DTL coefficients are not significantly different from each
other in all of the specifications and since DTA and DTL tend to develop synchronously, the
net effect on cash taxes paid is smaller. Multiplying absolute values of netted deferred tax
balances by 0.02 gives an estimated median deferred tax cash flow of $3.64 million, which is
opposed to median cash taxes paid of $110 million. Relating the estimated net effect of
deferred taxes to cash taxes before estimated deferred tax cash flow results for 50 (65) percent
of the observations in an estimated net effect of deferred taxes on actual cash taxes paid of
less than 3 (6) percent.82 Hence, estimated net effects of deferred taxes on actual tax
payments are small for the majority of firms.
4.3.2. Regression Results - By Industry
I additionally estimate the models separately by industry because of possible industry-specific
tax incentives and reporting practices. On the one hand, Dyreng et al. (2008) report some
evidence of industry effects in cash effective tax rates and, on the other hand, deferred tax
cash flow might be industry-specific, too, since book-tax differences and reversal behavior are
likely to vary by industry as a consequence of industry-specific production and operating
cycles, asset compositions, tax rules, and accounting conventions (Dyreng et al., 2010).
For parsimony, only the industry-specific coefficient estimates of the deferred tax
variables are displayed in Table III.6.83 The model explains tax cash flow well for each
industry, with adjusted R-squareds ranging from 0.6581 to 0.8973. Deferred tax information
is relevant (as indicated by F-tests of joint significance at a significance level of 5 percent) for
explaining variation in cash taxes paid for four of the ten sectors (Industrials, Health Care,
Financials, and Telecommunication Services). Coefficient estimates show generally the
expected signs. Only two sectors (Consumer Staples and Health Care) show coefficient
estimates of single deferred tax variables that are significant at 5 percent level or better.
Deferred tax information lagged by more than two periods is only significant for Financials.
Similar to the results based on pooled estimation, the increase in explanatory power due to
deferred tax information inclusion ranges from low 0.13 to 0.81 percentage points.
82 Specifically, I calculate (0.02*(|L1.DTA-L2.DTL|))/(|tax_paid + 0.02*(L1.DTA-L2.DTL)|). 83 Firms are classified into sectors according to S&P’s Global Industry Classification Standard (GICS). Classifying by the North American Industry Classification System (NAICS) does not lead to substantially different results for similar industries.

© Astrid K. Chludek
Table III.6 – Regression Results – By Industry
Energy Materials Industrials Consumer
Discretionary
Consumer
Staples Health Care Financials
Information
Technology
Telecom.
Services Utilities
L1.DTA
(-) -0.0140 (-1.21)
0.0087 (0.51)
-0.0531* (-1.96)
0.0563* (1.67)
-0.0965** (-2.68)
-0.0504 (-1.33)
0.0107 (0.39)
-0.0301* (-1.87)
0.0144 (0.32)
-0.0136 (-0.79)
L1.DTL
(+) 0.0033 (0.26)
-0.0222 (-0.98)
-0.0153 (-0.82)
-0.0446 (-1.30)
0.0374 (1.59)
0.0077 (0.29)
-0.0017 (-0.11)
0.0225 (1.00)
-0.0603* (-2.15)
-0.0106 (-0.45)
L2.DTA
(-) 0.0060 (0.50)
-0.0001 (-0.01)
0.0196 (0.75)
-0.0579* (-1.98)
0.0436 (1.46)
-0.0148 (-0.46)
-0.0019 (-0.05)
0.0220 (1.57)
0.0339 (0.68)
-0.0059 (-0.33)
L2.DTL
(+) 0.0064 (0.55)
0.0421* (1.77)
0.0168 (0.89)
0.0450 (1.48)
0.0148 (0.06)
0.0489** (2.09)
0.0379* (1.85)
0.0141 (0.59)
0.0156 (0.36)
0.0304 (1.23)
obs./cross-sections
439 / 38 317 / 30 674 / 57 864 / 76 480 / 39 572 / 51 400 / 43 768 / 73 77 / 9 336 / 32
adj. R² 0.8973 0.8607 0.7864 0.6956 0.6581 0.7708 0.7608 0.7291 0.7005 0.7905
adj. R² excl. DT a 0.7836 0.6500 0.7649 0.7578 0.7278 0.6991
F-test b 0.59 0.99 3.29** 1.10 2.59* 5.02*** 4.03** 2.24* 6.75** 1.13
***, **, and * indicate significance at 0.01, 0.05, and 0.1 level, respectively. Variable definitions are given in Table III.1. The prefix Li. denotes that the variable is lagged by i periods. Estimations
are based on the extended model (including firm- and year-fixed effects), but for parsimony only the estimation results with respect to deferred tax information are presented. t-statistics calculated
using Huber-White robust standard errors clustered at firm level are reported in parentheses. a Adjusted R² of model excluding deferred tax variables. b F-test of joint significance of the deferred tax variables.
92
III – D
eferred T
axes an
d T
ax C
ash F
low

III – Deferred Taxes and Tax Cash Flow
93 © Astrid K. Chludek
4.3.3. Regression Results - By Firm
Since the development of deferred taxes and tax cash flow may be very firm-specific, I
additionally estimate the basic model by firm.84 While for 67.25 percent of the firms all
deferred tax coefficients are insignificant, 25.73 percent (21.05 percent) of the firms exhibit
DTA (DTL) coefficients that are significantly different from zero at 5 percent level.85
The sector distribution of significant deferred tax coefficients confirms that DTA are,
in general, of higher cash flow relevance than DTL: Within each sector, a higher percentage
of firms exhibit significant DTA-coefficients than DTL-coefficients. In particular for Financial
and Utility firms, primarily DTA are cash flow-relevant, which might be due to specific
regulation requirements. Moreover, while deferred taxes are significantly related to actual tax
cash flow for about 30 percent of Industrial, IT, and Telecommunication Services firms,
virtually no Energy firm shows significant deferred tax coefficients. Likewise, firms in the
Consumer Staples sector show substantially less than the average percentage of significant
deferred tax coefficient estimates (see Table III.7).
Table III.7 – Sector Distribution of Significant Deferred Tax Coefficients
of Firm-Specific Regressions
Sector Percent (%) of firms with significant a
DTA-coefficients DTL-coefficients
Energy 13.33 3.33
Materials 28.57 23.81
Industrials 29.17 29.17
Consumer Discretionary 20.00 20.00
Consumer Staples 17.65 11.76
Health Care 22.50 22.50
Financials 40.74 14.81
Information Technology 28.30 28.30
Telecommunication Services 33.33 33.33
Utilities 39.13 26.09
Total 25.73 21.05
a Significance at 5 percent level.
84 For most of the firm-specific regressions, error terms are not autocorrelated. In case of detected autocorrelation, Newey-West standard errors are employed. 85 34.21 percent (31.58 percent) of the firms show DTA (DTL) coefficient estimates that are significant at 10 percent level, while for 54.39 percent of the firms deferred tax information is insignificant at this level of significance.

III – Deferred Taxes and Tax Cash Flow
94 © Astrid K. Chludek
With regard to other firm characteristics, firms with significant deferred tax
information tend to be underperformers in terms of showing, on average, less growth (of
sales, operating cash flow, and total assets), lower ROA, and significantly less multinational
activity (as measured by percent of foreign to total pre-tax income) as compared to the total
sample. Yet, these firms do not show a higher amount of reversal – neither in terms of
frequency of reversals nor in terms of average magnitude of reversal – in deferred tax
balances.
In sum, the regression results show that deferred taxes have indeed timely tax cash flow
implications. Yet, inclusion of deferred tax information increases explanatory power only to a
very small extent, and is only significant for 32.75 percent of the sample firms. Besides, firm-
as well as industry-specific estimation results suggest that deferred tax information is
particularly not useful for firms belonging to the Energy sector, while it is more informative
for Industrial, Financial, IT, or Telecommunication Services firms. To better assess the
usefulness of deferred tax information with respect to future tax cash flow, I analyze in the
following section whether inclusion of deferred tax information decreases forecast error of
forecasting tax cash flow up to five periods ahead.

III – Deferred Taxes and Tax Cash Flow
95 © Astrid K. Chludek
5. Forecast Analysis
The model used for forecasting is established based on the regression results of the preceding
section. In particular, using the extended model for forecasting purposes as opposed to the
basic model results in lower MAPE and RMSE. Hence, incorporation of additional variables
does increase the forecast accuracy of the model.
Forecast model:86
(3) tax_paidit+n = ß0 + ß1*curr_tax_expit + ß2*curr_tax_expit-1 + ß3*DTAit + ß4*DTLit +
ß5*DTAit-1 + ß6*DTLit-1 + ß7*CFit + ß8*∆sales_posit + ß9*capexit +
ß10*ESO_expit + ß11*R&D_expit + ß12*sizeit + ∑ � * Yeark + εit ,
n = 1, …, 5
One-period-ahead forecasts are obtained by using the first 11 observation years (1994
to 2004) to generate predictions of cash taxes paid for fiscal year 2005. Next, the model is
subsequently re-estimated by adding 2005-data to generate one-year-ahead predictions for
2006, and so forth. Likewise, two-year-ahead forecasts are obtained by first using data of
fiscal years 1994 to 2003 to generate two-year-ahead predictions of cash taxes paid for fiscal
year 2005. Subsequently, 2004-data is added to generate 2006-predictions. This procedure is
repeated until the end of the sample and for predictions up to five periods ahead. Firm-
specific forecasts are only computed for up to three periods ahead in order to have sufficient
observations per firm for model estimation.
Three error metrics are employed to compare the predictive ability of the model
including versus excluding deferred tax information: mean absolute percentage error (MAPE),
root mean squared error (RMSE), and the difference in absolute forecast errors (rank tests).87
Analysis of forecast errors shows that, in general, estimated cash taxes paid slightly
tend to overstate actual cash taxes paid, which is in line with current tax expense generally
overstating actual tax payments and the model not capturing all tax deductions and permanent
differences (see also Lisowsky, 2009).
86 For forecasts based on the pooled sample, industry controls are additionally employed. The model used for by-firm forecasts excludes the variables ESO_exp, R&D_exp, and size because exclusion improves the average forecast accuracy of the model on a by-firm basis and increases degrees of freedom. 87
MAPE is computed as the mean of the absolute value of the forecast error relative to the realized cash taxes
paid to total assets. RMSE is computed as root of the mean of squared forecast errors. MAPE of larger than 100% are truncated to 100%.

© Astrid K. Chludek
Table III.8 – Forecast Analysis
Panel A: Pooled Sample
obs. MAPE RMSE Rank Percent (%) change in forecast
errora
excl. DT incl. DT excl. DT incl. DT excl. DT incl. DT mean median
+1 2045 0.4533*** 0.4657 0.0137 0.0139 1.4057*** 1.5943 2.42 5.48
+2 2015 0.5128*** 0.5179 0.0176 0.0175 1.3949*** 1.6051 2.25 3.82
+3 1978 0.5339 0.5334 0.0191 0.0185 1.5024 1.4976 -4.54 -5.22
+4 1926 0.5335 0.5321 0.0200 0.0191 1.4369*** 1.5631 -1.10 3.69
+5 1885 0.5357*** 0.5416 0.0206 0.0199 1.4804* 1.5196 -0.84 -0.38
Panel B: By Firm
obs. MAPE mean RMSEb Rank
excl. DT incl. DT excl. DT incl. DT excl. DT incl. DT
+1 1180 0.4687** 0.4901 0.0417*** 0.0761 1.4992 1.5008
+2 1136 0.5923*** 0.6889 0.0468*** 0.1005 1.3538*** 1.6462
+3 1071 0.5864*** 0.7088 0.0370*** 0.1015 1.3378*** 1.6622
MAPE and RMSE for tax cash flow forecasts of one (+1) to five (+5) periods ahead. ***, **, and *: MAPE/RMSE/rank of model including deferred tax information is significantly different from
MAPE/RMSE/rank of model excluding deferred tax information at 0.01, 0.05, and 0.1 level, respectively. MAPE of larger than 100% are truncated to 100%. a Percent change in forecast error due to deferred tax inclusion. Positive values imply increasing forecast error as a consequence of deferred tax inclusion. Changes are truncated at 100% for mean
computation to prevent scarce large changes driving mean results. If these deleted observations are included, mean is positive for all 5 forecast horizons. b Means of RMSE that are calculated by firm are displayed. Squared forecast errors of larger than 2 are excluded to reduce the influence of outliers (in total 17 of the observations: 1 (16) of the forecast errors based on the model excluding (including) deferred tax information.
96
III – D
eferred T
axes an
d T
ax C
ash F
low

III – Deferred Taxes and Tax Cash Flow
97 © Astrid K. Chludek
Table III.8 presents error metrics of forecasts based on the pooled sample (Panel A) as
well as of forecasts based on by-firm regressions (Panel B). The model captures less variation
with increasing forecast horizon, so that forecast errors increase in the forecast horizon.
MAPE and RMSE are either not significantly different or significantly smaller for the model
excluding deferred tax information. Hence, the model excluding deferred tax information
outperforms the model including deferred tax information in terms of average forecast
accuracy.
This is confirmed by the results of the rank tests, comparing absolute percentage errors
(this is, the absolute value of the forecast error relative to the realized cash taxes paid) of the
model including versus excluding deferred tax information. For each forecast, the model
yielding the smaller absolute percentage error (i.e., the better performing model in terms of
forecast accuracy) is given a rank of one and the remaining model is given a rank of two. The
average ranks of the models are displayed in Table III.8, showing that, likewise, excluding
deferred tax information results in either not significantly different or significantly lower
average rank.88 Hence, rank tests indicate that the model provides significantly more often the
more accurate forecast, if deferred tax information is not included in the model.
The right column of Table III.8 Panel A displays mean and median percent change in
forecast error due to deferred tax inclusion, showing that the mean (median) change in
forecast error is positive for two (three) of the five forecast horizons.89 Since positive values
imply that deferred tax inclusion increases forecast error, these results further support the
model exclusive of deferred tax information for forecasting purposes.
In line, inclusion of deferred tax information lowers forecast error for about 40 percent
of the forecasts. Regarding the subgroup of forecasts for which inclusion of deferred tax
information does indeed decrease forecast error, I find that the reduction in forecast error is
not material, i.e., less than 5 percent of forecast error, for about 20 percent of these forecasts,
and less than 10 percent for 75 percent of the reductions.
Results are highly consistent across error metrics if forecasts are generated based on
regressions estimated separately by sector. Consistent with the regression results presented in
the preceding section, inclusion of deferred tax information improves tax cash flow forecasts
of the sectors Industrials, Consumer Staples, IT, and Telecommunication Services, while the
industry-specific forecasting results suggest that deferred tax information is particularly not
88 Significance of difference in average ranks is assessed by using Friedman’s ANOVA rank test and Wilcoxon’s sum rank test. 89 Changes are truncated at 100% for mean computation to prevent scarce large changes driving mean results. If
these deleted observations are included, the means are positive for all 5 forecast horizons.

III – Deferred Taxes and Tax Cash Flow
98 © Astrid K. Chludek
useful for firms belonging to the Energy and Materials sector. Apart from industry, less
multinational activity, and marginally higher growth ratios, firms for which deferred tax
information reduces forecast error are not significantly different, on average, from firms for
which deferred tax inclusion does not reduce forecast error. Summarizing, there is only
limited evidence for consideration of deferred tax information reducing forecast error of
future tax cash flow forecasts. Moreover, observed reductions are rather small for their most
part.
III – Deferred Taxes and Tax Cash Flow
99
© Astrid K. Chludek
6. Robustness Tests and Supplemental Analyses
To ensure the robustness of the results, I conduct several additional tests. First, I drop
negative cash taxes paid from the sample (169 observations) because these might exhibit a
different behavior. Yet, results are qualitatively unchanged. Cash taxes paid likely do not only
include tax payments for the current year, but also tax payments settling tax issues of prior
years. Furthermore, they include the effects of tax loss carrybacks and carryforwards. To
account for tax effects of prior and future years and to smooth possibly very variable cash tax
payments, I employ different long-term metrics (sum and moving average of cash taxes paid
over three to five years) as dependent variable. The significance of deferred tax coefficients
generally decreases in these models. Yet, significant coefficient estimates show consistently
expected signs in accordance with the tax effect.
Second, current tax expense is incorporated into the dependent variable, i.e., the
difference in cash taxes paid less current tax expense is regressed on the change in income
taxes payable and deferred tax variables. This is done to analyze more directly the incremental
information in deferred tax balances to current tax expense in explaining cash taxes paid.
Again, inclusion of deferred tax information results in an increase in explanatory power of
only marginal 0.26 percentage points.
Third, I replicate the analysis excluding Financial companies as well as Utilities
(GSIC 40 and 55) because of their regulated nature, specific accounting and taxation rules.
Exclusion of these firms does not change the inferences.
Fourth, alternatively deflating by common shares outstanding does not affect the
results. Likewise, deflating the control variables of the extended model by either total assets,
sales, or pre-tax income does not affect the main inferences. Besides, MAPE and RMSE of
the deflated models are far lower than of a model using non-deflated variables, which
supports the choice of the deflated model.
Fifth, instead of deferred tax balance information, I include deferred tax expense in the
models. Consistent with findings reported by Lisowsky (2009), current tax expense performs
significantly better than total tax expense in explaining cash taxes paid. Moreover, current
deferred tax expense is insignificant, while deferred tax expense lagged by one and two
periods is significantly positively related to cash taxes paid. Yet, in line with the overall
results of this study, inclusion of lagged deferred tax expense adds only negligible 0.06
percent in explanatory power.
III – Deferred Taxes and Tax Cash Flow
100 © Astrid K. Chludek
Sixth, discretion exercised in the recognition of DTA does not distort the results. If I
adjust DTA for discretionary changes in the valuation allowance, using a model developed by
Frank and Rego (2006), to obtain “nondiscretionary” DTA, results are qualitatively
unchanged.90 In general, inclusion of the valuation allowance into a regression model
employing gross DTA (i.e., DTA before valuation allowance) instead of net DTA (i.e., DTA
after valuation allowance) increases the explanatory power of the model. The coefficient
estimates of the (lagged) valuation allowance variables are significantly positive (at 3 percent
level and better). Thus, the results (not tabulated) provide supportive evidence of the
usefulness of the “probability”-adjustment of DTA as it is required by ASC 740-10 (formerly
SFAS No. 109) in form of the valuation allowance, since the adjustment clearly increases the
informativeness of disclosed DTA. These findings indicate furthermore that the valuation
allowance is largely set in accordance with the expected utilizability of deferred tax benefits
and not extensively determined by discretion, e.g., earnings management purposes.91
Seventh, DTA recognized for tax loss carryforwards might have different, more direct
cash flow implications than other deferred tax components. This might be the case because
tax losses are not expected to persist, so that tax benefits from tax loss carryforwards should
be realizable rather timely. Decomposing DTA into DTA for tax loss carryforwards and other
DTA reveals that both components feature significant coefficient estimates that are not
significantly different from each other. Hence, DTA for tax loss carryforwards do not exhibit
a different cash flow behavior according to the results.
Eighth, coefficient estimates of current versus noncurrent deferred taxes are not
significantly different from each other. The break-down in current versus noncurrent deferred
taxes is insignificant for the respective cash flow implications, since classification as current
or noncurrent is based on the classification of the underlying asset or liability. Yet, the time to
reversal of the aggregate deferred taxes is largely independent of the maturity of the single
underlying positions. For example, inventory is a current item, but since inventory is
permanently replaced, the associated deferred tax component is persistent in the aggregate as
90 Frank and Rego (2006) develop a model to determine (non)discretionary changes in the valuation allowance. Specifically, the annual change in the valuation allowance is regressed on annual changes of DTA for tax loss carryforwards, other DTA, DTL, previous, current, and next year’s pre-tax income, and the market-to-book ratio. Variables are deflated by total assets and regressions are estimated by GICS sector. Fitted values of the model represent expected changes. These estimated (nondiscretionary) changes in the valuation allowance are added to previous year’s valuation allowance, which is subsequently subtracted from current gross DTA, obtaining DTA adjusted for discretion in recognition. 91 See Frank and Rego (2006) and Graham et al. (2011) for an overview of research on earnings management by means of the valuation allowance.

III – Deferred Taxes and Tax Cash Flow
101
© Astrid K. Chludek
long as the firm is maintaining its operating capacity, resulting in an effectively long-term
deferral and, therefore, noncurrent.
Ninth, I replicate the analysis using only non-growth observations, i.e., firm-year
observations featuring decreasing total assets. Since the sample firms are overall growing
firms, lacking relation of deferred taxes to cash taxes paid could be due to growth, i.e.,
lacking reversal. Although the sample firms are growing over the total observation period, a
substantial part of the firm-year observations (1178 observations) fall in the category of non-
growth. Regression results (not tabulated) show that deferred tax coefficients are insignificant
for non-growth observations, while they remain unchanged for growth firm-year observations.
Moreover, if the analysis is replicated exclusively based on recession years (which,
consistently, exhibit a considerably higher percentage of non-growth observations),
significance levels of the deferred tax coefficients decrease. Thus, low usefulness of deferred
tax information does not seem to be attributable to continuous growth.
Tenth, I deflate cash taxes paid by pre-tax income less special items, obtaining the
cash effective tax rate (CASH ETR), as it is introduced by Dyreng, Hanlon, and Maydew
(2008, abbreviated as DHM in the following). To be in line with DHM, I exclude
observations with negative nominator or denominator and CASH ETRs of greater than 1 (402
observations).
Estimation results of using CASH ETR as dependent variable are displayed in Table
III.9. In this case, the additional controls included in the extended version of the model add
considerably more to the explanatory power of the model (11.93 percentage points).92 The
unexpectedly negative coefficient estimates of operating cash flow (CF) and sales growth
(∆sales_pos) are attributable to operating cash flow and sales growth being more highly
correlated with pre-tax income, which is part of the denominator of the dependent variable,
than with the nominator, cash taxes paid. The positive relation of CF and ∆sales_pos to the
dependent variable’s denominator dominates, resulting in negative coefficient estimates.
Moreover, the significantly negative size coefficient confirms, in a multivariate setting,
DHM’s observation based on descriptive statistics that CASH ETR is inversely related to firm
size (Table III.9 Model (1)).
92 This is because the additional variables are useful to explain variation in pre-tax income. The independent variable PI (pre-tax income deflated by total assets) is omitted in these regressions, since the dependent variable is divided by pre-tax income less special items.

III – Deferred Taxes and Tax Cash Flow
102 © Astrid K. Chludek
Table III.9 – CASH ETR
predicted
sign static model dynamic model
cashETR ≤ 0.2
0.2 < cashETR
≤ 0.4
cashETR > 0.4
pooled pooled low mid high
(1) (2) (3) (4) (5)
constant 0.3722*** (7.54)
0.2512 (1.61)
0.3333* (1.66)
-0.5049 (-1.22)
0.2576 (0.21)
L1.cashETR +
0.0743** (2.53)
0.1589*** (2.83)
0.1008*** (3.93)
-0.0992 (-0.92)
curr_tax_exp + 2.0049*** (11.37)
1.8530*** (10.02)
2.8485*** (9.72)
1.7587*** (9.58)
1.1586* (1.87)
L1.curr_tax_exp + 0.5005*** (5.11)
0.3758*** (2.65)
1.4090*** (4.54)
0.0437 (0.24)
-1.0831* (-1.96)
∆tax_payable - -2.9463*** (-14.43)
-3.0266*** (-16.33)
-2.4743*** (-8.29)
-2.8876*** (-11.59)
-2.8016*** (-5.35)
L1.DTA - -0.4346*** (-4.23)
-0.5229*** (-3.30)
-0.3137 (-1.59)
-0.7956*** (-3.82)
-1.6110* (-1.85)
L1.DTL + -0.0600 (-0.59)
0.2591* (1.84)
0.1657 (0.72)
0.5321*** (2.87)
0.1742 (0.43)
L2.DTA - -0.0487 (-0.48)
-0.1523 (-1.07)
-0.1035 (-0.50)
0.0066 (0.04)
-0.8842 (-1.16)
L2.DTL + 0.3936*** (3.72)
0.3026** (2.57)
0.1890 (0.84)
0.3409* (1.75)
-0.2907 (-0.43)
CF + -0.4745*** (-10.01)
-0.4049*** (-6.58)
-0.4487*** (-4.62)
-0.3580*** (-5.31)
-0.5808** (-2.21)
∆sales_pos + -0.0205*** (-4.02)
-0.0215*** (-3.78)
-0.0037 (-0.46)
-0.0157** (-2.55)
-0.0472* (-1.78)
capex ? -0.0766** (-2.04)
0.0871* (1.67)
0.1168 (1.22)
0.0527 (1.02)
0.1363 (0.82)
ESO_exp - -0.2298 (-1.03)
0.2667 (0.72)
0.6134 (0.97)
-0.4820 (-0.46)
-3.9552 (-0.59)
R&D_exp - -0.0907 (-1.01)
-0.1084 (-0.92)
-0.1873 (-1.10)
-0.0465 (-0.34)
-1.1692 (-0.99)
AD_exp + 0.0161 (0.08)
-0.1169 (-0.31)
0.1555 (0.23)
0.4676 (1.34)
1.0642 (1.15)
lev - 0.0111 (0.56)
0.0264 (0.96)
0.0160 (0.29)
-0.0114 (-0.31)
-0.0754 (-0.46)
size ? -0.0156*** (-3.04)
-0.0073 (0.22)
-0.0029 (-0.60)
-0.0005 (-0.05)
-0.0477 (-1.07)

III – Deferred Taxes and Tax Cash Flow
103
© Astrid K. Chludek
Table III.9 – CASH ETR (continued)
predicted
sign static model
dynamic model
cashETR ≤ 0.2
0.2 < cashETR
≤ 0.4
cashETR > 0.4
pooled pooled low mid high
(1) (2) (3) (4) (5)
FO - 0.0202** (2.27)
-0.0002 (-0.02)
0.0176 (0.74)
-0.0062 (-0.58)
0.0714 (0.85)
TLC - 0.0108* (1.69)
0.0078 (0.97)
0.0058 (0.34)
0.0022 (0.27)
0.0656 (1.24)
obs./cross-sections 4474 / 448 4249 / 446 1495 / 369 2358 / 403 396 / 203
adj. R² 0.3146
F-Test a 9.18*** 23.73*** 3.50 23.27*** 5.67
# IV 166 166 166 166
AR(1) b -9.942*** -4.263*** -6.409*** -1.425*
AR(2) c -0.438 1.185 0.599 -0.011
Hansen test d (p-value)
121.90 (0.54)
151.42* (0.05)
145.52 (0.11)
120.87 (0.49)
***, **, and * indicate significance at 0.01, 0.05, and 0.1 level, respectively. Dependent variable is cashETR: cash taxes paid (TXPD) divided by pre-tax income (PI) less special items (SPI). All other variables are as defined in Table III.1. The prefix Li. denotes that the variable is lagged by i periods. Models include firm- and year-fixed effects. Static Model: t-statistics calculated using Huber-White robust standard errors clustered at firm level are reported in parentheses. Dynamic Model: Model is estimated using two-step system GMM with z-statistics, calculated using Windmeijer-corrected robust standard errors, reported in parentheses. a F-test of joint significance of the deferred tax variables. b The Arellano-Bond test tests the null hypothesis of no first-order autocorrelation in first-differenced errors. c The Arellano-Bond test tests the null hypothesis of no second-order autocorrelation in first-differenced errors. d The Hansen Test tests the null hypothesis that the instruments are jointly exogenous.
DTA- as well as DTL-coefficients are again highly significant and show signs in
accordance with the tax effect (Table III.9 Models (1) and (2)). Deferred tax variables lagged
by more than two periods are again insignificant.
Partitioning the sample into three tax groups in accordance with DHM – firm-years
exhibiting a CASH ETR greater than 40 percent (high), between 20 and 40 percent (mid), and
smaller or equal to 20 percent (low) –,93 confirms in a multivariate setting DHM’s finding that
93 Since DHM’s sample is based on the total Compustat population, the sample used in this study features on
average larger firms. In line with DHM’s finding that long-run tax avoiders tend to be larger firms, only 9.32 percent of my sample’s observations show a CASH ETR of greater than 40 percent whereas 18.96 percent of DHM’s observations exhibit a high CASH ETR.

III – Deferred Taxes and Tax Cash Flow
104 © Astrid K. Chludek
high CASH ETR are less persistent than low CASH ETR. In line with the findings reported
by DHM, the persistence coefficient (i.e., the coefficient of L1.cashETR) is insignificant for
firm-years exhibiting a high CASH ETR, while low CASH ETR show a significantly higher
persistence than mid CASH ETR (Table III.9 Models (3) to (5)).
Interestingly, deferred tax information is only significant for the mid tax group (Model
(4)). Comparing firm characteristics across tax groups shows, in line with DHM, that firms in
the mid tax group exhibit, on average, higher ROA, lower R&D-expense, and higher
advertising expense. Moreover, firms in the mid tax group show, on average, a considerably
higher variation and less persistence in their deferred taxes balances.

III – Deferred Taxes and Tax Cash Flow
105
© Astrid K. Chludek
7. Conclusion
The analyses show that deferred taxes indeed may have timely cash flow implications, even in
the case of growing firms. Inclusion of deferred tax information, however, results only in an
increase in explanatory power of marginal 0.05 to 0.37 percentage points. Furthermore,
deferred taxes are only significantly related to actual tax cash flow for about 32.75 percent of
the sample firms, and the economic significance of deferred tax cash flow seems to be rather
negligible for the majority of firms. The results of the forecasting analysis, which investigates
the information content of deferred taxes with respect to future tax cash flow, show that
consideration of deferred tax information does not improve tax cash flow forecasts for the
majority of firms. Moreover, observed reductions in forecast errors due to deferred tax
consideration are quite moderate.
Thus, although the core purpose of inter-temporal tax allocation is to inform about
future tax payments and tax benefits, the overall results of this study rather indicate lacking
relevance of recognized deferred taxes for (future) tax cash flow. Hence, the results of this
study provide an empirical rationale for deferred taxes being not considered decision-relevant
by financial statement users. Moreover, since the estimated coefficients imply only small tax
cash flow effects of deferred taxes for the majority of the sample firms, this study provides in
particular empirical support for the equity view of deferred tax value relevance, which
attributes only low present value to deferred tax cash flows.
Overall, the benefit of deferred tax balance information in terms of informing about
future tax cash flow seems to be rather low, so that the findings of this study further
contribute to questioning the usefulness of (extensive) recognition and disclosure
requirements for deferred taxes.
The findings of this study are basically of descriptive nature, assessing the general
importance of deferred tax cash flow and showing that there are no substantial industry effects
in deferred tax cash flow. The path for future research is to analyze causal relations,
investigating the reasons for the observed differences in tax cash flow relevance of deferred
taxes across firms. Financial statements users should be particularly interested in being able to
identify firm characteristics and events that might cause substantial deferred tax cash flow in
the near future.

III – Deferred Taxes and Tax Cash Flow
106 © Astrid K. Chludek

IV – Accounting Choice of Deferred Taxes
107
© Astrid K. Chludek & Duc Hung Tran
CHAPTER IV
The Impact of Corporate Governance on
Accounting Choice
- The Case of Deferred Tax Accounting
under IFRS
Astrid K. Chludek and Duc Hung Tran94
94
Seminar of Financial Accounting & Auditing, University of Cologne
This is the first study trying to capture the general subjective influence determining the recognized amount of deferred tax assets apart from situational incentives for earnings
management. Therefore, we extend possible determinants of recognized deferred tax assets beyond the criteria provided by accounting standard IAS 12 and earnings management incentives, controlling for corporate governance attributes, like executive compensation schemes and ownership, as well as for the overall transparency and quality of the firm’s
financial statements. Our findings suggest that executives’ compensation schemes, blockholder ownership by the founding family, and audit firm significantly influence
disclosure behavior as well as the recognized amounts of deferred tax assets. These results highlight the complexity of the financial reporting process and importance of other
underlying effects beyond rules and criteria provided by accounting standards.

IV – Deferred Taxes and Accounting Choice
108 © Astrid K. Chludek & Duc Hung Tran
1. Introduction
Research in financial accounting concludes that accounting standards alone do not determine
financial reporting outcomes (see Leuz and Wysocki 2008, for an overview). A variety of
underlying forces also shape the quality of the financial reporting outcome. As long as
managers can elect to use their discretion over financial reporting, the effect of accounting
standards alone may turn out to be weak relative to the effects of forces such as managerial
incentives, auditor quality, enforcement, internal and external governance structures, and
other institutional features of the economy (Holthausen 2009).
Leuz (2006), for example, suggests that the degree of concentration in ownership leads
to systematic differences in earnings management and the overall financial reporting outcome,
even if enforcement and other country-related attributes are held constant. Consistently, Ball
and Shivakumar (2006) and Burgstahler et al. (2006) document that changes in accounting
standards alone will not result in comparable financial reporting outcomes, thereby providing
evidence for the importance of other institutional features in the process generating the
financial reporting outcome.
Set against this background, this paper examines the underlying factors of the financial
reporting outcome with regard to deferred tax assets along two dimensions: disclosure and
recognition. Deferred tax assets account for the amounts of future tax benefits that will arise
from deductible temporary book-tax differences and the carryforward of unused tax losses
and tax credits. Yet, according to IAS 12.24, a deferred tax asset shall only be recognized to
the extent that it is probable that the related tax benefit will be realized. Though IAS 12
provides several guidelines for assessing the probably realizable amount of future tax
benefits, the accounting standard still allows significant subjectivity in assessment. Therefore,
we focus in our empirical analysis on the determinants of deferred tax asset recognition.
While prior (predominantly US GAAP-based) research on recognition of deferred tax assets
has primarily investigated whether discretion in recognition is used for earnings management
purposes, we extend possible determinants of recognized deferred tax assets beyond
recognition guidelines, provided by the accounting standard (IAS 12, in this case), and
earnings management incentives, by relating corporate governance as well as transparency
variables to the recognized amount of deferred tax assets for tax loss carryforwards.
Using German firm data, we find that deferred tax assets for tax loss carryforwards are
generally recognized in accordance with IAS 12. In detail, the amount of deferred tax
liabilities, past and current profitability are significantly related to recognized amounts, while

IV – Deferred Taxes and Accounting Choice
109
© Astrid K. Chludek & Duc Hung Tran
future performance indicators are insignificant. Regarding corporate governance attributes, we
find that firms with large shares of the firm held by the founding family tend to recognize a
c.p. lower amount of deferred tax assets for tax loss carryforwards, which is in line with
family firms setting less incentives to report overoptimistically and improved monitoring.
Effects of managers’ compensation schemes, though, are only rather modest.
Overall transparency and quality of disclosure is highly significantly related to the
disclosed amount of deferred tax assets for tax loss carryforwards. Moreover, there are some
auditor effects on recognized amounts. The audit firm may significantly affect recognized
amounts due to firm-specific internal guidelines and due to the overall quality of the audit.
Since unrecognized amounts of deferred taxes are relevant for an analysis of
recognition determinants but income tax disclosures under IFRS (IAS 12) concerning these
unrecognized amounts of deferred tax assets are currently characterized by a high degree of
heterogeneity,95 we investigate in a first step determinants of disclosure of unrecognized
amounts. Namely, we focus on disclosure of a valuation allowance or of the total amount of
tax loss carryforwards. Regression analysis reveals that disclosure practice is significantly
influenced by whether the firm has once reported under US GAAP, by manager compensation
(whether managers are compensated on a share-basis), by firm size, as well as by the auditing
firm (Non-Big4 vs. Big4 audit firms).
Taken together, our findings provide additional evidence that underlying factors, such
as governance structures and auditor effects, play a role in shaping the outcome of the
financial reporting process.
The proceeding of this chapter is organized as follows: The second section motivates
the research question, reviews briefly related research, and develops the model and the
hypotheses. Section 3 describes the sample and Section 4 analyses the heterogeneity of
income tax disclosures under IAS 12. Section 5 presents the empirical results focusing on the
determinants of recognized deferred tax assets for tax loss carryforwards. Section 6 briefly
summarizes the results and finally concludes.
95 The IASB plans to make establishment and disclosure of a valuation allowance analogue to ASC 740 (formerly SFAS No. 109) mandatory (see exposure draft ED/2009/2). This amendment will decrease heterogeneity in disclosure and, hence, substantially improve inter-firm comparability and informativeness of income tax disclosures relating to unrecognized amounts of deferred taxes.

IV – Deferred Taxes and Accounting Choice
110 © Astrid K. Chludek & Duc Hung Tran
2. Motivation, Model, and Hypotheses
According to IAS 12.34 “A deferred tax asset shall be recognized for the carryforward of
unused tax losses and unused tax credits to the extent that it is probable that future taxable
profit will be available against which the unused tax losses and unused tax credits can be
utilized”. Since this requires from firms as well as from auditors to determine the amount of
unused tax loss carryforwards that is probable to be realized, IAS 12.36 declares four criteria
to be considered when assessing the probably realizable amount: (1) reversing deferred tax
liabilities, (2) expected future taxable income, (3) the sources of the unused tax losses, and (4)
available tax planning strategies.
On the one hand, these four criteria provide a quite objective guideline for assessing
the probably realizable amount of tax loss carryforwards. On the other hand, management yet
has still significant scope within the range of these four criteria to determine the amount of
recognized deferred tax assets. Therefore, research on recognition of deferred tax assets has
primarily focused on whether discretion in recognition is used for earnings management
purposes. These studies are largely based on US GAAP data, typically investigating whether
earnings management variables and objectives are significantly related to (changes in) the
valuation allowance for deferred tax assets.96
Visvanathan (1998), Bauman et al. (2001), Burgstahler et al. (2002), Schrand and
Wong (2003), Frank and Rego (2006), and Christensen et al. (2008) examine whether the
valuation allowance is used for earnings management purposes. The results of these studies,
however, provide no conclusive evidence that the valuation allowance is systematically used
for earnings management (see Graham et al. 2011, for a survey on these studies). Besides, this
research suggests that the valuation allowance is generally set in accordance with the criteria
and guidelines provided by SFAS No. 109.97 Specifically, the underlying deductible
temporary differences (total deferred tax assets and net operating loss carryforwards),
deferred tax liabilities, and past and current firm performance (EPS, ROA) are significantly
related to (changes in) the valuation allowance and the amount of recognized deferred tax
assets. Future performance indicators like market-to-book ratio, realized future ROA, or
96 According to ASC 740 (formerly SFAS No. 109), deferred tax assets are in a first step recognized in full, i.e., for all deductible temporary differences, tax loss and tax credit carryforwards. In a second step, a valuation allowance is established against this account, reducing the full deferred tax asset to the amount that is “more
likely than not” to be realized by subsuming the portion of the deferred tax asset that is “more likely than not” not to be realized. The subjectivity in the determination of the valuation allowance, combined with the fact that changes in the valuation allowance generally flow directly through income tax expense, suggest that it may be an attractive account for managing earnings. 97 Guidelines provided by ASC 740 are very similar to the guidelines given by IAS 12.

IV – Deferred Taxes and Accounting Choice
111
© Astrid K. Chludek & Duc Hung Tran
analysts’ EPS forecasts are largely insignificant, though (see also Behn et al. 1998 and Miller
and Skinner 1998).
This, by contrast, is the first study trying to capture the general subjective influence
determining the recognized amount of deferred tax assets apart from situational incentives for
earnings management. Therefore, we extend possible determinants of recognized deferred tax
assets beyond the criteria provided by the accounting standard IAS 12 and earnings
management incentives. Specifically, we control for corporate governance attributes, like
executive compensation schemes and ownership, as well as for the overall transparency and
quality of the firm’s financial statements, in order to differentiate between different types of
managers and their differing incentives, which possibly systematically affect the discretion
exercised. Hence, we relate recognized amounts of deferred tax assets for tax loss
carryforwards to four types of variables – variables controlling for the guidelines provided by
IAS 12.36, earnings management variables, corporate governance variables, and transparency
indicators – obtaining the following regression model:98
(1) DTA_TLCit = ß0 +∑ ß*IAS-12-criteria + ∑ß*EM + ∑ß*CG + ∑ß*Transparency + εit
(2) DTA_TLCit = ß0 + ß1*DTLit+ ß2*EBTit + ß3*loss_historyit + ß4*MtBit + ß5*FEPSit +
ß6*GAAP_ETRit + ß7*EMit + ß8*Bonus_percit + ß9*Share_percit +
ß10*Block_Famit + ß11*IR_Scoreit + ß12*Aud_Deloitteit + ß13*Aud_E&Yit +
ß14*Aud_PwCit + ß15*Aud_otherit + εit
Detailed variable definitions are given in Table IV.1.
98 Industry- and year-fixed effects are not included in the model since these are insignificant and their inclusion does not affect the results.

IV – Deferred Taxes and Accounting Choice
112 © Astrid K. Chludek & Duc Hung Tran
Table IV.1 – Variable Definitions
DTA_TLC recognized deferred tax assets for tax loss carryforwards divided by the total amount of tax loss carryforwards (hand-collected form notes to financial statements)
recTLC_TLC recognized amount of tax loss carryforwards divided by the total amount of tax loss carryforwards (hand-collected form notes to financial statements)
DTL deferred tax liabilities per share (hand-collected form notes to financial statements)
EBT earnings before taxes (01401) per share
loss_history = 1 if EBT < 0 in the current or previous fiscal year; = 0 otherwise
MtB market-to-book ratio (market value of equity/book value of equity (03501))
FEPS median one-year-ahead analysts’ EPS forecast (I/B/E/S) (fyr1)
GAAP_ETR = current tax expense (18186 + 18187) / earnings before taxes (01401). Observations with earnings before taxes < 0 are omitted.
EM = 1 if per-share earnings before current change in deferred tax assets for tax loss carryforwards below median analysts’ EPS forecast and actual EPS larger than median analysts’ EPS forecast; = 0 otherwise
Bonus_perc percent of bonus compensation in overall executive’s compensation package (hand-collected from financial statements)
Share_perc percent of share-based compensation in overall executive’s compensation package (hand-collected from financial statements)
Block_Fam = 1 if founding-family holds equal or more than 25 percent of shares; = 0 otherwise (hand-collected from Hoppenstedt AG / annual reports)
IR_Score
independent disclosure score (scaled from 0 to 1) extracted from the yearly annual report contest “Deutsche Investor Relations Preis” of the German business magazine Capital. The contest is conducted in collaboration with the German Society of Investment
Professionals (DVFA) and evaluates the quality of a firm’s investor relations.
Aud_Deloitte = 1 if auditor is Deloitte; = 0 otherwise.
Aud_E&Y = 1 if auditor is Ernst&Young; = 0 otherwise.
Aud_KPMG = 1 if auditor is KPMG; = 0 otherwise.
Aud_PwC = 1 if auditor is PwC; = 0 otherwise.
Aud_other = 1 if auditor is not a Big4; = 0 otherwise.
VA_discl = 1 if a valuation allowance is disclosed in income tax notes (hand-collected form notes to financial statements); = 0 otherwise
TLC_discl = 1 if the total amount of tax loss carryforwards is disclosed in income tax notes (hand-collected form notes to financial statements); = 0 otherwise
unrecTLC_discl = 1 if the amount of unrecognized tax loss carryforwards is disclosed in income tax notes (hand-collected form notes to financial statements); = 0 otherwise
USGAAP = 1 if firm prepared financial statements in accordance with US GAAP before 2005; = 0 otherwise
lnMV natural logarithm of market value
lev total debt (03255) divided by total assets (02999) Numbers in parentheses refer to Worldscope item numbers.

IV – Deferred Taxes and Accounting Choice
113
© Astrid K. Chludek & Duc Hung Tran
DTA_TLC denotes recognized deferred tax assets for tax loss carryforwards relative to
the total amount of tax loss carryforwards. We focus on deferred tax assets for tax loss
carryforwards (hereafter DTA for TLC) for several reasons. First, DTA for TLC constitute an
excellent case to analyze systematic discretion exercised on a regular basis,99 which is
possibly incentivized by certain corporate governance attributes. Following Frank and Rego
(2006), exercised discretion can be identified by determining the non-discretionary amount of
DTA for TLC using the guidelines provided by IAS 12.36 and attributing residual amounts to
subjectivity and discretion. Second, since changes in the underlying differences constitute the
main determinant of changes in deferred tax accounts (92.51 percent of the variation in DTA
for TLC is explained by variation in the underlying tax loss carryforwards alone), it is crucial
to control for the underlying differences or, alternatively, to know recognized versus
unrecognized amounts. The component DTA for TLC offers the advantage over total DTA
that the underlying book-tax difference, i.e., the total amount of tax loss carryforwards, is
disclosed and can therefore be controlled for.100 The underlying differences for the total DTA
account, by contrast, are hardly determinable, and unrecognized amounts in form of a
valuation allowance are only scarcely disclosed.101 Besides, DTA for TLC constitute the
major part of unrecognized deferred tax benefits,102 so that effects regarding DTA for TLC
recognition should represent main recognition effects.
The first six explanatory variables control for the recognition criteria provided by IAS
12.36. According to IAS 12.36, a firm should consider (1) the reversal of deferred tax
liabilities, (2) expected future taxable profit, (3) the sources of the unused tax losses, and (4)
tax planning opportunities to assess the probably realizable amount of unused tax loss
carryforwards. Since it is hardly possible to control for criterion (3) based on only publicly
available data, we address only criteria (1), (2), and (4). Hence, we relate the recognized
amount of DTA for TLC to the amount of deferred tax liabilities (DTL), and control for
management’s expectations of future taxable income by resorting to persistence in current
profitability (EBT), median one-year-ahead I/B/E/S analysts’ EPS forecast (FEPS), and
market’s growth expectations as captured by the market-to-book ratio (MtB). All four
variables should be positively related to the realization probability of future tax benefits and,
99 This is opposed to discretion exercised for earnings management purposes, for example, which is not exercised on a regular basis, but dependently on a certain situation, e.g., missing the analysts’ forecast. 100 This is done in our model by deflating the dependent variable, DTA for TLC, by the total amount of tax loss carryforwards. 101 A valuation allowance is disclosed for only 27.52 percent of the observations in our sample. The total amount of tax loss carryforwards, however, is available for 51.28 percent of the observations. 102
See Miller and Skinner (1998) as well as Section 3.

IV – Deferred Taxes and Accounting Choice
114 © Astrid K. Chludek & Duc Hung Tran
therefore, should be positively related to the recognized amount of tax loss carryforwards. A
history of recent losses, however, might indicate future losses, thereby implying that
(sufficient) future taxable profit may not be available (IAS 12.35). Thus, we include a dummy
variable taking a value of 1 if the firm reports a pre-tax loss (EBT < 0) for the current or
previous fiscal year and expect a negative coefficient sign.
Since overall tax planners, i.e., firms with a low effective tax rate, should rather be
able to use tax planning strategies to utilize otherwise unused tax losses, we use GAAP ETR,
defined as current tax expense divided by pre-tax income, to measure availability of tax
planning strategies, and expect a negative relation.103
We control for earnings management incentives by including the indicator variable
EM that takes a value of 1 if the annual increase in DTA for TLC allows the firm to meet/beat
the otherwise missed median EPS analyst forecast. We focus on the incentive to meet/beat
analysts’ forecasts because prior research on earnings management via the valuation
allowance provides only for this earnings management incentive consistent evidence (Graham
et al. 2011). If firms use DTA for TLC to meet/beat analysts’ forecasts, EM should show a
positive coefficient sign.
We additionally include corporate governance and transparency variables to control
for differing management types, on the one hand, and for the overall disclosure practice of the
firm, on the other hand. With respect to corporate governance, we use executive
compensation to differentiate between different types of managers and their respective
incentives as they are set by different compensation packages.104 Regarding manager
remuneration, we differentiate between three components of typical compensation packages:
fixed salary, performance-related bonus, and equity-based incentive components (e.g., stock
options). Setting “fixed salary” as reference, Bonus_perc (Share_perc) denotes the percentage
of bonus compensation (equity-based compensation) relative to the executive’s total annual
compensation.
The following hypotheses generally rest on the proposition that, within the scope of
the guidelines provided by IAS 12.36, managers have an incentive to recognize rather more
deferred tax assets than less, i.e., to recognize overoptimistically. This proposition comes
from two reasons. First, a higher recognition ratio should be a positive signal to providers of
capital by implying a higher utilizable tax benefit (and thus c.p. lower tax payments) and
103 We use current rather than total tax expense for GAAP ETR computation to exclude the effect of deferred taxes. Moreover, we prefer GAAP ETR over CASH ETR (this is, cash taxes paid divided by pre-tax income less special items; see Dyreng et al. 2008) to exclude the effect of tax loss carryforwards on ETR. 104 See Jensen (2000) for effects of different forms of compensation on manager incentives.

IV – Deferred Taxes and Accounting Choice
115
© Astrid K. Chludek & Duc Hung Tran
more positive future performance expectations. Second, recognition of DTA results in
deferred tax benefit which increases net income in the fiscal year of recognition. Hence,
managers have incentives to recognize rather more deferred tax assets than less.
Jensen (2000) refers, inter alia, to two sources of conflicts between managers and
owners that can be mitigated by compensation plans: (1) choice of effort (additional effort
increases firm value, but is bad to managers) and (2) differential horizons (manager’s claims
are limited to their tenure in the firm, whereas stockholders’ claim is indefinite). Accounting-
based performance measures (e.g., bonus plans) allow a disaggregation of the firm’s total
performance among divisions, thereby associating the managers’ compensation directly to an
accounting metric of the respective change in firm value. This leads to a reduction of agency
costs resulting from the conflicts over effort and horizon. This alignment of interests might
result in managers feeling more responsible for performance and less likely to recognize DTA
overoptimistically. Therefore, we expect a negative relation between DTA_TLC and Bonus_
perc.
An increasing ratio of recognized DTA for TLC might affect a firm’s market value
positively, since it implies a higher amount of realizable future tax benefits and signals
positive future firm performance expectations on the part of the management (Ayers 1998,
Amir and Sougiannis 1999, Kumar and Visvanathan 2003, Gordon and Joos 2004, Herbohn et
al. 2010). In such a case, a higher percentage of equity-based compensation in a manager’s
compensation package should increase his/her incentive to recognize overoptimistically.
Thus, we expect a positive relation between DTA_TLC and Share_perc.
Furthermore, we use the existence of blockholders to differentiate between firms with
different ways and objectives of entrepreneurship, thus setting different incentives for
recognition and disclosure. Large investors have a big enough stake in the firm that it pays for
them to spend private resources to monitor management. Moreover, their voting power
enables them to put pressure on managers, such that managers are likely to be replaced soon if
they repeatedly act against the wishes of the large investor (Shleifer and Vishny 1986). Since
different types of blockholders are likely to have different incentives and expertise, managers
are confronted with different objectives depending on the main owner of the firm. Therefore,
we include a dummy variable (Block_Fam) that takes a value of 1 if the founding family
holds a share in the firm of at least 25 percent, and 0 otherwise. 105 The threshold is set equal
105 Founding family is the largest blockholder group in our sample with 22.96 percent of the observations. Other large blockholder groups are financial institutions and corporations. 52 percent of the observations record no block ownership, i.e., no single shareholder holding a share of more than or equal to 25 percent.

IV – Deferred Taxes and Accounting Choice
116 © Astrid K. Chludek & Duc Hung Tran
to 25 percent because a blocking minority requires a share of 25 percent, according to the
German Stock Corporation Act (AktG), allowing to block all significant decisions and
resolutions.
We focus on family blockholders because these investors typically pursue interests in
line with long-term family commitment. Furthermore, firms with a family blockholder are
associated with more effective monitoring and better knowledge of the firms’ business,
leading to lower agency cost on the firm-level. Thus, their earnings might be less likely to be
affected by managerial opportunistic behavior (e.g., signaling overoptimistic numbers).
Consistent with this notion, Ali et al. (2007) provide empirical evidence that family firms
report better quality earnings. We therefore expect a negative relation.
In addition, we control for the overall transparency and quality of the firm’s financial
statements by including a disclosure measure of financial transparency (IR_Score) that is akin
to the rating by the Association of Investment Management and Research (AIMR). The score
is extracted from the yearly annual report contest Deutsche Investor Relations Preis (German
Investor Relations Award) of the German business magazine Capital. In collaboration with
the German Society of Investment Professionals (DVFA), Capital evaluates the quality of a
firm’s investor relations by surveying financial analysts and institutional investors of German
and other European banks – an essential target group of corporate disclosure – across four
dimensions:
(1) Target group orientation: Pro-activity of information provision by the board to
financial analysts and institutional investors.
(2) Transparency: Provision of relevant information in appropriate form and frequency.
(3) Track record: Provided reports are sufficiently up-to-date, continuous, and precise to
allow a high level of quality forecast.
(4) Extra financial reporting: Reports of non-financial information on corporate
governance, social and environmental assets, etc.
Based on these four dimensions, a total summary score (ranging from 0 to 500) is
constructed for every firm listed in DAX30, MDAX, TecDAX, SDAX, and Dow Jones Euro
STOXX 50.106 We divide the original score by 500 to obtain values between 0 and 1, which
allows a more intuitive interpretation of the empirical results. Since greater transparency of
financial information facilitates monitoring of managements’ actions, thereby setting
106 Daske (2005) and Noelte (2008), for instance, use this summary score in a German capital market context to measure reporting quality. They find statistically significant effects of this metric on the properties of financial analysts’ earnings forecasts and cost of capital, respectively.

IV – Deferred Taxes and Accounting Choice
117
© Astrid K. Chludek & Duc Hung Tran
constraints on management’s opportunistic behavior (e.g., too optimistic recognition), we
expect a negative relation.
Besides, recognition might be influenced by auditor, since each audit firm has its own
guidelines, possibly putting different emphasis on specific recognition criteria. Therefore, we
differentiate between the individual Big4 audit firms (Aud_Deloitte, Aud_E&Y, Aud_KPMG,
and Aud_PwC) and non-Big4 audit firms (Aud_other).107 We do not make any prediction
about the direction of possible differences between the Big4. Since larger audit firms have
client-specific quasi-rents that they try to secure (DeAngelo, 1981), the Big4 auditors are
supposed to practice higher quality audits, so that it might be easier for firms audited by a
non-Big4 firm to recognize overoptimistically. Therefore, we hypothesize a negative relation
for non-Big4 audit firms (Aud_other) and DTA_TLC.
107 KPMG is chosen as reference auditor and, therefore, Aud_KPMG is omitted in the regression model.

IV – Deferred Taxes and Accounting Choice
118 © Astrid K. Chludek & Duc Hung Tran
3. Data and Sample
Since information on corporate governance, transparency, auditor, deferred taxes, and tax loss
carryforwards is not available in databases, we resorted to hand-collect this information.
Specifically, information on governance, auditor, deferred taxes, and tax loss carryforwards is
extracted from the firms’ annual reports, while our transparency score, IR_Score, is collected
from the German business magazine Capital. All other data are taken from Thomson’s
Worldscope database.
Yet, our data requirements restrict our sample. For one thing, IR_Score covers only
firms listed in the indices DAX30, MDAX, TecDAX, SDAX, and Dow Jones Euro STOXX 50.
For another thing, disclosure of individual board members’ compensation packages is
mandatory in Germany since 2006. Thus, to ensure consistent blockholder regulation as well
as compensation disclosure rules, our initial sample comprises all firms listed in the German
stock market indices DAX30, MDAX, TecDAX, or SDAX over fiscal years 2006 to 2009, all in
all 187 firms and 600 firm-year observations.108 Nine firms (15 observations) are excluded
from the sample due to either income tax-exempt operations or financial statements being not
available in €uro. For additional 15 observations, there information on DTA for TLC is
missing. This leaves the sample with 575 firm-year observations.
Disclosures concerning the unrecognized amount of deferred tax assets are quite
heterogeneous across firms. This is because, in contrast to ASC 740 (formerly SFAS No.
109), IAS 12 does not require to disclose the unrecognized amount of deferred tax assets in
form of a valuation allowance.109 Instead, IAS 12.81(e) instructs to disclose the underlying
differences of the unrecognized amounts, i.e., “the amount (and expiry date, if any) of
deductible temporary differences, unused tax losses, and unused tax credits for which no
deferred tax asset is recognized in the statement of financial position.” Combined with the
fact that major parts of unrecognized deferred tax assets usually arise from unused tax loss
carryforwards,110 this results in firms disclosing either a valuation allowance analogue to ASC
108 DAX30, MDAX, TecDAX, and SDAX indices comprise the shares of the largest corporations in terms of order book volume and free float market capitalization listed on FWB Frankfurter
Wertpapierbörse (Frankfurt Stock Exchange). 109 The IASB plans to make establishment and disclosure of a valuation allowance mandatory, similar to ASC 740 (see IASB exposure draft ED/2009/2, becoming effective at January 1, 2012). This amendment will enhance comparability and information content of income tax disclosures under IFRS considerably. 110 We can relate the amount of unrecognized DTA for TLC to the total amount of unrecognized DTA for 78 observations. We find that for 80 percent of these 78 observations the valuation allowance comprises to at least 75 percent of unrecognized DTA for TLC. For 49 percent, the valuation allowance is established exclusively for DTA for TLC, i.e., consists to 100 percent of unrecognized DTA for TLC.

IV – Deferred Taxes and Accounting Choice
119
© Astrid K. Chludek & Duc Hung Tran
740, the amount of unrecognized unused tax loss carryforwards, the total amount of unused
tax loss carryforwards, or a mixture of these values.
The descriptive statistics on disclosure behavior illustrate the heterogeneity. While a
valuation allowance, i.e., the total amount of unrecognized DTA, is only disclosed for 27.52
percent of the observations in our sample, the total amount of tax loss carryforwards is
disclosed for 51.28 percent, and the amount of tax loss carryforwards for which no deferred
tax asset is recognized is disclosed for 72.14 percent of the sample’s observations (see Table
IV.2 Panel A). For 43.93 percent (7.01 percent) of the observations, two of these (all three)
items are disclosed. As a consequence of this heterogeneous disclosure practice, our
dependent variable (DTA for TLC relative to the total amount of tax loss carryforwards) is
only available for 259 observations.111 Missing data of the model’s independent variables lead
to a final sample of 238 firm-year observations (across 80 firms) for the main regression
analysis.112
Table IV.2 – Descriptive Statistics
Panel A: Disclosure According to Auditor
Disclosure of
valuation
allowance
unrecognized tax
loss
carryforwards
total tax loss
carryforwards
Deloitte 36.21 77.59 31.03
Ernst & Young 25.56 77.78 51.11
KPMG 39.23 67.96 65.19
PwC 20.13 81.21 43.62
Other 13.11 51.64 43.44
Total 27.52 72.14 51.28
Percent of observations for which a valuation allowance, the amount of unused tax loss carryforwards for which no deferred tax asset is recognized, and the total amount of unused tax loss carryforwards, respectively, is disclosed in the notes to financial statements.
111 DTA for TLC are disclosed for 529 observations since disclosure of material DTA for TLC is mandatory according to IAS 12.81(g). The total amount of tax loss carryforwards, in contrast, is only disclosed for 259 of these observations. 112 Potential outliers do not affect the results. Dropping the 1st and 99th percentile of the main variables or observations with an absolute value of the R-student statistic of larger than the common critical value of 3 does not lead to substantially different results.

IV – Deferred Taxes and Accounting Choice
120 © Astrid K. Chludek & Duc Hung Tran
Table IV.2 – Descriptive Statistics (continued)
Panel B: Analysis of Disclosure of Valuation Allowances and/or Tax Loss Carryforwards
Obs. Mean Median Std. Dev. Min. Max.
VA_discl 575 0.2783 0 0.4485 0 1
TLC_discl 575 0.5113 1 0.5003 0 1
unrecTLC_discl 575 0.7235 1 0.4477 0 1
USGAAP 575 0.2122 0 0.4092 0 1
Share_perc 575 0.1066 0 0.1552 0 0.7045
Block_Fam 575 0.2296 0 0.4209 0 1
IR_Score 575 0.5964 0.6140 0.1460 0.0458 0.9022
Aud_Deloitte 575 0.1009 0 0.3014 0 1
Aud_E&Y 575 0.1635 0 0.3701 0 1
Aud_KPMG 575 0.3200 0 0.4669 0 1
Aud_PwC 575 0.2643 0 0.4414 0 1
Aud_other 575 0.1652 0 0.3717 0 1
lnMV 575 7.2810 7.0469 1.6884 2.740.195 1.1521
lev 575 0.7516 0.7919 0.1944 0 0.8785
See Table IV.1 for variable definitions. Means of the auditor variables (Aud_) sum up to more than 1 because some firms are audited by more than one audit firm.
Panel C: Analysis of Determinants of DTA for TLC
Obs. Mean Median Std. Dev. Min. Max.
DTA_TLC 238 0.1259 0.1078 0.1003 0 0.5156
DTL 238 17.1064 0.7826 67.1013 0 825.5714
EBT 238 6.7062 0.9988 21.4543 -61.0795 175.6053
loss_history 238 0.1933 0 0.3957 0 1
MtB 238 2.3000 1.9000 1.7000 -0.4000 11.4000
FEPS 238 2.3734 1.5100 3.1688 -3.7300 18.5100
EM 238 0.0252 0 0.1571 0 1
Bonus_perc 238 0.4251 0.4307 0.2042 0 0.8080
Share_perc 238 0.0836 0 0.1373 0 0.6107
Block_Fam 238 0.2059 0 0.4052 0 1
IR_Score 238 0.5737 0.5853 0.1445 0.0458 0.8666
Aud_Deloitte 238 0.0588 0.0000 0.2358 0 1
Aud_E&Y 238 0.1639 0 0.3709 0 1
Aud_KPMG 238 0.3908 0 0.4889 0 1
Aud_PwC 238 0.2437 0 0.4302 0 1
Aud_other 238 0.1765 0 0.3820 0 1
recTLC_TLC 176 0.4421 0.4424 0.3118 0 0.9947
GAAP_ETR 185 0.2378 0 0.4269 0 1
See Table IV.1 for variable definitions. Means of the auditor variables (Aud_) sum up to more than 1 because some firms are audited by more than one audit firm.

© Astrid K. Chludek & Duc Hung Tran
Table IV.2 – Descriptive Statistics (continued)
Panel D: Pairwise Pearson Correlation Matrix
Pearson correlation coefficients are presented. Correlation coefficients that are significant at 0.1 level are presented in bold face. See Table IV.1 for variable definitions.
1 2 3 4 5 6 7 8 9 10 11 12 13 14 15 16 17 18 19 20 21 22 23 24
1:TLC_discl 1.00
2:VA_discl 0.17 1.00
3:DTA_TLC 0.12 - 1.00
4:recTLC_TLC 0.07 - 0.82 1.00
5:unrecTLC_discl -0.34 -0.05 0.01 - 1.00
6:USGAAP 0.31 0.19 0.03 0.05 -0.15 1.00
7:IR_Score 0.12 -0.05 0.24 0.20 -0.06 0.13 1.00
8:Bonus_perc -0.01 0.07 0.04 0.10 0.09 -0.05 0.24 1.00
9:Share_perc 0.01 -0.05 0.05 0.01 0.01 0.09 0.12 -0.29 1.00
10:Block_Fam -0.04 -0.04 -0.09 -0.06 0.00 0.06 0.10 0.14 -0.09 1.00
11:Aud_Deloitte 0.06 -0.13 -0.07 0.01 0.04 -0.03 -0.09 -0.06 0.01 -0.07 1.00
12:Aud_E&Y 0.05 0.02 0.03 0.00 0.04 0.14 -0.06 -0.09 -0.05 0.06 -0.15 1.00
13:aud_KPMG 0.20 0.20 -0.07 -0.21 -0.09 0.20 0.15 0.03 0.20 0.00 -0.23 -0.26 1.00
14:Aud_PwC -0.09 -0.08 0.13 0.26 0.11 -0.21 -0.06 -0.04 -0.03 -0.16 -0.20 -0.22 -0.41 1.00
15:Aud_other -0.19 -0.03 0.07 -0.02 -0.10 -0.14 0.01 0.05 -0.20 0.18 -0.19 -0.20 -0.31 -0.27 1.00
16:lnMV 0.23 -0.01 0.32 0.22 0.05 0.09 0.36 0.24 0.28 -0.06 -0.09 -0.09 0.32 0.09 -0.27 1.00
17:lev 0.00 -0.06 0.00 0.13 -0.05 -0.20 -0.20 -0.02 -0.08 -0.05 -0.03 -0.01 -0.01 -0.03 0.07 -0.08 1.00
18:DTL 0.18 0.02 0.30 0.20 0.01 0.03 0.03 0.12 0.04 -0.06 -0.09 -0.01 0.10 0.15 -0.13 0.49 0.12 1.00
19:MtB -0.09 -0.01 0.04 0.12 0.07 0.09 0.19 0.11 0.07 0.12 0.03 0.04 -0.03 -0.09 0.07 0.09 -0.27 -0.14 1.00
20:EBT 0.13 -0.01 0.33 0.26 0.06 0.04 0.17 0.30 0.11 -0.03 -0.04 -0.06 0.12 0.05 -0.14 0.53 0.01 0.57 0.01 1.00
21:loss_history 0.07 -0.04 -0.23 -0.30 0.03 0.03 -0.36 -0.39 0.03 -0.13 0.03 0.05 0.01 0.02 -0.10 -0.39 0.15 -0.03 -0.19 -0.27 1.00
22:FEPS 0.07 -0.03 0.10 0.08 -0.08 -0.07 0.15 0.15 0.13 -0.05 -0.05 -0.09 0.15 0.05 -0.14 0.38 -0.13 0.29 -0.09 0.31 -0.13 1.00
23:GAAP_ETR 0.00 0.08 0.03 0.01 0.09 0.04 -0.02 -0.01 0.04 0.16 0.02 -0.04 0.04 0.00 -0.05 0.03 0.00 0.12 0.03 -0.01 -0.03 0.07 1.00
24:EM 0.03 0.01 -0.01 0.02 0.06 -0.01 -0.01 0.01 0.01 -0.02 -0.05 0.01 0.07 0.00 -0.06 0.03 0.12 0.09 0.11 -0.05 0.12 0.01 0.04 1.00
121
IV –
Deferred
Tax
es and
Acco
un
ting C
ho
ice

IV – Deferred Taxes and Accounting Choice
122 © Astrid K. Chludek & Duc Hung Tran
4. Analysis of Disclosure
In order to investigate to what extent disclosing firms differ from non-disclosing firms, i.e., to
what extent firms included in our main analysis differ from firms that drop out of the sample
because of missing disclosure,113 we investigate in a first step the determinants of disclosure
using the following models:
(3) VA_disclit = ß0 + ß1*unrecTLC_disclit + ß2*TLC_disclit + ß3*USGAAPit +
ß4*Share_percit + ß5*Block_Famit + ß6*IR_Scoreit + ß7*Aud_Deloitteit +
ß8*Aud_E&Yit + ß9*Aud_PwCit + ß10*Aud_otherit + ß11*lnMVit + ß12*levit
+∑δk*Ind_ki + εit
(4) TLC_disclit = ß0 + ß1*unrecTLC_disclit + ß2*TLC_disclit + ß3*USGAAPit +
ß4*Share_percit + ß5*Block_Famit + ß6*IR_Scoreit + + ß7*Aud_Deloitteit +
ß8*Aud_E&Yit + ß9*Aud_PwCit + ß10*Aud_otherit + ß11*lnMVit + ß12*levit
+∑δk*Ind_ki + εit
See Table IV.1 for variable definitions.
The dependent variable VA_discl (TLC_discl) is an indicator variable taking a value of
1 if the valuation allowance (the total amount of tax loss carryforwards) is disclosed, and 0
otherwise. Indicator variables unrecTLC_discl and TLC_discl (VA_discl) are included, taking
a value of 1 if the unrecognized amount and the total amount of tax loss carryforwards (the
valuation allowance), respectively, is disclosed, and 0 otherwise. This is to observe whether
there is a substituting relation (firms choose to disclose one of the three items to satisfy
disclosure requirements) or a complementary relation between the three items.
Since fiscal year 2005, German firms are required to prepare their consolidated
financial statements in accordance with IFRS. Before 2005, listed German firms were allowed
to prepare their consolidated financial statements according to either US GAAP, IFRS, or
German Commercial Code (HGB). Since, in contrast to IFRS, disclosure of the valuation
allowance as well as of the total amount of tax loss carryforwards is mandatory under US
113 This different disclosing behavior is not relevant for intra-firm comparison because disclosures are consistent over time within a firm. During our sample period, 18 (28) firms switched from non-disclosure to disclosure of the valuation allowance (the total amount of tax loss carryforwards), while virtually no firm switched from disclosure to non-disclosure. Yet, heterogeneous disclosure practice constrains inter-firm comparison. Therefore, we investigate in a first step the determinants of disclosure.

IV – Deferred Taxes and Accounting Choice
123 © Astrid K. Chludek & Duc Hung Tran
GAAP,114 we expect that firms that prepared their financial statements according to US
GAAP before 2005 (indicated by USGAAP) are also more likely to disclose a valuation
allowance and the total amount of tax loss carryforwards in their financial statements prepared
under IFRS.115
Research suggests that the market values valuation allowance and tax loss
carryforwards negatively, since these are rather negative performance indicators.116 Thus,
managers with rather equity-based compensation might be more likely to refrain from
disclosing the valuation allowance and the amount of tax loss carryforwards, respectively.
Wang (2006) and Ali et al. (2007) document, based on S&P 500-firms, that firms with
a block ownership by the founding family are associated with a more transparent information
environment, i.e., these firms have better financial reporting quality, larger analyst following,
and smaller bid-ask spreads as compared to non-family firms.117 Based on this evidence, we
expect firms with a family blockholder to exhibit a higher likelihood of disclosing a valuation
allowance and/or the total amount of tax loss carryforwards.
Since more transparent firms are supposed to disclose more information, we expect a
positive coefficient of IR_Score. Moreover, we include auditor-fixed effects to investigate
whether disclosure behavior is significantly influenced by auditor (internal guidelines, etc.).
Besides, we control for size, measured by the natural logarithm of market value
(lnMV), and leverage (lev), which might influence disclosure. Concerning size, as there are
firm-specific costs of corporate disclosure, including the preparation and dissemination of
financial reports, fixed disclosure costs result in economies of scale and can make certain
disclosures particularly burdensome for smaller firms (Leuz and Wysocki 2008). Consistent
with this conjecture, Chow and Wang-Boren (1981) find that larger firms disclose more
information. Therefore, we expect a positive relation between size (lnMV) and disclosure of a
valuation allowance and/or the total amount of tax loss carryforwards. Concerning leverage,
114
See ASC 740-10-50-2 and 50-3 (formerly SFAS No.109, para. 43 and 48). 115 We also controlled for firms being cross-listed on a non-German stock exchange, potentially requiring preparation of additional financial statements in accordance with US GAAP. The cross-listing variable turns out to be insignificant as soon as the variable USGAAP is included in the model. 116 Ayers (1998), Amir and Sougiannis (1999), and Kumar and Visvanathan (2003) find negative valuation coefficients and return effects of the valuation allowance under US GAAP, and Chludek (2011) reports a negative valuation coefficient for the total amount of tax loss carryforwards based on German data. Moreover, Legoria and Sellers (2005) report a significantly negative relation of the valuation allowance and future operating cash flow. 117 Notably, prior research provides mixed evidence with respect to the reporting quality of family firms. Anderson et al. (2009), for example, find by contrast that the family firms among the top 2000 US industrial firms are less transparent than the non-family firms. Taken together, this research indicates systematic size differences (S&P 500 vs. 2000 US industrial firms). Consistently, Cheng et al. (2010) find that small family firms are more opaque than their non-family owned counterparts. Since our sample consists of the largest German firms in terms of market capitalization and order book volume, we refer to the results from Wang (2006) and Ali et al. (2007).

IV – Deferred Taxes and Accounting Choice
124 © Astrid K. Chludek & Duc Hung Tran
we predict a negative coefficient of lev, since increased leverage is expected to reduce overall
corporate disclosure, because agency problems of debt are controlled through substitute
channels (e.g., restrictive debt covenants) rather than increased disclosure of information in
annual reports (Jensen 1986).
Since, furthermore, accounting conventions may be industry-specific due to a demand
for intra-industry comparability by external financial statement users, we also include
industry-fixed effects.
Panel B of Table IV.2 provides descriptive statistics on the variables used in the
disclosure analysis. 21.22 percent of the sample firms prepared their consolidated financial
statements in accordance with US GAAP before 2005. Regarding the governance variables,
share-based compensation accounts, on average, for 10.66 percent of the total board
compensation. In 22.96 percent of the cases, the founding family has a share in the firm of at
least 25 percent. Mean firm size (financial leverage) is 7.2810 (0.7516) with a standard
deviation of 1.6884 (0.1944). The average IR_Score is 0.5964 with a standard deviation of
0.1460.
The majority of the audits (83.48 percent) are handled by a Big4 auditor, which
reflects the fact that our sample comprises of large firms. Regarding the Big4 auditors, KPMG
provides almost one third of the audits in our sample, followed by PwC, Ernst & Young, and
Deloitte.
Regarding auditor effects on disclosure, the descriptive statistics, displayed in Panel A
of Table IV.2, reveal that KPMG provides overall the most extensive footnote information,
followed by Ernst&Young, PwC, and Deloitte. Smaller audit firms provide the least footnote
information. Nevertheless, there is no definitive auditor effect visible in descriptive statistics.
Marginal effects as obtained by probit estimation (see Table IV.3) show that
disclosure of the valuation allowance substitutes for disclosure of the amount of unrecognized
tax loss carryforwards, which is in line with IAS 12.81(e).118 Moreover, as expected,
disclosure is highly determined by whether the firm has once prepared financial statements in
accordance with US GAAP. According to the estimation results, the likelihood to disclose a
valuation allowance (the total amount of tax loss carryforwards) increases by 33.10 (23.83)
percentage points if the firm prepared financial statements according to US GAAP before
2005. This finding provides some evidence on inter-temporal consistency in reporting even
across accounting standards.
118 Marginal effects based on the average firm are similar using logistic estimation. Coefficients are estimated in both cases, logistic and probit estimation, using maximum likelihood. While logistic estimation assumes a logistic distribution of error terms, probit estimation assumes that error terms are normally distributed.

IV – Deferred Taxes and Accounting Choice
125 © Astrid K. Chludek & Duc Hung Tran
Table IV.3 – Determinants of Disclosure
predicted
sign
VA_discl TLC_discl
TLC_discl ? 0.1161 (1.63)
VA_discl ?
0.1871* (1.74)
unrecTLC_discl ? -0.3763***
(-4.82)
0.0423 (0.43)
USGAAP + 0.3310***
(3.11)
0.2383* (1.91)
Share_perc - -0.4268**
(-2.34)
-0.3968* (-1.81)
Block_Fam + -0.0219 (-0.28)
-0.0932 (-0.99)
IR_Score + 0.1364 (0.62)
-0.3797* (1.69)
Aud_Deloitte 0.1773 (1.42)
-0.3820*** (-2.65)
Aud_E&Y 0.0100 (0.11)
-0.1283 (-1.05)
Aud_PwC -0.0651 (-0.66)
-0.1996* (-1.77)
Aud_other - -0.1944*
(-1.88)
-0.1582 (-1.20)
lnMV + 0.0567**
(2.43)
-0.0190 (-0.68)
lev - 0.2224 (1.40)
-0.1673 (-0.78)
Pseudo-R² 0.3242 0.1344
obs. / firms 575 / 177 575 / 177
***, **, and * indicate significance at 0.01, 0.05, and 0.1 level, respectively. Reported: marginal effects the variables (in the
case of indicator variables, the effect of a change from 0 to 1) according to a probit estimation. z-statistics concerning the
significance of the underlying probit estimation coefficients are reported in parentheses. Aud_KPMG is taken as reference
auditor and therefore omitted. Industry-fixed effects are included, but estimated coefficients are not reported. See Table IV.1
for variable definitions.

IV – Deferred Taxes and Accounting Choice
126 © Astrid K. Chludek & Duc Hung Tran
Results suggest furthermore that share-based compensation (Share_perc) incentivizes
not to disclose a valuation allowance, in line with a negative valuation effect of the valuation
allowance. By contrast, the existence of family blockholders does not affect disclosure
choice.119
In contrast to expectations, there is hardly any significant relation between the
disclosure of the two items and overall transparency as measured by IR_Score. Regarding
auditor effects, there is only a marginally significant effect of firms audited by a non-Big4
audit firm being less likely (by 19.44 percentage points) to disclose a valuation allowance.
Moreover, firms audited by Deloitte or PwC tend to be less likely (by 38.20 and 19.96
percentage points, respectively) to disclose the total amount of tax loss carryforwards.
Besides, we find that larger firms are significantly more likely to disclose a valuation
allowance, which is in line with prior research on the relation of firm size and disclosure
behavior (see, for example, Chow and Wang-Boren, 1981, and Leuz and Wysocki, 2008). By
contrast, leverage level does not affect the disclosure decision.120 Moreover, there is hardly
any systematic industry-effect on disclosure choice with only two of ten industry-fixed effects
being significant (coefficient estimates are not reported).
The results with respect to disclosure of the total amount of tax loss carryforwards
hence suggest that the sample used for the following analysis of determinants of deferred tax
asset recognition is based on a subsample of firms with a relatively lower share of equity-
based compensation in executives’ compensation packages, lower transparency in terms of
IR_Score, and higher alignment with US GAAP as compared to the average firm of the total
sample. Overall, identified differences in disclosure versus non-disclosure firms are far more
significant regarding valuation allowance disclosure.
119 Other blockholder groups than founding family are also insignificant. 120 Likewise, performance related variables like ROE, pre-tax loss, or market-to-book ratio are insignificant for the analyzed disclosure decisions. Furthermore, the amount of DTA for TLC (per share or relative to the total amount of DTA) is also insignificant for the disclosure decision.

IV – Deferred Taxes and Accounting Choice
127 © Astrid K. Chludek & Duc Hung Tran
5. Analysis of Determinants of Deferred Tax Assets for Tax Loss Carryforwards
5.1. Empirical Results
Panel C of Table IV.2 displays the descriptive statistics on the variables used in the analysis
of the determinants of DTA for TLC. Firms capitalize on average 12.59 percent of their tax
loss carryforwards (with a standard deviation of 0.1003 and a median of 10.78 percent). With
regard to compensation packages, the descriptive statistics reveal that bonus-based
compensation components exceed equity-based components considerably (42.51 percent
versus 8.36 percent of total annual compensation) for the majority of executives. This reflects
the emphasis on fixed and bonus-related compensation components in compensation
packages, which is typical for the German context. 20.59 percent of this subsample’s
observations feature a block ownership by the founding family. Consistent with the regression
results of the previous section on disclosure behavior, the subsample used for the following
analysis shows lower means of Share_perc, IR_Score, Aud_Deloitte, and Aud_PwC.
Panel D of Table IV.2 presents Pearson correlation coefficients. In particular the
guideline variables, as provided by IAS 12.36, show coefficient signs in the predicted
directions. These univariate results with respect to the guideline variables are replicated in the
multivariate results.
Estimation results are presented in Table IV.4. The results show that DTA for TLC are
generally recognized in accordance with the guidelines provided by IAS 12.36. For one thing,
the amount of taxable temporary differences (DTL) is positively related to the amount of
recognized DTA for TLC. For another thing, current positive (negative) performance (EBT)
results in c.p. more (less) recognized DTA for TLC consistent with persistence of earnings
entering expectations of future taxable income. Particularly recent pre-tax losses
(loss_history) affect the recognition of DTA significantly negatively in line with past losses
dampening future performance expectations and requiring more conservative recognition (see
also IAS 12.35).
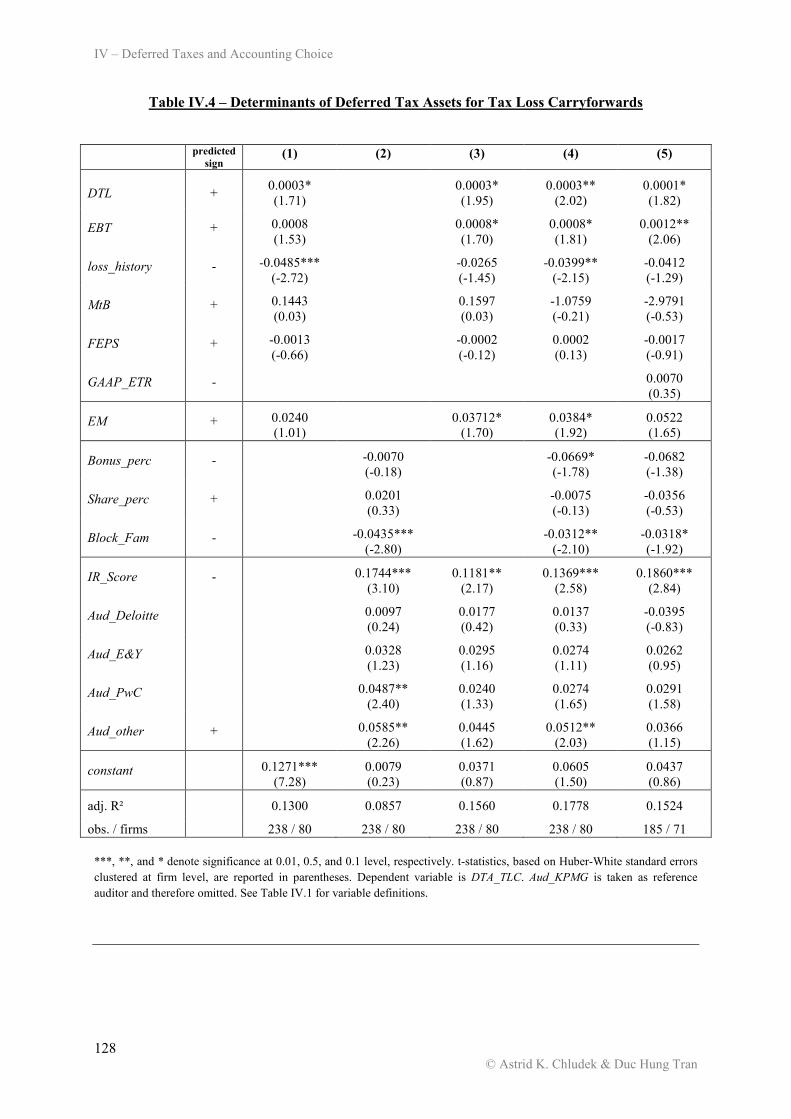
IV – Deferred Taxes and Accounting Choice
128 © Astrid K. Chludek & Duc Hung Tran
Table IV.4 – Determinants of Deferred Tax Assets for Tax Loss Carryforwards
predicted
sign (1) (2) (3) (4) (5)
DTL + 0.0003* (1.71)
0.0003* (1.95)
0.0003** (2.02)
0.0001* (1.82)
EBT + 0.0008 (1.53)
0.0008* (1.70)
0.0008* (1.81)
0.0012** (2.06)
loss_history - -0.0485*** (-2.72)
-0.0265 (-1.45)
-0.0399** (-2.15)
-0.0412 (-1.29)
MtB + 0.1443 (0.03)
0.1597 (0.03)
-1.0759 (-0.21)
-2.9791 (-0.53)
FEPS + -0.0013 (-0.66)
-0.0002 (-0.12)
0.0002 (0.13)
-0.0017 (-0.91)
GAAP_ETR -
0.0070 (0.35)
EM + 0.0240 (1.01)
0.03712*
(1.70) 0.0384* (1.92)
0.0522 (1.65)
Bonus_perc -
-0.0070 (-0.18)
-0.0669* (-1.78)
-0.0682 (-1.38)
Share_perc +
0.0201 (0.33)
-0.0075 (-0.13)
-0.0356 (-0.53)
Block_Fam -
-0.0435*** (-2.80)
-0.0312**
(-2.10) -0.0318* (-1.92)
IR_Score -
0.1744*** (3.10)
0.1181** (2.17)
0.1369*** (2.58)
0.1860*** (2.84)
Aud_Deloitte
0.0097 (0.24)
0.0177 (0.42)
0.0137 (0.33)
-0.0395 (-0.83)
Aud_E&Y
0.0328 (1.23)
0.0295 (1.16)
0.0274 (1.11)
0.0262 (0.95)
Aud_PwC
0.0487** (2.40)
0.0240 (1.33)
0.0274 (1.65)
0.0291 (1.58)
Aud_other +
0.0585** (2.26)
0.0445 (1.62)
0.0512** (2.03)
0.0366 (1.15)
constant
0.1271*** (7.28)
0.0079 (0.23)
0.0371 (0.87)
0.0605 (1.50)
0.0437 (0.86)
adj. R² 0.1300 0.0857 0.1560 0.1778 0.1524
obs. / firms 238 / 80 238 / 80 238 / 80 238 / 80 185 / 71
***, **, and * denote significance at 0.01, 0.5, and 0.1 level, respectively. t-statistics, based on Huber-White standard errors
clustered at firm level, are reported in parentheses. Dependent variable is DTA_TLC. Aud_KPMG is taken as reference
auditor and therefore omitted. See Table IV.1 for variable definitions.

IV – Deferred Taxes and Accounting Choice
129 © Astrid K. Chludek & Duc Hung Tran
While past as well as current performance are taken into account for determining the
recognizable amount of DTA, future performance expectations as measured by analysts’ one-
year-ahead earnings forecasts (FEPS) and growth opportunities as represented by the market-
to-book ratio (MtB) are insignificant.121 Furthermore, the availability of tax planning
strategies as indicated by GAAP_ETR is also not relevant for determining the probably
utilizable amount of tax loss carryforwards (Model (5)).122
With respect to earnings management via DTA for TLC, we find some limited
evidence that firms might tend to recognize more if this helps them to meet the analysts’ EPS
forecast.123
The estimation results show further that transparency as well as governance variables
are significantly related to the recognized amount of DTA for TLC. Inclusion of these
variables increases the explanatory power of the model as measured by adjusted R-squared
from 0.1300 to 0.1778 (Model (4)). Thus, we can identify other significant factors, beyond
IAS-12-guidelines and earnings management incentives, that influence the recognition
decision.
In particular, firms with large shares of the firm held by the founding family
(Block_Fam) tend to recognize a c.p. lower amount of DTA for TLC, in line with family firms
setting less incentives to report overoptimistically and improved monitoring in family firms.
Evidence with respect to management remuneration is only modest, though. The
insignificant coefficient of the share-based compensation component (Share_perc) suggests
that managers do generally not assume DTA for TLC to be considered value-relevant by
investors.124 Using the percentage of equity-based to total annual compensation, though,
assumes in a linear model context that the inducement to recognize overoptimistically
increases in the share of equity-based compensation. If we relax this assumption and
121 If we assume perfect foresight on the part of the management and, therefore, include one-year-ahead realized ROA, its coefficient estimate is also insignificant. 122 Summing current tax expense over the four observation years and dividing by the sum of pre-tax income, by this means obtaining a smoothed measure of tax burden, also gives an insignificant coefficient estimate. Moreover, using an indicator variable instead, identifying firms with available tax planning strategies by using various thresholds, likewise results in insignificant coefficient estimates. Our insignificant findings are in line with Miller and Skinner (1998), who point out that tax planning opportunities are not likely to be important sources of generating taxable income for using otherwise unused tax loss carryforwards since such strategies are only limited in scope (see also ASC 740-10-30-18 through 30-19 and 740-10-55-39 through 55-48, formerly SFAS No. 109, para. 246-251). Consistently, Visvanathan (1998) reports that only very few firms acknowledge the use such strategies and even less show income effects of such strategies. 123 Other earnings management incentives, like avoiding a loss or decline in earnings, are insignificant. Yet, our results with respect to earnings management have to be interpreted with caution. Due to the small sample size, only 2.52 percent of the observations meet the criterion to possibly shift their earnings from missing to meeting/beating the analyst forecast by the reported change in DTA for TLC and are therefore indicated as possible earnings manager. 124 Consistently, Chludek (2011) shows that total DTA as well as DTA for TLC are not value-relevant for a similar sample.

IV – Deferred Taxes and Accounting Choice
130 © Astrid K. Chludek & Duc Hung Tran
hypothesize instead, by using an indicator variable, that the incentive to recognize
overoptimistically in order to influence share price positively should be present as soon as the
manager is compensated with at least one share, results are unchanged.
Bonus compensation (Bonus_perc) is only marginally related to the recognized
amount of DTA for TLC. The coefficient estimate, however, shows the expected negative
sign across all model specifications. The modest evidence on this variable might be
attributable to the fact that bonus payments depend in many cases on pre-tax figures, thereby
excluding the effect of changes in DTA for TLC (see Johnson 2010).
Transparency is highly significantly related to the disclosed amount of DTA for TLC.
Yet, contrary to expectations, the coefficient estimate of our transparency score, IR_Score, is
positive, i.e., firms with an overall higher transparency score tend to recognize c.p. more DTA
for TLC. The unexpectedly positive coefficient might be due to correlated omitted variables,
more transparent firms possible tending to be “better” firms, in the sense of having better and
more persistent future performance prospects, therefore being able to recognize a higher
amount of deferred tax benefits.125
As far as the role of auditors for differences in recognized amounts is concerned, there
is some limited evidence that firms audited by smaller audit firms (Aud_other) and by PwC
(Aud_PwC) are able to recognize higher amounts of DTA for TLC.
Overall, our significant findings give some insights into the financial reporting
process, where not the accounting standard alone, but other factors such, as transparency as
well as governance structures, shape the financial reporting outcome.
5.2. Sensitivity Analysis
5.2.1. Dependent Variable
To ensure that differences in expected tax rates, which are implicitly included in the ratio of
recognized DTA for TLC relative to the total amount of tax loss carryforwards, do not drive
the results, we replicate the analysis using the ratio of recognized tax loss carryforwards
relative to the total amount of tax loss carryforwards (recTLC_TLC) as dependent variable
(Model (1) in Table IV.5).126 Results are generally confirmed. In particular, bonus
compensation (Bonus_perc) and a family blockholder (Block_Fam), overall transparency
125
Potential problems of correlated omitted variables are addressed in the following Section 5.2.2. 126 Due to differences in disclosure (see above), this ratio is only computable for 199 observations. We eliminate 16 observations for which recTL C_TLC equals 1 because of lacking variation in the dependent variable for these observations. For additional 7 observations, other variable data are missing, so that the model estimation is based on 176 observations.

IV – Deferred Taxes and Accounting Choice
131 © Astrid K. Chludek & Duc Hung Tran
(IR_Score), and audit firm significantly affect the relative amount of recognized tax loss
carryforwards.
5.2.2. Endogeneity
The empirical tests in the preceding section classify the transparency variable IR_Score as
exogenously determined. Yet, there might arise a potential endogeneity problem (i.e.,
independent variables are correlated with the error term) due to two reasons. First, we cannot
be sure of the direction of causality, since firms with higher DTA_TLC may opt for a higher
transparency level. Second, IR_Score might be endogenously determined by a set of factors
that have not been taken into account. In this case, endogeneity would come from
uncontrolled confounding variables (omitted variable bias). In any case, if the assumption of
exogeneity does not hold, the regression model is misspecified and leads to biased parameter
estimates.
Following Hail (2002), we address the issue of potential endogeneity of IR_Score by
employing linear instrumental variables regressions (2SLS), modelling in a first step a firm’s
transparency choice. This procedure will yield consistent and efficient coefficient estimates
even in the presence of endogeneity. In the first-stage regression, a firm’s transparency choice
is analyzed by using the following model:
(5) IR_Scoreit = ß0 + ß1* lnMVit + ß2*ROAit + ß3*crosslist it + ß4* levit + γit
We relate the transparency score IR_Score to size (lnMV), return on assets (ROA),
leverage (lev), and cross-listing (crosslist) because these factors are supposed to mainly affect
transparency according to prior literature (Jensen 1986, Leuz and Wysocki 2008). lnMV
denotes the natural logarithm of market value and lev represents leverage. ROA equals the
ratio of net income to total assets and crosslist is an indicator variable taking the value of 1 if
the firm is cross-listed on a US stock exchange, and 0 otherwise. The explanatory power of
this regression model is 30.20 percent (adjusted R-squared). Apart from crosslist, all
coefficient estimates are significant at 7 percent level or better, and show the expected signs
(not reported).
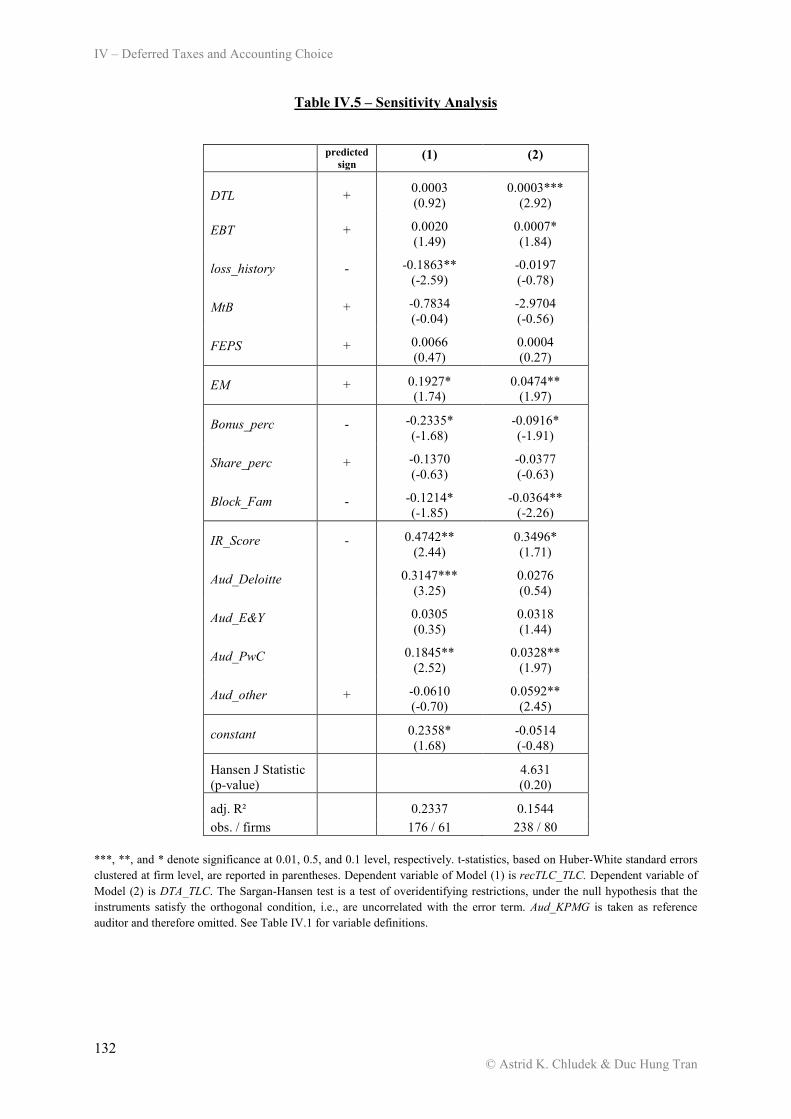
IV – Deferred Taxes and Accounting Choice
132 © Astrid K. Chludek & Duc Hung Tran
Table IV.5 – Sensitivity Analysis
predicted
sign (1) (2)
DTL + 0.0003 (0.92)
0.0003*** (2.92)
EBT + 0.0020 (1.49)
0.0007* (1.84)
loss_history - -0.1863** (-2.59)
-0.0197 (-0.78)
MtB + -0.7834 (-0.04)
-2.9704 (-0.56)
FEPS + 0.0066 (0.47)
0.0004 (0.27)
EM + 0.1927* (1.74)
0.0474** (1.97)
Bonus_perc - -0.2335* (-1.68)
-0.0916* (-1.91)
Share_perc + -0.1370 (-0.63)
-0.0377 (-0.63)
Block_Fam - -0.1214* (-1.85)
-0.0364** (-2.26)
IR_Score - 0.4742** (2.44)
0.3496* (1.71)
Aud_Deloitte 0.3147*** (3.25)
0.0276 (0.54)
Aud_E&Y 0.0305 (0.35)
0.0318 (1.44)
Aud_PwC 0.1845** (2.52)
0.0328** (1.97)
Aud_other + -0.0610 (-0.70)
0.0592** (2.45)
constant
0.2358* (1.68)
-0.0514 (-0.48)
Hansen J Statistic (p-value)
4.631 (0.20)
adj. R² 0.2337 0.1544
obs. / firms 176 / 61 238 / 80
***, **, and * denote significance at 0.01, 0.5, and 0.1 level, respectively. t-statistics, based on Huber-White standard errors
clustered at firm level, are reported in parentheses. Dependent variable of Model (1) is recTLC_TLC. Dependent variable of
Model (2) is DTA_TLC. The Sargan-Hansen test is a test of overidentifying restrictions, under the null hypothesis that the
instruments satisfy the orthogonal condition, i.e., are uncorrelated with the error term. Aud_KPMG is taken as reference
auditor and therefore omitted. See Table IV.1 for variable definitions.

IV – Deferred Taxes and Accounting Choice
133 © Astrid K. Chludek & Duc Hung Tran
In the second step, we re-estimate Model (4) (Table IV.4) replacing the original values
of IR_Score by the fitted values obtained from the first-stage regression. The results of the
2SLS-estimation, presented in Table IV.5 Model (2), show that the association of IR_Score
and DTA_TLC does not change qualitatively. The same applies to all other variables of
interest, with the exception of loss_history, which loses its statistical significance.
The results of the Sargan-Hansen test, which examines the appropriateness of the
instruments (i.e., whether they satisfy the orthogonal condition, thus being uncorrelated with
the error term), shows that the validity of the selected instrumental variables cannot be
rejected (Sargan-Hansen p-value is 0.20). Taken together, these findings provide some
indication that the results regarding IR_Score are not attributable to endogeneity.

IV – Deferred Taxes and Accounting Choice
134 © Astrid K. Chludek & Duc Hung Tran
6. Summary and Conclusion
Using regression analysis, we examine in this paper the underlying factors of financial
reporting outcome by focusing on deferred tax asset recognition and related disclosures under
IAS 12. In a first step, we analyze the heterogeneity of income tax disclosures concerning
unrecognized amounts of deferred tax assets under IFRS. According to the findings, the
likelihood to disclose a valuation allowance and the total amount of tax loss carryforwards
increases considerably if the firm prepared financial statements according to US GAAP
before 2005. This finding documents inter-temporal consistency in reporting even across
accounting standards. Besides, the results document that share-based compensation
incentivizes not to disclose a valuation allowance, which is in line with a negative valuation
effect of the valuation allowance (Kumar and Visvanathan, 2003). Regarding auditor effects,
there is a marginally significant effect of firms audited by a non-Big4 audit firm being less
likely to disclose a valuation allowance, while firms audited by Deloitte or PwC tend to be
less likely to disclose the total amount of tax loss carryforwards.
In the second step, we identify possible determinants of recognized deferred tax assets
beyond recognition criteria provided by accounting standards, namely governance and
transparency variables. Our results document that, in line with the guidelines provided by IAS
12, firms take the amount of taxable temporary differences, past and current profitability into
account when determining the probably utilizable amount of tax loss carryforwards.
Regarding earnings management via DTA for TLC, we find some limited evidence that firms
might tend to recognize more if this enables to meet the analysts’ EPS forecast.
With regard to governance attributes, we find that firms with a block ownership by the
founding family tend to recognize a c.p. lower amount of DTA for TLC. Furthermore, there is
some evidence of compensation being systematically related to the recognized amount of
DTA for TLC. Transparency is highly significantly related to the recognized amount of DTA
for TLC. As far as the role of auditors is concerned, there is evidence that firms audited by
smaller audit firms and PwC are able to recognize c.p. higher amounts of DTA for TLC,
which corresponds to our previous results that these audit firms require less detailed
disclosures.
Taken together, we can identify other significant factors, beyond IAS-12-guidelines
and earnings management incentives, that influence the recognition decision of DTA. Hence,
the results of this study provide some additional insights into the financial reporting process,
where not the accounting standard alone, but other factors, such as transparency as well as
governance structures, shape the financial reporting outcome.

IV – Deferred Taxes and Accounting Choice
135 © Astrid K. Chludek & Duc Hung Tran
However, our research has its limitations, and future avenues can be suggested. Since
this study is based on firm’s choices, the issues of self-selection and endogeneity are
addressed by using instrumental variables (IV). Therefore, instrumental variables need to be
identified that are correlated with the endogenous explanatory variables, but uncorrelated with
the error in the structural equation. Unfortunately, these requirements are difficult to satisfy,
since no well developed economic models exist that explain the determinants of corporate
disclosure structures (Hermalin and Weisbach 2003).
A possibility for further investigation would be an exploration of the subjective factors
(such as transparency and corporate governance) and whether they affect the credibility of the
signal provided by the recognition ratio of DTA.

IV – Deferred Taxes and Accounting Choice
136 © Astrid K. Chludek & Duc Hung Tran

137
References
Ali, A., T.-Y. Chen, and S. Radkrishnan. 2007. Corporate disclosures by family firms.
Journal of Accounting and Economics, 44 (1-2): 238-286.
Amir, E., M. Kirschenheiter, and K. Willard. 1997. The valuation of deferred taxes.
Contemporary Accounting Research, 14 (4): 597–622.
Amir, E., and T. Sougiannis. 1999. Analysts’ Interpretation and Investors’ Valuation of Tax
Carryforwards. Contemporary Accounting Research 16 (1): 1-33.
Anderson, R.C., A. Duru, and D.M. Reeb. 2009. Founders, heirs, and corporate opacity in the
United States. Journal of Financial Economics, 92 (2): 205-222.
Arellano, M., and S. Bond. 1991. Some tests of specification for panel data: Monte Carlo
evidence and an application to employment equations. Review of Economic Studies 58
(2): 277-297.
Arellano, M., and O. Bover. 1995. Another look at the instrumental variables estimation of
error-components models. Journal of Econometrics 68 (1): 29-51.
Ayers, B. C. 1998. Deferred tax accounting under SFAS No. 109: An empirical investigation
of its incremental value-relevance relative to APB No. 11. The Accounting Review 73
(2): 195–212.
Ball, R., and L. Shivakumar. 2005. Earnings Quality in U.K. Private Firms. Journal of
Accounting and Economics, 39 (1): 83-128.
Barth, M.E., W.H. Beaver, and W.R. Landsman. 1998. Relative valuation roles of equity book
value and net income as a function of financial health. Journal of Accounting and
Economics 25 (1): 1–34.
Bauman, C.C., M.P. Bauman, and R.F. Halsey. 2001. Do firms use the deferred tax asset
valuation allowance to manage earnings? Journal of the American Taxation
Association, 23 (Supplement): 27-48.
Beckman, J., C. Brandes, and B. Eierle. 2007. German reporting practices: An analysis of
reconciliations from German Commercial Code to IFRS or U.S. GAAP. Advances in
International Accounting, 20: 253–294.
Beechy, T.H. 2007. The Make-Believe World of Future Income Taxes. Accounting
Perspectives 6 (3): 221-229.
Behn, B.K., T.V. Eaton, and J.R. Williams. 1998. The Determinants of the Deferred Tax
Allowance Account Under SFAS No. 109. Accounting Horizons 12 (1): 63-78.
Blouin, J., and I. Tuna. 2009. Tax contingencies: Cushioning the blow to earnings? Working
paper, University of Pennsylvania.
Blundell, R., and S. Bond. 1998. Initial conditions and moment restrictions in dynamic panel
data models. Journal of Econometrics 87: 115-143.
Burgstahler, D.C., and I.D. Dichev. 1997. Earnings, adaptation and equity value. The
Accounting Review 72 (2): 187–215.

138
Burgstahler, D., B.W. Elliott, and M. Hanlon. 2002. How Firms Avoid Losses: Evidence of
Use of the Net Deferred Tax Asset Account. Working Paper SSRN.
Burgstahler, D., L. Hail, and C. Leuz. 2006. The Importance of Reporting Incentives:
Earnings Management in European Private and Public Firms. Accounting Review, 81
(5): 983-1016.
Carnahan, I., and J. Novack, 03/04/2002. Two Birds, One Stone. Forbes Magazine 169 (5).
Chandra, U., and B.T. Ro. 1997. The association between deferred taxes and common stock
risk. Journal of Accounting and Public Policy 16 (1): 6–13.
Chaney, P.K., and D.C. Jeter. 1989. Accounting for deferred income taxes: Simplicity?
Usefulness? Accounting Horizons 3 (June): 6–13.
Chang, C., K. Herbohn, and I. Tutticci. 2009. Market’s perception of deferred tax accruals.
Accounting and Finance 49 (4): 645-673.
Chattopadhyay, S., F.J. Arcelus, and G. Srinivasan. 1997. Deferred Taxes and Bond Ratings:
a Canadian Case. Journal of Business Finance & Accounting 24 (3&4): 541-557.
Chen, K.C.W., and M.P. Schoderbek. 2000. The 1993 Tax Rate Increase and Deferred Tax
Adjustments: A Test of Functional Fixation. Journal of Accounting Research 38 (1):
23-44.
Chen, T.-Y., S. Dasgupta, and Y. Yu. 2010. Transparency and financing choices of family
firms. Working Paper SSRN.
Cheung, J.K., G.V. Krishnan, and C. Min. 1997. Does Interperiod Income Tax Allocation
Enhance Prediction of Cash Flows? Accounting Horizons 11 (4): 1-18.
Chludek, A.K. 2011. Perceived versus Actual Cash Flow Implications of Deferred Taxes – An
Analysis of Value Relevance and Reversal under IFRS. Journal of International
Accounting Research 10 (1): 1-25.
Chow, C.W., and A. Wong-Boren (1987): Voluntary financial disclosure by Mexican
corporations. The Accounting Review 62 (3): 533-541.
Christensen, T., G.H. Paik, and E.K. Stice. 2008. Creating a bigger bath using the deferred tax
valuation allowance. Journal of Business Finance & Accounting 35 (5&6): 601-625.
Citron, D.B. 2001. The Valuation of Deferred Taxation: Evidence from the UK Partial
Provision Approach. Journal of Business Finance & Accounting 28 (7&8): 821-852.
Colley, R., J. Rue, and A. Volkan. 2009. Continuing Case Against Inter-Period Tax
Allocation. Journal of Business & Economics Research 7 (6): 13-23.
Commission of the European Communities. 2007. Communication from the Commission on a
simplified business environment for companies in the areas of company law,
accounting and auditing. COM(2007) 394 final. Available at:
http://ec.europa.eu/internal_market/company/docs/simplification/com2007_394_en.pd
f.

139
Daske, H. 2005. Adopting International Financial Reporting Standards in the European
Union: Empirical Essays on Causes, Effects and Economic Consequences. Frankfurt
am Main.
DeAngelo, L.E. 1981. Auditor size and audit quality. Journal of Accounting and Economics 3
(3): 183-199.
Dyreng, S.D., M. Hanlon, and E.L. Maydew. 2008. Long-Run Coporate Tax Avoidance. The
Accounting Review 83 (1): 61-82.
Dyreng, S.D., M. Hanlon, and E.L. Maydew. 2010. The Effects of Executives on Corporate
Tax Avoidance. The Accounting Review 85 (4): 1163-1189.
Eierle, B., A. Haller, and K. Beiersdorf. 2007. Final Report of the Survey on the ED-IFRS for
SMEs among German SMEs. Berlin, Germany: DRSC. Available at:
http://www.standardsetter.de/drsc/docs/press_releases/071129FinalReport_SME.pdf.
Feltham, G. A., and J. A. Ohlson. 1995. Valuation and clean surplus accounting for operating
and financial activities. Contemporary Accounting Research 11 (2): 689–731.
Frank, M.M., and S.O. Rego. 2006. Do Managers Use the Valuation Allowance Account to
Manage Earnings Around Certain Earnings Targets? Journal of the American Taxation
Association 28 (1): 43-65.
Frank, M.M. 2009. Discussion of Inferring U.S. Tax Liability from Financial Statement
Information. The Journal of the American Taxation Association 31 (1): 65-74.
Gordon, E.A., and P.R. Joos. 2004. Unrecognized Deferred Taxes: Evidence from the U.K.
The Accounting Review 79 (1): 97-124.
Graham, J.R., J. S. Raedy, and D.A. Shackelford. 2011. Research in Accounting for Income
Taxes. Working Paper.
Greene, W.H., 2003. Econometric Analysis (5th ed). Prentice Hall, New Jersey.
Hail, L. 2002. The impact of voluntary corporate disclosure on the ex-ante cost of capital for
swiss firms. European Accounting Review 11 (4): 741-773.
Hall, B.J., and J.B. Liebman. 2000. The Taxation of Executive Compensation. Tax Policy and
the Economy 14. Cambridge, MA: MIT Press.
Haller, A., J.V. Löffelmann, K. Beiersdorf, M. Bolin, B. Etzel, and K. Haussmann. 2008.
Rechnungslegung aus Sicht von Kreditinstituten als Rechnungslegungsaddressaten—
Empirische Ergebnisse und Implikationen für die Entwicklung der Nationalen und
Internationalen Rechnungslegungsnormen für Mittelständische Unternehmen. Berlin,
Germany: DRSC.
Hanlon, M., and T. Shevlin. 2002. Accounting for Tax Benefits of Employee Stock Options
and Implications for Research. Accounting Horizons 16 (1): 1-16.
Hanlon, M. 2003. What Can We Infer about a Firm’s Taxable Income from Its Financial
Statements? National Tax Journal 56 (4): 831-863.

140
Hayn, C. 1995. The information content of losses. Journal of Accounting and Economics 20:
125–153.
Huss, F.H., and J. Zhao. 1991. An investigation of alternative treatments of deferred taxes in
bond raters’ judgment. Journal of Accounting, Auditing and Finance: 53–73.
Herbohn, K., I. Tutticci, and P.S. Khor. 2010. Changes in Unrecognized Deferred Tax
Accruals from Carry-Forward Losses: Earnings Management or Signalling? Journal of
Business Finance & Accounting 37 (7&8): 763-791.
Hermalin, B.E., and M.S. Weisbach. 2003. Boards of Directors as an Endogenously
Determined Institution: A Survey of the Economic Literature. Economic Policy
Review 9 (1): 7–26.
Jensen, M.C. 1986. Agency costs of free cash flow, corporate finance, and takeovers.
American Economic Review 76 (1): 323-329.
Jensen, M.C. 2000. A Theory of the Firm: Governance, Residual Claims, and Organizational
Forms. Harvard University Press: Cambridge.
Johnson, N.B. 2010. Residual Income Compensation Plans and Deferred Taxes. Journal of
Management Accounting Research 22: 103-114.
Kumar, K.R., and G. Visvanathan. 2003. The Information Content of the Deferred Tax
Valuation Allowance. The Accounting Review 78 (2): 471-490.
Legoria, J., and K.F. Sellers. 2005. The Analysis of SFAS No. 109’s Usefulness in Predicting
Future Cash Flows from a Conceptual Framework Perspective. Research in
Accounting Regulation 18: 143-161.
Leuz, C. 2006. Cross Listing, Bonding and Firms’ Reporting Incentives: A Discussion of
Lang, Raedy and Wilson (2006). Journal of Accounting and Economics 42 (1-2): 285-
299.
Leuz, C., and P.D. Wysocki. 2008. Economic Consequences of Financial Reporting and
Disclosure Regulation: A Review and Suggestions for Future Research. Working
Paper SSRN.
Lisowsky, P. 2009. Inferring U.S. Tax Liability from Financial Statement Information. The
Journal of the American Taxation Association 31 (1): 29-63.
Lev, B., and D. Nissim. 2004. Taxable income, future earnings, and equity values. The
Accounting Review 79 (4): 1039–1074.
Miller, G.S., and D.J. Skinner. 1998. Determinants of the valuation allowance for deferred tax
assets under SFAS No. 109. The Accounting Review 73 (2): 213-233.
Mills, L., K. Newberry, and W. B. Trautman. 2002. Trends in book-tax income and balance
sheet differences. Tax Notes 96 (19): 1109–1124.
Nickell, S. 1981. Biases in Dynamic Models with Fixed Effects. Econometrica 49 (6): 1417-
1426.

141
Noelte, U. 2008. Managementprognosen, Analystenschaetzungen und Eigenkapitalkosten:
Empirische Analysen am deutschen Kapitalmarkt. University of Bochum.
Ohlson, J.A. 1995. Earnings, book values, and dividends in equity valuation. Contemporary
Accounting Research 11 (2): 661–687.
Plumlee, M. 2003. The effect of information complexity on analysts’ use of that information.
The Accounting Review 78 (1): 275–296.
Raedy, J. S., J. Seidman, and D.A. Shackelford. 2011. Is there Information Content in the Tax
Footnote? Working Paper.
Rego, S.O. 2003. Tax-Avoidance Activities of U.S. Multinational Corporations.
Contemporary Accounting Research 20 (4): 804-833.
Roodman, D. 2006. How to Do xtabond2: An Introduction to “Difference” and “System”
GMM in Stata. Working Paper 103. Center for Global Development, Washington.
Schrand, Cathrine M. and Franco Wong (2003): Earnings management using the valuation
allowance for deferred tax assets under SFAS No. 109, Contemporary Accounting
Research 20 (3): 579-611.
Shleifer, A., and R.W. Vishny. 1986. Large Shareholders and Corporate Control. The Journal
of Political Economy 94 (3): 461-488.
Stadler, C. 2010. Pension Accounting Choice in Germany: Pension Discount Rate and
Actuarial Gains and Losses. Working Paper, University of London, School of
Management.
Stocker, T. 2007. On the Asymptotic Bias of OLS in Dynamic Regression Models with
Autocorrelated Errors. Statistical Papers 48 (1): 81-93.
Visvanathan, G. 1998. Deferred tax valuation allowances and earnings management. Journal
of Financial Statement Analysis 3 (4): 6-15.
Wang, D. 2006. Founding family ownership and earnings quality. Journal of Accounting
Research 44 (3): 619-656.
Weber, D. P. 2009. Do analysts and investors fully appreciate the implications of book-tax
differences for future earnings? Contemporary Accounting Research 26 (4): 1175–
1206.
Windmeijer, F. 2005. A finite sample correction for the variance of linear efficient two-step
GMM estimators. Journal of Econometrics 126 (1): 25-51.

142

143
Acknowledgements
The author appreciates the helpful and beneficial comments from Norbert Herzig, Doug Shackelford,
Michelle Hanlon, Wayne Landsman, Ed Maydew, Christoph Kuhner, Joachim Gassen, Sönke Sievers,
Christoph Watrin, Rainer Niemann, Christian Schade, participants at the 34th EAA Annual Congress,
at the Workshop on Current Research in Taxation at the Westfälische Wilhelms-Universität Münster,
as well as participants at Research Seminars at Kenan-Flagler Business School/University of North
Carolina, Humboldt University Berlin, University of Cologne, Friedrich-Alexander Universität
Erlangen-Nürnberg. The author further thanks two anonymous reviewers of the Journal of
International Accounting Research for their helpful comments and suggestions.
The author thanks Prof. Dr. Norbert Herzig for supervising the dissertation project and Prof. Dr.
Christoph Kuhner for providing the second opinion. Additionally, the author thanks Prof. Dr. Carsten
Homburg for heading the disputation committee.
The author sincerely thanks Duc Hung Tran for co-authorship, pleasant and smooth collaboration.
Moreover, the author sincerely thanks Prof. Dr. Sönke Sievers and Prof. Doug Shackelford for support
and for the opportunity to attend Kenan-Flagler.
The author gratefully acknowledges funding by the DFG, by the University of Cologne, and, first and foremost, by Karin Chludek and Adrian Chludek. Special thanks for system administration go to Alexander Chludek XO