Embed Size (px)
Citation preview
American Institute of Aeronautics and Astronautics
1
The Ice Particle Threat to Engines in Flight
Jeanne G. Mason* Boeing Commercial Airplanes , Seattle WA, USA, 98124
J. Walter Strapp† Environment Canada, 4905 Dufferin St., Downsview, ON, M3H 5T4, Canada
Philip Chow ‡ Honeywell International, 111 S. 34 St., Phoenix, Arizona, USA, 85034
This paper discusses jet engine powerloss and damage due to ingestion of ice particles. In the mid-90s several commercial airplane jet engines experienced more frequent powerloss in ice particle conditions, resulting in a focused investigation, and a greater awareness that led to recognition of similar events on other aircraft. Since the mid-90s, events have been more numerous, and costly, and have generated greater industry interest. These events have been predominately associated with flight at high altitude near deep convective systems, often in tropical regions. Data are presented from flight-testing and an event data base to support the contention that the events are caused by ingestion of high concentrations of ice particles, and that supercooled liquid water is either of secondary importance or not required. The basic theory of how ice accretes in the engine by this process is described. Complex issues facing industry to mitigate the problem, and simulation of the ice particle environment are discussed.
Nomenclature LWC = Liquid Water Content IWC = Ice Water Content TWC = Total Water Content = LWC + IWC TAT = Total Air Temperature
I. Introduction ince 1990, there have been a large number of jet engine powerloss events on commuter and large transport aircraft at altitudes higher than 22,000’, the extreme upper limit recognized in the industry for the existence of supercooled liquid water. This is significant, because at such altitudes the hydrometeors are largely expected to
be in the form of ice particles. These particles may be in the form of individual ice crystals, aggregates of crystals such as snowflakes, or crystals that have collided with supercooled water droplets to form more dense and spherical particles such as graupel and hail. Ice particles can span a very large size range, from microns to centimeters. In the past, ice particles were thought to be benign to the airframe and the engine due to the fact that frozen particles bounce off cold wing or engine component surfaces and do not result in any accretion. However this belief is challenged by the recent engine powerloss events. A deeper investigation into the influence of ice particles in jet engines has been initiated, and is discussed herein. Since the term “icing” is accepted in the industry to imply the accretion of supercooled liquid water on aircraft surfaces, and “icing conditions” is accepted to mean the environment where supercooled liquid water exists, in this article we will use the term ice particle icing to denote
* Senior Specialist Propulsion Engineer, Propulsion Systems Division, M/S 4T-54, P.O. Box 3707 Seattle WA 98124, AIAA Member. † Physical Scientist, Environment Canada, 4905 Dufferin St., Downsview, ON, M3H 5T4, Canada, AIAA Member ‡ Senior Principal Engineer, Honeywell International, 111 S. 34 St., Phoenix, Arizona, USA, 85034, AIAA Member
S
44th AIAA Aerospace Sciences Meeting and Exhibit9 - 12 January 2006, Reno, Nevada
AIAA 2006-206
Copyright © 2006 by Environment Canada , Boeing Commercial Airplanes. and Honeywell International . Published by the American Institute of Aeronautics and Astronautics, Inc., with permission.
American Institute of Aeronautics and Astronautics
2
the accretion caused by ice particles on aircraft/engine surfaces, and glaciated/mixed phase conditions to denote the environment where ice particles exist alone, or in combination with supercooled liquid. There have been over 240 icing related events listed since the 1990s, of which 62 have been categorized by an industry working group as turbofan powerloss likely due to ice particle icing. In this article, 46 events chosen for evaluation due to their more complete documenting data, including two detailed case studies of aircraft engine events are described in order to form a detailed hypothesis of the environment causing the engine problem. Further information on the chronology of the identification of events in the commuter and large transport aircraft database follow.
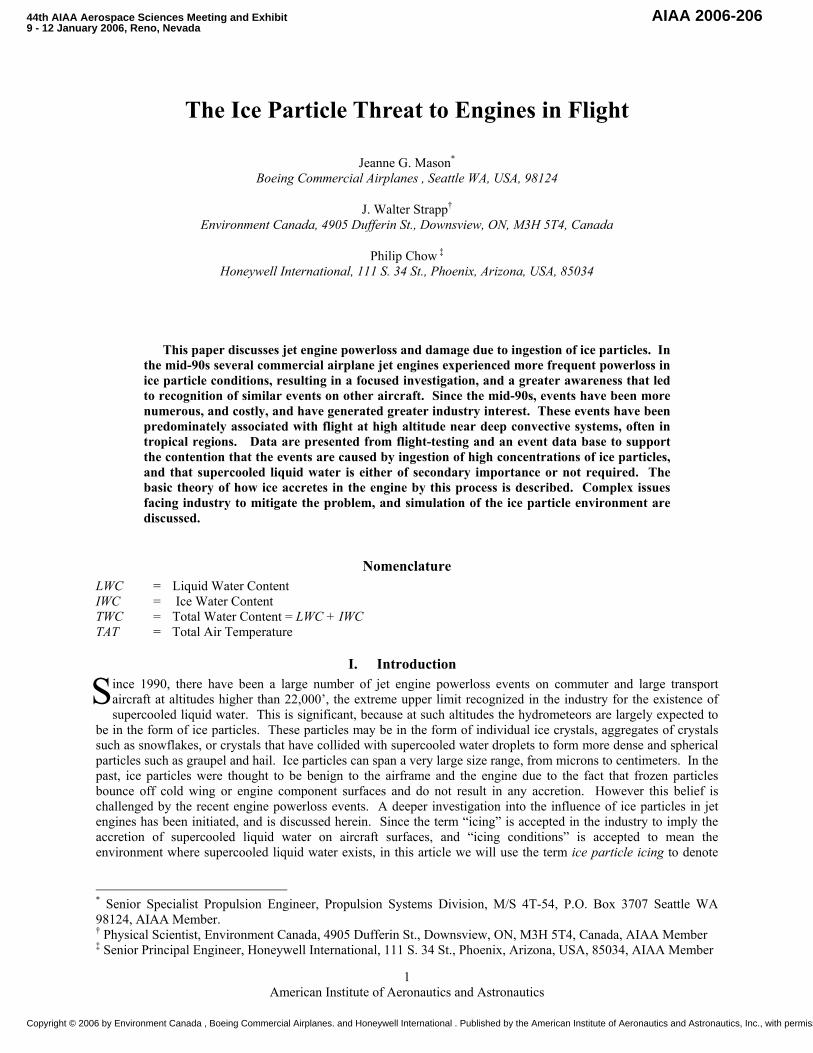
A. Commuter Transport Aircraft Engine Events During the mid-90s, a number of high bypass ratio turbofan engine powerloss events were experienced on commuter transport aircraft. The engines experienced uncommanded thrust reductions when cruising in the vicinity of major thunderstorms at altitudes between 28,000 and 31,000 feet. All incidents occurred under instrument meteorological conditions (IMC) in cloud, at thrust levels between 90 percent and 100 percent maximum continuous cruise power and with precipitation (rain, ice or visible moisture) and light to moderate turbulence reported. An early analysis of this commuter aircraft experience, and a description of the meteorological conditions present during commuter transport engine events has been provided by Lawson et al. (1998)1. Further discussion related to the event database herein is given in section II. The uncommanded thrust reduction manifested itself initially by a gradual decay in fan rotational speed and a final stabilization of the engine at a sub-idle operating condition. The engine speed decay was also associated with an increase of Turbine Gas Temperature (TGT) and a failure of the engine to respond to the pilot commanded thrust level, thereby, receiving the name “rollback”. Engines that were shut down from the sub-idle operating condition could be restarted at an altitude of about 10,000 feet Those engines not shut down recovered to normal operation at about the same altitude. Following considerable research and analysis complemented by flight tests conducted by the airframe and engine manufacturers, the cause of the rollbacks was determined to be the build up of ice on the second stage stator inside the engine core passage (Fig. 1) in ice particle meteorological conditions, and without the presence of significant supercooled liquid water. As the aircraft descended to warmer air at a lower altitude after the event, the ice blockage was released, making the engine recovery process possible. In the case of this specific type of commuter aircraft, results of the investigations have led to successful engine modifications, and events from this commuter aircraft have ceased. The data from one of the flights conducted during this flight test program are described in section IV, and the accretion of ice in the engine is further discussed in section VIIB.
B. Large Transport Aircraft Engine Events Large transport aircraft engine events are most evident since about 1990, although there may be earlier
unrecognized events. A summary of these events follows in section II. These events were found to have occurred near convective clouds. In early investigations it was presumed that supercooled liquid water, or perhaps rain or hail was lifted to high altitude by the updrafts characteristic of these clouds. Often the event report mentioned being in cloud, but when interviewed, the pilot reported no significant airframe icing, nor any particularly remarkable weather encounter. Some pilots were even surprised that the investigators suspected icing as the cause of the engine powerloss. Investigation was hindered by the lack of recorded data, particularly on older airplanes. Often the window of opportunity to retrieve the Flight Data Recorder (FDR) was missed, data quality was poor or the FDR on older airplanes did not record important engine parameters. Occasionally, the airline was able to provide the airplane latitude and longitude at the time of the event. When these data were available, it was possible to confirm the aircraft flew through a convective cloud, however, when considered with the pilot reports, the conclusion was
Fan
Low Pressure CompressorHigh Pressure Compressor
Intercompressor Bleed
Supercooled liquid water accretion areas (inlet, spinner, fan and first stages of the core)
Potential ice particle accretion areas
Core inlet stator
Core air travels downstream to the combustor
rotating blades (rotors)stationary blades (stators)
Figure 1: Typical turbofan engine compression systemschematic, with potential ice accretion sites noted.
American Institute of Aeronautics and Astronautics
3
that the aircraft had not flown through a region of high radar reflectivity or heavy turbulence. It was also concluded that hail was not likely the cause of the events due to the lack of any airframe damage. Known hail encounters that were severe enough to cause engine powerloss also typically produced damage such as radome dimpling.
The fact that the engines suffered powerloss§ allows one to conclude that the ice was accreting in the engine core rather than on the fan. Ice accreting ahead of the fan on the inlet or spinner, or on the fan itself, is most likely to shed radially outward into the fan bypass duct without causing a powerloss.
In the early 80s, a multiple engine large transport powerloss event occurred at 28,000’ and –40C, the theoretical coldest limit for supercooled liquid water. The investigators initially considered whether ice particles could be responsible, but failed to explain how ice particles could accrete on the engine. They argued that the engine airflow rate in flight, even at descent power levels was calculated to be high enough to prevent sufficient residence time for heat transfer to take place between the ice particle and the engine surfaces. Also, engine temperatures quickly reached well above freezing as the air progressed downstream, and were clearly adequate to melt particles. There was apparently no mechanism to refreeze the liquid downstream, once it was melted. The corrective action chosen for this event was to raise the engine descent rotor speed, and hence temperatures, and was successful in preventing further events in this engine-type. With the problem solved for this engine, no further effort was taken to explain how ice particles could be the source of the ice accretion.
By the 1990’s, three scenarios of ice accretion due to ice particles in engines were known. Two were discussed in the advisory material for engine certification2. First, airflow in an engine inlet duct with a high turning angle can stagnate and ice can accumulate. Second, high solidity (closely spaced) compressor stators can be susceptible to non-aerodynamic ice build-up and airflow blockage. A third mechanism for ice particle accretion known through industry experience is the melting of ice particles on anti-ice systems followed by accretion due to refreezing on cold surfaces downstream. None of these three mechanisms were thought to be present in the large jet transport engines, so another mechanism had to exist, but was unknown.
During the period of 1990-2003, large transport icing related engine powerloss events continued to occur, however many pilots reported a coincident heavy rain encounter. The report of rain threw off investigators, and these events were not correctly attributed to ice particle icing. In section V, this observation of rain is linked to the melting of ice particles on the windscreen. These events are only now being recognized as due to ice particles, and the overall efforts to understand them have led to the present study.
C. The Connection Between Commuter and Large Transport Aircraft Events In 2002 one large transport aircraft engine powerloss event occurred on an aircraft equipped with dual
Rosemount Ice Detectors (RIDs), one on each wing. When exposed to supercooled LWC, ice accretes on the exposed rod of the RID until it reaches a threshold mass, at which point deicing heat is applied to the rod and a ‘trip’ is registered. In this event, neither ice detector detected sufficient supercooled liquid water to cause a trip. At the same time, the aircraft total air temperature probe, and the engine total temperature probe showed evidence of ice crystal corruption, a known mechanism that will be discussed in section IV. This event was a turning point in the understanding that the engine failure was not linked to accretion by supercooled liquid water only, but was more likely due to ice particles or mixed phase icing. However, the exact mechanism of the accretion was not understood at that time.
The following year, the Ice Protection Harmonization Working Group** convened a sub-committee to consider how the Federal Aviation Regulations might be modified to address supercooled large drops and mixed-phase icing in the engine. It was only when this committee began to look at the similarity between the commuter aircraft experience and the unexplained transport aircraft powerloss events, that it was recognized that ice particles were also the most likely cause of the large transport aircraft events. Further it was recognized that the mechanism for ice accretion seen on the commuter aircraft engine was not unique, but possible on all jet engines.
§ In this paper, the term powerloss will be used to mean engine instability resulting in a sub-idle operating condition. ** Since 1999 the Ice Protection Harmonization Working Group (IPHWG) has been working to address an National Transportation Safety Board recommendation that the Federal Aviation Administration’s regulations be amended to include supercooled large drops and mixed phase icing. The sub-committee to the IPHWG considering engine icing is known as the Engine Harmonization Working Group (EHWG)
American Institute of Aeronautics and Astronautics
4
II. Commuter and Large Transport Aircraft Event Statistics
Data from 46 engine powerloss or core damage events were considered for this report. This event database includes nine different aircraft types, both large transport and commuter jets, and eight different engine types. While other engine powerloss events are now thought to be attributable to ice particles, insufficient event data are available for these events to draw significant conclusions. In addition, review of past event data (some as recent as 2002) shows that in some cases, events were attributed to icing, and successful corrective action was taken, without recognition that ice particles were responsible. These events have been included when sufficient data for analysis exists.
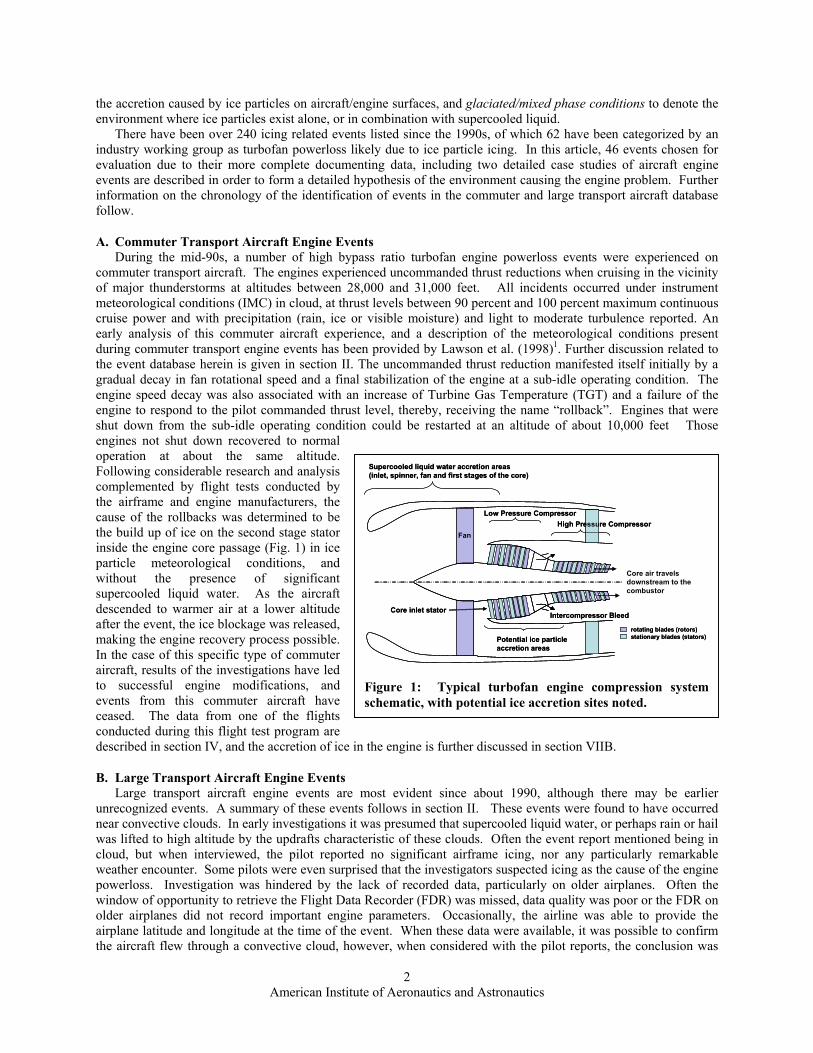
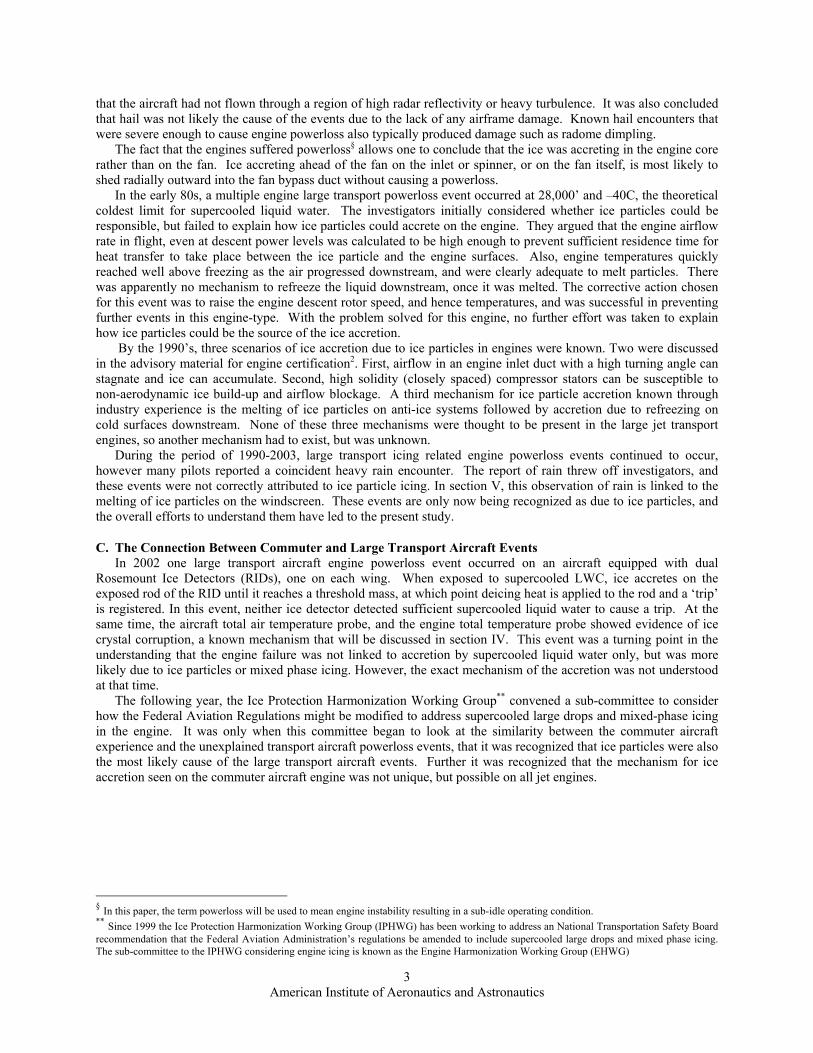
These data show that both older generation jet engines and the new generation of jet engines (high bypass ratio engines with electronic engine controls) can be affected by ice particle icing. The oldest airplane in the event database went into service in 1970, and the newest in 1995. It is impossible to determine whether the frequency of events has increased with time from these data, as it is not an exhaustive list. The locations of the events are plotted on Fig. 2. For 21 events the latitude and longitude of the engine powerloss are exactly known. If it is not known, and the aircraft was on descent, the destination airport location was plotted; if the aircraft was in cruise, the mean location between airports was plotted. There is a predominance of events in Asia, with 23 events occurring between 100 and 140 degrees East longitude. It is also evident that few events are further than 45 degrees from the equator. There is a heavy concentration of events between 20-40 degrees North latitude. Fig. 3 shows the altitude, and static air temperature range of the event data, where it is known. Note that most of the points lie
Figure 2: Locations of small commuter and large transport engine events for 46 events chosen for thisstudy, with inset of events in Asia-Pacific region.
-60
-50
-40
-30
-20
-10
0
0 5000 10000 15000 20000 25000 30000 35000 40000 45000Altitude, feet
Ambi
ent T
empe
ratu
re, C
Appendix C to FAR Part 25 Continuous Maximum
Appendix C to FAR Part 25 Intermittent Maximum
ISA +10
ISA +20
Figure 3: Event temperature-altitude envelope, superimposed on the Appendix C, FAR Part 25 icing envelopes. Temperature profiles exceeding the International Standard Atmosphere (ISA) by 10 and 20°C are also shown (ISA+10, ISA+20).
American Institute of Aeronautics and Astronautics
5
outside the FAR Part 25 Appendix C envelope23, and are generally found in a warmer atmosphere. Events occur as cold as ISA-5, but generally occur from ISA+10 to ISA+20. In the small number of cases (5) where the event occurred near the freezing level, other data, such as the aircraft total air temperature (TAT) anomaly (i.e. the corruption of the temperature measurement due to ice particles), were used to conclude ice particles were present. The TAT anomaly will be presented as a key indicator that ice particles were present in these events, and support for this contention will be provided in section V. The TAT anomaly was noted in 35 of the 46 events. Rosemount TAT sensors of similar design are installed on all of the airplanes in the event database. The TAT sensor response appears to be different depending on the location on the fuselage where the sensor is installed. This was concluded after examining the events for a single engine type, and TAT design that is installed on more than one airframe. For one airframe, none of the events showed the TAT anomaly, however meteorological analysis suggested that ice particles were present. The ambient temperature presented for events having TAT anomaly is either estimated by interpolating between good data, or from radiosonde soundings.
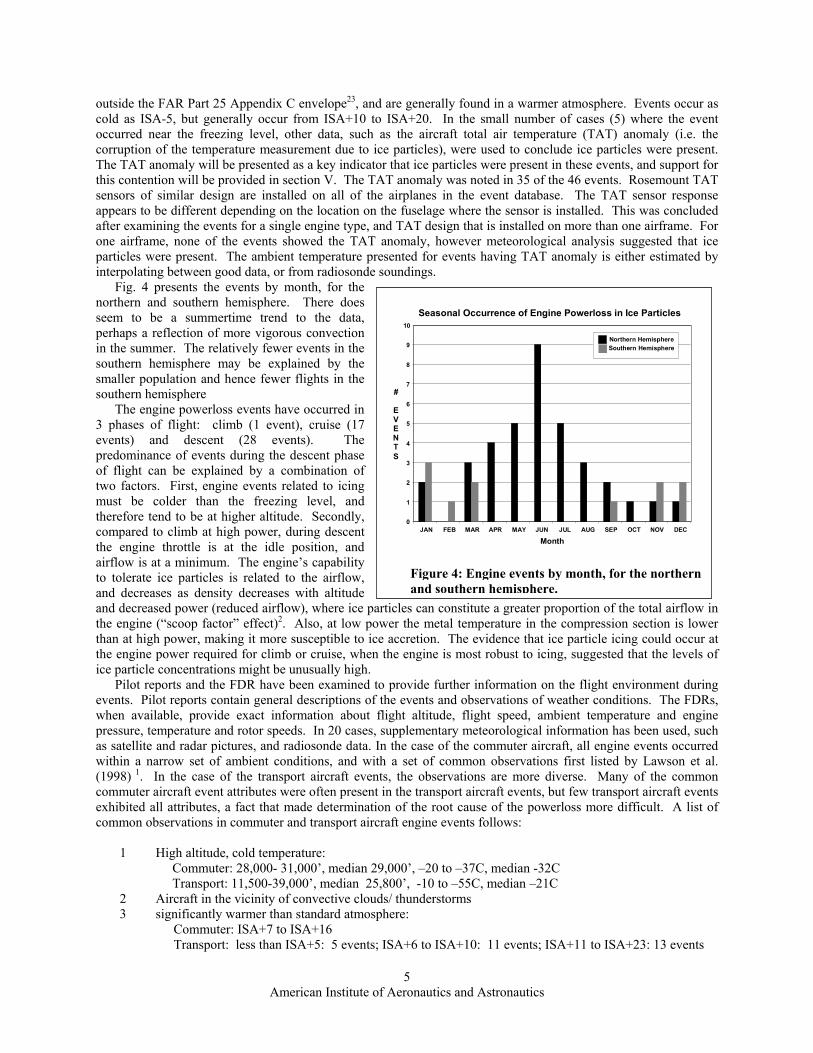
Fig. 4 presents the events by month, for the northern and southern hemisphere. There does seem to be a summertime trend to the data, perhaps a reflection of more vigorous convection in the summer. The relatively fewer events in the southern hemisphere may be explained by the smaller population and hence fewer flights in the southern hemisphere
The engine powerloss events have occurred in 3 phases of flight: climb (1 event), cruise (17 events) and descent (28 events). The predominance of events during the descent phase of flight can be explained by a combination of two factors. First, engine events related to icing must be colder than the freezing level, and therefore tend to be at higher altitude. Secondly, compared to climb at high power, during descent the engine throttle is at the idle position, and airflow is at a minimum. The engine’s capability to tolerate ice particles is related to the airflow, and decreases as density decreases with altitude and decreased power (reduced airflow), where ice particles can constitute a greater proportion of the total airflow in the engine (“scoop factor” effect)2. Also, at low power the metal temperature in the compression section is lower than at high power, making it more susceptible to ice accretion. The evidence that ice particle icing could occur at the engine power required for climb or cruise, when the engine is most robust to icing, suggested that the levels of ice particle concentrations might be unusually high. Pilot reports and the FDR have been examined to provide further information on the flight environment during events. Pilot reports contain general descriptions of the events and observations of weather conditions. The FDRs, when available, provide exact information about flight altitude, flight speed, ambient temperature and engine pressure, temperature and rotor speeds. In 20 cases, supplementary meteorological information has been used, such as satellite and radar pictures, and radiosonde data. In the case of the commuter aircraft, all engine events occurred within a narrow set of ambient conditions, and with a set of common observations first listed by Lawson et al. (1998) 1. In the case of the transport aircraft events, the observations are more diverse. Many of the common commuter aircraft event attributes were often present in the transport aircraft events, but few transport aircraft events exhibited all attributes, a fact that made determination of the root cause of the powerloss more difficult. A list of common observations in commuter and transport aircraft engine events follows:
1 High altitude, cold temperature: Commuter: 28,000- 31,000’, median 29,000’, –20 to –37C, median -32C Transport: 11,500-39,000’, median 25,800’, -10 to –55C, median –21C 2 Aircraft in the vicinity of convective clouds/ thunderstorms 3 significantly warmer than standard atmosphere: Commuter: ISA+7 to ISA+16 Transport: less than ISA+5: 5 events; ISA+6 to ISA+10: 11 events; ISA+11 to ISA+23: 13 events
Seasonal Occurrence of Engine Powerloss in Ice Particles
0
1
2
3
4
5
6
7
8
9
10
JAN FEB MAR APR MAY JUN JUL AUG SEP OCT NOV DEC
Month
#
E V E NT S
Northern Hemisphere Southern Hemisphere
Figure 4: Engine events by month, for the northernand southern hemisphere.
American Institute of Aeronautics and Astronautics
6
4 Visible moisture/ Instrument Meteorological Conditions (IMC)/ In cloud 5 Light to moderate turbulence 6 Precipitation on windscreen, often reported as rain 7 Aircraft total air temperature probe (TAT) anomaly 8 Lack of observations of significant airframe icing 9 No flight-radar echoes at the location and altitude of the engine event (only large transport aircraft pilots
queried) Many of these observations above are discussed in much greater detail in two case studies following in this
article, and then linked into a hypothesis that high concentrations of ice particles, in most cases in the absence of significant supercooled liquid water, are responsible for ice accretion in the engine. It is however worth commenting on a few things at this point. Sixty-two percent of the large transport aircraft events in this study were above 22,000 ft, the extreme of the Appendix C icing envelope for clouds containing supercooled liquid water. Those events that occurred below this altitude had other evidence to support the presence of ice particles, in particular, the TAT anomaly (section IV). While pilot reports indicate the aircraft were usually in cloud (IMC conditions), they rarely report ice build-up on aircraft surfaces, and if a Rosemount Ice Detector was installed and reports were available, it never gave any indication of ice accretion (6 cases). Pilots made comments such as “at no stage was there any visible signs of icing around windscreen, wipers or winglets”, and “all the time in clouds, but no icing was observed”. In 4 cases where “icing conditions” were reported, this statement has usually not been an indication of ice buildup on the aircraft, but has been interpreted by the authors, with advice from experts in flight operations to mean icing conditions defined by the airplane flight manual: visible moisture and a temperature criterion such as total air temperature less than 10 C. Pilots often reported deviating around convective clouds or strong radar returns at altitude, and post-event review of satellite imagery indicated that the probable location of the aircraft was in the vicinity of a convective storm. During the commuter transport investigations in the mid 1990s, engine events were found to initiate within about 30 miles of the area of maximum radar reflectivity associated with a major thunderstorm, normally associated with the area of maximum precipitation. Similar accounts are often found in the transport aircraft events, for example “deviated up to 30NM left of track at flight level 360 to avoid the huge Cb (cumulonimbus) cloud”. In one case pilots inadvertently entered a red echo region, but in no other cases did the aircraft enter this maximum precipitation zone. According to standard procedure, the pilot would have diverted around such areas to stay within green echo or no-echo regions on his/her radar (normally < 30 dBz radar reflectivity). Accordingly, pilots normally reported no significant radar returns at the location of the aircraft at the time of the event. However, they often noted rain or heavy rain on the windscreen, often at very cold temperatures, seemingly in contradiction to observations of no airframe icing and no radar returns. It has been concluded that this observation is due to ice particles melting on a heated windscreen, and will be further explored in the case studies that follow. For the large transport aircraft, 15 of 20 reports included rain, the others had no report from the pilots.
While the majority of the events were associated with deep summer convection, there was one notable exception. Event #22 occurred on 4 January 2005 on descent to Los Angeles International Airport at 11,500’ and -11°C. The pilot report states that they were in heavy turbulence, and they observed no flight-level echoes on the onboard radar. Supplementary meteorological data indicates that this event was associated with a weather system called a ‘Pineapple Connection’, an unusually wet California winter storm that brings in moisture from the general direction of Hawaii. In this case the system broke rainfall records in the Long Beach area (2.6” per hour) near the time of the event. Ground meteorological radar echoes at the time did not appear to be from classical isolated convective cells but rather from more widespread synoptic precipitation. Although there is not a great deal of pilot report information and no FDR information, the most likely explanation of this event is that the aircraft encountered very heavy snow at flight altitude that had more or less the same effect as a high IWC encounter from a deep convective storm. This would be consistent with the record rainfalls below. The common factor linking this event and those associated with deep convective clouds may have been the potential for very high ice water content.
III. Microphysical Properties of Deep Convective Clouds Convective clouds can contain deep updraft cores that transport low-level air high into the atmosphere, during
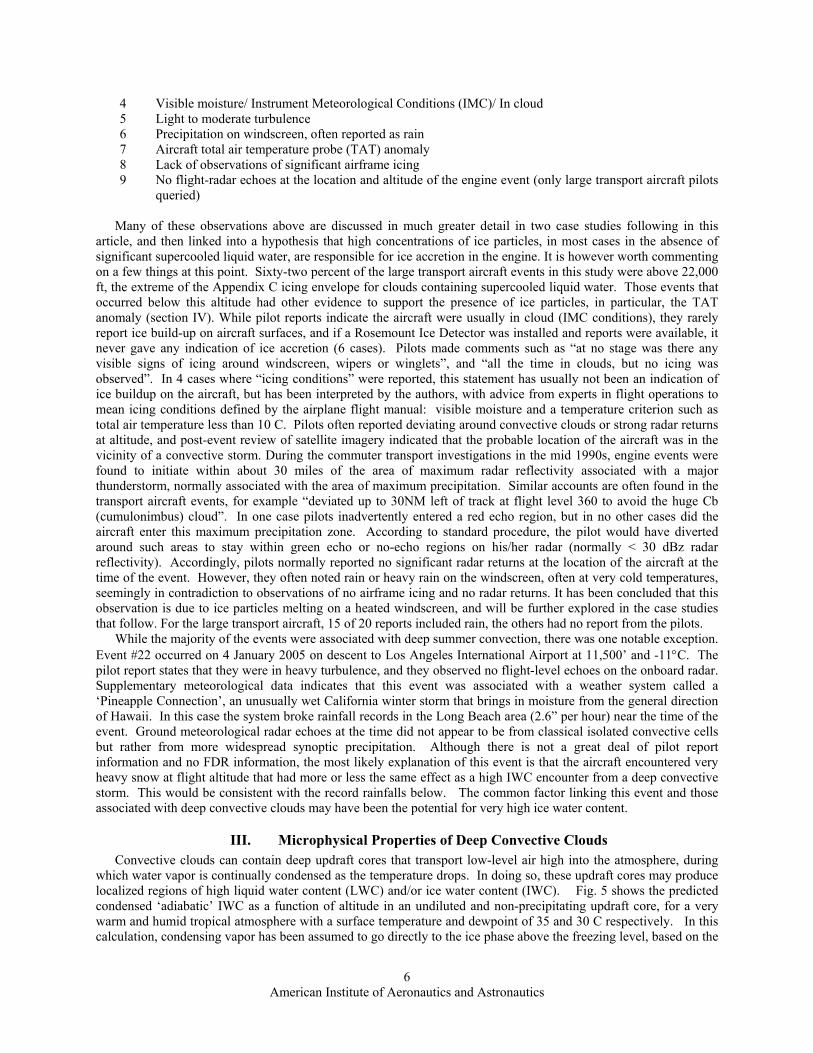
which water vapor is continually condensed as the temperature drops. In doing so, these updraft cores may produce localized regions of high liquid water content (LWC) and/or ice water content (IWC). Fig. 5 shows the predicted condensed ‘adiabatic’ IWC as a function of altitude in an undiluted and non-precipitating updraft core, for a very warm and humid tropical atmosphere with a surface temperature and dewpoint of 35 and 30 C respectively. In this calculation, condensing vapor has been assumed to go directly to the ice phase above the freezing level, based on the
American Institute of Aeronautics and Astronautics
7
scenario of a fully glaciated cloud. Note that the IWC reaches a maximum of about 9 gm-3 at around 30,000’, and thereafter decreases with altitude. This figure represents a first approximation for the highest cloud IWC that could be expected in such an atmosphere. In nature, we would expect this adiabatic value to be reduced significantly by dilution with mixing surrounding air and by fallout and/or redistribution by precipitation. For example, in tropical oceanic clouds, the low updraft velocities are thought to provide sufficient time for rain to develop below the freezing level, thus depleting the adiabatic values by fallout. Note however that the complexity of the precipitation redistribution process could, at least in theory, also lead to localized areas exceeding the simple adiabatic calculation (for example large particles falling into an undiluted adiabatic parcel), although in general it is commonly thought that even adiabatic levels are unlikely high in deep
convective systems. There have been very limited measurements of the microphysical properties of deep convective clouds to
date. In the late 1950s, an extensive program was conducted by the Royal Aircraft Establishment (RAE) to document the expected levels of total water content (TWC=LWC+IWC) in tropical cumulonimbus and deep layer clouds in the inter-tropical convergence zone (McNaughtan 1959) 3. The study examined clouds in the altitude and temperature range of 11,500-28,000’ and +3 to –25 °C (averages of 19,100’ and ~ -9°C). TWC values up to 8 gm-3 were reported in this study, and a 99% value of TWC of over 4 gm-3 was observed on a distance scale of ~20 statute miles. Although the measurement technique could not discriminate between ice and water, an RAE leaflet referring to these data implied in its title “Flight in Ice Crystal Clouds”4 that the TWC was dominated by the ice phase. The more recent deep convective cloud data, mostly from the atmospheric science community, is sparse. A review of convective cloud microphysics by Lawson et al. (1998)1 reported IWC values up to about 2.5 gm-3. LWC was found only in small areas and amounts in convective elements near the centers of storms. Very little additional TWC data from deep convection is reported, but a common observation is the lack of supercooled LWC. Black and Hallett (1986)5 observed that Atlantic hurricane convection was almost completely glaciated at –5°C, and concluded that there was rapid conversion of LWC to ice above the freezing level. Jorgensen and Lamone (1989)6 measured the properties of deep oceanic convection near Taiwan, and also concluded that there was rapid conversion of LWC to ice particles above the freezing level. Stith et al. (2002)7 measured the properties of intermediate maritime/continental tropical convective clouds in Brazil, and maritime tropical convection near the Marshall Islands, and although no TWC information was included, they noted LWC only in regions of significant updrafts, and the amount of LWC decreased significantly with decreasing temperature. No significant supercooled LWC was observed at temperatures colder than –12 °C. Stith et al.7 concluded that these clouds did not contain appreciable amounts of LWC. Lawson et al. 1, Black and Hallett5, and Stith et al.7 all agreed that in stratiform anvil regions clouds were glaciated, and aggregation was the dominant growth mechanism. Abraham et al. (2004)8 described the microphysical characteristics of cloud resulting from deep convection in Hurricane Michael. In the broad area of high TWC peaking at about 1.5 gm-3, the cloud was found to be entirely glaciated. LWC was found only in shallower cloud and at temperatures warmer than –10° C. One conclusion from the available data is that they are really inadequate to accurately fully define the levels of TWC that may exist during these engine events. However, it does appear from most reports that ice particle mass dominates deep convection above the freezing level, and that there is a potential for very high and potentially sustained mass concentrations. Further measurements from an instrumented commuter test aircraft are contained in the following section.
0 1 2 3 4 5 6 7 8 90
10000
20000
30000
40000
50000
60000Pr
essu
re A
ltitu
de (K
ft)
Adiabatic Total Water Content (gm-3) Figure 5: Calculated adiabatic TWC in an ascending air parcel, for a surface temperature of 35° C and a dewpoint of 30° C
American Institute of Aeronautics and Astronautics
8
IV. A Case Study of a Commuter Aircraft Engine Event The data perhaps most pertinent to engine events since the RAE study was collected onboard a specially
instrumented commuter transport test aircraft with relatively modern cloud instrumentation during an industry-sponsored flight test program designed to study commuter aircraft engine rollback. The successful outcome of this project led to modifications of this commuter aircraft’s engines and no further events have been recorded. Further details on the test program are given in section VIIB. The remainder of this section summarizes the microphysical measurements from a flight in which a rollback was observed on an unmodified (build-of-material) engine, establishes the environmental conditions that caused the engine event, and compares some of the observations to those that are common to the engine event database listed in section II.
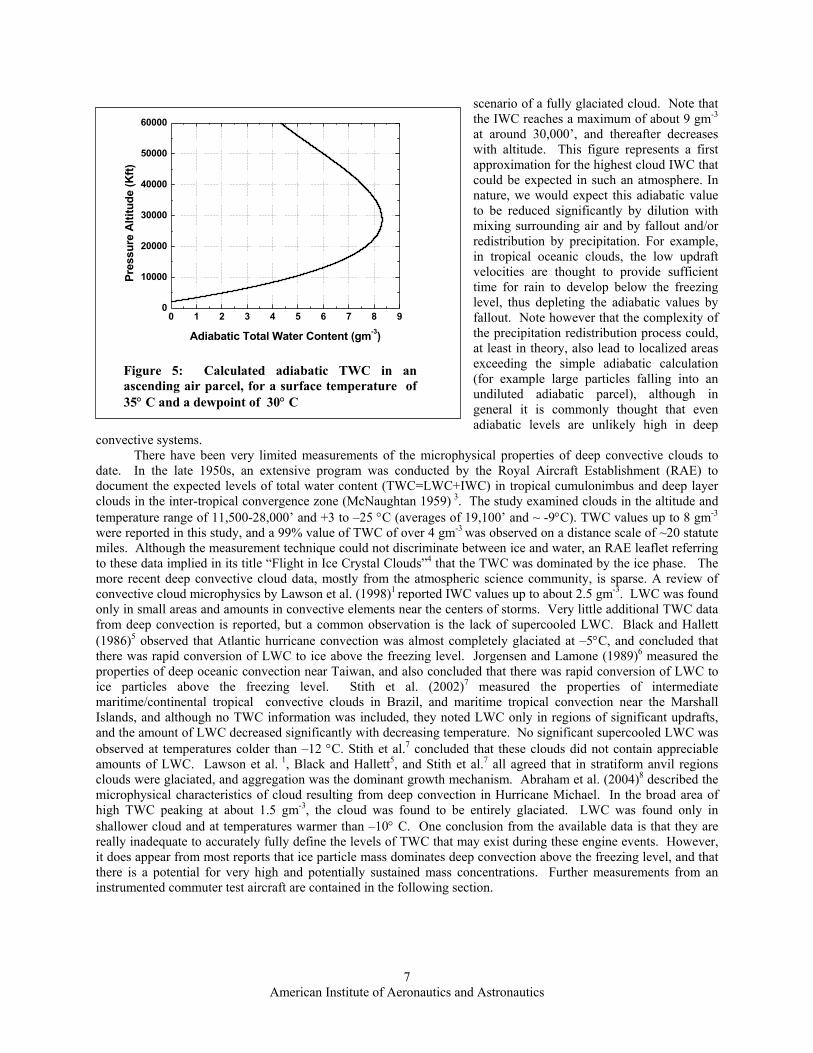
The flight test aircraft was equipped with a Rosemount TAT sensor of similar design to those installed on all the aircraft of the event database. Fig. 6 illustrates an example from this project of a TAT anomaly encountered while flying straight and level at an ambient temperature of about -26°C (TAT ~ -12°C) across a cloud with moderately high IWC. The cloud was determined to contain at most trace amounts of supercooled LWC, because the Rosemount Ice Detector ramp voltage trace was very flat during this entire pass (not shown). Shortly after the estimated IWC (top panel) rose in the first cloud encounter (~21:14 UTC), the TAT (bottom panel) also rose from an undisturbed value of about –12° C to a plateau value of about 0° C, but then continued to rise to about 5° C. On exit from the high IWC region, the temperature quickly dropped back to approximate pre-cloud values. Similar behavior was observed during a second cloud encounter from 21:22-21:32, although there did not appear to be much TAT effect in a lower IWC cloud between the two high IWC clouds. In fact, for this case, the anomaly appeared to trigger within 60 seconds of the IWC exceeding 0.5 gm-3, and had cleared within 30 seconds of the IWC dropping below 0.5 gm-3. Lawson et al. (1998)1 have discussed the TAT anomaly at length, and have displayed a similar figure illustrating the correlation of temperature change to apparent IWC, and the rapid clearing of the probe after exit from ice particle conditions. They pointed out that a similar TAT experience had been reported by Holland et al. (1984)9 while flying in a broad convective outflow region of a tropical storm near Australia, and incorrectly interpreted as an intrusion of warm air from the stratosphere. The same misinterpretation of the TAT anomaly as a warm zone was made at the initial stage of this commuter engine event investigation. Lawson et al. (1998) 1 further reported that wind tunnel testing by the probe manufacturer confirmed that it could ice up in super cooled liquid water/ice particle concentrations that could have been encountered during rollback events.
As in Lawson et al. (1998)1, in this article we link the TAT anomaly to ingestion of ice particles, presumably which block the airflow through the heated housing, and corrupt the measurement. Further information on the incidence of the TAT anomaly is available from the event database. All the aircraft involved in the 46 engine powerloss cases (both large transport and commuter aircraft) investigated in this report are equipped with a total air temperature (TAT) probe of similar design. The event database contains four engine events in which a TAT anomaly was observed at an outside air temperature below -40°C, the minimum temperature at which supercooled LWC can occur. Furthermore, of the 35 cases in the event database in which the existence of a TAT anomaly could be determined from available data, in only one of those cases was there a conclusive report of some airframe icing. It is therefore concluded that TAT icing occurs in glaciated cloud, as it did in the case study above, and all but one
Figure 6: Time history of TWC (top panel) and Rosemount total air temperature (TAT, bottom panel), showing the TAT ‘anomaly’ caused by ingestion of ice particles, for a portion of the commuter test flight on 16 June 1997.
American Institute of Aeronautics and Astronautics
9
of the engine event data base TAT anomalies are likely due to ice particle ingestion. Although the specifics of the interaction between IWC and the TAT anomaly may vary according to the specifics of the probe and installation, Fig. 6 further illustrates that the TAT probe measurements in the event database may provide a powerful tool for assessing the time of onset and the distance scale for high IWC regions. An example of such will be described in the large transport case study in section V, and further discussion is provided in section VIIc.
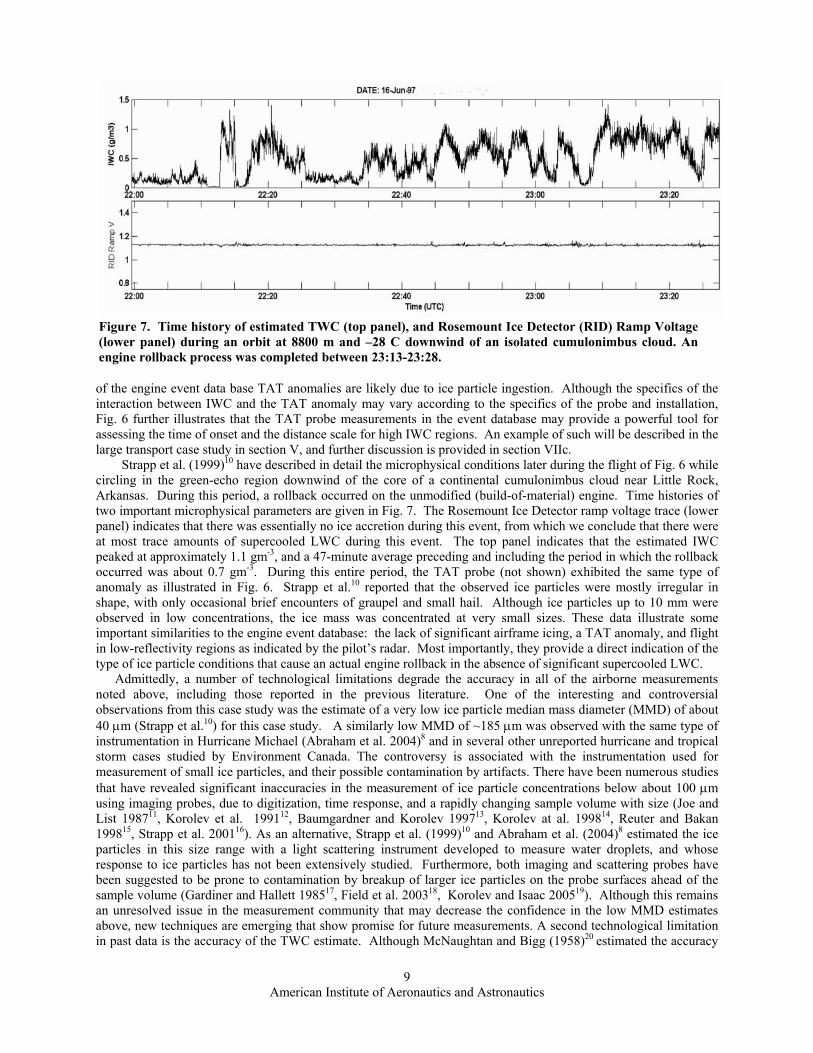
Strapp et al. (1999)10 have described in detail the microphysical conditions later during the flight of Fig. 6 while circling in the green-echo region downwind of the core of a continental cumulonimbus cloud near Little Rock, Arkansas. During this period, a rollback occurred on the unmodified (build-of-material) engine. Time histories of two important microphysical parameters are given in Fig. 7. The Rosemount Ice Detector ramp voltage trace (lower panel) indicates that there was essentially no ice accretion during this event, from which we conclude that there were at most trace amounts of supercooled LWC during this event. The top panel indicates that the estimated IWC peaked at approximately 1.1 gm-3, and a 47-minute average preceding and including the period in which the rollback occurred was about 0.7 gm-3. During this entire period, the TAT probe (not shown) exhibited the same type of anomaly as illustrated in Fig. 6. Strapp et al.10 reported that the observed ice particles were mostly irregular in shape, with only occasional brief encounters of graupel and small hail. Although ice particles up to 10 mm were observed in low concentrations, the ice mass was concentrated at very small sizes. These data illustrate some important similarities to the engine event database: the lack of significant airframe icing, a TAT anomaly, and flight in low-reflectivity regions as indicated by the pilot’s radar. Most importantly, they provide a direct indication of the type of ice particle conditions that cause an actual engine rollback in the absence of significant supercooled LWC.
Admittedly, a number of technological limitations degrade the accuracy in all of the airborne measurements noted above, including those reported in the previous literature. One of the interesting and controversial observations from this case study was the estimate of a very low ice particle median mass diameter (MMD) of about 40 µm (Strapp et al.10) for this case study. A similarly low MMD of ~185 µm was observed with the same type of instrumentation in Hurricane Michael (Abraham et al. 2004)8 and in several other unreported hurricane and tropical storm cases studied by Environment Canada. The controversy is associated with the instrumentation used for measurement of small ice particles, and their possible contamination by artifacts. There have been numerous studies that have revealed significant inaccuracies in the measurement of ice particle concentrations below about 100 µm using imaging probes, due to digitization, time response, and a rapidly changing sample volume with size (Joe and List 198711, Korolev et al. 199112, Baumgardner and Korolev 199713, Korolev at al. 199814, Reuter and Bakan 199815, Strapp et al. 200116). As an alternative, Strapp et al. (1999)10 and Abraham et al. (2004)8 estimated the ice particles in this size range with a light scattering instrument developed to measure water droplets, and whose response to ice particles has not been extensively studied. Furthermore, both imaging and scattering probes have been suggested to be prone to contamination by breakup of larger ice particles on the probe surfaces ahead of the sample volume (Gardiner and Hallett 198517, Field et al. 200318, Korolev and Isaac 200519). Although this remains an unresolved issue in the measurement community that may decrease the confidence in the low MMD estimates above, new techniques are emerging that show promise for future measurements. A second technological limitation in past data is the accuracy of the TWC estimate. Although McNaughtan and Bigg (1958)20 estimated the accuracy
Figure 7. Time history of estimated TWC (top panel), and Rosemount Ice Detector (RID) Ramp Voltage (lower panel) during an orbit at 8800 m and –28 C downwind of an isolated cumulonimbus cloud. An engine rollback process was completed between 23:13-23:28.
American Institute of Aeronautics and Astronautics
10
of the TWC in the RAE study at 15%, the method can no longer be traced, and given current knowledge of the difficulties of TWC estimation, the 15% estimate seems optimistic. The methods used in the later studies based on the computation of ice mass from two-dimensional particle images are probably accurate only to within a factor of two, and the commuter transport case study and hurricane estimates, which used hot-wire estimates of IWC, may be low by as much as a factor of two due to ice particle bouncing out of the capture area of the hot-wire probe (Strapp et al. 2005)21.
V. A Case Study of Large Transport Engine Event This case study provides a detailed description of a large transport engine event, and a more detailed discussion
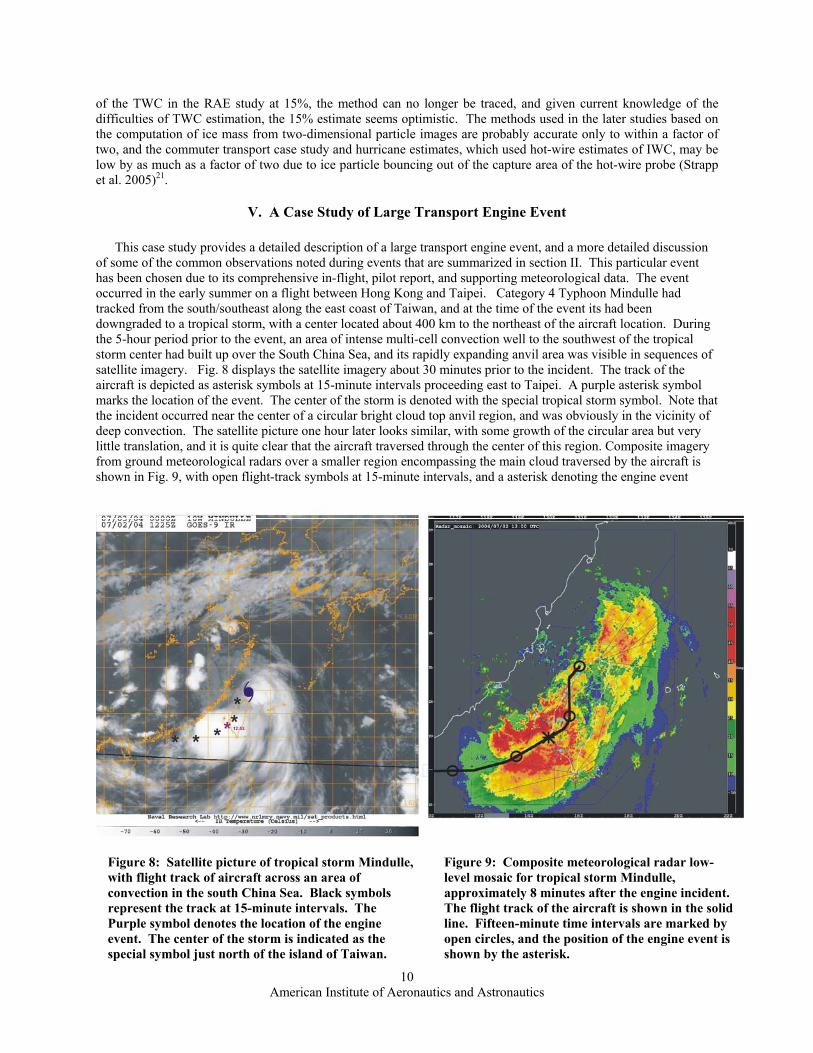
of some of the common observations noted during events that are summarized in section II. This particular event has been chosen due to its comprehensive in-flight, pilot report, and supporting meteorological data. The event occurred in the early summer on a flight between Hong Kong and Taipei. Category 4 Typhoon Mindulle had tracked from the south/southeast along the east coast of Taiwan, and at the time of the event its had been downgraded to a tropical storm, with a center located about 400 km to the northeast of the aircraft location. During the 5-hour period prior to the event, an area of intense multi-cell convection well to the southwest of the tropical storm center had built up over the South China Sea, and its rapidly expanding anvil area was visible in sequences of satellite imagery. Fig. 8 displays the satellite imagery about 30 minutes prior to the incident. The track of the aircraft is depicted as asterisk symbols at 15-minute intervals proceeding east to Taipei. A purple asterisk symbol marks the location of the event. The center of the storm is denoted with the special tropical storm symbol. Note that the incident occurred near the center of a circular bright cloud top anvil region, and was obviously in the vicinity of deep convection. The satellite picture one hour later looks similar, with some growth of the circular area but very little translation, and it is quite clear that the aircraft traversed through the center of this region. Composite imagery from ground meteorological radars over a smaller region encompassing the main cloud traversed by the aircraft is shown in Fig. 9, with open flight-track symbols at 15-minute intervals, and a asterisk denoting the engine event
Figure 8: Satellite picture of tropical storm Mindulle, with flight track of aircraft across an area of convection in the south China Sea. Black symbols represent the track at 15-minute intervals. The Purple symbol denotes the location of the engine event. The center of the storm is indicated as the special symbol just north of the island of Taiwan.
Figure 9: Composite meteorological radar low-level mosaic for tropical storm Mindulle, approximately 8 minutes after the engine incident. The flight track of the aircraft is shown in the solid line. Fifteen-minute time intervals are marked by open circles, and the position of the engine event is shown by the asterisk.
American Institute of Aeronautics and Astronautics
11
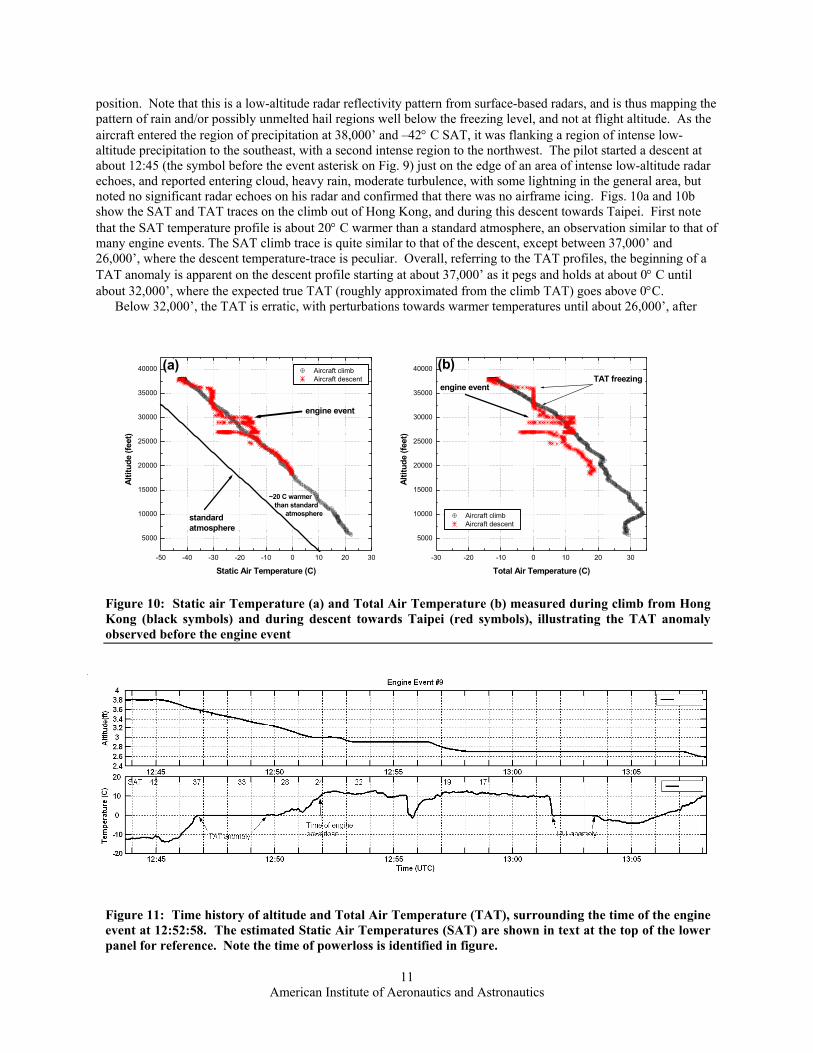
position. Note that this is a low-altitude radar reflectivity pattern from surface-based radars, and is thus mapping the pattern of rain and/or possibly unmelted hail regions well below the freezing level, and not at flight altitude. As the aircraft entered the region of precipitation at 38,000’ and –42° C SAT, it was flanking a region of intense low-altitude precipitation to the southeast, with a second intense region to the northwest. The pilot started a descent at about 12:45 (the symbol before the event asterisk on Fig. 9) just on the edge of an area of intense low-altitude radar echoes, and reported entering cloud, heavy rain, moderate turbulence, with some lightning in the general area, but noted no significant radar echoes on his radar and confirmed that there was no airframe icing. Figs. 10a and 10b show the SAT and TAT traces on the climb out of Hong Kong, and during this descent towards Taipei. First note that the SAT temperature profile is about 20° C warmer than a standard atmosphere, an observation similar to that of many engine events. The SAT climb trace is quite similar to that of the descent, except between 37,000’ and 26,000’, where the descent temperature-trace is peculiar. Overall, referring to the TAT profiles, the beginning of a TAT anomaly is apparent on the descent profile starting at about 37,000’ as it pegs and holds at about 0° C until about 32,000’, where the expected true TAT (roughly approximated from the climb TAT) goes above 0°C.
Below 32,000’, the TAT is erratic, with perturbations towards warmer temperatures until about 26,000’, after
-30 -20 -10 0 10 20 30
5000
10000
15000
20000
25000
30000
35000
40000
-50 -40 -30 -20 -10 0 10 20 30
5000
10000
15000
20000
25000
30000
35000
40000 (b)(a)TAT freezing
engine event
Altit
ude
(feet
)
Total Air Temperature (C)
Aircraft climb Aircraft descent
standardatmosphere
~20 C warmer than standard atmosphere
engine event
Altit
ude
(feet
)
Static Air Temperature (C)
Aircraft climb Aircraft descent
Figure 10: Static air Temperature (a) and Total Air Temperature (b) measured during climb from Hong Kong (black symbols) and during descent towards Taipei (red symbols), illustrating the TAT anomaly observed before the engine event
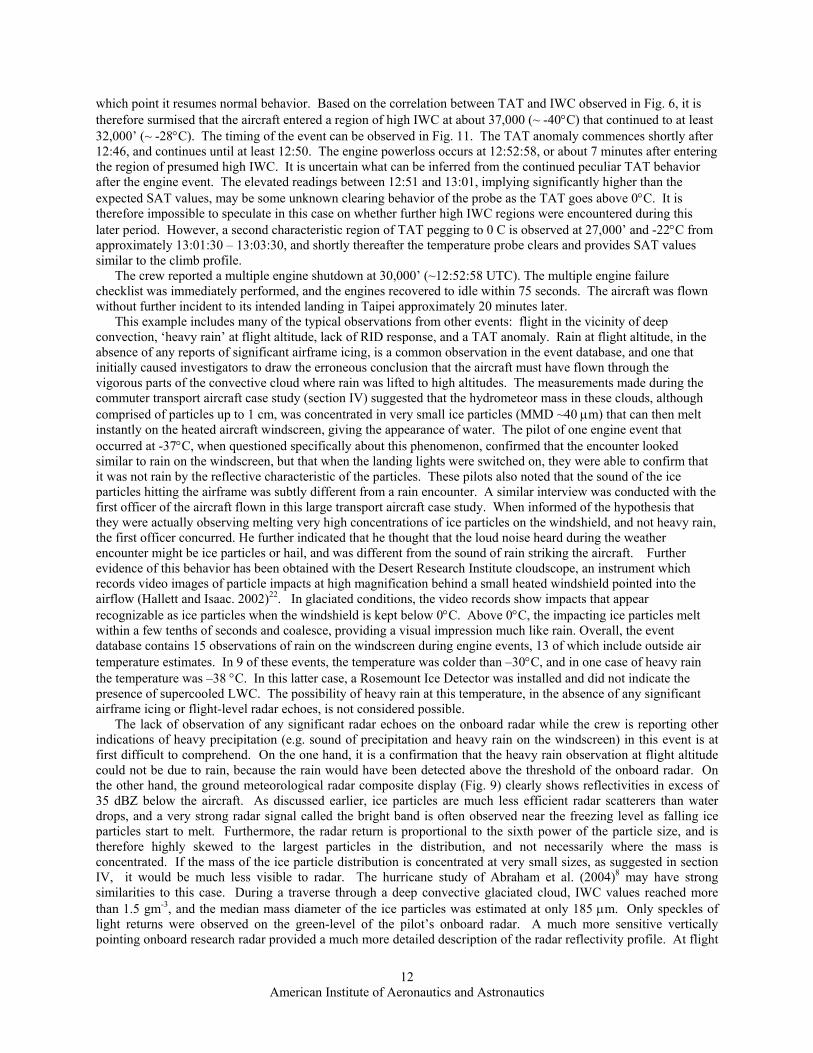
Figure 11: Time history of altitude and Total Air Temperature (TAT), surrounding the time of the engine event at 12:52:58. The estimated Static Air Temperatures (SAT) are shown in text at the top of the lower panel for reference. Note the time of powerloss is identified in figure.
American Institute of Aeronautics and Astronautics
12
which point it resumes normal behavior. Based on the correlation between TAT and IWC observed in Fig. 6, it is therefore surmised that the aircraft entered a region of high IWC at about 37,000 (~ -40°C) that continued to at least 32,000’ (~ -28°C). The timing of the event can be observed in Fig. 11. The TAT anomaly commences shortly after 12:46, and continues until at least 12:50. The engine powerloss occurs at 12:52:58, or about 7 minutes after entering the region of presumed high IWC. It is uncertain what can be inferred from the continued peculiar TAT behavior after the engine event. The elevated readings between 12:51 and 13:01, implying significantly higher than the expected SAT values, may be some unknown clearing behavior of the probe as the TAT goes above 0°C. It is therefore impossible to speculate in this case on whether further high IWC regions were encountered during this later period. However, a second characteristic region of TAT pegging to 0 C is observed at 27,000’ and -22°C from approximately 13:01:30 – 13:03:30, and shortly thereafter the temperature probe clears and provides SAT values similar to the climb profile.
The crew reported a multiple engine shutdown at 30,000’ (~12:52:58 UTC). The multiple engine failure checklist was immediately performed, and the engines recovered to idle within 75 seconds. The aircraft was flown without further incident to its intended landing in Taipei approximately 20 minutes later.
This example includes many of the typical observations from other events: flight in the vicinity of deep convection, ‘heavy rain’ at flight altitude, lack of RID response, and a TAT anomaly. Rain at flight altitude, in the absence of any reports of significant airframe icing, is a common observation in the event database, and one that initially caused investigators to draw the erroneous conclusion that the aircraft must have flown through the vigorous parts of the convective cloud where rain was lifted to high altitudes. The measurements made during the commuter transport aircraft case study (section IV) suggested that the hydrometeor mass in these clouds, although comprised of particles up to 1 cm, was concentrated in very small ice particles (MMD ~40 µm) that can then melt instantly on the heated aircraft windscreen, giving the appearance of water. The pilot of one engine event that occurred at -37°C, when questioned specifically about this phenomenon, confirmed that the encounter looked similar to rain on the windscreen, but that when the landing lights were switched on, they were able to confirm that it was not rain by the reflective characteristic of the particles. These pilots also noted that the sound of the ice particles hitting the airframe was subtly different from a rain encounter. A similar interview was conducted with the first officer of the aircraft flown in this large transport aircraft case study. When informed of the hypothesis that they were actually observing melting very high concentrations of ice particles on the windshield, and not heavy rain, the first officer concurred. He further indicated that he thought that the loud noise heard during the weather encounter might be ice particles or hail, and was different from the sound of rain striking the aircraft. Further evidence of this behavior has been obtained with the Desert Research Institute cloudscope, an instrument which records video images of particle impacts at high magnification behind a small heated windshield pointed into the airflow (Hallett and Isaac. 2002)22. In glaciated conditions, the video records show impacts that appear recognizable as ice particles when the windshield is kept below 0°C. Above 0°C, the impacting ice particles melt within a few tenths of seconds and coalesce, providing a visual impression much like rain. Overall, the event database contains 15 observations of rain on the windscreen during engine events, 13 of which include outside air temperature estimates. In 9 of these events, the temperature was colder than –30°C, and in one case of heavy rain the temperature was –38 °C. In this latter case, a Rosemount Ice Detector was installed and did not indicate the presence of supercooled LWC. The possibility of heavy rain at this temperature, in the absence of any significant airframe icing or flight-level radar echoes, is not considered possible. The lack of observation of any significant radar echoes on the onboard radar while the crew is reporting other indications of heavy precipitation (e.g. sound of precipitation and heavy rain on the windscreen) in this event is at first difficult to comprehend. On the one hand, it is a confirmation that the heavy rain observation at flight altitude could not be due to rain, because the rain would have been detected above the threshold of the onboard radar. On the other hand, the ground meteorological radar composite display (Fig. 9) clearly shows reflectivities in excess of 35 dBZ below the aircraft. As discussed earlier, ice particles are much less efficient radar scatterers than water drops, and a very strong radar signal called the bright band is often observed near the freezing level as falling ice particles start to melt. Furthermore, the radar return is proportional to the sixth power of the particle size, and is therefore highly skewed to the largest particles in the distribution, and not necessarily where the mass is concentrated. If the mass of the ice particle distribution is concentrated at very small sizes, as suggested in section IV, it would be much less visible to radar. The hurricane study of Abraham et al. (2004)8 may have strong similarities to this case. During a traverse through a deep convective glaciated cloud, IWC values reached more than 1.5 gm-3, and the median mass diameter of the ice particles was estimated at only 185 µm. Only speckles of light returns were observed on the green-level of the pilot’s onboard radar. A much more sensitive vertically pointing onboard research radar provided a much more detailed description of the radar reflectivity profile. At flight
American Institute of Aeronautics and Astronautics
13
altitude, the reflectivity was approximately 16 dBZ, with occasional brief regions of 20 dBZ. Far below at and below the freezing level in the heavy rain area of the hurricane, the reflectivity in the bright band exceeded 30 dBZ, similar to the low-altitude reflectivities of Fig. 9, and in fact was attenuated by the heavy precipitation so that actual values are underestimated. A standard pilot’s weather radar has a threshold of about 20 dBZ, and would therefore be insensitive to such glaciated high-IWC regions, or would at most show some returns at the green level. One important note is that regions of low-altitude high reflectivity on ground meteorological weather radars in convective storms, such as shown in Fig. 9, are also an indication of potentially high IWC above the freezing level that may be conducive to engine powerloss.
VI. The Hypothesis of the Environment that Causes Engine Events Based on the information from the event database, the case studies outlined in sections IV and V, and the past
reports and literature, the environment conducive to most engine events can be hypothesized. An event may occur while diverting around a flight-level high reflectivity region associated with an isolated thunderstorm core, but may also occur in broad anvil outflow regions from clouds associated with convective storm complexes and tropical storms. Temperatures are likely between 0 and –50° C, and the altitude is likely between about 11,500’ and at least 39,000 ft. The atmospheric temperature is likely to be warmer than a standard atmosphere by up to 25°C. The deep convective lift associated with such storms releases large amounts of condensed water that can at least in theory reach levels approaching 9 gm-3. In such deep storms, previous reports indicate that the environment is dominated by ice particles, with very little supercooled LWC, and tentatively with mass concentrated at sub-200 µm sizes. It has been shown earlier that supercooled LWC in the atmosphere is not a necessary factor for an engine event, and at most one of the events was associated with a significant conventional supercooled LWC icing encounter and this one has evidence that IWC was also present. Ice particles are inefficient radar scatterers, especially small ice particles, and thus there may be little radar reflectivity at flight altitude above the minimum threshold of the pilot’s onboard weather radar.
VII. The Mechanisms for Engine Powerloss
A. Conventional Icing – Supercooled Liquid Water Accretion Ice accretion on aerospace engines in flight can be caused by the ingestion of supercooled liquid droplets or
glaciated/mixed phase conditions in the atmosphere. In practical terms liquid droplets are commonly observed in a wide variety of clouds in the atmosphere below the contact freezing point of 0°C down to temperatures of at least -15°C, although they have also been observed in some special cases down to temperatures approaching the homogeneous freezing point of about -40°C. Such droplets are referred to as supercooled. However, in large convective clouds such as thunderstorms, the vast anvil regions are largely glaciated (ice-only), or mixed phase with small fractions of supercooled liquid droplets. Although both ice and liquid hydrometeors can exist in this environment, the only commonly recognized form of aerospace component icing has been associated with supercooled liquid droplets, and the focus of engine icing has been placed on supercooled droplets until recent years.
The supercooled droplet environment is well documented. The most well known characterization of this icing envelope is depicted in the Appendix C in Part 25 of the FAA Airworthiness Regulations23. Ice accretion occurs due to the impact and freezing of supercooled droplets on cold surfaces. The amount and shape of ice accreted is dependent on outside air temperature, cloud liquid water content, droplet size, airspeed and horizontal extent of the icing conditions. For a turbofan engine, the main components of concern are those that are below freezing, namely the inlet lip, fan spinner, fan blade and the rows of stators in front and immediately behind the fan. (Fig. 1) The adverse effects resulting from supercooled liquid droplet exposure are generally structural damage due to inlet or fan blade ice shedding, control malfunction due to engine sensor icing, and engine instability when ice shed from the stators behind the fan enters the core of the engine at low power. Since ice is formed and shed continuously on the fan blades, an increased vibration level is generally detected when engine icing caused by supercooled water droplets occurs, and may be noticeable to the pilot. These effects are well documented24 and engine design and certification procedures have been developed to identify and eliminate these risks.
B. Ice Particle Icing in Commuter Transport Aircraft The effect of the glaciated/mixed phase environment on turbine engines is not as well understood as it is for the
supercooled liquid icing environment. Based on field knowledge collected in commuter and transport aircraft events
American Institute of Aeronautics and Astronautics
14
cited in section IA&IB, it is believed that ice particles can enter the engine core without leaving ice accretion on the wing, engine inlet and fan components, thereby, making detection difficult. Ice particles inside the core have been shown to accrete on static components with local air temperature significantly warmer than freezing. This ice particle icing can create core flow blockage that could adversely affect the operability of the engine. This ice accretion could eventually detach from those components and go directly into the high-pressure compressor or combustor causing potential surge or flameout. In the absence of cloud, the ice accretion locations operate at a temperature warmer than freezing, and therefore icing is normally not suspected as the root cause when the engine malfunction is first detected. It was only through vigorous research and instrumented flight-testing that such accretion on commuter aircraft was identified and corrected.
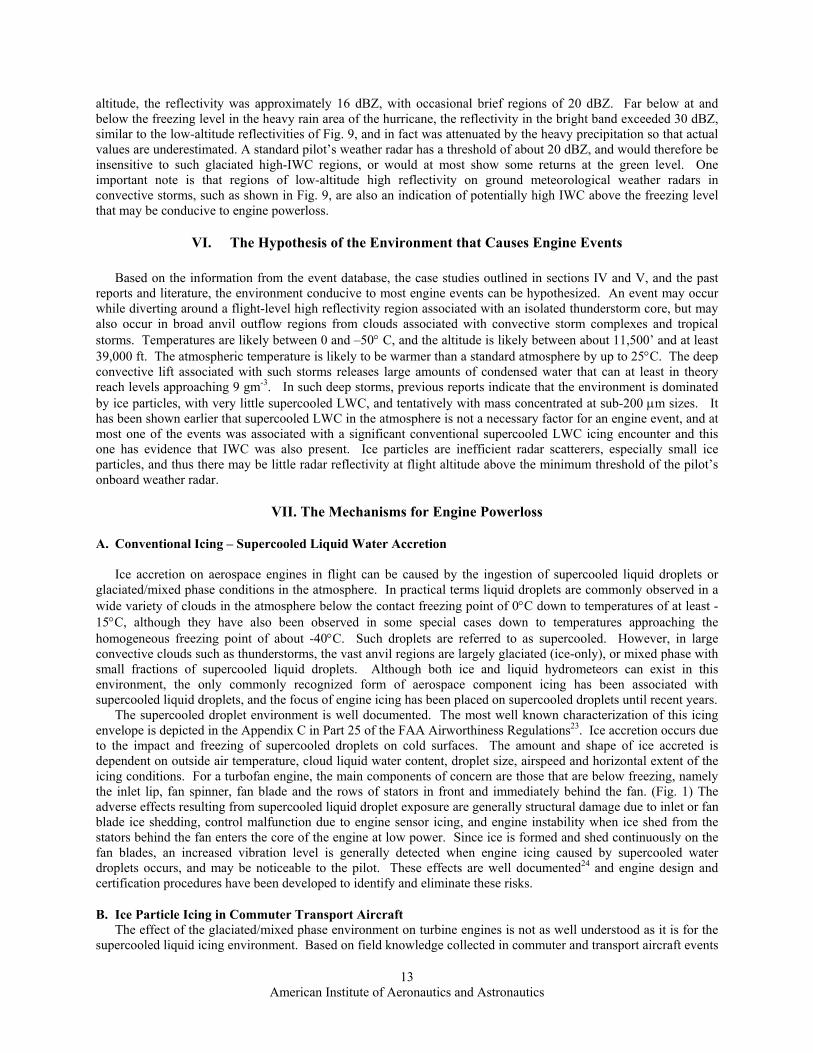
A flight test program was conducted on a multiple-engine commuter aircraft by the aircraft and engine manufacturers and was designed for detailed investigation of the rollback event and to evaluate the engine modifications made to eliminate this icing potential. The test was conducted on the summer of 1997 over Alabama in the vicinity of thunderstorms. An engine rollback was successfully induced on the unmodified (build-of-material) engine and a modified engine performed flawlessly. The rollback event was well documented with cloud microphysical probes and is summarized in Section IV of this paper. Engine inlet cameras and metal thermocouples were strategically placed to monitor the affected engine components and record their behaviors under wet conditions. When the rollback was recorded, the aircraft was flying at an altitude of 28,800 feet altitude, and an ambient static temperature between -27C and -30C, corresponding to ISA + 15C to ISA + 12C. The flight Mach Number was 0.56. All engines were set at cruise setting. The environmental condition was within the envelope defined by the service incidents.
Test results on the rollback engine clearly showed that all engine parts visible on the inlet camera were free of ice during the initial slow speed decay stage of the rollback event. These included the fan spinner, a rotating fan rotor and the first stage compressor stator vanes at the engine core passage inlet. Ice formation on the core inlet vanes was visible after the engine rollback occurred, because the engine core and fan speeds had significantly reduced and could no longer support the energy requirement of the inlet anti-ice system. A correlation of the cloud microphysical data, and the engine data plotted in Fig. 12, showed that the onset of the initial rollback stage took place 5 minutes and 40 seconds after cloud entry. The flight test rollback scenario was similar to all the recorded
Figure 12: Engine data from the rollback test flight described in section IV, with text description of the cloud and engine observations. N1 and N2 are the fan and core speed respectively
American Institute of Aeronautics and Astronautics
15
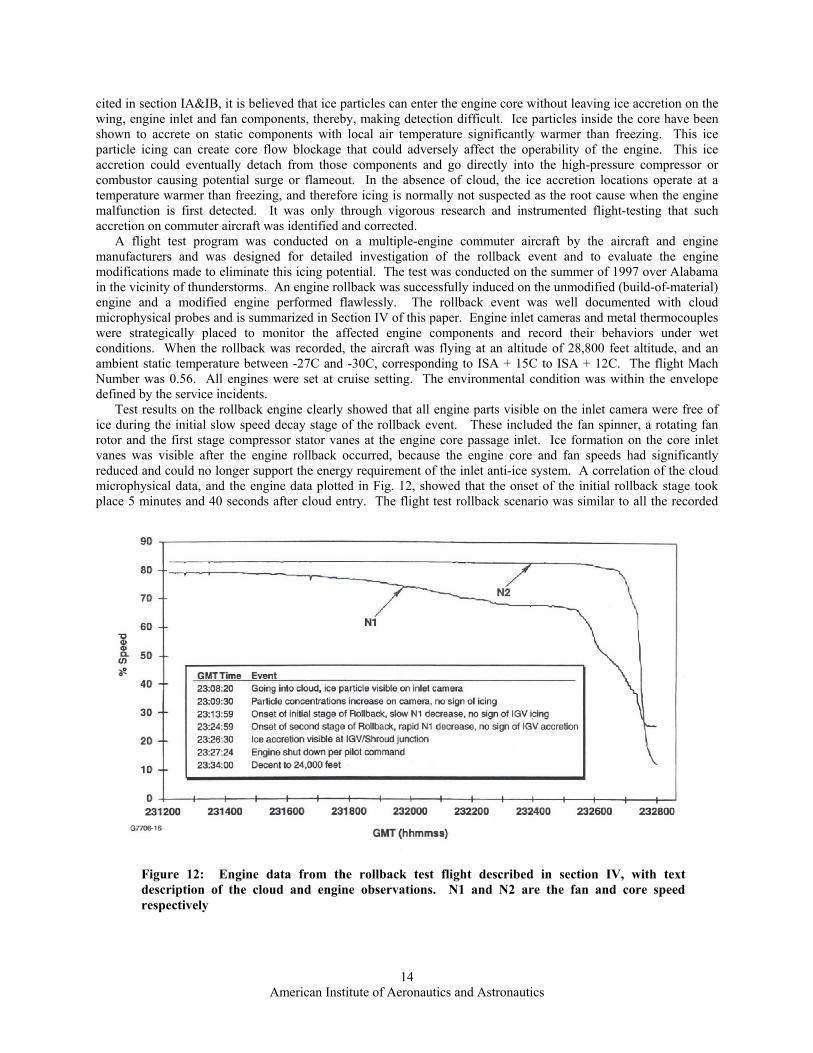
field events in that the engine remained on a slow decay stage for seven minutes before the onset of a rapid decay stage. The test data supports the theory that icing blockage of the flow path behind the first compressor stator vanes was the root cause of the engine incidents. Thermocouple data, shown in Fig. 13, recorded on stator vanes further downstream of the core inlet also supported this theory. The data taken on the unmodified (build-of-material) compressor second stage stator vanes, also known as exit guide vanes (EGV), indicated a rapid surface metal temperature reduction soon after entry into the cloud. The temperature hovered around the freezing point (within instrumentation errors) until the onset of the rapid decay stage of the rollback. This period of freezing point measurements was an indication that ice was accreting continuously on the EGV surfaces. This temperature data indicated that ice started to accrete on the EGV surfaces soon after cloud entry, creating blockage and initiating the slow decay stage of the rollback. Ice continued to build and pressure loss increased until the final rapid decay stage of the rollback was reached. In the rapid decay stage, the local air temperature dropped below freezing. In this stage, due to the rollback rotor speeds, the fan and compressor could no longer increase the local air temperature and therefore the entire front section of the engine was bathed in cold ambient air, as reflected in the metal temperature measurements. The ice accreted on the EGV and the metal temperatures underneath the ice followed this temperature trend.
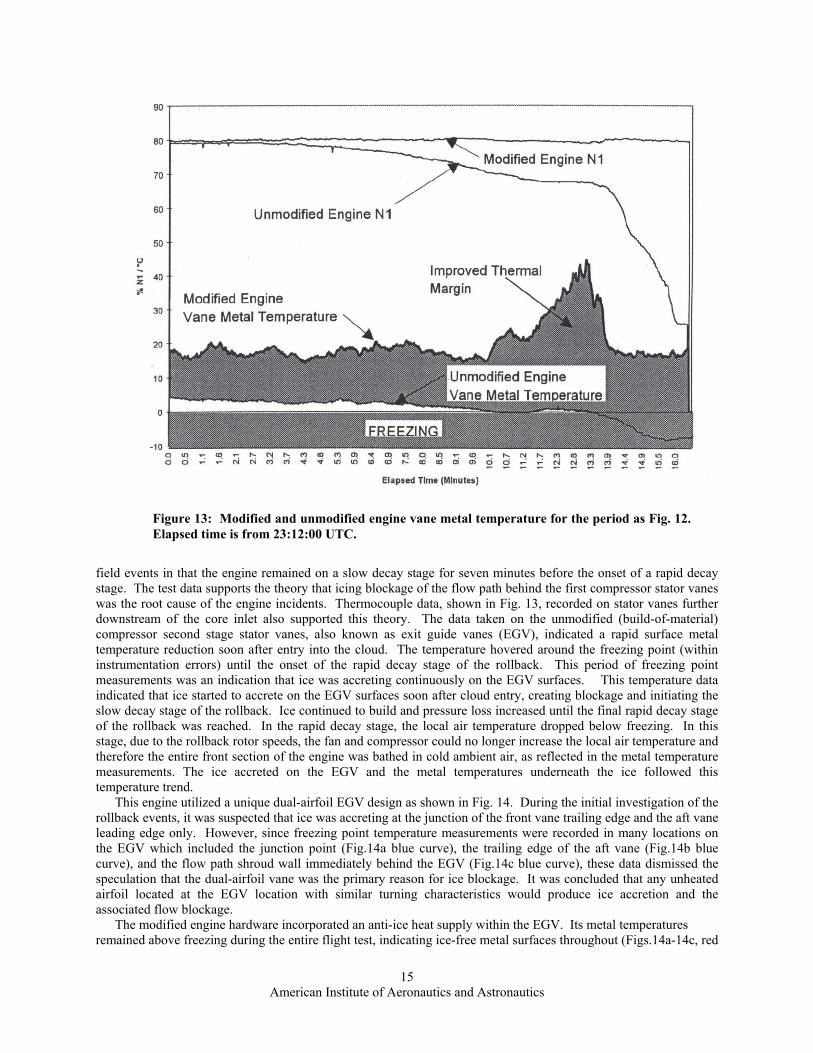
This engine utilized a unique dual-airfoil EGV design as shown in Fig. 14. During the initial investigation of the rollback events, it was suspected that ice was accreting at the junction of the front vane trailing edge and the aft vane leading edge only. However, since freezing point temperature measurements were recorded in many locations on the EGV which included the junction point (Fig.14a blue curve), the trailing edge of the aft vane (Fig.14b blue curve), and the flow path shroud wall immediately behind the EGV (Fig.14c blue curve), these data dismissed the speculation that the dual-airfoil vane was the primary reason for ice blockage. It was concluded that any unheated airfoil located at the EGV location with similar turning characteristics would produce ice accretion and the associated flow blockage.
The modified engine hardware incorporated an anti-ice heat supply within the EGV. Its metal temperatures remained above freezing during the entire flight test, indicating ice-free metal surfaces throughout (Figs.14a-14c, red
Figure 13: Modified and unmodified engine vane metal temperature for the period as Fig. 12. Elapsed time is from 23:12:00 UTC.
American Institute of Aeronautics and Astronautics
16
curves). Further analysis indicated that the heat provided was sufficient to maintain ice-free surfaces for the glaciated/mixed phase icing envelope identified for this series of engine incidents.
This flight test yielded the evidence that ice accretion may occur on engine component surfaces where local air temperatures under normal operation are significantly above freezing. The exact mechanism for ice accretion is not fully understood at this time, however, a hypothesis was developed based on the flight test results as follows. As soon as the engine enters glaciated/mixed phase conditions, both liquid and ice particles coexist on the warm EGV surfaces. The presence of liquid on the surface slows down the ice particles, allowing heat transfer between the metal and ice particles to take place. Heat removed from the metal reduces its temperature until the freezing point is reached, and ice forms. After this point, it is contended that further impingement of liquid and ice particles on the metal surface would accrete as ice even with a local air temperature higher than 0 degrees C. Accretion will continue to grow as long as both liquid water and ice particles continue to impinge on the ice surface, increasing the size of the blockage until the engine can no longer function properly. It should be noted that liquid water is a necessary condition locally at the EGV for ice accretion to continue. If there is no liquid water in the air stream, ice particles will bounce off the iced EGV surface in a way similar to what happens on the wing or the inlet of the engine. This phenomenon has also been observed in mixed phase icing tests with supercooled liquid droplets and ice particles performed by Al Kahlil et al. (2003)25 in the Cox and Co. LeClerc icing wind tunnel. Since significant amounts of supercooled liquid water were not recorded by the weather instrumentation during the flight test, it is hypothesized that either only a very small amount of liquid water, ingested by the engine, is required for this process or that the liquid water impacting the EGV is actually produced by the melting of minute ice particles as they pass through the front section of the engine. Further research is required to identify the source of this liquid.
This ice particle accretion phenomenon demonstrated by the commuter aircraft flight test is not unique to the commuter aircraft engine. Large transport aircraft engines have similar geometry on a larger scale, and similar airflow rates and temperatures, and therefore it is expected that the ice accretion mechanism is very similar on both engine types.
C. Ice Particle Icing in Large Transport Aircraft Information on the mechanism for powerloss in large transport aircraft is largely derived from the event
database. In most events the flight data supports the theory that ice was building up in the engine core and shedding downstream causing the powerloss, rather than building up and causing a rollback as seen in the commuter aircraft When data were available to monitor engine fan and core speeds, pressure and temperature, these parameters appeared normal up until the moment of engine failure. Further, the engine could be restarted immediately following the failure, suggesting that the threat had passed.
(a)
(b)
(c)
Figures 14 a-c: Thermocouple temperatures on the Exit Guide Vanes of the modified (MOD1) and unmodified (Baseline) engines during the rollback flight test described in section IV. Inset geometry shows location of thermocouple for each figure
American Institute of Aeronautics and Astronautics
17
The actual mechanism for engine powerloss takes many forms, depending on the engine. Each engine’s overall stability is a balance between compressor stability, combustor stability, and the fuel available for acceleration. The component that is the mechanism for failure is the element with the least margin to cope with an ice ingestion, and varies by engine type. All of the following mechanisms have occurred:
• Engine surge and stall: ice shed into the compressor can drive the engine into stall due to the combined
effect of the lost inertial and heat energy to the ice, and the inefficiency of the airfoils having ice on them. The scenario begins with a compressor surge (a sudden flow reversal) followed by stall (engine rotor speeds decay), as airflow is reduced due the presence of one or more compressor stages with localized airflow separation. The combustor remains lit, and due to the lack of airflow, exhaust gas temperature (EGT) typically rises quickly.
• Flameout: quenching of the combustor following the ingestion a quantity of ice. • Engine damage: engine blades and vanes can become damaged as shed ice impacts them. Typically minor
blade tip curl is the only damage present however, rare instances of blade release have occurred. Damage has also occurred without any other symptom.
The event data indicate that following the powerloss, all engines were restarted. Even in the rare cases where the
engine was damaged, those engines were restarted and operated normally for the remainder of the flight. Typically the encounter with high concentrations of ice particles is relatively brief, as inferred from TAT anomaly data. Section IV presented the documented behavior of the TAT in ice particles; beyond a threshold of IWC, the TAT anomaly occurred. The TAT anomaly data indicates, for the transport aircraft events, that the exposure to very high ice particle content never exceeded 44 nautical miles prior to the onset of the engine event. It must be stated that the engine may have been accreting ice particles at lower concentrations, prior to the onset of the TAT anomaly. The TAT anomaly lasted 135 nautical miles in the longest case, however in most cases, it was much shorter, averaging 5 nautical miles. In all cases, once the aircraft exited the ice particle conditions, and descended to the restart envelope, the engine was restarted.
VIII. Industry Challenges
A. Avoidance of Ice Particle Encounters The tools available to the pilot of a commercial jet to identify regions of potentially high ice particle
concentration are limited. It is clear from the engine event database that the on-board weather radar does not show significant returns for these events at altitude, although in some cases the pilot was diverting around areas of high reflectivity associated with a large convective storm. Lawson et al. (1998)1 described a model of a single thunderstorm with maximum IWC in a core area of maximum radar reflectivity at altitude, and with rapidly decreasing IWC away from the center. They reported that at distances > 30 km from the center, IWC was expected to be less than 1 gm-3. It is prudent to assume that flight in the close vicinity of a thunderstorm may lead to high IWC encounters that can lead to engine events. However, it is also clear from the event database that this model is not sufficient as a general avoidance strategy. The database includes complex cases of multiple convective cells with perhaps merged anvil regions (e.g. section V tropical storm case study), and cases where there was no high-reflectivity core at flight altitude. Furthermore, pilot reports of the sudden onset of a strong weather encounter without warning and without a significant radar return suggests that the aircraft may have encountered a new convective impulse imbedded in the convective outflow region, implying that such regions of engine threat may be randomly encountered in areas of convective cloud rather than associated with an identifiable core region at altitude. Today’s pilot is not typically on guard for these conditions, because his/her training is focused on identifying conventional icing and storm targets which provide strong radar returns. Manuals that are provided with on-board weather radar explain the use of the system to identify and avoid regions of high reflectivity. Regions where ice particles exist without radar returns are presented as a hazard for potential turbulence. While current procedures do not expressly avoid regions with high ice particle content, following the recommended procedures for thunderstorm avoidance, where possible, may help avoid these conditions. Pilots are advised to avoid reflective regions by at least 20 nautical miles, and are advised not to overfly convective cells. The high reflectivity below the aircraft from rain returns associated with these cells may be a good indicator of high ice particle concentrations aloft, since that rain would often have formed from falling ice particles. The onboard radar is sensitive to rain, but not nearly as much to the ice particles, because ice particles are much less efficient radar scatterers than water drops. In this regard, at high altitude, the pilot must tilt the radar down to scan for high reflectivity rain below and determine the existence and position of a convective cell, and gage the altitude of the high-reflectivity region. The height of the cell above
American Institute of Aeronautics and Astronautics
18
this region, if not visible, may only be inferred. Convective cells often lift to the tropopause, which can be as high as 60,000 ft in the tropics. If the top is not visible, it is prudent to conclude that it exceeds the aircraft cruise altitude, and the cell should be avoided by circumnavigation. When avoiding convective cells by circumnavigation, flight upwind of the cell is recommended to avoid the spreading anvil downstream and to limit exposure to high ice particle content conditions. The gain function may be used to artificially enhance the color of lower reflectivity targets, which may be useful to confirm the extent of the convective cell, however increasing the gain will not reveal the smaller ice particles that may make up most of the ice particle mass.
Given their training, the density of air traffic, the frequency of storms in the Asia-Pacific region, and the increasing difficulty for a pilot to obtain an alternate routing to avoid convective weather, it is just not practical for pilots to avoid all high ice particle content conditions. It is clear from the event data, that the high altitude regions of high ice particle content in weather systems such as isolated deep convective clouds, complexes of convective clouds, and tropical storms, even those that are being carefully monitored by meteorological agencies, are being penetrated by commercial aircraft. Pilot interviews indicate that these conditions are routine and not perceived as a threat due to lack of airframe icing and only moderate turbulence. The most effective solution therefore is to make the engine capable of flight in these conditions.
B. Improving Engine Tolerance to Ice Particle Accretion The industry has faced engine powerloss for many years associated with engine icing. Many of the strategies
used to make an engine robust to icing due to supercooled liquid drops are also effective for ice particle icing. An additional challenge arises because ice particle icing typically occurs further aft in the engine than icing due to supercooled liquid drops. Flight test data and evaluation of engine events have shown that ice accretion is likely to occur deep in the core of the engine. This can make finding the ice accretion location and a corrective action difficult. This is further complicated by the fact that the engine conditions change with ambient temperature and airspeed, therefore the potential locations of ice accretion sites may continually change during cruise and descent.
One successful strategy to prevent engine powerloss from ice particle icing focuses on removing the accreted ice from the engine core when it sheds. The intercompressor bleeds, if open during an ice shed, can be very effective to remove upstream accreted ice. (Fig. 1) These intercompressor bleeds are typically open at idle powers but modulate closed as power is increased. An acceleration can cause the ice to shed, during which time, if the bleed is open the ice may pass into the fan duct. Ice particle icing has occurred on some engines at cruise power, where for performance and fuel economy reasons, the bleeds are closed. If at cruise power the ice sheds, it has no opportunity to exit, and will pass through the high compressor and combustor posing the threat of surge or flameout. The approach to solving ice particle icing at high power tends to be the prevention of ice accretion in the first place. This is typically achieved by heating the surface where the ice is accreting.
Conditions may be conducive to ice particle accretion in the high pressure compressor under certain conditions, such as encounters with high altitude convective clouds at idle power descent with ambient temperatures below minus 40C. Under these extremely cold conditions ice could accrete in the first stages of the high compressor. Preventing ice accretion in the high pressure compressor poses a similar challenge as ice accretion during cruise; there are typically no bleeds to remove ice from the system. In this case, raising the idle speed may be effective in increasing temperatures and moving the ice accretion site forward. While these approaches have been effective as a corrective action when ice particle icing is recognized in a service event, further research is required to design a new engine to be more tolerant to glaciated/mixed phase icing conditions. The research that is needed will be explored in the following paragraphs.
C. Ice Particle Atmospheric Characterization As previously mentioned, the experimental data currently available characterizing the glaciated/mixed phase
environment is limited. Over the past several years, the Engine Harmonization Working Group (EHWG) has met under the auspices of the Ice Protection Harmonization Working Group to make recommendations on regulatory issues related to engine icing, and among other things, to assess what is currently available on atmospheric characterization of clouds that cause engine events, and recommend whether additional measurements are required. The EHWG has recommended further atmospheric characterization, and also recommended that a dedicated flight test program be conducted to provide data for future engine certification requirements. Such a program must provide accurate information on the levels of total water content (TWC), liquid water content (LWC) and ice water content (IWC) in clouds, determine the distance scales over which these levels occur, and develop an encounter probability. In addition, information on the sizes and distributon of hydrometeors may be critical information for future simulation and engine accretion modeling activities. Certain technical challenges must be overcome before a suitable airborne instrument package will be ready to provide the accuracy required by industry in such a harsh
American Institute of Aeronautics and Astronautics
19
measurement environment (Strapp et al. 199910, Strapp et al. 200521). Thus it is anticipated that a flight program would be preceded by an instrumentation development and testing phase, that would include assessment of current instrumentation, development of new instrumentation, and testing in wind tunnels that can simulate the ice particle environment. Due to the high frequency of events in Southeast Asia, it is appropriate that a flight test program would be conducted somewhere in this region, collecting data similar to those measured by the RAE out of Darwin, Entebbe, and Singapore in the 1950s (McNaughtan, 1959)3, where tropical cumulonimbus and deep layer clouds in the inter-tropical convergence zone were sampled over a period of three years. Due to the high cost of such an endeavor, the use of Cloud Resolving Models, three dimensional computer models that simulate the atmosphere on a cloud-scale and include numerical schemes to simulate cloud microphysical properties, will be investigated due to their potential to enormously expand flight statistics at a fraction of the cost. If this modeling activity could be coupled with the flight test program to provide simultaneous simulations of clouds measured by the aircraft, it would allow for validation of model output and potential expansion of flight test measurement statistics.
D. Simulation Testing Once the atmospheric threat is known, the next challenge to the industry is to develop test methods that properly
simulate the engine operation at high altitude in this environment. Icing wind tunnels and icing test facilities available to the industry nowadays are mainly designed to simulate supercooled liquid droplets depicted in the FAR Part 25 Appendix C icing envelope23. These droplets are produced by nozzles spraying water initially at above-freezing temperature into the cold working air stream of the test facility, and targeting the same particle size range as in the natural cloud conditions. The droplets lose temperature as they travel down the cold air stream, and in most cases achieve a supercooled state before they reach the test article. The spray particles are generally spherical in shape as they would be in a natural supercooled cloud. Ice particles, on the other hand, occur naturally in many different shapes and they generally span a much larger range of sizes than the supercooled droplets depicted in the Appendix C envelope. These properties create a simulation challenge to a test facility. A developed ice crystal nozzle engine test facility does not exist in the industry today although many research activities had been conducted in this area. An ice shaver can also be used to produce larger size ice particles. However, a test on a larger turbofan engine requires a large amount of ice, and providing such sufficient quantities of shaved ice in real time requires machinery and a delivery system that are not available today. Producing a stockpile of shaved ice before testing may alleviate delivery rate issues, but may result in storage issues such as melting and coalescing of the ice particles. All these difficulties will have to be overcome in the development of a test facility capable of simulating glaciated/mixed phase ice particles for engine testing.
The thermodynamic conditions within the engine where ice particle accretion occurs are unique. Based on observations from the engine rollback flight test discussed in section IVB, the accretion site is imbedded deep inside the core of the engine where local air temperature is above freezing point. Observing and documenting this ice accretion requires visual data that is not possible to obtain from an engine inlet mounted camera. An internally mounted camera would require a light source, making it a difficult design problem. One way to circumvent this difficulty is to use test rigs that yield more flexibility for camera mounting. Past efforts to rig test engine components in ice particles experienced difficulties associated with the proper simulation of local air (above freezing) temperature. Ice particles generated by a water nozzle require a cold air stream to induce freezing, therefore precluding their use in a warm air environment. Shaved ice particle testing in a warm environment has not yet been studied in detail. Introducing the ice shavings in a uniform manner could be a challenging task. Finally, a rotating engine icing rig composed of an engine inlet, a fan section and the stages of a compressor section pertinent to icing, is a good solution for simulating the thermodynamic effects of ice particle accretion. Rotating the rig at the design speed of the engine would result in the proper simulation of the local temperature conditions. Camera visibility issues are easier to be resolved in this setup because non-essential components inside the engine can be removed to make room for the imaging system. Development of such facility would be a valuable asset to the continuing investigation into engine anomalies in the ice particle environment.
E. Modeling of the ice accretion process In addition to the technology requirements associated with properly simulating ice particle size distributions for
engine testing, there is a need for research focused toward the development of a calibrated model of the interaction of ice particles with the engine inlet air stream in flight and in the test facility. The trajectory path of potentially larger ice particles of irregular shape versus smaller ice particles of more uniform shape must be accounted for in establishing icing certification test conditions.
American Institute of Aeronautics and Astronautics
20
XIX Summary and Conclusions The article describes a weather phenomenon recently identified to be hazardous to turbofan engines on both
large commercial aircraft and smaller commuter aircraft. Engine powerloss and rollback (loss of engine control) are common results. Service event records and flight-testing have determined that these engine events are happening in a glaciated/mixed-phase environment dominated by ice particles. A case study of commuter transport aircraft flight in a thunderstorm anvil describes the cloud microphysical conditions encountered during an actual engine event. A large transport engine event case study describes the conditions encountered during an actual in-service event while traversing a tropical storm. A number of similarities are discussed between these case studies and a collection of 46 events summarized in the article. It is strongly suggested that supercooled LWC in the atmosphere is not required to cause engine events, and this phenomenon is largely driven by ice particle entering and accreting within the core passage of the engine. This is underscored by 4 engine events at temperatures lower than –40 C, where supercooled LWC is not theoretically possible. The environment is hypothesized to be a region of high ice water content in the vicinity of a deep convective cloud, convective cloud complex, or tropical storm that can in at least in theory have values approaching 9 gm-3. Historical measurements from the 1950s reveal values as high as 8 gm-3 in such clouds, and values of in excess of 4 gm-3 occasionally sustained over 20 mile distance scales. Events are observed throughout the world in tropical and subtropical locations, and there is a concentration of events in Southeast Asia.
During an industry flight test program studying rollback on a small commuter transport aircraft, engine instrumentation pinpointed the location of the ice accretion where the local air temperature was significantly higher than freezing point before entering the cloud. These results led to the hypothesis that ice particles adhere to a warm metal surface, and act as a heat sink until the metal surface temperature drops below freezing, thereby forming a location for mixed phase ice accretion. Engine core flow blockage or shedding of this accumulated ice into the combustor are the causes of engine malfunction in this environment. Although the general ambient conditions responsible for these engine events are believed to be known, finding a solution to ensure safe engine operation has been challenging. Although some guidelines for avoidance of these conditions are proposed, there is currently no direct detection method such as the weather radar. Test facilities capable of simulating this weather condition for turbine engine are also not readily available to the industry. More detailed research on characterizing the atmospheric conditions, and on the thermodynamic processes determining ice accretion and shedding in the engine is needed.
Acknowledgments The authors wish to acknowledge the valuable discussions with the Engine Harmonization Working Group on
topics contained in this study. The efforts of Robert Mazzawy have contributed to the knowledge base of this article. Satellite and radar data for tropical storm Mindulle was obtained from the Naval Research Laboratory and the Central Weather Bureau Taiwan respectively.
References
1 Lawson, R.P., Angus, L.J., and Heymsfield, A..J., “Cloud Particle Measurements in Thunderstorm anvils and Possible Threat to Aviation,” J. Aircraft, Vol. 35, No. 1, 1998, pp. 113-121.
2 “Turbojet, Turboprop and Turbofan Engine Induction System Icing” Federal Aviation Administration Advisory Circular 20-147, February 2, 2004
3 McNaughtan, I.I.,”The Analysis of Measurements of Free Ice and Ice/Water Concentrations in the Atmosphere of the Equatorial Zone,” Royal Aircraft Establishment (Farnborough) Technical Note No. : Mech. Eng. 283, 1959.
4 “Flight in Ice Crystal Clouds,” Aeroplanes and Rotorcraft Joint Airworthiness Committee, Paper 733, Leaflet 714Y, August 1958.
5 Black, R. and J. Hallett, “Observations of the Ice Distributions in Hurricanes,” J. Atmos. Sci., Vol. 43, 1986, pp. 802-822. 6 Jorgensen, D., and M. LeMone, “Vertical Velocity Characteristics in Oceanic Convection,” J. Atmos. Sci., Vol. 46, 1989,
pp. 621-640. 7 Stith, J. L., J. E. Dye, A. Bansemer, A. Heymsfield, C. Grainger, W.W. Petersen, and R. Berticelli, “Microphysical
Observations of Tropical Clouds,” J. Appl. Meteor., Vol. 41, 2002, pp. 97-117. 8 Abraham, J., J. W. Strapp, C. Fogarty, and M. Wolde, “Extratropical Transition of Hurricane Michael,” Bull. Amer. Met.
Soc., Vol. 85, 2004, pp. 1323-1339. 9 Holland, G.J., T.D. Keenan, and G.D. Crane, “Observations of a Phenomenal Temperature Perturbation in Tropical Cyclone
Kerry,” Mon. Wea. Review, Vol. 112, 1984, pp. 1074-1082.
American Institute of Aeronautics and Astronautics
21
10 Strapp, J.W., P. Chow, M. Maltby, A.D. Bezer, A. Korolev, I. Stomberg, and J. Hallett, “Cloud Microphysical Measurements in Thunderstorm Outflow Regions during Allied/BAe 1997 Flight Trials,” 37th AIAA Aerospace Sciences Meeting and Exhibit , Reno, NV. , Jan. 11-14, 1999, AIAA 99-0498.
11 Joe, P. and R. List, “Testing and Performance of Two-Dimensional Optical Array Spectrometers with Greyscale,” J. Atmos. Oceanic Technol., Vol. 4, 1987, pp.139-150.
12 Korolev, A.V., S.V. Kuznetsov, Y.E. Makarov, and V.S. Novikov, “Evaluation of Measurements of Particle Size and Sample Area from Optical Array Probes,” J. Atmos. Oceanic Technol., Vol. 8, 1991, pp. 514-522.
13 Baumgardner, D., and A. Korolev, “Airspeed Corrections for Optical Array Probe Sample Volumes,” J. Atmos. Oceanic Technol., Vol. 14, 1997, pp. 1224-1129.
14 Korolev, A.V., J.W. Strapp, and G.A. Isaac, “Evaluation of the Accuracy of PMS Optical Array Probes,” J. Atmos. Oceanic Technol., Vol. 15, 1998, pp. 708-720.
15 Reuter, A., and S. Bakan, “Improvements of Cloud Particle Sizing with a 2D-grey Probe,” J. Atmos. Oceanic Technol., Vol. 15, 1998, pp. 1196-1203.
16 Strapp, J.W., F. Albers, A. Reuter, A.V. Korolev, U. Maixner, E. Rashke, and Z. Vukovic, “Laboratory Measurements of the Response of a PMS OAP-2DC,” J. Atmos. Oceanic Technol., Vol. 18, 2001, pp. 1150-1170.
17 Gardiner, B. A. and J. Hallett, “Degradation of in-cloud Forward Scattering Probe Measurements in the Presences of Ice Crystals,” J. Atmos. and Oceanic. Technol., Vol. 2, 1985, pp. 171-180.
18 Field, P.R., R. Wood, P.R.A. Brown, P.H. Kaye, E. Hirst, R. Greenaway, and J.A. Smith, “Ice Particle Interarrival Times Measured with a Fast FSSP,” J. Atmos. and Oceanic Technol., Vol. 20, 2003, pp. 249-261.
19 Korolev, A.V., and G.A. Isaac, “Shattering during Sampling by OAPs and HVPS. Part 1: Snow Particles”, J. Atmos. and Oceanic Technol., Vol. 22, 2005, pp. 528-542.
20 McNaughtan, I.I, and F.J. Bigg, “Development and Calibration of the Pitot Type Ice Concentration Meter,” Royal Aircraft Establishment (Farnborough) Technical Note No: Mech. Eng. 281, Feb. 1959
21 Strapp, J.W., L. E. Lilie, E. Emery and D. Miller, “Preliminary Comparison of Ice Water Content as Measured by Hot Wire Instruments of Varying Configuration,” 43rd AIAA Aerospace Sciences Meeting, Reno, Nevada, 11-13 January 2005, AIAA-2005-0860
22 Hallett, J. and G.A. Isaac, “Aircraft Icing in Glaciated and Mixed Phase Clouds”, 40th AIAA Aerospace Sciences Meeting, Reno, Nevada, 14-17 January 2002, AIAA-2002-0677
23 Code of Federal Regulations, Title 14, Part 25, Washington, D.C., January 1, 1997 24 AIRCRAFT ICING HANDBOOK, DOT/FAA/CT-88/8-1 25 Al-Khalil, K., “Assessment of Effects of Mixed Phase Icing Conditions on Thermal Ice Protection Systems”,
DOT/FAA/AR-03/48, May 2003


![generated by Diesel Engines · Emission Reduction of IC-Engines ... l an zahl [cm-3] Uhrzeit Particle number Pa r t i c le nu ... London SmogLondon Smog. Mortality due to](https://img.pdfslide.us/doc/110x75/5b3447f27f8b9a436d8bd2f3/generated-by-diesel-emission-reduction-of-ic-engines-l-an-zahl-cm-3-uhrzeit.jpg)