Embed Size (px)
Citation preview

The Hume Workforce Development Committee
Hume Regional Development Australia
Arts and Recreation Services Labour Market Snapshot
Workforce Planning Australia | December 2012
Arts and Recreation Services Industry
2 |
The Arts and Recreation Services Industry as defined by ANZSIC includes the following sectors.
Source: Employment outlook for Arts and Recreation Services, Skills Info, 2012
Amusement and other Recreation
Activities
Horse and Dog Racing
Gambling Activities
Sports and Physical
Recreation Activities
Creative and performing
Arts
Parks and Gardens
Museum Operations
Arts and Recreation Services Industry Snapshot
3 |
• Arts and Recreation Services is the third smallest of 19 industries classified under ANZSIC*.
• In August 2012 approximately 218,000 people were employed in the Arts and Recreation field across Australia.
• Between 2007 and 2012, employment increased at an rate of 2% per annum.
• Between 2012 – 2016/17 employment is projected to increase 1.6% per annum, equivalent to a total of 7,800 people.
• The Arts and Recreation Services industry has a large part-time workforce, with 45% of people in the industry working part time.
• At 54% of the total workforce men slightly out number women in the industry, but this ratio varies markedly between industry segments.
• The industry employs large numbers of contractors, freelancers and volunteers.
Source: DEEWR, SkillsInfo, 2012; * Australian New Zealand Standard Industrial Classification
Arts and Recreation Services Industry Data
4 |
‘Arts and Recreation’
ABS
‘Culture and Recreation’Skills HubVictorian’
Industry Training Advisory Board
body
‘Sport, Recreation and
Fitness’Service Skills
Australia (SSA) Industry Skills
Council
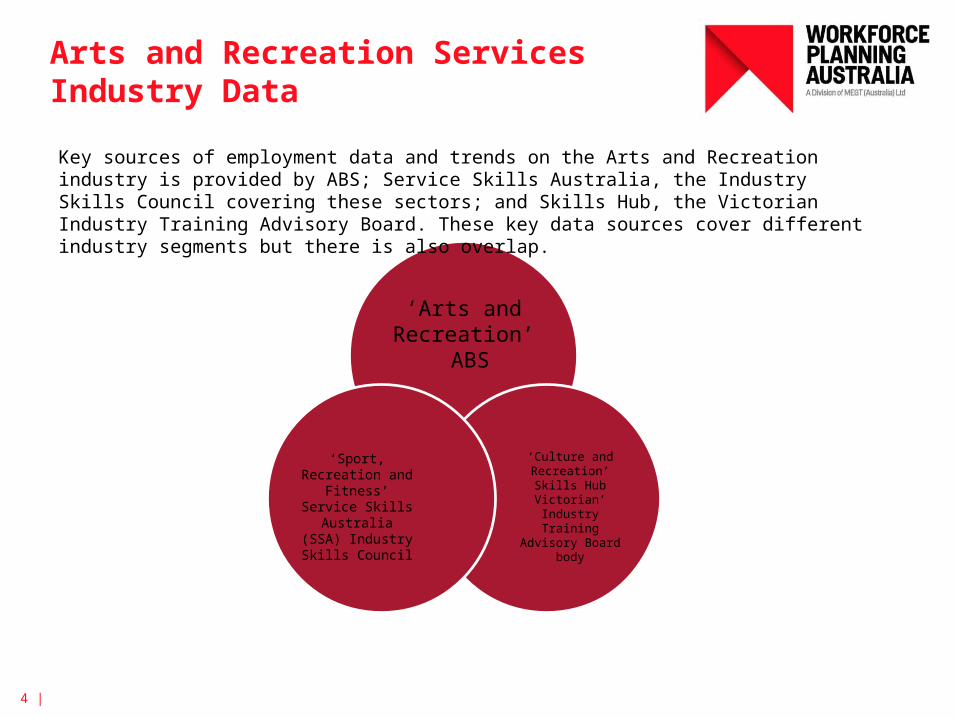
Key sources of employment data and trends on the Arts and Recreation industry is provided by ABS; Service Skills Australia, the Industry Skills Council covering these sectors; and Skills Hub, the Victorian Industry Training Advisory Board. These key data sources cover different industry segments but there is also overlap.
Arts and Recreation Services Industry Data Sources
5 |
Source: DEEWR, Skills Info, 2012, Skills Hub, SSA, Sport, Recreation and Fitness Environmental Scan 2012.
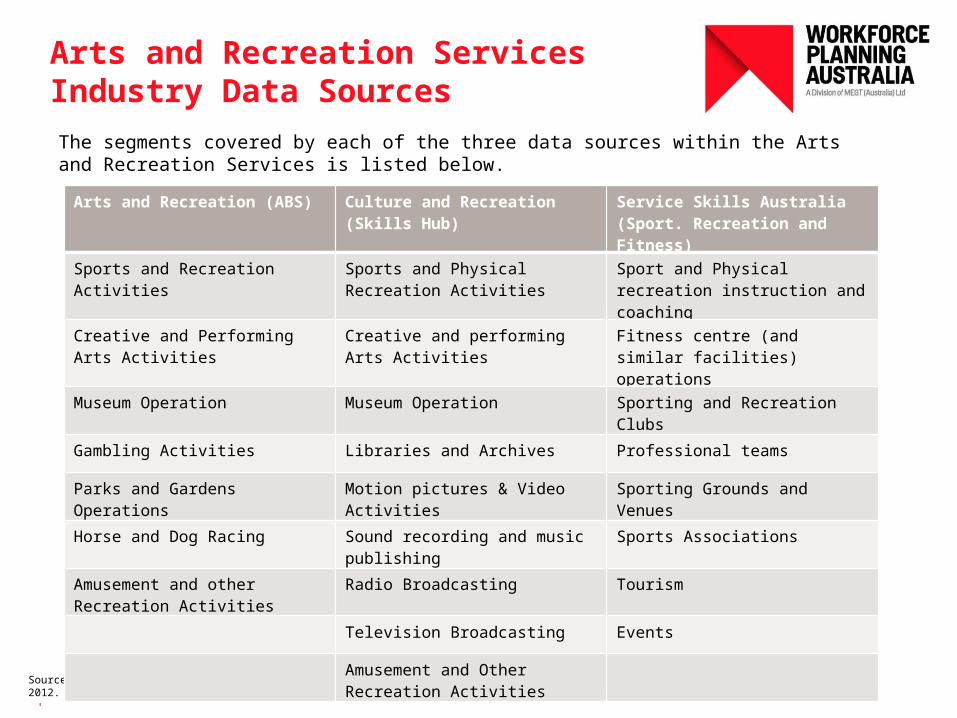
The segments covered by each of the three data sources within the Arts and Recreation Services is listed below.
Arts and Recreation (ABS) Culture and Recreation (Skills Hub)
Service Skills Australia (Sport. Recreation and Fitness)
Sports and Recreation Activities
Sports and Physical Recreation Activities
Sport and Physical recreation instruction and coaching
Creative and Performing Arts Activities
Creative and performing Arts Activities
Fitness centre (and similar facilities) operations
Museum Operation Museum Operation Sporting and Recreation Clubs
Gambling Activities Libraries and Archives Professional teams
Parks and Gardens Operations Motion pictures & Video Activities
Sporting Grounds and Venues
Horse and Dog Racing Sound recording and music publishing
Sports Associations
Amusement and other Recreation Activities
Radio Broadcasting Tourism
Television Broadcasting Events
Amusement and Other Recreation Activities

National Industry Overview
Arts and Recreation Services Industry Employment
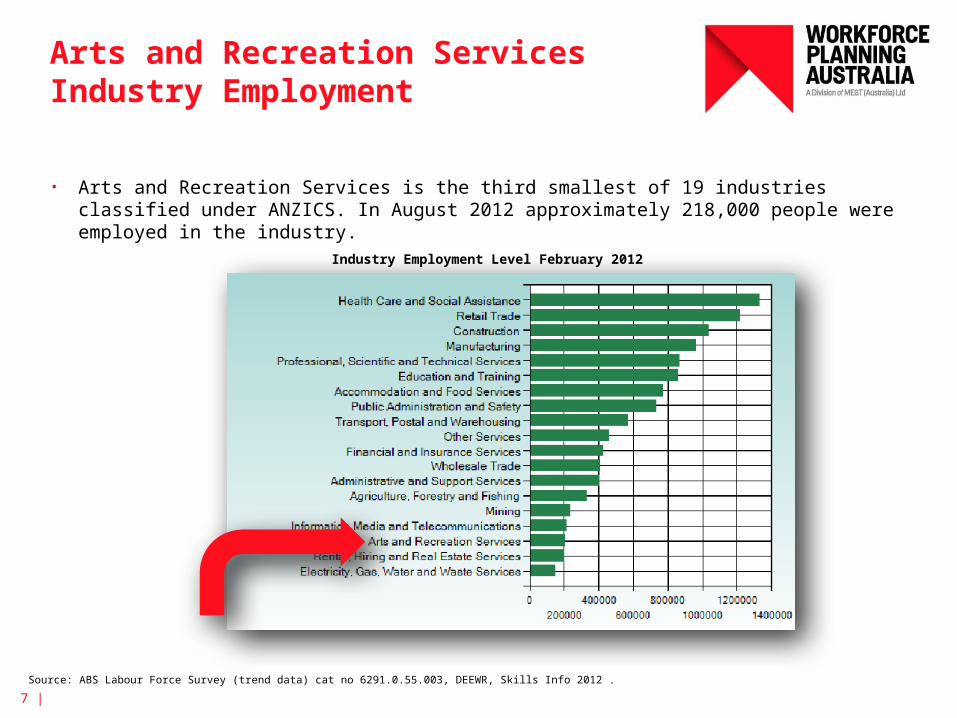
• Arts and Recreation Services is the third smallest of 19 industries classified under ANZICS. In August 2012 approximately 218,000 people were employed in the industry.
7 |
Source: ABS Labour Force Survey (trend data) cat no 6291.0.55.003, DEEWR, Skills Info 2012 .
Industry Employment Level February 2012
Arts and Recreation Services Historical Employment Growth
8 |
Source: ABS Labour Force Survey (trend data) cat no 6291.0.55.003, DEEWR, Skills Info 2012
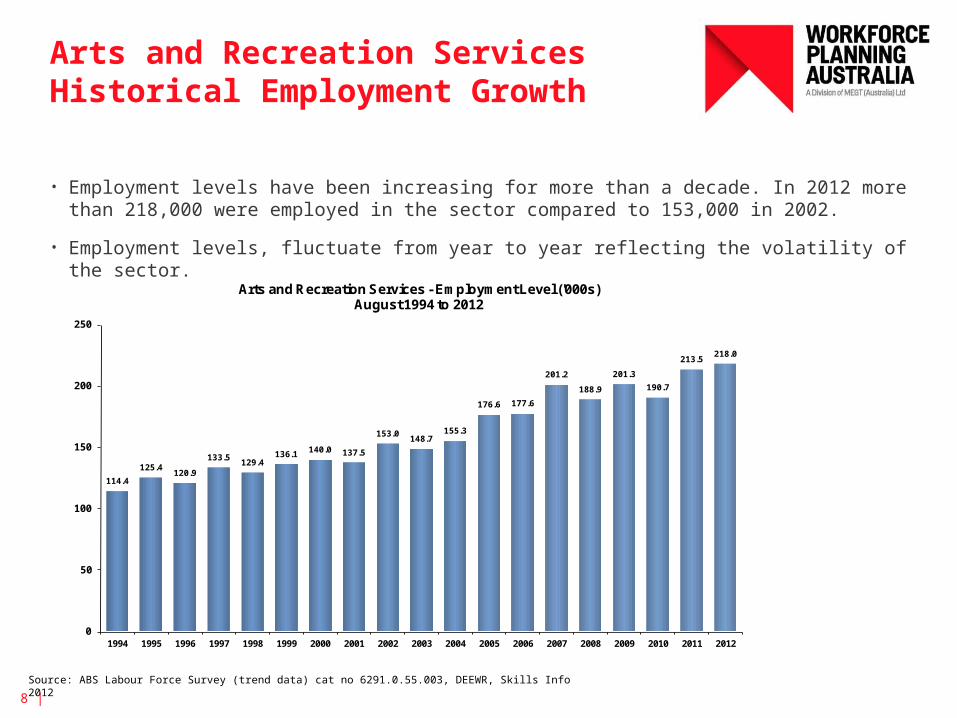
• Employment levels have been increasing for more than a decade. In 2012 more than 218,000 were employed in the sector compared to 153,000 in 2002.
• Employment levels, fluctuate from year to year reflecting the volatility of the sector.
114.4
125.4120.9
133.5129.4
136.1140.0 137.5
153.0148.7
155.3
176.6 177.6
201.2
188.9
201.3
190.7
213.5218.0
0
50
100
150
200
250
1994 1995 1996 1997 1998 1999 2000 2001 2002 2003 2004 2005 2006 2007 2008 2009 2010 2011 2012
Arts and Recreation Services - Employment Level ('000s)August 1994 to 2012
Arts and Recreation Services Projected Employment Level by segment (%)
9 |
Source: ABS Labour Force Survey (trend data) cat no 6291.0.55.003 (DEEWR Projections), DEEWR, SkilisInfo ,2012
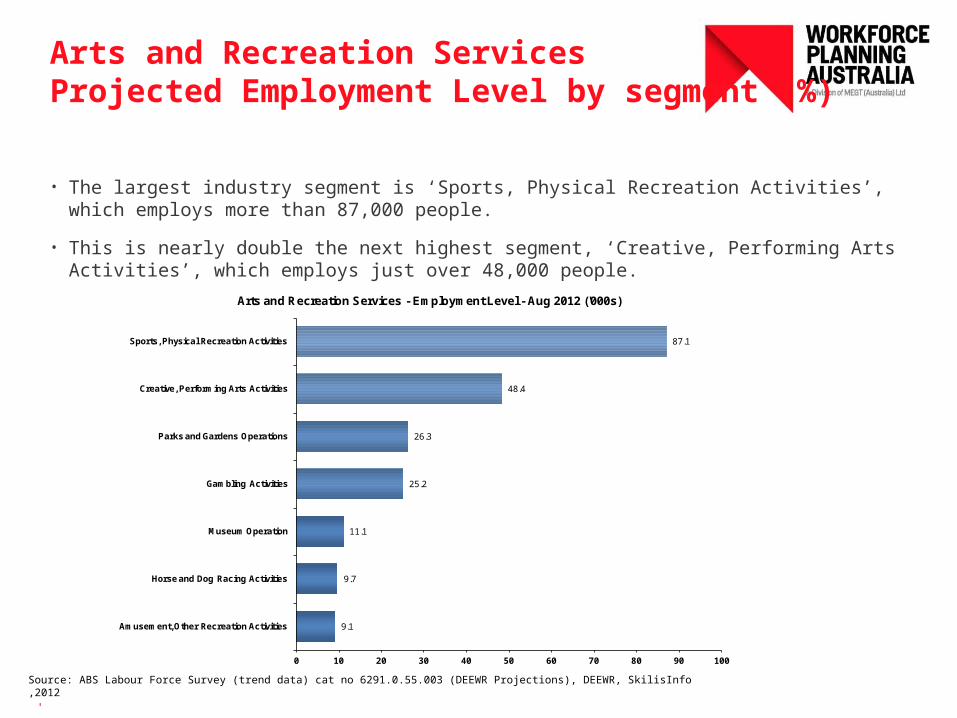
• The largest industry segment is ‘Sports, Physical Recreation Activities’, which employs more than 87,000 people.
• This is nearly double the next highest segment, ‘Creative, Performing Arts Activities’, which employs just over 48,000 people.
87.1
48.4
26.3
25.2
11.1
9.7
9.1
0 10 20 30 40 50 60 70 80 90 100
Sports, Physical Recreation Activities
Creative, Performing Arts Activities
Parks and Gardens Operations
Gambling Activities
Museum Operation
Horse and Dog Racing Activities
Amusement, Other Recreation Activities
Arts and Recreation Services - Employment Level - Aug 2012 ('000s)
Arts and Recreation Services Projected Employment Growth (‘000)
10 |
Source: ABS Labour Force Survey (trend data) cat no 6291.0.55.003 (DEEWR Projections), DEEWR, Skillsinfo, 2012
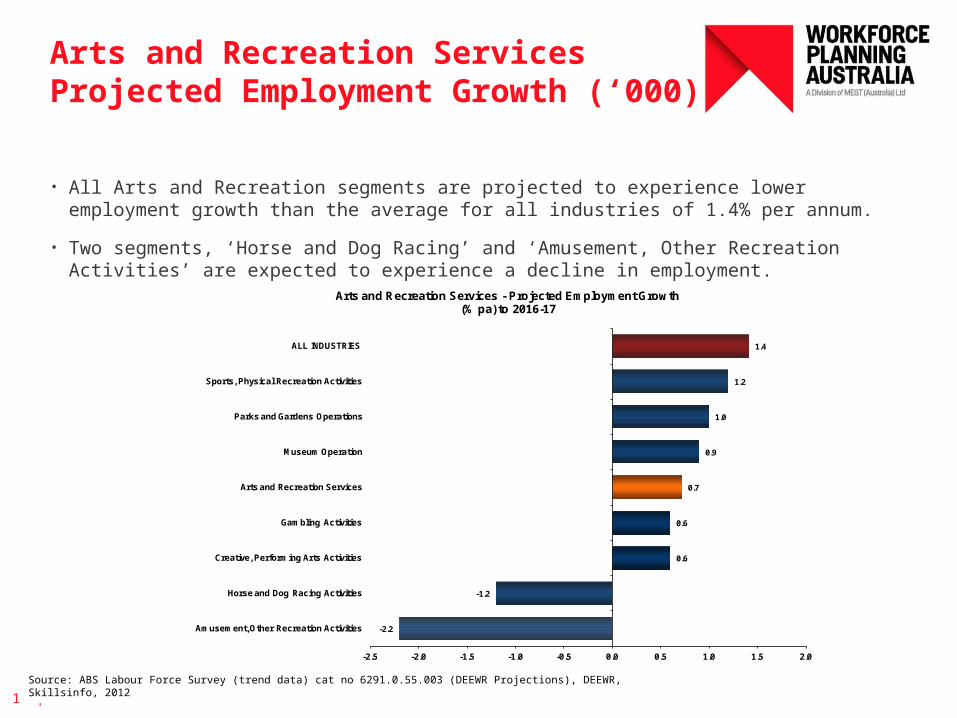
• All Arts and Recreation segments are projected to experience lower employment growth than the average for all industries of 1.4% per annum.
• Two segments, ‘Horse and Dog Racing’ and ‘Amusement, Other Recreation Activities’ are expected to experience a decline in employment.
-2.2
-1.2
0.6
0.6
0.7
0.9
1.0
1.2
1.4
-2.5 -2.0 -1.5 -1.0 -0.5 0.0 0.5 1.0 1.5 2.0
Amusement, Other Recreation Activities
Horse and Dog Racing Activities
Creative, Performing Arts Activities
Gambling Activities
Arts and Recreation Services
Museum Operation
Parks and Gardens Operations
Sports, Physical Recreation Activities
ALL INDUSTRIES
Arts and Recreation Services - Projected Employment Growth(% pa) to 2016-17
Arts and Recreation Services Projected Employment Growth (%)
11 |
Source: ABS Labour Force Survey (trend data) cat no 6291.0.55.003 (DEEWR Projections), DEEWR, SkillsInfo 2012
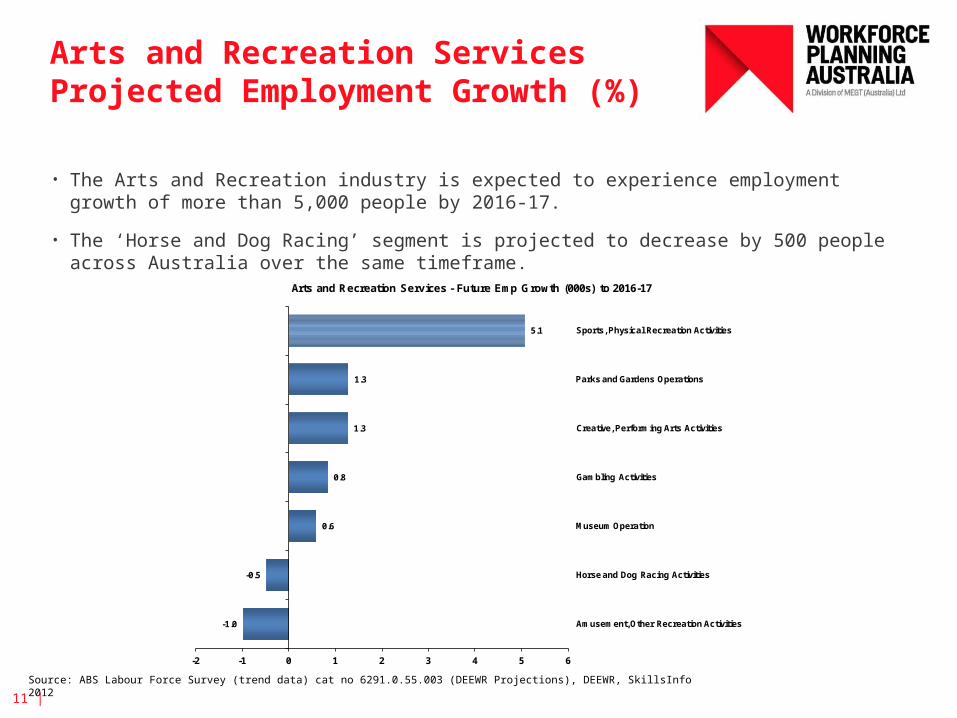
• The Arts and Recreation industry is expected to experience employment growth of more than 5,000 people by 2016-17.
• The ‘Horse and Dog Racing’ segment is projected to decrease by 500 people across Australia over the same timeframe.
5.1
1.3
1.3
0.8
0.6
-0.5
-1.0
-2 -1 0 1 2 3 4 5 6
Sports, Physical Recreation Activities
Parks and Gardens Operations
Creative, Performing Arts Activities
Gambling Activities
Museum Operation
Horse and Dog Racing Activities
Amusement, Other Recreation Activities
Arts and Recreation Services - Future Emp Growth (000s) to 2016-17
Arts and Recreation Services –Top 20 Occupations
12 |
Source: ABS Labour Force Survey (trend data) cat no 6291.0.55.003, DEEWR, SkillsInfo, 2012
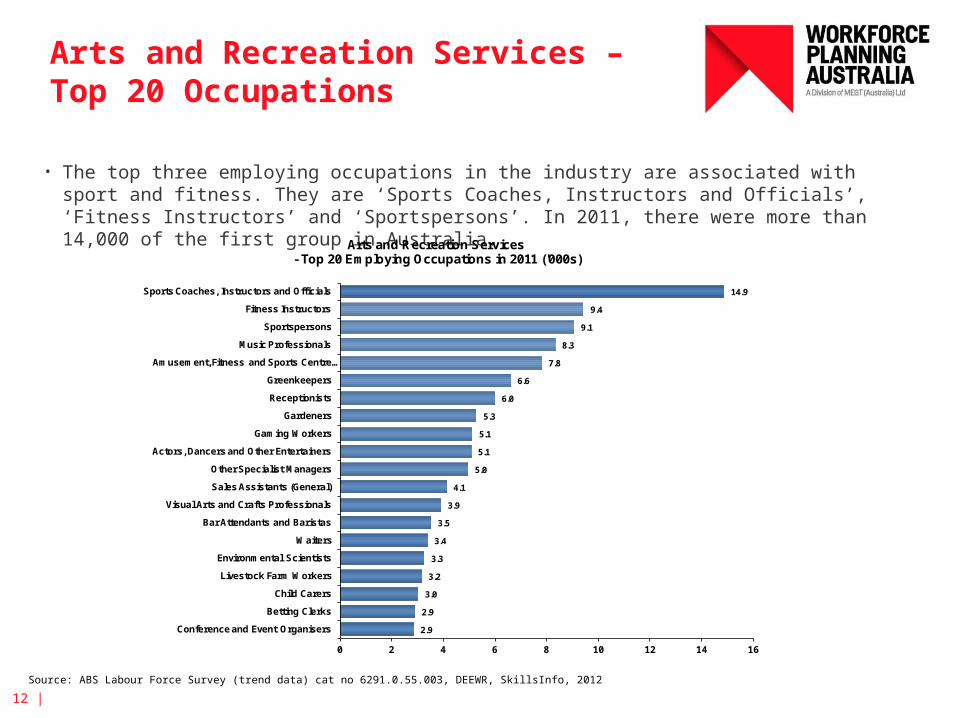
• The top three employing occupations in the industry are associated with sport and fitness. They are ‘Sports Coaches, Instructors and Officials’, ‘Fitness Instructors’ and ‘Sportspersons’. In 2011, there were more than 14,000 of the first group in Australia.
14.9
9.4
9.1
8.3
7.8
6.6
6.0
5.3
5.1
5.1
5.0
4.1
3.9
3.5
3.4
3.3
3.2
3.0
2.9
2.9
0 2 4 6 8 10 12 14 16
Sports Coaches, Instructors and Officials
Fitness Instructors
Sportspersons
Music Professionals
Amusement, Fitness and Sports Centre …
Greenkeepers
Receptionists
Gardeners
Gaming Workers
Actors, Dancers and Other Entertainers
Other Specialist Managers
Sales Assistants (General)
Visual Arts and Crafts Professionals
Bar Attendants and Baristas
Waiters
Environmental Scientists
Livestock Farm Workers
Child Carers
Betting Clerks
Conference and Event Organisers
Arts and Recreation Services- Top 20 Employing Occupations in 2011 ('000s)

Industry OverviewVictoria
Arts and Recreation Services: A Victorian Perspective
14 |
Source: Deloitte Access Economics, Victorian skills needs in 2011: A summary of industry intelligence (Skills Victoria), March 2011
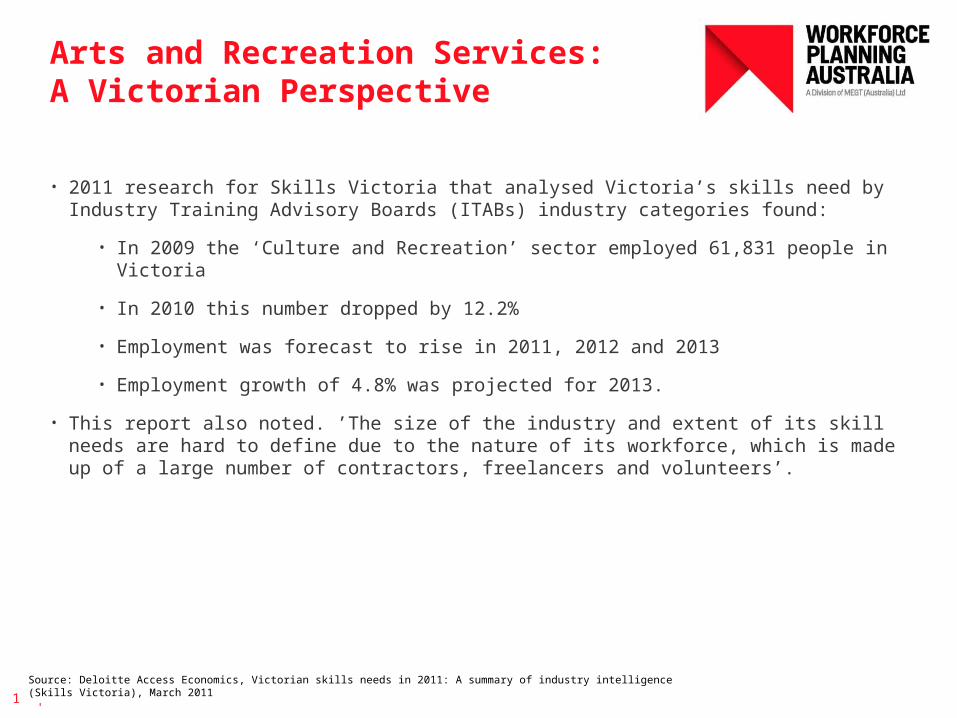
• 2011 research for Skills Victoria that analysed Victoria’s skills need by Industry Training Advisory Boards (ITABs) industry categories found:
• In 2009 the ‘Culture and Recreation’ sector employed 61,831 people in Victoria
• In 2010 this number dropped by 12.2%
• Employment was forecast to rise in 2011, 2012 and 2013
• Employment growth of 4.8% was projected for 2013.
• This report also noted. ’The size of the industry and extent of its skill needs are hard to define due to the nature of its workforce, which is made up of a large number of contractors, freelancers and volunteers’.
Culture and Recreation Services Occupations in Demand in Victoria
15 |
Source: Deloitte Access Economics, Victorian skills needs in 2011: A summary of industry intelligence (Skills Victoria), March 2011
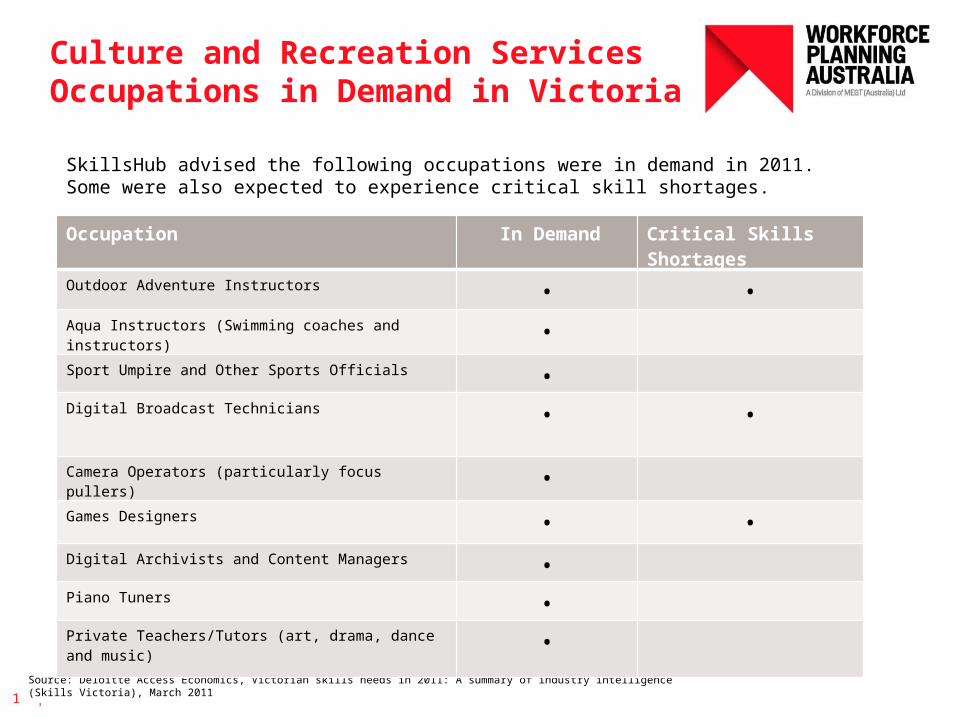
Occupation In Demand Critical Skills Shortages
Outdoor Adventure Instructors • •Aqua Instructors (Swimming coaches and instructors) •
Sport Umpire and Other Sports Officials •Digital Broadcast Technicians • •
Camera Operators (particularly focus pullers) •Games Designers • •Digital Archivists and Content Managers •Piano Tuners •Private Teachers/Tutors (art, drama, dance and music) •
SkillsHub advised the following occupations were in demand in 2011. Some were also expected to experience critical skill shortages.
Arts and Recreation Services Drivers of Workforce Demand and Workforce Development
16 |
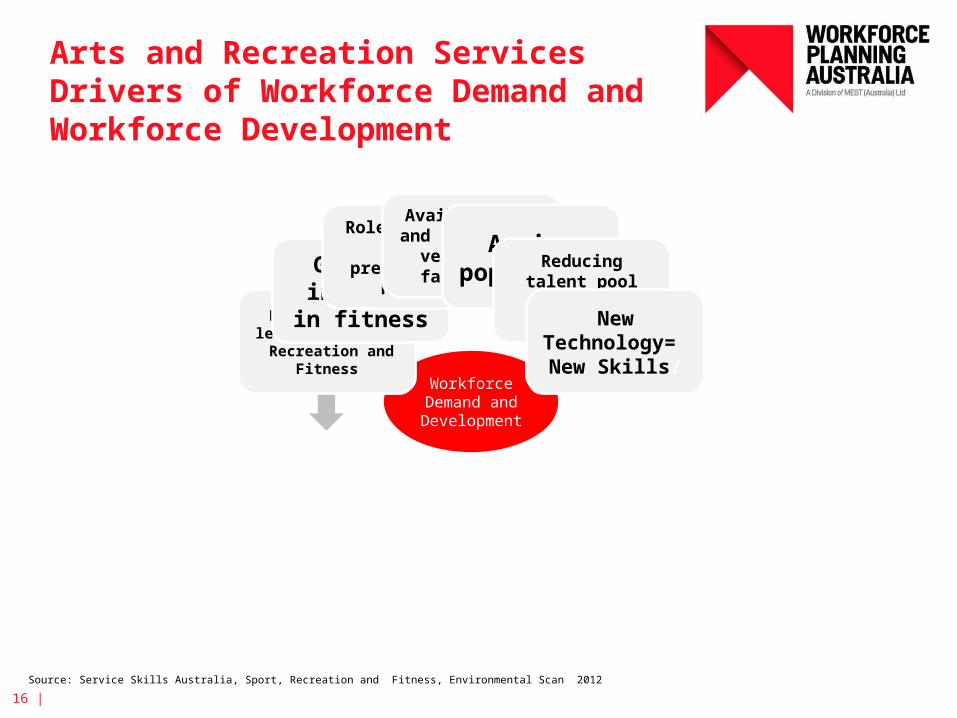
Workforce Demand and Development
Participation levels in Sport,
Recreation and Fitness
Growing interest in
fitness
Role of sport in
preventative health
Availability and funding of
venues and facilities
Ageing populationReducing
talent pool for elite sportNew
Technology= New Skills/
Source: Service Skills Australia, Sport, Recreation and Fitness, Environmental Scan 2012
Arts and Recreation: Drivers of Workforce Demand and Workforce Development
17 |
Source: Deloitte Access Economics, Victorian skills needs in 2011: A summary of industry intelligence (Skills Victoria), March 2011
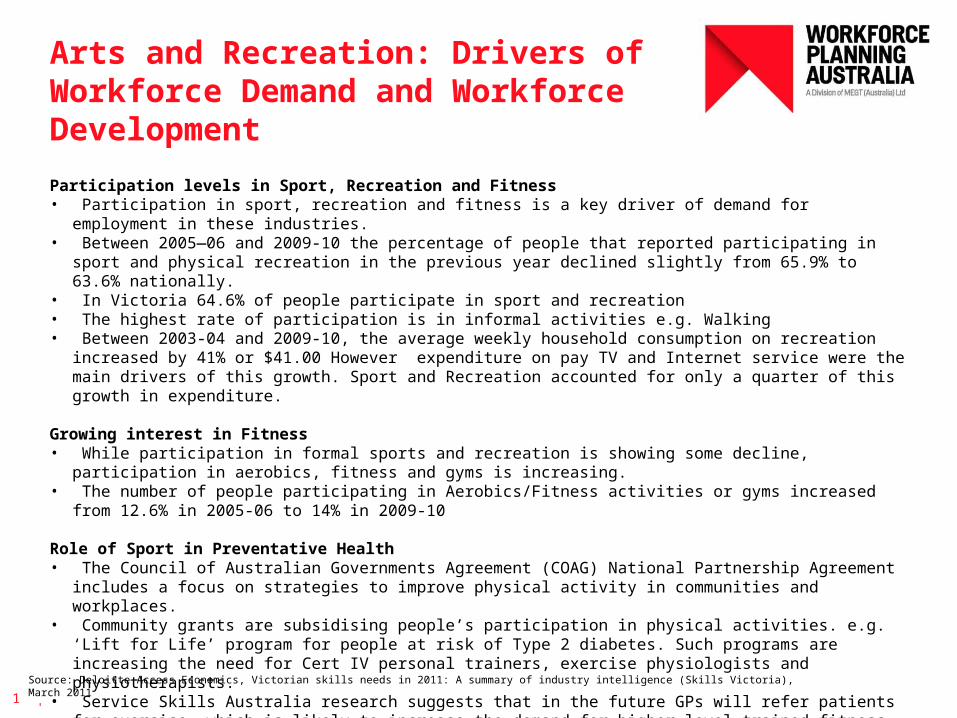
Participation levels in Sport, Recreation and Fitness• Participation in sport, recreation and fitness is a key driver of demand for employment in these
industries.• Between 2005—06 and 2009-10 the percentage of people that reported participating in sport and
physical recreation in the previous year declined slightly from 65.9% to 63.6% nationally. • In Victoria 64.6% of people participate in sport and recreation • The highest rate of participation is in informal activities e.g. Walking• Between 2003-04 and 2009-10, the average weekly household consumption on recreation increased
by 41% or $41.00 However expenditure on pay TV and Internet service were the main drivers of this growth. Sport and Recreation accounted for only a quarter of this growth in expenditure.
Growing interest in Fitness• While participation in formal sports and recreation is showing some decline, participation in aerobics,
fitness and gyms is increasing.• The number of people participating in Aerobics/Fitness activities or gyms increased from 12.6% in
2005-06 to 14% in 2009-10
Role of Sport in Preventative Health• The Council of Australian Governments Agreement (COAG) National Partnership Agreement includes a
focus on strategies to improve physical activity in communities and workplaces. • Community grants are subsidising people’s participation in physical activities. e.g. ‘Lift for Life’
program for people at risk of Type 2 diabetes. Such programs are increasing the need for Cert IV personal trainers, exercise physiologists and physiotherapists.
• Service Skills Australia research suggests that in the future GPs will refer patients for exercise, which is likely to increase the demand for higher level trained fitness professionals.
Arts and Recreation: Drivers of Workforce Demand and Workforce Development
18 |
Source: Service Skills Australia, Environmental Scan 2012
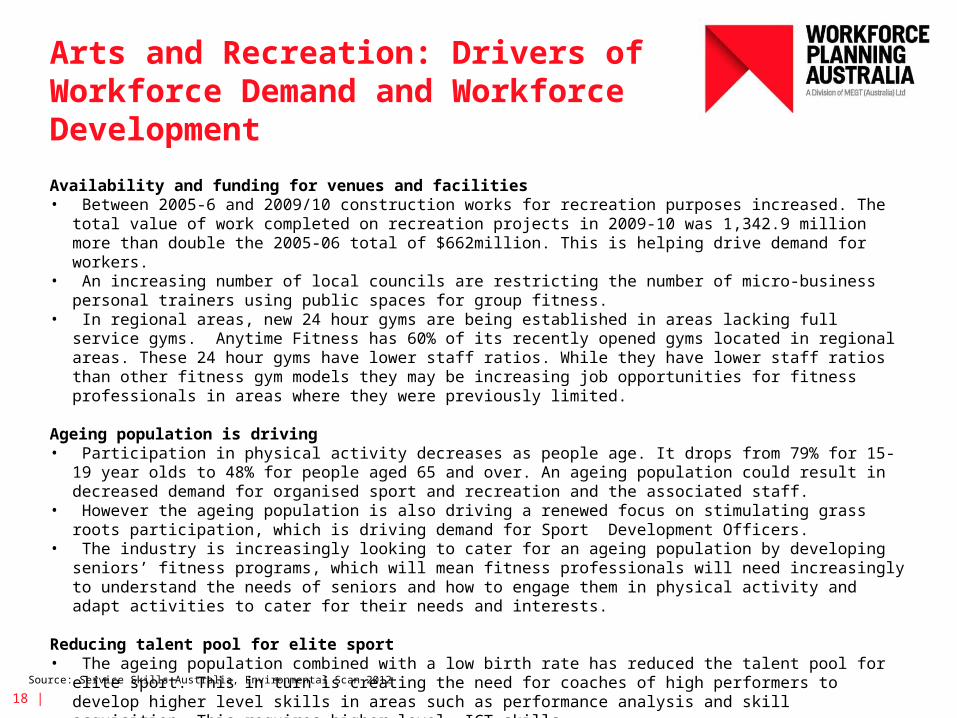
Availability and funding for venues and facilities• Between 2005-6 and 2009/10 construction works for recreation purposes increased. The total value of
work completed on recreation projects in 2009-10 was 1,342.9 million more than double the 2005-06 total of $662million. This is helping drive demand for workers.
• An increasing number of local councils are restricting the number of micro-business personal trainers using public spaces for group fitness.
• In regional areas, new 24 hour gyms are being established in areas lacking full service gyms. Anytime Fitness has 60% of its recently opened gyms located in regional areas. These 24 hour gyms have lower staff ratios. While they have lower staff ratios than other fitness gym models they may be increasing job opportunities for fitness professionals in areas where they were previously limited.
Ageing population is driving• Participation in physical activity decreases as people age. It drops from 79% for 15-19 year olds to 48%
for people aged 65 and over. An ageing population could result in decreased demand for organised sport and recreation and the associated staff.
• However the ageing population is also driving a renewed focus on stimulating grass roots participation, which is driving demand for Sport Development Officers.
• The industry is increasingly looking to cater for an ageing population by developing seniors’ fitness programs, which will mean fitness professionals will need increasingly to understand the needs of seniors and how to engage them in physical activity and adapt activities to cater for their needs and interests.
Reducing talent pool for elite sport• The ageing population combined with a low birth rate has reduced the talent pool for elite sport. This in
turn is creating the need for coaches of high performers to develop higher level skills in areas such as performance analysis and skill acquisition. This requires higher level ICT skills.
Arts and Recreation: Drivers of Workforce Demand and Workforce Development
19 |
Source: Service Skills Australia, Environmental Scan 2012
New technology = New Skills
• While information is limited, industry feedback suggests sporting clubs and associations, gyms and other fitness and recreational organisations are developing on-line services. This is in response to customer expectations that the customer service relations will include online, social media and smart phones. Skills in retailing, copyright and social marketing are increasingly being required.
• Social media is allowing people to set up recreational and casual sport groups by passing the traditional role of clubs and other recreational organisations in bring people together.
The availability of a growing number of smart phone ‘apps’, which offer personalised fitness programs is leading to concerns by fitness professionals that their services will be bypassed.
• This new technology is necessitating new marketing, retailing and entertainment practices. Sector particularly affected include television, film, game design.

Hume Overview
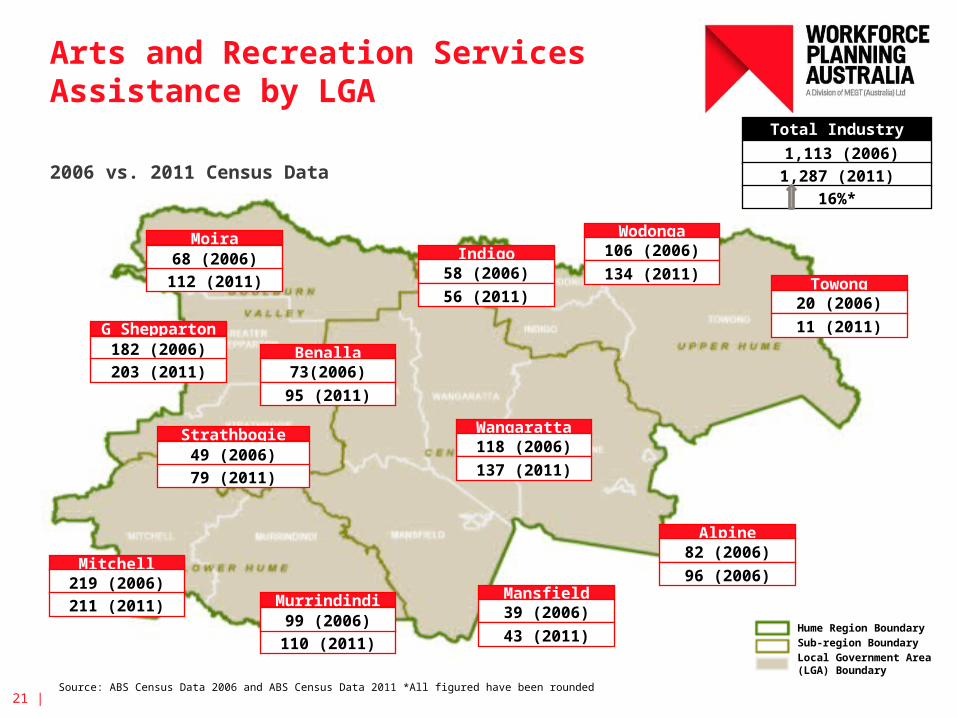
Arts and Recreation Services Assistance by LGA
2006 vs. 2011 Census Data
21 |
Towong20 (2006)
Wodonga106 (2006)
Alpine82 (2006)
Mansfield39 (2006)
Hume Region BoundarySub-region BoundaryLocal Government Area (LGA) Boundary
Indigo58 (2006)
Murrindindi
110 (2011)
Mitchell219 (2006)
Strathbogie49 (2006)
G Shepparton
Moira68 (2006)
Wangaratta118 (2006)
Benalla73(2006)
182 (2006)
95 (2011)
112 (2011)56 (2011)
134 (2011)
11 (2011)
137 (2011)
43 (2011)
96 (2006)
203 (2011)
211 (2011)
79 (2011)
99 (2006)
Total Industry
1,113 (2006)1,287 (2011)
Source: ABS Census Data 2006 and ABS Census Data 2011 *All figured have been rounded
16%*
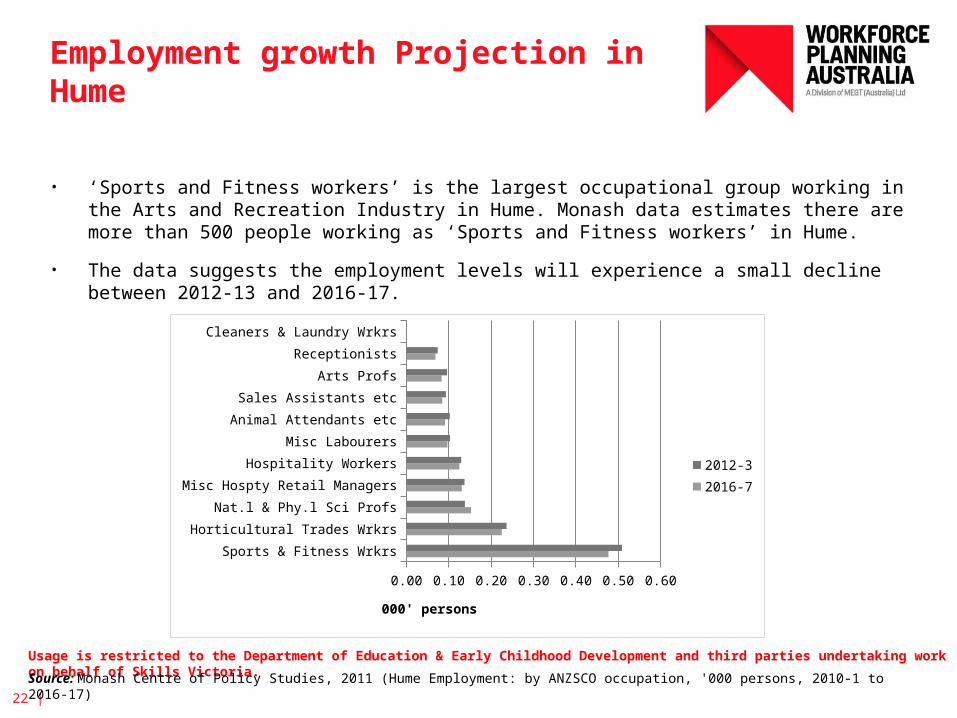
Employment growth Projection in Hume
• ‘Sports and Fitness workers’ is the largest occupational group working in the Arts and Recreation Industry in Hume. Monash data estimates there are more than 500 people working as ‘Sports and Fitness workers’ in Hume.
• The data suggests the employment levels will experience a small decline between 2012-13 and 2016-17.
22 |
Usage is restricted to the Department of Education & Early Childhood Development and third parties undertaking work on behalf of Skills Victoria.Source: Monash Centre of Policy Studies, 2011 (Hume Employment: by ANZSCO occupation, '000 persons, 2010-1 to 2016-17)
Sports & Fitness Wrkrs
Horticultural Trades Wrkrs
Nat.l & Phy.l Sci Profs
Misc Hospty Retail Managers
Hospitality Workers
Misc Labourers
Animal Attendants etc
Sales Assistants etc
Arts Profs
Receptionists
Cleaners & Laundry Wrkrs
0.00 0.10 0.20 0.30 0.40 0.50 0.60
2012-32016-7
000' persons
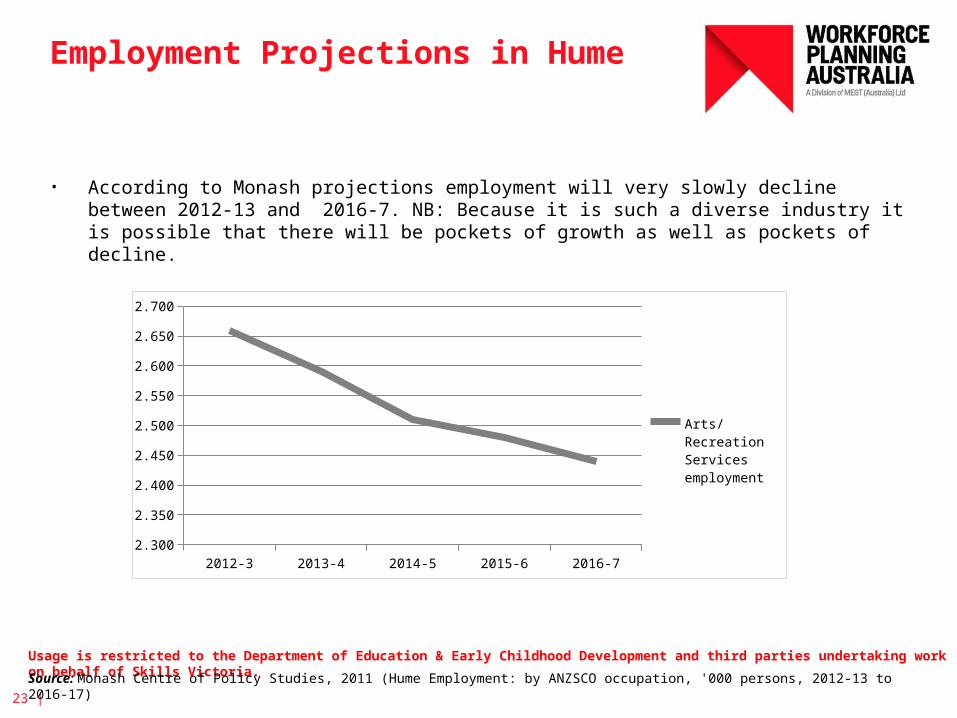
Employment Projections in Hume
• According to Monash projections employment will very slowly decline between 2012-13 and 2016-7. NB: Because it is such a diverse industry it is possible that there will be pockets of growth as well as pockets of decline.
23 |
Usage is restricted to the Department of Education & Early Childhood Development and third parties undertaking work on behalf of Skills Victoria.Source: Monash Centre of Policy Studies, 2011 (Hume Employment: by ANZSCO occupation, '000 persons, 2012-13 to 2016-17)
2012-3 2013-4 2014-5 2015-6 2016-72.300
2.350
2.400
2.450
2.500
2.550
2.600
2.650
2.700
Arts/Recreation Services em-ployment
Arts and Recreation VET Education DataFitness Instructor

Fitness Instructor

Fitness Instructor VET Enrolments Age Profile
26 |
Source: Data prepared 9 March 2012, Market Analysis team, Skills Victoria.
• Between 2008 and 2011 VET enrolments in Fitness Instructor certificate qualifications increased markedly. Enrolments jumped from approximately 115 in 2008 to more than 300 in 2011.
• The vast majority of people studying to become fitness instructors are aged between 15-29.
15 to 19 20 to 24 25 to 29 30 to 34 35 to 39 40 to 44 45 to 49 50 to 54 55 to 59 60 to 64 65 and over
Under 15
0
20
40
60
80
100
120
140
160
20082011
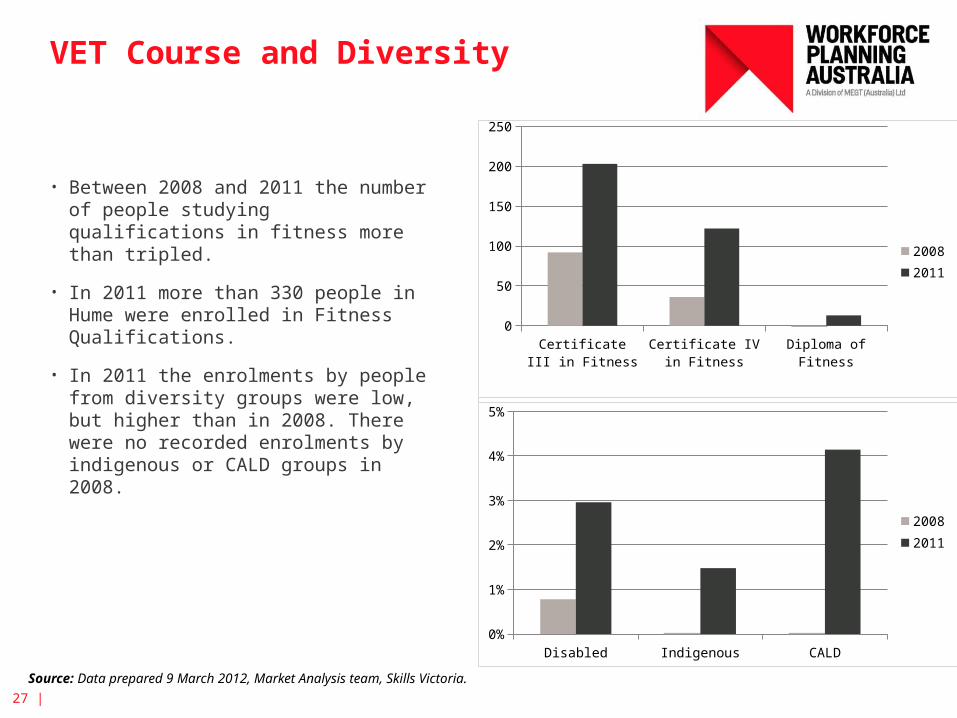
VET Course and Diversity
27 |
Source: Data prepared 9 March 2012, Market Analysis team, Skills Victoria.
• Between 2008 and 2011 the number of people studying qualifications in fitness more than tripled.
• In 2011 more than 330 people in Hume were enrolled in Fitness Qualifications.
• In 2011 the enrolments by people from diversity groups were low, but higher than in 2008. There were no recorded enrolments by indigenous or CALD groups in 2008.
Certificate III in Fitness
Certificate IV in Fitness
Diploma of Fitness
0
50
100
150
200
250
20082011
Disabled Indigenous CALD0%
1%
2%
3%
4%
5%
20082011
What this means?
Arts and Recreation Services is the third smallest of 19 industries classified underANZSIC and employs approximately 218,000 people.
Between 2007 and 2012, employment increased across Australia at a rate of 2% perannum but for the next five years employment growth is expected to slow to 1.6% growthper annum.
The largest segment is ‘Sports, Physical Recreation Activities’, employing 87,000 people.
The ‘Horse and Dog Racing’ segment is one of only two segments projected to experiencedecreases in employment levels.
A number of specialist areas within the sport and fitness industry, e.g. Seniors’ FitnessPrograms are expected to grow. Skill shortages exist for Outdoor Adventure Guides.
Employment in Arts and Recreation in Hume is expected to show a very small decline overthe next five years.
There are more than 500 Sports and Fitness Workers, the largest occupation inthe industry in the Hume Region.
Between 2006 and 2011 VET enrolments in Fitness Instructor qualifications in Humejumped from 115 to more than 300.
28 |

Data Quality and Limitations
The data challenges included:
1. Different definitions of industries / occupations between ABS, Industry Skills Councils and Monash.
2. Different Time periods used by different sources
3. Old Data - ABS Census is now 6 years old. 2011 ABS Census data has been used where available.
4. Lack of HUME region industry data particularly for industries where employers are predominantly private sector (e.g. Retail, manufacturing and Transport and Logistics)
5. Lack of regional Skills Shortage Data – DEEWR lists are at the State level
6. Changes in name and level of VET qualifications (training packages)
7. Poor sourcing of data – The data source and date were unclear for some data sources.
Limitation of Liability
This Labour Market Snapshot has been compiled using data which, to the best of Workforce Planning Australia’s knowledge, was current and correct at the time of printing.
WPA gives no warranty as to the accuracy of the information contained herein nor its applicability to any specific circumstances. It is intended as a guide only and Workforce Planning Australia will not be liable to any person as a result of any actual or perceived inaccuracy contained in this report.