Embed Size (px)
Citation preview
The Human Development Value Stream
AME/APQC Webinar November 16, 2011
Roger Gerard PhD, Chief Learning Officer, ThedaCare
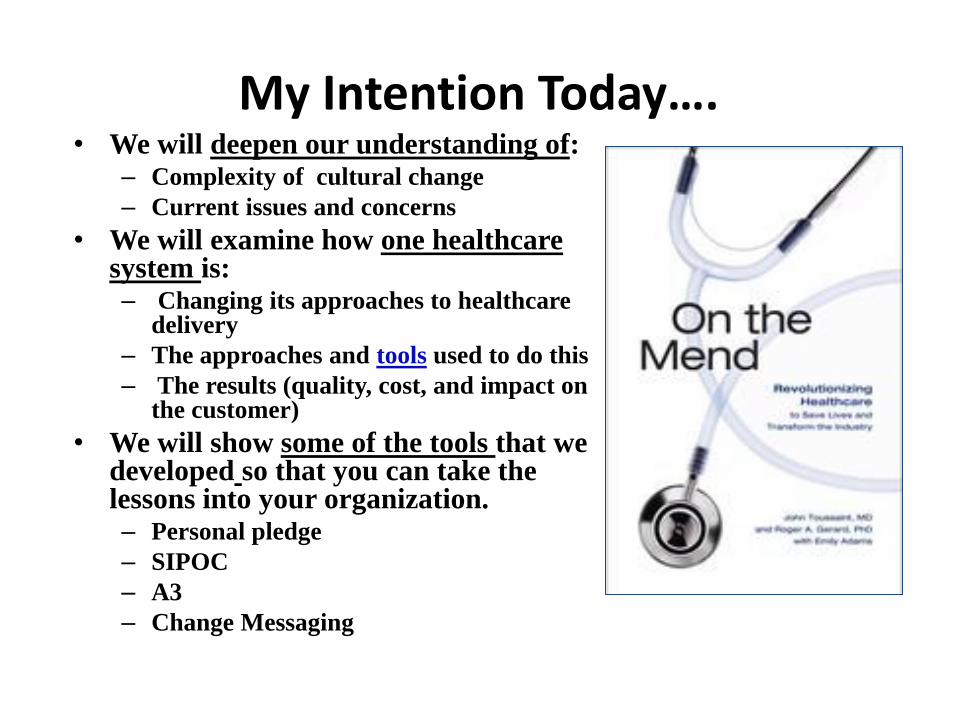
My Intention Today…. • We will deepen our understanding of:
– Complexity of cultural change
– Current issues and concerns
• We will examine how one healthcare system is: – Changing its approaches to healthcare
delivery
– The approaches and tools used to do this
– The results (quality, cost, and impact on the customer)
• We will show some of the tools that we developed so that you can take the lessons into your organization. – Personal pledge
– SIPOC
– A3
– Change Messaging
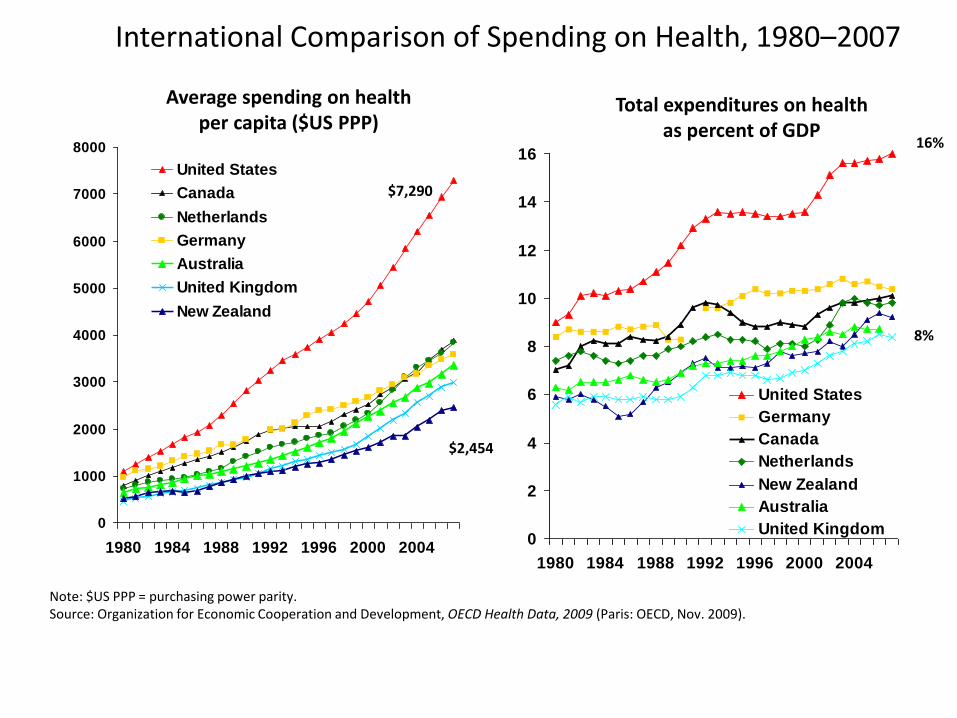
International Comparison of Spending on Health, 1980–2007
Note: $US PPP = purchasing power parity. Source: Organization for Economic Cooperation and Development, OECD Health Data, 2009 (Paris: OECD, Nov. 2009).
0
1000
2000
3000
4000
5000
6000
7000
8000
1980 1984 1988 1992 1996 2000 2004
United States
Canada
Netherlands
Germany
Australia
United Kingdom
New Zealand
Average spending on health per capita ($US PPP)
0
2
4
6
8
10
12
14
16
1980 1984 1988 1992 1996 2000 2004
United States
Germany
Canada
Netherlands
New Zealand
Australia
United Kingdom
Total expenditures on health as percent of GDP
$7,290
$2,454
16%
8%
4
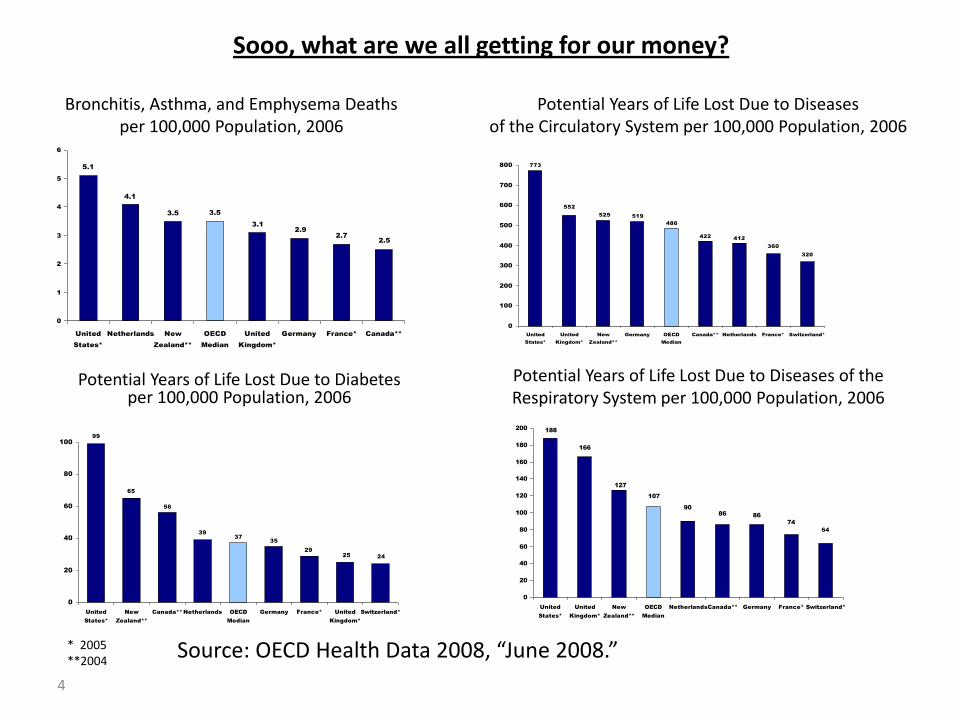
Bronchitis, Asthma, and Emphysema Deaths per 100,000 Population, 2006
5.1
4.1
3.5 3.5
3.1
2.9
2.7
2.5
0
1
2
3
4
5
6
United
States*
Netherlands New
Zealand**
OECD
Median
United
Kingdom*
Germany France* Canada**
* 2005 **2004
Source: OECD Health Data 2008, “June 2008.”
773
552
525 519
486
422412
360
320
0
100
200
300
400
500
600
700
800
United
States*
United
Kingdom*
New
Zealand**
Germany OECD
Median
Canada** Netherlands France* Switzerland*
Potential Years of Life Lost Due to Diseases of the Circulatory System per 100,000 Population, 2006
2425
29
35
37
39
56
65
99
0
20
40
60
80
100
United
States*
New
Zealand**
Canada**Netherlands OECD
Median
Germany France* United
Kingdom*
Switzerland*
Potential Years of Life Lost Due to Diabetes per 100,000 Population, 2006
188
166
127
107
90
8686
74
64
0
20
40
60
80
100
120
140
160
180
200
United
States*
United
Kingdom*
New
Zealand**
OECD
Median
NetherlandsCanada** Germany France* Switzerland*
Potential Years of Life Lost Due to Diseases of the Respiratory System per 100,000 Population, 2006
Sooo, what are we all getting for our money?
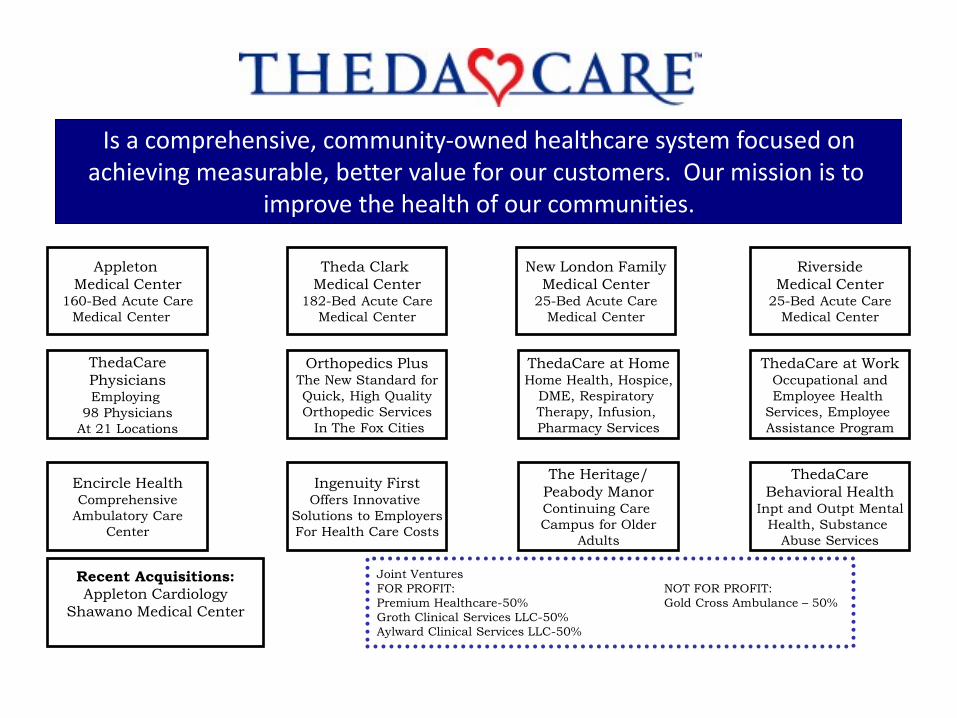
Is a comprehensive, community-owned healthcare system focused on achieving measurable, better value for our customers. Our mission is to
improve the health of our communities.
Appleton
Medical Center 160-Bed Acute Care
Medical Center
ThedaCare
Physicians Employing
98 Physicians
At 21 Locations
Ingenuity First Offers Innovative
Solutions to Employers
For Health Care Costs
Theda Clark
Medical Center 182-Bed Acute Care
Medical Center
New London Family
Medical Center 25-Bed Acute Care
Medical Center
Riverside
Medical Center 25-Bed Acute Care
Medical Center
ThedaCare at Home Home Health, Hospice,
DME, Respiratory
Therapy, Infusion,
Pharmacy Services
ThedaCare at Work Occupational and
Employee Health
Services, Employee
Assistance Program
Orthopedics Plus The New Standard for
Quick, High Quality
Orthopedic Services
In The Fox Cities
The Heritage/
Peabody Manor Continuing Care
Campus for Older
Adults
ThedaCare
Behavioral Health Inpt and Outpt Mental
Health, Substance
Abuse Services
July 2006
Encircle Health Comprehensive
Ambulatory Care
Center
Joint Ventures
FOR PROFIT: NOT FOR PROFIT:
Premium Healthcare-50% Gold Cross Ambulance – 50%
Groth Clinical Services LLC-50%
Aylward Clinical Services LLC-50%
Recent Acquisitions:
Appleton Cardiology
Shawano Medical Center
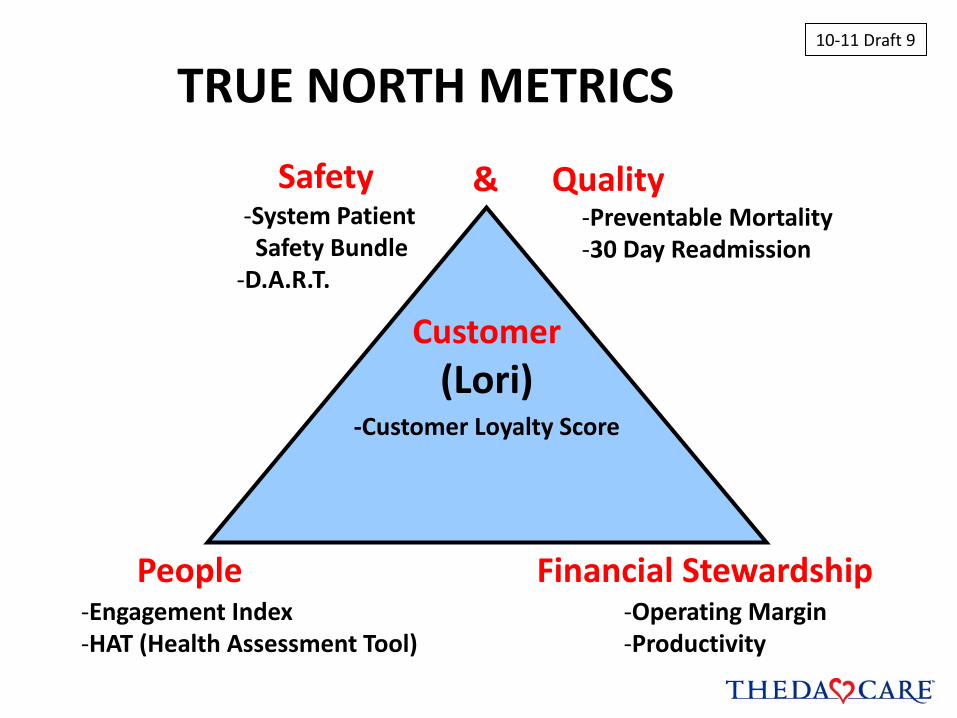
-Engagement Index -HAT (Health Assessment Tool)
-Operating Margin -Productivity
Financial Stewardship People
Safety -System Patient Safety Bundle -D.A.R.T.
-Customer Loyalty Score
10-11 Draft 9
Customer
(Lori)
TRUE NORTH METRICS
Quality -Preventable Mortality -30 Day Readmission
&
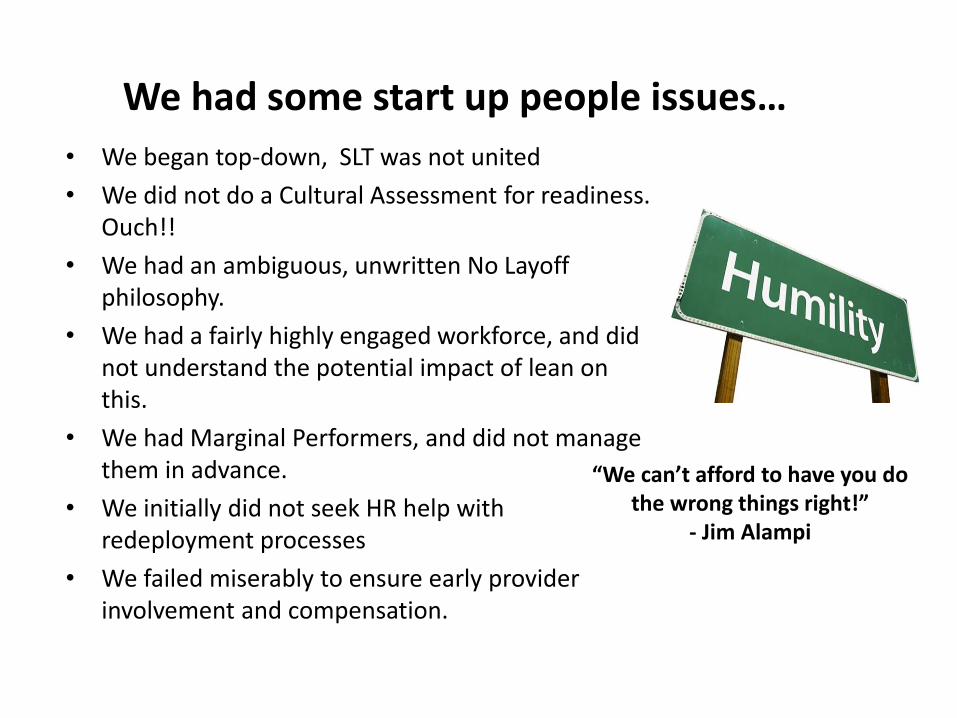
We had some start up people issues…
• We began top-down, SLT was not united
• We did not do a Cultural Assessment for readiness. Ouch!!
• We had an ambiguous, unwritten No Layoff philosophy.
• We had a fairly highly engaged workforce, and did not understand the potential impact of lean on this.
• We had Marginal Performers, and did not manage them in advance.
• We initially did not seek HR help with redeployment processes
• We failed miserably to ensure early provider involvement and compensation.
“We can’t afford to have you do the wrong things right!”
- Jim Alampi
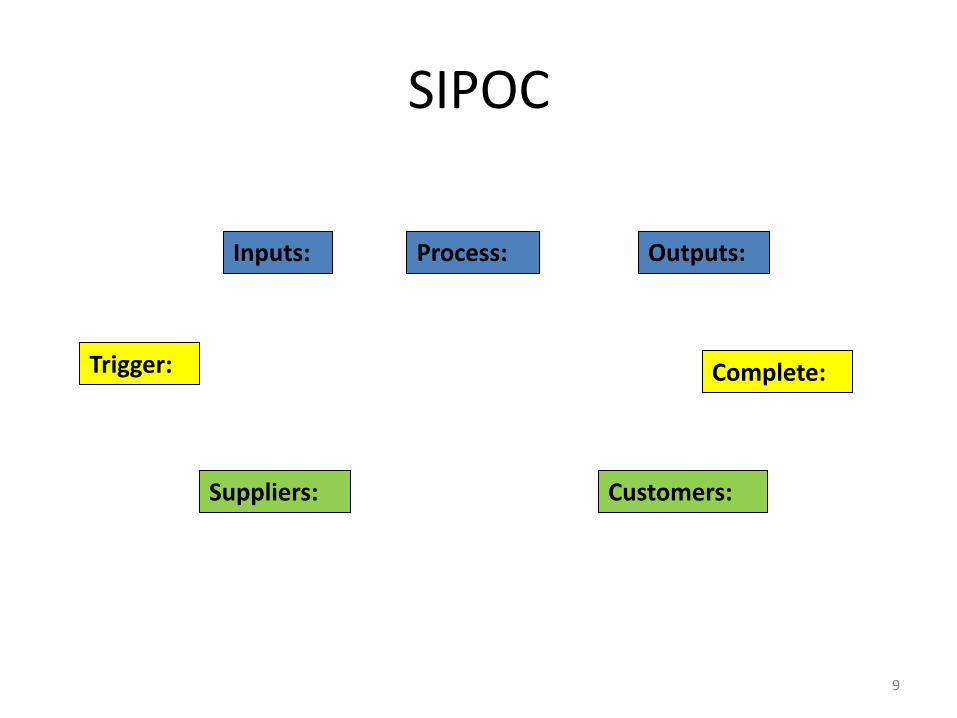
SIPOC
9
Suppliers: Customers:
Inputs: Process: Outputs:
Complete: Trigger:
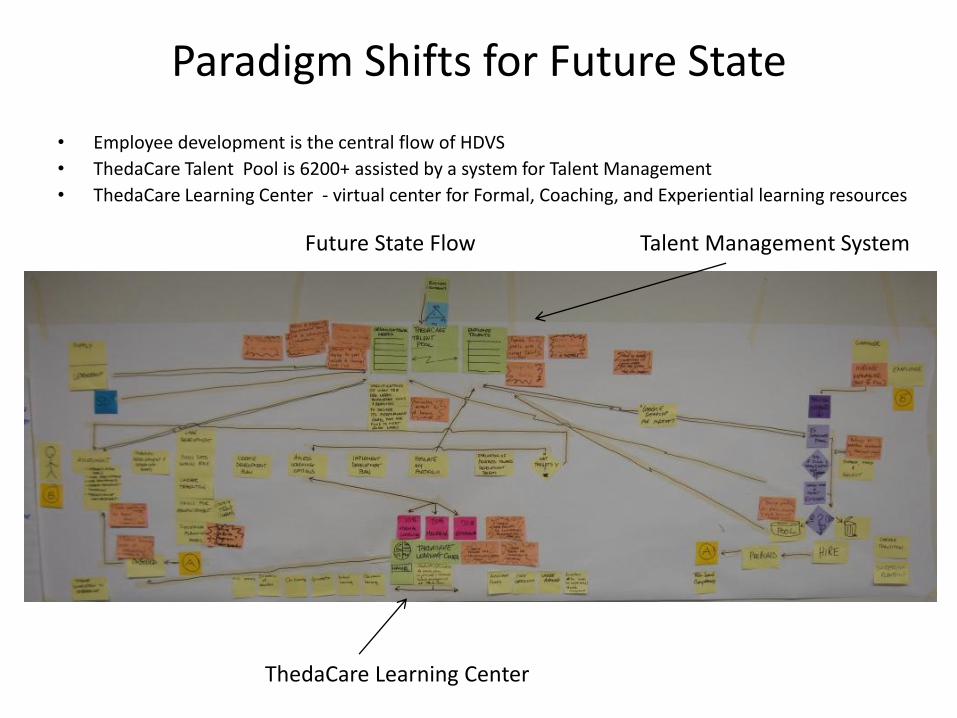
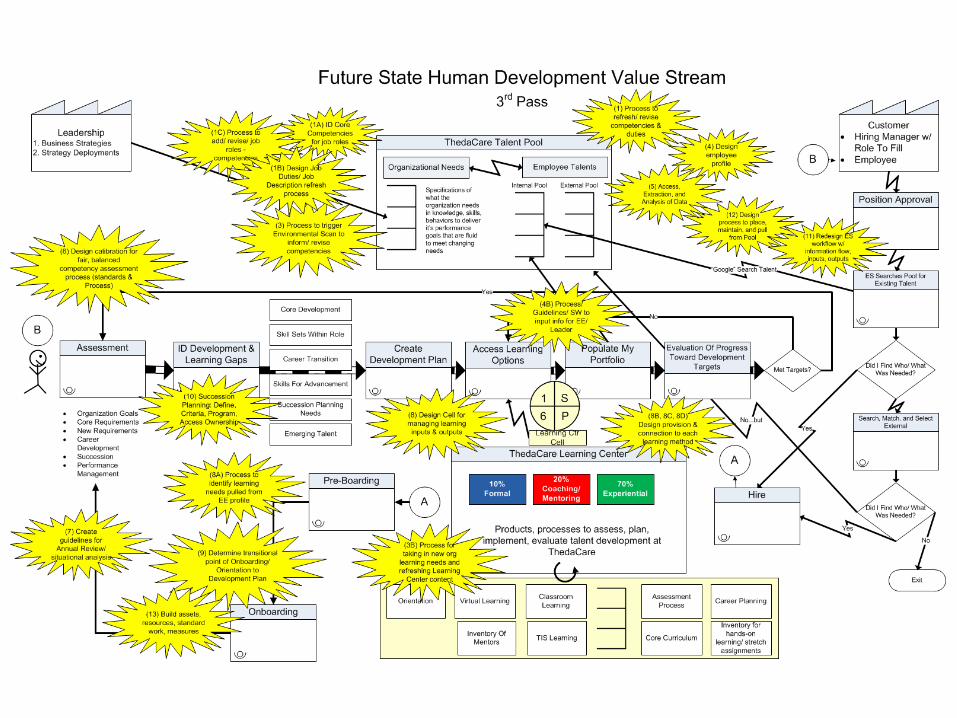
Paradigm Shifts for Future State
• Employee development is the central flow of HDVS
• ThedaCare Talent Pool is 6200+ assisted by a system for Talent Management
• ThedaCare Learning Center - virtual center for Formal, Coaching, and Experiential learning resources
Talent Management System
ThedaCare Learning Center
Future State Flow
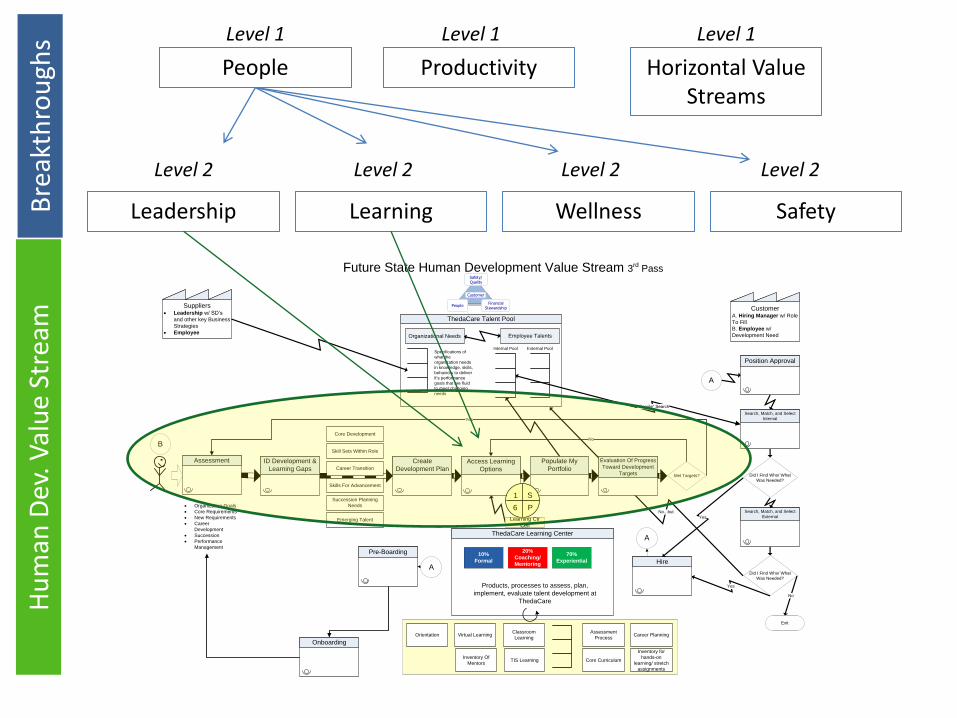
Hu
man
Dev
. Val
ue
Stre
am
Bre
akth
rou
ghs
Yes
No...but
ThedaCare Talent Pool
Suppliers· Leadership w/ SD’s
and other key Business
Strategies
· Employee
Assessment ID Development &
Learning Gaps
Create
Development PlanAccess Learning
Options
· Organization Goals
· Core Requirements
· New Requirements
· Career
Development
· Succession
· Performance
Management
Core Development
Skill Sets Within Role
Career Transition
Skills For Advancement
Succession Planning
Needs
Emerging Talent
Future State Human Development Value Stream 3rd Pass
Onboarding
A
Organizational Needs Employee Talents
Specifications of
what the
organization needs
in knowledge, skills,
behaviors to deliver
it’s performance
goals that are fluid
to meet changing
needs
Populate My
Portfolio
Evaluation Of Progress
Toward Development
Targets Met Targets?
No
ThedaCare Learning Center
10%
Formal
20%
Coaching/
Mentoring
70%
Experiential
Products, processes to assess, plan,
implement, evaluate talent development at
ThedaCare
Classroom
LearningOrientation Virtual Learning
Inventory Of
MentorsTIS Learning
Assessment
Process
Core Curriculum
Career Planning
Inventory for
hands-on
learning/ stretch
assignments
CustomerA. Hiring Manager w/ Role
To Fill
B. Employee w/
Development Need
Position Approval
Did I Find Who/ What
Was Needed?
Search, Match, and Select
External
Did I Find Who/ What
Was Needed?
External Pool
Exit
Hire
“Google” Search
Yes
No
Internal Pool
Yes
Search, Match, and Select
Internal
Pre-Boarding
A
1 S
6 P
Learning Ctr
Cell
Customer
Safety/Quality
PeopleFinancial
Stewardship
A
B
People Productivity Horizontal Value Streams
Leadership Learning Wellness Safety
Level 2 Level 2 Level 2 Level 2
Level 1 Level 1 Level 1
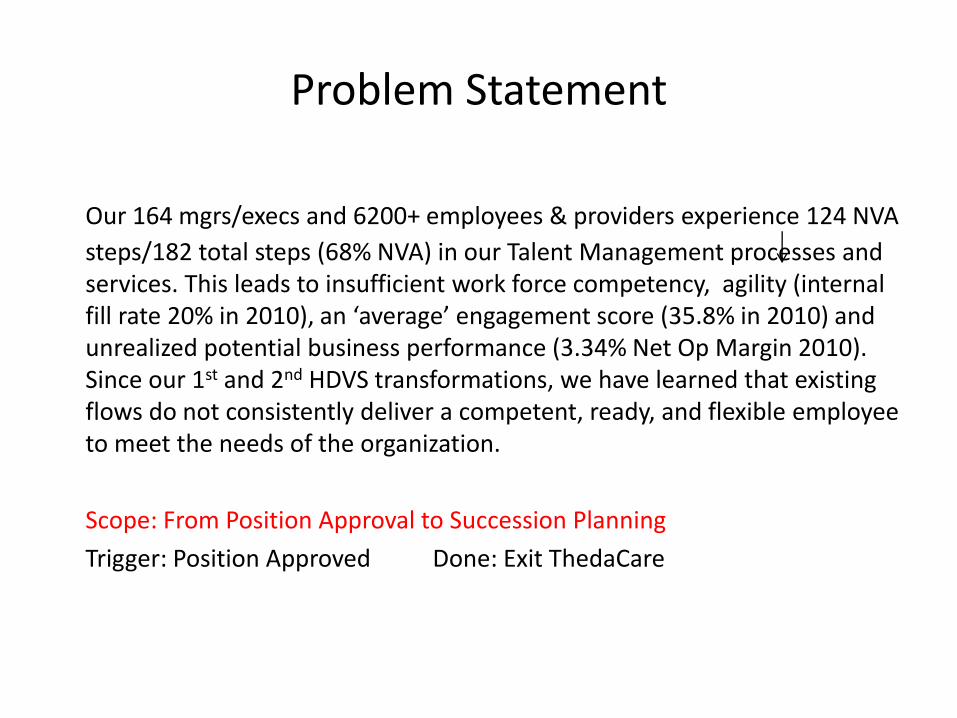
Problem Statement
Our 164 mgrs/execs and 6200+ employees & providers experience 124 NVA
steps/182 total steps (68% NVA) in our Talent Management processes and services. This leads to insufficient work force competency, agility (internal fill rate 20% in 2010), an ‘average’ engagement score (35.8% in 2010) and unrealized potential business performance (3.34% Net Op Margin 2010). Since our 1st and 2nd HDVS transformations, we have learned that existing flows do not consistently deliver a competent, ready, and flexible employee to meet the needs of the organization.
Scope: From Position Approval to Succession Planning
Trigger: Position Approved Done: Exit ThedaCare
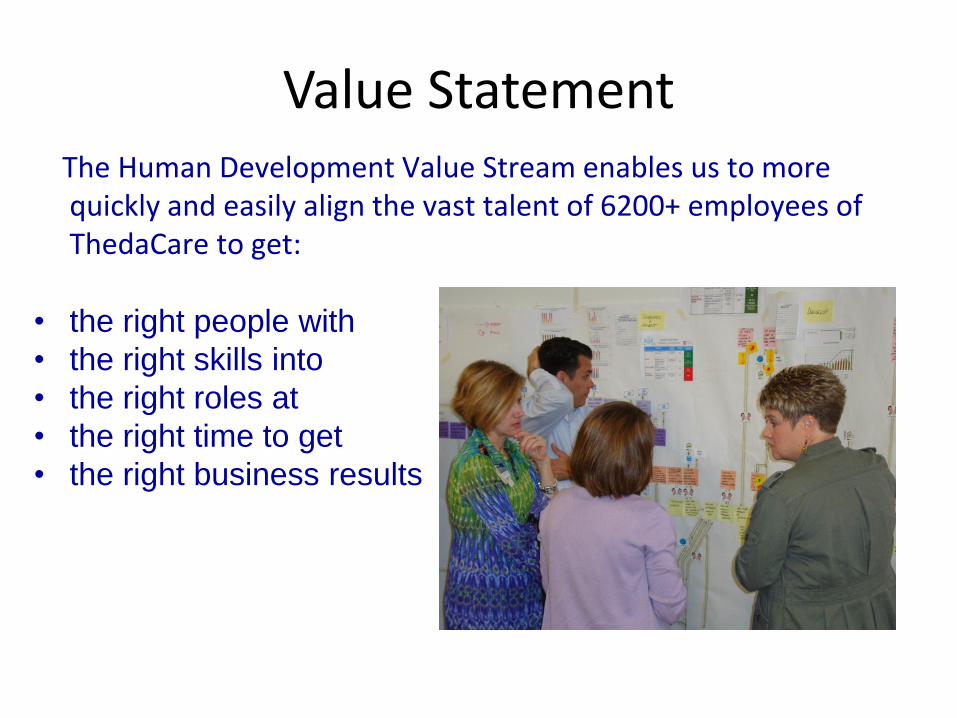
Value Statement The Human Development Value Stream enables us to more
quickly and easily align the vast talent of 6200+ employees of ThedaCare to get:
• the right people with
• the right skills into
• the right roles at
• the right time to get
• the right business results
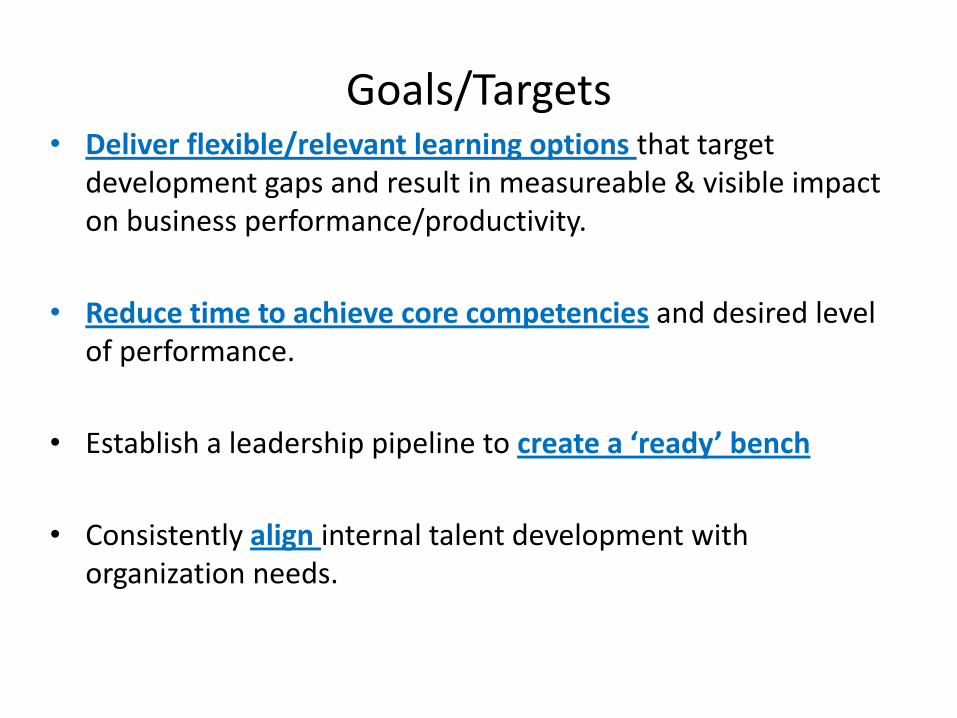
Goals/Targets • Deliver flexible/relevant learning options that target
development gaps and result in measureable & visible impact on business performance/productivity.
• Reduce time to achieve core competencies and desired level of performance.
• Establish a leadership pipeline to create a ‘ready’ bench
• Consistently align internal talent development with organization needs.
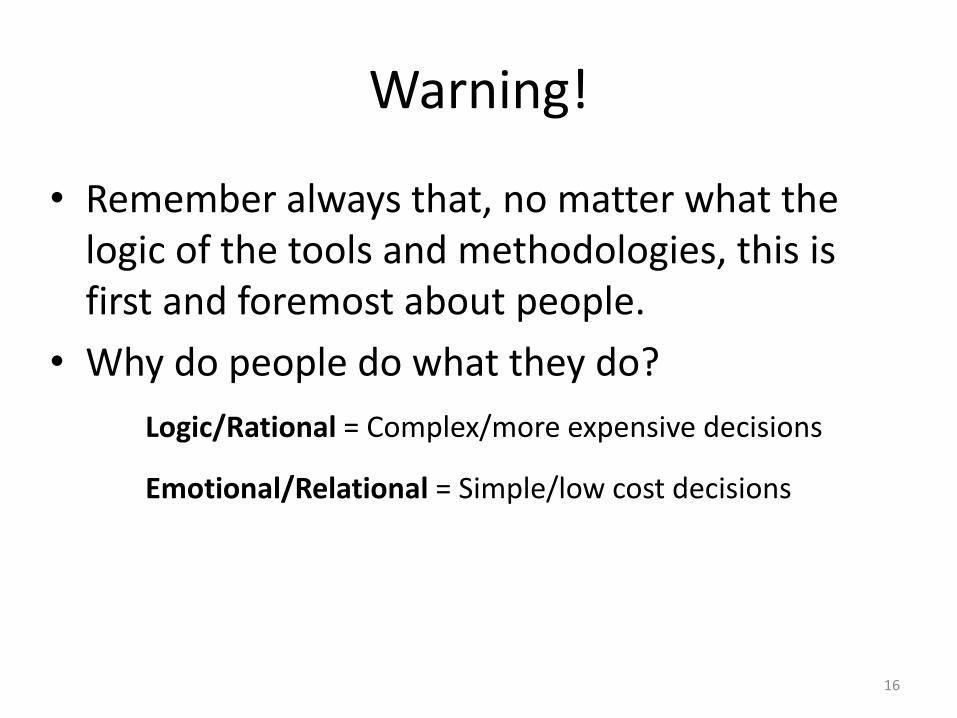
Warning!
• Remember always that, no matter what the logic of the tools and methodologies, this is first and foremost about people.
• Why do people do what they do?
Logic/Rational = Complex/more expensive decisions
Emotional/Relational = Simple/low cost decisions
16
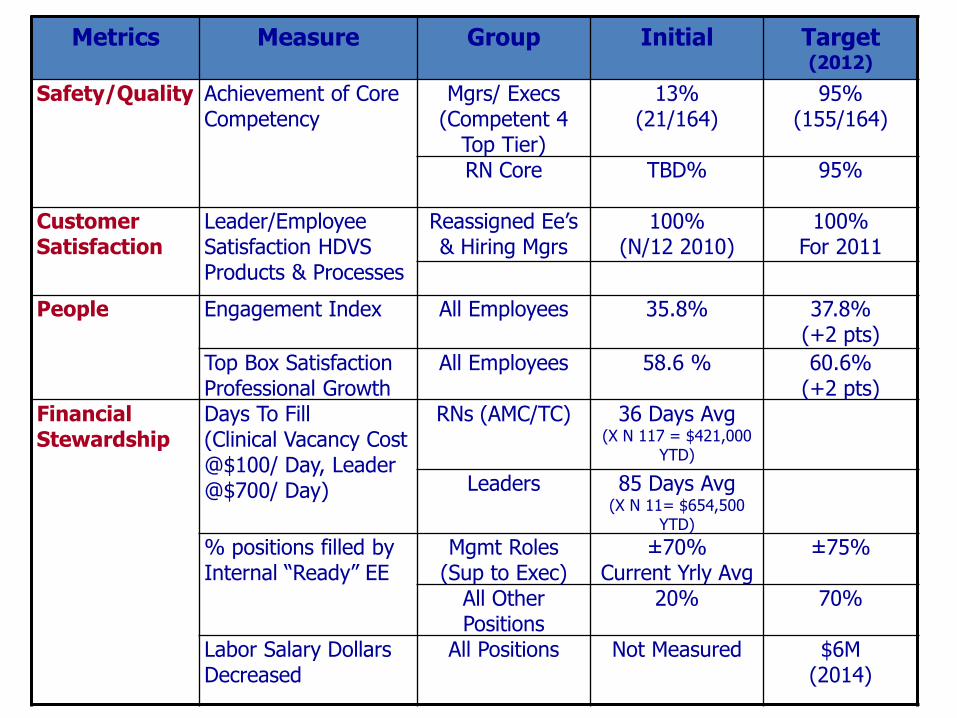
Metrics Measure Group Initial Target (2012)
Safety/Quality
Achievement of Core Competency
Mgrs/ Execs (Competent 4
Top Tier)
13% (21/164)
95% (155/164)
RN Core TBD%
95%
Customer Satisfaction
Leader/Employee Satisfaction HDVS Products & Processes
Reassigned Ee’s & Hiring Mgrs
100% (N/12 2010)
100% For 2011
People Engagement Index All Employees 35.8% 37.8% (+2 pts)
Top Box Satisfaction Professional Growth
All Employees 58.6 % 60.6% (+2 pts)
Financial Stewardship
Days To Fill (Clinical Vacancy Cost @$100/ Day, Leader @$700/ Day)
RNs (AMC/TC)
36 Days Avg (X N 117 = $421,000
YTD)
Leaders 85 Days Avg (X N 11= $654,500
YTD)
% positions filled by Internal “Ready” EE
Mgmt Roles (Sup to Exec)
±70% Current Yrly Avg
±75%
All Other Positions
20% 70%
Labor Salary Dollars Decreased
All Positions Not Measured $6M (2014)
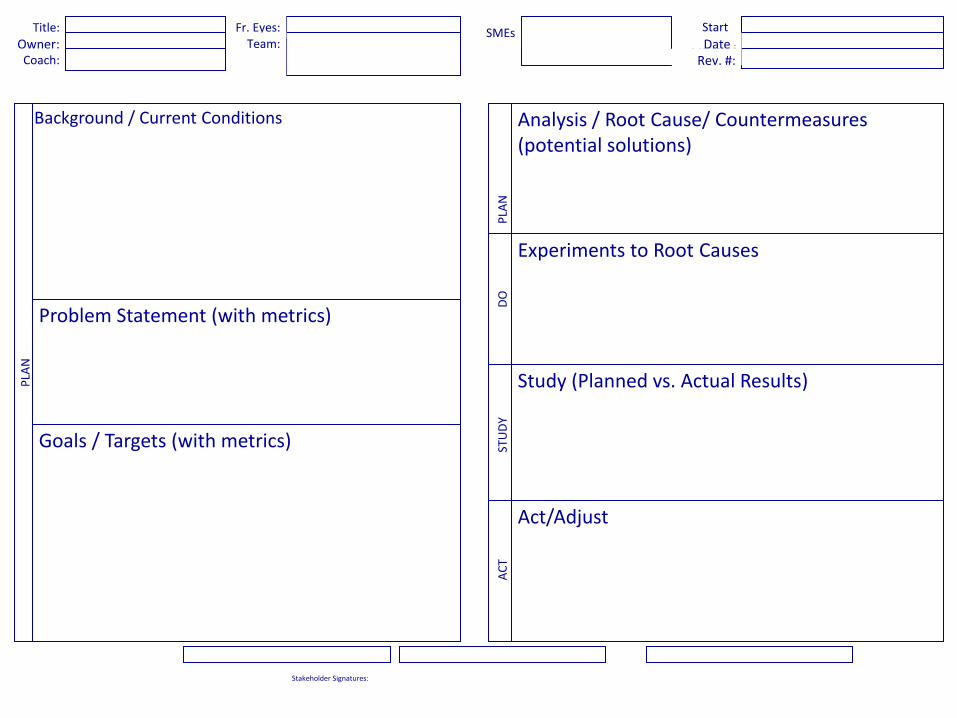
Problem Statement (with metrics)
Goals / Targets (with metrics)
Title:
Owner: Coach:
Background / Current Conditions
PLA
N
Stakeholder Signatures:
Fr. Eyes: Team:
P
LAN
D
O
STU
DY
AC
T
Analysis / Root Cause/ Countermeasures (potential solutions)
Experiments to Root Causes
Study (Planned vs. Actual Results)
Act/Adjust
SMEs Start
Date: Date :
Rev. #:
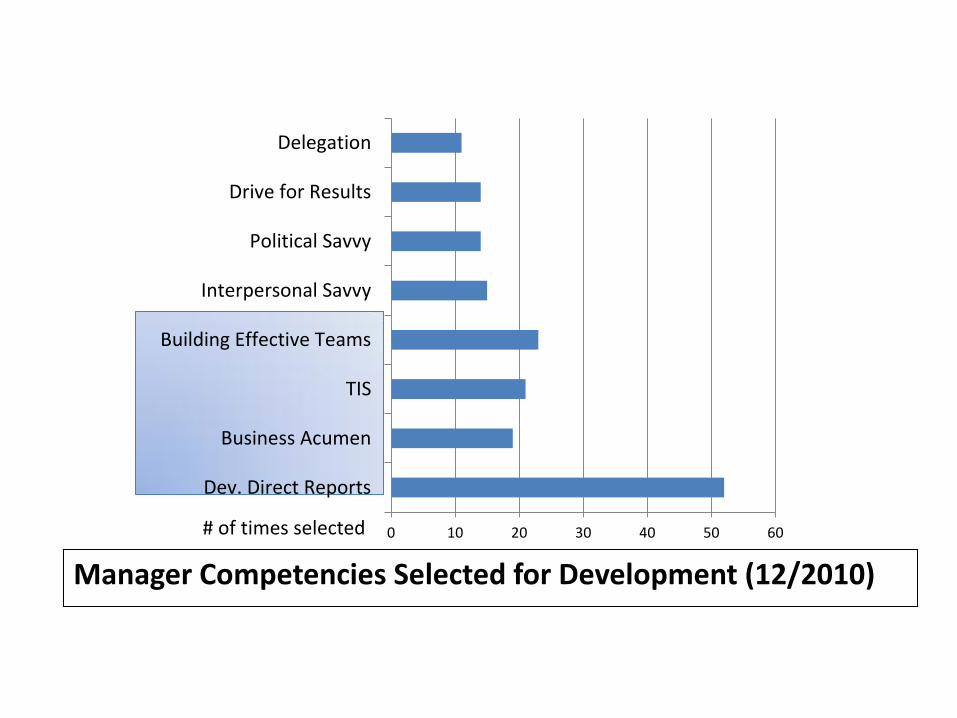
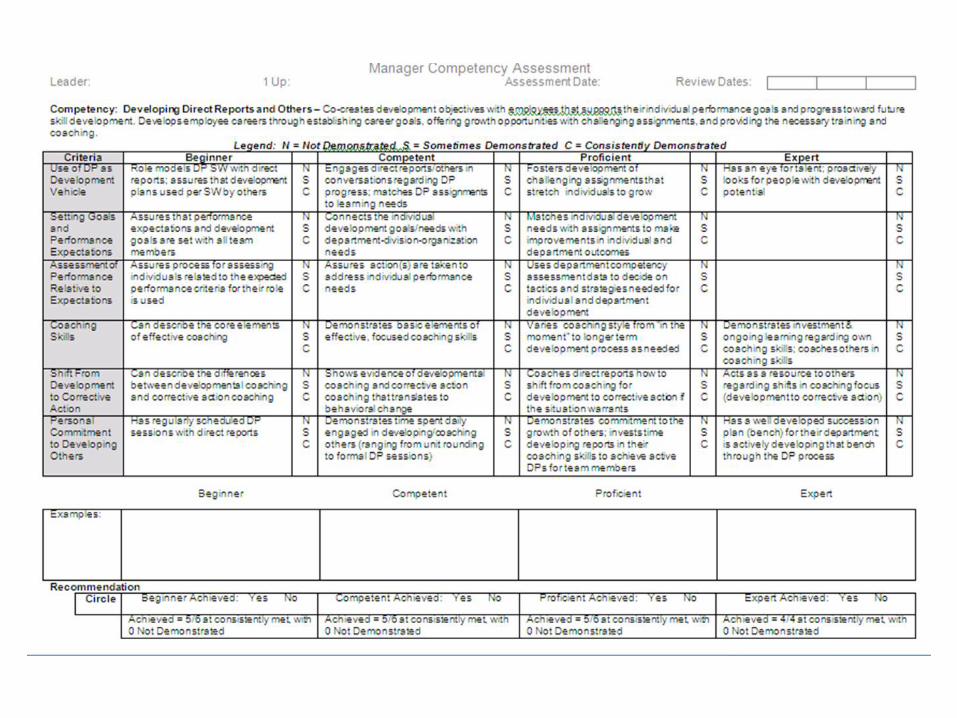
0 10 20 30 40 50 60
Dev. Direct Reports
Business Acumen
TIS
Building Effective Teams
Interpersonal Savvy
Political Savvy
Drive for Results
Delegation
# of times selected
Manager Competencies Selected for Development (12/2010)
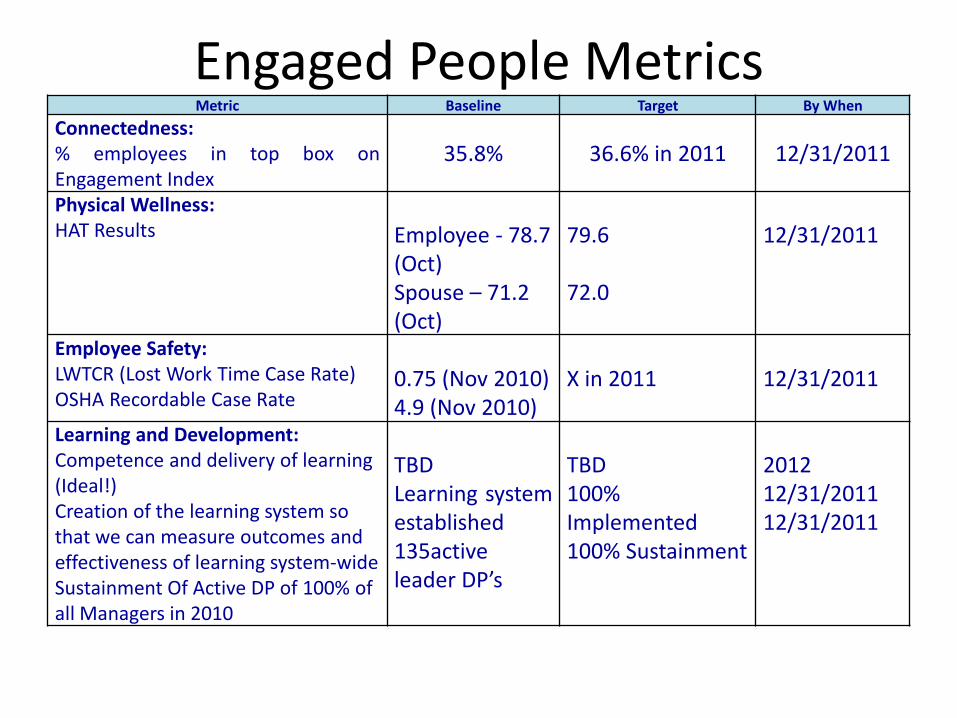
Metric Baseline Target By When
Connectedness: % employees in top box on Engagement Index
35.8% 36.6% in 2011 12/31/2011
Physical Wellness: HAT Results
Employee - 78.7 (Oct) Spouse – 71.2 (Oct)
79.6 72.0
12/31/2011
Employee Safety: LWTCR (Lost Work Time Case Rate) OSHA Recordable Case Rate
0.75 (Nov 2010) 4.9 (Nov 2010)
X in 2011
12/31/2011
Learning and Development: Competence and delivery of learning (Ideal!) Creation of the learning system so that we can measure outcomes and effectiveness of learning system-wide Sustainment Of Active DP of 100% of all Managers in 2010
TBD Learning system established 135active leader DP’s
TBD 100% Implemented 100% Sustainment
2012 12/31/2011 12/31/2011
Engaged People Metrics
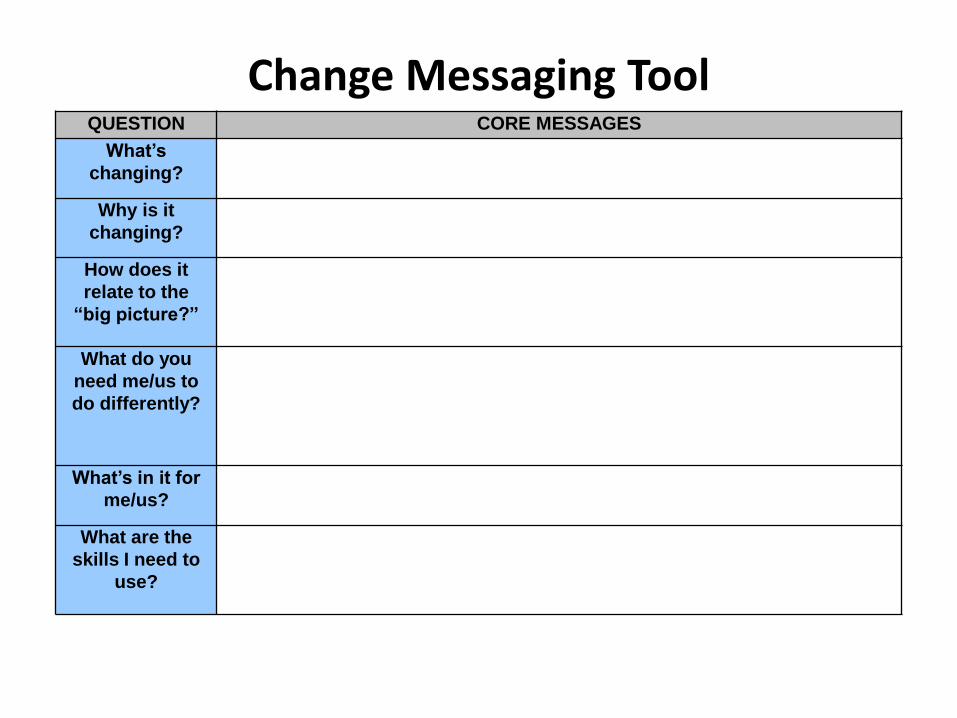
Change Messaging Tool QUESTION CORE MESSAGES
What’s
changing?
Why is it
changing?
How does it
relate to the
“big picture?”
What do you
need me/us to
do differently?
What’s in it for
me/us?
What are the
skills I need to
use?
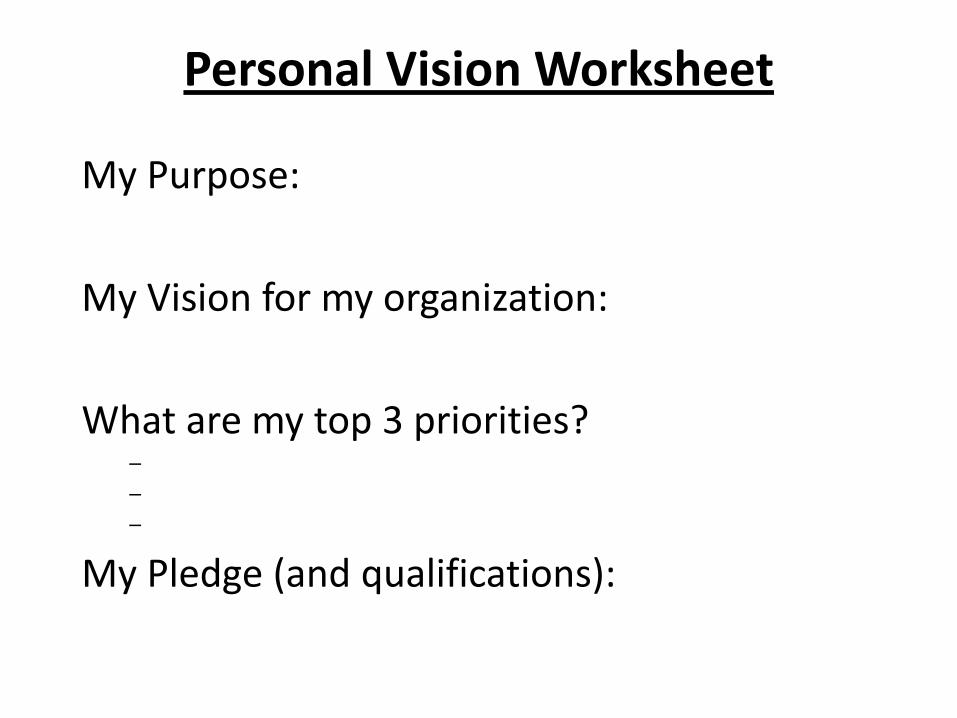
Personal Vision Worksheet
My Purpose:
My Vision for my organization:
What are my top 3 priorities? –
–
–
My Pledge (and qualifications):
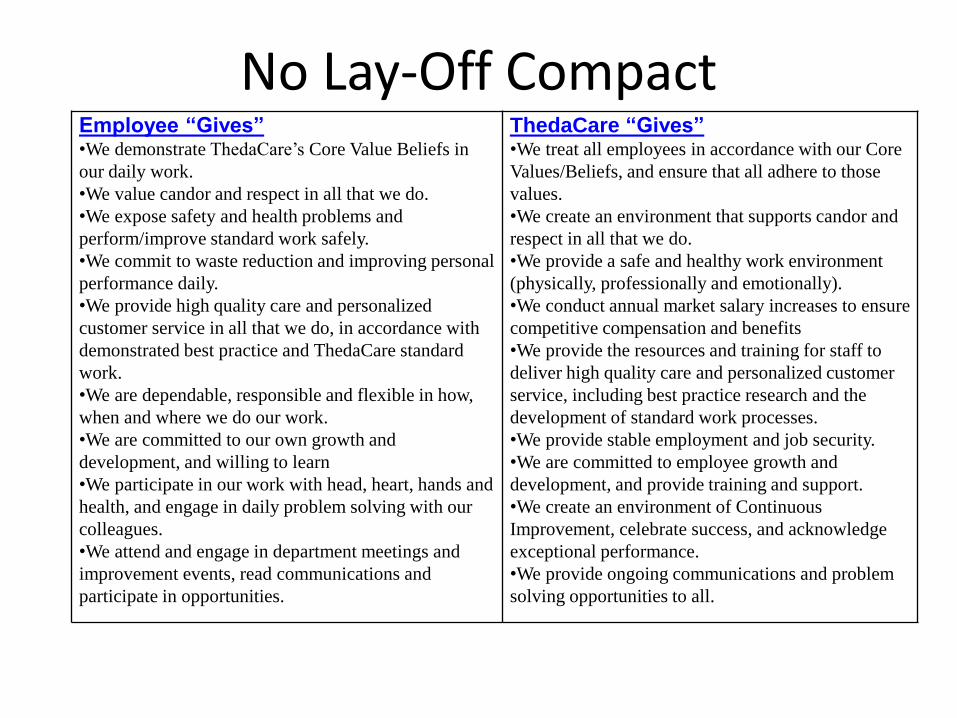
No Lay-Off Compact Employee “Gives” •We demonstrate ThedaCare’s Core Value Beliefs in
our daily work.
•We value candor and respect in all that we do.
•We expose safety and health problems and
perform/improve standard work safely.
•We commit to waste reduction and improving personal
performance daily.
•We provide high quality care and personalized
customer service in all that we do, in accordance with
demonstrated best practice and ThedaCare standard
work.
•We are dependable, responsible and flexible in how,
when and where we do our work.
•We are committed to our own growth and
development, and willing to learn
•We participate in our work with head, heart, hands and
health, and engage in daily problem solving with our
colleagues.
•We attend and engage in department meetings and
improvement events, read communications and
participate in opportunities.
ThedaCare “Gives” •We treat all employees in accordance with our Core
Values/Beliefs, and ensure that all adhere to those
values.
•We create an environment that supports candor and
respect in all that we do.
•We provide a safe and healthy work environment
(physically, professionally and emotionally).
•We conduct annual market salary increases to ensure
competitive compensation and benefits
•We provide the resources and training for staff to
deliver high quality care and personalized customer
service, including best practice research and the
development of standard work processes.
•We provide stable employment and job security.
•We are committed to employee growth and
development, and provide training and support.
•We create an environment of Continuous
Improvement, celebrate success, and acknowledge
exceptional performance.
•We provide ongoing communications and problem
solving opportunities to all.
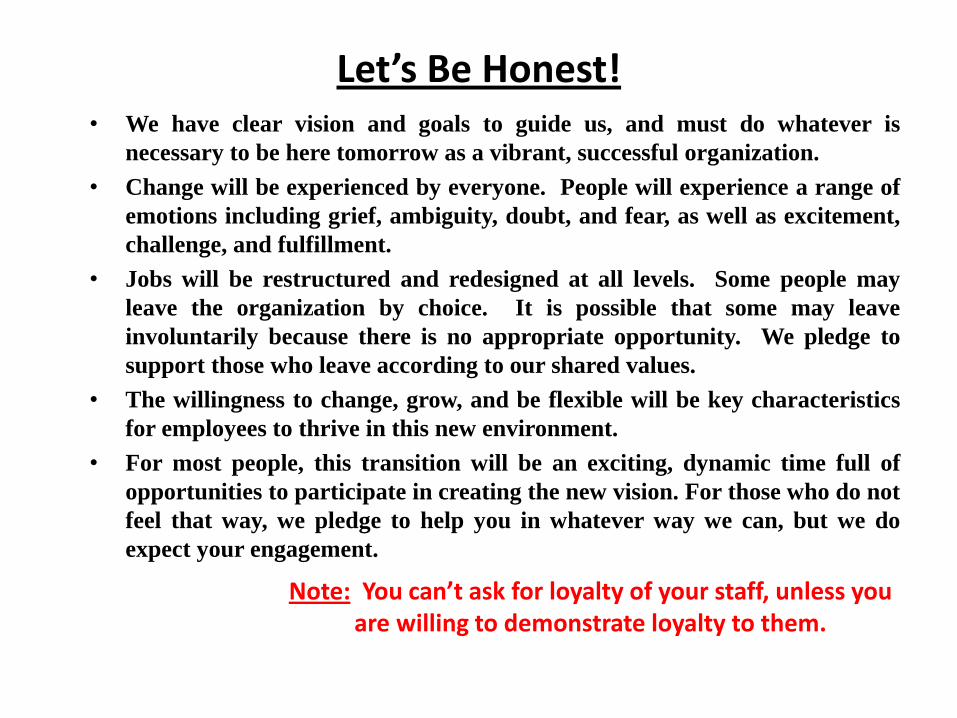
Let’s Be Honest! • We have clear vision and goals to guide us, and must do whatever is
necessary to be here tomorrow as a vibrant, successful organization.
• Change will be experienced by everyone. People will experience a range of
emotions including grief, ambiguity, doubt, and fear, as well as excitement,
challenge, and fulfillment.
• Jobs will be restructured and redesigned at all levels. Some people may
leave the organization by choice. It is possible that some may leave
involuntarily because there is no appropriate opportunity. We pledge to
support those who leave according to our shared values.
• The willingness to change, grow, and be flexible will be key characteristics
for employees to thrive in this new environment.
• For most people, this transition will be an exciting, dynamic time full of
opportunities to participate in creating the new vision. For those who do not
feel that way, we pledge to help you in whatever way we can, but we do
expect your engagement.
Note: You can’t ask for loyalty of your staff, unless you are willing to demonstrate loyalty to them.
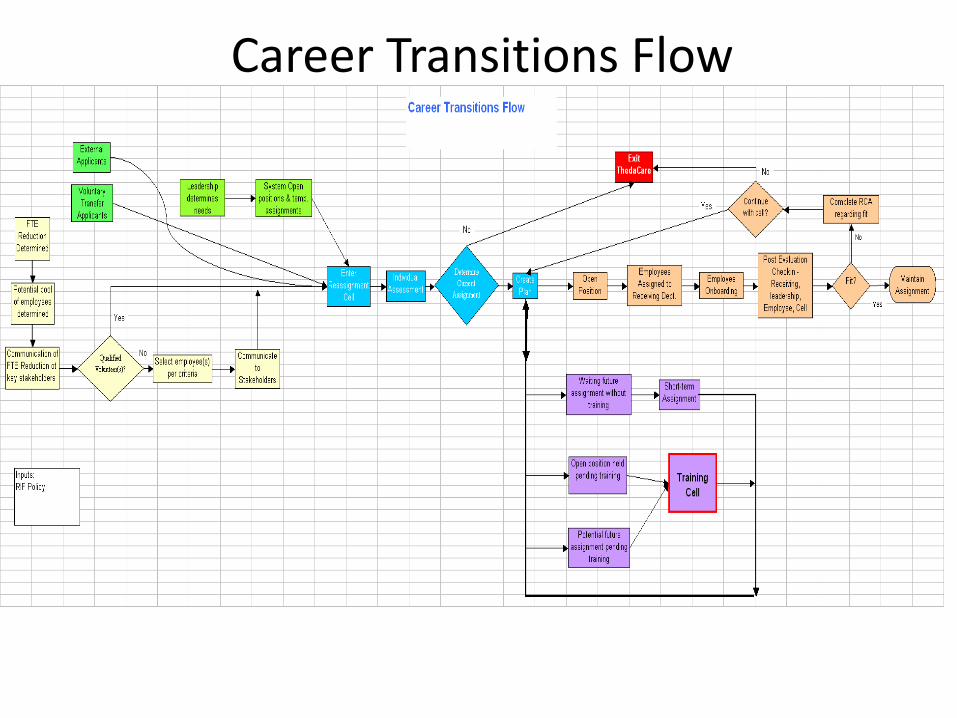
Career Transitions Flow
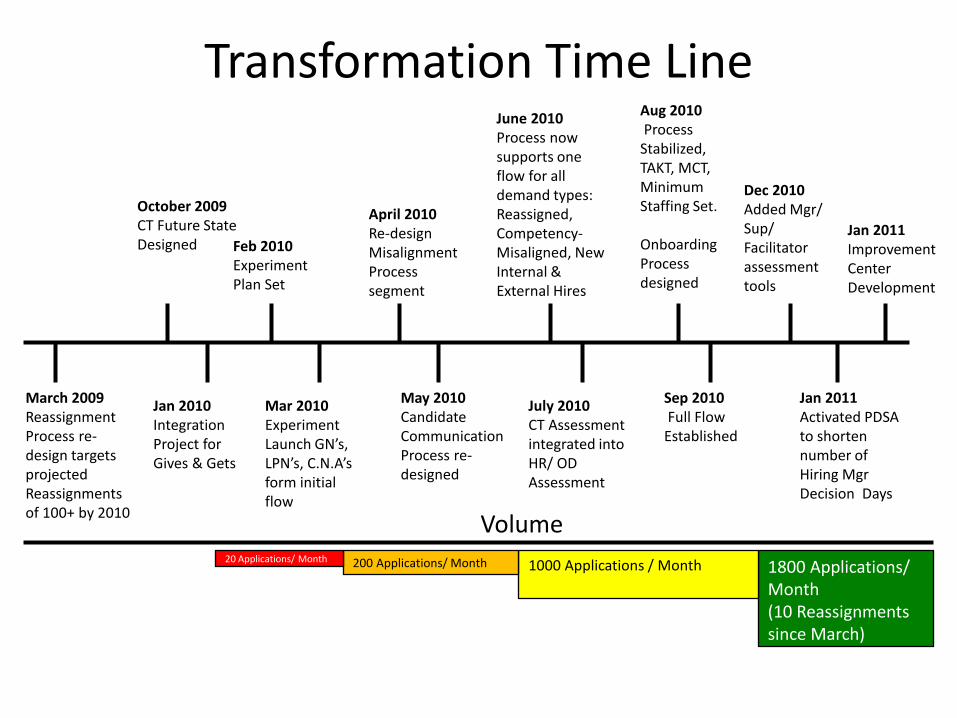
Transformation Time Line Aug 2010 Process Stabilized, TAKT, MCT, Minimum Staffing Set. Onboarding Process designed
Jan 2011 Improvement Center Development
October 2009 CT Future State Designed
Jan 2010 Integration Project for Gives & Gets
Feb 2010 Experiment Plan Set
Mar 2010 Experiment Launch GN’s, LPN’s, C.N.A’s form initial flow
Sep 2010 Full Flow Established
1800 Applications/ Month (10 Reassignments since March)
1000 Applications / Month
Volume
200 Applications/ Month 20 Applications/ Month
April 2010 Re-design Misalignment Process segment
May 2010 Candidate Communication Process re-designed
July 2010 CT Assessment integrated into HR/ OD Assessment
June 2010 Process now supports one flow for all demand types: Reassigned, Competency-Misaligned, New Internal & External Hires
March 2009 Reassignment Process re-design targets projected Reassignments of 100+ by 2010
Dec 2010 Added Mgr/ Sup/ Facilitator assessment tools
Jan 2011 Activated PDSA to shorten number of Hiring Mgr Decision Days
Marginal Performers: What do we do?
• Identify who they are, and what is marginal about their performance.
• Be clear about expectations with them.
• Be clear about consequences with them.
• Invoke the consequences in an even-handed, non-empathic way.
• Terminate if changes do not occur.
• Do all of this within your organizations core values.
29
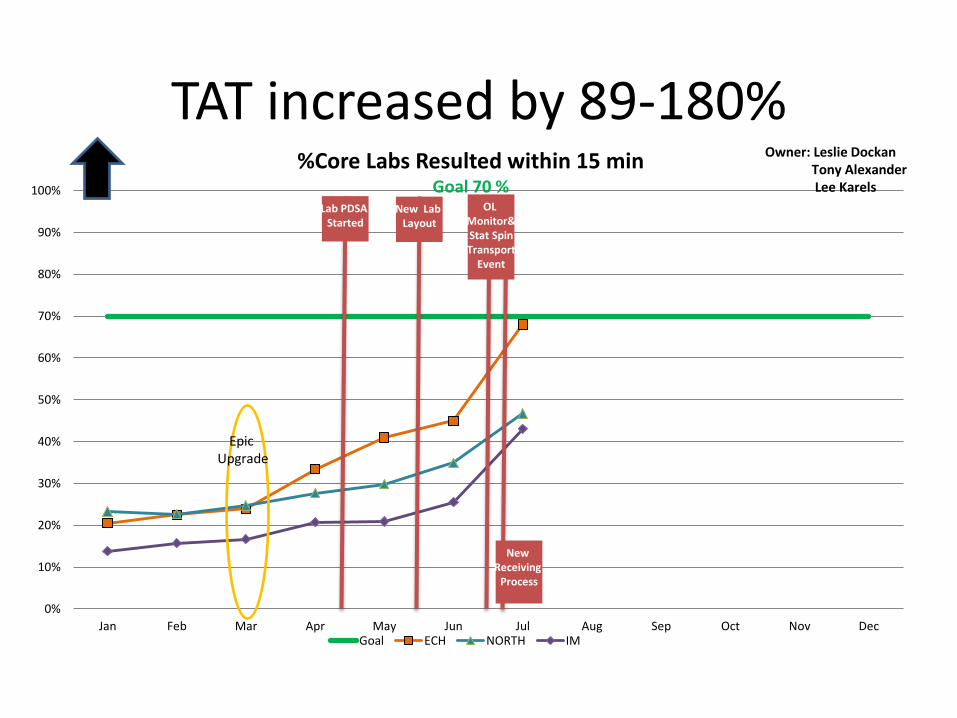
TAT increased by 89-180%
0%
10%
20%
30%
40%
50%
60%
70%
80%
90%
100%
Jan Feb Mar Apr May Jun Jul Aug Sep Oct Nov Dec
%Core Labs Resulted within 15 min Goal 70 %
Goal ECH NORTH IM
Owner: Leslie Dockan Tony Alexander Lee Karels
Lab PDSA Started
Epic Upgrade
New Lab Layout
OL Monitor& Stat Spin Transport
Event
New Receiving
Process
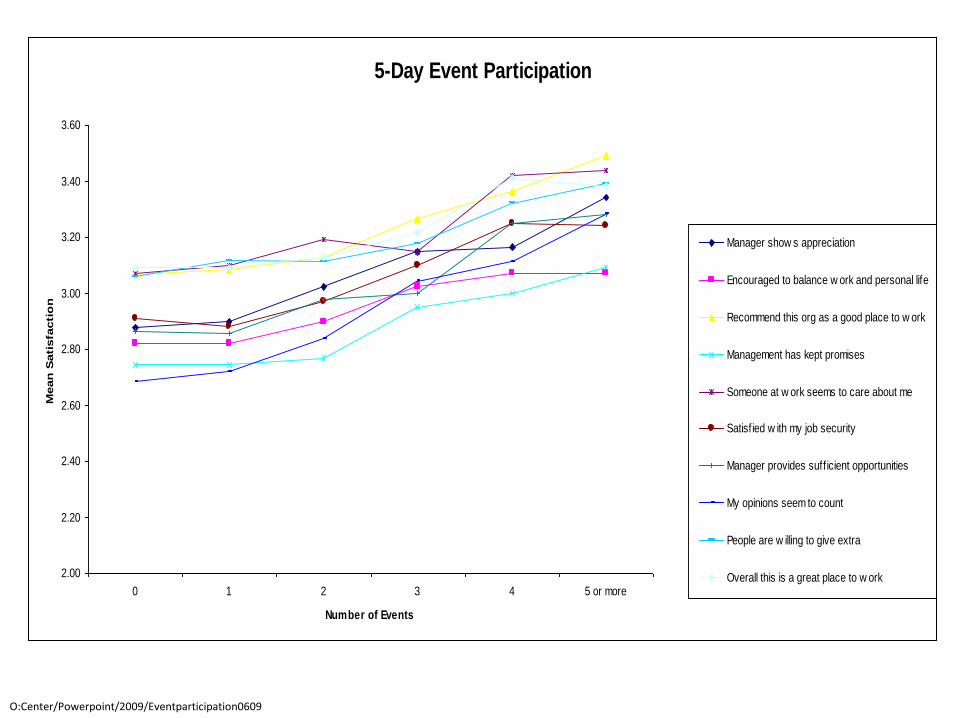
5-Day Event Participation
2.00
2.20
2.40
2.60
2.80
3.00
3.20
3.40
3.60
0 1 2 3 4 5 or more
Number of Events
Mean
Sati
sfa
cti
on
Manager show s appreciation
Encouraged to balance w ork and personal life
Recommend this org as a good place to w ork
Management has kept promises
Someone at w ork seems to care about me
Satisfied w ith my job security
Manager provides suff icient opportunities
My opinions seem to count
People are w illing to give extra
Overall this is a great place to w ork
O:Center/Powerpoint/2009/Eventparticipation0609
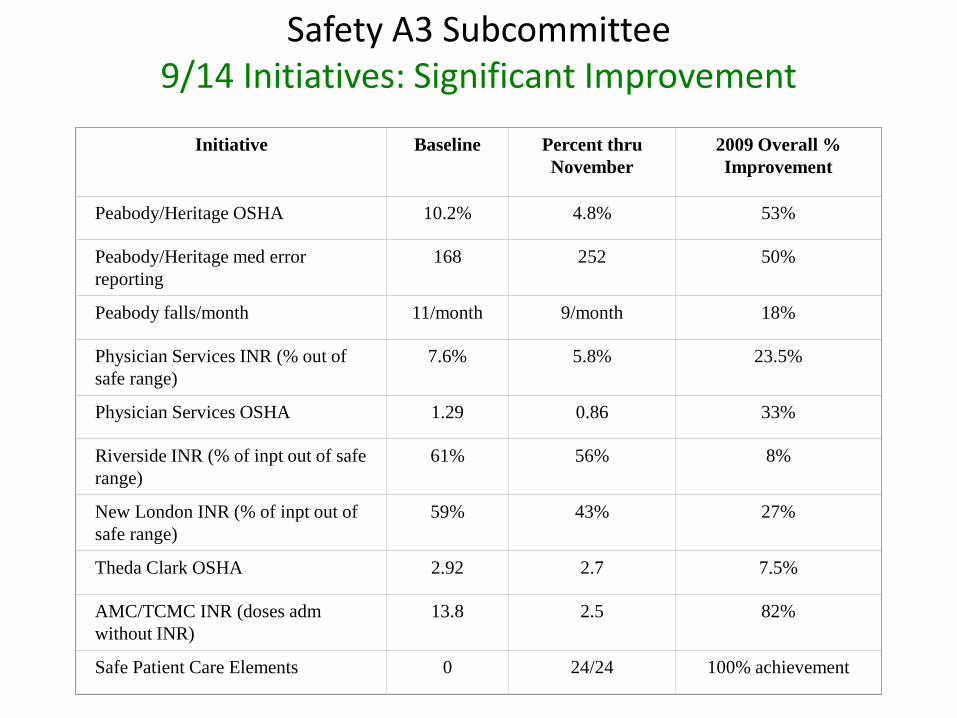
Initiative
Baseline
Percent thru
November
2009 Overall %
Improvement
Peabody/Heritage OSHA
10.2%
4.8%
53%
Peabody/Heritage med error
reporting
168
252
50%
Peabody falls/month
11/month
9/month
18%
Physician Services INR (% out of
safe range)
7.6%
5.8%
23.5%
Physician Services OSHA
1.29
0.86
33%
Riverside INR (% of inpt out of safe
range)
61%
56%
8%
New London INR (% of inpt out of
safe range)
59%
43%
27%
Theda Clark OSHA
2.92
2.7
7.5%
AMC/TCMC INR (doses adm
without INR)
13.8
2.5
82%
Safe Patient Care Elements
0
24/24
100% achievement
Safety A3 Subcommittee 9/14 Initiatives: Significant Improvement
But….things don’t always go as planned!!!
Photo copyright R Gerard 2011
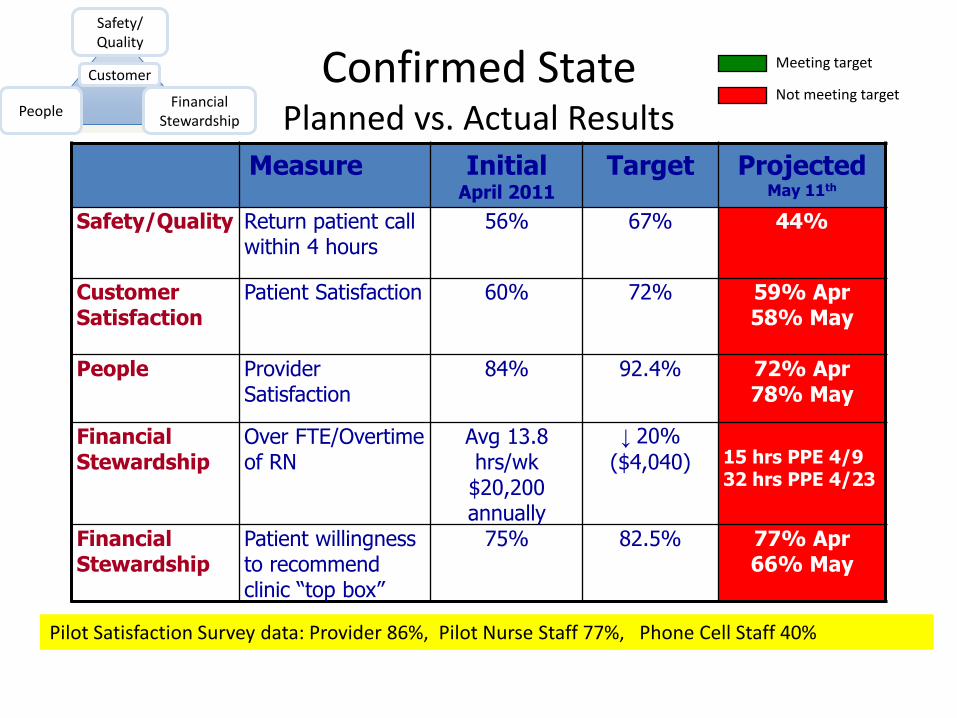
Confirmed State Planned vs. Actual Results
Measure Initial April 2011
Target Projected May 11th
Safety/Quality Return patient call within 4 hours
56% 67% 44%
Customer Satisfaction
Patient Satisfaction 60% 72% 59% Apr 58% May
People Provider
Satisfaction 84% 92.4% 72% Apr
78% May
Financial Stewardship
Over FTE/Overtime of RN
Avg 13.8 hrs/wk $20,200 annually
↓ 20%
($4,040)
15 hrs PPE 4/9 32 hrs PPE 4/23
Financial Stewardship
Patient willingness to recommend clinic “top box”
75% 82.5% 77% Apr 66% May
Meeting target
Not meeting target Customer
Safety/ Quality
People Financial
Stewardship
Pilot Satisfaction Survey data: Provider 86%, Pilot Nurse Staff 77%, Phone Cell Staff 40%
But….things don’t always go as planned!!!
Lesson: We learn not only from our success, but also from our failure to meet target. Celebrate the failures!
“It’s not that I’m so smart, it’s just
that I stay with problems longer.”
- Albert Einstein
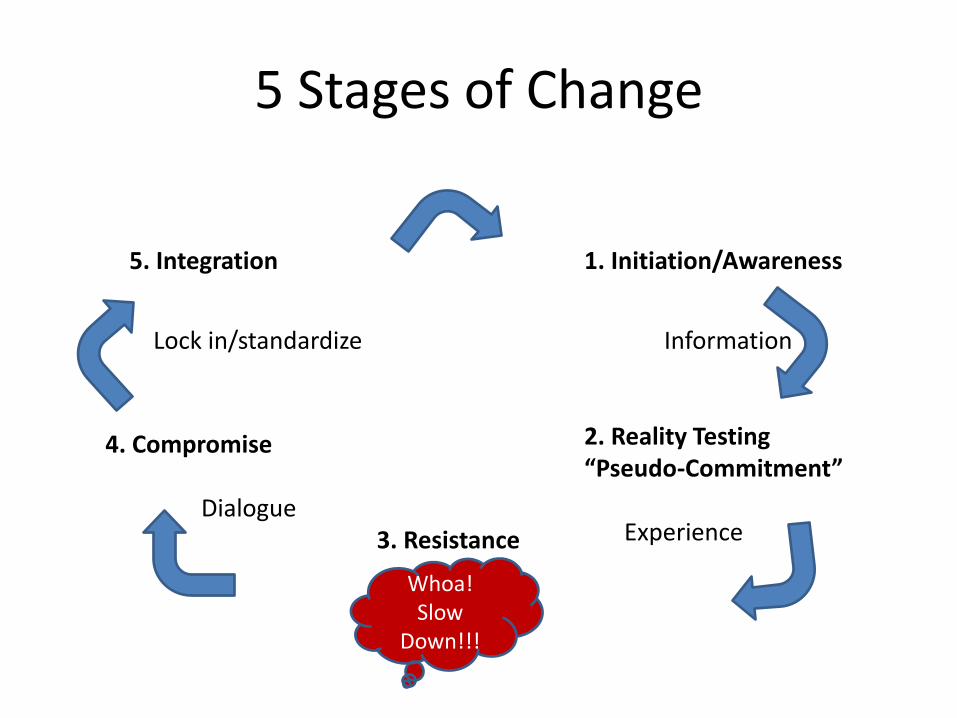
5 Stages of Change
1. Initiation/Awareness 5. Integration
4. Compromise
3. Resistance
2. Reality Testing “Pseudo-Commitment”
Information Lock in/standardize
Dialogue Experience
Whoa! Slow
Down!!!
Optimism
• Not Cheerleading!!!
• Sharing Stories – let them reflect
• Gemba
• Report Out
37

Adjourn
38