Embed Size (px)
Citation preview
1
THE HOME OF BETTINGWilliam Hill corporate presentationApril 2015
2
This presentation has been prepared by William Hill PLC (“William Hill”). This presentation includes statements that are,or may be deemed to be, “forward-looking statements”. These forward-looking statements can be identified by the useof forward-looking terminology, including the terms "believes", "estimates", "anticipates", "expects", "intends", "plans","goal", "target", "aim", "may", "will", "would", "could" or "should" or, in each case, their negative or other variations orcomparable terminology. These forward-looking statements include all matters that are not historical facts. They appearin a number of places throughout this presentation and the information incorporated by reference into this presentation,and include statements regarding the intentions, beliefs or current expectations of the directors, William Hill or theGroup concerning, amongst other things, the results of operations, financial condition, liquidity, prospects, growth,strategies and dividend policy of William Hill and the industry in which it operates.
By their nature, forward-looking statements involve risks and uncertainties because they relate to events and dependon circumstances that may or may not occur in the future and may be beyond William Hill's ability to control or predict.Forward-looking statements are not guarantees of future performance and hence may prove to be erroneous. TheGroup's actual results of operations, financial condition, liquidity, dividend policy and the development of the industry inwhich it operates may differ materially from the impression created by the forward-looking statements contained in thispresentation and/or the information incorporated by reference into this presentation. In addition, even if the results ofoperations, financial condition, liquidity and dividend policy of the Group and the development of the industry in which itoperates are consistent with the forward-looking statements contained in this presentation and/or the informationincorporated by reference into this presentation, those results or developments may not be indicative of results ordevelopments in subsequent periods.
Other than in accordance with its legal or regulatory obligations (including under the Listing Rules, the Disclosure andTransparency Rules and the Prospectus Rules), William Hill does not undertake any obligation to update or revisepublicly any forward-looking statement, whether as a result of new information, future events or otherwise.
Disclaimer
3
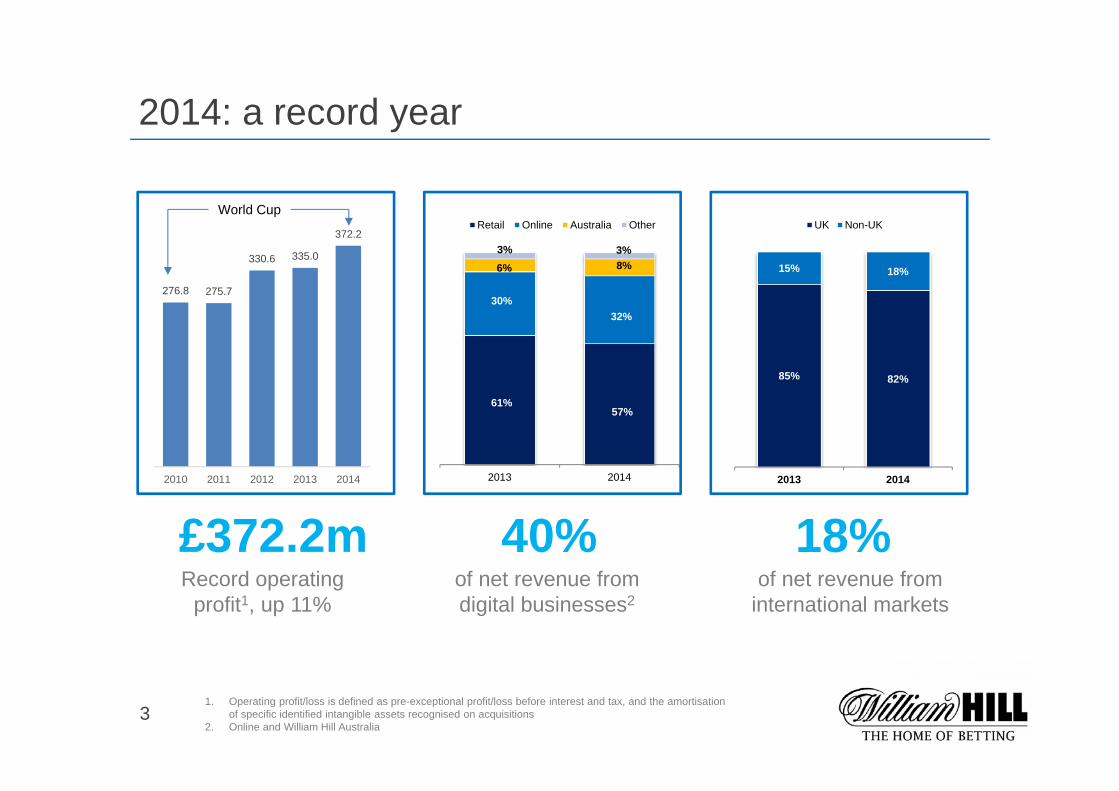
2014: a record year
£372.2m 40% 18%
276.8 275.7
330.6 335.0
372.2
2010 2011 2012 2013 2014
Record operating profit1, up 11%
of net revenue from digital businesses2
of net revenue from international markets
61%57%
30%32%
6% 8%3%
2013 2014
Retail Online Australia Other
3%
85% 82%
15% 18%
2013 2014
UK Non-UK
1. Operating profit/loss is defined as pre-exceptional profit/loss before interest and tax, and the amortisation of specific identified intangible assets recognised on acquisitions
2. Online and William Hill Australia
World Cup
4
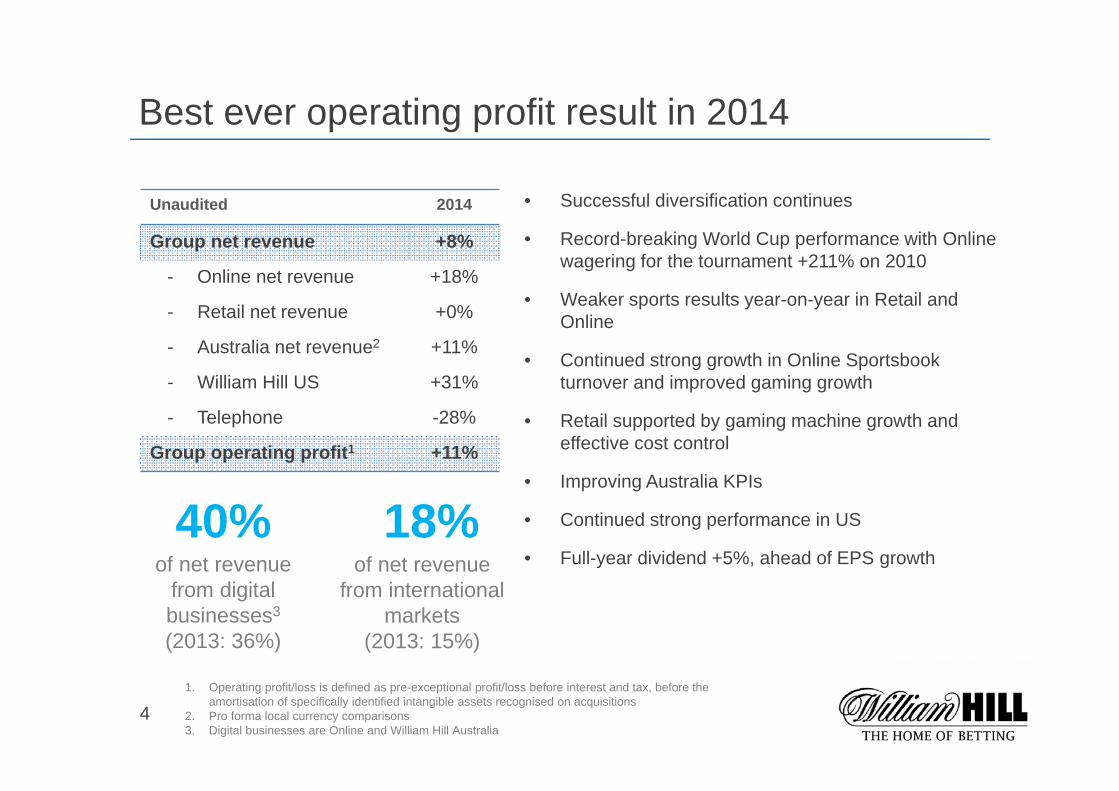
Best ever operating profit result in 2014
Unaudited 2014
Group net revenue +8%
- Online net revenue +18%
- Retail net revenue +0%
- Australia net revenue2 +11%
- William Hill US +31%
- Telephone -28%
Group operating profit1 +11%
• Successful diversification continues
• Record-breaking World Cup performance with Online wagering for the tournament +211% on 2010
• Weaker sports results year-on-year in Retail and Online
• Continued strong growth in Online Sportsbook turnover and improved gaming growth
• Retail supported by gaming machine growth and effective cost control
• Improving Australia KPIs
• Continued strong performance in US
• Full-year dividend +5%, ahead of EPS growth
1. Operating profit/loss is defined as pre-exceptional profit/loss before interest and tax, before the amortisation of specifically identified intangible assets recognised on acquisitions
2. Pro forma local currency comparisons3. Digital businesses are Online and William Hill Australia
40% 18%of net revenue
from digital businesses3
(2013: 36%)
of net revenue from international
markets(2013: 15%)
5
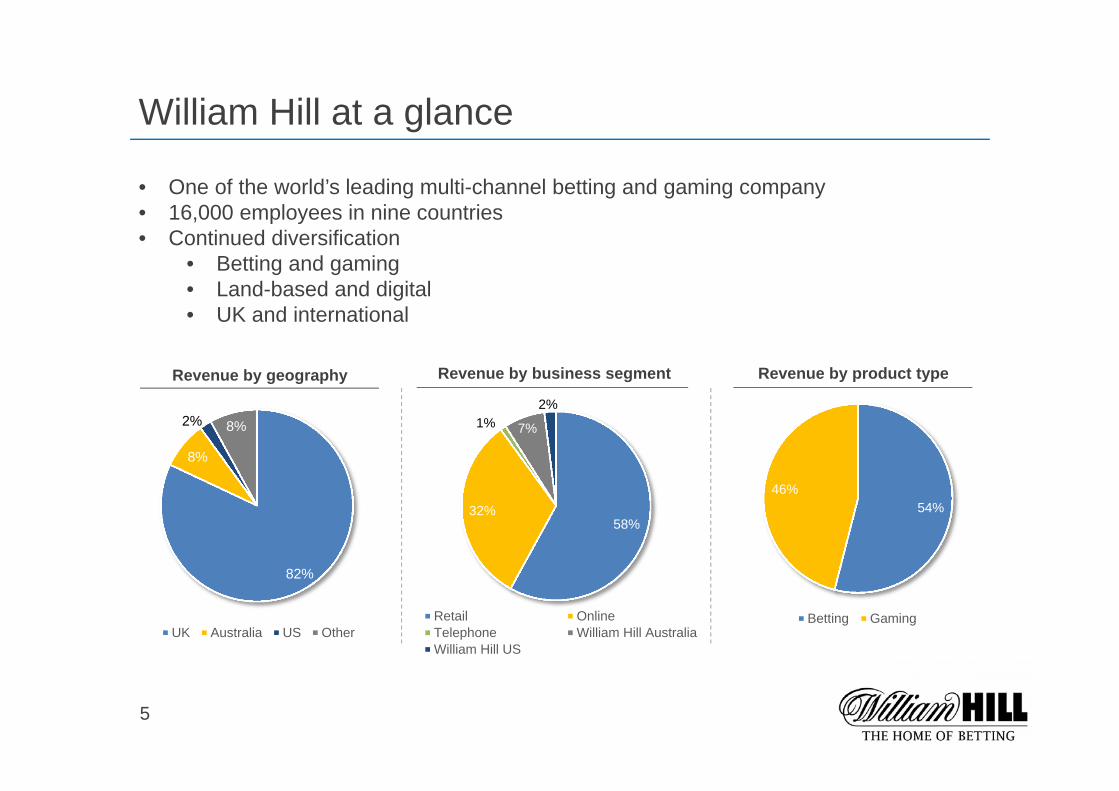
William Hill at a glance
• One of the world’s leading multi-channel betting and gaming company• 16,000 employees in nine countries• Continued diversification
• Betting and gaming• Land-based and digital• UK and international
82%
8%
2% 8%
UK Australia US Other
58%32%
1% 7%
2%
Retail OnlineTelephone William Hill AustraliaWilliam Hill US
54%46%
Betting Gaming
Revenue by geography Revenue by product typeRevenue by business segment
6
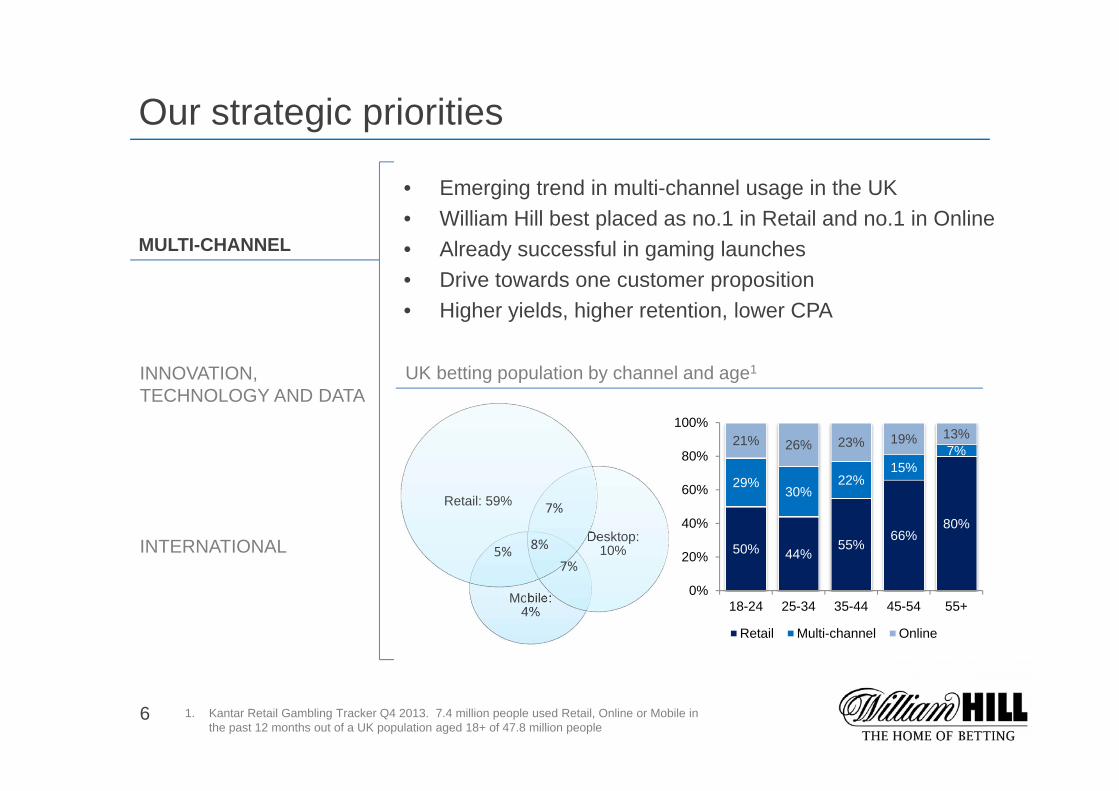
• Emerging trend in multi-channel usage in the UK• William Hill best placed as no.1 in Retail and no.1 in Online• Already successful in gaming launches• Drive towards one customer proposition• Higher yields, higher retention, lower CPA
MULTI-CHANNEL
Our strategic priorities
INNOVATION, TECHNOLOGY AND DATA
INTERNATIONAL
Mobile: 4%
Desktop: 10%
Retail: 59% 7%
7%5% 8%
1. Kantar Retail Gambling Tracker Q4 2013. 7.4 million people used Retail, Online or Mobile in the past 12 months out of a UK population aged 18+ of 47.8 million people
UK betting population by channel and age1
50% 44%55%
66%80%
29%30%
22%15%
7%21% 26% 23% 19% 13%
0%
20%
40%
60%
80%
100%
18-24 25-34 35-44 45-54 55+
Retail Multi-channel Online
7
MULTI-CHANNEL
Our strategic priorities
INNOVATION, TECHNOLOGY AND DATA
INTERNATIONAL
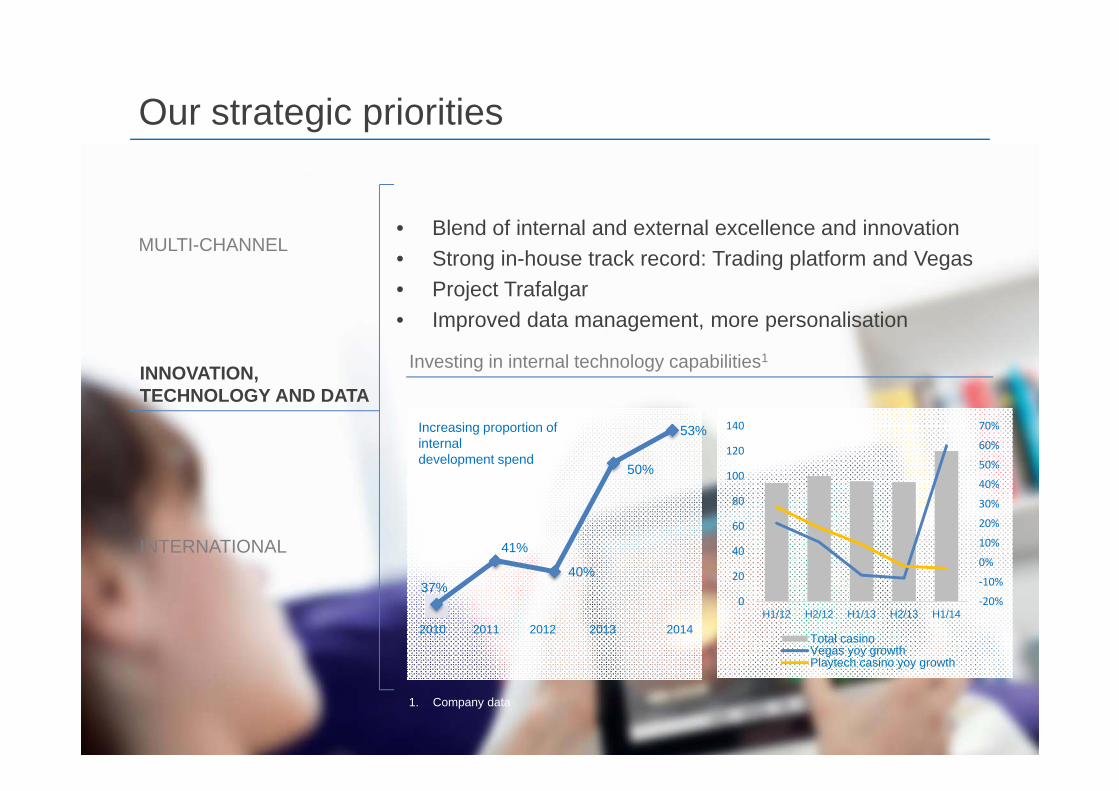
• Blend of internal and external excellence and innovation• Strong in-house track record: Trading platform and Vegas• Project Trafalgar • Improved data management, more personalisation
37%
41%
40%
50%
53%
2010 2011 2012 2013 2014
Increasing proportion of internal development spend
1. Company data
Investing in internal technology capabilities1
‐20%
‐10%
0%
10%
20%
30%
40%
50%
60%
70%
0
20
40
60
80
100
120
140
H1/12 H2/12 H1/13 H2/13 H1/14
Total casinoVegas yoy growthPlaytech casino yoy growth
8
MULTI-CHANNEL
Our strategic priorities
INNOVATION, TECHNOLOGY AND DATA
INTERNATIONAL
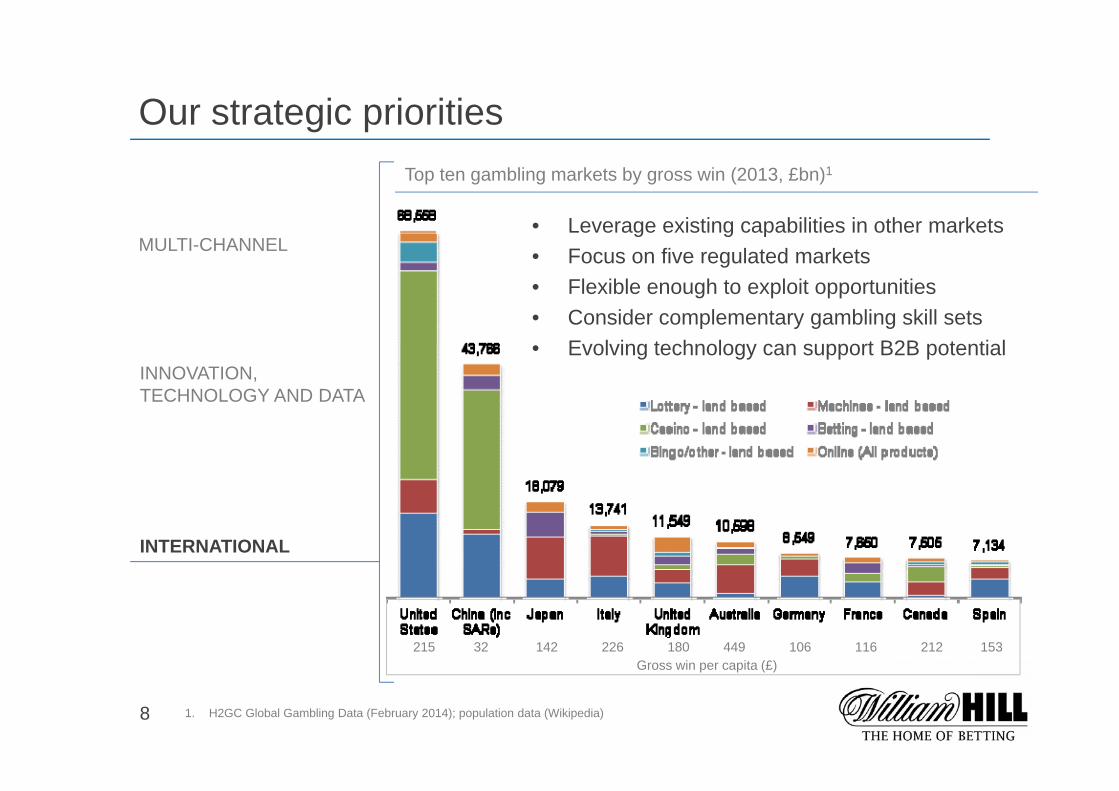
• Leverage existing capabilities in other markets• Focus on five regulated markets• Flexible enough to exploit opportunities• Consider complementary gambling skill sets• Evolving technology can support B2B potential
1. H2GC Global Gambling Data (February 2014); population data (Wikipedia)
Top ten gambling markets by gross win (2013, £bn)1
215 32 142 226 180 449 106 116 212 153Gross win per capita (£)
9
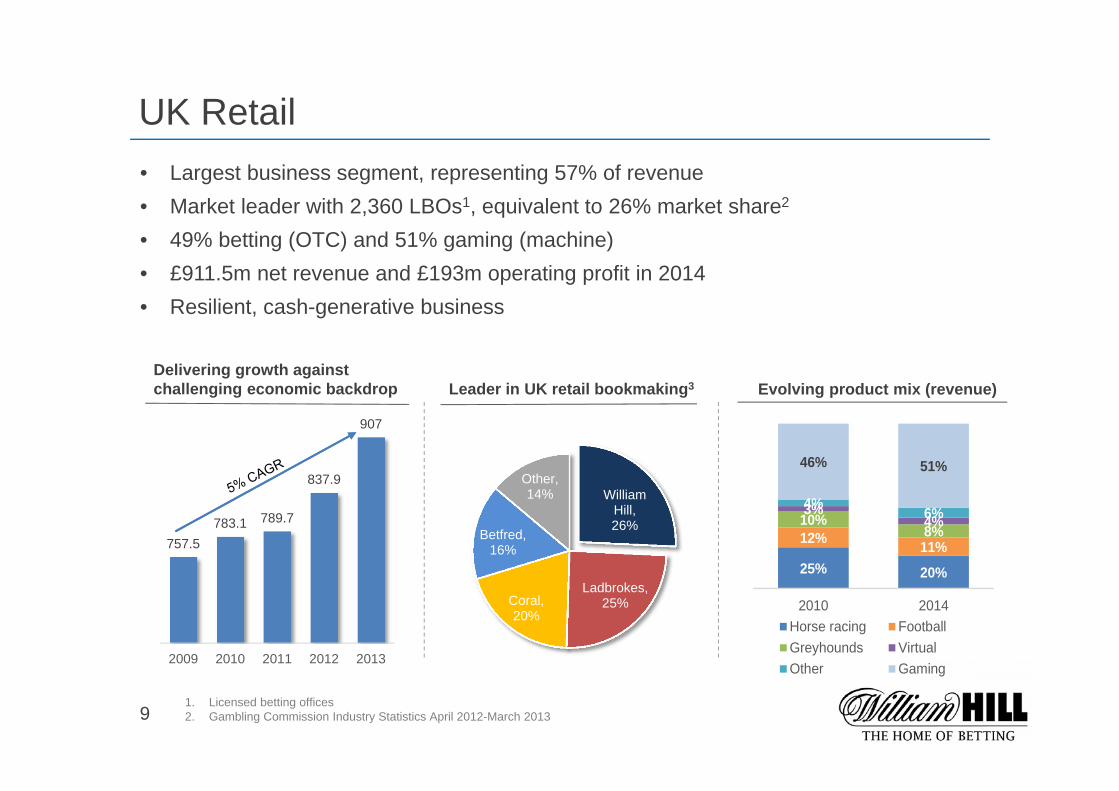
UK Retail• Largest business segment, representing 57% of revenue• Market leader with 2,360 LBOs1, equivalent to 26% market share2
• 49% betting (OTC) and 51% gaming (machine)• £911.5m net revenue and £193m operating profit in 2014• Resilient, cash-generative business
1. Licensed betting offices2. Gambling Commission Industry Statistics April 2012-March 2013
757.5783.1 789.7
837.9
907
2009 2010 2011 2012 2013
Delivering growth against challenging economic backdrop
William Hill, 26%
Ladbrokes, 25%Coral,
20%
Betfred, 16%
Other, 14%
Leader in UK retail bookmaking3 Evolving product mix (revenue)
25% 20%
12% 11%
10%8%
3%4%
4% 6%
46% 51%
2010 2014Horse racing FootballGreyhounds VirtualOther Gaming
10
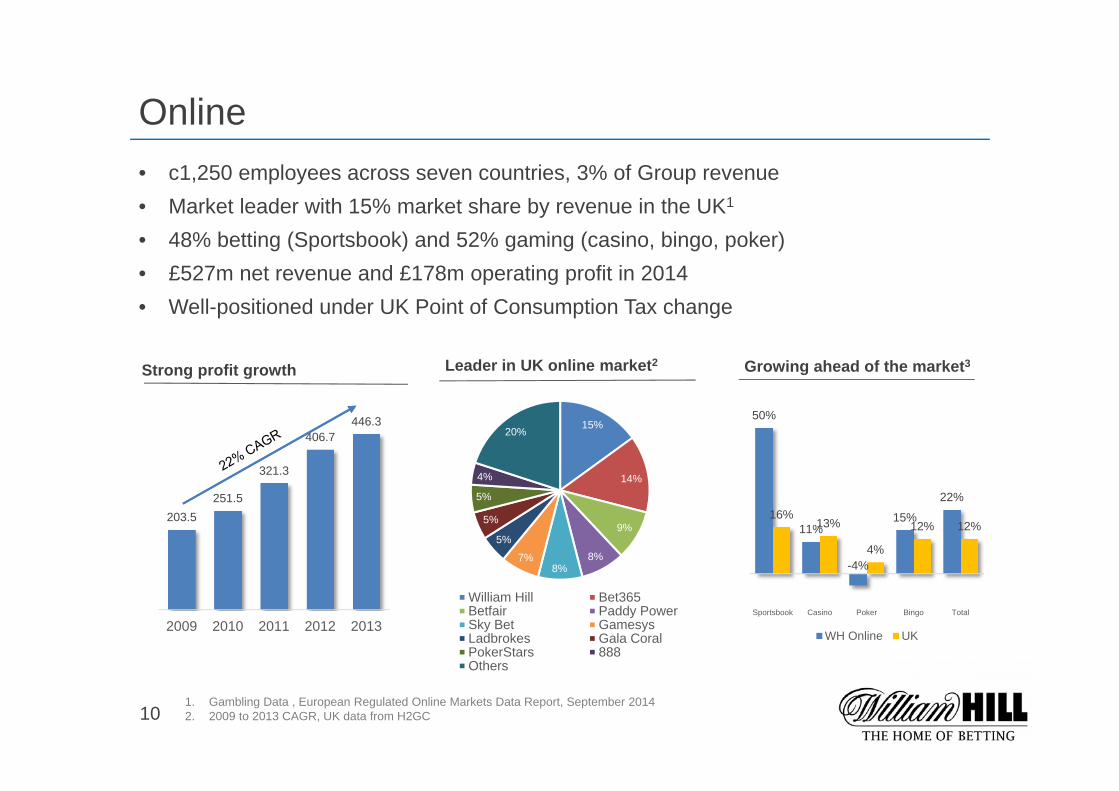
Online• c1,250 employees across seven countries, 3% of Group revenue• Market leader with 15% market share by revenue in the UK1
• 48% betting (Sportsbook) and 52% gaming (casino, bingo, poker)• £527m net revenue and £178m operating profit in 2014• Well-positioned under UK Point of Consumption Tax change
Strong profit growth Leader in UK online market2 Growing ahead of the market3
203.5251.5
321.3
406.7446.3
2009 2010 2011 2012 2013
50%
11%
-4%
15%
22%16%
13%
4%
12% 12%
Sportsbook Casino Poker Bingo Total
WH Online UK
1. Gambling Data , European Regulated Online Markets Data Report, September 20142. 2009 to 2013 CAGR, UK data from H2GC
15%
14%
9%
8%8%
7%
5%
5%
5%
4%
20%
William Hill Bet365Betfair Paddy PowerSky Bet GamesysLadbrokes Gala CoralPokerStars 888Others
11
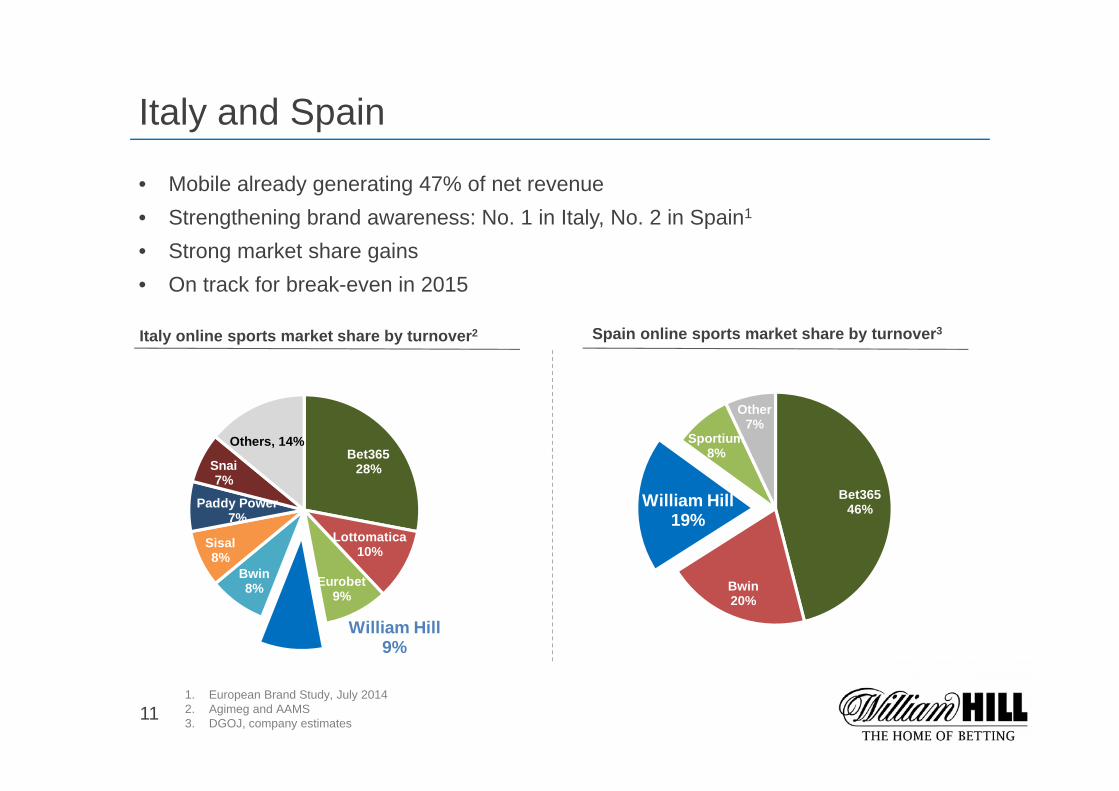
Italy and Spain
• Mobile already generating 47% of net revenue• Strengthening brand awareness: No. 1 in Italy, No. 2 in Spain1
• Strong market share gains • On track for break-even in 2015
Italy online sports market share by turnover2
1. European Brand Study, July 20142. Agimeg and AAMS3. DGOJ, company estimates
Spain online sports market share by turnover3
Bet36546%
Bwin20%
William Hill19%
Sportium8%
Other7%
Bet36528%
Lottomatica10%
Eurobet9%
William Hill9%
Bwin8%
Sisal8%
Paddy Power7%
Snai7%
Others, 14%
12
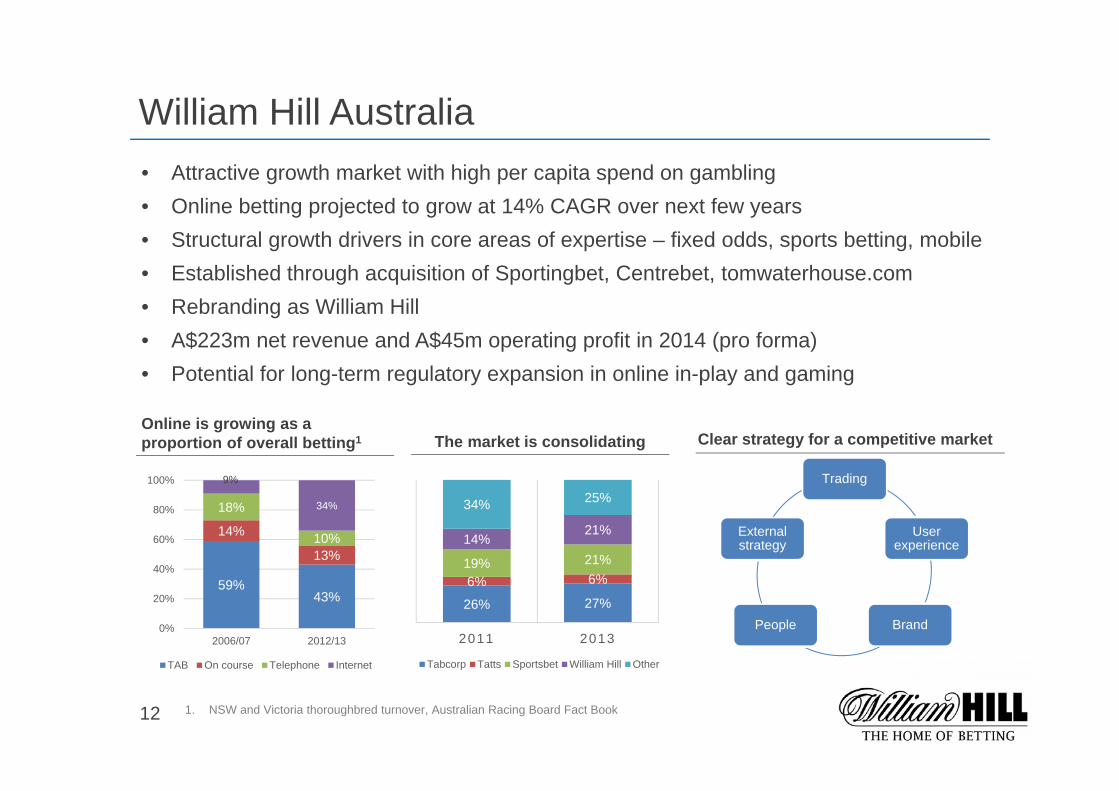
William Hill Australia
1. NSW and Victoria thoroughbred turnover, Australian Racing Board Fact Book
• Attractive growth market with high per capita spend on gambling• Online betting projected to grow at 14% CAGR over next few years• Structural growth drivers in core areas of expertise – fixed odds, sports betting, mobile• Established through acquisition of Sportingbet, Centrebet, tomwaterhouse.com• Rebranding as William Hill• A$223m net revenue and A$45m operating profit in 2014 (pro forma)• Potential for long-term regulatory expansion in online in-play and gaming
26% 27%6% 6%19% 21%14%
21%
34% 25%
2011 2013
Tabcorp Tatts Sportsbet William Hill Other
The market is consolidating
59%43%
14%
13%
18%
10%
9%
34%
0%
20%
40%
60%
80%
100%
2006/07 2012/13
TAB On course Telephone Internet
Online is growing as a proportion of overall betting1 Clear strategy for a competitive market
Trading
User experience
BrandPeople
External strategy
13
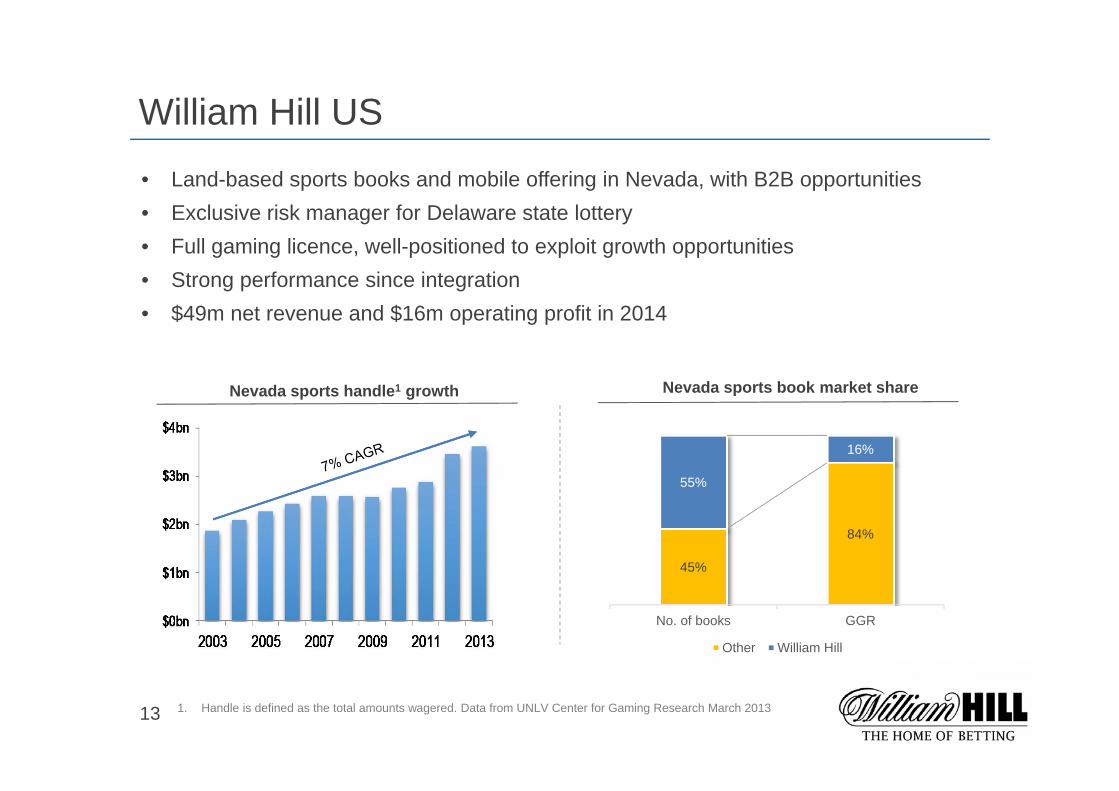
William Hill US
1. Handle is defined as the total amounts wagered. Data from UNLV Center for Gaming Research March 2013
• Land-based sports books and mobile offering in Nevada, with B2B opportunities• Exclusive risk manager for Delaware state lottery• Full gaming licence, well-positioned to exploit growth opportunities• Strong performance since integration• $49m net revenue and $16m operating profit in 2014
Nevada sports handle1 growth
45%
84%
55%
16%
No. of books GGR
Other William Hill
Nevada sports book market share
14
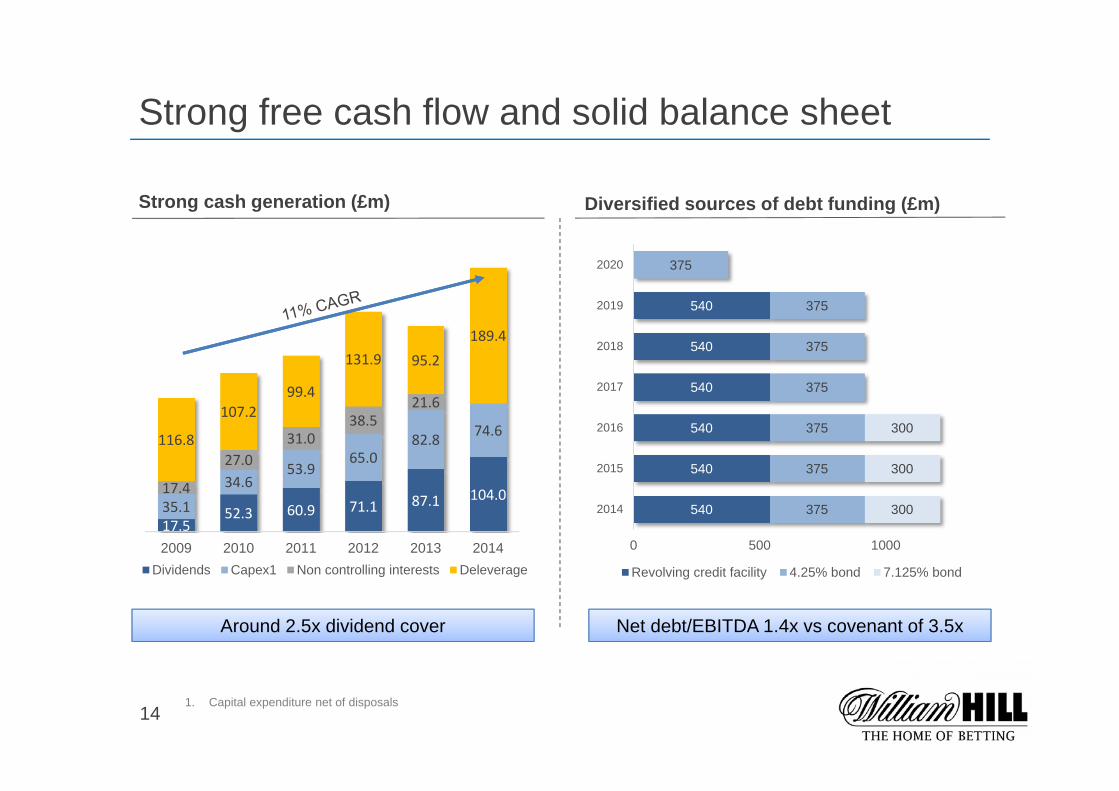
Strong free cash flow and solid balance sheet
Strong cash generation (£m) Diversified sources of debt funding (£m)
540
540
540
540
540
540
375
375
375
375
375
375
375
300
300
300
0 500 1000
2014
2015
2016
2017
2018
2019
2020
Revolving credit facility 4.25% bond 7.125% bond
17.552.3 60.9 71.1 87.1 104.0
35.134.6
53.965.0
82.8 74.6
17.4
27.031.0
38.521.6
116.8
107.299.4
131.9 95.2189.4
2009 2010 2011 2012 2013 2014Dividends Capex1 Non controlling interests Deleverage
1. Capital expenditure net of disposals
Around 2.5x dividend cover Net debt/EBITDA 1.4x vs covenant of 3.5x
15
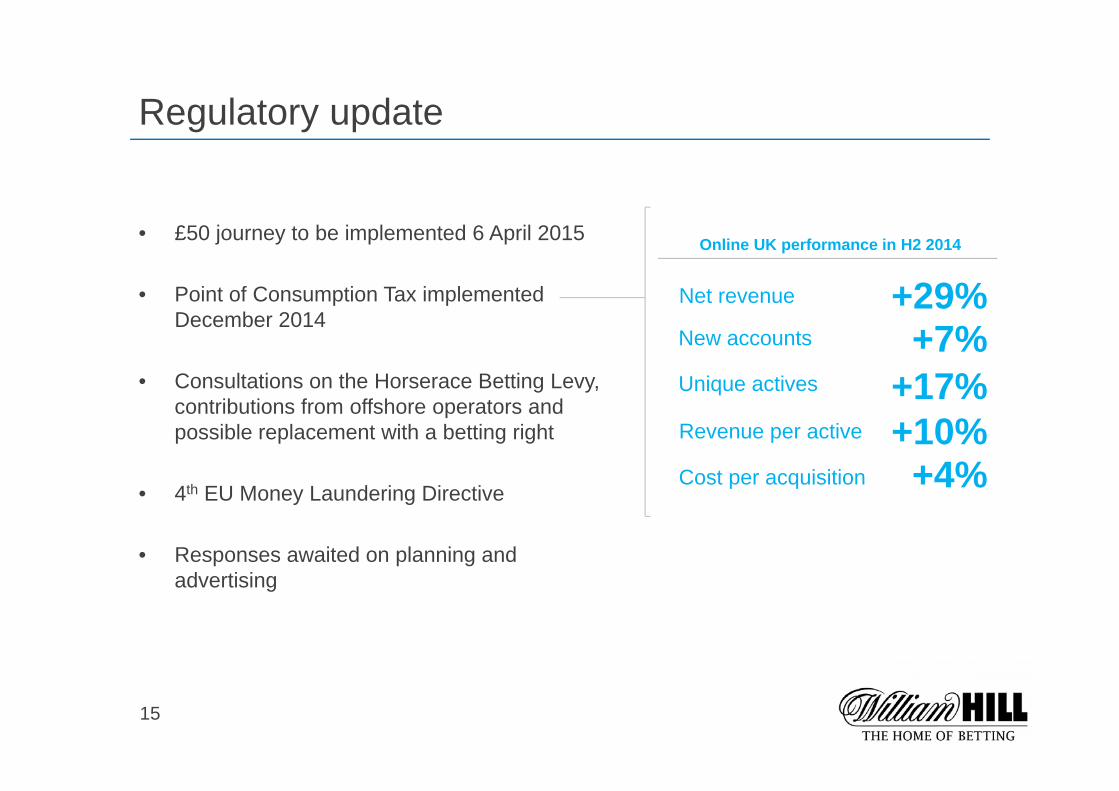
Regulatory update
• £50 journey to be implemented 6 April 2015
• Point of Consumption Tax implemented December 2014
• Consultations on the Horserace Betting Levy, contributions from offshore operators and possible replacement with a betting right
• 4th EU Money Laundering Directive
• Responses awaited on planning and advertising
+29%Net revenue
+7%New accounts
+17%Unique actives
+10%Revenue per active
+4%Cost per acquisition
Online UK performance in H2 2014
16
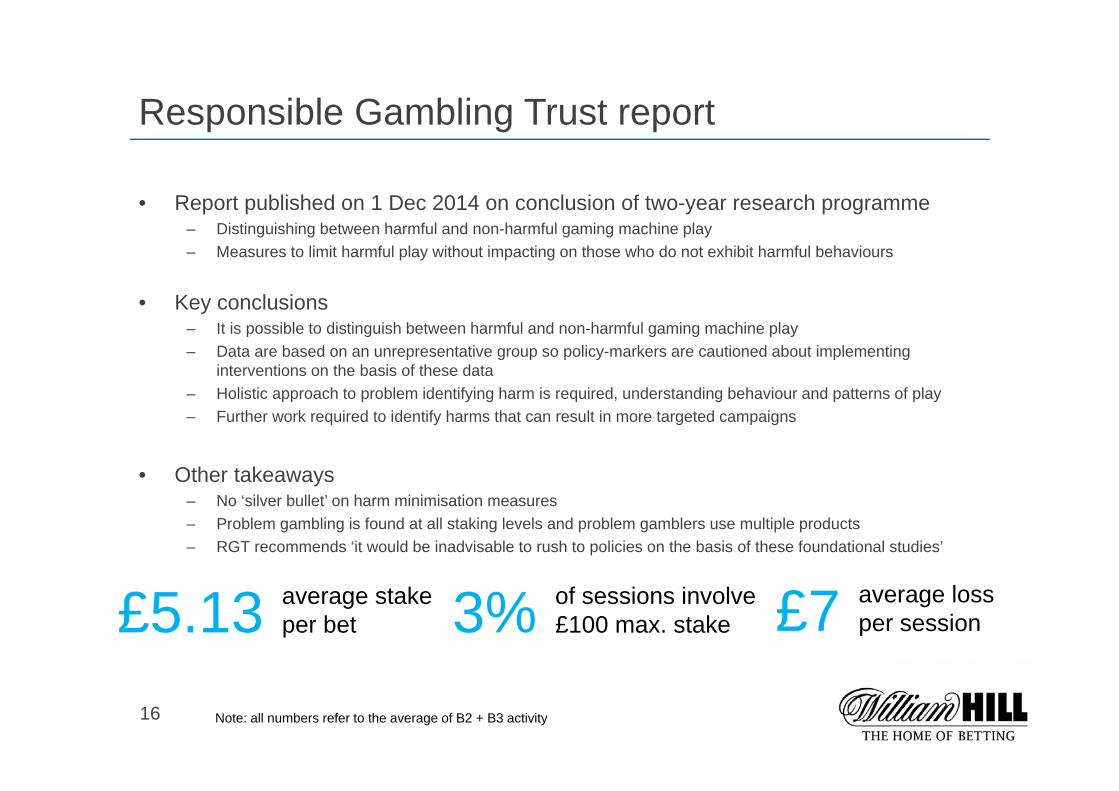
Responsible Gambling Trust report
• Report published on 1 Dec 2014 on conclusion of two-year research programme– Distinguishing between harmful and non-harmful gaming machine play– Measures to limit harmful play without impacting on those who do not exhibit harmful behaviours
• Key conclusions– It is possible to distinguish between harmful and non-harmful gaming machine play– Data are based on an unrepresentative group so policy-markers are cautioned about implementing
interventions on the basis of these data– Holistic approach to problem identifying harm is required, understanding behaviour and patterns of play– Further work required to identify harms that can result in more targeted campaigns
• Other takeaways– No ‘silver bullet’ on harm minimisation measures– Problem gambling is found at all staking levels and problem gamblers use multiple products– RGT recommends ‘it would be inadvisable to rush to policies on the basis of these foundational studies’
£5.13 average stake per bet 3% of sessions involve
£100 max. stake £7 average loss per session
Note: all numbers refer to the average of B2 + B3 activity
17
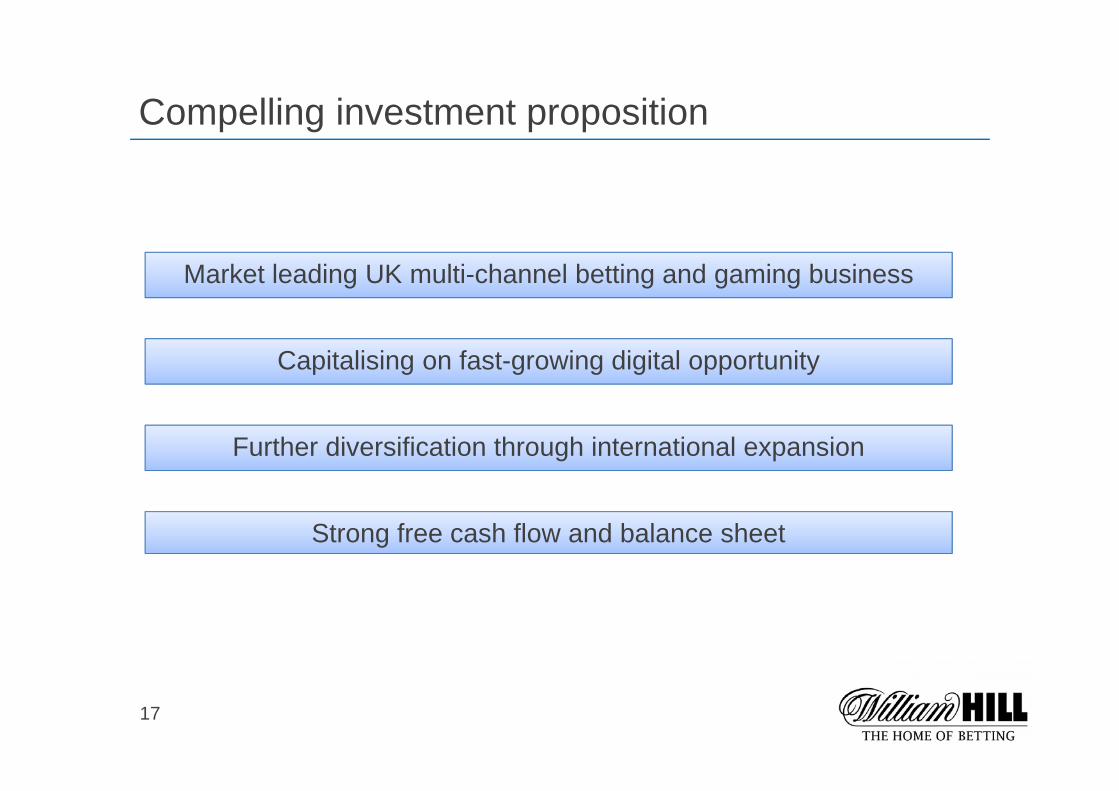
Compelling investment proposition
Market leading UK multi-channel betting and gaming business
Strong free cash flow and balance sheet
Further diversification through international expansion
Capitalising on fast-growing digital opportunity
18
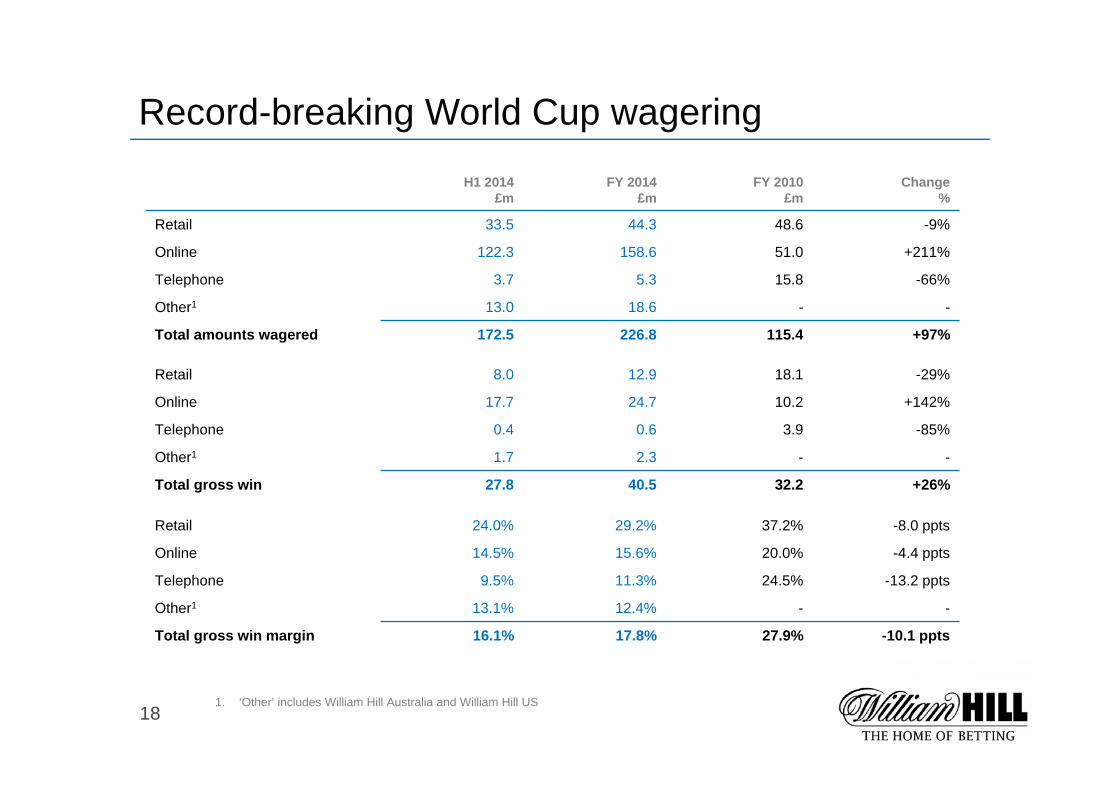
Record-breaking World Cup wagering
1. ‘Other’ includes William Hill Australia and William Hill US
H1 2014£m
FY 2014£m
FY 2010£m
Change%
Retail 33.5 44.3 48.6 -9%
Online 122.3 158.6 51.0 +211%
Telephone 3.7 5.3 15.8 -66%
Other1 13.0 18.6 - -
Total amounts wagered 172.5 226.8 115.4 +97%
Retail 8.0 12.9 18.1 -29%
Online 17.7 24.7 10.2 +142%
Telephone 0.4 0.6 3.9 -85%
Other1 1.7 2.3 - -
Total gross win 27.8 40.5 32.2 +26%
Retail 24.0% 29.2% 37.2% -8.0 ppts
Online 14.5% 15.6% 20.0% -4.4 ppts
Telephone 9.5% 11.3% 24.5% -13.2 ppts
Other1 13.1% 12.4% - -
Total gross win margin 16.1% 17.8% 27.9% -10.1 ppts