Embed Size (px)
Citation preview
Title
Author(s)
Source
Version
DOI
Publisher
Publication information
Copyright information
Notice
This version available at HKUST Institutional Repository via
If it is the author’s pre-published version, changes introduced as a result of publishing processes such as copy-editing and formatting may not be reflected in this document. For a definitive version of this work, please refer to the published version.
http://repository.ust.hk/ir/
The Accounting review , v. 89, (6), November 2014, p. 2151-2180
Huang, Allen H.; Zang, Amy Y.; Zheng, Rong
American Accounting Association
http://dx.doi.org/10.2308/accr-50833
Published version
Evidence on the information content of text in analyst reports
© 2014 American Accounting Association
http://hdl.handle.net/1783.1/67831

THE ACCOUNTING REVIEW American Accounting AssociationVol. 89, No. 6 DOI: 10.2308/accr-508332014pp. 2151–2180
Evidence on the Information Content of Textin Analyst Reports
Allen H. HuangAmy Y. ZangRong Zheng
The Hong Kong University of Science and Technology
ABSTRACT: We document that textual discussions in a sample of 363,952 analystreports provide information to investors beyond that in the contemporaneously releasedearnings forecasts, stock recommendations, and target prices, and also assist investorsin interpreting these signals. Cross-sectionally, we find that investors react more stronglyto negative than to positive text, suggesting that analysts are especially important inpropagating bad news. Additional evidence indicates that analyst report text is moreuseful when it places more emphasis on nonfinancial topics, is written more assertivelyand concisely, and when the perceived validity of other information signals in the samereport is low. Finally, analyst report text is shown to have predictive value for futureearnings growth in the subsequent five years.
Keywords: analyst report; naıve Bayes; textual analysis; information content.
I. INTRODUCTION
Analyst reports are a useful source of information for both institutional and individual
investors (SRI International 1987). An analyst report typically provides several
quantitative summary measures, including a stock recommendation, an earnings forecast,
and sometimes a target price;1 it also provides a detailed, mostly textual analysis of the company.
We are grateful to Gregory S. Miller (editor), John Harry Evans III (senior editor), two anonymous referees, and RobyLehavy for numerous comments that significantly improved the paper. This paper has also benefited from commentsfrom Phil Berger, William Buslepp, Kevin Chen, Qiang Cheng, John Core, Patty Dechow, Ilia Dichev, Xi Li, Lin Lin,Mike Mikhail, Mark Seasholes, Haifeng You, and Jerry Zimmerman. We appreciate the comments from workshopparticipants at the 2011 AAA Annual Meeting, the HKUST 2010 Accounting Research Symposium, and XiamenUniversity. We acknowledge financial support provided by HKUST. The work described in this paper was substantiallysupported by a grant from the Research Grants Council of the HKSAR, China (Project No., HKUST645210). We thankYao Zhang and April Wang for their research assistance. Author names are in alphabetical order. All errors are our own.
An earlier version of this paper was titled ‘‘Large Sample Evidence on the Informativeness of Text in Analyst Reports.’’
Editor’s note: Accepted by Gregory S. Miller.
Submitted: March 2012Accepted: April 2014
Published Online: June 2014
1 In this paper, we refer to the earnings forecast, stock recommendation, and target price released in the same analystreport as the quantitative summary measures.
2151

This textual analysis is an important component of the report; at an average of 7.7 pages in our
sample, it constitutes the main body of a report and covers a wide range of topics, such as the
company’s recent financial performance, business strategies, competitive position within the
industry, risk exposure, and the effectiveness of its management.
In this study, we employ a naıve Bayes machine learning approach to extract textual opinions
from a large sample of analyst reports.2 Doing so provides the basis for testing the information
content of report text. Specifically, we investigate the following issues: (1) Does analyst report text
provide incremental information beyond the quantitative summary measures released contempo-
raneously? (2) Does it provide value by assisting investors in interpreting the quantitative signals?
(3) Under what circumstances do investors find text particularly useful? The extant literature has not
provided answers to these questions.
Investors may perceive text as being the most important research output in an analyst report
because it contains analysts’ research ideas useful for investors to form their own investment
decisions.3 Survey evidence supports this perception. Since 1998, investors consistently rank
written reports as a far more important attribute of analysts than stock selections or earnings
estimates, according to Institutional Investor (II) magazine’s annual survey of nearly 3,500
institutional investors.4 Moreover, investors spend millions of dollars annually to purchase the full
content of analyst reports, even though they could subscribe to databases, such as I/B/E/S and
Bloomberg, that provide only analysts’ quantitative outputs.
However, whether text is incrementally useful to investors is still an open empirical question.
Text might not provide independent information if analysts use it merely to support or justify the
contemporaneously issued quantitative summary measures (Francis and Soffer 1997). Furthermore,
investors may find text difficult to use because, in contrast to quantitative signals, textual discussion
in analyst reports, such as product quality and management effectiveness, may not be verifiable expost, comparable across different reports, or easily converted into numerical inputs that investors
can use in their quantitative investing models.
Despite the apparent importance of analyst report text, the extant literature largely overlooks it
and focuses almost exclusively on analysts’ quantitative research outputs (Ramnath, Rock, and
Shane 2008; Bradshaw 2011). This imbalance in the research effort might prevent the literature
from developing a comprehensive understanding of the analysts’ information role (Bradshaw
2011). For example, if analyst report text is informative, then it is possible that part of the
documented market reaction to the quantitative signals is attributable to its correlation with the
textual information. Moreover, the recent debate in the literature about whether analysts are an
important information intermediary is inconclusive (Altınkılıc and Hansen 2009; Altınkılıc,Balashov, and Hansen 2013; Bradley, Clarke, Lee, and Ornthanalai 2014), perhaps because these
studies do not take into account the information role of analyst report text.
To investigate the information content of analyst report text, we use the naıve Bayes machine
learning approach to extract textual opinions from 363,952 analyst reports issued for the S&P 500
firms during the 1995–2008 period. Specifically, our trained naıve Bayes algorithm classifies
more than 27 million sentences in our sample reports into either positive, negative, or neutral
2 This approach is a computational linguistic algorithm that applies Bayes’ theorem with a ‘‘naıve’’ assumption thatwords are conditionally independent. See Section IV for details.
3 This idea is conveyed in the following quotation from A. M. (Toni) Sacconaghi, a 13-time ‘‘All-Star’’ analyst byInstitutional Investor: ‘‘As an analyst, the goal should be to deliver outstanding research that your clients can dependupon and use to make their own decisions—whether or not their ultimate conclusion agrees with yours’’ (InstitutionalInvestor 2011).
4 In 2010 and 2011, for example, written reports rank 5th, considerably higher than earnings estimates (12th); stockselection is not in the top-12 list. This survey does not include target price as a candidate.
2152 Huang, Zang, and Zheng
The Accounting ReviewNovember 2014

opinion categories.5 We then aggregate the sentence-level opinions for each report to determine
an overall report opinion. Our validity tests show that the naıve Bayes approach outperforms
dictionary-based approaches based on both the general dictionaries and financial dictionaries.6
We begin the empirical analyses with a description of the textual opinions in our sample
analyst reports. On average, an analyst report comprises 53 percent neutral sentences, 33 percent
positive sentences, and 14 percent negative sentences. We plot the temporal variation of analyst
reports’ overall textual opinions during 1996–2008 and show that they co-move with the stock
market’s boom and bust, and have become less optimistic after 2001.
Our first set of empirical tests indicates that the market reaction to textual opinions, conditional
on the contemporaneously released quantitative summary measures, is statistically and
economically significant. Specifically, we find that a one standard deviation increase in the
favorableness of the textual opinion measure results in an additional two-day abnormal return of 41
basis points. In addition, we find that the market reacts to the favorable (unfavorable) quantitative
summary measures in a report more intensely when the accompanying textual opinion is more
positive (negative). These results indicate that analyst report text provides information on a stand-
alone basis, as well as helping investors to interpret other signals in the report.
To further understand the information content of analyst report text, we investigate the
determinants of the cross-sectional variation in its information content. First, we compare the
relative weights investors attach to positive and negative text. Prior studies document a greater
market reaction to recommendation downgrades compared to upgrades (Ivkovic and Jegadeesh
2004; Asquith, Mikhail, and Au 2005). We find that, on average, investors similarly attach more
than twice the weight to negative as they do to positive text in analyst reports. This result suggests
that analysts are especially important in propagating bad news.
Next, we explore the effect of different characteristics of analyst reports on the information
content of report text. After controlling for factors previously shown to explain analyst forecasting
performance (brokerage size, II Star status, experience, and Regulation Fair Disclosure [Reg FD]),
we find that investors react to analyst report text more intensely when it places greater emphasis on
nonfinancial topics, when it is written more assertively or concisely, and when the report contains
bold or conflicting quantitative summary signals.
Finally, as a non-market-based test of the information content, we examine whether analyst
report text can predict future earnings growth. We find that text predicts future earnings growth in
the subsequent five years, and that it provides greater predictive power economically and predicts
earnings growth over a longer horizon than do quantitative summary measures. These results are
intuitive because analysts provide detailed fundamental analyses in report text, many of which, such
as analysts’ evaluation of companies’ management quality, strategic alliances, and capital
investments, have implications for long-term earnings. Moreover, we find that negative text is
almost twice as informative as positive text in predicting earnings growth, consistent with investors’
stronger reaction to negative text.
Overall, our study complements the existing analyst literature that focuses on quantitative signals
by providing a more comprehensive understanding of the value of analyst research to investors. We
do so by documenting the first large-sample evidence on the information content of analyst report
5 We classify opinions at the sentence level because the sentence is a natural unit in language for expressing an opinion(Ivers 1991).
6 The naıve Bayes approach achieves a classification accuracy of 80.9 percent in the in-sample validation and 76.9percent in the out-of-sample validation, which is substantially higher than that achieved using dictionary-basedcontent analysis approaches based on the general dictionaries (48.4 percent for General Inquirer [GI]; 51.7 percent forLinguistic Inquiry and Word Count [LIWC]; 54.9 percent for Diction), and on financial dictionaries recentlydeveloped by Loughran and McDonald (2011) (62.0 percent) and Henry (2006) (65.4 percent).
Evidence on the Information Content of Text in Analyst Reports 2153
The Accounting ReviewNovember 2014

text. Our study offers a more definitive answer to the value of analyst report text than previous studies
(Asquith et al. 2005; Twedt and Rees 2012) for several reasons. First, our sample provides greater
confidence in the generalizability of our results.7 Second, our use of the naıve Bayes machine learning
approach produces a more accurate classification of the textual opinions. Third, we conduct both
market- and non-market-based tests of the incremental informativeness of report text, document its
economic significance, and show its value in helping investors to interpret the quantitative summary
measures. Furthermore, our study is the first to explore cross-sectional variation in text’s information
content. The insight that text’s informativeness is determined by its topics, writing style, and features
of other signals in the reports has important implications for both investors and analysts.
Section II discusses relevant prior studies; Section III develops hypotheses; Section IV
describes the naıve Bayes machine learning approach; Section V presents the sample selection and
variable descriptions; Section VI discusses the empirical results; Section VII provides an additional
test; and Section VIII concludes.
II. PRIOR STUDIES
Our paper relates to prior research on financial analysts and to research that applies the naıve
Bayes algorithm to classify textual information. Previous research on financial analysts focuses
mostly on analysts’ quantitative research outputs, including stock recommendations, earnings
forecasts, target prices, and forecasts of some elements in financial statements, such as cash flows
and revenues. Overall, the findings of these studies suggest analyst quantitative outputs are
informative (Womack 1996; Givoly and Lakonishok 1979; Lys and Sohn 1990; Brav and Lehavy
2003; Asquith et al. 2005; Givoly, Hayn, and Lehavy 2009; Call, Chen, and Tong 2013; Ertimur,
Livnat, and Martikainen 2003).
By contrast, only a few studies examine the qualitative content of analysts’ written reports.8 Of
these studies, Asquith et al. (2005) manually catalog the content of 1,126 reports issued by 56 II All-
American ‘‘First Team’’ analysts during the 1997–1999 period. They construct a variable called the
‘‘strength-of-arguments’’ for analyst reports as the number of categories with positive remarks less the
number of categories with negative remarks for 14 categories. Asquith et al. (2005) find that,
conditional on revisions of recommendations, earnings forecasts, and target prices, the strength of
arguments is marginally significant in explaining five-day abnormal returns surrounding the report
date. While Asquith et al. (2005) provide insight into the role of written reports, their study uses a
small and non-random sample. Their small regression sample of 193 observations may explain their
unintuitive result that the market reacts negatively to the strength of arguments for upgrade reports.
Furthermore, because their sample contains only top-ranked analysts who likely receive greater
attention from the market, no more than three SELL reports in their main test, and reports issued only
in the boom years of 1997–1999, it is not clear whether their results are generalizable.
7 Two prior studies that examine analyst report text use small and non-random samples. Asquith et al. (2005) manuallycatalog a small number of reports issued by 56 II All-American ‘‘First Team’’ analysts during the 1997–1999 period.Because these celebrity analysts have greater impacts on the market (Gleason and Lee 2003; Stickel 1992), theirresults may not be generalizable to reports issued by non-star analysts. Twedt and Rees (2012) study initiation reportsissued by analysts in 2006. An initiation report is the first report issued by an analyst when she decides to cover acompany; hence, their results could be partially explained by analysts’ coverage decisions (McNichols and O’Brien1997). Initiation reports are also much longer and more favorable than regular analyst reports. Therefore, it is notclear whether the results in these papers can be generalized to regular analyst reports.
8 Hirst, Koonce, and Simko (1995) conduct an experiment with 291 graduate students and find that their subjects’judgment about a stock is influenced by the strength of arguments contained in an analyst report only when the analystreport is unfavorable. De Franco, Hope, Vyas, and Zhou (2014) study the readability of analyst reports and find that itcorrelates with analyst ability and stock trading volume. Huang, Lehavy, Zang, and Zheng (2014) compare the thematiccontent of analyst report text with that of the earnings conference call transcripts and find that analysts serve as both theinformation interpretation role and the information discovery role immediately after the conference calls.
2154 Huang, Zang, and Zheng
The Accounting ReviewNovember 2014

Twedt and Rees (2012) use a dictionary approach to assess the tone of 2,057 initiation reports
issued in 2006. They find that, conditional on earnings forecasts and stock recommendations, the
market reacts positively to the textual tone of initiation reports. However, one potential limitation of
their study is their use of initiation reports, which tend to be much longer and more favorable than
regular analyst reports.9 Hence, it is not clear whether their results can apply to regular analyst reports.
By employing the naıve Bayes algorithm to extract opinions in analyst written reports, our
study adds to the burgeoning literature that applies computational methods to analyze textual
information. The naıve Bayes algorithm is one of the most successful classification techniques in
the information retrieval and computational linguistics literature (Lewis 1998). It has been used to
extract opinion in a wide variety of text domains, including manager opinions in financial
statements (Li 2010), investor sentiments in Internet stock message boards (Das and Chen 2007;
Antweiler and Frank 2004), and editorial opinions in Wall Street Journal articles (Yu and
Hatzivassiloglou 2003). This study extends our understanding of the naıve Bayes learning method
by showing its superior performance relative to the dictionary-based methods, based on both the
general and financial dictionaries for the context of analysts’ written reports.
III. HYPOTHESES DEVELOPMENT
Information Content of Analyst Report Text
Analyst report text can provide incremental information beyond quantitative summary
measures by supplying detailed information about many aspects of the company, and thus allowing
every investor to use it according to her unique set of private information. For example, certain
elements in the text might provide an investor with new information or confirm her private signals.
She might also place different weights on the various information signals discussed in the text,
based on the precision of her private signals. In contrast, quantitative summary measures provide
only aggregations of analysts’ information. For example, prior research shows that many analysts
generate target prices based on price-multiple heuristics, such as price-earning-to-growth (PEG)
(Bradshaw 2002; Asquith et al. 2005). An investor who does not agree with such valuation models
can still make use of analysts’ comments on the companies’ expected growth in forming her own
target price. Furthermore, text is not subject to the same restrictions that limit the information
content of earnings forecasts and stock recommendations. Earnings forecasts are restricted to
information about short-term earnings, and a stock recommendation is a discrete signal with only
five levels: strong buy, buy, hold, sell, and strong sell.
However, there are two reasons to believe that analyst report text might not provide
information beyond quantitative summary measures. First, text could be provided merely to support
or justify the quantitative summary measures issued contemporaneously. Second, processing
analyst written reports demands not only a sophisticated understanding of language, but also a
significant amount of financial and industry knowledge. Therefore, it might be difficult for investors
to convert text into numerical inputs that they can use in their investing models. Given the above
discussion, we hypothesize that:
H1a: Investors react to the information in analyst report text conditional on the report’s
quantitative summary measures that are released contemporaneously.
H1a predicts that analyst report text provides information content that is independent of the
contemporaneously issued quantitative summary measures. Another way that analyst report text
9 Their sample initiation reports have an average length of more than 18 pages, longer than the average length of 7.7pages of our sample reports.
Evidence on the Information Content of Text in Analyst Reports 2155
The Accounting ReviewNovember 2014

might provide value to investors is by helping them interpret quantitative summary measures.
Specifically, investors may perceive quantitative summary measures as more credible if textual
analyses support or justify these measures. This leads to the following hypothesis:
H1b: Investor reactions to favorable (unfavorable) quantitative summary measures are stronger
when the overall textual opinion of the analyst report is more positive (negative).
Cross-Sectional Determinants of the Information Content of Analyst Report Text
This section identifies several analyst report characteristics that may influence the usefulness of
analyst report text to investors.
Direction of Textual Opinions
There are several reasons that investors may react more strongly to negative than to positive
report text. First, Hong, Lim, and Stein (2000) propose that analysts are especially important in
propagating bad news because managers push out good news as fast as possible, but are less
forthcoming with bad news (Miller 2002; Kothari, Shu, and Wysocki 2009). This asymmetric
disclosure by managers implies that the market is more likely to have advance knowledge of
favorable than unfavorable content in analyst reports, resulting in a stronger market reaction to
negative than to positive report text. Second, prior research shows that analysts are optimistically
biased because of incentives to generate underwriting business (Lin and McNichols 1998), increase
trading commissions (Irvine 2001), and retain access to management (Das, Levine, and
Sivaramakrishnan 1998). Recognizing analysts’ incentives, investors might consider analysts’
unfavorable comments to be more credible. Finally, Epstein, and Echneider (2008) argue that
investors treat textual information as ambiguous signals because its information quality is difficult
to judge. Their theory suggests that ambiguity-averse investors make a worst-case assessment of
quality when interpreting textual information by assuming that good news is unreliable and bad
news is very reliable. As a result, investors react more strongly to bad news than to good news.
Collectively, these intuitions lead to the following hypothesis:
H2a: Investors react more strongly to negative than to positive text in analyst reports.
Emphasis on Nonfinancial Topics
We also examine whether the inclusion of nonfinancial information impacts the influence of
analyst written reports on investor decision making. Nonfinancial information is information not yet
recognized by the financial reporting system (Stocken and Verrecchia 2004). It is well documented
that nonfinancial measures, such as customer satisfaction, brand recognition, and corporate social
responsibility, are key drivers of firm value (Ittner and Larcker 1998; Barth, Clement, Foster, and
Kasznik 1998; Dhaliwal, Li, Tsang, and Yang 2011). Prior research also shows that analysts are a
source of nonfinancial information on a firm (Bradshaw 2002, 2009; Previts, Bricker, Robinson,
and Young 1994).
There is cross-sectional variation among analyst reports in their emphasis on nonfinancial topics.
Analyst reports that emphasize nonfinancial topics more may be perceived as more informative for
several reasons. First, managers might be less willing to disclose nonfinancial information due to
proprietary cost (Verrecchia 1983); thus, analyst research on nonfinancial information could be more
valuable to investors. Second, since nonfinancial information is voluntarily disclosed and hard to
verify ex post, investors may perceive analysts’ discussion of nonfinancial information to be more
credible than that disclosed by managers. Last, since nonfinancial information on topics such as the
synergy of a merger or an industry’s competitive landscape is challenging for investors to process,
2156 Huang, Zang, and Zheng
The Accounting ReviewNovember 2014

investors may rely more on analysts’ opinions due to analysts’ superior industry knowledge and
analytical skills. The above discussion leads to our next hypothesis:
H2b: Investors react more strongly to analyst report text that places a greater emphasis on
nonfinancial information.
Assertiveness of Text
We expect analysts to use a more assertive writing style to convey information signals with
greater precision. It is also well documented in the psychology literature that people use a
confidence heuristic; that is, they assume a more confident communicator to be more accurate,
competent, and credible (Zarnoth and Sniezek 1997; Sniezek and Van Swol 2001; Price and Stone
2004). Therefore, investors likely perceive a more assertively written analyst report as reflecting
higher information quality, and thus react more strongly to it. Based on this idea, we predict:
H2c: Investors react more strongly to analyst report text when it is written more assertively.
Conciseness of Text
Extensive finance and economics literatures document the limited attention of even
sophisticated investors, which in turn affects security pricing (Hirshleifer and Teoh 2003; Daniel,
Hirshleifer, and Teoh 2002). Prior research (Li 2008; Lehavy, Li, and Merkley 2011) shows that
longer annual reports are less readable and harder to process. Therefore, it is reasonable to assume
that a more concise report is easier to process and likely to receive more attention than a longer
report, resulting in a greater price reaction. Hence, we hypothesize the following:
H2d: Investors react more strongly to analyst report text when it is written more concisely.
Perceived Validity of Headlines
In a typical analyst report, quantitative summary measures are presented at the top of the first
page, often in italics or in a larger headline font. The psychology literature suggests that when a
communicator’s message disconfirms the recipient’s prior expectation, the recipient will find it
more difficult to judge the validity of the message and will seek information from the
communicator’s message arguments (Hirst et al. 1995; Mercer 2004). In the context of the analyst
report, a headline may disconfirm investors’ prior expectation if it contains bold signals that deviate
substantially from investors’ prior expectations or inconsistent signals reflecting a mix of good and
bad news. In either case, investors would question the validity of the headlines and thus place more
weight on the report text (Koehler 1993), leading to the following two hypotheses:
H2e: When headlines in analyst reports contain bold signals, investors react more strongly to
the text.
H2f: When headlines in analyst reports contain inconsistent signals, investors react more
strongly to the text.
IV. THE NAIVE BAYES MACHINE LEARNING APPROACH AND MEASUREMENTOF TEXTUAL OPINION
Naıve Bayes Classification
The naıve Bayes classification is a statistical learning method that assigns the textual document
to the most likely category based on the statistical relation between words and categories learned
Evidence on the Information Content of Text in Analyst Reports 2157
The Accounting ReviewNovember 2014

from a training dataset. Formally, the approach assigns a document d, containing m words, fw1, w2,
. . . , wmg, to one of k categories, c* 2 fc1, c2, . . . , ckg, by maximizing the conditional probability
that the document belongs to a particular category, P(cjd):c� ¼ argmax
c2 c1;c2;...;ckf gPðcjdÞ:
Applying Bayes rule based on the ‘‘naıve’’ assumption that, given a document’s category, wi’s are
conditionally independent yields the following:
c� ¼ argmaxc2 c1;c2;...;ckf g
PðcÞYm
j¼1
PðwjjcÞ: ð1Þ
The assumption ignores the internal structure of words in a document, such as the sequence of
words. Hence, the approach is also referred to as the ‘‘bag of words’’ approach. Prior research showsthat applying this assumption yields a classification of text as effective as that of other approaches
that incorporate the internal structures of documents (Lewis 1998; Manning, and Schutze 1999).
The naıve Bayes classification can be viewed as a prediction model, with the words in the
document as the input variables and the probability of the opinion categories as the predicted value.
The parameters of this prediction model, the conditional probabilities of word occurrence given a
category, are learned from a training dataset that represents the specific domain being examined,
which, in our study, is analyst reports.
The specificity of the analyst domain is one of the advantages of the naıve Bayes machine
learning approach. By adapting to the words that appear in a specific domain and their probabilistic
relation to a certain opinion category, this approach leads to increased classification accuracy for the
specific analyst context compared to dictionary-based approaches. This feature is important
because, as Pang and Lee (2008) discuss, opinions are highly domain-dependent, in terms of both
vocabulary and the conditional probabilities of the opinion categories given the domain vocabulary.
Implementation of the Naıve Bayes Machine Learning Approach and Its Performance
To classify the opinions in analyst reports, we begin with the set of all reports in the Investext
database issued for S&P 500 firms during the 1995–2008 period. This yields a set of 488,494
reports. We next partition each report into sentences, and delete sentences that fall under the
category of ‘‘brokerage disclosure.’’10 After cleaning the data of such statements, we end up with a
final classification sample consisting of 27,231,727 sentences.
First, to construct a training dataset for the naıve Bayes machine learning approach, we
randomly select 10,000 sentences from our sample and manually classify each sentence into one of
three categories: positive, negative, and neutral.11 This classification yields a total of 3,580 positive,
1,830 negative, and 4,590 neutral sentences in the training dataset. The higher percentage of
positive versus negative sentences is consistent with findings that show an optimistic bias in analyst
forecasts and recommendations (Ramnath et al. 2008). Next, the naıve Bayes algorithm ‘‘learns’’the parameters of the prediction model from the training dataset by solving the maximum likelihood
10 The category of brokerage disclosure includes explanations of stock-rating systems, disclosures regarding conflicts ofinterest, analyst certifications, and other disclosures required by regulations, as well as disclaimers, glossaries, anddescriptions of the brokerage or research firm. It does not contain analyst opinions about the companies covered. Wemanually identify these disclosure sections for each brokerage and research firm and then remove them from oursample.
11 We conduct the classification. To avoid unnecessary influences on the opinion assignment, we are given only thesentences, without any other information from the analyst reports. Following Li (2010), to keep a neutral prior inclassifying the sentences, we ignore any prior knowledge about the topic mentioned in the sentence.
2158 Huang, Zang, and Zheng
The Accounting ReviewNovember 2014

problem specified in Equation (1). Last, we use our ‘‘trained’’ naıve Bayes classifier to assign each
sentence in our sample to the category with the highest predicted probability.
Because the power of the empirical tests depends crucially on the classification effectiveness,
we evaluate the performance of the naıve Bayes approach. Such an evaluation is also important
because this is the first study to use the naıve Bayes approach on analyst reports; whether it can
outperform dictionary approaches is unknown.
To gauge the accuracy of the naıve Bayes algorithm, we follow Li (2010) and use both in-
sample validation and out-of-sample ten-fold cross validation. Our in-sample validation uses the
same set of data to both train and test the naıve Bayes classifier, providing an upper bound for the
classifier’s performance. Our out-of-sample validation uses different data at the training and testing
stages to provide a more realistic measure of performance. Accuracy is measured as a percentage
determined by the number of correct classifications of sentences divided by the number of sentences
in the dataset.
The results in Table 1 show that the naıve Bayes classifier achieves accuracy of 80.89 percent
in the in-sample validation and 76.91 percent in the ten-fold cross validation. These accuracy rates
are greater than the accuracy rate of 62.02 percent and 65.44 percent obtained from the financial
dictionaries of Loughran and McDonald (2011) and Henry (2006), respectively, in classifying
analyst reports. These rates are also greater than those obtained from general dictionaries in
classifying analyst reports, which are 48.40 percent, 51.74 percent, and 54.93 percent, for General
Inquirer (GI), Linguistic Inquiry and Word Count (LIWC), and Diction, respectively. Finding that
the naıve Bayes approach outperforms both financial and general dictionaries in classifying analyst
reports suggests that analyst reports constitute a unique domain and that learning the probabilistic
relation between words and a certain opinion category results in improved accuracy.
Measurement of Opinions at the Report Level
The naıve Bayesian learning approach yields the number of positive (N_POS), negative (N_NEG), and neutral sentences (N_NEU) for each report. The length (LENGTH) of a given report is
the sum of these three numbers. Report length excludes the brokerage disclosure sentences removed
from the beginning sample set (see footnote 10).
To measure the overall opinion in an analyst report, we use the following metric:
OPN ¼ N POS� N NEG
LENGTH¼ PCT POS� PCT NEG;
where PCT_POS (PCT_NEG) is the percentage of positive (negative) sentences in a report.12 Here,
OPN decreases with N_NEU to capture the effect that a greater number of neutral statements will
dilute the overall strength of the opinion statements.
V. SAMPLE SELECTION AND VARIABLE DESCRIPTIONS
Selection of Sample Analyst Reports
We extract report date, report title, analyst name, name of the institution issuing the report, and
full report content from every downloaded analyst report. From the initial sample of 488,494
12 We also examine two other measures, where OPN0 ¼ (N_POS� N_NEG)/(N_POSþ N_NEG) depends on only theratio of positive to negative sentences, ignoring sentences classified as neutral. The second measure is OPN00¼ ln[(1þN_POS)/(1þN_NEG)] ’ f[(N_POS� N_NEG)/(N_POSþN_NEG)]ln(1þN_POSþN_NEG)g, and increases withboth the ratio of positive to negative sentences and the overall percentage of opinionated statements (i.e., N_POSþN_NEG). The empirical results based on these two alternative measures are very similar.
Evidence on the Information Content of Text in Analyst Reports 2159
The Accounting ReviewNovember 2014

reports, we delete 25,313 reports that cover multiple stocks, as indicated by the report titles, because
we cannot discern company-specific opinions from these reports. We next match the reports in our
sample with I/B/E/S to obtain stock recommendations, earnings forecasts, and target prices. The
overlap between Investext and I/B/E/S provides the sample for our main analyses. As described in
detail in Appendix A, we match 363,952 reports to I/B/E/S, including 321,533 with valid stock
recommendations, 320,094 with valid earnings forecasts, and 254,387 with valid target prices.
Descriptions of Textual Opinions
Panel A of Table 2 provides the descriptive statistics for our key variables. Overall, we find that
the average length of the reports in our sample is 57 sentences, of which 31 sentences are neutral,
19 are positive, and 7 are negative. The textual opinion measure (OPN), which captures the
percentage difference in positive versus negative sentences, has a mean value of 18.7 percent,
consistent with analysts’ well-known optimism.
TABLE 1
Accuracy of the Naıve Bayes Machine Learning Approach versus Financial Dictionary andGeneral Dictionary Approaches
Accuracy(%)
FalsePositive(%)
FalseNegative
(%)
FalseNeutral(%)
Naıve Bayes (in-sample validation) 80.89 6.07 2.31 10.73
Naıve Bayes (ten-fold cross validation) 76.91 7.79 3.04 12.26
Financial Dictionaries:
Loughran and McDonald (2011) word list 62.02 4.65 7.93 25.40
Henry (2006) word list 65.44 12.70 5.23 16.63
General Dictionaries:
General Inquirer 48.40 23.74 8.94 18.92
Linguistic Inquiry and Word Count 51.74 13.14 2.92 32.20
Diction 54.93 10.33 6.65 28.09
This table reports the results for the naıve Bayes classifier from the in-sample and the ten-fold cross validation tests, aswell as the prediction results using the word lists developed by Loughran and McDonald (2011), Henry (2006), GeneralInquirer (GI), Linguistic Inquiry and Word Count (LIWC), and Diction. For the in-sample test for the naıve Bayesclassifier, we use 10,000 manually coded sentences to train the classifier and test it with the same sample. In the ten-foldcross validation, the sample of 10,000 sentences is randomly and evenly split into ten subsets (folds) and the classifier istrained and tested ten times. Each time, nine folds of data (out of the ten) are selected as the training data, and theremaining one fold is used to test the classifier; the reported accuracy is the average of the ten tests. For the Loughran andMcDonald (2011) word list, the Henry (2006) word list, GI, LIWC, and Diction, the sentence is classified as positive ifthe percentage of positive words is greater than that of negative words, negative if the percentage of negative words isgreater than that of positive words, and neutral if the percentage of positive words equals that of negative words. For theLoughran and McDonald (2011) word list, the percentage of positive (negative) words is the percentage of words inLoughran and McDonald’s Fin-Pos (Fin-Neg) word lists. For the Henry (2006) word list, the percentage of positive(negative) words is the percentage of words in Henry’s ‘‘positivity’’ (‘‘negativity’’) word lists. For GI, the percentage ofpositive (negative) words is the percentage of positive (negative) words classified by GI’s ‘‘Positiv’’ and ‘‘Negativ’’ wordlists. For LIWC, the percentage of positive (negative) words is the percentage of positive (negative) emotion wordsclassified by the LIWC software. For Diction, the percentages of positive (negative) words is the percentage of words inDiction’s ‘‘praise,’’ ‘‘satisfaction,’’ and ‘‘inspiration’’ (‘‘blame,’’ ‘‘hardship,’’ and ‘‘denial’’) categories. Accuracy ismeasured as the number of correct classifications divided by the number of sentences in the test sample. The falsepositive (false negative, false neutral) rate is defined as the number of sentences incorrectly predicted to be positive(negative, neutral), divided by the total number of sentences in the test sample.
2160 Huang, Zang, and Zheng
The Accounting ReviewNovember 2014

TABLE 2
Descriptive Statistics of Textual Opinions and the Quantitative Summary Measures inAnalyst Reports
Panel A: Summary Statistics
# of Obs. Mean Median Std. Dev. 25% 75%
LENGTH 343,099 56.784 40.000 73.467 21.000 68.000
OPN 343,099 0.187 0.188 0.199 0.062 0.316
PCT_POS 343,099 0.326 0.321 0.156 0.217 0.429
PCT_NEG 343,099 0.140 0.120 0.106 0.063 0.200
REC 321,533 3.674 4.000 0.878 3.000 4.000
REC_REV 314,703 0.000 0.000 0.319 0.000 0.000
EF 319,818 0.056 0.054 0.038 0.038 0.072
EF_REV 287,018 0.000 0.000 0.004 0.000 0.000
TP 254,203 1.251 1.173 0.481 1.046 1.318
TP_REV 248,174 0.000 0.000 0.091 0.000 0.000
CAR 363,747 0.000 0.000 0.051 �0.019 0.020
PRIOR_CAR 363,695 0.000 0.000 0.076 �0.033 0.034
SIZE 363,786 9.589 9.480 1.212 8.746 10.366
BM 363,786 0.381 0.324 0.389 0.199 0.503
Panel B: Textual Opinions by Report Type
Report Type byRecommendation # Obs.
Avg.OPN
Avg.PCT_POS
(%)
Avg.PCT_NEG
(%)
Avg.PCT_NEU
(%)Avg.
LENGTH
BUY 177,883 0.231 34.864 11.784 53.352 59.105
HOLD 123,304 0.138 30.162 16.394 53.444 54.093
SELL 20,346 0.089 27.544 18.655 53.801 53.468
Upgrade 8,588 0.229 35.281 12.420 52.300 68.002
Reiteration 297,274 0.186 32.612 13.986 53.402 53.531
Downgrade 8,841 0.101 28.917 18.792 52.291 57.219
This table reports the descriptive statistics for the 363,952 sample reports.
Variable Definitions:LENGTH ¼ total number of sentences in the analyst report;PCT_POS ¼ percentage of sentences in the analyst report that are classified as positive by the naıve Bayes approach;PCT_NEG¼ percentage of sentences in the analyst report that are classified as negative by the naıve Bayes approach;PCT_NEU ¼ percentage of sentences in the analyst report that are classified as neutral by the naıve Bayes approach;OPN ¼ textual opinion, calculated as PCT_POS � PCT_NEG;REC¼ recommendation from I/B/E/S, reordered such that a higher value indicates a more positive recommendation (1:
Sell; 2: Underperform; 3: Hold; 4: Buy; 5: Strong Buy);REC_REV¼ recommendation revision, calculated as the current report’s REC minus the last REC in I/B/E/S issued by
the same analyst for the same firm;EF¼ earnings forecast from I/B/E/S scaled by the stock price 50 days before the report date, winsorized at the top and
bottom 1 percent;EF_REV ¼ earnings forecast revision, calculated as the current report’s EF minus the last EF in I/B/E/S issued by the
same analyst for the same firm’s same fiscal year, winsorized at the top and bottom 1 percent;TP¼ target price from I/B/E/S scaled by the stock price 50 days before the report date, winsorized at the top and bottom
1 percent;
(continued on next page)
Evidence on the Information Content of Text in Analyst Reports 2161
The Accounting ReviewNovember 2014

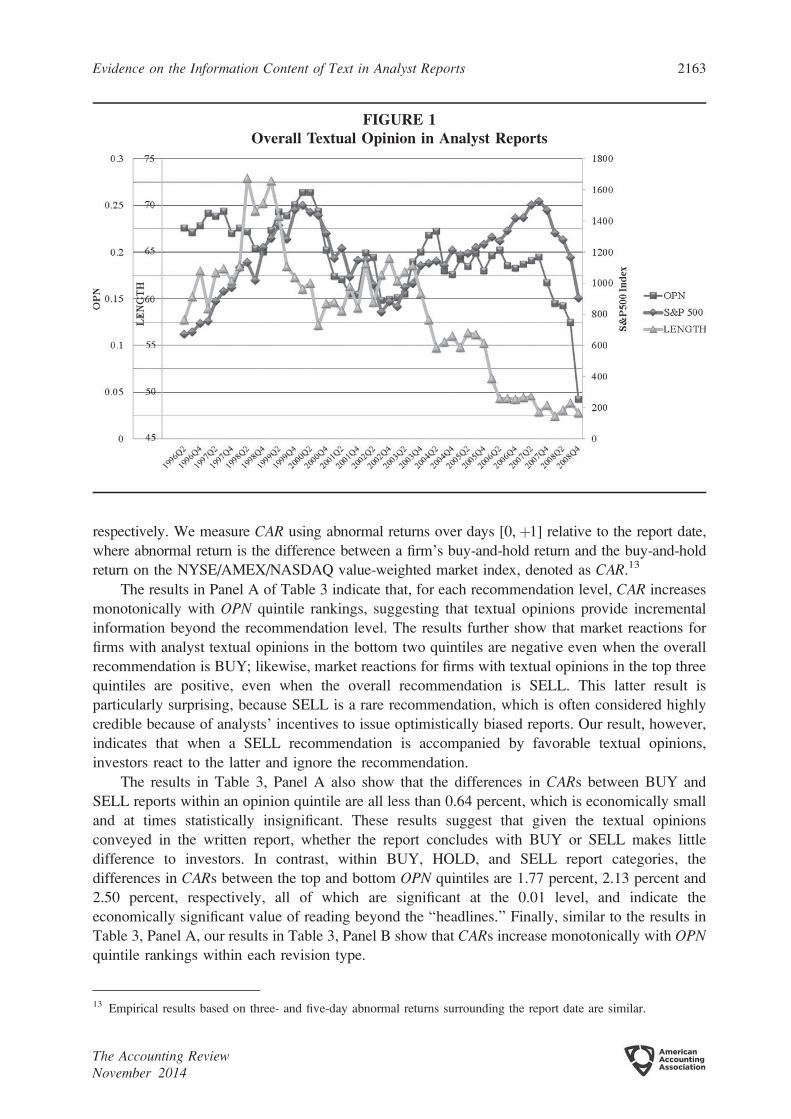
Figure 1 plots the results for our textual opinion classifications and report length over time. First,
the results show that analyst report length decreases over our sample period from around 65–70
sentences during 1996–1999 to around 50 sentences during 2006–2008. This decrease is
accompanied by an increase in report frequency. On average, an analyst issues 10.5 reports for our
sample firms in 1998, and that number increases gradually to 33 by 2008. Second, the results show
that textual opinion reflects stock-market cycles. Specifically, we find that report opinions are most
optimistic during the boom market in the late 1990s, reaching their peak at the same time as the S&P
500 index in early 2000 with an average OPN of 0.264. However, the favorableness of report
opinions drops by 41 percent during the market crash of 2001 to 0.155 in late 2001. Similarly, during
2002–2006, textual opinion becomes increasingly optimistic as the average OPN increases from
0.148 to 0.202, reflecting another market boom period. Favorableness then decreases dramatically by
nearly 78 percent during the 2008 financial crisis from 0.195 in 2007 to 0.043 in the fourth quarter of
2008. This co-movement with stock market boom and bust provides validation for our textual opinion
measure. Finally, the results in Figure 1 show that textual opinions generally become less optimistic
after 2001, consistent with the impact of regulatory changes, including the enactment of Reg FD in
2000 and the Global Settlement reached in 2003, on the financial analyst industry.
Association between Textual Opinions and the Quantitative Summary Measures
Table 2, Panel B describes textual opinions by report type. Specifically, our average OPNdecreases by 40 percent from 0.231 to 0.138 from a BUY to a HOLD recommendation and by a
further 36 percent from 0.138 to 0.089 from a HOLD to a SELL. Although the literature often
combines HOLD and SELL as sell recommendations, our finding here suggests that analysts are
considerably more negative in the text of a SELL report than a HOLD report. We also note that
even in SELL reports, we find more positive than negative sentences.
Furthermore, the results in Panel B of Table 2 show that average OPN drops by 19 percent
from 0.229 to 0.186 from an upgrade to a reiteration (i.e., a report that contains the same stock
recommendation level as in the last report issued by the same analyst), and by more than 46 percent
from 0.186 to 0.101 from a reiteration to a downgrade, suggesting that the level of OPN reflects
revisions in the recommendations. This finding is consistent with analysts discussing what has
changed at the company since their last report and providing detailed explanations for the revisions
of the quantitative summary measures.
VI. EMPIRICAL RESULTS
Information Content of Analyst Report Text
Table 3, Panel A reports the market reaction (CAR) across OPN quintiles by recommendation
level. The top and bottom quintiles contain reports with the most and least favorable textual opinions,
TABLE 2 (continued)
TP_REV¼ target price revision, calculated as the current report’s TP minus the last TP in I/B/E/S issued by the sameanalyst for the same firm, winsorized at the top and bottom 1 percent;
CAR¼ cumulative two-day abnormal returns starting from the current report date, where abnormal returns are calculatedas the raw return minus the buy-and-hold return on the NYSE/AMEX/NASDAQ value-weighted market index;
PRIOR_CAR¼ cumulative ten-day abnormal returns ending before the current report date, where abnormal returns arecalculated as the raw return minus the buy-and-hold return on the NYSE/AMEX/NASDAQ value-weighted marketindex;
SIZE¼ logarithm of the firm’s market value of equity; andBM¼ firm’s book value of equity to its market value of equity.
2162 Huang, Zang, and Zheng
The Accounting ReviewNovember 2014
respectively. We measure CAR using abnormal returns over days [0,þ1] relative to the report date,
where abnormal return is the difference between a firm’s buy-and-hold return and the buy-and-hold
return on the NYSE/AMEX/NASDAQ value-weighted market index, denoted as CAR.13
The results in Panel A of Table 3 indicate that, for each recommendation level, CAR increases
monotonically with OPN quintile rankings, suggesting that textual opinions provide incremental
information beyond the recommendation level. The results further show that market reactions for
firms with analyst textual opinions in the bottom two quintiles are negative even when the overall
recommendation is BUY; likewise, market reactions for firms with textual opinions in the top three
quintiles are positive, even when the overall recommendation is SELL. This latter result is
particularly surprising, because SELL is a rare recommendation, which is often considered highly
credible because of analysts’ incentives to issue optimistically biased reports. Our result, however,
indicates that when a SELL recommendation is accompanied by favorable textual opinions,
investors react to the latter and ignore the recommendation.
The results in Table 3, Panel A also show that the differences in CARs between BUY and
SELL reports within an opinion quintile are all less than 0.64 percent, which is economically small
and at times statistically insignificant. These results suggest that given the textual opinions
conveyed in the written report, whether the report concludes with BUY or SELL makes little
difference to investors. In contrast, within BUY, HOLD, and SELL report categories, the
differences in CARs between the top and bottom OPN quintiles are 1.77 percent, 2.13 percent and
2.50 percent, respectively, all of which are significant at the 0.01 level, and indicate the
economically significant value of reading beyond the ‘‘headlines.’’ Finally, similar to the results in
Table 3, Panel A, our results in Table 3, Panel B show that CARs increase monotonically with OPNquintile rankings within each revision type.
FIGURE 1Overall Textual Opinion in Analyst Reports
13 Empirical results based on three- and five-day abnormal returns surrounding the report date are similar.
Evidence on the Information Content of Text in Analyst Reports 2163
The Accounting ReviewNovember 2014

To examine how much abnormal returns can be triggered by per-unit variation in textual
opinions beyond the impact of the quantitative summary measures, we estimate the following
multivariate regression:
CAR ¼ a0 þ bOPN þ c1REC REV þ c2EF REV þ c3TP REV þX
jdj � Controlsj þ e: ð2Þ
We include in Equation (2) the revisions of the recommendation, earnings forecast, and target
price because previous research shows that revisions of these signals are informative to investors
(Jegadeesh, Kim, Krische, and Lee 2004; Barber, Lehavy, and Trueman 2010).14 In Equation (2),
TABLE 3
Cumulative Abnormal Returns (CARs) around Report Issuance by Textual Opinions andRecommendation Levels and Revisions
Panel A: Abnormal Returns by Textual Opinions and Recommendation Levels
OPN
BUY HOLD SELL
All RECLevels
BUY� SELLCAR
# ofObs. CAR
# ofObs. CAR
# ofObs.
5 (Top Quintile) 0.92% 42,847 0.89% 16,268 1.01% 1,631 0.91% �0.09%
4 0.45% 38,300 0.35% 20,458 0.26% 2,610 0.41% 0.19%*
3 0.22% 34,320 0.01% 23,264 0.07% 3,806 0.13% 0.15%
2 �0.08% 29,153 �0.30% 25,896 �0.54% 4,940 �0.21% 0.47%***
1 (Bottom Quintile) �0.85% 22,383 �1.24% 31,614 �1.49% 6,902 �1.12% 0.64%***
All OPN Quintiles 0.26% �0.21% �0.52%
Top � Bottom 1.77%*** 2.13%*** 2.50%***
Panel B: Abnormal Returns by Textual Opinions and Recommendation Revisions
OPN
Upgrade Reiteration DowngradeAllREC
RevisionsUpgrade �DowngradeCAR
# ofObs. CAR
# ofObs. CAR
# ofObs.
5 (Top Quintile) 2.89% 2,023 0.89% 56,826 �1.42% 883 0.92% 4.31%***
4 2.31% 1,944 0.39% 56,480 �1.44% 1,199 0.42% 3.75%***
3 2.07% 1,781 0.12% 56,134 �1.85% 1,535 0.13% 3.92%***
2 2.04% 1,366 �0.18% 55,489 �2.66% 1,927 �0.21% 4.70%***
1 (Bottom Quintile) 1.33% 981 �0.97% 56,508 �4.96% 2,813 �1.12% 6.29%***
All OPN Quintiles 2.24% 0.05% �2.98%
Top � Bottom 1.56%*** 1.86%*** 3.54%***
*, *** Indicates p , 0.1 and p , 0.01, respectively.This table reports the market reaction to analyst reports across the quintiles of OPN for each level of recommendation.OPN: the textual opinion, calculated as the percentage of positive sentences minus the percentage of negative sentencesin the report as classified by the naıve Bayes approach; OPN is ranked into quintiles in each month; CAR: the cumulativetwo-day abnormal returns starting from the current report date, with abnormal returns calculated as the raw return minusthe buy-and-hold return on the NYSE/AMEX/NASDAQ value-weighted market index.
14 In an alternative specification, we include both the levels and revisions of the quantitative summary measures and findsimilar results.
2164 Huang, Zang, and Zheng
The Accounting ReviewNovember 2014

REC represents the five-level recommendation values, where REC equals 1 for Sell; 2 for
Underperform; 3 for Hold; 4 for Buy; and 5 for Strong Buy; EF and TP are defined as the annual
earnings forecast and target price scaled by the stock price 50 days before the report date,
respectively; REC_REV is the recommendation revision, measured as the current report’s RECminus the analyst’s last REC in I/B/E/S for the same stock; and earnings forecast revision (EF_REV) and target price revision (TP_REV) are defined similarly. Following Brav and Lehavy (2003),
we winsorize EF_REV and TP_REV at the top and bottom 1 percent to reduce the influence of
outliers.
The regression also includes several control variables. To address the concern that analysts may
piggyback on recent news or events, we include abnormal returns during the ten trading days prior
to the report date (PRIOR_CAR) to control for any potential short-term momentum or reversal in
stock price. To control for investor reactions due to firm characteristics and industry- and market-
wide conditions, we include firm size (SIZE), measured as the logarithm of the market value of
equity, book-to-market ratio (BM), and industry and year fixed-effects in Equation (2). Because
multiple analysts can follow the same firm, and one analyst can cover multiple firms, standard
errors in all empirical tests are estimated with a two-way cluster control at the firm and analyst
levels. Finally, if an earnings announcement or a management forecast is issued during the CARwindow, then we delete the observation to mitigate the concern that such events might affect both
market reactions and analyst opinions.15 Our final sample for estimating Equation (2) contains
112,304 observations.
Table 4, Panel A presents the estimated results for Equation (2). Column (1) reports the results
without the opinion variables, while column (2) reports the results including OPN. Comparing
column (2) with column (1), we find two pieces of evidence consistent with H1a, which states that
textual opinions provide information beyond quantitative summary measures. First, the adjusted R2
increases 21 percent from 3.37 percent to 4.09 percent after including OPN in the regression,
suggesting that textual opinions account for some variation in the abnormal returns beyond that
provided by the quantitative summary measures or control variables. Second, the estimated
coefficient of 0.0208 on OPN is not only statistically significant (p , 0.01 level), but also
economically significant. On average, a one standard deviation increase in OPN increases the two-
day abnormal returns by 41 basis points.16,17 This is comparable to the magnitude of the abnormal
15 We remove 59,713 observations because the companies issue earnings announcements during the CAR window, andan additional 8,037 observations for management forecasts. We obtain the earnings announcement dates from theCompustat database and the management forecast dates from the First Call database. Our results are qualitativelysimilar if we do not remove these observations.
16 Recent studies have developed dictionaries specifically for financial contexts (Loughran and McDonald 2011; Henry2006). However, these word lists are based on 10-Ks and earnings releases rather than on analyst reports. In anuntabulated test, we estimate Equation (2) using the textual opinions measured with dictionary-based methods. Wefind that while the estimated coefficients of textual opinion remain statistically significant, their economic significancedecreases considerably. Specifically, the word list developed by Loughran and McDonald (2011) produces the largesteconomic significance (33 basis points) among all the dictionaries examined, which is still 20 percent lower than thatof the naıve Bayes method. Other dictionary methods (GI, LIWC, Diction, and the word list developed by Henry[2006]) understate the economic significance by up to 41 percent. This is consistent with the findings in Section IVthat the naıve Bayes method classifies the textual opinions in analyst reports more accurately than dictionary-basedmethods.
17 As a robustness test, we replicate Equation (2) using the market reaction during a 40-minute announcement window,centered on the analyst report announcement time, to alleviate the concern that the market’s documented reaction iscaused by concurrent events. We use stock transaction data from the TAQ database and the announcement time fromI/B/E/S. Market reaction is measured as (PRCpost/PRCpre� 1), where PRCpost is the mean transaction price in the lastten minutes of the announcement window or the previous ten minutes if there is no transaction in the last ten minutes.PRCpre is the mean transaction price in the first ten minutes of the announcement window or the next ten minutes ifthere is no transaction in the first ten minutes. The untabulated result shows that the estimated coefficient on OPN issignificant at the p , 0.01 level, indicating that our main results are not driven by concurrent events.
Evidence on the Information Content of Text in Analyst Reports 2165
The Accounting ReviewNovember 2014

TABLE 4
Information Content of Analyst Report Text
Panel A: Estimation Results of Equation (2)
(1)Coefficients(t-stats)
(2)Coefficients(t-stats)
(3)Coefficients(t-stats)
OPN 0.0208***
(19.69)
PCT_POS 0.0129***
(11.89)
PCT_NEG �0.0364***
(�15.19)
REC_REV 0.0122*** 0.0116*** 0.0115***
(12.31) (11.77) (11.68)
EF_REV 1.1415*** 0.9919*** 0.9687***
(9.31) (8.27) (8.14)
TP_REV 0.0492*** 0.0442*** 0.0432***
(12.11) (10.99) (10.79)
PRIOR_CAR �0.0217** �0.0260*** �0.0267***
(�2.30) (�2.76) (�2.82)
SIZE �0.0008*** �0.0008*** �0.0009***
(�3.11) (�3.20) (�3.48)
BM 0.0009** 0.0017*** 0.0016***
(2.05) (3.88) (3.69)
Intercept 0.0122*** 0.0093*** 0.0133***
(5.15) (3.82) (5.55)
# of Obs. 112,304 112,304 112,304
Adj. R2 3.37% 4.09% 4.25%
*, **, *** Indicates p , 0.1, p , 0.05, and p , 0.01, respectively.Panel A reports the estimation results of Equation (2): CAR¼ a0þ bkOPINIONkþ c1REC_REVþ c2EF_REVþ c3TP_REVþ Ridi � Controlsiþ e. All regressions include industry and year fixed-effects; standard errors are estimated with atwo-way cluster control at the firm and analyst levels.
Variable Definitions:CAR¼ dependent variable, which is the cumulative two-day abnormal returns starting from the current report date, with
abnormal returns calculated as the raw return minus the buy-and-hold return on the NYSE/AMEX/NASDAQvalue-weighted market index;
PCT_POS ¼ percentage of sentences in the analyst report that are classified as positive by the naıve Bayes approach;PCT_NEG¼ percentage of sentences in the analyst report that are classified as negative by the naıve Bayes approach;OPN ¼ textual opinion, calculated as PCT_POS � PCT_NEG;REC_REV¼ recommendation revision, calculated as the current report’s REC minus the last REC in I/B/E/S issued by
the same analyst for the same firm;EF_REV¼ earnings forecast revision, calculated as the current report’s earnings forecast minus the last earnings forecast
in I/B/E/S issued by the same analyst for the same firm’s same fiscal year, scaled by the stock price 50 days beforethe report date, winsorized at the top and bottom 1 percent;
TP_REV¼ target price revision, calculated as the current report’s target price minus the last target price in I/B/E/S issuedby the same analyst for the same firm, scaled by the stock price 50 days before the report date, winsorized at the topand bottom 1 percent;
PRIOR_CAR ¼ cumulative ten-day abnormal returns ending the day before the current report date, where abnormalreturns are calculated as the raw return minus the buy-and-hold return on the NYSE/AMEX/NASDAQ value-weighted market index;
SIZE¼ logarithm of the firm’s market value of equity; andBM¼ firm’s book value of equity to its market value of equity.
(continued on next page)
2166 Huang, Zang, and Zheng
The Accounting ReviewNovember 2014

TABLE 4 (continued)
Panel B: Estimation Results of Equation (3)
PredictedSign Coefficients (t-stats)
OPN þ 0.0171*** (14.91)
OPN 3 REC_REV 3 REC_DIR þ 0.0093** (2.09)
OPN 3 EF_REV 3 EF_DIR þ 1.2928*** (2.79)
OPN 3 TP_REV 3 TP_DIR þ 0.0293* (1.71)
REC_REV þ 0.0066*** (4.78)
REC_DIR þ 0.0061*** (4.43)
REC_DIR 3 REC_REV � �0.0068*** (�3.87)
EF_REV þ 0.4617*** (4.59)
EF_DIR þ 0.0019*** (7.07)
EF_DIR 3 EF_REV � �0.6095*** (�5.14)
TP_REV þ 0.0344*** (6.80)
TP_DIR þ 0.0010*** (2.60)
TP_DIR 3 TP_REV � �0.0146*** (�2.61)
PRIOR_CAR �0.0263*** (�2.79)
SIZE �0.0009*** (�3.50)
BM 0.0019*** (4.14)
Intercept 0.0200*** (6.99)
# of Obs. 112,304
Adj. R2 4.29%
*, **, *** Indicates p , 0.1, p , 0.05, and p , 0.01, respectively.Panel B reports the estimation results of Equation (3): CAR¼aþb0OPNþb1OPN3REC_REV3REC_DIRþb2OPN3EF_REV3EF_DIRþb3OPN3TP_REV3TP_DIRþ c1REC_REVþ c2REC_DIRþ c3REC_DIR3REC_REVþ c4EF_REVþ c5EF_DIRþ c6EF_DIR3EF_REVþ c7TP_REVþ c8TP_DIRþ c9TP_DIR3TP_REVþRjhj � Controlsjþ e. Allregressions include industry and year fixed-effects; standard errors are estimated with a two-way cluster control at thefirm and analyst levels.
Variable Definitions:CAR¼ dependent variable, which is the cumulative two-day abnormal returns starting from the current report date, with
abnormal returns calculated as the raw return minus the buy-and-hold return on the NYSE/AMEX/NASDAQvalue-weighted market index;
OPN¼ textual opinions, calculated as the percentage of positive sentences minus the percentage of negative sentences inthe report as classified by the naıve Bayes approach;
REC_REV¼ recommendation revision, calculated as the current report’s REC minus the last REC in I/B/E/S issued bythe same analyst for the same firm;
REC_DIR ¼ 1 if REC_REV is larger than 0,�1 if REC_REV is smaller than 0, and 0 if REC_REV equals 0;EF_REV¼ earnings forecast revision, calculated as the current report’s earnings forecast minus the last earnings forecast
in I/B/E/S issued by the same analyst for the same firm’s same fiscal year, scaled by the stock price 50 days beforethe report date, winsorized at the top and bottom 1 percent;
EF_DIR ¼ 1 if EF_REV is larger than 0, �1 if EF_REV is smaller than 0, and 0 if EF_REV equals 0;TP_REV¼ target price revision, calculated as the current report’s target price minus the last target price in I/B/E/S issued
by the same analyst for the same firm, scaled by the stock price 50 days before the report date, winsorized at the topand bottom 1 percent;
TP_DIR ¼1 if TP_REV is larger than 0,�1 if TP_REV is smaller than 0, and 0 if TP_REV equals 0;PRIOR_CAR¼ cumulative ten-day abnormal returns ending before the current report date, where abnormal returns are
calculated as the raw return minus the buy-and-hold return on the NYSE/AMEX/NASDAQ value-weighted marketindex;
SIZE ¼ logarithm of the firm’s market value of equity; andBM ¼ firm’s book value of equity to its market value of equity.
Evidence on the Information Content of Text in Analyst Reports 2167
The Accounting ReviewNovember 2014

returns induced by a one standard deviation increase in EF_REV and TP_REV, both of which are 40basis points.18
We also estimate Equation (2) using a subsample of analyst reports that reiterate all the
quantitative summary measures. Since their revisions are all zero, we include their levels in the
regression instead. There are 67,123 such reports, making up 59.8 percent of the sample used in
Table 4. The untabulated results show that the coefficient on OPN remains highly significant at the
0.01 level and that the adjusted R2 increases from 0.05 percent to 0.92 percent after including OPNin the regression, suggesting that the information in the reiteration reports comes mostly from the
text rather than the quantitative summary measures. We further find that the economic magnitude of
OPN, measured as a one standard deviation increase of it results in an additional two-day abnormal
return of 29 basis points, is smaller than the 41 basis points of the overall sample, consistent with
the explanation that text is perceived as more informative in revision versus reiteration reports.19
To test H1b, we modify Equation (2) by including the interaction of OPN with each of the three
quantitative summary measures, REC_REV, EF_REV, and TP_REV, as well as the variable
indicating the corresponding measure’s revision direction, REC_DIR, EF_DIR, or EF_DIR. Therevision direction of recommendations, REC_DIR, equals 1 if REC_REV is positive, �1 if REC_REV is negative, and 0 otherwise. EF_DIR and TP_DIR are defined similarly:
CAR ¼ aþ b0OPN þ b1OPN3REC REV3REC DIRþ b2OPN3EF REV3EF DIRþ b3OPN3 TP REV3 TP DIRþ c1REC REV þ c2REC DIRþ c3REC DIR3REC REV þ c4EF REV þ c5EF DIRþ c6EF DIR3EF REV
þ c7TP REV þ c8TP DIRþ c9TP DIR3 TP REV þX
j
hj � Controlsj þ e: ð3Þ
According to H1b, the intensity of the market reaction to the favorable quantitative summary
measures is higher when OPN is higher; the intensity of the market reaction to the unfavorable
quantitative summary measures is higher when OPN is lower. That is, the effect of textual opinionson the intensity of the market reaction to the quantitative summary signals depends on the direction
of the quantitative summary signals. We include the revision direction variables, REC_DIR, EF_DIR, or TP_DIR, so that the predicted sign of b1, b2, and b3, respectively, is positive regardless ofthe direction of the quantitative summary measures.20
18 In an untabulated test, we replace OPN with the change in OPN from the last to the current report (DOPN) and re-estimate Equation (2). We find that the adjusted R2 decreases from 4.09 percent to 3.76 percent and that the economicmagnitude of DOPN, where a one standard deviation increase in DOPN increases the two-day abnormal returns by 27basis points, is one-third smaller than that of OPN, indicating that OPN provides greater explanatory power for marketreactions than does DOPN. This is probably because analysts describe in their text how the company has changedsince their last reports, so that the level measure, OPN, captures what is new. In an alternative specification, we defineDOPN0 as the current report’s OPN minus the consensus OPN (the average OPN of the reports issued by all otheranalysts for the same firm during the last 90 days), and our results are qualitatively the same. That is, the resultssupport H1a, but the statistical and economic significance of DOPN0 and the adjusted R2 of the regression are lowerthan those based on OPN.
19 As a sensitivity test, we estimate Equation (2) using the subsample of 45,181 analyst reports that revise any of thequantitative summary measures and find results similar to those reported in column (2) of Table 1. Specifically, OPNis positive and significant at the 1 percent level. The economic significance of OPN in revision reports is much higher(a one standard deviation increase adds 78 basis points to the two-day abnormal return) than that in the overallsample.
20 When the quantitative summary measure is favorable, such as an upward revision, the intensity of the market reactionis higher when OPN is higher. For example, the intensity of the market reaction to an upward earnings forecastrevision is ]CAR/]EF_REV¼ b2OPN þ c4 þ c6. When the quantitative summary measure is unfavorable, such as adownward revision, the intensity of the market reaction is higher when OPN is lower. For example, the intensity ofmarket reaction to a downward earnings forecast revision is ]CAR/]EF_REV ¼�b2OPN þ c4 � c6. Therefore, thepredicted sign of b1, b2, and b3 stays positive.
2168 Huang, Zang, and Zheng
The Accounting ReviewNovember 2014

Table 4, Panel B reports the results for Equation (3). We find that the estimated coefficients on
b1, b2, and b3 are positive and significant or marginally significant (p , 0.05, 0.01, and 0.1,
respectively), consistent with H1b. The coefficient on OPN is positive and significant (p , 0.01),
consistent with H1a. The combined evidence in this section suggests that analyst report text
provides both information on a ‘‘stand-alone’’ basis and also assists investors in interpreting the
quantitative summary measures.
Cross-Sectional Determinants of the Information Content of Analyst Report Text
H2a predicts that the market will exhibit asymmetric reactions to positive versus negative
opinions in analyst reports. To test this prediction, we replace OPN with both PCT_POS and
PCT_NEG in estimating Equation (2). The results, reported in column (3) of Table 4, Panel A,
show significant coefficients of 0.0129 and �0.0364 on PCT_POS and PCT_NEG, respectively(p , 0.01). These results indicate that investors place more than twice as much weight on
negative versus positive comments in analyst reports (an F-test confirms that the difference
between the magnitude of the two coefficients is significant at the 0.01 level). As discussed in
Section III, several theories could explain this result: (1) the market has less foreknowledge of
the unfavorable content in analyst reports because of managers’ incentives to delay bad news; (2)
investors recognize analysts’ conflicts of interest and consider their unfavorable comments more
credible; or (3) investors treat textual information as ambiguous because it is difficult to judge its
information quality, and, thus, they assume good news is unreliable and bad news is very
reliable.
H2b–H2f hypothesize five factors that might influence how investors use analyst report text:
(1) emphasis on nonfinancial topics (NONFIN) is measured as the percentage of sentences in the
report text that do not contain ‘‘$’’ or ‘‘%,’’ because analysts tend to discuss financial information
with dollar denomination or percentage changes;21 (2) assertiveness of text (ASSERTIVE) is
measured as the percentage of sentences in the report text that contain any of the words in the
strong modal word list developed by Loughran and McDonald (2011) to capture confident
expressions in financial text; (3) conciseness of text (CONCISE) is measured as �1 times the
estimated residual from regressing report length (LENGTH) on firm size (SIZE), book-to-market
ratio (BM), and the recent return of the firm (PRIOR_CAR), all of which control for the normal
length of the text;22 (4) bold signals in the headline (BOLD) are measured as an indicator variable
that equals 1 if the report contains an earnings forecast deviating from the consensus by at least
two standard deviations, and 0 otherwise; and (5) inconsistency in the headline (INCON) is
measured as an indicator variable that equals 1 if the report’s recommendation and earnings
forecast are revised in different directions (i.e., they are not both upgraded, downgraded, or
reiterated), and 0 otherwise.
To test H2b-H2f, we expand Equation (2) to include the economic factors that we identify and
their interaction terms with textual opinions:
21 To validate this measure, we randomly select 500 sentences that contain ‘‘$’’ or ‘‘%’’ and find that 81.4 percent ofthem are related to financial topics; we also randomly select 500 sentences that do not contain ‘‘$’’ or ‘‘%’’ and findthat 85.6 percent of them are related to nonfinancial topics. Using sentences containing a number other than thosedenoting a quarter or year as an alternative measure yields qualitatively similar results.
22 Following Li (2008), we use �1 times LENGTH as an alternative measure for textual conciseness and find similarresults.
Evidence on the Information Content of Text in Analyst Reports 2169
The Accounting ReviewNovember 2014

CAR ¼ a0 þ a1OPN þ b1OPN3NONFIN þ b2OPN3ASSERTIVE þ b3OPN3CONCISEþ b4OPN3BOLDþ b5OPN3 INCON þ b6OPN3BROKERSIZEþ b7OPN3 STARþ b8OPN3EXPRþ b9OPN3POSTFDþ a2REC REVþ a3EF REV þ a4TP REV þ c1NONFIN þ c2ASSERTIVEþ c3CONCISE þ c4BOLDþ c5INCON þ c6BROKERSIZEþ c7STARþ c8EXPRþ c9POSTFDþ c10PRIOR CARþ c11SIZEþ c12BM þ e:
ð4ÞIn Equation (4), we also control for the variables that may contribute to analyst forecast
performance and interact them with OPN. For example, Clement (1999) and Jacob, Lys, and Neale
(1999) suggest that larger brokerage houses provide more research support to analysts, which leads
to better forecasting performance. We measure broker size as the number of analysts issuing
earnings forecasts from this brokerage house (BROKERSIZE). Another factor that may impact
earnings forecast accuracy is the analyst’s star ranking. Prior research yields mixed results (Stickel
1992; Emery and Li 2009). To control for analyst ranking, we include an indicator variable, STAR,that equals 1 if the analyst is ranked as an II All-Star in the current year, and 0 otherwise. Several
prior studies show that forecasting performance is related to experience (Mikhail, Walther, and
Willis 1997; Clement 1999). We control for experience and measure it as the number of quarters an
analyst has been forecasting earnings (EXPR). Finally, we consider the effect of Reg FD, the
regulation that prohibits private communications between managers and analysts, on analysts’
forecast performance. Prior studies found mixed evidence on whether the informativeness of
analysts’ earnings forecasts and stock recommendations has changed since the enactment of Reg
FD (Francis, Nanda, and Wang 2006; Heflin, Subramanyam, and Zhang 2003). We include an
indicator variable that equals 1 if the report was issued in 2001 when Reg FD became effective or
later, and 0 otherwise (POSTFD).Table 5, Panel A provides the summary statistics for our report characteristic and control
variables included in Equation (4). On average, 64.7 percent of analyst report text is about
nonfinancial topics; 10 percent of text contains at least one word from Loughran and McDonald’s
(2011) strong modal list; 13.4 percent of the sample reports contain bold forecasts; 32.8 percent
contain inconsistent revisions in recommendations and earnings forecasts; 33 percent are issued by
star analysts; and 88.5 percent are announced post-Reg FD. The average broker size (95) suggests
that a large number of our sample reports are from large brokerage houses. The average analyst in
our sample has a forecasting experience of 31 quarters.
Table 5, Panel B reports the estimation results for Equation (4). The coefficients of interest are
those on the interaction terms. We find a positive and significant coefficient on OPN3NONFIN (p
, 0.01), consistent with H2b that investors find text that places more emphasis on nonfinancial
topics to be more informative. The positive and significant coefficients on OPN3ASSERTIVE and
OPN3CONCISE (both p , 0.1) are consistent with H2c and H2d, respectively; that is, investors
react more strongly to more assertive and more concise text. The positive and significant
coefficients on OPN 3 BOLD and OPN 3 INCON (both p , 0.01) indicate that investors place
more weight on the text when the headlines contain bold or inconsistent signals, thus supporting
H2e and H2f, respectively. We also find a significant and positive coefficient on OPN 3BROKERSIZE (p , 0.01), indicating that analysts who work for larger brokerage houses provide
more informative report text. Finally, the coefficients on OPN3 STAR, OPN3 EXPR, and OPN3POSTFD are statistically insignificant, indicating that the market does not react differently to text
written by star analysts or more experienced analysts, or text written after Reg FD.
Overall, our findings support H2a-H2f and suggest that analyst report text is more useful when
it conveys bad news, when it emphasizes nonfinancial topics more, when it is more assertive and
concise, and when the perceived validity of the report headlines is low.
2170 Huang, Zang, and Zheng
The Accounting ReviewNovember 2014

TABLE 5
Cross-Sectional Variation in the Information Content of Analyst Report Text
Panel A: Summary Statistics
# of Obs. Mean Median Std. Dev. 25% 75%
NONFIN 91,438 0.647 0.657 0.168 0.538 0.768
ASSERTIVE 91,438 0.103 0.086 0.089 0.040 0.147
CONCISE 91,438 �0.400 16.972 70.908 �10.146 32.697
BOLD 91,438 0.134 0.000 0.341 0.000 0.000
INCON 91,438 0.328 0.000 0.470 0.000 1.000
BROKERSIZE 91,438 94.786 107.000 57.882 48.000 134.000
STAR 91,438 0.330 0.000 0.470 0.000 1.000
EXPR 91,438 30.922 26.000 20.344 16.000 42.000
POSTFD 91,438 0.885 1.000 0.319 1.000 1.000
PRIOR_CAR 91,438 �0.002 0.000 0.080 �0.035 0.035
SIZE 91,438 9.796 9.709 1.193 8.928 10.649
BM 91,438 0.404 0.332 0.321 0.207 0.516
Panel B: Estimation Results of Equation (4)
Coefficients (t-stats)
OPN 0.0038 (0.71)
OPN 3 NONFIN 0.0142*** (3.34)
OPN 3 ASSERTIVE 0.0203* (1.84)
OPN 3 CONCISE 0.0388* (1.89)
OPN 3 BOLD 0.0157*** (5.07)
OPN 3 INCON 0.0082*** (3.66)
OPN 3 BROKERSIZE 0.0060*** (3.04)
OPN 3 STAR �0.0023 (�0.89)
OPN 3 EXPR �0.0000 (�0.74)
OPN 3 POSTFD �0.0041 (�1.07)
REC_REV 0.0110*** (9.91)
EF_REV 0.8373*** (6.84)
TP_REV 0.0438*** (10.01)
NONFIN �0.0048*** (�3.49)
ASSERTIVE �0.0004 (�0.15)
CONCISE �0.0067 (�1.47)
BOLD �0.0040*** (�4.23)
INCON �0.0024*** (�3.72)
BROKERSIZE �0.0000** (�1.98)
STAR 0.0005 (0.68)
EXPR 0.0000 (0.27)
POSTFD �0.0020 (�0.79)
PRIOR_CAR �0.0270** (�2.50)
SIZE �0.0009*** (�3.31)
BM 0.0016*** (3.18)
Intercept 0.0146*** (4.52)
# of Obs. 91,438
Adj. R2 4.04%
(continued on next page)
Evidence on the Information Content of Text in Analyst Reports 2171
The Accounting ReviewNovember 2014

VII. AN ADDITIONAL TEST
In our final set of analyses, we conduct a non-market-based test for the information content of
analyst report text by examining text’s ability to predict earnings growth (Penman 1992; Abarbanell
and Bushee 1997). Because a substantial amount of text is based on fundamental analysis, we
expect it to contain discussions about the value-drivers that analysts are likely to use in their
security valuation, including those about long-term fundamentals (Lev and Thiagarajan 1993; Lev
TABLE 5 (continued)
*, **, *** Indicates p , 0.1, p , 0.05, and p , 0.01, respectively.This table reports the estimation results of Equation (4): CAR ¼ a0 þ a1OPN þ b1OPN 3 NONFIN þ b2OPN 3ASSERTIVE þ b3OPN 3 CONCISE þ b4OPN 3 BOLD þ b5OPN 3 INCON þ b6OPN 3 BROKERSIZE þ b7OPN 3STARþ b8OPN3EXPRþ b9OPN3POSTFDþa2REC_REVþ a3EF_REVþ a4TP_REVþ c1NONFINþ c2ASSERTIVEþc3CONCISEþ c4BOLDþ c5INCONþ c6BROKERSIZEþ c7STARþ c8EXPRþc9POSTFDþ c10PRIOR_CARþ c11SIZEþ c12BM þ e.All regressions include industry and year fixed-effects; standard errors are estimated with a two-way cluster control at thefirm and analyst levels. The dependent variable is CAR, which is the cumulative two-day abnormal returns starting fromthe current report date, with abnormal returns calculated as the raw return minus the buy-and-hold return on the NYSE/AMEX/NASDAQ value-weighted market index.
Variable Definitions:OPN¼ textual opinions, calculated as the percentage of positive sentences minus the percentage of negative sentences in
the report as classified by the naıve Bayes approach;REC_REV¼ recommendation revision, calculated as the current report’s REC minus the last REC in I/B/E/S issued by
the same analyst for the same firm;EF_REV¼ earnings forecast revision, calculated as the current report’s earnings forecast minus the last earnings forecast
in I/B/E/S issued by the same analyst for the same firm’s same fiscal year, scaled by the stock price 50 days beforethe report date, winsorized at the top and bottom 1 percent;
TP_REV¼ target price revision, calculated as the current report’s target price minus the last target price in I/B/E/S issuedby the same analyst for the same firm, scaled by the stock price 50 days before the report date, winsorized at the topand bottom 1 percent;
NONFIN ¼ the percentage of sentences in reports that do not contain ‘‘$’’ or ‘‘%’’;ASSERTIVE ¼ the percentage of sentences in reports that contain any of the word in the strong modal word list from
Loughran and McDonald (2011);CONCISE ¼�1 times the residual from regressing report length (LENGTH) on firm size (SIZE), book-to-market ratio
(BM), and the recent return of the firm (PRIOR_CAR), the one used in Panel B is scaled by 1,000 to facilitateinterpretation;
BOLD¼ an indicator variable that equals 1 if the report’s earnings forecast is at least two standard deviations away fromthe 30-day consensus, and 0 otherwise;
INCON¼ an indicator variable that equals 1 if the report’s recommendation and earnings forecast are revised in differentdirections, and 0 otherwise;
BROKERSIZE ¼ number of analysts issuing earnings forecasts from this brokerage house, the one used in Panel B isscaled by 100 to facilitate interpretation;
STAR¼ an indicator variable that equals 1 if the analyst is an Institutional Investor All-Star analyst in the current year,and 0 otherwise;
EXPR ¼ number of quarters the analyst has been forecasting earnings according to I/B/E/S;POSTFD ¼ an indicator variable that equals 1 if the report is issued in 2001 or later;PRIOR_CAR¼ cumulative ten-day abnormal returns ending before the current report date, where abnormal returns are
calculated as the raw return minus the buy-and-hold return on the NYSE/AMEX/NASDAQ value-weighted marketindex;
SIZE¼ logarithm of the firm’s market value of equity; andBM¼ firm’s book value of equity to its market value of equity.
2172 Huang, Zang, and Zheng
The Accounting ReviewNovember 2014

and Nissim 2004).23 Therefore, we regress future earnings growth over the subsequent five years on
textual opinion and the quantitative summary measures:
GROWTHtþn ¼ aþ b1OPNt þ b2RECt þ b3EFt þ b4TPt þ b5ROAt þ b6SIZEt þ b7BMt þ e;
ð5Þwhere GROWTHtþn is measured as operating income from year tþn minus operating income in year
t, scaled by total assets in year t (Lev and Nissim 2004). In addition to the quantitative summary
measures, we include earnings performance in the previous year (ROAt) to control for mean-
reversion in profitability. We also control for firm size (SIZEt) and book-to-market ratio (BMt)
because these characteristics are likely to be associated with future earnings growth. The regression
is estimated with industry and year fixed-effects to control for industry- and economy-wide factors
that affect firms’ fundamental performance.
Table 6 reports the results based on Equation (5). It shows that OPN is significantly associated
with future earnings growth in the subsequent five years (p , 0.01), suggesting that analyst report
text has predictive power for both short- and long-term fundamentals beyond other information
signals included in the regression. This result corroborates the finding of the informativeness of text
inferred from investors’ reaction as described in Section VI. From Table 6, we also see that the
result of text stands in contrast to the results of earnings forecasts and target prices. The coefficients
on EF are insignificant or even significantly negative, indicating that the information contained in
earnings forecasts is very short-term.24 Furthermore, we find that the coefficients on TP are all
negative and mostly significant, suggesting that target price is a poor indicator of future earnings
growth. Similar to our findings for OPN, the results show that recommendation levels are
significantly and positively related to future earnings growth. However, this effect holds only until
the fourth year. In terms of economic significance, a one standard deviation increase in OPNpredicts an earnings increase of 3.40 percent of total assets in the subsequent five years, which is
considerably larger than the economic significance of recommendations: an increase of 1 in REC(for example, from SELL to HOLD or from HOLD to BUY) predicts a total earnings increase of
1.45 percent of total assets in the subsequent five years.
To find out whether positive and negative text has asymmetric predictive power for future
earnings growth, we replace OPN with PCT_POS and PCT_NEG and report the results in Table 6.
The result shows that both variables are correlated with future earnings growth in the expected
direction (p , 0.01). The total amount of earnings decreases in the subsequent five years predicted
by negative text is 99 percent larger than that of earnings increases predicted by the same amount of
positive text, which explains investors’ stronger reaction to negative than to positive text,
documented in Section VI.
Overall, the results in Table 6 reveal that text is the most useful component of analyst reports in
terms of the economic magnitude of earnings’ predictive power and the ability to predict earnings
growth over a longer horizon. These findings from our non-market-based test reveal the economic
23 Some examples of analyst reports’ analyses of long-term fundamentals include: ‘‘We believe Nucor’s uniquecombination of low-cost production of steel and steel products, innovative technology, creative labor andmanagement practices, vertical integration, and tremendous financial strength have positioned the company tocontinue to gain market share over the next five to 10 years’’ (report on Nucor, issued by G. S. Lucas from WellsFargo on 8/16/2000). ‘‘We believe that this transaction assures solid growth for Ecolab for the next 5–10 yearsthrough market share gain opportunities in the underpenetrated European market, and rollout of numerous U.S.products into Europe’’ (report on Ecolab, issued by G. Yang from Citigroup on 12/11/2000). ‘‘We believe slowerpopulation growth in Tenet’s two most important states over the next 10 years could have a negative impact on thecompany’s growth’’ (report on Tenet Healthcare, issued by G. Lieberman from Morgan Stanley on 3/5/2002).
24 In an untabulated test, we find that EF is positively associated with future earnings growth only in the subsequent twoquarters (significant at the 0.01 level) and not beyond.
Evidence on the Information Content of Text in Analyst Reports 2173
The Accounting ReviewNovember 2014

TABLE
6
PredictiveValueofAnalyst
Report
TextforFuture
EarningsGrowth
GROWTH
tþ1
GROWTH
tþ2
GROWTH
tþ3
GROWTH
tþ4
GROWTH
tþ5
GROWTH
tþ1
GROWTH
tþ2
GROWTH
tþ3
GROWTH
tþ4
GROWTH
tþ5
Coeff.
(t-stats)
Coeff.
(t-stats)
Coeff.
(t-stats)
Coeff.
(t-stats)
Coeff.
(t-stats)
Coeff.
(t-stats)
Coeff.
(t-stats)
Coeff.
(t-stats)
Coeff.
(t-stats)
Coeff.
(t-stats)
OPN
0.0256***
0.0359***
0.0390***
0.0357***
0.0346***
(13.14)
(11.20)
(9.95)
(7.60)
(6.10)
PCT_P
OS
0.0218***
0.0275***
0.0281***
0.0258***
0.0251***
(8.82)
(6.28)
(4.99)
(3.70)
(2.88)
PCT_N
EG
�0.0331***
�0.0525***
�0.0605***
�0.0555***
�0.0536***
(�8.69)
(�7.44)
(�6.14)
(�4.53)
(�3.78)
REC
0.0016***
0.0029***
0.0037***
0.0036**
0.0027
0.0015***
0.0027***
0.0034***
0.0034**
0.0025
(3.34)
(3.06)
(2.70)
(2.16)
(1.37)
(3.21)
(2.95)
(2.62)
(2.10)
(1.31)
EF
0.0003
�0.0007
�0.0013*
�0.0020*
�0.0020
0.0003
�0.0007
�0.0013*
�0.0020*
�0.0020
(1.15)
(�1.47)
(�1.73)
(�1.91)
(�1.55)
(1.14)
(�1.48)
(�1.73)
(�1.92)
(�1.55)
TP
�0.0000***
�0.0000***
�0.0000***
�0.0000
�0.0000*
�0.0000***
�0.0000***
�0.0000***
�0.0000
�0.0000*
(�3.35)
(�4.87)
(�4.02)
(�1.46)
(�1.73)
(�3.34)
(�4.83)
(�4.03)
(�1.52)
(�1.77)
ROAt
�0.3366***
�0.4493***
�0.4761***
�0.4112***
�0.3543***
�0.3363***
�0.4486***
�0.4752***
�0.4104***
�0.3535***
(�17.24)
(�10.68)
(�7.87)
(�5.40)
(�4.09)
(�17.22)
(�10.67)
(�7.85)
(�5.38)
(�4.07)
SIZE
0.0005
�0.0006
�0.0019
�0.0043
�0.0070*
0.0004
�0.0007
�0.0020
�0.0043
�0.0070*
(0.39)
(�0.31)
(�0.71)
(�1.29)
(�1.79)
(0.38)
(�0.33)
(�0.73)
(�1.31)
(�1.80)
BM
�0.0285***
�0.0420***
�0.0481***
�0.0535***
�0.0597***
�0.0285***
�0.0420***
�0.0481***
�0.0536***
�0.0598***
(�13.13)
(�11.05)
(�10.77)
(�9.81)
(�8.81)
(�13.13)
(�11.06)
(�10.78)
(�9.82)
(�8.81)
Intercept
0.0012
�0.0068
0.0109
0.0828***
0.1510***
0.0036
�0.0015
0.0174
0.0890***
0.1568***
(0.11)
(�0.38)
(0.48)
(2.99)
(4.64)
(0.33)
(�0.08)
(0.76)
(3.19)
(4.76)
#ofObs.
199,178
193,912
188,588
183,970
177,630
199,178
193,912
188,588
183,970
177,630
Adj.R2
30.97%
27.35%
23.05%
18.75%
17.26%
31.00%
27.40%
23.11%
18.79%
17.29%
(continued
onnext
page)
2174 Huang, Zang, and Zheng
The Accounting ReviewNovember 2014

TABLE
6(continued)
*,**,***Indicates
p,
0.1,p,
0.05,andp,
0.01,respectively.
Thistable
reportstheregressionresultsofEquation(5):GROWTHtþn¼
aþ
b 1OPNtþ
b 2RECtþ
b 3EFtþ
b4TPtþ
b 5ROAtþ
b 6SIZEtþ
b7BM
tþ
e.Allregressionsincludeindustry
andyearfixed-effects;standarderrors
areestimated
withatwo-w
aycluster
controlat
thefirm
andanalyst
levels.
Thedependentvariable
isGROWTHtþn,defined
astheoperatingincomein
yeartþn
minustheoperatingincomein
yeart,scaled
bythetotalassetsin
yeart.
Variable
Definitions:
PCT_P
OS¼
percentageofsentencesin
theanalystreportthat
areclassified
aspositivebythenaıveBayes
approach;
PCT_N
EG¼
percentageofsentencesin
theanalystreportthat
areclassified
asnegativebythenaıveBayes
approach;
OPN¼
textual
opinion,calculatedas
PCT_P
OS�
PCT_N
EG;
REC¼recommendationfrom
I/B/E/S,reordered
such
that
ahigher
valueindicates
amore
positiverecommendation(1:Sell;2:Underperform
;3:Hold;4:Buy;5:StrongBuy);
EF¼
earningsforecastfrom
I/B/E/S
scaled
bythestock
price
50daysbefore
thereportdate,
winsorizedat
thetopandbottom
1percent;
TP¼
target
price
from
I/B/E/S
scaled
bythestock
price
50daysbefore
thereportdate,
winsorizedat
thetopandbottom
1percent;
ROAt¼
operatingincomein
yeartscaled
bythetotalassetsin
yeart;
SIZE¼
logarithm
ofthefirm
’smarket
valueofequity;and
BM
¼firm
’sbookvalueofequityto
itsmarket
valueofequity.
Evidence on the Information Content of Text in Analyst Reports 2175
The Accounting ReviewNovember 2014

nature of the textual information in analyst reports and supplement the earlier finding of text’s
information content evaluated with reference to stock returns.
VIII. CONCLUSION
The emphasis that market participants place on analysts’ written reports greatly exceeds the
amount of effort researchers have made to understand them. The lack of empirical evidence on
analyst report text prevents the extant literature from developing a comprehensive understanding of
analysts’ information role. We use the naıve Bayes machine learning approach to address the
challenge of extracting information from a large volume of unstructured textual data. This approach
enables us to extract textual opinions from 363,952 analyst reports issued for S&P 500 firms,
providing the basis upon which to conduct tests on the information content of analyst report text.
We find that investors generally react to analyst report text conditional on the quantitative
summary measures issued contemporaneously and that the market reaction triggered by text is
economically significant. Moreover, investors react to the favorable (unfavorable) quantitative
summary measures more strongly when the textual opinion is more positive (negative), indicating
that text is also useful in helping investors interpret quantitative signals. A non-market-based test
indicates that text has predictive value for future earnings growth for up to five years, confirming its
informativeness. Our study also provides important insights into the cross-sectional determinants of
the information content of analyst report text. We show that investors find text more useful when it
conveys bad news, when it places more emphasis on nonfinancial topics, when it is written more
assertively and concisely, and when the perceived validity of other information signals in the
reports is low. Overall, we contribute to a better understanding of analysts’ information role by
providing the first large-sample evidence on the information content of analyst report text.
Finally, our finding that the naıve Bayes approach is more effective in extracting textual
opinions from analyst reports than dictionary-based methods has implications for future research in
this area, because using a less-effective technique understates the economic significance of textual
information.
REFERENCES
Abarbanell, J. S., and B. J. Bushee. 1997. Fundamental analysis, future earnings, and stock prices. Journal
of Accounting Research 35 (1): 1–24.
Altınkılıc, O., and R. S. Hansen. 2009. On the information role of analyst recommendations. Journal ofAccounting and Economics 48 (1): 17–36.
Altınkılıc, O., V. Balashov, and R. S. Hansen. 2013. Are analysts’ forecasts informative to the general
public? Management Science 59 (11): 2550–2565.
Antweiler, W., and M. Z. Frank. 2004. Is all that talk just noise? The information content of internet stock
message boards. Journal of Finance 59: 1259–1294.
Asquith, P., M. Mikhail, and A. S. Au. 2005. Information content of equity analyst reports. Journal of
Financial Economics 75: 245–282.
Barber, B. M., R. Lehavy, and B. Trueman. 2010. Ratings changes, ratings levels, and the predictive value
of analysts’ recommendations. Financial Management (Summer): 533–553.
Barth, M. E., M. B. Clement, G. Foster, and R. Kasznik. 1998. Brand values and capital market valuation.
Review of Accounting Studies 3: 41–68.
Bradley, D. J., J. Clarke, S. S. Lee, and C. Ornthanalai. 2014. Are analysts’ recommendations informative?
Intraday evidence on the impact of time stamp delays. Journal of Finance 69 (2): 645–673.
Bradshaw, M. 2002. The use of target prices to justify sell-side analysts’ stock recommendations.
Accounting Horizon 16 (1): 27–40.
2176 Huang, Zang, and Zheng
The Accounting ReviewNovember 2014

Bradshaw, M. 2009. Analyst information processing, financial regulation, and academic research. TheAccounting Review 84 (4): 1073–1083.
Bradshaw, M. 2011. Analysts’ Forecasts: What Do We Know After Decades of Work? Working paper,
Boston College.
Brav, A., and R. Lehavy. 2003. An empirical analysis of analysts’ target prices: Short-term informativeness
and long-term dynamics. Journal of Finance 58 (5): 1933–1968.
Call, A., S. Chen, and Y. H. Tong. 2013. Are analysts’ cash flow forecasts naıve extensions of their own
earnings forecasts? Contemporary Accounting Research 30 (2): 438–465.
Clement, M. B. 1999. Analyst forecast accuracy: Do ability, resources, and portfolio complexity matter?
Journal of Accounting and Economics 27: 285–303.Daniel, K. D., D. Hirshleifer, and S. H. Teoh. 2002. Investor psychology in capital markets: Evidence and
policy implications. Journal of Monetary Economics 49 (1): 139–209.
Das, S., C. B. Levine, and K. Sivaramakrishnan. 1998. Earnings predictability and bias in analysts’ earnings
forecast. The Accounting Review 73 (2): 277–294.
Das, S. R., and M. Y. Chen. 2007. Yahoo! for Amazon: Sentiment extraction from small talk on the web.
Management Science 53 (9): 1375–1388.
De Franco, G., O. Hope, D. Vyas, and Y. Zhou. 2014. Analyst report readability. Contemporary AccountingResearch (forthcoming).
Dhaliwal, D. S., O. Z. Li, A. Tsang, and Y. G. Yang. 2011. Voluntary nonfinancial disclosure and the cost
of equity capital: The initiation of corporate social responsibility reporting. The Accounting Review86 (1): 59–100.
Emery, D., and X. Li. 2009. An anatomy of all-star analyst rankings. Journal of Financial and QuantitativeAnalysis 44: 411–437.
Epstein, L. G., and M. Echneider. 2008. Ambiguity, information quality, and asset pricing. Journal ofFinance 63 (1): 197–228.
Ertimur, Y., J. Livnat, and M. Martikainen. 2003. Differential market reaction to revenue and expense
surprises. Review of Accounting Studies 8: 185–211.Francis, J., and L. Soffer. 1997. The relative informativeness of analysts’ stock recommendations and
earnings forecast revisions. Journal of Accounting Research 35 (2): 193–211.
Francis, J., D. Nanda, and X. Wang. 2006. Re-examining the effects of Regulation Fair Disclosure using
foreign listed firms to control for concurrent shocks. Journal of Accounting and Economics 41: 271–292.
Givoly, D., and J. Lakonishok. 1979. The information content of financial analysts’ forecasts of earnings:
Some evidence on semi-strong inefficiency. Journal of Accounting and Economics 1 (3): 165–185.
Givoly, D., C. Hayn, and R. Lehavy. 2009. The quality of analysts’ cash flow forecasts. The AccountingReview 84 (6): 1877–1911.
Gleason, C. A., and C. M. C. Lee. 2003. Analyst forecast revisions and market price discovery. TheAccounting Review 78 (1): 193–225.
Heflin, F., K. R. Subramanyam, and Y. Zhang. 2003. Regulation FD and the financial information
environment: Early evidence. The Accounting Review 78 (1): 1–37.
Henry, E. 2006. Market reaction to verbal components of earnings press releases: Event study using a
predictive algorithm. Journal of Emerging Technologies in Accounting 3: 1–19.
Hirshleifer, D., and S. H. Teoh. 2003. Limited attention, information disclosure, and financial reporting.
Journal of Accounting and Economics 36: 337–386.Hirst, D. E., L. Koonce, and P. Simko. 1995. Investor reactions to financial analysts’ research reports.
Journal of Accounting Research 33 (2): 335–351.
Hong, H., T. Lim, and J. C. Stein. 2000. Bad news travels slowly: Size, analyst coverage, and the
profitability of momentum strategies. Journal of Finance 55 (1): 265–294.
Huang, A., R. Lehavy, A. Zang, and R. Zheng. 2014. A Thematic Analysis of Analyst Information Discoveryand Information Interpretation Roles. Working paper, The Hong Kong University of Science and
Technology.
Institutional Investor. 2011. The Best Analysts of All Time. London, U.K.: Euromoney Institutional Investor.
Evidence on the Information Content of Text in Analyst Reports 2177
The Accounting ReviewNovember 2014

Irvine, P. J. A. 2001. Do analysts generate trade for their firms? Evidence from the Toronto stock exchange.
Journal of Accounting and Economics 30 (2): 209–226.
Ittner, C. D., and D. F. Larcker. 1998. Are nonfinancial measures leading indicators of financial
performance? An analysis of customer satisfaction. Journal of Accounting Research 36: 1–35.
Ivers, M. 1991. The Random House Guide to Good Writing. New York, NY: Random House.
Ivkovicı, Z., and N. Jegadeesh. 2004. The timing and value of forecast and recommendation revisions.
Journal of Financial Economics 73: 433–463.Jacob, J., T. Z. Lys, and M. A. Neale. 1999. Expertise in forecasting performance of security analysts.
Journal of Accounting and Economics 28: 51–82.Jegadeesh, N., J. Kim, S. D. Krische, and C. M. C. Lee. 2004. Analyzing the analysts: When do
recommendations add value? Journal of Finance 59 (3): 1083–1124.
Koehler, J. 1993. The influence of prior beliefs on scientific judgments of evidence quality. OrganizationalBehavior and Human Decision Processes 56: 28–55.
Kothari, S. P., S. Shu, and P. D. Wysocki. 2009. Do managers withhold bad news? Journal of AccountingResearch 47 (1): 241–276.
Lehavy, R., F. Li, and K. Merkley. 2011. The effect of annual report readability on analyst following and
the properties of their earnings forecasts. The Accounting Review 86 (3): 1087–1115.
Lev, B., and S. R. Thiagarajan. 1993. Fundamental information analysis. Journal of Accounting Research31 (2): 190–215.
Lev, B., and D. Nissim. 2004. Taxable income, future earnings, and equity values. The Accounting Review79 (4): 1039–1074.
Lewis, D. 1998. Naıve (Bayes) at forty: The independence assumption in information retrieval. Proceedingsof ECML-98, 10th European Conference on Machine Learning, No. 1398, 4–15.
Li, F. 2008. Annual report readability, current earnings, and earnings persistence. Journal of Accountingand Economics 45 (1): 221–247.
Li, F. 2010. The information content of forward-looking statements in corporate filings—A naıve Bayesian
machine learning approach. Journal of Accounting and Research 48 (5): 1049–1102.
Lin, H., and M. F. McNichols. 1998. Underwriting relationships, analysts’ earnings forecasts and
investment recommendations. Journal of Accounting and Economics 25: 101–127.Loughran, T., and B. McDonald. 2011. When is a liability not a liability? Textual analysis, dictionaries, and
10-Ks. Journal of Finance 66 (1): 35–65.
Lys, T., and S. Sohn. 1990. The association between revisions of financial analysts’ earnings forecasts and
security price changes. Journal of Accounting and Economics 13 (4): 341–363.
Manning, C. D., and H. Schutze. 1999. Foundations of Statistical Natural Language Processing.Cambridge, MA: MIT Press.
McNichols, M., and P. C. O’Brien. 1997. Self-selection and analyst coverage. Journal of AccountingResearch 35: 167–199.
Mercer, M. 2004. How do investors assess the credibility of management disclosures? Accounting Horizons18 (2): 185–196.
Mikhail, M., B. Walther, and R. Willis. 1997. Do security analysts improve their performance with
experience? Journal of Accounting Research 35: 131–166.
Miller, G. 2002. Earnings performance and discretionary disclosure. Journal of Accounting Research 40 (1):173–204.
Pang, B., and L. Lee. 2008. Opinion mining and sentiment analysis. Foundations and Trends in InformationRetrieval 2: 1–135.
Penman, S. H. 1992. Return to fundamentals. Journal of Accounting, Auditing and Finance 7 (4): 465–483.
Previts, G. J., R. J. Bricker, T. R. Robinson, and S. J. Young. 1994. A content analysis of sell-side financial
analyst company reports. Accounting Horizons 8 (2): 55–70.
Price, P. C., and E. R. Stone. 2004. Intuitive evaluation of likelihood judgment producers: Evidence for a
confidence heuristic. Journal of Behavioral Decision Making 17: 39–57.
Ramnath, S., S. Rock, and P. Shane. 2008. The financial analyst forecasting literature: A taxonomy with
suggestions for further research. International Journal of Forecasting 24 (1): 34–75.
2178 Huang, Zang, and Zheng
The Accounting ReviewNovember 2014

Sniezek, J. A., and L. M. Van Swol. 2001. Trust, confidence, and expertise in a judge-advisor system.
Organizational Behavior and Human Decision Processes 84 (2): 288–307.
SRI International. 1987. Investor Information Needs and the Annual Report. Morristown, NJ: Financial
Executives Research Foundation.
Stickel, S. 1992. Reputation and performance among security analysts. Journal of Finance 47: 1811–1836.Stocken, P. C., and R. E. Verrecchia. 2004. Financial reporting system choice and disclosure management.
The Accounting Review 79 (4): 1181–1203.
Twedt, B., and L. Rees. 2012. Reading between the lines: An empirical examination of qualitative attributes
of financial analysts’ reports. Journal of Accounting and Public Policy 31 (1): 1–21.
Verrecchia, R. E. 1983. Discretionary disclosure. Journal of Accounting and Economics 5: 179–194.Womack, K. L. 1996. Do brokerage analysts’ recommendations have investment value? Journal of Finance
51: 137–167.
Yu, H., and V. Hatzivassiloglou. 2003. Towards answering opinion questions: Separating facts from
opinions and identifying the polarity of opinion sentences. Proceedings of the 2003 Conference onEmpirical Methods in Natural Language Processing, Volume 10.
Zarnoth, P., and J. A. Sniezek. 1997. The social influence of confidence in group decision making. Journalof Experimental Social Psychology 33: 345–366.
APPENDIX A
Investext Analyst Reports and I/B/E/S Forecasts Matching Methodology
Here, we outline the approach we use to match the Investext analyst reports in our sample with
the I/B/E/S forecast data. Our first step in this process is to match the analyst-brokerage name
combinations in the two databases. After completing this step, we delete 65,265 reports from our
analyst report sample because we cannot locate their respective analyst-brokerage combinations in
I/B/E/S. This yields a sample of 16,091 analyst-brokerage name combinations obtained from the
Investext database and located in I/B/E/S. For these, we match companies that are covered by the
same combinations in both databases, using company tickers and names.
We then match specific reports to their corresponding forecasts in I/B/E/S. While Investext
organizes data at the report level, I/B/E/S organizes data at the valid forecast level. Thus, in I/B/E/S,
the only information that identifies the timing of a forecast (a stock recommendation, an earnings
forecast, or a target price) are its announcement date, on which the analyst revises her estimate, and
review date, which is the most recent date that I/B/E/S confirms this estimate as accurate. A forecast
is considered valid during the period from its announcement date until its review date. During this
period, multiple reports may be issued by the same analyst to reiterate the forecast; however, such
reports have no separate data entries in I/B/E/S. Therefore, we match a report with an I/B/E/S valid
forecast if the report date falls within the ‘‘matching window’’ in Figure 2, which is the window
FIGURE 2Matching between Investext’s Analyst Reports and I/B/E/S Forecasts
Evidence on the Information Content of Text in Analyst Reports 2179
The Accounting ReviewNovember 2014

from two days before the I/B/E/S forecast announcement date until two days after the I/B/E/S
forecast review date.
We then categorize all matched reports as either revision or reiteration reports. A report is
considered a revision report if the report date is within two days of the I/B/E/S forecast
announcement date because the announcement date is the date the analyst revised her forecasts. All
other reports are considered reiteration reports. We randomly select 100 reiteration reports and
confirm that they contain the same forecast numbers as in I/B/E/S.
2180 Huang, Zang, and Zheng
The Accounting ReviewNovember 2014


![The HKUST Institutional Repositoryrepository.ust.hk/ir/bitstream/1783.1-83645/1/PhysRevB.95.pdf · and in SP-STM work by von Bergmann et al. [29,30]. The MOKE hysteresis loops of](https://img.pdfslide.us/doc/110x75/5f5d57ce5aa223279c21976e/the-hkust-institutional-and-in-sp-stm-work-by-von-bergmann-et-al-2930-the-moke.jpg)