Embed Size (px)
Citation preview
RESEARCH REPORT
March 2013Prepared for The Heinz Endowments by R.H. White Consultants, LLC
Pittsburgh, PA
The Health Impacts of Pittsburgh Air Quality: A Review of the Scientific Literature, 1970 –2012

TABLE OF CONTENTS
Executive Summary 3
Introduction 7
Overview of Air Pollution Health Effects Science 8
Particulate Matter 10
Ozone 13
Hazardous Air Pollutants 14
Diesel Engine Exhaust 15
Benzene 15
Formaldehyde 16
Trichloroethene 17
Pittsburgh Air Quality 18
Criteria Air Pollutants 18
Hazardous Air Pollutants 19
Summary of Findings and Conclusions 21
Findings 21
Conclusions 26
Tables
Table 1Summary of PM Causal Determinations by Exposure Duration and Health Outcome 12
Table 2Causal Determination for Ozone Exposure and Health Outcomes 14
Table 3Summary of Pittsburgh Air Pollution and Health Studies 21
Table 4Pittsburgh Air Pollution and Mortality Studies 23
Table 5Pittsburgh Air Pollution and Cardiovascular and Pulmonary Morbidity Studies 24
Table 6Pittsburgh Air Pollution and Birth Outcomes Studies 25
Table 7Pittsburgh Air Toxics and Cancer and Non-Cancer Studies 26
Appendices
Appendix APittsburgh-related Air Pollution and Health Studies / Reports References 28
Appendix B
Studies / Reports with Non-reported Pittsburgh Air Pollution and Health Data 31
Appendix C
Additional References 33
Appendix D Summaries of Pittsburgh-related Air Pollution and Health Studies / Reports (Available online at www.heinz.org)
THE HEALTH IMPACTS OF PITTSBURGH AIR QUALITY: A REVIEW OF THE SCIENTIFIC LITERATURE, 1970–2012 3
his report provides the results of a literature search and review regarding scientific assessments of the relationship between current levels of outdoor air pollution in the Pittsburgh metropolitan area and human health impacts. Key findings of the report are as follows:
• While the days of darkened skies and air pollution emergencies have receded into history with respect to outdoor air quality for the Pittsburgh area, the U.S. Environmental Protection Agency (EPA) classifies the Pittsburgh-Beaver Valley Metropolitan Statistical Area as exceeding current National Ambient Air Quality Standards (NAAQS) for several criteria pollutants, most notably fine particulate matter (PM2.5, defined as particles ≤ 2.5 microns in diameter) and ozone. The region’s air also contains levels of toxic air pollutants that pose a public health concern.
• The current state-of-the-science with respect to methods for investigating the relationship of air pollutants to health outcomes has improved significantly over the past two decades. Epidemio logical
EXECUTIVE SUMMARYT
4 THE HEINZ ENDOWMENTS
studies have applied increasingly sophisticated statistical metho-dologies and have identified a broad range of serious health effects, with particular attention on particulate matter and ozone. The spectrum of adverse effects includes substantial premature death; hospitalizations and emergency department visits for those with cardiovascular and respiratory disease; long-term deficits in lung function development in children; exacerbation of asthma and other lung diseases; increased medication use; lung cancer (related to diesel particulates); development of asthma; and adverse birth outcomes, including fetal development and infant mortality. Many of these health outcomes have been examined with respect to Pittsburgh air quality.
• The expansion of scientific research regarding health effects of air pollution has also served to identify those most susceptible to adverse outcomes. The scope of populations at particular risk of suffering adverse health effects from exposure to air pollutants has broadened in recent years beyond the elderly, children, people with heart and lung disease and exercising adults, with emerging evidence of concern for people with diabetes, those living in poverty, the fetus, the obese and people with certain genetic factors.
• The EPA’s most current assessment of the relationship of premature death and other adverse health outcomes from PM2.5 and ozone, confirmed after review by its committee of external scientific advisors, finds no threshold or level of no risk that can be identified at the population level for these serious public health concerns. Increasing evidence from epidemiological and clinical studies, supported by animal toxicological studies, has provided insight into
EXECUTIVE SUMMARY
(CONTINUED)
THE HEALTH IMPACTS OF PITTSBURGH AIR QUALITY: A REVIEW OF THE SCIENTIFIC LITERATURE, 1970–2012 5
the potential biological mechanisms for these adverse health effects. This overall body of research documents that the risk of some of the most serious health effects remains even at levels well below the current national air quality standards for these pollutants.
• Assessment of the body of air pollution and health studies with published Pittsburgh-related health risks identified through this review provides largely consistent evidence that exposure to Pittsburgh air pollution levels has resulted in increased risk of adverse health effects. These health effects include premature death, particularly in the elderly population and those with existing lung and heart disease, exacerbation of lung and heart disease resulting in hospitalization and emergency department visits and adverse birth outcomes. Though air pollution levels in the studies almost uniformly reflect higher levels from the previous decade or earlier periods, the assessment of risks in the majority of these studies are expressed based on a standardized increase in air pollution levels (e.g., 10 µg/m3 daily PM2.5). The results of these studies, most of which are based on changes in short-term (acute) pollution exposures, remain valid for present-day air pollution levels in Pittsburgh given the current scientific understanding of a logarithmic (i.e., exponentially increasing) scale-based linear exposure-response relation ship (i.e., response is proportional to the exposure throughout the range of high to low exposure levels) down to very low levels for outdoor air pollutants such as PM2.5 and ozone. Numerous epidemio logical studies examining the relationship between increases in fine particulates and ozone with the most serious adverse health effects — such as premature death or hospitalization for heart or lung
6 THE HEINZ ENDOWMENTS
conditions — have not been able to identify a level of “no risk” (i.e., threshold), even at extremely low pollution levels. In addition, multi-city studies that capture the chronic health effects of long-term exposure to PM2.5 and ozone have found substantially larger risks for these serious health outcomes with pollution levels at or well below those currently experienced in Pittsburgh. Many of these studies include Pittsburgh data even if they did not report Pittsburgh-specific risk data in the published literature. Taken together, these findings indicate that exposure to these pollutants at or below current levels measured in Pittsburgh produces an increased risk of serious adverse health effects.
• Cancer and non-cancer risk estimates derived from analysis of contemporary levels of hazardous (toxic) air pollutants in the Pittsburgh area reach levels that exceed EPA’s regulatory risk targets. Levels of several hazardous air pollutants (acetaldehyde, benzene, 1,4-dichloro benzene, 1,3-butadiene, formaldehyde, carbon tetra-chloride, chloroform and tetrachloroethene) exceeded EPA’s one in one million cancer risk threshold at multiple monitoring sites. The lifetime additive cancer risk posed by 36 volatile organic air toxic compounds and diesel particulate matter considered in a recent study reached one in one thousand for Downtown Pittsburgh. Data from the 2005 EPA National Air Toxics Assessment (NATA) indicate that Allegheny County ranks in the top two percent in overall U.S. air pollution-related cancer risk and in the top two-tenths of one percent with respect to cancer risk from power plants and other large industrial sources.
EXECUTIVE SUMMARY
(CONTINUED)
THE HEALTH IMPACTS OF PITTSBURGH AIR QUALITY: A REVIEW OF THE SCIENTIFIC LITERATURE, 1970–2012 7
INTRODUCTION
In August 2012, The Heinz Endowments contracted with R.H. White Consultants, LLC to prepare a report based on a review and assessment of the scientific and technical literature regarding the impact of Pittsburgh’s outdoor air quality on public health. This document presents the results of that review and assessment. The overall structure of this project was guided by recommendations included in the World Health Organization document Evaluation and Use of Epidemiological Evidence for Environmental Health Risk Assessment (WHO 2000). The first component of this effort involved a search of the available scientific and technical literature that included data regarding the relationship between
ambient (outdoor) air quality in the Pittsburgh metropolitan area1 and health outcomes. The literature search involved using electronic search engines via the PubMed, Google Scholar, Web of Science and Scopus websites, with primary search terms “Pittsburgh air pollution health” and variations on these terms (e.g., “air quality” instead of “air pollution”). In addition to research articles published in the peer- reviewed literature, the assessment included technical reports that used commonly accepted analytical methodology and provided specific data on health impacts or risks from Pittsburgh air pollution levels. In cases where identical data were available in both a report and a peer-reviewed literature article, only the peer-reviewed article was selected for inclusion in this report to avoid duplication. Studies and reports identified through the literature search and included in the assessment were limited to those published post-1970 to ensure relevance to modern air pollution levels experienced in the Pittsburgh area. Second, a qualitative weight-of-evidence assessment was undertaken for the body of studies and reports identified through the literature review. As discussed in the Summary of Findings and Conclusions section of this report, the identified studies and reports were organized according to major health outcome categories. Criteria used to determine inclusion of epidemiological studies in this assessment and to evaluate the scientific evidence used to inform the report conclusions were based on Herz-Picciotto (1995) regarding the use of epidemiological studies for application in quantitative risk assessment, as well as scientific assessment criteria from the EPA 2009 Integrated Scientific Assessment for Particulate Matter (EPA 2009), the WHO 2000 epidemiological evidence document cited above, and from recommendations of the 2010 State-of-the-Science Workshop: Evaluation of Epidemiological Data Consistency for Application in Regulatory Risk Assessment (White et al., 2012, accepted for publication). These criteria were as follows: 1) study population adequately selected and whether a positive association was identified; 2) strong biases ruled out or unlikely; 3) confounding factors controlled or likely to be limited; 4) quality of exposure assessment; and 5) biological basis indicated for identified health outcome. Multi-city epidemiological studies that found a positive and statistically significant association between air pollutant exposure and health outcomes for Pittsburgh, as well as in the overall multi-city analysis, were given increased weight in developing the conclusions of this evaluation.
1 Study areas typically included the Pittsburgh Metropolitan Statistical Area (MSA) as defined by the U.S. Census Bureau (Allegheny, Armstrong, Beaver, Butler, Fayette, Washington and Westmoreland counties), but also included studies limited to Allegheny County (City of Pittsburgh and surrounding municipalities).
8 THE HEINZ ENDOWMENTS
OVERVIEW OF AIR POLLUTION HEALTH EFFECTS SCIENCE
Scientific understanding of the health effects associated with exposure to outdoor air pollution has improved significantly in the more than 40 years since passage of the Clean Air Act Amendments of 1970 (hereafter referred to as the Clean Air Act or CAA). A substantial body of new information regarding the health effects of air pollution, especially related to ozone, carbon monoxide and sulfur dioxide, was developed in the 1970s and 1980s. Much of this new information resulted from human clinical studies in which voluntary human subjects were exposed to specific air pollution levels in test chambers to observe health outcomes, as well as from human field studies in which
people’s responses to monitored air pollution levels are assessed “in the field.” These clinical and field studies produced important information on the effect of ozone on exacerbation of asthma in children and respiratory symptoms in healthy exercising adults; the impact of carbon monoxide exposure on onset of angina in people with coronary heart disease; and the ability of short-term exposure to low levels of sulfur dioxide to rapidly induce asthma attacks. Results from more recent clinical chamber studies of the effect of ozone on adult lung function and other respiratory outcomes have provided important information for revising the ozone NAAQS. While the first two decades after the passage of the CAA produced important new research on air pollution health effects, the past quarter-century has produced a dramatic improvement in the scientific understanding of the effects of exposure to air pollutants at significantly lower levels. Further, a large body of epidemiological evidence supported by animal toxicological studies has developed regarding the effects of fine particles on the cardiovascular system. The animal toxicology studies provide information on the potential biological mechanisms for understanding the air pollution risks of premature deaths and heart-related hospital and emergency department admissions. Last, a body of epidemiological evidence has emerged linking exposure to particulate matter, carbon monoxide and nitrogen dioxide to a variety of adverse birth outcomes, including fetal development and infant mortality. These advances in the air pollution health effects field have been driven in part by the dynamic expansion in the development and application of epidemiological methods for relating air pollution exposures to health outcomes. Over the past two decades, epidemiological studies conducted primarily by academic researchers, especially regarding exposure to particulate matter and more recently ozone and other criteria pollutants, accelerated at a rapid rate and now number in the several hundred. This period of air pollution and health epidemiological research produced results from large multi-city population cohorts to assess health outcomes prospectively (e.g., the Harvard Six Cities and American Cancer Society II studies); the creation of large multi-city databases with information on deaths, hospital admissions and related health outcomes and their relationship to air pollution exposures (e.g., the National Morbidity, Mortality and Air Pollution Study and Harvard University multi-city studies); and the development of new, sophisticated statistical methods for analyzing the results of these new sources of data (e.g., generalized additive models applied to air pollution and health outcomes over multi-year time periods, Bayesian hierarchical models applied to multi-city studies, combined analyses of multiple pollutants and assessment of multi-day exposure periods). The controversy surrounding the EPA’s 1997 decision to establish a fine particulate standard, which placed substantial emphasis on the results of the Dockery et al.
THE HEALTH IMPACTS OF PITTSBURGH AIR QUALITY: A REVIEW OF THE SCIENTIFIC LITERATURE, 1970–2012 9
1993 Harvard Six Cities and the Pope et al., 1995 American Cancer Society (ACS) epidemiological studies, resulted in substantial funding for the establishment of a multi-year research program on the health effects of particulate matter driven by recommendations from the National Research Council Committee on Research Priorities for Airborne Particulate Matter.2
The advances in epidemiological study design and analytical methods were significant in addressing several issues that had been highlighted by critics of previous air pollution epidemiological studies. For example, data from large cohort studies used for prospective analysis included information on individual characteristics such as smoking status and occupation that could be accounted for in analyses to address concerns that health outcome results were influenced (“confounded”) by smoking and/or exposure to occupational pollutants. The large multi-year cohort studies prospectively assess the effects of multiple years of exposure to air pollution rather than the impact of daily changes, and thus capture the long-term effects of exposure to pollution. Results of these studies found substantially higher risks associated with similar increases in particulate matter air pollution levels when compared to daily time-series assessments. For example, analysis of long-term (1994–1998) air pollution exposure in a cohort of post-menopausal women included in the Women’s Health Initiative Observational Study, which included women from Pittsburgh, found a 24 percent increase in the risk of a cardiovascular event (e.g., heart attack, stroke) and a 76 percent increase in the risk of death from cardiovascular disease for a 10 µg/m3 increase in PM2.5 levels (Miller et al., 2007). An analysis of the relationship between PM2.5 exposure and premature death for women enrolled in the Nurses’ Health Study (which includes nurses in Pennsylvania) found a 26 percent increase in all-cause death and a 102 percent increase in coronary heart disease-related death for a 10 µg/m3 increase in PM2.5 levels (Puett et al., 2009). These risks are approximately tenfold higher than those found for similar health outcomes in the short-term studies. More recently, an analysis of the effect of recent (2000–2007) reductions in PM2.5 levels for the 545 counties included in the ACS cohort, including counties in the Pittsburgh metropolitan area, found that a 10 µg/m3 decrease in PM2.5 levels was associated with an increase in mean life expectancy of 0.35 years. In counties with high population densities (>200 people/square mile), such as Allegheny County, the increase in mean life expectancy more than doubled to 0.72 years and increased to almost one year in counties with primarily urban residences (Correia et al., 2013). A recent Canadian study (Crouse et al., 2012) found a 31 percent increase in the risk of death from ischemic heart disease for a 10 µg/m3 increase in PM2.5 levels even at low PM2.5 levels (mean 8.7 µg/m3, median 7.4 µg/m3). The use of large multi-city studies provided additional statistical power when analyzing results for changes in daily health outcomes such as premature mortality, which are small numbers for individual cities, typically analyzed over several years (known as time-series studies). The application of Bayesian hierarchical models in large multi-city studies took advantage of the statistical power from other cities using pooled data estimates. In addition, the use of consistent statistical models for a large number of cities addressed the issue of publication bias — whereby academic journals are more likely to publish the results of studies that indicate a positive association — as these studies with large numbers of cities have the potential to provide both negative and positive associations. Other advances in epidemiological methods during this period included the use of case-crossover designs, in which air pollution levels are assessed at standardized periods before, after and during the time of a health outcome event (e.g., cardiovascular hospitalization) so that all other aspects of the
2 National Research Council Committee on Research Priorities for Airborne Particulate Matter, Research Priorities for Airborne Particulate Matter I: Immediate Priorities and a Long-Range Research Portfolio, National Academy Press, 1998.
10 THE HEINZ ENDOWMENTS
individual’s characteristics remain the same except for their air pollution exposure. More precise estimates of individual levels of chronic exposure to air pollutants were made possible by advances in exposure assessment methods that incorporate spatial and spatiotemporal models. Other exposure assessment advances have allowed researchers to investigate the health impacts of specific air pollution sources (e.g., traffic, power plants and other industrial sources, wood smoke). Studies using these more advanced types of exposure assessment methods have generally found higher air pollution risks when compared with results from studies using less precise exposure assessment methods (e.g., Jerrett et al., 2005). To identify which pollutant(s) in the urban air pollution mixture was responsible for observed health effects, epidemiological studies analyzed the results of exposure to several pollutants simul-taneously to assess whether the inclusion of one or more additional pollutants affected the results found when only one pollutant at a time was assessed. Studies also examined the same data set using various statistical models (e.g., generalized additive models, natural spline models) to explore the potential impact on study results from the selection of different statistical approaches. Researchers also began to investigate whether different exposure periods were associated with changes in the findings of health outcomes, with generally consistent findings that the use of multi-day exposure periods prior to the health outcome event (“distributed lags”) produced larger relative risks when compared to exposures on the same day or just prior to the health outcome event. Support for the epidemiological study findings regarding the effect of particulate matter on cardiovascular-related premature death and other cardiovascular health outcomes was provided by numerous human clinical and animal toxicological studies documenting adverse changes in outcomes such as heart rate variability, increases in systemic inflammation and oxidative stress. A summary review of scientific and regulatory information regarding those air pollutants that received the greatest attention in the Pittsburgh air quality and health literature reviewed for this report (particulate matter, ozone and selected hazardous air pollutants presenting the highest risks to the Pittsburgh population) is presented below.
PARTICULATE MATTER
The Clean Air Act requires that EPA review, and if necessary, revise the National Ambient Air Quality Standards at no more than five-year intervals to ensure that they reflect the most current health science and protect public health with an “adequate margin of safety.”3 This process entails an extensive review and compilation by EPA of the most current scientific information regarding pollution levels, composition, as well as health and environmental effects. The CAA also requires that the EPA Clean Air Scientific Advisory Committee (CASAC) review these scientific compilations and provide input and recommendations regarding both the scientific evidence and the adequacy of the national air quality standards to protect public health and the environment. EPA completed its review of the scientific evidence regarding the adequacy of the 1997 particulate matter standard in 2006 (missing the five-year review cycle requirement by four years) and maintained the 1997 annual PM2.5 standard of 15 µg/m3, while lowering the daily PM2.5 standard from 65 µg/m3 to 35 µg/m3. However, the decision to maintain the 1997 annual PM2.5 standard of 15 µg/m3 contravened the recommendation from the CASAC to revise the annual PM2.5 standard to a level of 13–14 µg/m3 and consider a revised daily standard of 30 µg/m3 if the higher annual standard was selected (Henderson 2005). EPA’s 2006 decision
3 Clean Air Act Amendments of 1970, Section 109(b)(1)
OVERVIEW OF AIR POLLUTION
HEALTH EFFECTS SCIENCE
(CONTINUED)
THE HEALTH IMPACTS OF PITTSBURGH AIR QUALITY: A REVIEW OF THE SCIENTIFIC LITERATURE, 1970–2012 11
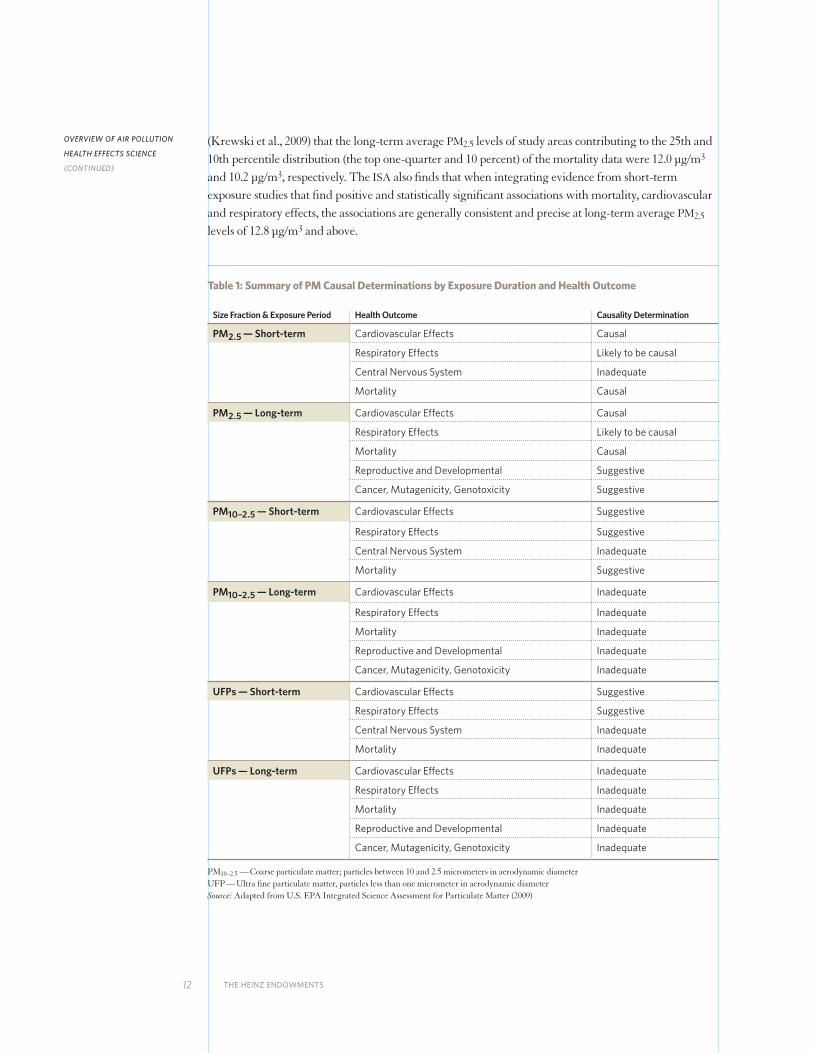
was challenged in court by environmental groups, public health advocates and some states, as well as by industry litigants. In 2009, the U.S. Court of Appeals found the EPA’s rationale for maintaining the PM2.5 annual standard to be deficient and sent the 2006 PM2.5 standards back to EPA for reconsideration.4 In 2009, the EPA initiated a review of both the 2006 PM NAAQS and the 2008 ozone NAAQS, leading to updated science and policy assessments, as well as new CASAC reviews of the science and recommen-dations regarding revision of the NAAQS. On January 15, 2013, EPA published announcement of the revised PM2.5 annual NAAQS at the 12 µg/m3 level. This level was consistent with the CASAC’s updated recommendation for the PM2.5 annual standard (Samet 2010), which lowers its recommended range for the PM2.5 annual standard (11 µg/m3–13 µg/m3) from the 2005 recommendation and supports the proposed EPA staff recommendation, while retaining the existing 24-hour PM2.5 and PM10 (PM10, defined as particles ≤ 10 microns in diameter) standards (EPA 2013). A broad spectrum of adverse health effects has been identified in scientific studies regarding exposure to particulate matter. These effects include: premature non-accidental deaths, deaths related to cardiovascular and respiratory disease and infant mortality; increased hospital admissions and emergency department visits related to cardiovascular and respiratory disease; increased risk of respiratory infections such as pneumonia; higher frequency of asthma attacks and increased use of asthma medication; reduced lung function; increased risk of adverse birth outcomes including premature births; and increased absences from school or work and poor quality of life related to restricted activity days. For its most recent review of the health science regarding human exposure to particulate matter pollution undertaken for the current review of the national particulate matter air quality standard, the EPA developed a several hundred-page document that compiled, summarized and assessed the current state of knowledge from epidemiological, clinical and toxicological studies. This document, the 2009 Integrated Environmental Assessment for Particulate Matter (ISA), was subject to extensive review and comment by the EPA CASAC and the public. Table 1 provides a summary of EPA’s causal determination findings regarding the relationship of various particulate matter sizes, exposure periods and categorical health outcomes. Causal determinations are classification categories based on EPA’s assessment of the strength of scientific information regarding the relationship of pollutant exposure to health outcome. The 2009 EPA PM ISA identified children, the elderly, people with pre-existing heart and respiratory disease and those with low socioeconomic status as particularly at risk of health effects from particulate matter exposure. The ISA also cites emerging evidence that infants, the developing fetus, people with diabetes, those who are obese and people with certain genetic factors may also be at particular risk. The American Lung Association State of the Air 2012 report (ALA 2012) notes that more than 52 million children (age <18 years); nearly 27 million elderly (age ≥65 years); more than 53 million people with cardiovascular disease; more than 10 million people with chronic bronchitis and/or emphysema; more than 14 million adults and four million children with asthma; more than 14 million people with diabetes; and more than 32 million people living in poverty reside in 643 U.S. counties with PM2.5 monitors. Of the nearly 218 million people living in counties with PM2.5 monitors, more than 49 million (~23 percent) live in areas where air quality received an “F” grade for unhealthy air quality from the ALA. Of particular significance is the determination in the ISA that there is no evidence of a population-level threshold below which no adverse health effects will occur for either long-term or short-term PM2.5 exposures. The ISA cites findings from the one long-term PM2.5 study that analyzed health event data
4 American Farm Bureau Federation v. EPA, 559 F. 3rd 512, 520–527 (D.C. Cir. 2009)
12 THE HEINZ ENDOWMENTS
(Krewski et al., 2009) that the long-term average PM2.5 levels of study areas contributing to the 25th and 10th percentile distribution (the top one-quarter and 10 percent) of the mortality data were 12.0 µg/m3 and 10.2 µg/m3, respectively. The ISA also finds that when integrating evidence from short-term exposure studies that find positive and statistically significant associations with mortality, cardiovascular and respiratory effects, the associations are generally consistent and precise at long-term average PM2.5 levels of 12.8 µg/m3 and above.
Table 1: Summary of PM Causal Determinations by Exposure Duration and Health Outcome
Size Fraction & Exposure Period Health Outcome Causality Determination
PM2.5 — Short-term Cardiovascular Effects Causal
Respiratory Effects Likely to be causal
Central Nervous System Inadequate
Mortality Causal
PM2.5 — Long-term Cardiovascular Effects Causal
Respiratory Effects Likely to be causal
Mortality Causal
Reproductive and Developmental Suggestive
Cancer, Mutagenicity, Genotoxicity Suggestive
PM10–2.5 — Short-term Cardiovascular Effects Suggestive
Respiratory Effects Suggestive
Central Nervous System Inadequate
Mortality Suggestive
PM10–2.5 — Long-term Cardiovascular Effects Inadequate
Respiratory Effects Inadequate
Mortality Inadequate
Reproductive and Developmental Inadequate
Cancer, Mutagenicity, Genotoxicity Inadequate
UFPs — Short-term Cardiovascular Effects Suggestive
Respiratory Effects Suggestive
Central Nervous System Inadequate
Mortality Inadequate
UFPs — Long-term Cardiovascular Effects Inadequate
Respiratory Effects Inadequate
Mortality Inadequate
Reproductive and Developmental Inadequate
Cancer, Mutagenicity, Genotoxicity Inadequate
PM10–2.5 — Coarse particulate matter; particles between 10 and 2.5 micrometers in aerodynamic diameterUFP — Ultra fine particulate matter, particles less than one micrometer in aerodynamic diameter Source: Adapted from U.S. EPA Integrated Science Assessment for Particulate Matter (2009)
OVERVIEW OF AIR POLLUTION
HEALTH EFFECTS SCIENCE
(CONTINUED)
THE HEALTH IMPACTS OF PITTSBURGH AIR QUALITY: A REVIEW OF THE SCIENTIFIC LITERATURE, 1970–2012 13
OZONE
In a process similar to that described above for review of the particulate matter NAAQS, the EPA is currently engaged in a review of the adequacy of the national air quality standard for ozone. EPA’s previous review of the ozone standard, completed in 2008, lowered the health-based 8-hour average standard from 0.085 parts per million (ppm) to 0.075 ppm. While this change represented a strength-ening of the ozone standard, the level selected was inconsistent with the EPA CASAC recommendation for a revised health-based standard set between 0.060–0.070 ppm based on its assessment of the available health science (Henderson 2008). As was the case with the 2006 PM standard, EPA’s revised ozone standard was challenged in court by environmental and public health groups, states and industry. At EPA’s request, this litigation was held in abeyance, and in January 2010, EPA announced its intent to reconsider the previous ozone NAAQS decision. In September 2011, the Office of Management and Budget returned to EPA its draft final rule regarding the reconsideration. EPA decided to coordinate the reconsideration with its regular ongoing NAAQS review, which by CAA requirements would be due in 2013.5
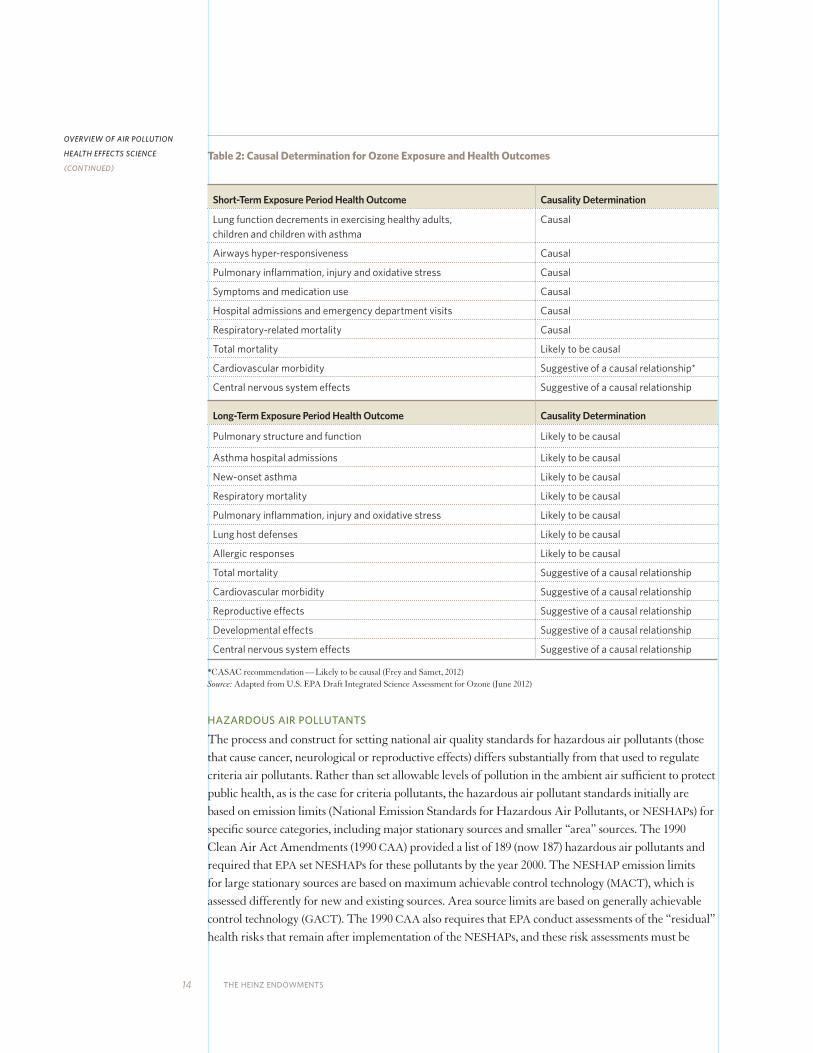
Epidemiological evidence from studies published over the past two decades has expanded the scope of health outcomes associated with exposure to ozone beyond previously identified effects, such as exacerbation of asthma and impairment of lung function and respiratory symptoms in healthy, exercising adults. Of particular concern was an increasing body of evidence that ozone exposure is related to the increase risk of non-accidental and cardiopulmonary-related premature death. Table 2 summarizes the current EPA causal determinations for ozone exposure and health outcomes. Recent clinical chamber studies have found adverse respiratory effects on healthy, young adult test subjects at ozone exposures as low as 0.060 ppm (Adams 2006, Schelegle et al., 2009). These studies, as well as re-analyses of the clinical data and epidemiological studies indicating increased mortality risk, were a key basis for the recommendation by CASAC and EPA’s draft 2011 proposal to strengthen the national ozone standard. EPA has determined that there is no identifiable population-level threshold for the morbidity and mortality effects related to ozone exposure identified by human controlled clinical, as well as epidemiological studies. As is the case for PM2.5 health science, uncertainty regarding the exposure-response relationship increases at very low ozone levels considered at or close to natural background concentrations (0.020–0.040 ppm). Specifically, EPA’s assessment of the recent ozone health science notes the clinical study evidence supports a finding of “a smooth C-R [concentration-response] curve without indication of a threshold in young adults exposed during moderate exercise for 6.6 hours to ozone concentrations between 40 and 120 ppb [parts per billion] O3 [ozone]” (EPA 2012a). With respect to the evaluation of epidemiological studies examining the relationship of ozone exposure and premature death, the EPA science review finds that the epidemiological studies “do not provide evidence for the existence of a threshold within the range of 24-hour average O3 concentrations most commonly observed in the U.S. during the ozone season (i.e., above 20 ppb)” (EPA 2012a).
5 As a result of the EPA decision, the litigation is no longer in abeyance and is proceeding with the 2008 NAAQS remaining in effect.
14 THE HEINZ ENDOWMENTS
Table 2: Causal Determination for Ozone Exposure and Health Outcomes
Short-Term Exposure Period Health Outcome Causality Determination
Lung function decrements in exercising healthy adults, children and children with asthma
Causal
Airways hyper-responsiveness Causal
Pulmonary inflammation, injury and oxidative stress Causal
Symptoms and medication use Causal
Hospital admissions and emergency department visits Causal
Respiratory-related mortality Causal
Total mortality Likely to be causal
Cardiovascular morbidity Suggestive of a causal relationship*
Central nervous system effects Suggestive of a causal relationship
Long-Term Exposure Period Health Outcome Causality Determination
Pulmonary structure and function Likely to be causal
Asthma hospital admissions Likely to be causal
New-onset asthma Likely to be causal
Respiratory mortality Likely to be causal
Pulmonary inflammation, injury and oxidative stress Likely to be causal
Lung host defenses Likely to be causal
Allergic responses Likely to be causal
Total mortality Suggestive of a causal relationship
Cardiovascular morbidity Suggestive of a causal relationship
Reproductive effects Suggestive of a causal relationship
Developmental effects Suggestive of a causal relationship
Central nervous system effects Suggestive of a causal relationship
*CASAC recommendation — Likely to be causal (Frey and Samet, 2012)Source: Adapted from U.S. EPA Draft Integrated Science Assessment for Ozone (June 2012)
HAZARDOUS AIR POLLUTANTS
The process and construct for setting national air quality standards for hazardous air pollutants (those that cause cancer, neurological or reproductive effects) differs substantially from that used to regulate criteria air pollutants. Rather than set allowable levels of pollution in the ambient air sufficient to protect public health, as is the case for criteria pollutants, the hazardous air pollutant standards initially are based on emission limits (National Emission Standards for Hazardous Air Pollutants, or NESHAPs) for specific source categories, including major stationary sources and smaller “area” sources. The 1990 Clean Air Act Amendments (1990 CAA) provided a list of 189 (now 187) hazardous air pollutants and required that EPA set NESHAPs for these pollutants by the year 2000. The NESHAP emission limits for large stationary sources are based on maximum achievable control technology (MACT), which is assessed differently for new and existing sources. Area source limits are based on generally achievable control technology (GACT). The 1990 CAA also requires that EPA conduct assessments of the “residual” health risks that remain after implementation of the NESHAPs, and these risk assessments must be
OVERVIEW OF AIR POLLUTION
HEALTH EFFECTS SCIENCE
(CONTINUED)
THE HEALTH IMPACTS OF PITTSBURGH AIR QUALITY: A REVIEW OF THE SCIENTIFIC LITERATURE, 1970–2012 15
conducted within eight years after adoption of the standards. If the residual risk assessment indicates that the remaining health risks to the most exposed persons exceed one in ten thousand, or one in one million for a broader exposed population, a second round of emission limits is required to ensure the “ample margin of safety” required by Section 112 of the 1990 CAA. The EPA conducts assessments of the scientific basis for determining the health risks for chemicals, including those listed as hazardous air pollutants. The results of these scientific assessments are included in the EPA’s Integrated Risk Information System (IRIS) database.
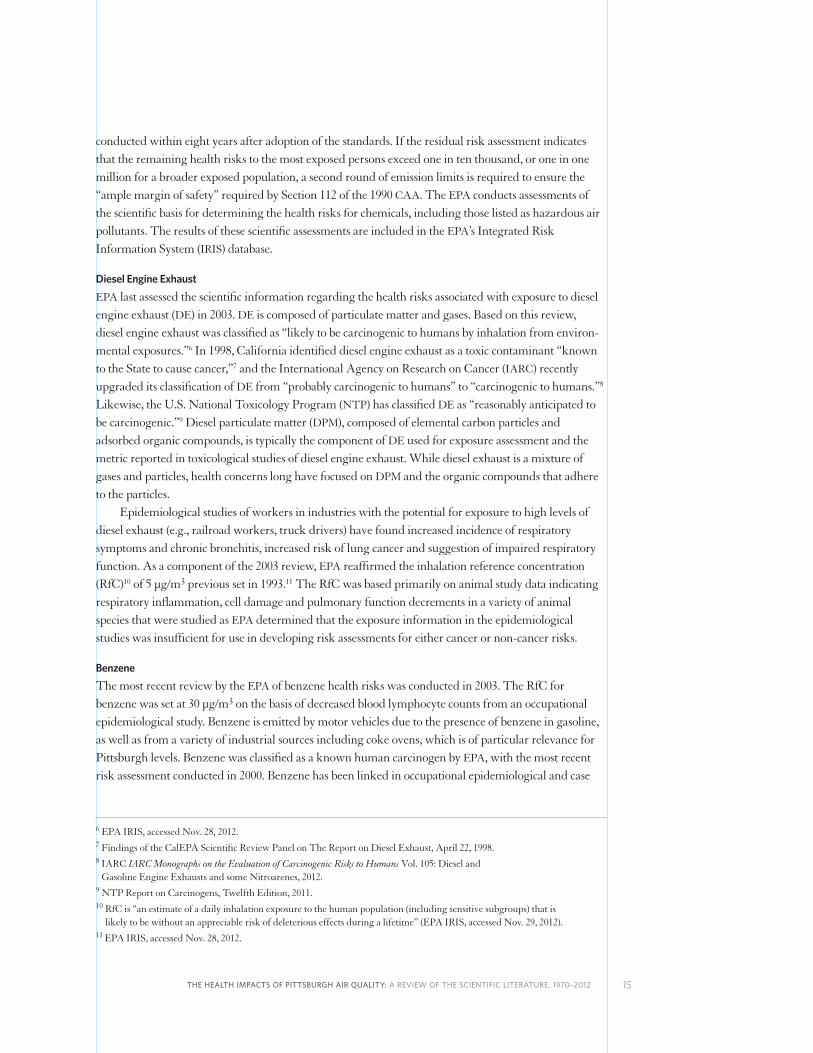
Diesel Engine ExhaustEPA last assessed the scientific information regarding the health risks associated with exposure to diesel engine exhaust (DE) in 2003. DE is composed of particulate matter and gases. Based on this review, diesel engine exhaust was classified as “likely to be carcinogenic to humans by inhalation from environ-mental exposures.”6 In 1998, California identified diesel engine exhaust as a toxic contaminant “known to the State to cause cancer,”7 and the International Agency on Research on Cancer (IARC) recently upgraded its classification of DE from “probably carcinogenic to humans” to “carcinogenic to humans.”8 Likewise, the U.S. National Toxicology Program (NTP) has classified DE as “reasonably anticipated to be carcino genic.”9 Diesel particulate matter (DPM), composed of elemental carbon particles and adsorbed organic compounds, is typically the component of DE used for exposure assessment and the metric reported in toxicological studies of diesel engine exhaust. While diesel exhaust is a mixture of gases and particles, health concerns long have focused on DPM and the organic compounds that adhere to the particles. Epidemiological studies of workers in industries with the potential for exposure to high levels of diesel exhaust (e.g., railroad workers, truck drivers) have found increased incidence of respiratory symptoms and chronic bronchitis, increased risk of lung cancer and suggestion of impaired respiratory function. As a component of the 2003 review, EPA reaffirmed the inhalation reference concentration (RfC)10 of 5 µg/m3 previous set in 1993.11 The RfC was based primarily on animal study data indicating respiratory inflammation, cell damage and pulmonary function decrements in a variety of animal species that were studied as EPA determined that the exposure information in the epidemiological studies was insufficient for use in developing risk assessments for either cancer or non-cancer risks.
BenzeneThe most recent review by the EPA of benzene health risks was conducted in 2003. The RfC for benzene was set at 30 µg/m3 on the basis of decreased blood lymphocyte counts from an occupational epidemiological study. Benzene is emitted by motor vehicles due to the presence of benzene in gasoline, as well as from a variety of industrial sources including coke ovens, which is of particular relevance for Pittsburgh levels. Benzene was classified as a known human carcinogen by EPA, with the most recent risk assessment conducted in 2000. Benzene has been linked in occupational epidemiological and case
6 EPA IRIS, accessed Nov. 28, 2012.7 Findings of the CalEPA Scientific Review Panel on The Report on Diesel Exhaust, April 22, 1998.8 IARC IARC Monographs on the Evaluation of Carcinogenic Risks to Humans Vol. 105: Diesel and
Gasoline Engine Exhausts and some Nitroarenes, 2012.9 NTP Report on Carcinogens, Twelfth Edition, 2011.10 RfC is “an estimate of a daily inhalation exposure to the human population (including sensitive subgroups) that is
likely to be without an appreciable risk of deleterious effects during a lifetime” (EPA IRIS, accessed Nov. 29, 2012).11 EPA IRIS, accessed Nov. 28, 2012.
16 THE HEINZ ENDOWMENTS
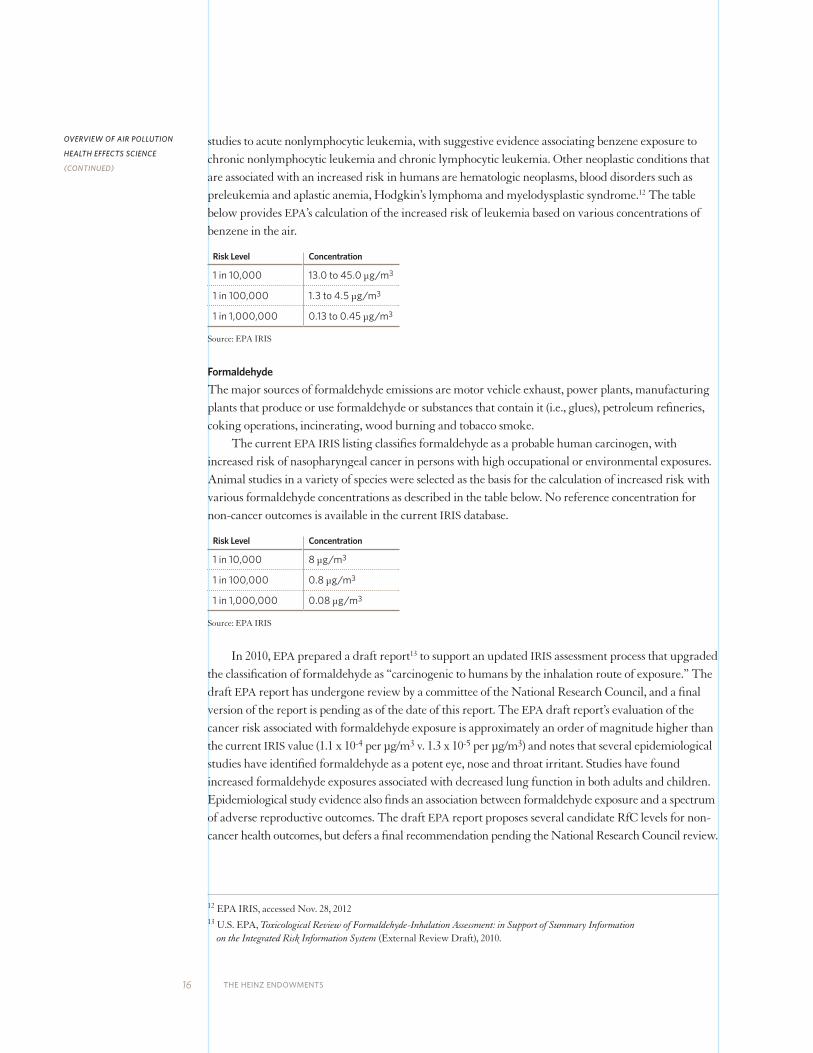
studies to acute nonlymphocytic leukemia, with suggestive evidence associating benzene exposure to chronic nonlymphocytic leukemia and chronic lymphocytic leukemia. Other neoplastic conditions that are associated with an increased risk in humans are hematologic neoplasms, blood disorders such as preleukemia and aplastic anemia, Hodgkin’s lymphoma and myelodysplastic syndrome.12 The table below provides EPA’s calculation of the increased risk of leukemia based on various concentrations of benzene in the air.
Risk Level Concentration
1 in 10,000 13.0 to 45.0 µg/m3
1 in 100,000 1.3 to 4.5 µg/m3
1 in 1,000,000 0.13 to 0.45 µg/m3
Source: EPA IRIS
FormaldehydeThe major sources of formaldehyde emissions are motor vehicle exhaust, power plants, manufacturing plants that produce or use formaldehyde or substances that contain it (i.e., glues), petroleum refineries, coking operations, incinerating, wood burning and tobacco smoke. The current EPA IRIS listing classifies formaldehyde as a probable human carcinogen, with increased risk of nasopharyngeal cancer in persons with high occupational or environmental exposures. Animal studies in a variety of species were selected as the basis for the calculation of increased risk with various formaldehyde concentrations as described in the table below. No reference concentration for non-cancer outcomes is available in the current IRIS database.
Risk Level Concentration
1 in 10,000 8 µg/m3
1 in 100,000 0.8 µg/m3
1 in 1,000,000 0.08 µg/m3
Source: EPA IRIS
In 2010, EPA prepared a draft report13 to support an updated IRIS assessment process that upgraded the classification of formaldehyde as “carcinogenic to humans by the inhalation route of exposure.” The draft EPA report has undergone review by a committee of the National Research Council, and a final version of the report is pending as of the date of this report. The EPA draft report’s evaluation of the cancer risk associated with formaldehyde exposure is approximately an order of magnitude higher than the current IRIS value (1.1 x 10⁻⁴ per µg/m3 v. 1.3 x 10⁻⁵ per µg/m3) and notes that several epidemiological studies have identified formaldehyde as a potent eye, nose and throat irritant. Studies have found increased formaldehyde exposures associated with decreased lung function in both adults and children. Epidemiological study evidence also finds an association between formaldehyde exposure and a spectrum of adverse reproductive outcomes. The draft EPA report proposes several candidate RfC levels for non- cancer health outcomes, but defers a final recommendation pending the National Research Council review.
12 EPA IRIS, accessed Nov. 28, 201213 U.S. EPA, Toxicological Review of Formaldehyde-Inhalation Assessment: in Support of Summary Information
on the Integrated Risk Information System (External Review Draft), 2010.
OVERVIEW OF AIR POLLUTION
HEALTH EFFECTS SCIENCE
(CONTINUED)
THE HEALTH IMPACTS OF PITTSBURGH AIR QUALITY: A REVIEW OF THE SCIENTIFIC LITERATURE, 1970–2012 17
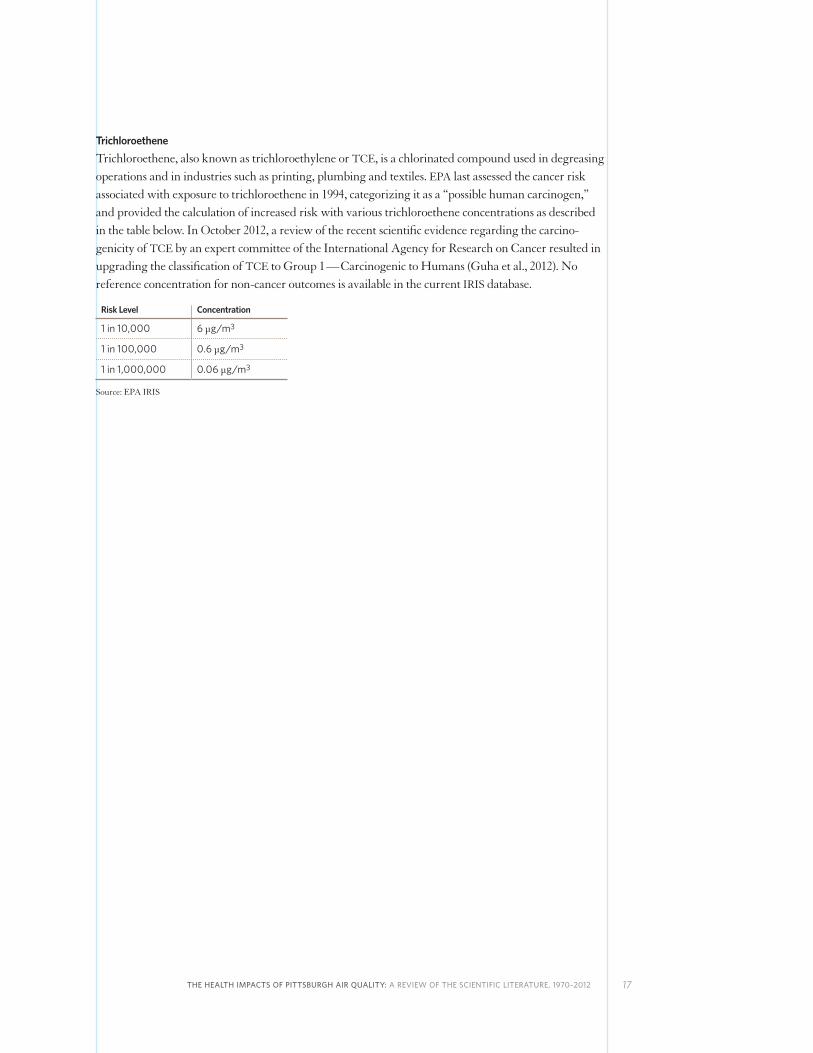
TrichloroetheneTrichloroethene, also known as trichloroethylene or TCE, is a chlorinated compound used in degreasing operations and in industries such as printing, plumbing and textiles. EPA last assessed the cancer risk associated with exposure to trichloroethene in 1994, categorizing it as a “possible human carcinogen,” and provided the calculation of increased risk with various trichloroethene concentrations as described in the table below. In October 2012, a review of the recent scientific evidence regarding the carcino-genicity of TCE by an expert committee of the International Agency for Research on Cancer resulted in upgrading the classification of TCE to Group 1 — Carcinogenic to Humans (Guha et al., 2012). No reference concentration for non-cancer outcomes is available in the current IRIS database.
Risk Level Concentration
1 in 10,000 6 µg/m3
1 in 100,000 0.6 µg/m3
1 in 1,000,000 0.06 µg/m3
Source: EPA IRIS
18 THE HEINZ ENDOWMENTS
PITTSBURGH AIR QUALITY
Efforts to analyze and address Pittsburgh’s outdoor air quality date at least to the post-World War II era, as documented, for example, in the presentation by Sumner Ely, then superintendent of the Pittsburgh Bureau of Smoke Prevention, to the American Public Health Association in October 1947 (Ely 1948). Coincidently, this event took place almost exactly one year before the October 1948 multi-day air pollution episode in Donora, Pa., in which 20 people died and thousands were sickened. Outdoor air quality for the Pittsburgh area has improved substantially over the past half-century, and air pollution emergencies such as the November 1975 episode discussed in the 1976 study by Stebbings et al.,
fortunately no longer occur. But current air pollution levels in Pittsburgh still exceed national air quality standards and pose public health concerns.
CRITERIA AIR POLLUTANTS
In the Pittsburgh-Beaver Valley Metropolitan Statistical Area, all of Beaver, Butler, Washington and Westmoreland counties, as well as portions of Allegheny, Armstrong, Greene and Lawrence counties, are classified by the EPA as not meeting the 2006 daily and annual NAAQS for PM2.5. Non-attainment classifications based on the revised January 2013 annual average PM2.5 NAAQS of 12 µg/m3 will not be established until 2014 at the earliest. EPA also classifies Lincoln, Glassport, Liberty and Port Vue boroughs and the City of Clairton in the southeastern portion of Allegheny County as not meeting the current PM2.5 NAAQS. EPA classifies Allegheny, Armstrong, Beaver, Butler, Fayette, Washington and Westmoreland counties as not meeting the 2008 NAAQS for ozone (0.075 ppm). EPA classifies a portion of Armstrong County as not meeting the NAAQS for sulfur dioxide, and a portion of Beaver County does not meet the 2008 NAAQS for lead.14,15
A 2011 report prepared for The Heinz Endowments by the Clean Air Task Force (CATF 2011) notes that annual levels of PM2.5 recorded by more than half of Pittsburgh-area air quality monitors, as well as ozone levels immediately downwind of Pittsburgh, were ranked in the worst 10 percent of air quality readings nationally over the 1999–2009 period. Daily PM2.5 levels in the Pittsburgh area ranked in the worst 25 percent nationally. While the 2007–2009 PM2.5 and ozone levels discussed in the CATF report indicate continued improvement in the Pittsburgh area, as noted in the report, these improve-ments likely can be attributed to the impact of both air pollution control measures and reduced emissions related to the economic recession of this period. However, as discussed in the Overview of Air Pollution Health Effects Science section of this report, the current body of scientific evidence indicates that the 2008 ozone national health-based air quality standard does not adequately protect public health and may be revised to lower levels to conform to the recommendations of the EPA’s CASAC. Based on 2009–2011 annual average PM2.5 levels, six of the nine Pittsburgh design value monitors reported levels that exceeded the EPA’s December 2012 revised
14 www.epa.gov/airquality/greenbk/ (accessed Sept. 13, 2012)15 The zinc works associated with violation of the lead NAAQS is expected to shut down in 2013
(www.energycapitalonline.com/news/article.php?aid=116, accessed Jan. 19, 2013)
PITTSBURGH AIR QUALITY
(CONTINUED)
THE HEALTH IMPACTS OF PITTSBURGH AIR QUALITY: A REVIEW OF THE SCIENTIFIC LITERATURE, 1970–2012 19
annual PM2.5 air quality standard. Pittsburgh-area PM2.5 design value levels16 for 2009–2011 were highest in Allegheny County,17 reaching 15 µg/m3. With a 2009–2011 design value level for ozone18 of 0.080 ppm,19 the Pittsburgh area will be even further out of compliance with a potentially more stringent ozone standard. Therefore, additional pollution control measures will be required to meet the more health-protective particulate matter and ozone standards.
HAZARDOUS AIR POLLUTANTS
In addition to the health risks posed by exposure to particulate matter and ozone, Pittsburgh air quality also contains high levels of several hazardous air pollutants (also commonly referred to as “toxic air pollutants” or “air toxics”). In a 2009 report prepared for the Allegheny County Health Department, researchers at Carnegie Mellon University examined Pittsburgh-area monitoring data for 36 volatile organic air toxics (CMU 2009).20 Data were gathered from monitoring sites located in Downtown Pittsburgh, adjacent to Neville Island, as well as in South Fayette, which served as a regional site. The CMU report also used historical monitoring data for an expanded list of 65 air toxics in developing an assessment of the additive cancer and non-cancer health risks posed by exposure to these pollutants. The CMU analysis indicated that the additive cancer risk posed by the 36 volatile organic air toxic compounds reached one in ten thousand for the Downtown Pittsburgh site. Risks for the four monitoring sites varied by only 1.5, indicating significant regional distribution of the air toxics risks. To put these cancer risk levels into context, EPA regulates exposure to toxic air pollutants so that the most exposed persons have a maximum lifetime cancer risk of one in ten thousand and the broader exposed population has an individual maximum lifetime cancer risk of one in one million. Diesel particulate matter (DPM) levels presented the highest cancer risks for all Pittsburgh areas included in the study, with DPM levels at the Downtown Pittsburgh site reaching levels associated with a one in one thousand lifetime cancer risk. Levels of several hazardous air pollutants (acetaldehyde, benzene, 1,4 dichlorobenzene, 1,3 butadiene, formaldehyde, carbon tetrachloride, chloroform and tetrachloroethene) exceeded EPA’s one in one million risk threshold at multiple monitoring sites, and levels of DPM, benzene, formaldehyde and trichloroethene each reached a lifetime cancer risk level of one in one hundred thousand per exposed individual. Downtown Pittsburgh cancer risks increased by an order of magnitude to approximately one in one thousand when the broader suite of 65 air toxics was considered, which may be a low estimate since data on levels of metals and polycyclic aromatic hydrocarbons were not available for this site, and therefore not included in this calculation. Based on data from the 2005 EPA National Air Toxics Assessment (NATA) database, out of a national total of 3,225 counties, Allegheny County ranked 63rd (in the top two percent) in overall air pollution-related cancer risk and seventh (in the top two-tenths of one percent) with respect to cancer risk from power plants and other large industrial sources.21 The Pittsburgh metropolitan area contained 11 of a total 721 census tracts (or approximately 2 percent) with air pollution-related cancer risks greater
16 The design value for the annual PM2.5 NAAQS is the 3-year average annual mean concentration.17 www.epa.gov/pm/2012/20092011table.pdf (accessed Jan. 18, 2013)18 The design value is the 3-year average of the annual fourth-highest daily maximum 8-hour ozone concentration.19 www.epa.gov/airtrends/values.html (accessed Jan. 18, 2013)20 The results of these analyses contained in the CMU report were also published in the peer-reviewed literature
(Logue et al., 2009, Logue et al., 2010).21 www.epa.gov/ttn/atw/nata2005/tables.html (accessed Sept. 20, 2012)
20 THE HEINZ ENDOWMENTS
than one in ten thousand (out of a total of 3,141 U.S. census tracts with cancer risks >1x10⁻⁴), ranking 17th in the number of census tracts exceeding this risk level among U.S. metropolitan areas.22
With respect to non-cancer (e.g., neurotoxic, reproductive) effects, of the 38 gas phase organic compounds assessed in the CMU report, only acrolein was identified as presenting a potential health risk based on exceeding a hazard quotient (HQ)23 of one based on levels measured at all Pittsburgh monitoring sites. The primary acute health effect of exposure to acrolein is pronounced eye, nose and throat irritation, and animal studies indicate the potential for acrolein to impair lung function and sensitize the respiratory system to increased response to other air pollutants such as ozone or particulate matter.24 However, according to the 2005 EPA NATA data, the Pittsburgh area contained 560 census tracts with air toxics respiratory hazard quotient indices above 1 (about 78 percent out of a total of 721 Pittsburgh metropolitan area census tracts and one percent of the total 48,362 U.S. census tracts with HQ >1), ranking 19th for the total number of census tracts among U.S. metropolitan areas.
22 U.S. Environmental Protection Agency. Summary of Results from the 2005 National-Scale Assessment. February 17, 2011.23 Hazard quotient (HQ) is the ratio of the potential exposure to the toxic air pollutant compared to the level at which no
adverse effects are expected. If the HQ is calculated to be equal to or less than 1, then no adverse health effects are expected as a result of exposure. If the HQ is greater than 1, then adverse health effects are possible.
24 EPA 2003 IRIS review www.epa.gov/iris/subst/0364.htm (accessed Sept. 18, 2012)
SUMMARY OF FINDINGS
AND CONCLUSIONS
(CONTINUED)
THE HEALTH IMPACTS OF PITTSBURGH AIR QUALITY: A REVIEW OF THE SCIENTIFIC LITERATURE, 1970–2012 21
SUMMARY OF FINDINGS AND CONCLUSIONS
FINDINGS
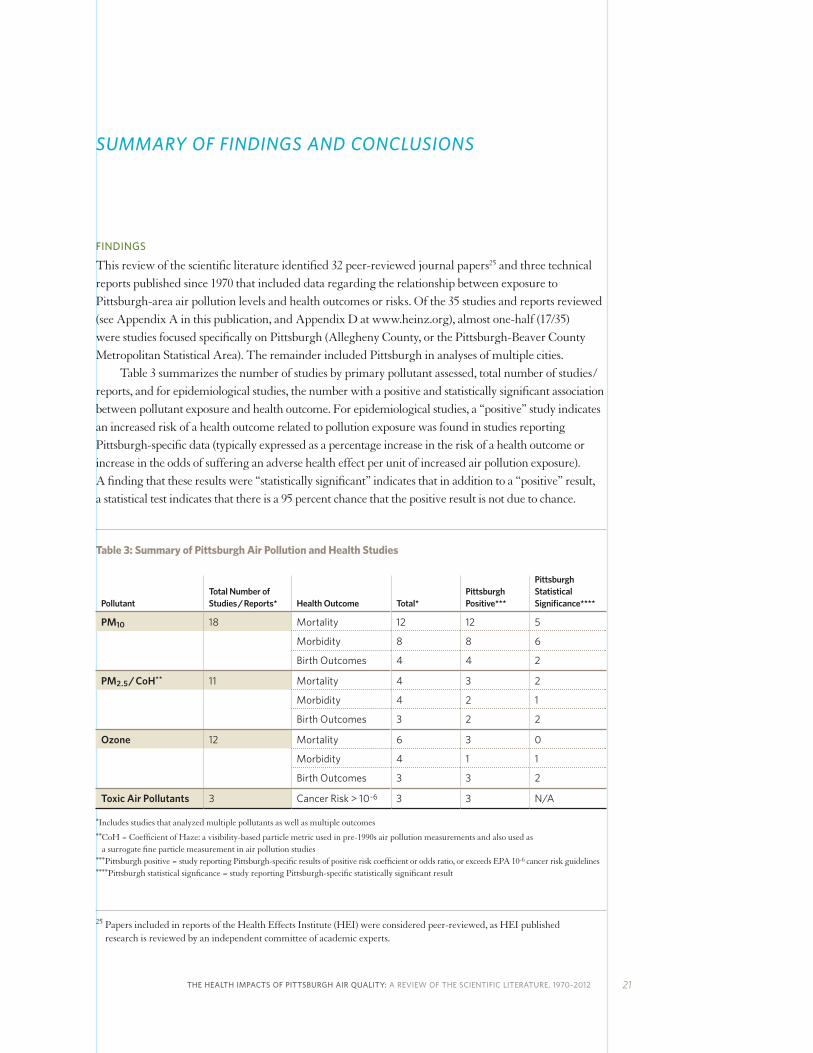
This review of the scientific literature identified 32 peer-reviewed journal papers25 and three technical reports published since 1970 that included data regarding the relationship between exposure to Pittsburgh-area air pollution levels and health outcomes or risks. Of the 35 studies and reports reviewed (see Appendix A in this publication, and Appendix D at www.heinz.org), almost one-half (17/35) were studies focused specifically on Pittsburgh (Allegheny County, or the Pittsburgh-Beaver County Metropolitan Statistical Area). The remainder included Pittsburgh in analyses of multiple cities. Table 3 summarizes the number of studies by primary pollutant assessed, total number of studies / reports, and for epidemiological studies, the number with a positive and statistically significant association between pollutant exposure and health outcome. For epidemiological studies, a “positive” study indicates an increased risk of a health outcome related to pollution exposure was found in studies reporting Pittsburgh-specific data (typically expressed as a percentage increase in the risk of a health outcome or increase in the odds of suffering an adverse health effect per unit of increased air pollution exposure). A finding that these results were “statistically significant” indicates that in addition to a “positive” result, a statistical test indicates that there is a 95 percent chance that the positive result is not due to chance.
Table 3: Summary of Pittsburgh Air Pollution and Health Studies
PollutantTotal Number of Studies / Reports* Health Outcome Total*
Pittsburgh Positive***
Pittsburgh Statistical Significance****
PM10 18 Mortality 12 12 5
Morbidity 8 8 6
Birth Outcomes 4 4 2
PM2.5 / CoH** 11 Mortality 4 3 2
Morbidity 4 2 1
Birth Outcomes 3 2 2
Ozone 12 Mortality 6 3 0
Morbidity 4 1 1
Birth Outcomes 3 3 2
Toxic Air Pollutants 3 Cancer Risk > 10-6 3 3 N/A
* Includes studies that analyzed multiple pollutants as well as multiple outcomes ** CoH = Coefficient of Haze: a visibility-based particle metric used in pre-1990s air pollution measurements and also used as
a surrogate fine particle measurement in air pollution studies ***Pittsburgh positive = study reporting Pittsburgh-specific results of positive risk coefficient or odds ratio, or exceeds EPA 10-6 cancer risk guidelines****Pittsburgh statistical signficance = study reporting Pittsburgh-specific statistically significant result
25 Papers included in reports of the Health Effects Institute (HEI) were considered peer-reviewed, as HEI published research is reviewed by an independent committee of academic experts.
22 THE HEINZ ENDOWMENTS
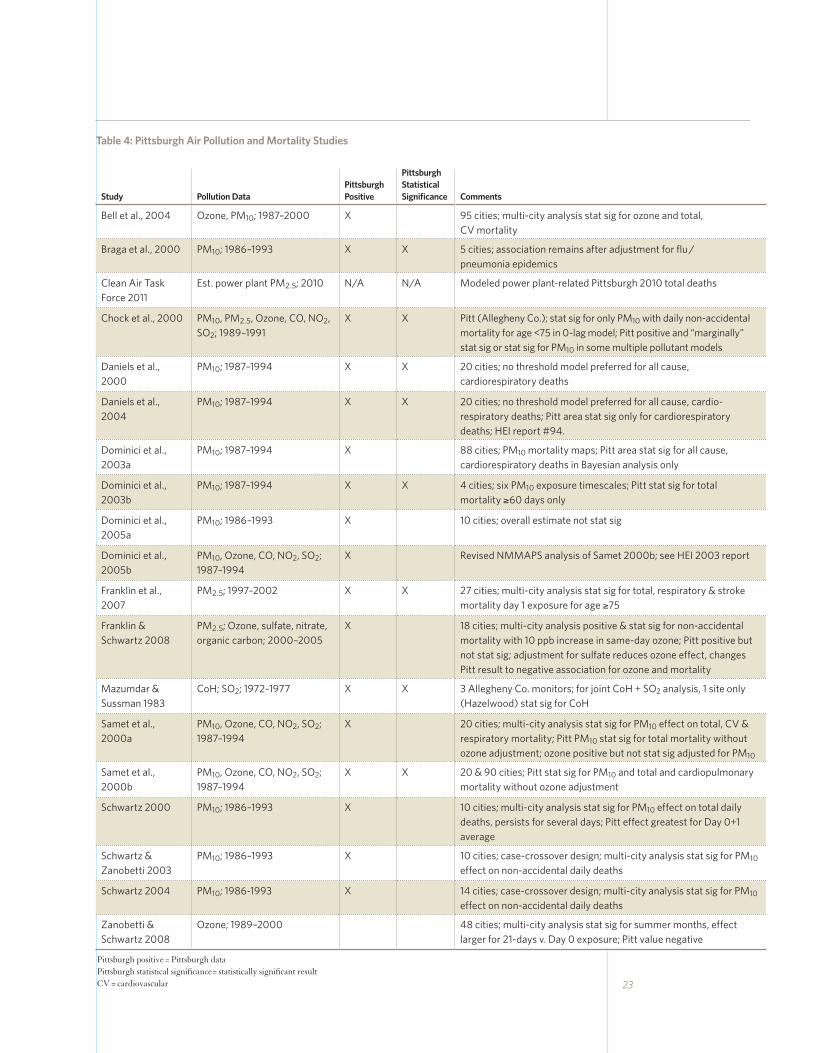
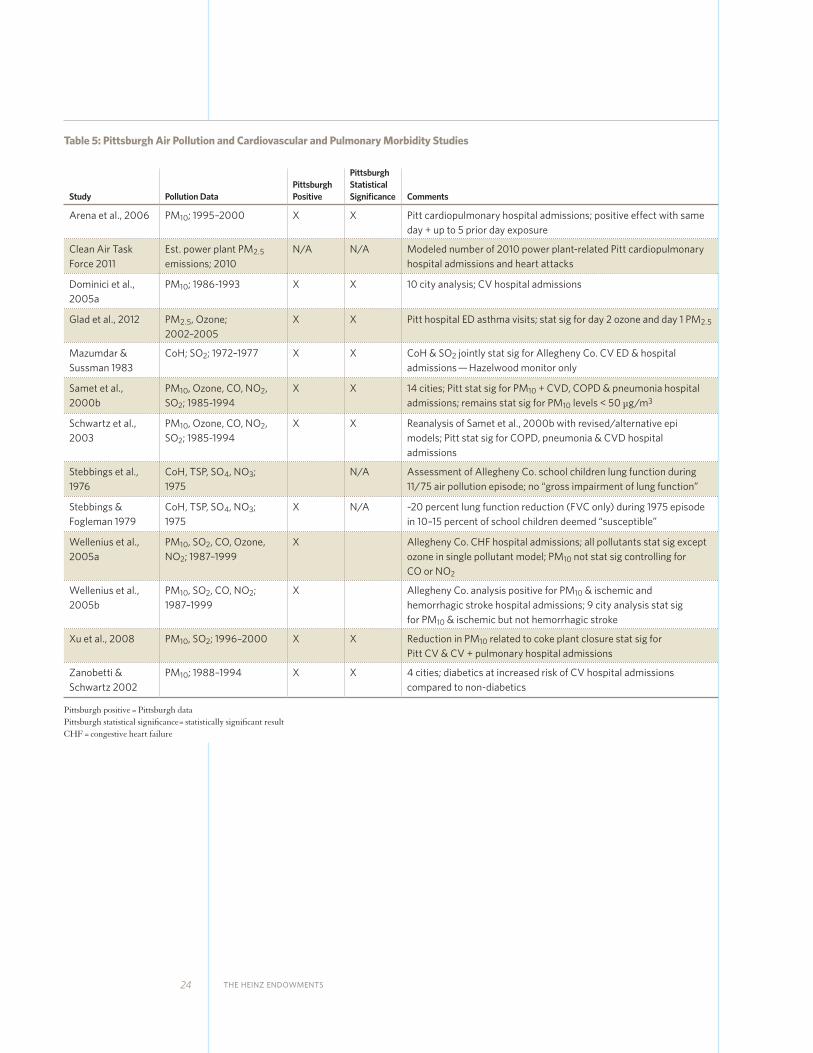
PM10 was the primary pollutant assessed in just over one-half (18/35) of the identified studies, with PM2.5 / Coefficient of Haze and ozone each assessed in approximately one-third of studies. One report and two studies were identified that estimated the risk of cancer from measurements of Pittsburgh-area toxic air pollutant levels,26 and one study estimated non-cancer risks. Tables 4, 5, 6, and 7 summarize the studies identified as assessing Pittsburgh-related mortality, morbidity, birth outcomes and cancer/non-cancer risks, respectively. Of the 18 epidemiological studies that assessed the association of Pittsburgh-area levels of PM10, PM2.5 / CoH, and ozone with premature mortality, 17 studies found a positive association with one or more pollutants. Results from almost half (8) of these studies were statistically significant. Eleven of 12 epidemiological / field clinical studies that assessed morbidity effects found a positive association with exposure to one or more of the assessed pollutants, with approximately two-thirds of these results statistically significant. All four studies that assessed adverse birth outcomes or measurements of upstream conditions related to increased risk of adverse birth outcomes (i.e., high C-reactive protein levels, preeclampsia, maternal hypertension) found associations with one or more of the following pollutants: PM10, PM2.5 and ozone, and all study results were statistically significant. All of the studies and reports that estimated cancer and non-cancer health outcome risks found cumulative lifetime cancer risks from Pittsburgh-area toxic air pollutant concentrations that exceeded EPA’s one in one million risk target. The 2009 Carnegie Mellon University report to the Allegheny County Health Department identified lifetime additive cancer risk estimates from a combination of gas phase organic compounds and diesel particulate matter that exceeded EPA’s one in ten thousand population-level risk threshold for regulatory action, and these risks reached one in one thousand for the Downtown Pittsburgh area. Results from EPA’s 2005 National Air Toxics Assessment, which used modeled emissions data to assess cancer and non-cancer health risks from hazardous air pollutants areas in Pittsburgh, also exceeded EPA target risk levels. Allegheny County ranked in the top two percent in overall U.S. air pollution-related cancer risk and in the top two-tenths of one percent with respect to cancer risk from power plants and other large industrial sources. The majority of the health studies included in this review found positive risks for Pittsburgh air pollution exposures. Many of these positive findings were in studies that included large multi-city databases. Each city was evaluated using consistent statistical models, thus avoiding concerns regarding publication bias, whereby studies that find positive rather than negative effects are more likely to be submitted and accepted for publication in the peer-reviewed literature. Though some of these positive associations were not statistically significant, the small numbers of daily deaths and hospital admissions for cardiopulmonary causes for smaller individual cities in daily time-series studies can constrain having sufficient statistical power to find a statistically significant result and can also result in wide confidence intervals surrounding the risk estimates. It is important to note that many of the positive but non-statistically significant Pittsburgh-related risk estimates were included as part of large multi-city databases, that when combined across cities to achieve greater statistical power, found statistically significant positive results. All but one of the multi-city data studies in this review that included Pittsburgh PM and ozone-related mortality found statistically significant associations between exposure to those pollutants and premature death when data for all cities considered were combined.
26 It should be noted that the two toxic air pollution studies published in the peer-reviewed literature contained much of the same data and results included in the CMU technical report.
SUMMARY OF FINDINGS
AND CONCLUSIONS
(CONTINUED)
23
Table 4: Pittsburgh Air Pollution and Mortality Studies
Study Pollution DataPittsburgh Positive
Pittsburgh Statistical Significance Comments
Bell et al., 2004 Ozone, PM10; 1987–2000 X 95 cities; multi-city analysis stat sig for ozone and total, CV mortality
Braga et al., 2000 PM10; 1986–1993 X X 5 cities; association remains after adjustment for flu / pneumonia epidemics
Clean Air Task Force 2011
Est. power plant PM2.5; 2010 N/A N/A Modeled power plant-related Pittsburgh 2010 total deaths
Chock et al., 2000 PM10, PM2.5, Ozone, CO, NO2, SO2; 1989–1991
X X Pitt (Allegheny Co.); stat sig for only PM10 with daily non-accidental mortality for age <75 in 0-lag model; Pitt positive and “marginally” stat sig or stat sig for PM10 in some multiple pollutant models
Daniels et al., 2000
PM10; 1987–1994 X X 20 cities; no threshold model preferred for all cause, cardiorespiratory deaths
Daniels et al., 2004
PM10; 1987–1994 X X 20 cities; no threshold model preferred for all cause, cardio-respiratory deaths; Pitt area stat sig only for cardiorespiratory deaths; HEI report #94.
Dominici et al., 2003a
PM10; 1987–1994 X 88 cities; PM10 mortality maps; Pitt area stat sig for all cause, cardiorespiratory deaths in Bayesian analysis only
Dominici et al., 2003b
PM10; 1987–1994 X X 4 cities; six PM10 exposure timescales; Pitt stat sig for total mortality ≥60 days only
Dominici et al., 2005a
PM10; 1986–1993 X 10 cities; overall estimate not stat sig
Dominici et al., 2005b
PM10, Ozone, CO, NO2, SO2; 1987–1994
X Revised NMMAPS analysis of Samet 2000b; see HEI 2003 report
Franklin et al., 2007
PM2.5; 1997–2002 X X 27 cities; multi-city analysis stat sig for total, respiratory & stroke mortality day 1 exposure for age ≥75
Franklin & Schwartz 2008
PM2.5; Ozone, sulfate, nitrate, organic carbon; 2000–2005
X 18 cities; multi-city analysis positive & stat sig for non-accidental mortality with 10 ppb increase in same-day ozone; Pitt positive but not stat sig; adjustment for sulfate reduces ozone effect, changes Pitt result to negative association for ozone and mortality
Mazumdar & Sussman 1983
CoH; SO2; 1972–1977 X X 3 Allegheny Co. monitors; for joint CoH + SO2 analysis, 1 site only (Hazelwood) stat sig for CoH
Samet et al., 2000a
PM10, Ozone, CO, NO2, SO2; 1987–1994
X 20 cities; multi-city analysis stat sig for PM10 effect on total, CV & respiratory mortality; Pitt PM10 stat sig for total mortality without ozone adjustment; ozone positive but not stat sig adjusted for PM10
Samet et al., 2000b
PM10, Ozone, CO, NO2, SO2; 1987–1994
X X 20 & 90 cities; Pitt stat sig for PM10 and total and cardiopulmonary mortality without ozone adjustment
Schwartz 2000 PM10; 1986–1993 X 10 cities; multi-city analysis stat sig for PM10 effect on total daily deaths, persists for several days; Pitt effect greatest for Day 0+1 average
Schwartz & Zanobetti 2003
PM10; 1986–1993 X 10 cities; case-crossover design; multi-city analysis stat sig for PM10 effect on non-accidental daily deaths
Schwartz 2004 PM10; 1986-1993 X 14 cities; case-crossover design; multi-city analysis stat sig for PM10 effect on non-accidental daily deaths
Zanobetti & Schwartz 2008
Ozone; 1989–2000 48 cities; multi-city analysis stat sig for summer months, effect larger for 21-days v. Day 0 exposure; Pitt value negative
Pittsburgh positive = Pittsburgh data Pittsburgh statistical significance= statistically significant resultCV = cardiovascular
24 THE HEINZ ENDOWMENTS
Table 5: Pittsburgh Air Pollution and Cardiovascular and Pulmonary Morbidity Studies
Study Pollution DataPittsburgh Positive
Pittsburgh Statistical Significance Comments
Arena et al., 2006 PM10; 1995–2000 X X Pitt cardiopulmonary hospital admissions; positive effect with same day + up to 5 prior day exposure
Clean Air Task Force 2011
Est. power plant PM2.5 emissions; 2010
N/A N/A Modeled number of 2010 power plant-related Pitt cardiopulmonary hospital admissions and heart attacks
Dominici et al., 2005a
PM10; 1986-1993 X X 10 city analysis; CV hospital admissions
Glad et al., 2012 PM2.5, Ozone; 2002–2005
X X Pitt hospital ED asthma visits; stat sig for day 2 ozone and day 1 PM2.5
Mazumdar & Sussman 1983
CoH; SO2; 1972–1977 X X CoH & SO2 jointly stat sig for Allegheny Co. CV ED & hospital admissions — Hazelwood monitor only
Samet et al., 2000b
PM10, Ozone, CO, NO2, SO2; 1985-1994
X X 14 cities; Pitt stat sig for PM10 + CVD, COPD & pneumonia hospital admissions; remains stat sig for PM10 levels < 50 µg/m3
Schwartz et al., 2003
PM10, Ozone, CO, NO2, SO2; 1985-1994
X X Reanalysis of Samet et al., 2000b with revised/alternative epi models; Pitt stat sig for COPD, pneumonia & CVD hospital admissions
Stebbings et al., 1976
CoH, TSP, SO4, NO3; 1975
N/A Assessment of Allegheny Co. school children lung function during 11/75 air pollution episode; no “gross impairment of lung function”
Stebbings & Fogleman 1979
CoH, TSP, SO4, NO3; 1975
X N/A ~20 percent lung function reduction (FVC only) during 1975 episode in 10–15 percent of school children deemed “susceptible”
Wellenius et al., 2005a
PM10, SO2, CO, Ozone, NO2; 1987–1999
X Allegheny Co. CHF hospital admissions; all pollutants stat sig except ozone in single pollutant model; PM10 not stat sig controlling for CO or NO2
Wellenius et al., 2005b
PM10, SO2, CO, NO2; 1987–1999
X Allegheny Co. analysis positive for PM10 & ischemic and hemorrhagic stroke hospital admissions; 9 city analysis stat sig for PM10 & ischemic but not hemorrhagic stroke
Xu et al., 2008 PM10, SO2; 1996–2000 X X Reduction in PM10 related to coke plant closure stat sig for Pitt CV & CV + pulmonary hospital admissions
Zanobetti & Schwartz 2002
PM10; 1988–1994 X X 4 cities; diabetics at increased risk of CV hospital admissions compared to non-diabetics
Pittsburgh positive = Pittsburgh data Pittsburgh statistical significance= statistically significant resultCHF = congestive heart failure
THE HEALTH IMPACTS OF PITTSBURGH AIR QUALITY: A REVIEW OF THE SCIENTIFIC LITERATURE, 1970–2012 25
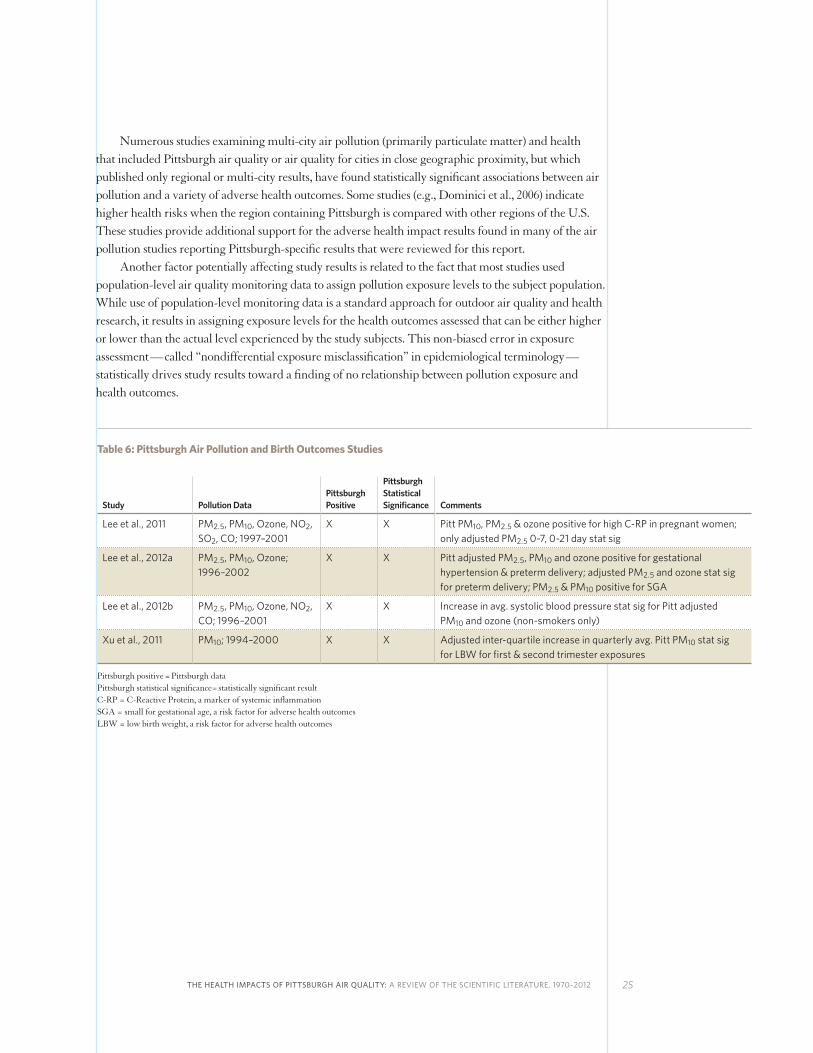
Numerous studies examining multi-city air pollution (primarily particulate matter) and health that included Pittsburgh air quality or air quality for cities in close geographic proximity, but which published only regional or multi-city results, have found statistically significant associations between air pollution and a variety of adverse health outcomes. Some studies (e.g., Dominici et al., 2006) indicate higher health risks when the region containing Pittsburgh is compared with other regions of the U.S. These studies provide additional support for the adverse health impact results found in many of the air pollution studies reporting Pittsburgh-specific results that were reviewed for this report. Another factor potentially affecting study results is related to the fact that most studies used population-level air quality monitoring data to assign pollution exposure levels to the subject population. While use of population-level monitoring data is a standard approach for outdoor air quality and health research, it results in assigning exposure levels for the health outcomes assessed that can be either higher or lower than the actual level experienced by the study subjects. This non-biased error in exposure assessment — called “nondifferential exposure misclassification” in epidemiological terminology — statistically drives study results toward a finding of no relationship between pollution exposure and health outcomes.
Table 6: Pittsburgh Air Pollution and Birth Outcomes Studies
Study Pollution DataPittsburgh Positive
Pittsburgh Statistical Significance Comments
Lee et al., 2011 PM2.5, PM10, Ozone, NO2, SO2, CO; 1997–2001
X X Pitt PM10, PM2.5 & ozone positive for high C-RP in pregnant women; only adjusted PM2.5 0-7, 0-21 day stat sig
Lee et al., 2012a PM2.5, PM10, Ozone; 1996–2002
X X Pitt adjusted PM2.5, PM10 and ozone positive for gestational hypertension & preterm delivery; adjusted PM2.5 and ozone stat sig for preterm delivery; PM2.5 & PM10 positive for SGA
Lee et al., 2012b PM2.5, PM10, Ozone, NO2, CO; 1996–2001
X X Increase in avg. systolic blood pressure stat sig for Pitt adjusted PM10 and ozone (non-smokers only)
Xu et al., 2011 PM10; 1994–2000 X X Adjusted inter-quartile increase in quarterly avg. Pitt PM10 stat sig for LBW for first & second trimester exposures
Pittsburgh positive = Pittsburgh data Pittsburgh statistical significance= statistically significant resultC-RP = C-Reactive Protein, a marker of systemic inflammationSGA = small for gestational age, a risk factor for adverse health outcomesLBW = low birth weight, a risk factor for adverse health outcomes
26 THE HEINZ ENDOWMENTS
CONCLUSIONS
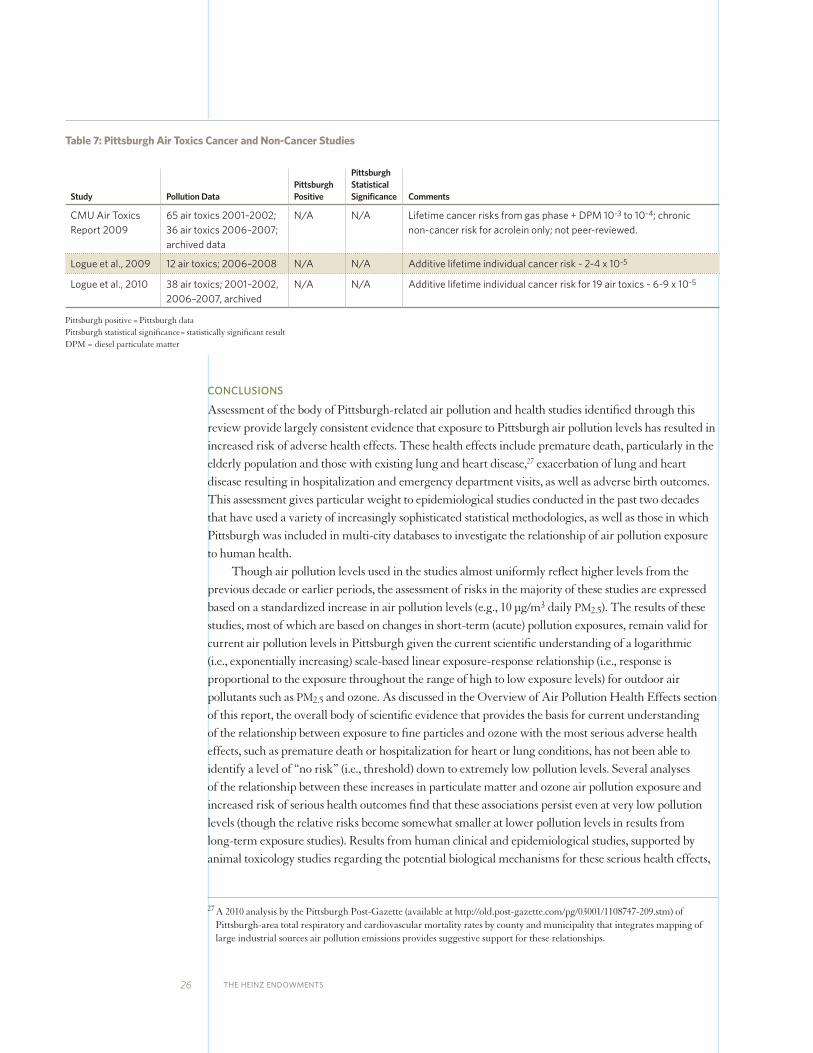
Assessment of the body of Pittsburgh-related air pollution and health studies identified through this review provide largely consistent evidence that exposure to Pittsburgh air pollution levels has resulted in increased risk of adverse health effects. These health effects include premature death, particularly in the elderly population and those with existing lung and heart disease,27 exacerbation of lung and heart disease resulting in hospitalization and emergency department visits, as well as adverse birth outcomes. This assessment gives particular weight to epidemiological studies conducted in the past two decades that have used a variety of increasingly sophisticated statistical methodologies, as well as those in which Pittsburgh was included in multi-city databases to investigate the relationship of air pollution exposure to human health. Though air pollution levels used in the studies almost uniformly reflect higher levels from the previous decade or earlier periods, the assessment of risks in the majority of these studies are expressed based on a standardized increase in air pollution levels (e.g., 10 µg/m3 daily PM2.5). The results of these studies, most of which are based on changes in short-term (acute) pollution exposures, remain valid for current air pollution levels in Pittsburgh given the current scientific understanding of a logarithmic (i.e., exponentially increasing) scale-based linear exposure-response relationship (i.e., response is proportional to the exposure throughout the range of high to low exposure levels) for outdoor air pollutants such as PM2.5 and ozone. As discussed in the Overview of Air Pollution Health Effects section of this report, the overall body of scientific evidence that provides the basis for current understanding of the relationship between exposure to fine particles and ozone with the most serious adverse health effects, such as premature death or hospitalization for heart or lung conditions, has not been able to identify a level of “no risk” (i.e., threshold) down to extremely low pollution levels. Several analyses of the relationship between these increases in particulate matter and ozone air pollution exposure and increased risk of serious health outcomes find that these associations persist even at very low pollution levels (though the relative risks become somewhat smaller at lower pollution levels in results from long-term exposure studies). Results from human clinical and epidemiological studies, supported by animal toxicology studies regarding the potential biological mechanisms for these serious health effects,
27 A 2010 analysis by the Pittsburgh Post-Gazette (available at http://old.post-gazette.com/pg/03001/1108747-209.stm) of Pittsburgh-area total respiratory and cardiovascular mortality rates by county and municipality that integrates mapping of large industrial sources air pollution emissions provides suggestive support for these relationships.
Table 7: Pittsburgh Air Toxics Cancer and Non-Cancer Studies
Study Pollution DataPittsburgh Positive
Pittsburgh Statistical Significance Comments
CMU Air Toxics Report 2009
65 air toxics 2001–2002; 36 air toxics 2006–2007; archived data
N/A N/A Lifetime cancer risks from gas phase + DPM 10-3 to 10-4; chronic non-cancer risk for acrolein only; not peer-reviewed.
Logue et al., 2009 12 air toxics; 2006–2008 N/A N/A Additive lifetime individual cancer risk ~ 2-4 x 10⁻⁵
Logue et al., 2010 38 air toxics; 2001–2002, 2006–2007, archived
N/A N/A Additive lifetime individual cancer risk for 19 air toxics ~ 6-9 x 10⁻⁵
Pittsburgh positive = Pittsburgh data Pittsburgh statistical significance= statistically significant resultDPM = diesel particulate matter
THE HEALTH IMPACTS OF PITTSBURGH AIR QUALITY: A REVIEW OF THE SCIENTIFIC LITERATURE, 1970–2012 27
reinforce the finding that levels of these pollutants well below those currently experienced in the Pittsburgh area still pose public health risks. EPA estimated that short-term exposure to 2007 Pittsburgh PM2.5 levels and long-term exposure to 1999-2000 PM2.5 levels resulted in one percent of heart attack-related deaths and hospital admissions and 12 percent of heart attack-related deaths, respectively, even when PM2.5 levels met the 2006 PM2.5 NAAQS (U.S. EPA 2011). In addition, multi-city studies that capture the chronic health effects of long-term exposure to PM2.5 and ozone, many of which include Pittsburgh data but did not report Pittsburgh-specific risk data in the published literature, have found substantially larger risks for these serious health outcomes with pollution levels at or well below those currently experienced in Pittsburgh. Of note is the fact that of the nine Pittsburgh area PM2.5 design value monitoring sites, 2009–2011 PM2.5 levels at two monitors exceeded the 12.8 µg/m3 level noted as associated with a variety of adverse health effects in the EPA ISA. Six monitors exceeded the 12.0 µg/m3 level, and all nine exceeded the 10.2 µg/m3 and the 8.7 µg/m3 levels discussed in the 2009 Krewski et al., and the 2012 Crouse et al., studies, respectively, linking PM2.5 and premature mortality. Taken together, these findings indicate that exposure to these pollutants at or below current levels found in Pittsburgh produce an increased risk of serious adverse health effects. Risk estimates derived from analysis of contemporary levels of hazardous (toxic) air pollutants in the Pittsburgh area also present a health concern. Reports reviewed for this assessment estimated lifetime combined cancer risks that substantially exceed the EPA’s most exposed individual and population-level risk targets for exposure to hazardous air pollutants. Results from the EPA 2005 NATA identified numerous Pittsburgh-area census tracts that exceed cancer and non-cancer risk levels of concern (with Allegheny County ranked in the top two percent in overall U.S. air pollution-related cancer risk and in the top two-tenths of one percent with respect to cancer risk from power plants and other large industrial sources), and thus support those findings.
28 THE HEINZ ENDOWMENTS
APPENDIX A: PITTSBURGH-RELATED AIR POLLUTION AND HEALTH STUDIES/REPORTS
Arena VC, Mazumdar S, Zborowski JV, Talbott EO, He S, Chuang Y-H, Schwerha JJ. 2006. “A Retrospective Investigation of PM10 in Ambient Air and Cardiopulmonary Hospital Admissions in Allegheny County, Pennsylvania: 1995 – 2000.” Journal of Occupational and Environmental Medicine; 48(1): 38 – 47.
Bell ML, McDermott A, Zeger SL, Samet JM, Dominici F. 2004. “Ozone and Short-term Mortality in 95 US Urban Communities: 1987 – 2000.” Journal of the American Medical Association; 292(19): 2372 – 2378.
Braga ALF, Zanobetti A, Schwartz J. 2000. “Do respiratory epidemics confound the association between air pollution and daily deaths?” European Respiratory Journal; 16: 723 – 728.
Carnegie Mellon University. Air Toxics in Allegheny County: Sources, Airborne Concentrations, and Human Exposure. 2009. Report submitted to Allegheny County Health Department. Carnegie Mellon University, Pittsburgh, PA.
Chock DP, Winkler SL, Chen C. 2000. “A Study of the Association between Daily Mortality and Ambient Air Pollution Concentrations in Pittsburgh, Pennsylvania.” Journal of the Air and Waste Management Association; 50: 1481 – 1500.
Clean Air Task Force. The Toll From Coal. 2010. Clean Air Task Force, Boston, MA.
Daniels MJ, Dominici F, Samet JM, Zeger SL. 2000. “Estimating Particulate Matter-Mortality Dose-Response Curves and Threshold Levels: An Analysis of Daily Time-Series for the 20 Largest US Cities.” American Journal of Epidemiology; 152(5): 397–406.
Daniels MJ, Dominici F, Zeger SL, Samet JM. 2004. The National Morbidity, Mortality, and Air Pollution Study Part III: PM10 Concentration–Response Curves and Thresholds for the 20 Largest US Cities.” Health Effects Institute Special Report #94. Health Effects Institute, Cambridge MA.
Dominici F, McDermott A, Zeger SL, Samet JM. 2003a. “National Maps of the Effects of Particulate Matter on Mortality: Exploring Geographic Variation.” Environmental Health Perspectives; 111(1): 39 – 43.
Dominici F, McDermott A, Zeger SL, Samet JM. 2003b. “Airborne Particulate Matter and Mortality: Timescale Effects in Four US Cities.” American Journal of Epidemiology; 157(12): 1055 – 1065.
Dominici F, McDermott A, Daniels M, Zeger SL, Samet JM. Mortality Among Residents of 90 Cities. 2003c. In Health Effects Institute Special Report Revised Analyses of Time-Series Studies of Air Pollution and Health. Health Effects Institute, Cambridge MA.
Dominici F, Zanobetti A, Zeger SL, Schwartz J, Samet JM. 2005a. “The National Morbidity, Mortality and Air Pollution Study, Part IV: Hierarchical Bivariate Time-Series Models—A Combined Analysis of PM10 Effects on Hospitalization and Mortality.” Health Effects Institute Research Report Number 94. Health Effects Institute, Cambridge, MA.
Dominici F, McDermott A, Daniels M, Zeger SL, Samet JM. 2005b. “Revised Analyses of the National Morbidity, Mortality and Air Pollution Study: Mortality Among Residents of 90 Cities.” Journal of Toxicology and Environmental Health, Part A; 68: 1071–1092. Note: Same data as HEI 2003 report
THE HEALTH IMPACTS OF PITTSBURGH AIR QUALITY: A REVIEW OF THE SCIENTIFIC LITERATURE, 1970–2012 29
Franklin M, Zeka A, Schwartz J. 2007. “Association between PM2.5 and All-cause and Specific-cause Mortality in 27 US Communities.” Journal of Exposure Science and Environmental Epidemiology; 17: 279–287.
Franklin M, Schwartz J. 2008. “The Impact of Secondary Particles on the Association between Ambient Ozone and Mortality.” Environmental Health Perspectives; 116(4): 453 – 458.
Glad JA, Brink LL, Talbott EO, Lee PC, Xu X, Saul M, Rager J. 2012. “The Relationship of Ambient Ozone and PM2.5 Levels and Asthma Emergency Department Visits: Possible Influence of Gender and Ethnicity.” Archives of Environmental and Occupational Health; 67(2): 103–108.
Lee P-C, Talbott EO, Roberts JM, Catov JM, Sharma RK, Ritz B. 2011. “Particulate Air Pollution Exposure and C-reactive Protein During Early Pregnancy.” Epidemiology; 22(4): 524–531.
Lee P-C, Roberts JM, Catov JM, Talbott EO, Ritz B. Published on-line April 28, 2012a. “First Trimester Exposure to Ambient Air Pollution, Pregnancy Complications and Adverse Birth Outcomes in Allegheny County, PA.” Maternal and Child Health Journal 2012; DOI 10.1007/s10995-012-1028-5.
Lee P-C, Talbott EO, Roberts JM, Catov JM, Bilonick RA, Stone RA, Sharma RK, Ritz B. 2012b. “Ambient air pollution exposure and blood pressure changes during pregnancy.” Environmental Research; 117: 46 – 53.
Logue JM, Small MJ, Robinson AL. 2009. “Identifying Priority Pollutant Sources: Apportioning Air Toxics Risks using Positive Matrix Factorization.” Environmental Science and Technology; 43(24): 9439–9444.
Logue JM, Small MJ, Stern D, Maranche J, Robinson AL. 2010. “Spatial Variation in Ambient Air Toxics Concentrations and Health Risks between Industrial-Influenced, Urban, and Rural Sites.” Journal of the Air and Waste Management Association; 60: 271–286.
Mazumdar S, Sussman N. 1983. “Relationships of Air Pollution to Health: Results from the Pittsburgh Study.” Archives of Environmental Health; 38(1): 17–24.
Samet JM, Dominici F, Curriero FC, Coursac I, Zeger SL. 2000a. “Fine Particulate Air Pollution and Mortality in 20 US Cities, 1987 – 1994.” The New England Journal of Medicine; 343(24): 1742-1749.
Samet JM, Zeger SL, Dominici F, Curriero FC, Coursac I, Dockery DW, Schwartz J, Zanobetti A. 2000b. “The National Morbidity, Mortality, and Air Pollution Study Part II: Morbidity and Mortality From Air Pollution in the United States.” Health Effects Institute Research Report Number 94. Health Effects Institute, Cambridge, MA.
Schwartz J. 2000. “The Distributed Lag between Air Pollution and Daily Deaths.” Epidemiology; 11(3): 320-326.
Schwartz J, Zanobetti A, Bateson T. 2003. Morbidity and Mortality Among Elderly Residents of Cities with Daily PM Measurements. In Health Effects Institute Special Report Revised Analyses of Time-Series Studies of Air Pollution and Health. Health Effects Institute, Cambridge, MA.
Schwartz J. 2004. “The Effects of Particulate Air Pollution on Daily Deaths: A Multi-City Case Crossover Analysis.” Occupational and Environmental Medicine; 61(12): 956 – 961.
Stebbings JH, Fogleman DG, McClain KE, Townsend MC. 1976. “Effect of the Pittsburgh Air Pollution Episode Upon Pulmonary Function in Schoolchildren.” Journal of the Air Pollution Control Association; 26(6): 547 – 553.
Stebbings JH, Fogleman DG. 1979. “Identifying a Susceptible Subgroup: Effects of the Pittsburgh Air Pollution Episode Upon Schoolchildren.” American Journal of Epidemiology; 110(1): 27 – 40.
30 THE HEINZ ENDOWMENTS
APPENDIX A
(CONTINUED)Wellenius GA, Bateson TF, Mittleman MA, Schwartz J. 2005a. “Particulate Air Pollution and the Rate of Hospitalization for Congestive Heart Failure among Medicare Beneficiaries in Pittsburgh, Pennsylvania.” American Journal of Epidemiology; 161(11): 1030 – 1036.
Wellenius GA, Schwartz ,J Mittleman MA. 2005b. “Air Pollution and Hospital Admissions for Ischemic and Hemorrhagic Stroke Among Medicare Beneficiaries.” Stroke; 36: 2549 – 2553.
Xu X, Zborowski JV, Arena VC, Rager J, Talbott EO. 2008. “Case-Crossover Analysis of Air Pollution and Cardiorespiratory Hospitalizations: Using Routinely Collected Health and Environmental Data for Tracking: Science and Data.” Journal of Public Health Management and Practice; 14(6): 569 – 576.
Xu X, Sharma RK, Talbott EO, Zborowski JV, Rager J, Arena VC, Volz CD. 2011. “PM10 air pollution exposure during pregnancy and term low birth weight in Allegheny County, PA, 1994–2000.” International Archives of Occupational and Environmental Health; 84: 251 – 257.
Zanobetti A, Schwartz J. 2002. “Cardiovascular Damage by Airborne Particles: Are Diabetics More Susceptible?” Epidemiology; 13(5): 588 – 592.
Zanobetti A, Schwartz J. 2008. “Mortality Displacement in the Association of Ozone with Mortality: An Analysis of 48 Cities in the United States.” American Journal of Respiratory and Critical Care Medicine; 177(2): 184– 189.
THE HEALTH IMPACTS OF PITTSBURGH AIR QUALITY: A REVIEW OF THE SCIENTIFIC LITERATURE, 1970–2012 31
APPENDIX B: STUDIES/REPORTS WITH NON-REPORTED PITTSBURGH AIR POLLUTION AND HEALTH DATA
Bell ML, Peng RD, Dominici F. 2006. “The Exposure–Response Curve for Ozone and Risk of Mortality and the Adequacy of Current Ozone Regulations.” Environmental Health Perspectives; 114(4): 532–536.
Bell ML, Ebisu K, Peng RD, Samet JM, Dominici F. 2009. “Hospital Admissions and Chemical Composition of Fine Particle Air Pollution.” American Journal of Respiratory and Critical Care Medicine; 179: 1115–1120.
Braga AL, Zanobetti A, Schwartz J. 2001. “The Lag Structure Between Particulate Air Pollution and Respiratory and Cardiovascular Deaths in 10 US Cities.” Journal of Occupational and Environmental Medicine; 43(11): 927–933.
Correia AW, Pope CA III, Dockery DW, Wang Y, Ezzati M, Dominici F. 2013. “Effect of Air Pollution Control on Life Expectancy in the United States.” Epidemiology; 24(1): 1–9.
Dominici F, Peng R, Bell ML, Pham L, McDermott A, Zeger SL, Samet JM. 2006. “Fine Particulate Air Pollution and Hospital Admission for Cardiovascular and Respiratory Diseases.” Journal of the American Medical Association; 295(10): 1127–1134.
Janssen NAH, Schwartz J, Zanobetti A, Suh HH. “Air Conditioning and Source-Specific Particles as Modifiers of PM10 on Hospital Admissions for Heart and Lung Disease.” Environmental Health Perspectives; 110(1): 43–49.
Krewski D, Burnett R, Jerrett M, Pope CA, Rainham D, Calle E, Thurston G, Thun M. 2005. “Mortality and Long-Term Exposure to Ambient Air Pollution: Ongoing Analyses Based on the American Cancer Society Cohort.” Journal of Toxicology and Environmental Health: Part A; 68(13-14): 1093–1109.
Krewski D, Jerrett M, Burnett RT, Ma R, Hughes E, Shi Y, Turner MC, Pope CA III, Thurston G, Calle EE, Thun MJ. 2009. “Extended Follow-Up and Spatial Analysis of the American Cancer Society Study Linking Particulate Air Pollution and Mortality,” Research Report Number 140. Health Effects Institute. Boston, MA.
Levy JI, Baxter LK, Schwartz J. 2009. “Uncertainty and Variability in Health-Related Damages From Coal-Fired Power Plants in the United States.” Risk Analysis; 29(7): 1000–1014.
Maisonet M, Bush TJ, Correa A, Jaakkola JJ. 2001. ”Relation between Ambient Air Pollution and Low Birth Weight in the Northeastern United States.” Environmental Health Perspectives; 109(supplement 3): 351–356.
Medina-Roman M, Zanobetti A, Schwartz J. 2006. “The Effect of Ozone and PM10 on Hospital Admissions for Pneumonia and Chronic Obstructive Pulmonary Disease: A National Multicity Study.” American Journal of Epidemiology; 163(6): 579–588.
Peng RD, Dominici F, Pastor-Barriuso R, Zeger SL, Samet JM. 2005. “Seasonal Analyses of Air Pollution and Mortality in 100 US Cities.” American Journal of Epidemiology; 161(6): 585–594.
Peng RD, Chang HH, Bell ML, McDermott A, Zeger SL, Samet JM, Dominici F. 2008. “Coarse Particulate Matter Air Pollution and Hospital Admissions for Cardiovascular and Respiratory Diseases among Medicare Patients.” Journal of the American Medical Association; 299(18): 2172–2179.
32 THE HEINZ ENDOWMENTS
Peng RD, Bell ML, Geyh AS, McDermott A, Zeger SL, Samet JM, Dominici F. 2009. “Emergency Admissions for Cardiovascular and Respiratory Diseases and the Chemical Composition of Fine Particle Air Pollution.” Environmental Health Perspectives; 117(6): 957–963.
Pope CA III, Thun MJ, Nambooridi MM, Dockery DW, Evans JS, Speizer FE, Heath CW Jr. 1995. “Particulate Air Pollution as a Predictor of Mortality in a Prospective Study of US Adults.” American Journal of Respiratory and Critical Care Medicine; 151: 669–674.
Zanobetti A, Franklin M, Koutrakis P, Schwartz J. 2009. “Fine particulate air pollution and its components in association with cause-specific emergency admissions.” Environmental Research; 8:58.
Zeka A, Zanobetti A, Schwartz J. 2005. “Short term effects of particulate matter on cause specific mortality: effects of lags and modification by city characteristics.” Occupational and Environmental Medicine; 62: 718–725.
Zeka A, Zanobetti A, Schwartz J. 2006. “Individual-level modifiers of the effects of particulate matter on daily mortality.” American Journal of Epidemiology; 163(9): 849–859.
APPENDIX B
(CONTINUED)
THE HEALTH IMPACTS OF PITTSBURGH AIR QUALITY: A REVIEW OF THE SCIENTIFIC LITERATURE, 1970–2012 33
APPENDIX C: ADDITIONAL REFERENCES
Adams WC. 2006. “Comparison of Chamber 6.6-h Exposures to 0.04 – 0.08 PPM Ozone via Square-wave and Triangular Profiles on Pulmonary Responses.” Inhalation Toxicology; 18: 127–136.
American Lung Association. 2012. State of the Air 2012. American Lung Association. Washington, D.C.
Clean Air Task Force. 2011. Fine Particulate Matter (PM2.5) and Ozone (O3) Air Quality in Western Pennsylvania. Clean Air Task Force. Boston, MA.
Crouse DL, Peters PA, van Donkelaar, Goldberg MS, Villeneuve PJ, Brion O, Khan S, Atari DO, Jerrett M, Pope CA III, Brauer M, Brook JR, Martin RV, Stieb D, Burnett RT. 2012. “Risk of Nonaccidental and Cardiovascular Mortality in Relation to Long-term Exposure to Low Concentrations of Fine Particulate Matter: A Canadian National-Level Cohort Study.” Environmental Health Perspectives; 120(5): 708–714.
Dockery DW, Pope CA III, Xu X, Spengler JD, Ware JH, Fay ME, Ferris BG Jr, Speizer FE. 1993. “An Association Between Air Pollution and Mortality in Six US Cities.” The New England Journal of Medicine; 329: 1753–1759.
Ely SB. 1948. “General Atmospheric Pollution: Some Work in Pittsburgh Air Pollution Problems.” Atmospheric Pollution; 38: 960–961.
Frey HC, Samet JM. 2012. Clean Air Scientific Advisory Committee Ozone Review Panel letter to EPA Administrator Lisa Jackson, CASAC Review of the EPA’s Integrated Science Assessment for Ozone and Related Photochemical Oxidants (Third External Review Draft — June 2012). November 14, 2012.
Guha N, Loomis D, Grosse Y, Lauby-Secretan B, El Ghissassi F, Bouvard V, Benbrahim-Tallaa L, Baan R, Mattock H, Straif K. 2012. “Carcinogenicity of trichloroethylene, tetrachloroethylene, some other chlorinated solvents, and their metabolites.” The Lancet Oncology; 13(12): 1192–1193.
Henderson RF. 2005. EPA’s Review of the National Ambient Air Quality Standards for Particulate Matter (Second Draft PM Staff Paper, January 2005): A Review by the Particulate Matter Review Panel of the EPA Clean Air Scientific Advisory Committee. June 6, 2005.
Henderson RF. 2008. Clean Air Scientific Advisory Committee Ozone Review Panel Letter to EPA Administrator Lisa Jackson, CASAC Recommendations Concerning the Final Rule for the National Ambient Air Quality Standards for Ozone (EPA-CASAC-08-009). April 7, 2008.
Hertz- Picciotto I. 1995. “Epidemiology and Quantitative Risk Assessment: A Bridge from Science to Policy.” American Journal of Public Health; 85(4): 484–491.
Jerrett M, Burnett RT, Ma R, Pope III CA, Krewski D, Newbold KB, Thurston G, Shi Y, Finkelstein N, Calle EE, Thun MJ. 2005. “Spatial Analysis of Air Pollution and Mortality in Los Angeles.” Epidemiology; 16(6): 727–736.
Miller KA, Siscovick SA, Sheppard L, Shepherd K, Sullivan JH, Anderson GL, Kaufman JD. 2007. “Long-term Exposure to Air Pollution and Incidence of Cardiovascular Events in Women.” The New England Journal of Medicine; 356(5): 447–458.
34 THE HEINZ ENDOWMENTS
Puett RC, Hart JE, Yanosky JD, Paciorek C, Schwartz J, Suh H, Speizer FE, Laden F. 2009. “Chronic Fine and Coarse Particulate Exposure, Mortality, and Coronary Heart Disease in the Nurses’ Health Study.” Environmental Health Perspectives; 117(11): 1697–1701.
Samet J. 2010. Letter from Dr. Jonathan M. Samet, Chair, Clean Air Scientific Advisory Committee to the Honorable Lisa P. Jackson, Administrator, U.S. EPA. CASAC Review of Policy Assessment for the Review of the PM NAAQS — Second External Review Draft (June 2010). September 10, 2010.
Schegele ES, Morales CA, Walby WF, Marion S, Allen RP. “6.6 Hour Inhalation of Ozone Concentrations from 60 to 87 Parts Per Billion in Healthy Humans.” 2009. American Review of Respiratory and Critical Care Medicine. 180: 265–272.
U.S. Environmental Protection Agency. 2011. Policy Assessment for the Review of the Particulate Matter National Air Quality Standard. EPA/452/R-11-003. U.S. Environmental Protection Agency. Research Triangle Park, N.C.
U.S. Environmental Protection Agency. 2009. Integrated Science Assessment for Particulate Matter EPA/600/R-08/139F. U.S. Environmental Protection Agency. Research Triangle Park, N.C.
U.S. Environmental Protection Agency. 2012a. Integrated Science Assessment for Ozone and Related Photochemical Oxidants: Third External Review Draft. EPA/600/R-10/076C. U.S. Environmental Protection Agency. Research Triangle Park, N.C.
U.S. Environmental Protection Agency. 2012b. Provisional Assessment of Recent Studies on the Health Effects of Particulate Matter Exposure. EPA/600/R–12/056F. U.S. Environmental Protection Agency. Research Triangle Park, N.C.
White RH, Fox M, Cooper GS, Bateson TF, Burke TA, Samet JM. 2012. “Workshop Report: Evaluation of Epidemiological Data Consistency for Application in Regulatory Risk Assessment.” The Open Epidemiology Journal (Accepted for publication).
World Health Organization. 2000. Evaluation and Use of Epidemiological Evidence for Environmental Health Risk Assessment EUR/00/5020369. World Health Organization Regional Office for Europe. Copenhagen, Denmark.
APPENDIX C
(CONTINUED)

COVER PHOTO BY JOSHUA FRANZOS / DESIGN BY LANDESBERG DESIGN
E Printed on Lynx paper, which is FSC® certified, SFI® Certified Sourcing, and Rainforest Alliance Certified.™
THE HEINZ ENDOWMENTS
Howard Heinz EndowmentVira I. Heinz Endowment 625 Liberty Avenue, 30th FloorPittsburgh, PA 15222-3115
412.281.5777www.heinz.org