Embed Size (px)
Citation preview
Air quality, health and toxics impacts of the proposed coal power cluster in Payra, Bangladesh
Key messages ● Bangladesh and Barisal are already suffering from high levels of air pollution,
increasing the risk of many chronic diseases, lowering life expectancy and making the country more vulnerable to the COVID-19 pandemic.
● The seven coal-fired power plants proposed in Payra would constitute one of the largest air pollutant, mercury and CO2 emissions hotspots in South Asia and the world.
● The plants would emit an estimated 600-800 kg of mercury per year into the air, of which one third would be deposited into land and freshwater ecosystems in Bangladesh. Most of the deposition takes place onto cropland and into waterways, increasing the mercury concentrations in food. The levels of mercury deposition are potentially dangerous in an area with 500,000 - 1,500,000 inhabitants. This does not include releases into water which would add to the impact.
● The air pollutant emissions from the plants would be responsible for a projected 18,000-35,000 air pollution-related deaths over an operating life of 30 years. Other health impacts include 71,000 asthma emergency room visits, 15,000 new cases of asthma in children, 39,000 preterm births, 26 million days of work absence (sick leave) and 57,000 years lived with disability related to chronic obstructive pulmonary disease, diabetes and stroke.
Contents
Key messages 1
Contents 2
Abstract 3
Results: Emissions 4
Results: Air Quality and Health 8
Results: Toxic Deposition 14
How air pollution worsens the COVID-19 pandemic 20
Materials and methods 22
References 26
Abstract Bangladesh is among the countries most affected by air pollution, with the life expectancy in the country reduced by almost 2 years due to the impacts of pollution exposure on health (Apte et al 2018). Dhaka was ranked as the second most polluted capital city in the world, after New Delhi, with average PM2.5 pollution levels more than 8 times as high as the World Health Organization guideline and 6 times the country’s national standards (IQAir 2020).
The high levels of air pollution are currently putting the Bangladeshi population at an elevated risk from the unfolding COVID-19 epidemic. Air pollution increases the risk of many pre-existing conditions that make COVID-19 more severe and deadly, including diabetes, lung diseases, asthma, heart disease and cancer. These health conditions substantially increase the risk of hospitalization and death for COVID-19 patients. Hundreds of thousands of Bangladesh citizens were already suffering from chronic diseases and disabilities or undergoing treatments like chemotherapy because of their past exposure to air pollution, and this is making them more vulnerable to COVID-19. It's also likely that the risk of infection is affected by the impact of air pollution on the immune system, and the respiratory symptoms for infected people are made worse by air pollution - there is evidence of this for respiratory infections in general but not yet specifically for COVID-19.
Threatening to worsen this situation is a large number of proposed coal-fired power plants, the sixth largest pipeline in the world, combined with very lax emission standards for such plants.
A hotspot for these coal power expansion plans is a massive cluster of coal-fired power plants, with a total of 8 power pla nts with 16 boilers and a total capacity of 9.8 gigawatts is being proposed in Payra, Bangladesh, making it the second-largest in South Asia and fourth-largest in the world.
The coal-fired power plants proposed in Payra would constitute one of the largest air pollutant, mercury and CO2 emissions hotspots in South Asia and the world.
Emissions for 7 of the 8 coal power plants were modeled for two different scenarios, “low” and “high”, depending on the SO2 control techniques required at the plants for which specific information is not available.
In the high emissions scenario, SO2 emissions from the plants would expose up to 80,000 people to exceedances of the WHO 24-hour guideline level for SO2 concentrations. As PM2.5 concentrations in the area already exceed both Bangladesh national air quality
standards and WHO guidelines, the plants would worsen the air quality compliance situation in both emissions scenarios.
In the high emissions scenario, the increased air pollutant concentrations resulting from all the plants being built and operated would result in a projected 720 deaths per year, due to increased risk of stroke, heart disease, lung cancer and respiratory diseases, including lower respiratory infections in children. Other impacts include 1,800 asthma emergency room visits, 600 new cases of asthma in children, 1,600 preterm births, 600,000 days of work absence (sick leave), and 1,200 person-years of disability related to strokes and chronic respiratory disease. In the low emissions scenario, the impacts amount to 380 air pollution-related deaths per year.
Over 30 years of operation, in the high emissions scenario, the emissions from the plants are projected to contribute to 34,000 deaths, of which 4,900 due to chronic obstructive pulmonary disease, 11,000 to ischaemic heart disease, 2,700 due to lower respiratory infections of which 300 in children, 1,800 due to lung cancer and 8,900 due to stroke. 2,400 deaths are due to deaths related to NO2 exposure.
Other health impacts include 71,000 asthma emergency room visits, 15,000 new cases of asthma in children, 39,000 preterm births, 26 million days of work absence (sick leave) and 57,000 years lived with disability related to chronic obstructive pulmonary disease, diabetes and stroke.
In the low emissions scenario, the projected number of premature deaths due to air pollutant exposure is 18,000.
These projects would emit an estimated 600-800 kg of mercury per year into the air, of which one third would be deposited into land and freshwater ecosystems in Bangladesh, affecting cropland and fisheries in particular. The levels of mercury deposition are potentially dangerous in an area with 500,000 - 1,500,000 inhabitants. This does not include releases into water which would add to the impact.
Results: Emissions Environmental Impact Assessment reports were available for the Payra and Patuakhali (Payra Phase II) power projects. As the status of the Sena Kalyan Sangstha (SKS) project is unclear, this study assessed the impacts of the seven active projects and did not include SKS (Table 1).
The Patuakhali EIA also presented estimated emissions rates for the other power projects in the area (p 237). For NOx and particulate matter, these emission rates are very similar to those reported for the two projects with EIAs. However, for SO2, the emissions rates were
considerably higher, implying that less effective SO2 control technology could be installed.
To capture the uncertainty, two emissions scenarios were modeled (Table 3), one using the average of the emissions rates for the two projects for the other plants (low emissions), the other using the emissions projections from the Patuakhali EIA (high emissions). The higher SO2 emissions levels in the “high emissions” scenario are likely achievable without the use of SO2 scrubbers, which also entails higher mercury emissions levels. For the Barisal project, a statement on the website of Sinohydro Foundation Engineering 1
indicated that the plant would have wet flue gas desulfurization, but there was no further information; this was assumed to be true and emissions levels similar to those given in Payra and Patuakhali EIAs were assumed for both “low” and “high” scenarios.
In all scenarios, the plants are assumed to fully and properly operate their emissions controls. If there are gaps in operation & maintenance or enforcement, the emissions and impacts could be considerably higher.
In both scenarios, all plants were assumed to run at a capacity factor of 74%, as in the Payra EIA. Stack height and other properties affecting plume rise were generalized from values given in the two EIAs (Table 2).
Multiple issues were found with the emission data provided in the EIAs. They failed to provide mercury emissions for any of the projects. The PM2.5 emissions of the Patuakhali plant were given as less than 1/10th of PM10 emissions, which is not physically plausible. If this data was used for air quality modeling, it means that PM2.5 air quality impacts were grossly underestimated.
The emissions numbers for the Payra EIA are inconsistent - the emissions rates expressed in grams per second are much higher than they should be based on the reported composition of the fuel and the flue gas concentrations claimed to be achieved.
Both the Payra and Patuakhali EIAs claim that the emission levels cited in the reports are in compliance with the guidelines of the International Finance Corporation (IFC) of the World Bank Group. However, the air quality data provided in the EIAs themselves makes it clear that the air quality in the project area is in violation of both the Bangladesh Ambient Air Quality Standard and the World Health Organization guideline for annual average PM2.5 concentrations, the single most important air quality standard for the protection of public health. This means that if the projects intend to follow the IFC guidelines, they should adopt the values for degraded airshed, which are significantly stricter than the
1 https://www.chinafec.com/Item/10788.aspx
applied values. Hence the EIAs mislead the public about the emission control technology they intend to adopt and their compliance with international guidelines.
The existence of such elementary errors in the cornerstone data used in the EIAs makes it appear that the reports have not been independently reviewed by the regulator, raising serious questions about the level of regulatory oversight.
The Patuakhali EIA uses exceptional sleight-of-hand to obfuscate the fact that the project would contribute to violations of ambient air quality standard. The consultant first monitored air quality in the area, obtaining results showing that air quality norms are being violated. Instead of using these monitoring results as the baseline for actual air quality modeling, as per normal practice, the consultant defined an arbitrary baseline. This baseline included some selected air pollutant emissions sources in the region that added up to much lower concentrations than found in the monitoring. This enabled them to cook up results that show the contribution of the power plant and the baseline pollution levels adding up to a level below the air quality standard.
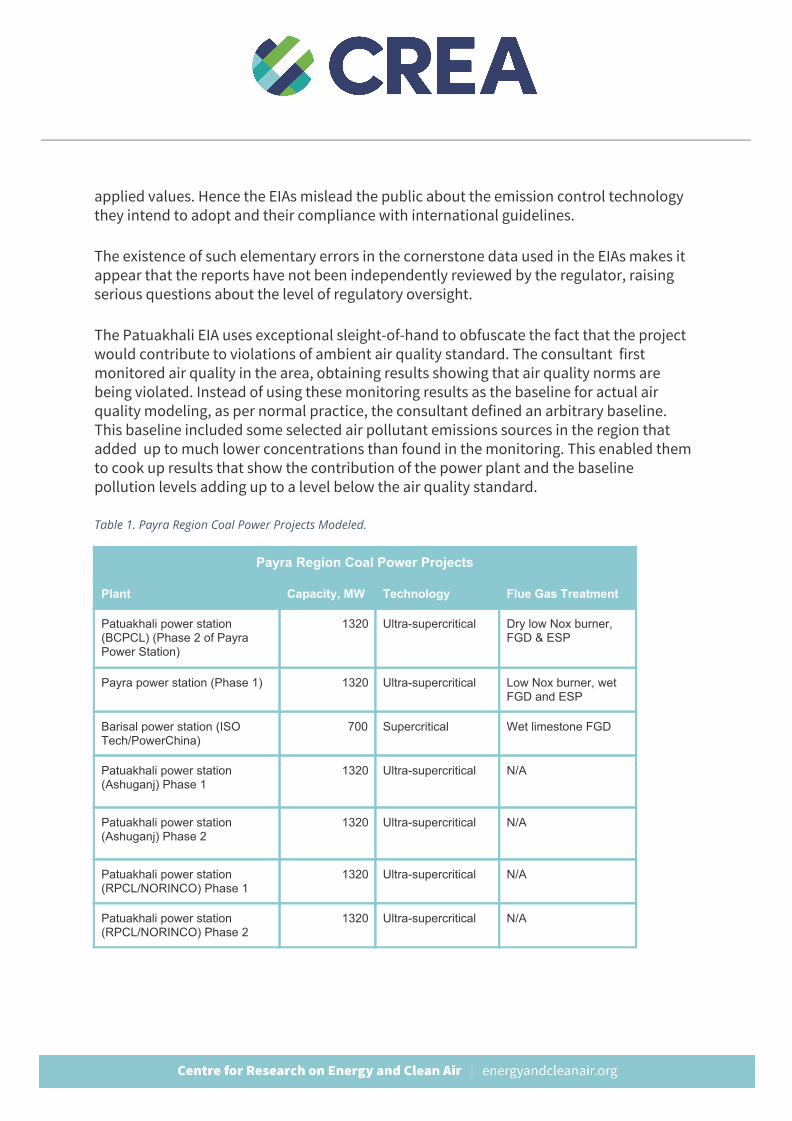
Table 1. Payra Region Coal Power Projects Modeled.
Payra Region Coal Power Projects
Plant Capacity, MW Technology Flue Gas Treatment
Patuakhali power station (BCPCL) (Phase 2 of Payra Power Station)
1320 Ultra-supercritical Dry low Nox burner, FGD & ESP
Payra power station (Phase 1) 1320 Ultra-supercritical Low Nox burner, wet FGD and ESP
Barisal power station (ISO Tech/PowerChina)
700 Supercritical Wet limestone FGD
Patuakhali power station (Ashuganj) Phase 1
1320 Ultra-supercritical N/A
Patuakhali power station (Ashuganj) Phase 2
1320 Ultra-supercritical N/A
Patuakhali power station (RPCL/NORINCO) Phase 1
1320 Ultra-supercritical N/A
Patuakhali power station (RPCL/NORINCO) Phase 2
1320 Ultra-supercritical N/A
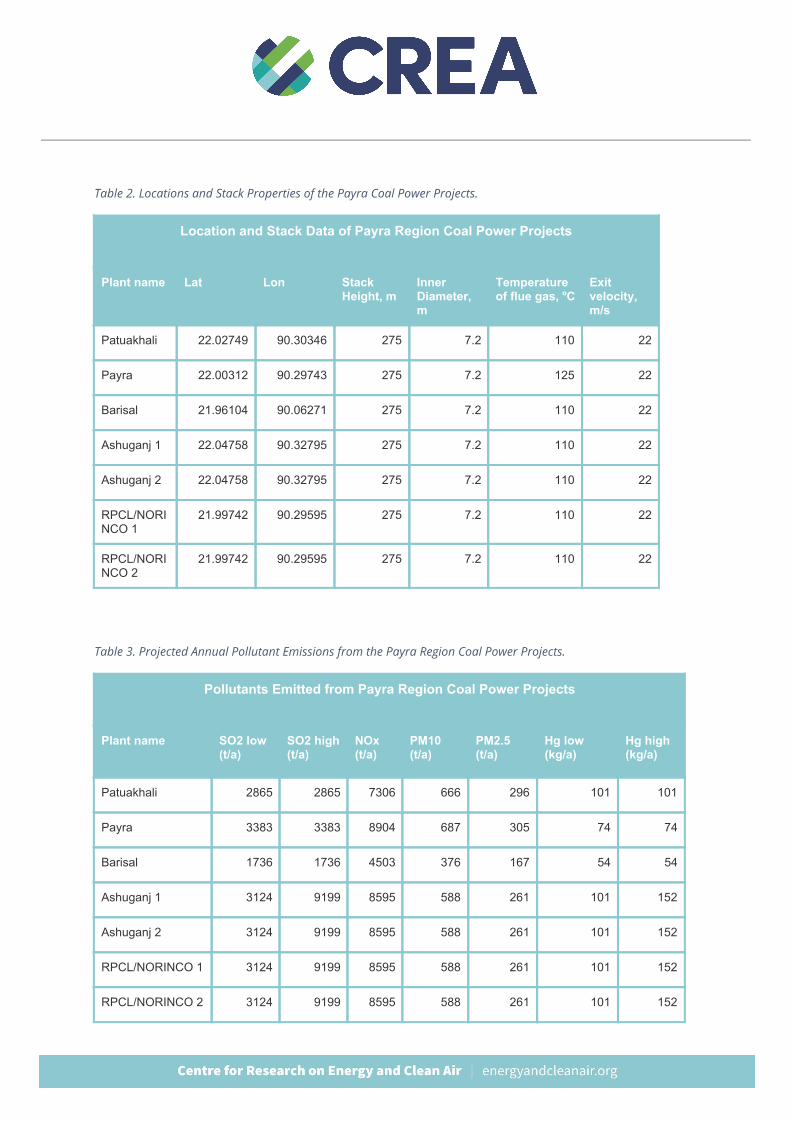
Table 2. Locations and Stack Properties of the Payra Coal Power Projects.
Location and Stack Data of Payra Region Coal Power Projects
Plant name Lat Lon Stack Height, m
Inner Diameter, m
Temperature of flue gas, oC
Exit velocity, m/s
Patuakhali 22.02749 90.30346 275 7.2 110 22
Payra 22.00312 90.29743 275 7.2 125 22
Barisal 21.96104 90.06271 275 7.2 110 22
Ashuganj 1 22.04758 90.32795 275 7.2 110 22
Ashuganj 2 22.04758 90.32795 275 7.2 110 22
RPCL/NORINCO 1
21.99742 90.29595 275 7.2 110 22
RPCL/NORINCO 2
21.99742 90.29595 275 7.2 110 22
Table 3. Projected Annual Pollutant Emissions from the Payra Region Coal Power Projects.
Pollutants Emitted from Payra Region Coal Power Projects
Plant name SO2 low (t/a)
SO2 high (t/a)
NOx (t/a)
PM10 (t/a)
PM2.5 (t/a)
Hg low (kg/a)
Hg high (kg/a)
Patuakhali 2865 2865 7306 666 296 101 101
Payra 3383 3383 8904 687 305 74 74
Barisal 1736 1736 4503 376 167 54 54
Ashuganj 1 3124 9199 8595 588 261 101 152
Ashuganj 2 3124 9199 8595 588 261 101 152
RPCL/NORINCO 1 3124 9199 8595 588 261 101 152
RPCL/NORINCO 2 3124 9199 8595 588 261 101 152
Results: Air Quality and Health This case study provides a detailed analysis of the air quality, toxic and health impacts of the coal power plant cluster in Payra, combining best available emissions data for the projects with detailed atmospheric modeling and existing epidemiological data and literature. It is the first study to model and predict air pollution impacts for proposed coal plants in the region, thus providing the first quantitative cumulative impact analysis. Currently, only one plant has been constructed. If all 8 coal plants are constructed, predicted impacts would be higher than projected in this study.
The air quality impacts of emissions from the plants were modeled using the CALPUFF dispersion model, which uses detailed hourly data on wind and other atmospheric conditions to track the transport, chemical transformation and deposition of pollutants, and is widely used to assess the short and long range impacts of emissions from industrial point sources and area sources. The model predicts the increases in hourly, daily and annual pollutant concentrations caused by emissions from the studied source.
Emissions from the power plants contribute to ambient concentrations of PM2.5, NO2 and SO2, causing increases in the risk of both acute and chronic diseases and symptoms (Table 5).
Table 4 shows that baseline PM2.5 levels were already around 2 times as high as Bangladesh ambient air quality standards and 3 times as high as WHO guidelines before any coal plants were built or proposed.
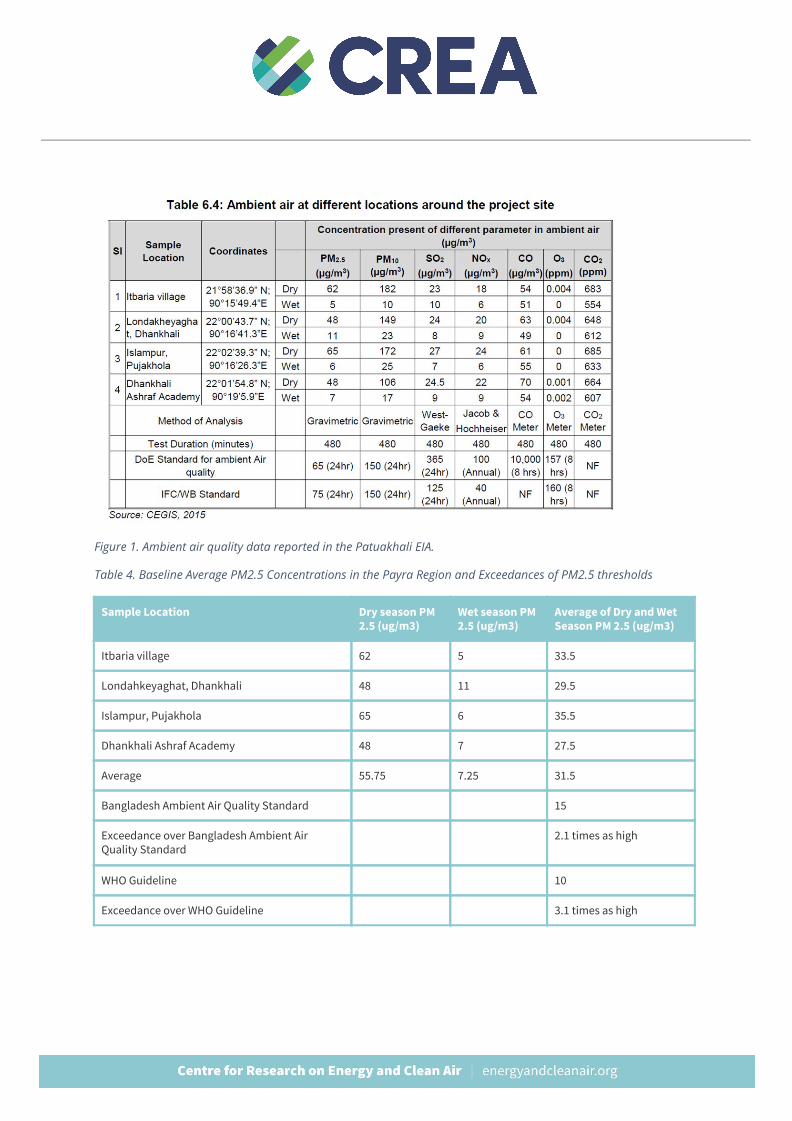
Figure 1. Ambient air quality data reported in the Patuakhali EIA. Table 4. Baseline Average PM2.5 Concentrations in the Payra Region and Exceedances of PM2.5 thresholds
Sample Location Dry season PM 2.5 (ug/m3)
Wet season PM 2.5 (ug/m3)
Average of Dry and Wet Season PM 2.5 (ug/m3)
Itbaria village 62 5 33.5
Londahkeyaghat, Dhankhali 48 11 29.5
Islampur, Pujakhola 65 6 35.5
Dhankhali Ashraf Academy 48 7 27.5
Average 55.75 7.25 31.5
Bangladesh Ambient Air Quality Standard 15
Exceedance over Bangladesh Ambient Air Quality Standard
2.1 times as high
WHO Guideline 10
Exceedance over WHO Guideline 3.1 times as high
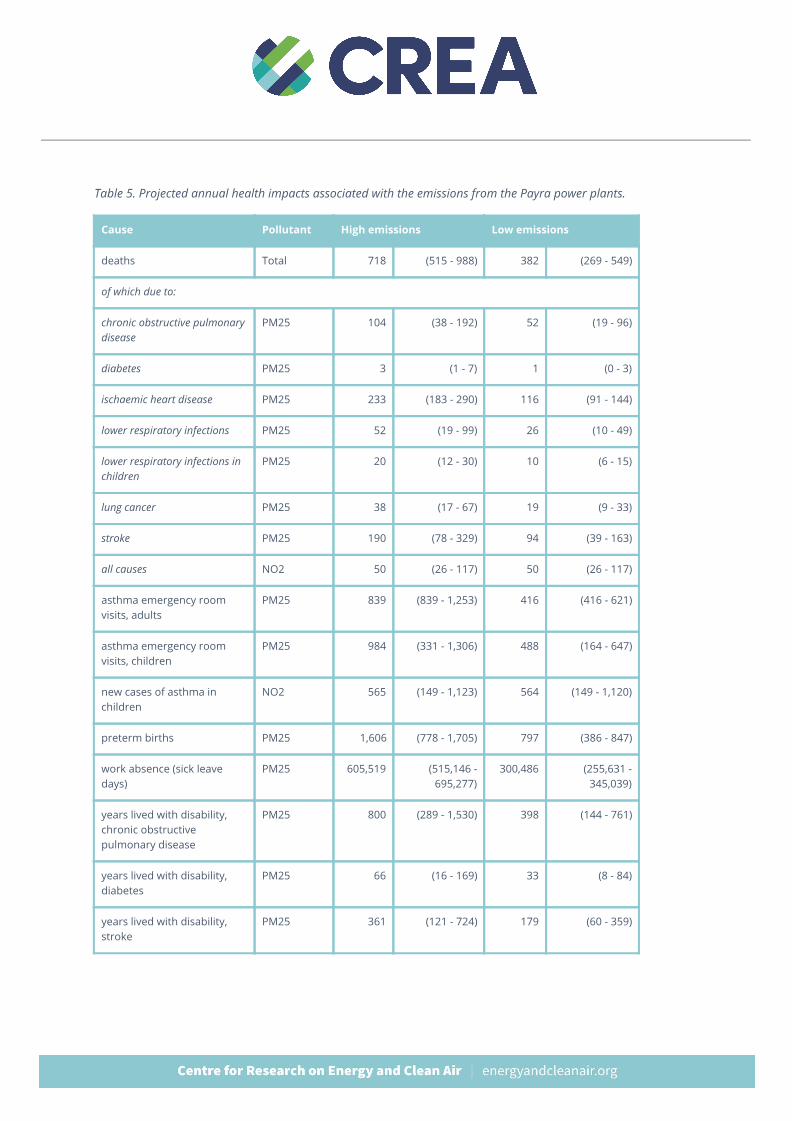
Table 5. Projected annual health impacts associated with the emissions from the Payra power plants.
Cause Pollutant High emissions Low emissions
deaths Total 718 (515 - 988) 382 (269 - 549)
of which due to:
chronic obstructive pulmonary disease
PM25 104 (38 - 192) 52 (19 - 96)
diabetes PM25 3 (1 - 7) 1 (0 - 3)
ischaemic heart disease PM25 233 (183 - 290) 116 (91 - 144)
lower respiratory infections PM25 52 (19 - 99) 26 (10 - 49)
lower respiratory infections in children
PM25 20 (12 - 30) 10 (6 - 15)
lung cancer PM25 38 (17 - 67) 19 (9 - 33)
stroke PM25 190 (78 - 329) 94 (39 - 163)
all causes NO2 50 (26 - 117) 50 (26 - 117)
asthma emergency room visits, adults
PM25 839 (839 - 1,253) 416 (416 - 621)
asthma emergency room visits, children
PM25 984 (331 - 1,306) 488 (164 - 647)
new cases of asthma in children
NO2 565 (149 - 1,123) 564 (149 - 1,120)
preterm births PM25 1,606 (778 - 1,705) 797 (386 - 847)
work absence (sick leave days)
PM25 605,519 (515,146 - 695,277)
300,486 (255,631 - 345,039)
years lived with disability, chronic obstructive pulmonary disease
PM25 800 (289 - 1,530) 398 (144 - 761)
years lived with disability, diabetes
PM25 66 (16 - 169) 33 (8 - 84)
years lived with disability, stroke
PM25 361 (121 - 724) 179 (60 - 359)
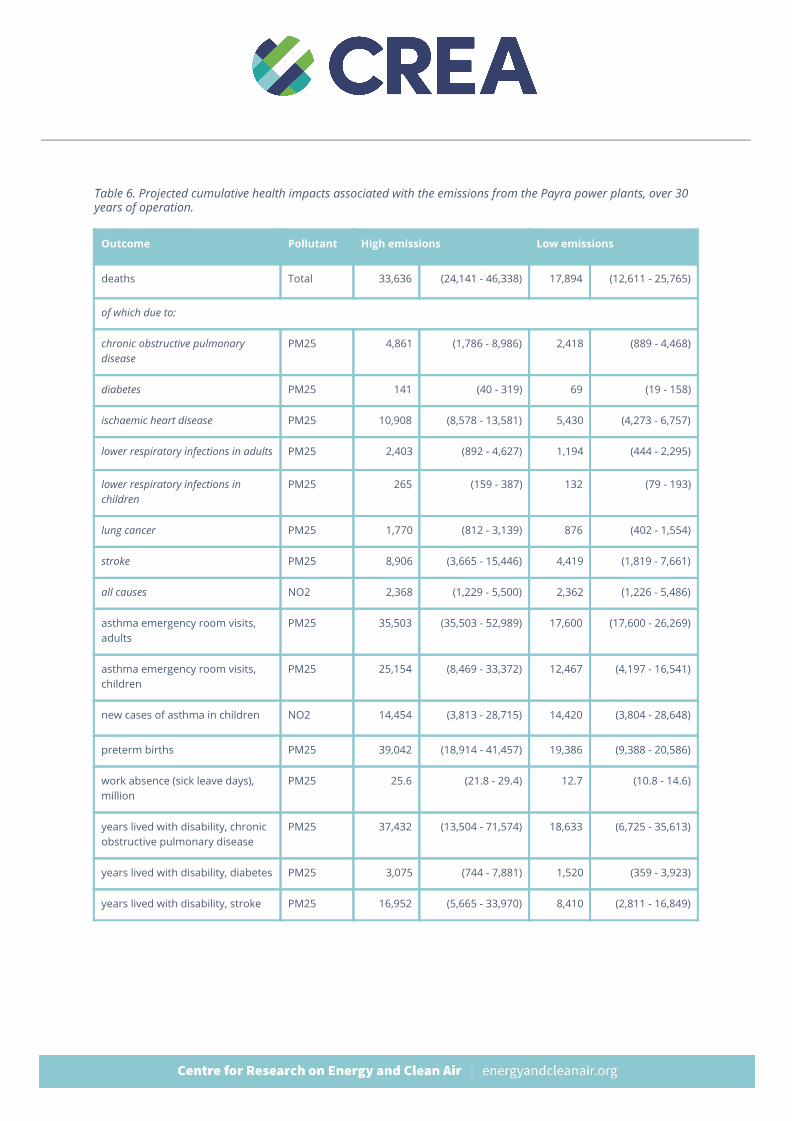
Table 6. Projected cumulative health impacts associated with the emissions from the Payra power plants, over 30 years of operation.
Outcome Pollutant High emissions Low emissions
deaths Total 33,636 (24,141 - 46,338) 17,894 (12,611 - 25,765)
of which due to:
chronic obstructive pulmonary disease
PM25 4,861 (1,786 - 8,986) 2,418 (889 - 4,468)
diabetes PM25 141 (40 - 319) 69 (19 - 158)
ischaemic heart disease PM25 10,908 (8,578 - 13,581) 5,430 (4,273 - 6,757)
lower respiratory infections in adults PM25 2,403 (892 - 4,627) 1,194 (444 - 2,295)
lower respiratory infections in children
PM25 265 (159 - 387) 132 (79 - 193)
lung cancer PM25 1,770 (812 - 3,139) 876 (402 - 1,554)
stroke PM25 8,906 (3,665 - 15,446) 4,419 (1,819 - 7,661)
all causes NO2 2,368 (1,229 - 5,500) 2,362 (1,226 - 5,486)
asthma emergency room visits, adults
PM25 35,503 (35,503 - 52,989) 17,600 (17,600 - 26,269)
asthma emergency room visits, children
PM25 25,154 (8,469 - 33,372) 12,467 (4,197 - 16,541)
new cases of asthma in children NO2 14,454 (3,813 - 28,715) 14,420 (3,804 - 28,648)
preterm births PM25 39,042 (18,914 - 41,457) 19,386 (9,388 - 20,586)
work absence (sick leave days), million
PM25 25.6 (21.8 - 29.4) 12.7 (10.8 - 14.6)
years lived with disability, chronic obstructive pulmonary disease
PM25 37,432 (13,504 - 71,574) 18,633 (6,725 - 35,613)
years lived with disability, diabetes PM25 3,075 (744 - 7,881) 1,520 (359 - 3,923)
years lived with disability, stroke PM25 16,952 (5,665 - 33,970) 8,410 (2,811 - 16,849)
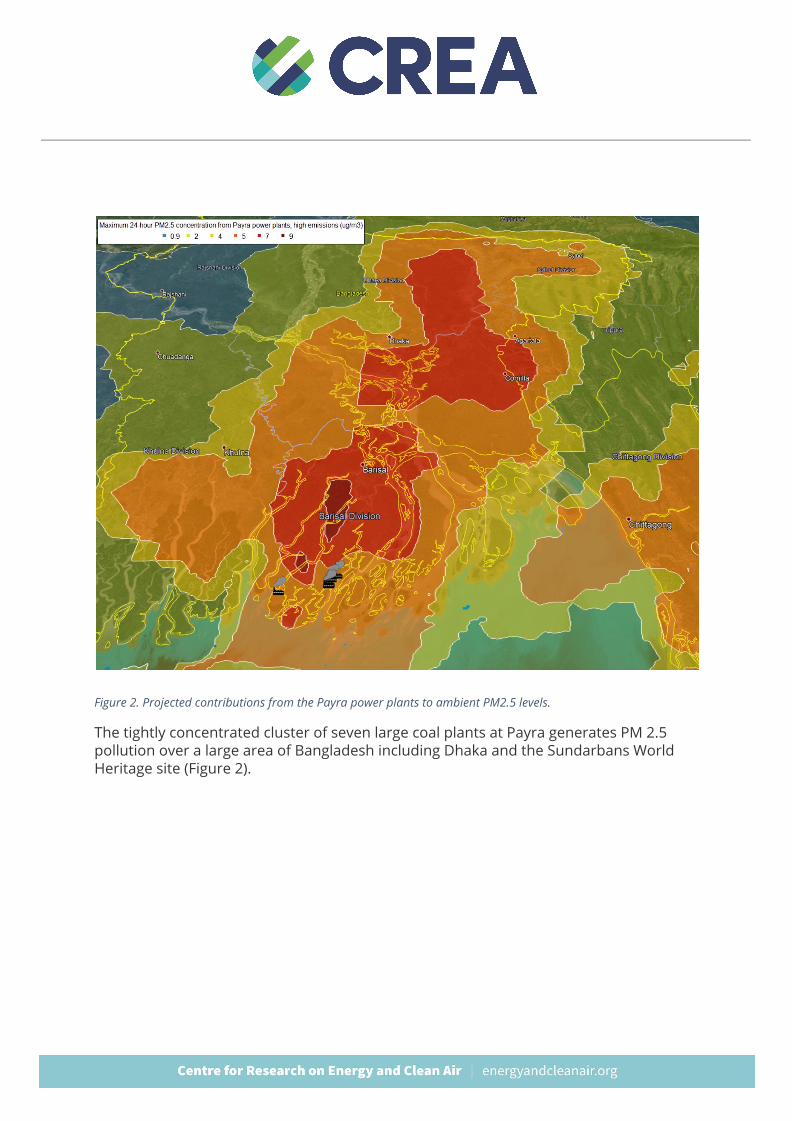
Figure 2. Projected contributions from the Payra power plants to ambient PM2.5 levels.
The tightly concentrated cluster of seven large coal plants at Payra generates PM 2.5 pollution over a large area of Bangladesh including Dhaka and the Sundarbans World Heritage site (Figure 2).
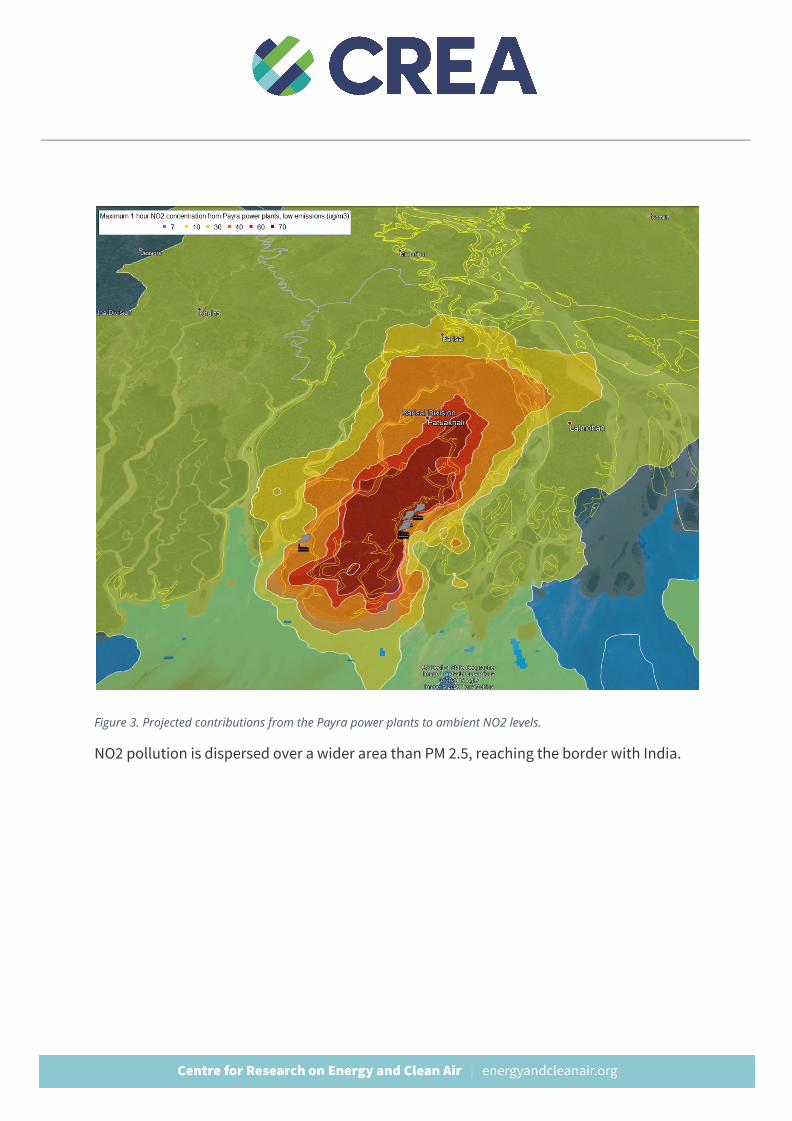
Figure 3. Projected contributions from the Payra power plants to ambient NO2 levels.
NO2 pollution is dispersed over a wider area than PM 2.5, reaching the border with India.
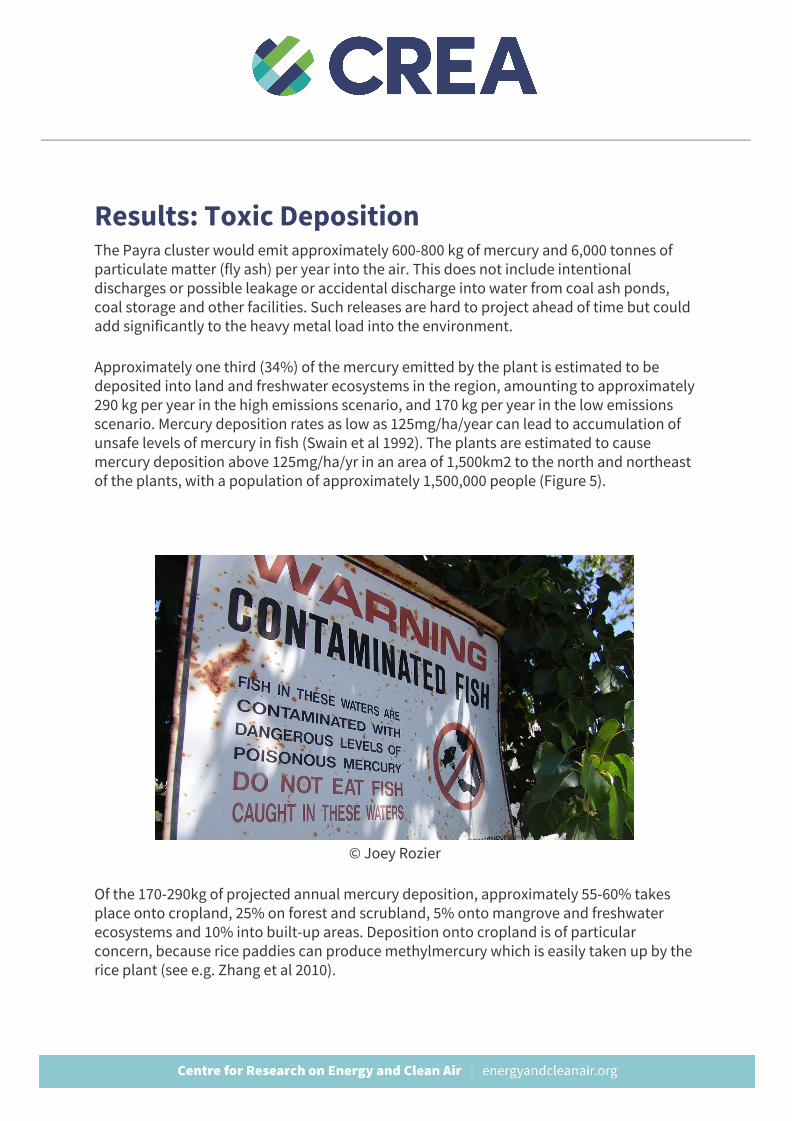
Results: Toxic Deposition The Payra cluster would emit approximately 600-800 kg of mercury and 6,000 tonnes of particulate matter (fly ash) per year into the air. This does not include intentional discharges or possible leakage or accidental discharge into water from coal ash ponds, coal storage and other facilities. Such releases are hard to project ahead of time but could add significantly to the heavy metal load into the environment.
Approximately one third (34%) of the mercury emitted by the plant is estimated to be deposited into land and freshwater ecosystems in the region, amounting to approximately 290 kg per year in the high emissions scenario, and 170 kg per year in the low emissions scenario. Mercury deposition rates as low as 125mg/ha/year can lead to accumulation of unsafe levels of mercury in fish (Swain et al 1992). The plants are estimated to cause mercury deposition above 125mg/ha/yr in an area of 1,500km2 to the north and northeast of the plants, with a population of approximately 1,500,000 people (Figure 5).
© Joey Rozier
Of the 170-290kg of projected annual mercury deposition, approximately 55-60% takes place onto cropland, 25% on forest and scrubland, 5% onto mangrove and freshwater ecosystems and 10% into built-up areas. Deposition onto cropland is of particular concern, because rice paddies can produce methylmercury which is easily taken up by the rice plant (see e.g. Zhang et al 2010).
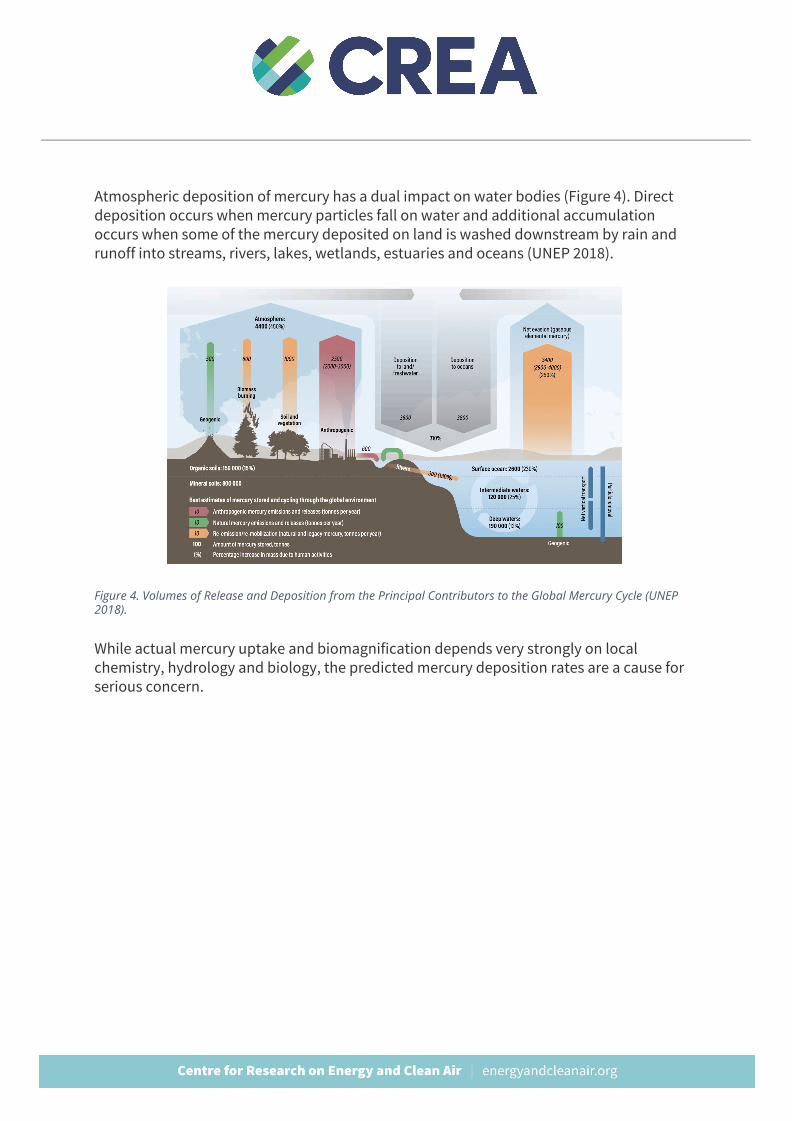
Atmospheric deposition of mercury has a dual impact on water bodies (Figure 4). Direct deposition occurs when mercury particles fall on water and additional accumulation occurs when some of the mercury deposited on land is washed downstream by rain and runoff into streams, rivers, lakes, wetlands, estuaries and oceans (UNEP 2018).
Figure 4. Volumes of Release and Deposition from the Principal Contributors to the Global Mercury Cycle (UNEP 2018).
While actual mercury uptake and biomagnification depends very strongly on local chemistry, hydrology and biology, the predicted mercury deposition rates are a cause for serious concern.
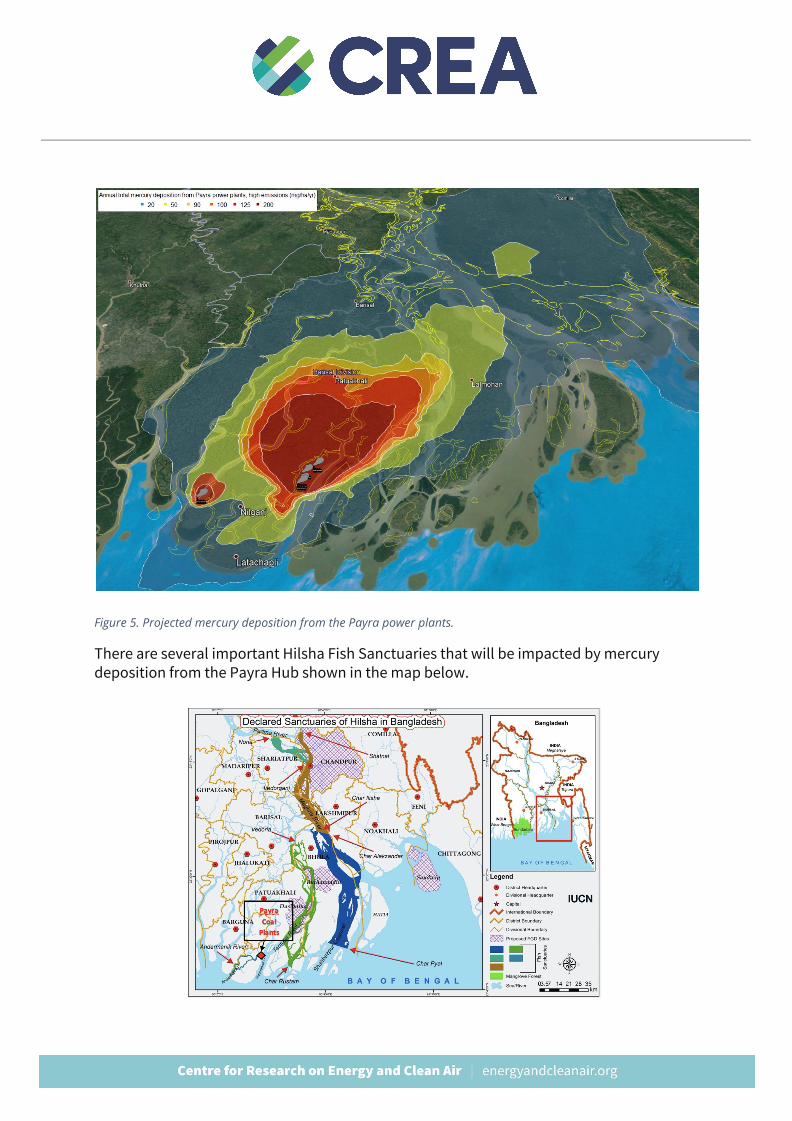
Figure 5. Projected mercury deposition from the Payra power plants.
There are several important Hilsha Fish Sanctuaries that will be impacted by mercury deposition from the Payra Hub shown in the map below.
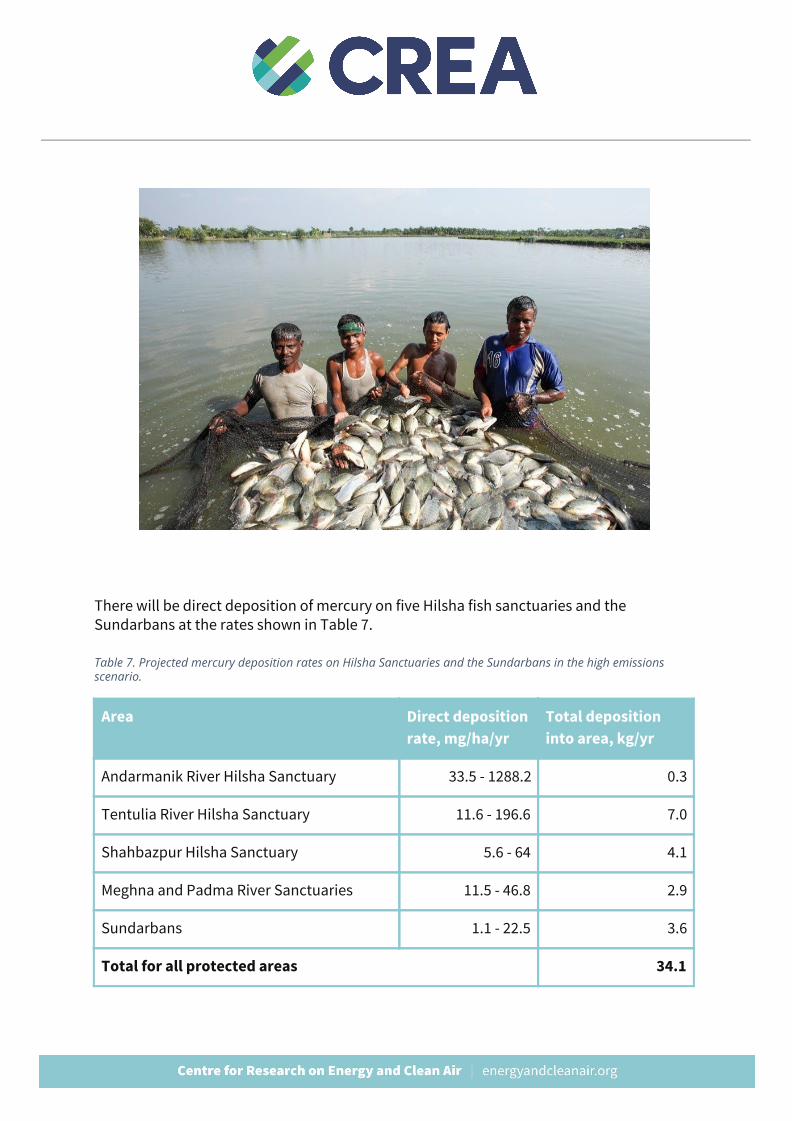
There will be direct deposition of mercury on five Hilsha fish sanctuaries and the Sundarbans at the rates shown in Table 7.
Table 7. Projected mercury deposition rates on Hilsha Sanctuaries and the Sundarbans in the high emissions scenario.
Area Direct deposition rate, mg/ha/yr
Total deposition into area, kg/yr
Andarmanik River Hilsha Sanctuary 33.5 - 1288.2 0.3
Tentulia River Hilsha Sanctuary 11.6 - 196.6 7.0
Shahbazpur Hilsha Sanctuary 5.6 - 64 4.1
Meghna and Padma River Sanctuaries 11.5 - 46.8 2.9
Sundarbans 1.1 - 22.5 3.6
Total for all protected areas 34.1
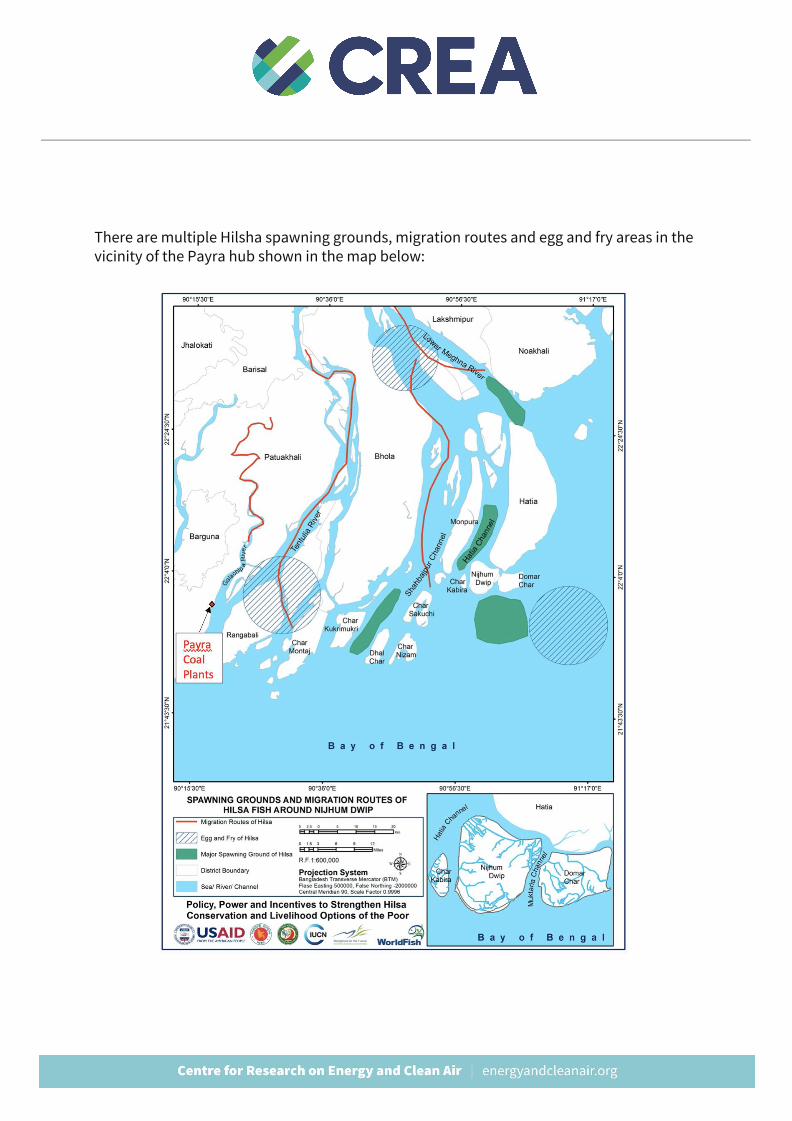
There are multiple Hilsha spawning grounds, migration routes and egg and fry areas in the vicinity of the Payra hub shown in the map below:
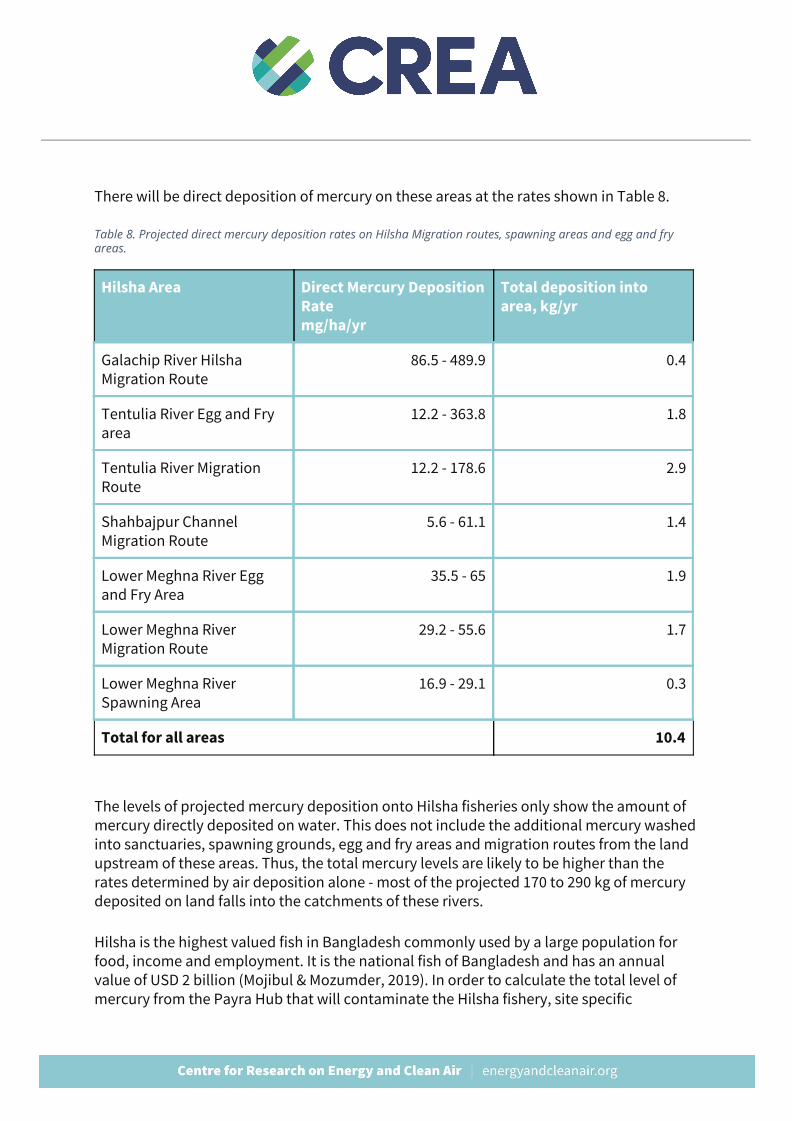
There will be direct deposition of mercury on these areas at the rates shown in Table 8.
Table 8. Projected direct mercury deposition rates on Hilsha Migration routes, spawning areas and egg and fry areas.
Hilsha Area Direct Mercury Deposition Rate mg/ha/yr
Total deposition into area, kg/yr
Galachip River Hilsha Migration Route
86.5 - 489.9 0.4
Tentulia River Egg and Fry area
12.2 - 363.8 1.8
Tentulia River Migration Route
12.2 - 178.6 2.9
Shahbajpur Channel Migration Route
5.6 - 61.1 1.4
Lower Meghna River Egg and Fry Area
35.5 - 65 1.9
Lower Meghna River Migration Route
29.2 - 55.6 1.7
Lower Meghna River Spawning Area
16.9 - 29.1 0.3
Total for all areas 10.4
The levels of projected mercury deposition onto Hilsha fisheries only show the amount of mercury directly deposited on water. This does not include the additional mercury washed into sanctuaries, spawning grounds, egg and fry areas and migration routes from the land upstream of these areas. Thus, the total mercury levels are likely to be higher than the rates determined by air deposition alone - most of the projected 170 to 290 kg of mercury deposited on land falls into the catchments of these rivers.
Hilsha is the highest valued fish in Bangladesh commonly used by a large population for food, income and employment. It is the national fish of Bangladesh and has an annual value of USD 2 billion (Mojibul & Mozumder, 2019). In order to calculate the total level of mercury from the Payra Hub that will contaminate the Hilsha fishery, site specific
watershed and waterbody modeling is needed. While actual mercury uptake and biomagnification depends very strongly on local chemistry, hydrology and biology, the predicted air deposition mercury deposition rates are a cause for serious concern and an assessment of the impacts and of measures to reduce mercury emissions is needed urgently.
How air pollution worsens the COVID-19 pandemic The high levels of air pollution in Bangladesh are currently putting the population at an elevated risk from the unfolding COVID-19 epidemic. Air pollution increases the risk of many pre-existing conditions that make COVID-19 more severe and deadly, including diabetes, lung diseases, asthma, heart disease and cancer. These health conditions substantially increase the risk of hospitalization and death for COVID-19 patients. Hundreds of thousands of Bangladesh citizens were already suffering from chronic diseases and disabilities or undergoing treatments like chemotherapy because of their past exposure to air pollution, and this is making them more vulnerable to COVID-19. It's also likely that the risk of infection is affected by the impact of air pollution on the immune system, and the respiratory symptoms for infected people are made worse by air pollution - there is evidence of this for respiratory infections in general but not yet specifically for COVID-19.
Air pollution is a major risk factor and contributor to the major chronic diseases that increase the severity and risk of death from COVID-19, including chronic respiratory diseases, cardiovascular diseases, hypertension, diabetes, strokes and cancers. People undergoing cancer treatments are at a higher risk because their immune system is compromised. (CDC 2020.) A study on Chinese patients found that the risk of severe symptoms requiring intensive care or ventilation, and the risk of death was elevated by 170% for people with chronic respiratory disease, by 60% for people with hypertension or diabetes, by 250% for people with cancer and by 80% for people with any of the pre-existing conditions listed above (Guan et al 2020). Another analysis of data from eight different studies on Chinese patients found that severely ill COVID-19 patients were 2.4 times as likely to suffer from hypertension, 2.5 times as likely to suffer from respiratory diseases and 3.4 times as likely to have cardiovascular diseases (Yang et al 2020).
In Bangladesh, air pollution is responsible for about 11% of the disease burden from diabetes, 16% of lung cancer, 15% of chronic obstructive pulmonary disease, 10% of deaths from ischemic heart disease and 6% from stroke (Table 7). Studies in China (Lin et al 2017) and the U.S. (Coogan et al 2016) have found strong associations between air pollution exposure and hypertension. This means that past air pollution exposure has made people around the world much more vulnerable to COVID-19 and is now contributing to the death toll and the enormous pressure on healthcare systems from the disease. Table 9 Contribution of air pollution to selected COVID-19 risk factors in Bangladesh (Global Burden of Disease Study 2017 ).
Disease Deaths Years Lived with Disability
Chronic obstructive pulmonary disease 30.5% 15.0%
Diabetes mellitus 8.5% 11.2%
Ischemic heart disease 9.7% 2.0%
Lower respiratory infections 18.1% 18.0%
Stroke 6.0% 4.2%
Lung cancer 15.7% 15.5%
This impact is highlighted by a pre-print study on COVID-19 deaths in the U.S., indicating dramatically higher risk of death in areas with higher past average PM2.5 pollution levels (Wu et al 2020). Multiple studies suggest that short-term exposure to elevated levels of air pollution increases the likelihood of infection with viruses that cause respiratory illness. A large study of more than 100,000 patients in the U.S. found that short-term spikes in PM2.5 air pollution increased acute lower respiratory infections requiring medical care, in both children and adults (Horne et al 2018). The same effect has been observed during smog episodes in e.g. in Beijing (Feng et al 2016, Liang et al 2014), Rome, Italy (Nenna et al 2017) and Brunei (Yadav et al 1998).
The suggested mechanisms that may link air pollution to virus transmission and likelihood of infection include damage to human airways and epithelial barriers (Donaldson and Tran
2002, Li et al 1996, Lee et al 2014), and pollution acting as “condensation nuclei” to which virus droplets attach allowing them to be transported in the air (Lee et al 2014) among others. These mechanisms are hypothesised, not certain, however early experimental evidence suggests that SARS-CoV-2 may remain viable as an aerosol for a number of hours (van Doremalen 2020).
Multiple studies exist that show that elevated levels of air pollution affects cells in a way that makes it easier for a virus to infect humans and start spreading (Harrod et al 2003, Jaspers et al 2005, Lee et al 2014). Studies concerning previous pandemics indicate that air pollution can cause severe symptoms or eventually death for some patients who have contracted the viral disease. For instance, when analyzing the early 2000s SARS outbreak, a positive association was found between air pollution and the SARS (SARS-CoV-1) fatality within the Chinese population (Cui et al 2003).
A study by Clay et al (2018) focused on the relationship between air pollution and the 1918 Spanish influenza mortality. They found that American cities that burned more coal saw higher mortality rates during the 1918 pandemic than neighboring cities that burned less coal.
In another study, mice were exposed to high levels of pollutants and then infected with influenza. The researchers found that PM caused increased levels of pulmonary oxidative stress in the mice and a compromised immune system to fight off the virus. Ultimately, this resulted in higher mortality rates (Lee et al 2014).
Materials and methods Since none of the EIAs contained information about mercury emissions, they were projected using the formula:
E Hg = CC x MC x (1 - CE),
where CC is the coal consumption of the plant in tonnes per year, MC is the mercury content of the coal, and CE is the capture efficiency. The Payra project EIA indicated Indonesia as the coal source so the UNEP default MC value was used. Patuakhali project’s EIA stated that the plant would burn a mixture of Australian and Indonesian coal, so MC was estimated as the average of the UNEP default values for the two countries; the same was done for all the other projects with no information about coal origin. Default capture efficiencies for ESP and wet FGD, or ESP only were used, as appropriate.
When information on CC was not available, it was estimated as:
CC = CAP / EFF x CF / CV,
where CAP is the electric capacity of the plant, EFF is the thermal efficiency (assumed 42% for supercritical and 44% for ultra-supercritical when data was not available), CF is the capacity factor of the plant and CV is the calorific value of the coal, per physical tonne. The CV value for coal used in Patuakhali plant was calculated from the EIA using the above formula, and this value was applied on the other projects.
Short-term air quality impacts were modeled assuming all plants are running at full capacity, while annual average impacts were modeled with the assumed average capacity factor of 74%.
Atmospheric dispersion modeling was carried out using version 7 (June 2015) of the CALPUFF modeling system. Meteorological and geophysical data for the simulations was generated with the TAPM model, developed by Australia’s national science agency CSIRO. A set of nested grids with a 37x37 grid size and 40km, 20km, 10km and 5km horizontal resolutions and 12 vertical levels was used, centered on the power plant cluster.
The CALPUFF model performs a detailed simulation of the rise of the plume from the power plant stack, through which the emissions are discharged; the characteristics of the modeled stacks are given in Table 2.
For emissions from main boilers of the power plants, 30% of emitted fly ash was assumed to be PM2.5, and 37.5% PM10, in line with the U.S. EPA (1998) AP-42 default value for electrostatic precipitators. Chemical transformation of sulphur and nitrogen species was modeled using the ISORROPIA chemistry module within CALPUFF, and required atmospheric chemistry parameters (monthly average ozone, ammonia and H2O2 levels) for the modeling domain were imported into the model from baseline simulations using the Geos-Chem atmospheric model (Koplitz et al 2017). The CALPUFF results were reprocessed using the POSTUTIL utility to repartition different nitrogen species (NO, NO2, NO3 and HNO3) based on background ammonia concentrations.
The health impacts resulting from the increase in PM2.5 concentrations were evaluated by assessing the resulting population exposure, based on high-resolution gridded population data for 2020 from CIESIN (2017), and then applying the Global Burden of Disease (IHME 2018) risk model for PM2.5, and health impact assessment recommendations of WHO HRAPIE (2013) for NO2, as implemented in Huscher et al (2017). Other health impacts were quantified using
GBD incidence data (IHME 2018) and concentration-response relationships compiled from latest scientific literature (Table 8).
As the concentration-response relationships used include non-linear functions and no-harm thresholds, information on baseline air pollutant concentrations is needed for the health impact assessment. This data was obtained from van Donkelaar et al (2016) for PM2.5 and Larkin (2017) for NO2.
Projections of future health impacts take into account projected population growth on the national level, and for mortality impacts, on projected changes in age-specific death rates based on UNPD (2019) medium variant. Importantly, use of age-specific death rates captures the impact of expected improvements in population health status and health services, which results in lower mortality for children, while increasing the susceptibility of the adult population to non-communicable diseases associated with air pollution.
Deposition results were differentiated by land use type using the European Space Agency global land use map for the year 2015 at 300m resolution (ESA 2018). Land use codes 10-30 were mapped as cropland; codes 50-100 were mapped as forest and code 170 as mangrove.
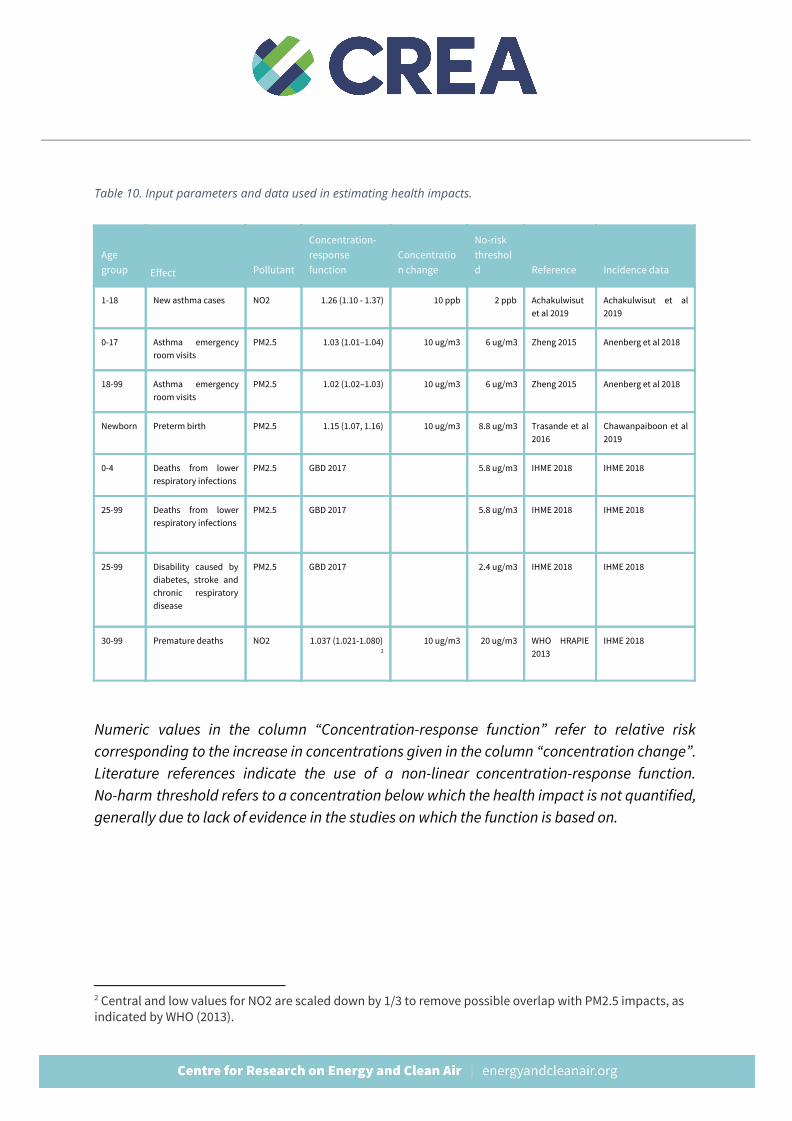
Table 10. Input parameters and data used in estimating health impacts.
Age group Effect Pollutant
Concentration- response function
Concentration change
No-risk threshold Reference Incidence data
1-18 New asthma cases NO2 1.26 (1.10 - 1.37) 10 ppb 2 ppb Achakulwisut et al 2019
Achakulwisut et al 2019
0-17 Asthma emergency room visits
PM2.5 1.03 (1.01–1.04) 10 ug/m3 6 ug/m3 Zheng 2015 Anenberg et al 2018
18-99 Asthma emergency room visits
PM2.5 1.02 (1.02–1.03) 10 ug/m3 6 ug/m3 Zheng 2015 Anenberg et al 2018
Newborn Preterm birth PM2.5 1.15 (1.07, 1.16) 10 ug/m3 8.8 ug/m3 Trasande et al 2016
Chawanpaiboon et al 2019
0-4 Deaths from lower respiratory infections
PM2.5 GBD 2017 5.8 ug/m3 IHME 2018 IHME 2018
25-99 Deaths from lower respiratory infections
PM2.5 GBD 2017 5.8 ug/m3 IHME 2018 IHME 2018
25-99 Disability caused by diabetes, stroke and chronic respiratory disease
PM2.5 GBD 2017 2.4 ug/m3 IHME 2018 IHME 2018
30-99 Premature deaths NO2 1.037 (1.021-1.080) 2
10 ug/m3 20 ug/m3 WHO HRAPIE 2013
IHME 2018
Numeric values in the column “Concentration-response function” refer to relative risk corresponding to the increase in concentrations given in the column “concentration change”. Literature references indicate the use of a non-linear concentration-response function. No-harm threshold refers to a concentration below which the health impact is not quantified, generally due to lack of evidence in the studies on which the function is based on.
2 Central and low values for NO2 are scaled down by 1/3 to remove possible overlap with PM2.5 impacts, as indicated by WHO (2013).
References Achakulwisut P, Brauer M, Hystad P, Anenberg SC 2019: Global, national, and urban
burdens of paediatric asthma incidence attributable to ambient NO2 pollution: estimates from global datasets. Lancet 3(4):E166-E178.
Anenberg SC, Henze DK, Tinney V, Kinney PL, Raich W, Fann N, Malley CS, Roman H, Lamsal L, Duncan B, Martin RV, van Donkelaar A, Brauer M, Doherty R, Jonson JE, Davila Y, Sudo K, Kuylenstierna JCI 2018: Estimates of the Global Burden of Ambient PM2.5, Ozone, and NO2 on Asthma Incidence and Emergency Room Visits. Environmental Health Perspectives 126:10. https://doi.org/10.1289/EHP3766.
Apte et al 2018 https://pubs.acs.org/doi/10.1021/acs.estlett.8b00360
CDC 2020. Groups at Higher Risk for Severe Illness. Centers for Disease Control and Prevention, Coronavirus Disease 2019 (COVID-19), April 2, 2020. https://www.cdc.gov/coronavirus/2019-ncov/need-extra-precautions/groups-at-higher-risk.html
Center for International Earth Science Information Network (CIESIN), Columbia University,
2017. Gridded Population of the World, Version 4 (GPWv4): Population Density, Revision 10. Palisades, NY: NASA Socioeconomic Data and Applications Center (SEDAC). https://doi.org/10.7927/H4DZ068D .
Chawanpaiboon S, Vogel JP, Moller AB, Lumbiganon P, Petzold M, Hogan D, Landoulsi S, Jampathong N, Kongwattanakul K, Laopaiboon M, Lewis C, Rattanakanokchai S, Teng DN, Thinkhamrop J, Watananirun K, Zhang J, Zhou W, Gülmezoglu AM 2019: Global, regional, and national estimates of levels of preterm birth in 2014: a systematic review and modelling analysis. Lancet Glob Health 7(1):e37-e46. https://doi.org/10.1016/S2214-109X(18)30451-0 .
Clay, K., Lewis, J. & Severnini, E. 2018. Pollution, Infectious Disease, and Mortality: Evidence from the 1918 Spanish Influenza Pandemic. NBER Working Paper No. 21635.
Coogan, P.F., White, L.F., Yu, J., Burnett, R.T., Seto, E., Brook, R.D., Palmer, J.R., Rosenberg,
L. & Jerrett M. 2017. PM2.5 and Diabetes and Hypertension Incidence in the Black Women’s Health Study. Epidemiology. 2016 Mar; 27(2):202-210. doi: 10.1097/EDE.0000000000000418
Cui, Y., Zhang, Z., Froines, J., Zhao, J., Wang, H., Yu, S. & Detels, R. 2003. Air pollution and
case fatality of SARS in the People’s Republic of China: an ecologic study. Environmental Health: A Global Access Science Source 2003, 2:15. DOI: 10.1186/1476-069X-2-15
Donaldson, K. & Tran, C.L. 2002. INFLAMMATION CAUSED BY PARTICLES AND FIBERS,
Inhalation Toxicology, 14(1):5-27, DOI: 10.1080/089583701753338613 van Donkelaar, A., R.V Martin, M.Brauer, N. C. Hsu, R. A. Kahn, R. C Levy, A. Lyapustin, A. M.
Sayer, and D. M Winker 2016, Global Estimates of Fine Particulate Matter using a Combined Geophysical-Statistical Method with Information from Satellites, Models, and Monitors, Environ. Sci. Technol. 50(7):3762-3772, https://doi.org/10.1021/acs.est.5b05833
Doremalen van, N., Bushmaker, T. & Morris, D.H. 2020. Aerosol and Surface Stability of SARS-CoV-2 as Compared with SARS-CoV-1. T he New England Journal of Medicine . DOI: 10.1056/NEJMc200497
European Space Agency (ESA), 2018. Land Cover Maps – v2.0.7.
http://maps.elie.ucl.ac.be/CCI/viewer/download.php
Feng, C., Li, J., Sun, W., Zhang, Y. & Wang, Q. 2016. Impact of ambient fine particulate matter (PM2.5) exposure on the risk of influenza-like-illness: a time-series analysis in Beijing, China. Environmental Health, 15:17. doi: 10.1186/s12940-016-0115-2
Global Burden of Disease Collaborative Network. Global Burden of Disease Study 2017
(GBD 2017) Results. Seattle, United States: Institute for Health Metrics and Evaluation (IHME), 2018. http://ghdx.healthdata.org/gbd-results-tool.
Guan, W-jie, Liang W-hua, Zhao, Y, et al. 2020. Comorbidity and its impact on 1590 patients with Covid-19 in China: A Nationwide Analysis. European Respiratory Journal 2020; in press (https://doi.org/10.1183/13993003.00547-2020 ).
Harrod, K.S., Jaramillo, R.J., Rosenberger, C.L., Wang, S., Berger, J.A., McDonald, J.D. & Reed, M.D. 2003. Increased Susceptibility to RSV Infection by Exposure to Inhaled Diesel Engine Emissions. American Journal of Respiratory Cell and Molecular Biology, 28(4):451-63, Apr 2003. DOI: 10.1165/rcmb.2002-0100OC
Huscher J, Myllyvirta L and Gierens R 2017: Modellbasiertes Health Impact Assessment zu grenzüberschreitenden Auswirkungen von Luftschadstoffemissionen europäischer Kohlekraftwerke. Umweltmedizin - Hygiene - Arbeitsmedizin Band 22, Nr. 2 (2017) https://www.ecomed-umweltmedizin.de/leseproben/umweltmedizin--hygiene--arbeitsmedizin-band-22-nr-2-2017-.pdf
Horne, B.D., Joy, E.A., Hoffmann, M.G., Gesteland, P.H., Cannon, J.B., Lefler, J.S., Blagev, D.P., Korgenski, E.K., Torosyan, N., Hansen, G.I., Kartchner, D., Pope III, C.A. 2018. Short-Term Elevation of Fine Particulate Matter Air Pollution and Acute Lower Respiratory Infection. American Journal of Respiratory and Critical Care Medicine , 198(6). https://doi.org/10.1164/rccm.201709-1883OC
Institute for Health Metrics and Evaluation (IHME) 2018: Global Burden of Disease Study 2017 (GBD 2017) Results. Seattle, United States. http://ghdx.healthdata.org/gbd-results-tool .
Jaspers, I. Ciencewicki, J.M., Zhang, W., Brighton, L.E., Carson, J.l., Beck, M.A. & Madden, M.C. 2005. Diesel exhaust enhances influenza virus infections in respiratory epithelial cells. Toxicological Sciences, 85(2):900-1002. DOI: 10.1093/toxsci/kfi141
Koplitz S, Jacob DJ, Sulprizio MP, Myllyvirta L, Reid C 2017: Burden of Disease from Rising
Coal-Fired Power Plant Emissions in Southeast Asia. Environmental Science & Technology. 51(3):1467-1476. http://dx.doi.org/10.1021/acs.est.6b03731.
IQAir 2020: 2019 World Air Quality Report. Region & City PM2.5 Ranking.
https://www.iqair.com/world-most-polluted-cities/world-air-quality-report-2019-en.pdf
Larkin A, Geddes JA, Martin RV, Xiao Q, Liu Y, Marshall JD, Brauer M, Hystad P 2017: Global Land Use Regression Model for Nitrogen Dioxide Air Pollution. Environmental Science & Technology 51(12):6957-6964. https://dx.doi.org/10.1021/acs.est.7b01148 .
Lee, G., Saravia, J., You, D., Shrestha, B., Jaligama, S., Hebert, V.Y., Dugas, T.R. & Cormier, S.A. 2014. Exposure to combustion generated environmentally persistent free radicals enhances severity of influenza virus infection. Particle and Fibre Toxicology 11:57. doi: 10.1186/s12989-014-0057-1
Li, X.Y., Gilmour, P.S., Donaldson, K. & MacNee, W. 1996. Free radical activity and pro-inflammatory effects of particulate air pollution (PM19) in vivo and in vitro. Thorax 51(12):1216-1222.
Liang, Y., Fang, L., Pan, H. et al. PM 2.5 in Beijing – temporal pattern and its association with
influenza. Environmental Health 13, 102 (2014). https://doi.org/10.1186/1476-069X-13-102
Lin, H., Guo, Y., Zheng, Y., Di, Q., Liu, T., Xiao, J., Li, X., Zeng, W., Cummings-Vaughn, L.A.,
Howard, S.W., Vaughn, M.G., Qian, Z.M., Ma, W. & Wu, F. 2017. Long-Term Effects of Ambient PM2.5 on Hypertension and Blood and Attributable Risk Among Older Chinese Adults. Hypertension. 2017; 69:806-812. DOI: 10.1161/HYPERTENSIONAHA.116.08839
Mojibul, Mohammad & M., Mozumder & Pyhälä, Aili & Wahab, Md & Sarkki, Simo &
Schneider, Petra & Islam, M. 2019: Understanding Social-Ecological Challenges of a Small-Scale Hilsa (Tenualosa ilisha) Fishery in Bangladesh. International Journal of Environmental Research and Public Health. 16. 4814. 10.3390/ijerph16234814. https://www.researchgate.net/publication/337656522_Understanding_Social-Ecological_Challenges_of_a_Small-Scale_Hilsa_Tenualosa_ilisha_Fishery_in_Bangladesh
Nenna, R., Evangelisti, M., Frassanito, A., Scagnolari, C., Pierangeli, A., Antonelli, G., Nicolai, A., Arima, S., Moretti, C., Papoff, P., Villa, M.P. & Midulla, F. 2017. Respiratory syncytial virus bronchiolitis, weather conditions and air pollution in an Italian urban area: An observational study. Environmental Research 158:188-193. https://doi.org/10.1016/j.envres.2017.06.014
Swain EB, Engstrom DR, Brigham ME, Henning TA, Brezonki PL 1992: Increasing Rates of
Atmospheric Mercury Deposition in Midcontinental North America. Science 257(5071):784-787. https://doi.org/10.1126/science.257.5071.784
Trasande L, Malecha P, Attina TM 2016: Particulate Matter Exposure and Preterm Birth: Estimates of U.S. Attributable Burden and Economic Costs. Environmental Health Perspectives 124:12. https://doi.org/10.1289/ehp.1510810.
United Nations, Department of Economic and Social Affairs, Population Division (UNPD) 2019: World Population Prospects 2019, Online Edition. Rev. 1.
UNEP, 2017. Toolkit for Identification and Quantification of Mercury Releases. UN Environment Chemicals Branch, Geneva, Switzerland.
UNEP, 2018. Global Mercury Assessment 2018. UN Environment Programme, Chemicals and Health Branch Geneva, Switzerland. https://www.unenvironment.org/resources/publication/global-mercury-assessment-2018
U.S. EPA 1998: AP-42: Compilation of Air Pollutant Emission Factors, Ed. 2, Fifth Edition, Volume I. https://www.epa.gov/air-emissions-factors-and-quantification/ap-42-compilation-air-emissions-factors.
World Health Organization (WHO) 2013: Health risks of air pollution in Europe-HRAPIE project. http://www.euro.who.int/__data/assets/pdf_file/0006/238956/Health_risks_air_pollution_HRAPIE_project.pdf?ua= .
Wu, X., Nethery, R.C., Sabath, B., Braun, D. & Dominici, F. 2020. Exposure to air pollution and COVID-19 mortality in the United States. Department of Biostatistics, Harvard T.H. Chan School of Public. https://projects.iq.harvard.edu/files/covid-pm/files/pm_and_covid_mortality.pdf
Yadav, A.K., Kumar, K., Kasim, M.H.A., Singh, M.P., Parida, S.K. & Sharan, M. 2003. Visibility
and Incidence of Respiratory Diseases During the 1998 Haze Episode in Brunei Darussalam. Air Quality , 265-277. Pageoph Topical Volumes. Birkhäuser, Basel. https://doi.org/10.1007/978-3-0348-7970-5_16
Yang, J., Zheng, Y., You, X., Pu, K., Chen, Z., Guo, Q., Ji, R., Wang, H., Wang, Y. & Zhou, Y.
2020. Prevalence of comorbidities in the novel Wuhan coronavirus (COVID-19) infection: a systematic review and meta-analysis. International Journal of Infectious Diseases (2020), (https://doi.org/10.1016/j.ijid.2020.03.017).
Zhang H, Feng X, Larssen T, Qiu G, Vogt RD 2010. In Inland China, Rice, Rather than Fish, Is
the Major Pathway for Methylmercury Exposure. Environmental Health Perspectives. 118(9): 1183–1188. https://dx.doi.org/10.1289%2Fehp.1001915.
Zheng X, Ding H, Jiang L, Chen S, Zheng J, Qiu M, Zhou Y, Chen Q, Guan W 2015: Association between Air Pollutants and Asthma Emergency Room Visits and hospital Admissions in Time Series Studies: A Systematic Review and Meta-Analysis. PloSOne 10(9):e0138146, PMID:26382947, https://doi.org/10.1371/journal.pone.0138146.