Embed Size (px)
Citation preview
HAMILTONTHE
PROJECT
Advancing Opportunity, Prosperity and Growth
The Brookings Institution
D I S C U S S I O N P A P E R 2 0 0 7 - 0 5 A P R I L 2 0 0 7
Jason Furman
The Promise of Progressive Cost Consciousness in Health-care Reform
The Hamilton Project seeks to advance America’s promise of
opportunity, prosperity, and growth. The Project’s economic
strategy reflects a judgment that long-term prosperity is best
achieved by making economic growth broad-based, by
enhancing individual economic security, and by embracing a
role for effective government in making needed public
investments. Our strategy—strikingly different from the
theories driving economic policy in recent years—calls for fiscal
discipline and for increased public investment in key growth-
enhancing areas. The Project will put forward innovative
policy ideas from leading economic thinkers throughout the
United States—ideas based on experience and evidence, not
ideology and doctrine—to introduce new, sometimes
controversial, policy options into the national debate with
the goal of improving our country’s economic policy.
The Project is named after Alexander Hamilton, the
nation’s first treasury secretary, who laid the foundation
for the modern American economy. Consistent with the
guiding principles of the Project, Hamilton stood for sound
fiscal policy, believed that broad-based opportunity for
advancement would drive American economic growth, and
recognized that “prudent aids and encouragements on the
part of government” are necessary to enhance and guide
market forces.
HAMILTONTHE
PROJECT
Advancing Opportunity, Prosperity and Growth
The Brookings InstitutionAPRIL 2007
HAMILTONTHE
PROJECT
This discussion paper is a proposal from the author. As emphasized in The Hamilton Project’s original strategy paper, the Project is designed in part to provide a forum for leading thinkers across the nation to put forward innovative and potentially important economic policy ideas that share the Project’s broad goals of promoting economic growth, broad-based participation in growth, and economic security. The authors are invited to express their own ideas in discussion papers, whether or not the Project’s staff or advisory council agree with the specific proposals. This discussion paper is offered in that spirit.
The Promise of Progressive Cost Consciousness
in Health-care Reform
Jason FurmanThe Hamilton Project, The Brookings Institution
The Promise of Progressive CosT ConsCiousness in healTh-Care reform
2 THE HAMILTON PROJECT | THE BROOkINgs INsTITuTION
Copyright © 2007 The Brookings Institution
abstract
Americans are frustrated with the unaffordability of health insurance, the effectiveness of health care, and the rising number of uninsured. One important contribution to all of these challenges is the increased insulation of Americans from the cost of their care. In 1965, roughly half of health-care expenses were paid out of pocket by patients; by 2006, that figure had declined to just 13 percent—lower than the average of other high-income OECD countries. One-size-fits-all high deductible policies associated with Health Savings Accounts (HSAs) require costly tax breaks for the most affluent while unnecessarily increasing financial and health risks for low- and moderate-income families. Instead, any expansions of cost sharing should be based on the evidence, chiefly the RAND Health Insurance Experiment and subsequent research. The RAND experiment found that cost sharing, if related to a family’s income, could reduce health spending by an average of 31 percent without any worse health outcomes. Subsequent research finds that the savings could be even greater. This paper proposes a template for a progressive cost sharing plan that would require typical families to pay half of their health costs until they reached 7.5 percent of their income; low-income families would not have any cost sharing. The analysis shows that this template could reduce total health spending by 13 to 30 percent, reducing premiums by 22 to 34 percent without hurting health outcomes. Moreover, low- and moderate-in-come families would face less cost sharing than they do under typical plans today while the premium savings would be more than enough to compensate middle- and upper-income families for the modest increase in their exposure to small risks. Every family would have an affordable limit on their out-of-pocket payments, in contrast to the situation today, where many families have insurance policies that expose them to unlimited cost sharing. In addition, the paper suggests the potential inclusion of evidence-based exceptions for highly valuable preventive care and chronic disease treatments as well as other mecha-nisms to protect the chronically ill.
The Promise of Progressive CosT ConsCiousness in healTh-Care reform
www.HAMILTONPROJECT.ORg | APRIL 2007 �
Contents
1. Introduction 5
2. Trends in Cost sharing 11
2.1. Cost sharing Has Declined Relative to Total Health-care spending, Both in the Aggregate… 11
2.2. …and among Those with Private Insurance 14
2.�. Cost-sharing Rates Are Higher in Other Countries 17
�. Evidence on the Impact of Cost sharing 19
�.1. Effects on Health-care spending 19
�.2. Effects on Health Outcomes 2�
�.�. Effects on Families’ Financial well-being 25
4. The Effects of Income-based Cost sharing on Health-care spending and Consumer well-being 29
4.1. The simulation Method 29
4.2. Impact on Health-care spending �0
4.�. Impact on Consumer well-being �1
4.4. For some, Income-related Cost sharing Could Reduce Financial Risk and Increase Health-care spending ��
5. Other Important Considerations in Designing Effective Cost sharing �4
5.1. Evidence-based Cost sharing �4
5.2. Insurance for the Chronically Ill �5
6. Implementing Better Cost sharing �7
6.1. How to Make Cost sharing Income sensitive �7
6.2. Income-related Compensation �8
6.�. Reforming the Tax Treatment of Health Insurance �8
6.4. Encouraging greater Transparency �9
7. Conclusions 40
References 41

The Promise of Progressive CosT ConsCiousness in healTh-Care reform
www.HAMILTONPROJECT.ORg | APRIL 2007 5
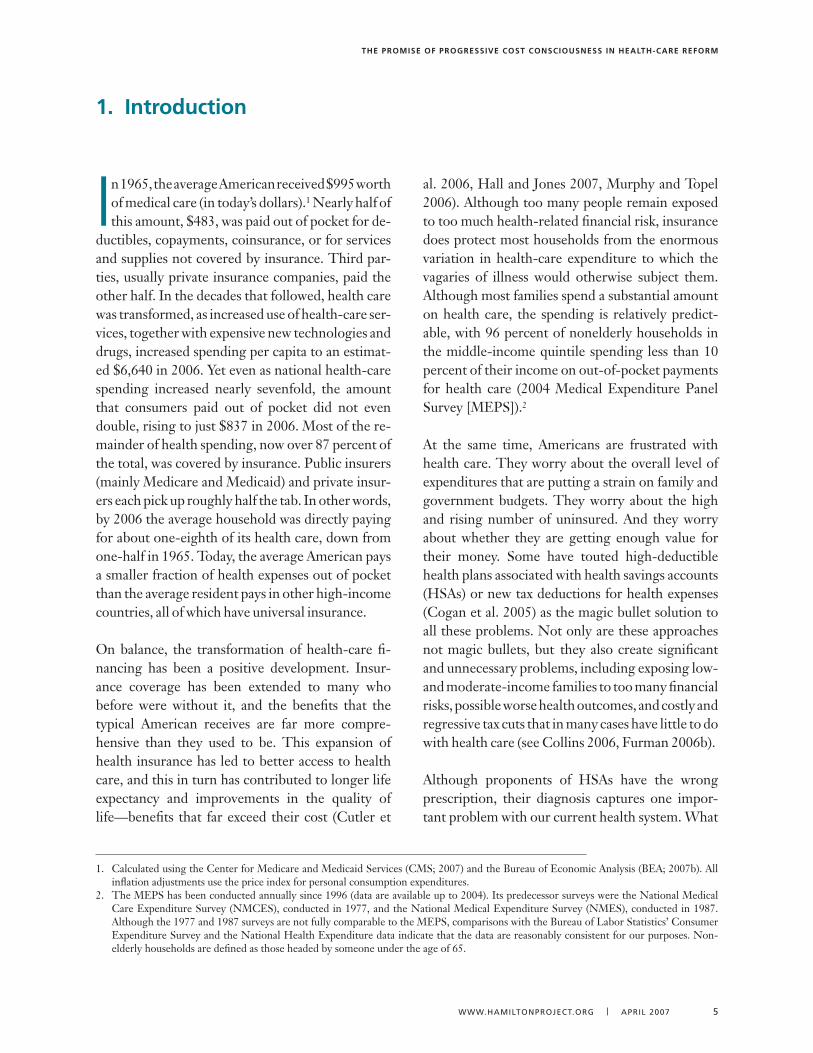
In 1965, the average American received $995 worth of medical care (in today’s dollars).1 Nearly half of this amount, $483, was paid out of pocket for de-
ductibles, copayments, coinsurance, or for services and supplies not covered by insurance. Third par-ties, usually private insurance companies, paid the other half. In the decades that followed, health care was transformed, as increased use of health-care ser-vices, together with expensive new technologies and drugs, increased spending per capita to an estimat-ed $6,640 in 2006. Yet even as national health-care spending increased nearly sevenfold, the amount that consumers paid out of pocket did not even double, rising to just $837 in 2006. Most of the re-mainder of health spending, now over 87 percent of the total, was covered by insurance. Public insurers (mainly Medicare and Medicaid) and private insur-ers each pick up roughly half the tab. In other words, by 2006 the average household was directly paying for about one-eighth of its health care, down from one-half in 1965. Today, the average American pays a smaller fraction of health expenses out of pocket than the average resident pays in other high-income countries, all of which have universal insurance.
On balance, the transformation of health-care fi-nancing has been a positive development. Insur-ance coverage has been extended to many who before were without it, and the benefits that the typical American receives are far more compre-hensive than they used to be. This expansion of health insurance has led to better access to health care, and this in turn has contributed to longer life expectancy and improvements in the quality of life—benefits that far exceed their cost (Cutler et
al. 2006, Hall and Jones 2007, Murphy and Topel 2006). Although too many people remain exposed to too much health-related financial risk, insurance does protect most households from the enormous variation in health-care expenditure to which the vagaries of illness would otherwise subject them. Although most families spend a substantial amount on health care, the spending is relatively predict-able, with 96 percent of nonelderly households in the middle-income quintile spending less than 10 percent of their income on out-of-pocket payments for health care (2004 Medical Expenditure Panel Survey [MEPS]).2
At the same time, Americans are frustrated with health care. They worry about the overall level of expenditures that are putting a strain on family and government budgets. They worry about the high and rising number of uninsured. And they worry about whether they are getting enough value for their money. Some have touted high-deductible health plans associated with health savings accounts (HSAs) or new tax deductions for health expenses (Cogan et al. 2005) as the magic bullet solution to all these problems. Not only are these approaches not magic bullets, but they also create significant and unnecessary problems, including exposing low- and moderate-income families to too many financial risks, possible worse health outcomes, and costly and regressive tax cuts that in many cases have little to do with health care (see Collins 2006, Furman 2006b).
Although proponents of HSAs have the wrong prescription, their diagnosis captures one impor-tant problem with our current health system. What
1. introduction
1. Calculated using the Center for Medicare and Medicaid Services (CMS; 2007) and the Bureau of Economic Analysis (BEA; 2007b). All inflation adjustments use the price index for personal consumption expenditures.
2. The MEPS has been conducted annually since 1996 (data are available up to 2004). Its predecessor surveys were the National Medical Care Expenditure Survey (NMCES), conducted in 1977, and the National Medical Expenditure Survey (NMES), conducted in 1987. Although the 1977 and 1987 surveys are not fully comparable to the MEPS, comparisons with the Bureau of Labor Statistics’ Consumer Expenditure Survey and the National Health Expenditure data indicate that the data are reasonably consistent for our purposes. Non-elderly households are defined as those headed by someone under the age of 65.
The Promise of Progressive CosT ConsCiousness in healTh-Care reform
6 THE HAMILTON PROJECT | THE BROOkINgs INsTITuTION
we need is a different approach to encourage cost consciousness in a progressive manner that links the level of cost sharing to income and attempts to use cost sharing to improve systemwide incen-tives for more effective care. This approach has the potential to be not just more equitable, but also more economically efficient than the HSA approach. Moreover, even those who would rather not see any more cost sharing should recognize that greater cost sharing is likely to be part of the health system in the future. That makes it all the more important to help ensure that this cost shar-ing is designed in an efficient and fair manner that reduces major risks, promotes better health, and makes health insurance more affordable.
The increased insulation from prices of household decisions about health care has several downsides:
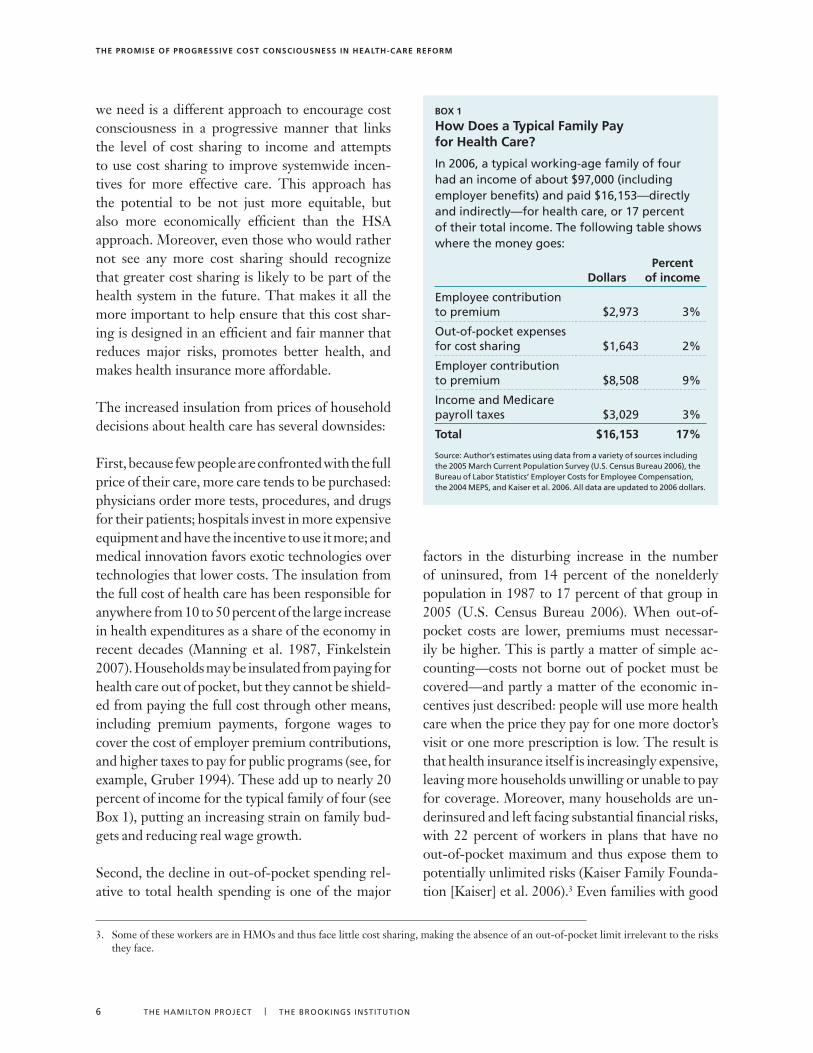
First, because few people are confronted with the full price of their care, more care tends to be purchased: physicians order more tests, procedures, and drugs for their patients; hospitals invest in more expensive equipment and have the incentive to use it more; and medical innovation favors exotic technologies over technologies that lower costs. The insulation from the full cost of health care has been responsible for anywhere from 10 to 50 percent of the large increase in health expenditures as a share of the economy in recent decades (Manning et al. 1987, Finkelstein 2007). Households may be insulated from paying for health care out of pocket, but they cannot be shield-ed from paying the full cost through other means, including premium payments, forgone wages to cover the cost of employer premium contributions, and higher taxes to pay for public programs (see, for example, Gruber 1994). These add up to nearly 20 percent of income for the typical family of four (see Box 1), putting an increasing strain on family bud-gets and reducing real wage growth.
Second, the decline in out-of-pocket spending rel-ative to total health spending is one of the major
factors in the disturbing increase in the number of uninsured, from 14 percent of the nonelderly population in 1987 to 17 percent of that group in 2005 (U.S. Census Bureau 2006). When out-of-pocket costs are lower, premiums must necessar-ily be higher. This is partly a matter of simple ac-counting—costs not borne out of pocket must be covered—and partly a matter of the economic in-centives just described: people will use more health care when the price they pay for one more doctor’s visit or one more prescription is low. The result is that health insurance itself is increasingly expensive, leaving more households unwilling or unable to pay for coverage. Moreover, many households are un-derinsured and left facing substantial financial risks, with 22 percent of workers in plans that have no out-of-pocket maximum and thus expose them to potentially unlimited risks (Kaiser Family Founda-tion [Kaiser] et al. 2006).3 Even families with good
3. Some of these workers are in HMOs and thus face little cost sharing, making the absence of an out-of-pocket limit irrelevant to the risks they face.
Box 1
how Does a Typical family Pay for health Care?
In 2006, a typical working-age family of four had an income of about $97,000 (including employer benefits) and paid $16,15�—directly and indirectly—for health care, or 17 percent of their total income. The following table shows where the money goes:
DollarsPercent
of income
Employee contribution to premium $2,97� �%
Out-of-pocket expenses for cost sharing $1,64� 2%
Employer contribution to premium $8,508 9%
Income and Medicare payroll taxes $�,029 �%
Total $16,153 17%
source: Author’s estimates using data from a variety of sources including the 2005 March Current Population survey (u.s. Census Bureau 2006), the Bureau of Labor statistics’ Employer Costs for Employee Compensation, the 2004 MEPs, and kaiser et al. 2006. All data are updated to 2006 dollars.
The Promise of Progressive CosT ConsCiousness in healTh-Care reform
www.HAMILTONPROJECT.ORg | APRIL 2007 7
insurance plans face the risk and associated anxiety of losing that coverage.
Finally, the transformation in health-care financ-ing can lead to worse health outcomes. Those who go without insurance receive less than half as much health care as the insured, resulting in poorer health outcomes for them, including an estimat-ed eighteen thousand premature deaths annually (Hadley and Holahan 2003, Institute of Medicine [IOM] 2003). Those who do have insurance spend more but do not necessarily get better outcomes. On average, health spending is enormously benefi-cial, with benefits that far outweigh its costs. At the margin, however, the effectiveness of health spend-ing varies greatly. Much of it is ineffective or even harmful. The RAND Health Insurance Experi-ment, discussed in §3, found that a large majority of people who did not face any cost sharing received 40 percent more health care without any better outcomes than those who had cost sharing, in part because the extra spending went to procedures that were barely useful or even harmful. A number of studies have identified large disparities in the inten-sity of treatments for Medicare patients in different parts of the United States, without any commensu-rate difference in outcomes (e.g., Wennberg et al. 2002). One survey noted that “for patients with hip fractures, colorectal cancer, or myocardial infarc-tion, more conservative practice patterns are asso-ciated with better survival” (Fisher 2003, p. 1665). Direct studies of medical procedures have found that a large fraction—often totaling one-third of all such procedures—are either inappropriate or of equivocal value (McGlynn 1998). At the same time, some health spending is clearly underutilized, in particular some preventive care and well-proven drugs to control chronic conditions such as hyper-tension, diabetes, and depression. At a systemwide level, there are few incentives to help direct people toward health care that is extremely important and underutilized and away from other seemingly more common areas where care is marginal or even harmful. Moreover, some of the techniques to get more out of health spending—for example, health maintenance organizations (HMOs)—have been
increasingly unpopular, in part because the sup-ply-side constraints, whereby insurance companies deny treatments or give health providers an incen-tive not to offer care, are not consistent with the demand-side incentives, which offer patients the prospect of free care, with no cost sharing, for any approved procedures.
Helping consumers become more cost conscious about their health-care choices, if and only if it is done correctly, has the potential to make progress in these three areas: First, greater cost conscious-ness can bring down health insurance premiums. The progressive cost-sharing plan presented in this paper would lower total health spending by 13 to 30 percent and premiums by 22 to 34 percent. Em-ployers’ savings on premium contributions would be passed on to workers in the form of more rap-idly rising wages, alleviating some of the squeeze that families face. Second, greater cost conscious-ness can reduce the number of uninsured, both directly by making premiums more affordable and indirectly as part of a broader health-care reform that uses some of these savings to ensure affordable universal coverage. Moreover, exposing families to smaller expenses can help shield them from larger expenses. In the progressive cost-sharing plan, at least 23 percent of people would see their out-of-pocket expenses fall, particularly families with lower incomes or larger out-of-pocket expenses in the current system. Finally, by more appropriately aligning system-side incentives facing both pa-tients and providers with medical evidence, more cost-effective insurance may also promote health. All told, increasing cost sharing for most every-day health-care expenditures, such as low-yielding medical tests, while reducing the income share that households have to pay for catastrophic care, can lower total health-care spending, improve health outcomes, and ultimately reduce the financial risks faced by families.
One key to implementing cost consciousness cor-rectly is to provide more protection to households with low and moderate incomes, and more direct exposure to price signals for higher-income house-
The Promise of Progressive CosT ConsCiousness in healTh-Care reform
8 THE HAMILTON PROJECT | THE BROOkINgs INsTITuTION
holds. Reforms along these lines have been pro-posed by people across the ideological spectrum, from conservative economist Martin Feldstein to single-payer health insurance supporter Thomas Rice (Feldstein 1971, Rice and Thorpe 1993; see also Feldstein and Gruber 1995, Seidman 1980). Ideally, this could be accomplished simply by link-ing the degree of cost sharing in insurance plans to income—for example capping out-of-pocket payments at 7.5 percent of income for middle-class families. If income-linked out-of-pocket pay-ments prove too difficult to institute, lower-income households could instead be compensated for the extra risks associated with greater cost sharing by providing them with lower premiums—or even tax credits or transfers—to help them meet their out-of-pocket payments.
Also worth considering is some form of “smart” cost sharing that would exempt health treatments whose benefits are proven but currently underuti-lized, such as preventive care, statins for people with high cholesterol, or beta blockers to manage cardiac arrhythmias (Lambrew 2007). Covered par-ticipants would pay nothing or a reduced amount out of pocket for these favored treatments. Not only would this lower the relative price of these treatments to users, but it would also send a strong signal about the types of care that are proven to be valuable and effective from a wellness point of view. Moreover, extra cost sharing would ideally be combined with some form of compensation for those with chronic conditions. The current limita-tions of our knowledge about both medical effec-tiveness and how the utilization of different types of treatments responds to prices, however, limit what we could accomplish with smart cost sharing today. Nevertheless, the potential payoffs to getting it right are high enough that further research and experimentation would be very beneficial.
If done incorrectly, however, greater cost sharing could be counterproductive. Consider the high-deductible insurance plans associated with the HSAs established under the Medicare Prescrip-tion Drug, Improvement, and Modernization Act
of 2003 (U.S. Congress 2003). These plans have a fixed deductible, which averages $4,000 for a family plan, and returns on savings within the associated accounts accumulate tax free (Kaiser et al. 2006). Each family has the same deductible regardless of its income, leading to a substantial risk for lower-income families who may not be able to afford the $4,000 deductible, while only negligibly changing the health-care spending incentives facing high-in-come families. Moreover, not only do low-income families get the extra risk, but they also get little benefit from the tax-free accounts because they are in low tax brackets. In contrast, high-income fami-lies are able to bear the risk and get tax breaks that are larger for people in higher tax brackets. In some cases, these tax breaks actually increase the bias of the tax code toward greater health-care spending, potentially increasing total health expenditures (Furman 2006b, Remler and Glied 2006). More-over, current-law HSAs also lack any mechanism to insure people with chronic conditions. Finally, the integration of cost sharing into health-care reform needs to be mindful of the ever-present potential for adverse selection: healthier people tend to opt into plans with more cost sharing to take advantage of the lower premiums, leading insurers to try to dif-ferentiate between the healthy and the less healthy and to exclude the latter from coverage or price it out of their reach. But because today’s HSAs were introduced in the absence of comprehensive health reform that addresses this problem, they actually increased the risk of adverse selection, splintering insurance pools.
Cost consciousness is not a magic bullet. It is also important to combine cost sharing, which is a de-mand-side approach to improving the cost effec-tiveness of care, with supply-side measures that lead to better decisions about which care is offered and to whom. These include familiar managed-care techniques such as reviewing the use of health care and giving suppliers the incentive to offer appropri-ate care through supply-side cost sharing (whereby suppliers share some of the costs of treatment) and pay-for-performance (which rewards doctors and hospitals for achieving measurable benchmarks).
The Promise of Progressive CosT ConsCiousness in healTh-Care reform
www.HAMILTONPROJECT.ORg | APRIL 2007 9
Instead of demand- and supply-side measures be-ing viewed as alternatives, however, they can and should be viewed as complements (Newhouse 2004). Indeed, one reason for the backlash against managed care in the past decade may have been the disconnect between the demand and supply sides: consumers were promised essentially free care, only to be told when they came to seek care that they could not have it. If demand-side incentives and supply-side constraints can be made to work together, the result might be a more effective and more sustainable health-care environment than Americans experienced under the rigid managed-care techniques associated with HMOs that became increasingly unpopular in the late 1990s.
Enhanced cost consciousness is not without its downsides. It presents a trade-off: health insurance can become more affordable, and individuals can face a smaller risk of personal financial catastrophe, but only if all of us accept an increased financial risk over a range of possible spending that falls far short of catastrophic levels. Because risk is an inherently random process, this means that some individuals will inevitably end up better off and others worse off. If the alternative to greater cost consciousness were free care with no constraints at a low premium, the choice would be easy, but this is not the choice we face. In a world of lim-ited resources, where illness strikes unpredictably and all health care must ultimately be paid for by individuals, trade-offs are unavoidable. The goal of increased cost consciousness is to help put indi-viduals in the position to make their own decisions about these trade-offs.
Cost consciousness can and should be a critical component—together with pooling mechanisms to ensure that everyone has an affordable insur-ance option—of any viable plan to achieve such universal coverage. Even single-payer health in-surance needs a way to decide what care to pro-vide or to withhold in order to keep costs from rising uncontrollably. Most countries with single-payer plans do this in part through cost sharing. In fact, as detailed in §2, the United States has a
lower overall rate of cost sharing than the average OECD country. Health reforms at the U.S. state level that include an individual mandate, like the Massachusetts plan, face the challenge of design-ing a pooling option that is affordable enough for middle-class families who receive little or no sub-sidies. Income-related cost sharing is one way to meet this challenge.
Raising cost consciousness is not a cure-all. The challenges facing the nation’s health-care system are so large that no single change can hope to solve all of them. Better information technology, improved disease management, more effective pre-vention, and strategies to address the mounting public health challenges, such as the obesity epi-demic, will all be important in ensuring that we get the maximum benefit from our health dollars. In some areas, particularly managing chronic illnesses, we should spend more, not less.
But none of these reforms, by themselves, address the difficult problem of deciding when and how to say no to the expensive care of marginal benefit (Aaron et al. 2005). In an economy that relies on the ability of individuals to make sound decisions in their own interest, and in a society that is concerned about individual outcomes, exposing individuals to the price of health care through greater cost shar-ing, in a manner consistent with their ability to pay, is a sensible approach. Although not necessar-ily popular, neither are the alternatives: having in-surance companies or the government make these decisions or allowing health expenditures to grow without bound.
This discussion paper argues for serious consid-eration of a greater role for cost consciousness in health-care reform. This paper provides evidence of the potential of this greater role, but also warns about the dangers of approaches such as current-law HSAs. This paper does not propose a single, specific reform design because any cost-sharing measure or set of measures chosen should be part of a broader health system reform that provides universal insurance, and the form of cost sharing
The Promise of Progressive CosT ConsCiousness in healTh-Care reform
10 THE HAMILTON PROJECT | THE BROOkINgs INsTITuTION
will depend on the shape of that system. Instead, the goal is to provide guidance for how cost sharing could be included in broader reforms.
Section 2 of this paper is a review of recent trends in cost sharing, and in particular the long-term decline in cost sharing relative to total health-care spending. Section 3 reviews the evidence on cost sharing and finds that it has the potential to dramat-ically lower costs with no adverse effect on health or financial security—provided that cost sharing is
related to income. This is followed by an analysis of the impact of alternative forms of cost sharing, in §4, focusing on income-related out-of-pocket limits. The paper then briefly discusses some im-portant related issues in §5, including the potential for “smart,” evidence-based cost sharing and how best to insure the chronically ill. The penultimate section, §6, sketches some ways to implement in-come-related cost sharing, or versions of it, and the final section, §7, concludes.
The Promise of Progressive CosT ConsCiousness in healTh-Care reform
www.HAMILTONPROJECT.ORg | APRIL 2007 11
In the United States today, the majority of fami-lies face relatively little cost sharing, either as a fraction of their income or as a fraction of their
total health-care expenditure. As noted in the in-troduction, the costs borne directly by those with insurance have diminished as a share of total health-care spending, and that share is lower than the aver-age for other OECD economies.
It is worth emphasizing at the outset that cost shar-ing as used here is limited strictly to out-of-pocket payments by the health-care consumer, either for services not covered by insurance or for the por-tion of covered services that, under the insurance contract, the insured must pay for herself, through deductibles, copayments, and the like. The defini-tion does not include premium payments, includ-ing those paid directly by the insured individual and indirectly through the lower wages that reflect the employer’s contribution. There are three rea-sons for this focus: First, this analysis is concerned with factors that affect the amount of health care a person receives, measured both in terms of total spending and in terms of its impact on that per-son’s health. Here the most relevant factor is how much a person has to spend for health care actually consumed, and not how much she pays for insur-ance. Second, some conventional estimates of the individual share of health-care spending are flawed, because they do not reflect the fact that even in-sured individuals ultimately bear the full burden of that spending, either through direct expenditure on premiums or through out-of-pocket payments, lower wages, or higher taxes. Finally, the empha-sis here is on the risks associated with health-care spending. Variable out-of-pocket payments, which can range from nothing to hundreds of thousands of dollars, represent a risk. A known premium, whether paid by an employer or by the individual, does not. This is not to say that rising premiums, or more generally a rising share of income devoted to purchasing health insurance, are not also cause for
concern, but this concern is part of what motivates the focus on out-of-pocket payments and their role in health-care spending in the first place.
This section begins with an analysis of aggregate data, data that capture broad trends in both public and private insurance. Then it uses data at the indi-vidual level to focus on changes in cost sharing for the privately insured. Finally, it puts cost sharing in the United States in a comparative international perspective.
2.1. Cost sharing has Declined relative to Total health-care spending, Both in the aggregate…
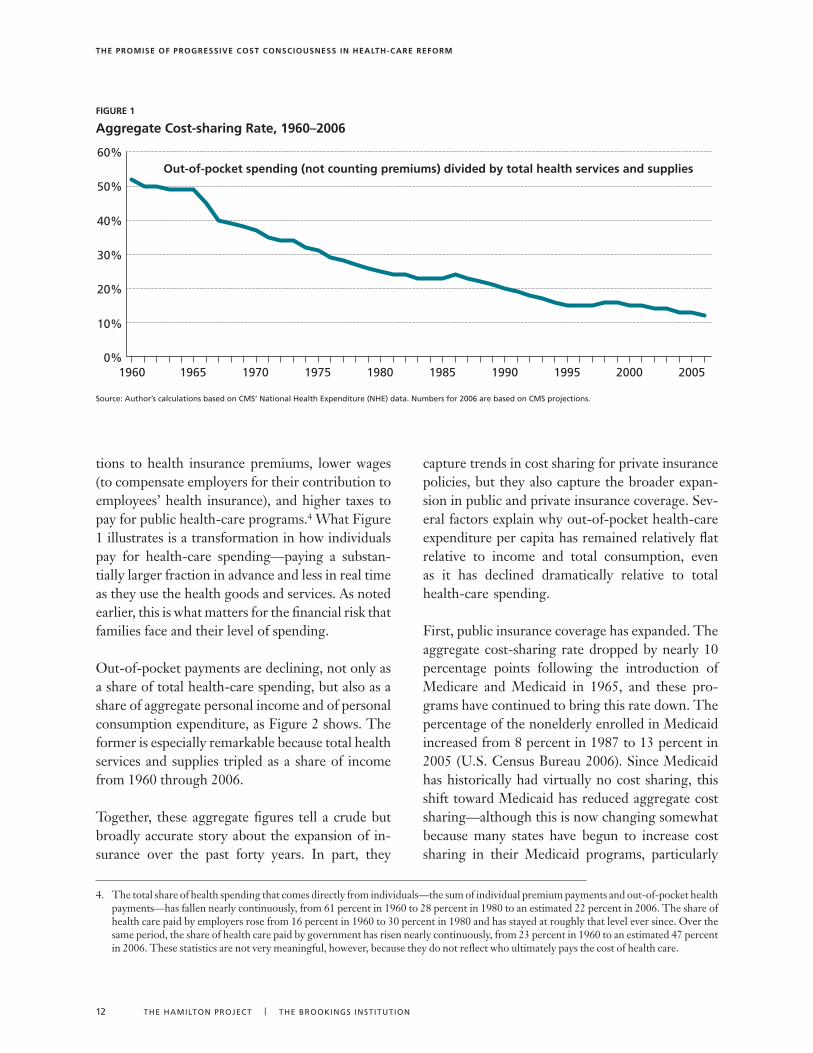
The Center for Medicare and Medicaid Services compiles the National Health Expenditure Ac-counts, the official federal government statistics on aggregate health-care spending. These statis-tics document the transformation of health care and its financing since 1960. At that time, before the invention of so many of the life-saving but costly technologies and drugs that have come to define modern medicine, the average health-care consumer spent much less on health care than to-day. But Americans have been paying a smaller and smaller fraction of their health-care costs out of pocket, from just over 50 percent in 1965 to just under 13 percent in 2006. Figure 1 shows a clear and continuous downward trend in the share of health-care spending spent directly on health-care goods and services. The trend has slowed, however, although not actually stabilized, in the past decade.
Again, this is not to say that individuals do not have to pay for their rising health-care spending. Ulti-mately, individuals pay 100 percent of the cost of health care and this cost is rising as a share of in-come. But much (and today the majority) of that expenditure comes in the form of rising contribu-
2. Trends in Cost sharing
The Promise of Progressive CosT ConsCiousness in healTh-Care reform
12 THE HAMILTON PROJECT | THE BROOkINgs INsTITuTION
tions to health insurance premiums, lower wages (to compensate employers for their contribution to employees’ health insurance), and higher taxes to pay for public health-care programs.4 What Figure 1 illustrates is a transformation in how individuals pay for health-care spending—paying a substan-tially larger fraction in advance and less in real time as they use the health goods and services. As noted earlier, this is what matters for the financial risk that families face and their level of spending.
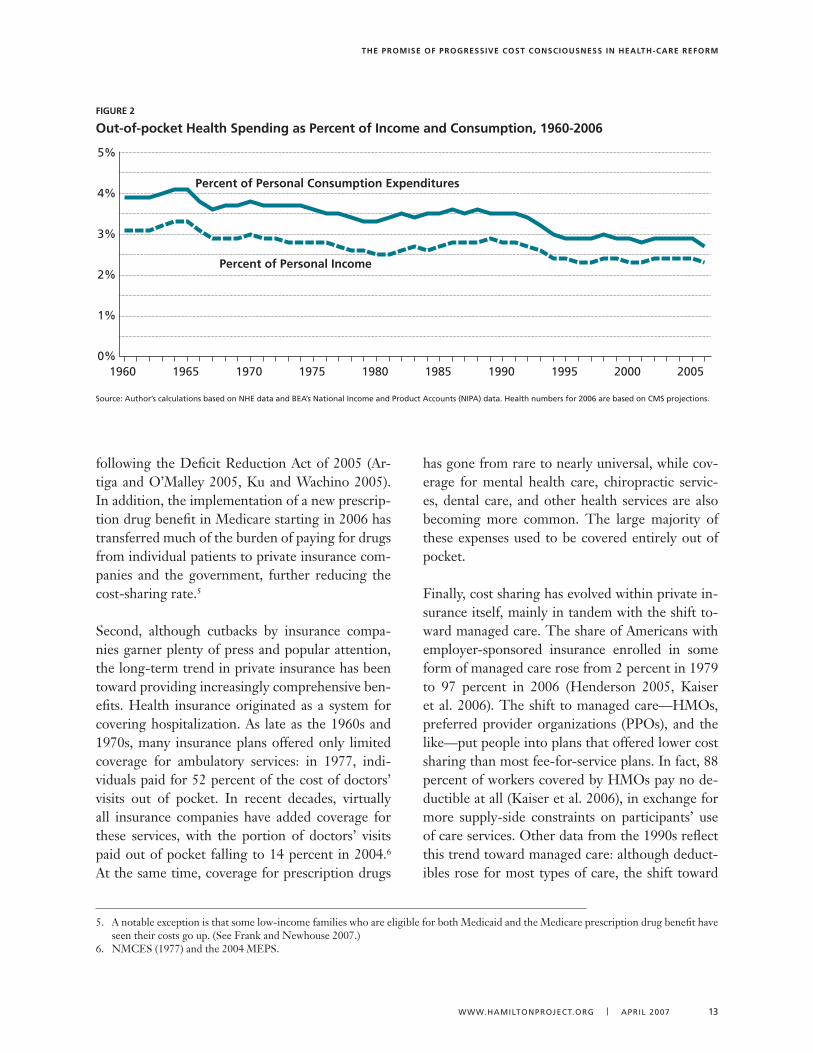
Out-of-pocket payments are declining, not only as a share of total health-care spending, but also as a share of aggregate personal income and of personal consumption expenditure, as Figure 2 shows. The former is especially remarkable because total health services and supplies tripled as a share of income from 1960 through 2006.
Together, these aggregate figures tell a crude but broadly accurate story about the expansion of in-surance over the past forty years. In part, they
capture trends in cost sharing for private insurance policies, but they also capture the broader expan-sion in public and private insurance coverage. Sev-eral factors explain why out-of-pocket health-care expenditure per capita has remained relatively flat relative to income and total consumption, even as it has declined dramatically relative to total health-care spending.
First, public insurance coverage has expanded. The aggregate cost-sharing rate dropped by nearly 10 percentage points following the introduction of Medicare and Medicaid in 1965, and these pro-grams have continued to bring this rate down. The percentage of the nonelderly enrolled in Medicaid increased from 8 percent in 1987 to 13 percent in 2005 (U.S. Census Bureau 2006). Since Medicaid has historically had virtually no cost sharing, this shift toward Medicaid has reduced aggregate cost sharing—although this is now changing somewhat because many states have begun to increase cost sharing in their Medicaid programs, particularly
figure 1
aggregate Cost-sharing rate, 1960–2006
source: Author’s calculations based on CMs’ National Health Expenditure (NHE) data. Numbers for 2006 are based on CMs projections.
0%
10%
20%
30%
40%
50%
60%Out-of-pocket spending (not counting premiums) divided by total health services and supplies
1960 1965 1970 1975 1980 1985 1990 1995 2000 2005
4. The total share of health spending that comes directly from individuals—the sum of individual premium payments and out-of-pocket health payments—has fallen nearly continuously, from 61 percent in 1960 to 28 percent in 1980 to an estimated 22 percent in 2006. The share of health care paid by employers rose from 16 percent in 1960 to 30 percent in 1980 and has stayed at roughly that level ever since. Over the same period, the share of health care paid by government has risen nearly continuously, from 23 percent in 1960 to an estimated 47 percent in 2006. These statistics are not very meaningful, however, because they do not reflect who ultimately pays the cost of health care.
The Promise of Progressive CosT ConsCiousness in healTh-Care reform
www.HAMILTONPROJECT.ORg | APRIL 2007 1�
following the Deficit Reduction Act of 2005 (Ar-tiga and O’Malley 2005, Ku and Wachino 2005). In addition, the implementation of a new prescrip-tion drug benefit in Medicare starting in 2006 has transferred much of the burden of paying for drugs from individual patients to private insurance com-panies and the government, further reducing the cost-sharing rate.5
Second, although cutbacks by insurance compa-nies garner plenty of press and popular attention, the long-term trend in private insurance has been toward providing increasingly comprehensive ben-efits. Health insurance originated as a system for covering hospitalization. As late as the 1960s and 1970s, many insurance plans offered only limited coverage for ambulatory services: in 1977, indi-viduals paid for 52 percent of the cost of doctors’ visits out of pocket. In recent decades, virtually all insurance companies have added coverage for these services, with the portion of doctors’ visits paid out of pocket falling to 14 percent in 2004.6 At the same time, coverage for prescription drugs
has gone from rare to nearly universal, while cov-erage for mental health care, chiropractic servic-es, dental care, and other health services are also becoming more common. The large majority of these expenses used to be covered entirely out of pocket.
Finally, cost sharing has evolved within private in-surance itself, mainly in tandem with the shift to-ward managed care. The share of Americans with employer-sponsored insurance enrolled in some form of managed care rose from 2 percent in 1979 to 97 percent in 2006 (Henderson 2005, Kaiser et al. 2006). The shift to managed care—HMOs, preferred provider organizations (PPOs), and the like—put people into plans that offered lower cost sharing than most fee-for-service plans. In fact, 88 percent of workers covered by HMOs pay no de-ductible at all (Kaiser et al. 2006), in exchange for more supply-side constraints on participants’ use of care services. Other data from the 1990s reflect this trend toward managed care: although deduct-ibles rose for most types of care, the shift toward
figure 2
out-of-pocket health spending as Percent of income and Consumption, 1960-2006
source: Author’s calculations based on NHE data and BEA’s National Income and Product Accounts (NIPA) data. Health numbers for 2006 are based on CMs projections.
0%
1%
2%
3%
4%
5%
Percent of Personal Consumption Expenditures
Percent of Personal Income
1960 1965 1970 1975 1980 1985 1990 1995 2000 2005
5. A notable exception is that some low-income families who are eligible for both Medicaid and the Medicare prescription drug benefit have seen their costs go up. (See Frank and Newhouse 2007.)
6. NMCES (1977) and the 2004 MEPS.
The Promise of Progressive CosT ConsCiousness in healTh-Care reform
14 THE HAMILTON PROJECT | THE BROOkINgs INsTITuTION
plans with lower deductibles (usually managed-care plans) meant that the average worker faced a falling deductible.
The high-water mark of this transformation was in 1996, when 31 percent of workers were enrolled in HMOs, which represented a doubling in the HMO share in just eight years. The share of workers en-rolled in HMOs fell back to 20 percent in 2006 as many people rebelled against the supply-side con-straints on their care (Kaiser et al. 2006). As a re-sult, health expenditures rose rapidly and insurance companies started to return to cost sharing in order to control expenses.
Ultimately, the goal of insurance is to balance two competing interests. On the one hand, individuals want to be protected against the risks associated with fluctuations in their income or expenditure needs. On the other hand, this protection leads to “moral hazard,” resulting in more total spending and thus crowding out money for other priorities. The key is to strike a balance between these two competing needs. The fact that out-of-pocket pay-ments have fallen relative to income and consump-
tion implies that the risk associated with health expenditures has declined over time.7 The reduc-tion in the aggregate cost-sharing rate implies that the distortions associated with moral hazard have grown over time. To the degree that we were strik-ing the right balance at any point in the past, this broad analysis suggests we are no longer striking the right balance today.
2.2. …and among Those with Private insurance
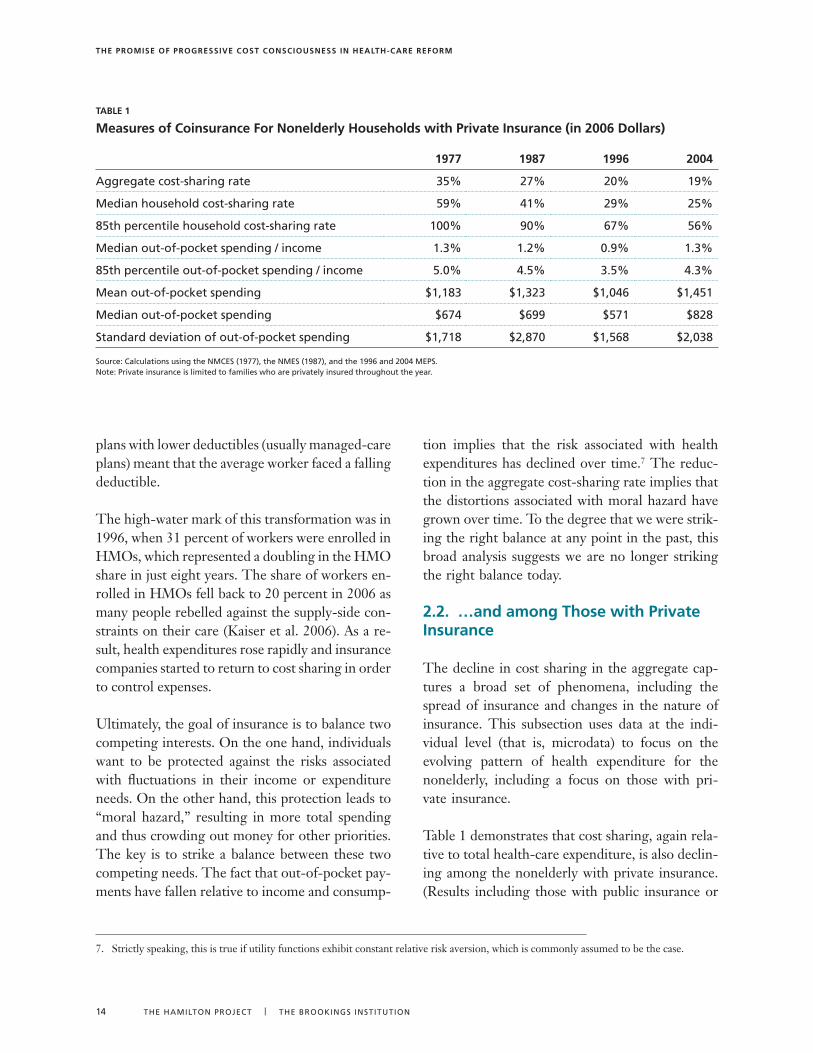
The decline in cost sharing in the aggregate cap-tures a broad set of phenomena, including the spread of insurance and changes in the nature of insurance. This subsection uses data at the indi-vidual level (that is, microdata) to focus on the evolving pattern of health expenditure for the nonelderly, including a focus on those with pri-vate insurance.
Table 1 demonstrates that cost sharing, again rela-tive to total health-care expenditure, is also declin-ing among the nonelderly with private insurance. (Results including those with public insurance or
7. Strictly speaking, this is true if utility functions exhibit constant relative risk aversion, which is commonly assumed to be the case.
TaBle 1
measures of Coinsurance for nonelderly households with Private insurance (in 2006 Dollars)
1977 1987 1996 2004
Aggregate cost-sharing rate �5% 27% 20% 19%
Median household cost-sharing rate 59% 41% 29% 25%
85th percentile household cost-sharing rate 100% 90% 67% 56%
Median out-of-pocket spending / income 1.�% 1.2% 0.9% 1.�%
85th percentile out-of-pocket spending / income 5.0% 4.5% �.5% 4.�%
Mean out-of-pocket spending $1,18� $1,�2� $1,046 $1,451
Median out-of-pocket spending $674 $699 $571 $828
standard deviation of out-of-pocket spending $1,718 $2,870 $1,568 $2,0�8
source: Calculations using the NMCEs (1977), the NMEs (1987), and the 1996 and 2004 MEPs. Note: Private insurance is limited to families who are privately insured throughout the year.
The Promise of Progressive CosT ConsCiousness in healTh-Care reform
www.HAMILTONPROJECT.ORg | APRIL 2007 15
the elderly, which are not shown, are very similar.) The first row shows that the trend for this sub-group is similar to the aggregate trend depicted in Figure 1.8 The second row shows that, for the median household, cost sharing is a higher pro-portion of health spending, largely because the average rate is driven down by very large pay-ments by insurers for a minority of families. But the downward trend in cost sharing—relative to health expenditures—is even more pronounced for the median household, perhaps because of the in-creasing importance of extreme expenditures that are covered by insurance. Because health expendi-ture is thus skewed across families, the third row reports the cost-sharing rate at the eighty-fifth percentile. This, too, displays a similar trend. Cost sharing is relatively stable as a share of income, with bigger reductions in larger burdens relative to income.
The table’s bottom three rows report actual (in-flation-adjusted) dollar values for out-of-pocket spending at the mean and the median of the distri-bution, as well as the standard deviation. What is noteworthy here is that out-of-pocket spending for both the average and the median family was similar in 2004 to what it had been in 1977.9
While the long-term trends in cost sharing are fall-ing relative to health expenditures and are stable relative to income or in real terms, cost sharing has increased substantially since 1996. As noted earlier, that year represents the peak of the experience with HMOs, most of which have little or no cost sharing. As HMO enrollment has declined—and managed care more broadly has become less strict—some of the cost sharing that characterized insurance in the 1970s and 1980s is returning.
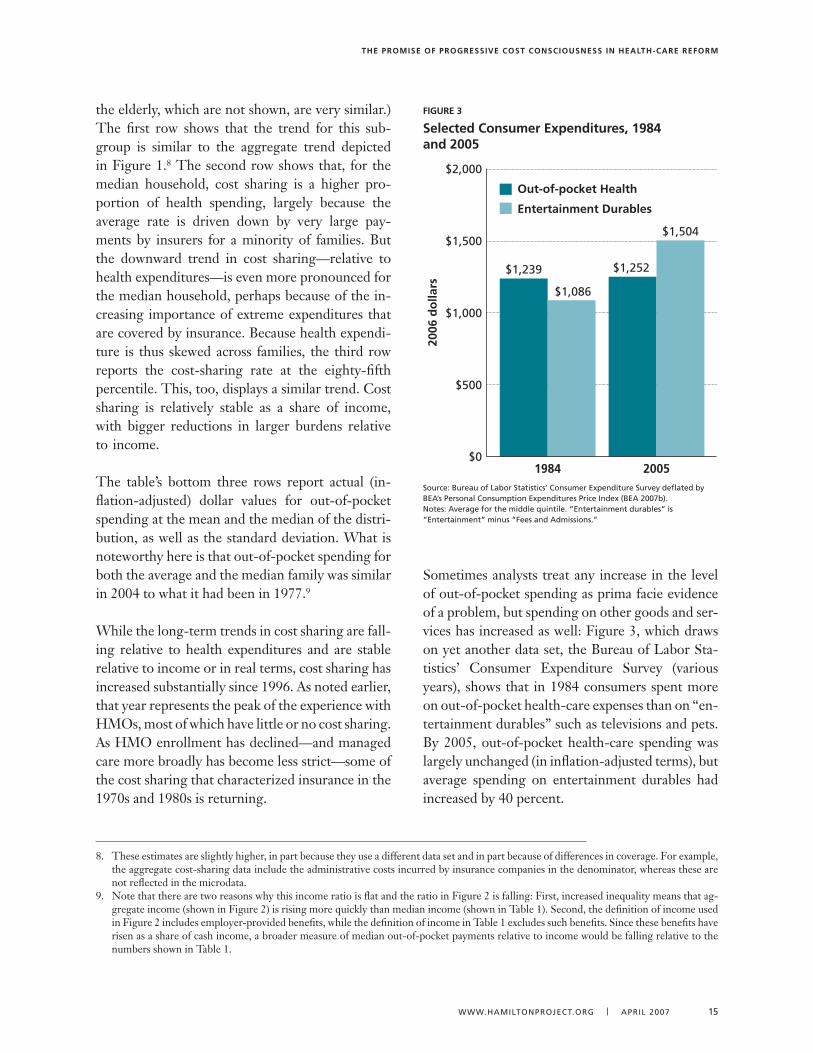
Sometimes analysts treat any increase in the level of out-of-pocket spending as prima facie evidence of a problem, but spending on other goods and ser-vices has increased as well: Figure 3, which draws on yet another data set, the Bureau of Labor Sta-tistics’ Consumer Expenditure Survey (various years), shows that in 1984 consumers spent more on out-of-pocket health-care expenses than on “en-tertainment durables” such as televisions and pets. By 2005, out-of-pocket health-care spending was largely unchanged (in inflation-adjusted terms), but average spending on entertainment durables had increased by 40 percent.
8. These estimates are slightly higher, in part because they use a different data set and in part because of differences in coverage. For example, the aggregate cost-sharing data include the administrative costs incurred by insurance companies in the denominator, whereas these are not reflected in the microdata.
9. Note that there are two reasons why this income ratio is flat and the ratio in Figure 2 is falling: First, increased inequality means that ag-gregate income (shown in Figure 2) is rising more quickly than median income (shown in Table 1). Second, the definition of income used in Figure 2 includes employer-provided benefits, while the definition of income in Table 1 excludes such benefits. Since these benefits have risen as a share of cash income, a broader measure of median out-of-pocket payments relative to income would be falling relative to the numbers shown in Table 1.
figure 3
selected Consumer expenditures, 1984 and 2005
source: Bureau of Labor statistics’ Consumer Expenditure survey deflated by BEA’s Personal Consumption Expenditures Price Index (BEA 2007b).Notes: Average for the middle quintile. “Entertainment durables” is “Entertainment” minus “Fees and Admissions.”
$0
$500
$1,000
$1,500
$2,000
2006
do
llars
1984
$1,239
$1,086
2005
$1,252
$1,504
Out-of-pocket Health
Entertainment Durables
The Promise of Progressive CosT ConsCiousness in healTh-Care reform
16 THE HAMILTON PROJECT | THE BROOkINgs INsTITuTION
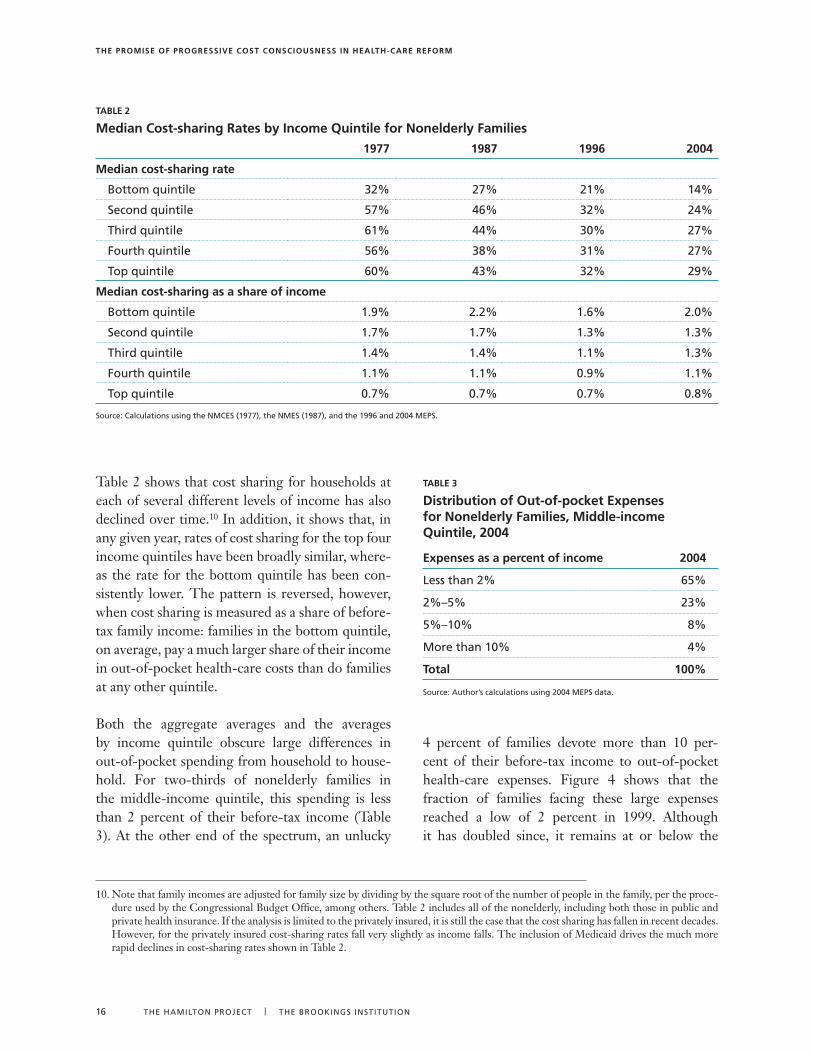
Table 2 shows that cost sharing for households at each of several different levels of income has also declined over time.10 In addition, it shows that, in any given year, rates of cost sharing for the top four income quintiles have been broadly similar, where-as the rate for the bottom quintile has been con-sistently lower. The pattern is reversed, however, when cost sharing is measured as a share of before-tax family income: families in the bottom quintile, on average, pay a much larger share of their income in out-of-pocket health-care costs than do families at any other quintile.
Both the aggregate averages and the averages by income quintile obscure large differences in out-of-pocket spending from household to house-hold. For two-thirds of nonelderly families in the middle-income quintile, this spending is less than 2 percent of their before-tax income (Table 3). At the other end of the spectrum, an unlucky
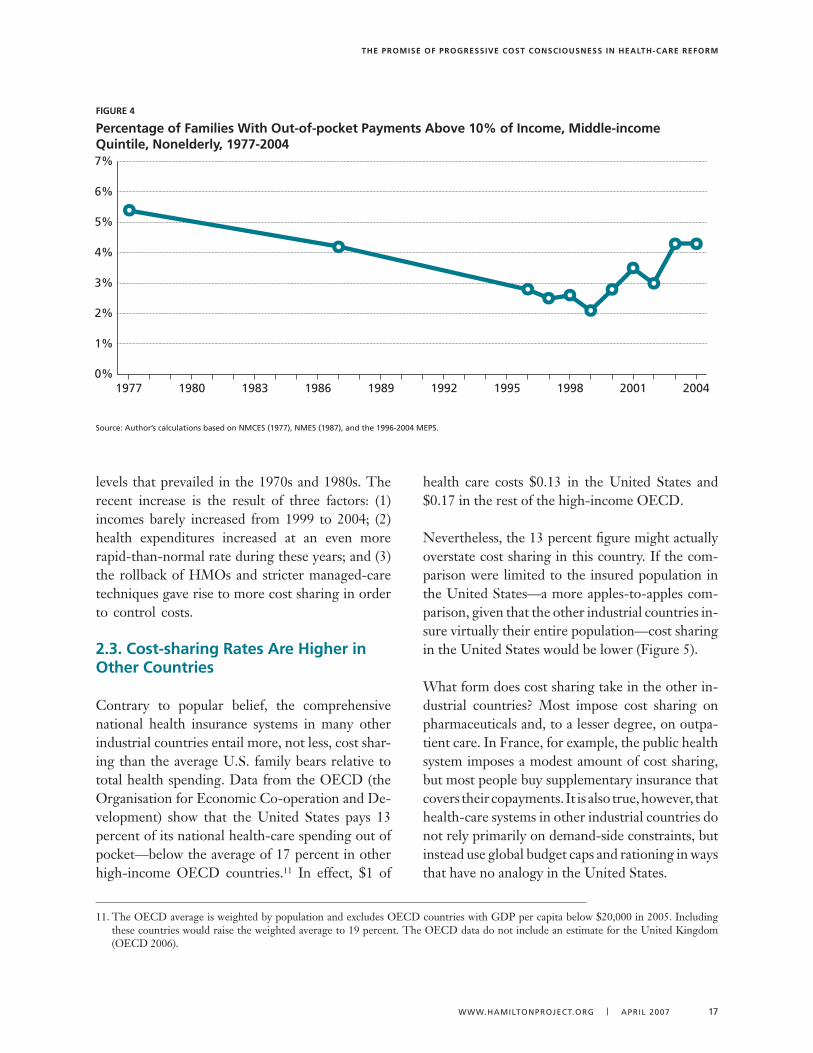
4 percent of families devote more than 10 per-cent of their before-tax income to out-of-pocket health-care expenses. Figure 4 shows that the fraction of families facing these large expenses reached a low of 2 percent in 1999. Although it has doubled since, it remains at or below the
TaBle 2
median Cost-sharing rates by income Quintile for nonelderly families
1977 1987 1996 2004
median cost-sharing rate
Bottom quintile �2% 27% 21% 14%
second quintile 57% 46% �2% 24%
Third quintile 61% 44% �0% 27%
Fourth quintile 56% �8% �1% 27%
Top quintile 60% 4�% �2% 29%
median cost-sharing as a share of income
Bottom quintile 1.9% 2.2% 1.6% 2.0%
second quintile 1.7% 1.7% 1.�% 1.�%
Third quintile 1.4% 1.4% 1.1% 1.�%
Fourth quintile 1.1% 1.1% 0.9% 1.1%
Top quintile 0.7% 0.7% 0.7% 0.8%
source: Calculations using the NMCEs (1977), the NMEs (1987), and the 1996 and 2004 MEPs.
10. Note that family incomes are adjusted for family size by dividing by the square root of the number of people in the family, per the proce-dure used by the Congressional Budget Office, among others. Table 2 includes all of the nonelderly, including both those in public and private health insurance. If the analysis is limited to the privately insured, it is still the case that the cost sharing has fallen in recent decades. However, for the privately insured cost-sharing rates fall very slightly as income falls. The inclusion of Medicaid drives the much more rapid declines in cost-sharing rates shown in Table 2.
TaBle 3
Distribution of out-of-pocket expenses for nonelderly families, middle-income Quintile, 2004
expenses as a percent of income 2004
Less than 2% 65%
2%–5% 2�%
5%–10% 8%
More than 10% 4%
Total 100%
source: Author’s calculations using 2004 MEPs data.
The Promise of Progressive CosT ConsCiousness in healTh-Care reform
www.HAMILTONPROJECT.ORg | APRIL 2007 17
levels that prevailed in the 1970s and 1980s. The recent increase is the result of three factors: (1) incomes barely increased from 1999 to 2004; (2) health expenditures increased at an even more rapid-than-normal rate during these years; and (3) the rollback of HMOs and stricter managed-care techniques gave rise to more cost sharing in order to control costs.
2.3. Cost-sharing rates are higher in other Countries
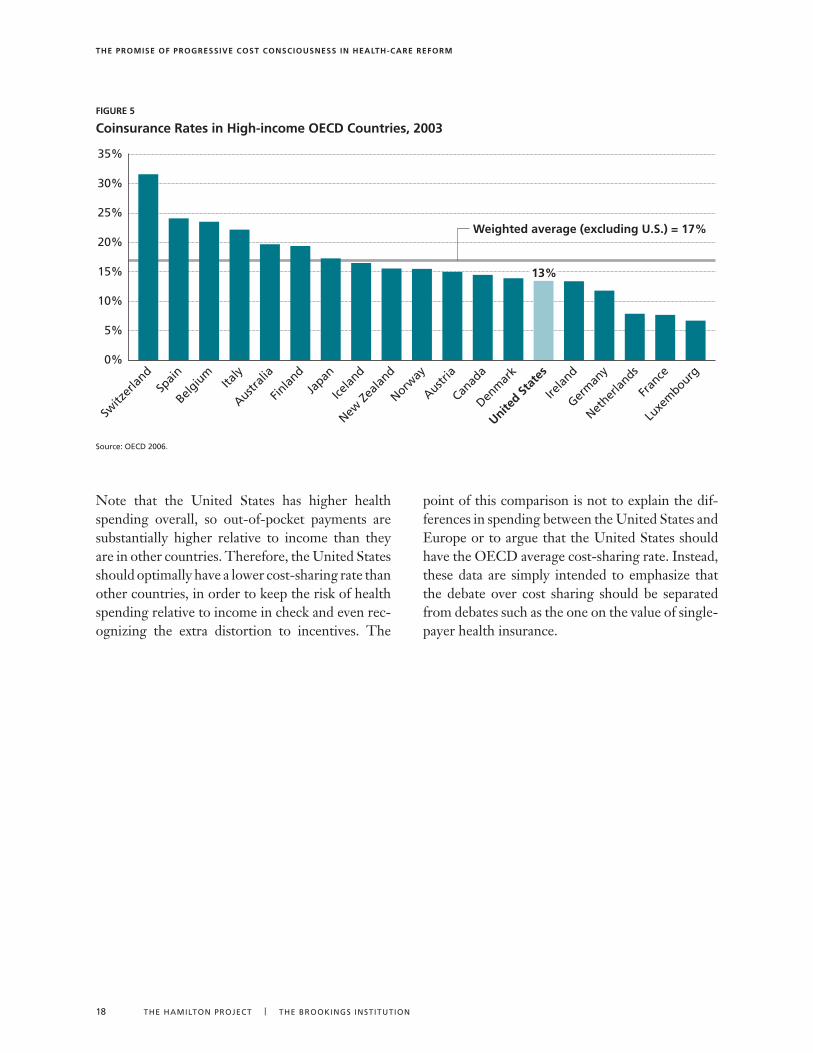
Contrary to popular belief, the comprehensive national health insurance systems in many other industrial countries entail more, not less, cost shar-ing than the average U.S. family bears relative to total health spending. Data from the OECD (the Organisation for Economic Co-operation and De-velopment) show that the United States pays 13 percent of its national health-care spending out of pocket—below the average of 17 percent in other high-income OECD countries.11 In effect, $1 of
health care costs $0.13 in the United States and $0.17 in the rest of the high-income OECD.
Nevertheless, the 13 percent figure might actually overstate cost sharing in this country. If the com-parison were limited to the insured population in the United States—a more apples-to-apples com-parison, given that the other industrial countries in-sure virtually their entire population—cost sharing in the United States would be lower (Figure 5).
What form does cost sharing take in the other in-dustrial countries? Most impose cost sharing on pharmaceuticals and, to a lesser degree, on outpa-tient care. In France, for example, the public health system imposes a modest amount of cost sharing, but most people buy supplementary insurance that covers their copayments. It is also true, however, that health-care systems in other industrial countries do not rely primarily on demand-side constraints, but instead use global budget caps and rationing in ways that have no analogy in the United States.
figure 4
Percentage of families With out-of-pocket Payments above 10% of income, middle-income Quintile, nonelderly, 1977-2004
source: Author’s calculations based on NMCEs (1977), NMEs (1987), and the 1996-2004 MEPs.
1977 1980 1983 1986 1989 1992 1995 1998 2001 20040%
1%
2%
3%
4%
5%
6%
7%
11. The OECD average is weighted by population and excludes OECD countries with GDP per capita below $20,000 in 2005. Including these countries would raise the weighted average to 19 percent. The OECD data do not include an estimate for the United Kingdom (OECD 2006).
The Promise of Progressive CosT ConsCiousness in healTh-Care reform
18 THEHAMILTONPROJECT | THEbROOkINgsINsTITuTION
Note that the United States has higher health spending overall, so out-of-pocket payments are substantially higher relative to income than they are in other countries. Therefore, the United States should optimally have a lower cost-sharing rate than other countries, in order to keep the risk of health spending relative to income in check and even rec-ognizing the extra distortion to incentives. The
point of this comparison is not to explain the dif-ferences in spending between the United States and Europe or to argue that the United States should have the OECD average cost-sharing rate. Instead, these data are simply intended to emphasize that the debate over cost sharing should be separated from debates such as the one on the value of single-payer health insurance.
figure 5
Coinsurance rates in high-income oeCD Countries, 2003
source:OECD2006.
Switz
erlan
dSp
ain
Belgiu
mIta
ly
Australi
a
Finlan
d
Japan
Icelan
d
New Ze
aland
Norway
Austria
Canad
a
Denm
ark
United St
ates
Irelan
d
Germ
any
Nether
lands
Fran
ce
Luxe
mbourg
0%
5%
10%
15%
20%
25%
30%
35%
Weighted average (excluding U.S.) = 17%
13%
The Promise of Progressive CosT ConsCiousness in healTh-Care reform
www.HAMILTONPROJECT.ORg | APRIL 2007 19
Cost sharing affects total health-care spend-ing, health outcomes, and the financial well-being of the households subjected to
it: four decades of empirical research have ac-cumulated considerable evidence on these im-pacts. Perhaps the best evidence comes from one of the most ambitious social science experiments ever conducted: the RAND Health Insurance Ex-periment, which lasted from 1974 through 1982 (Newhouse and the Insurance Experiment Group 1993, Manning et al. 1987). This landmark re-search project randomly assigned two thousand nonelderly families (comprising about seven thou-sand individuals) to fee-for-service plans with dif-ferent levels of cost sharing. Researchers then col-lected detailed data on health expenditures and health status for the three to five years that these individuals were enrolled.12
The use of a random trial enabled the researchers to identify what effects were caused by the cost shar-ing itself. It avoided the difficult problem, inherent in research based on inferential statistical methods, of determining the direction of causality. For ex-ample, if higher cost sharing is found to be statisti-cally associated with better health, is that because cost sharing leads to better health outcomes, or did the healthier people in the sample tend to choose plans that featured high cost sharing? The random assignment of families to different plans eliminates this ambiguity.
It is important to treat the RAND results cautiously and use a range of other evidence to confirm and update the conclusions. The RAND experiment, after all, was conducted twenty-five years ago, and some dramatic changes in health technologies (in-cluding the increased importance of prescription drugs and medical imaging) and the practice of insurance (most notably utilization review) have
occurred since then. Moreover, the RAND experi-ment examined the behavioral effects of varying cost sharing assuming that the rest of the health system was unchanged. It has become increasingly clear that systemwide changes in cost sharing would have effects that go well beyond what could be cap-tured in a randomized experiment.
Studies conducted since the RAND experiment have tended to confirm its finding of the effects of cost sharing on health expenditures and suggest that they might be even larger than the RAND study found. The studies have a less clear message of the effects of cost sharing on health outcomes, although they find that caution is warranted, at least for prescription drugs in certain populations.
3.1. effects on health-care spending
Several popular arguments cast doubts on whether cost sharing could have much of a real impact on health-care spending. It is often argued that people will not respond to cost sharing because almost all health care is considered necessary: when their health is on the line, people will pay whatever their providers charge. As shown below, though, RAND and subsequent studies have found that people in fact do respond to higher out-of-pocket prices for health care: at the margin, people will consume less care if the cost is high.
Others argue that cost sharing will do little to hold down costs because total health-care spending is driven by the exorbitant spending of a minority of consumers. In 2004, for example, 20 percent of nonelderly households were responsible for 70 per-cent of health-care expenditures for the whole non-elderly population. People at that level of expendi-ture are generally well beyond the range where any significant cost sharing would apply.
3. evidence on the impact of Cost sharing
12. For a good summary of the RAND experiment and subsequent evidence, see Gruber (2006).
The Promise of Progressive CosT ConsCiousness in healTh-Care reform
20 THE HAMILTON PROJECT | THE BROOkINgs INsTITuTION
This argument does identify an important limita-tion of cost sharing and the reason that cost shar-ing will never be a solo magic bullet solution to limiting care, and why supply-side constraints such as utilization review will likely always be a part of the health system. But in its simple form the argu-ment has two shortcomings: (1) Much of the ex-penditure of this high-spending 20 percent may still be subject to cost sharing. The typical high-deductible health plan includes cost sharing up to about $7,000 of total health-care expenditures for individuals and $14,000 for families. In total, 86 percent of nonelderly households, representing 41 percent of total expenditures, fell under these limits and thus were subjected to cost sharing throughout the year. Moreover, even for people who eventu-ally go above the limit, cost sharing might affect their initial spending, potentially affecting as much as the 61 percent of total health spending falling in the cost-sharing range. (2) All of these calculations are based on the assumption that the distribution of health-care expenditure under current insurance practices would persist under a new system. In fact, the distribution is likely to change. For example, a patient with heart problems that are better treated by drugs but who undergoes marginally useful (or even harmful) surgery costing $100,000, who thus would appear to be unaffected by cost sharing at the margin, might not have undertaken the surgery at all in a world with more cost sharing.
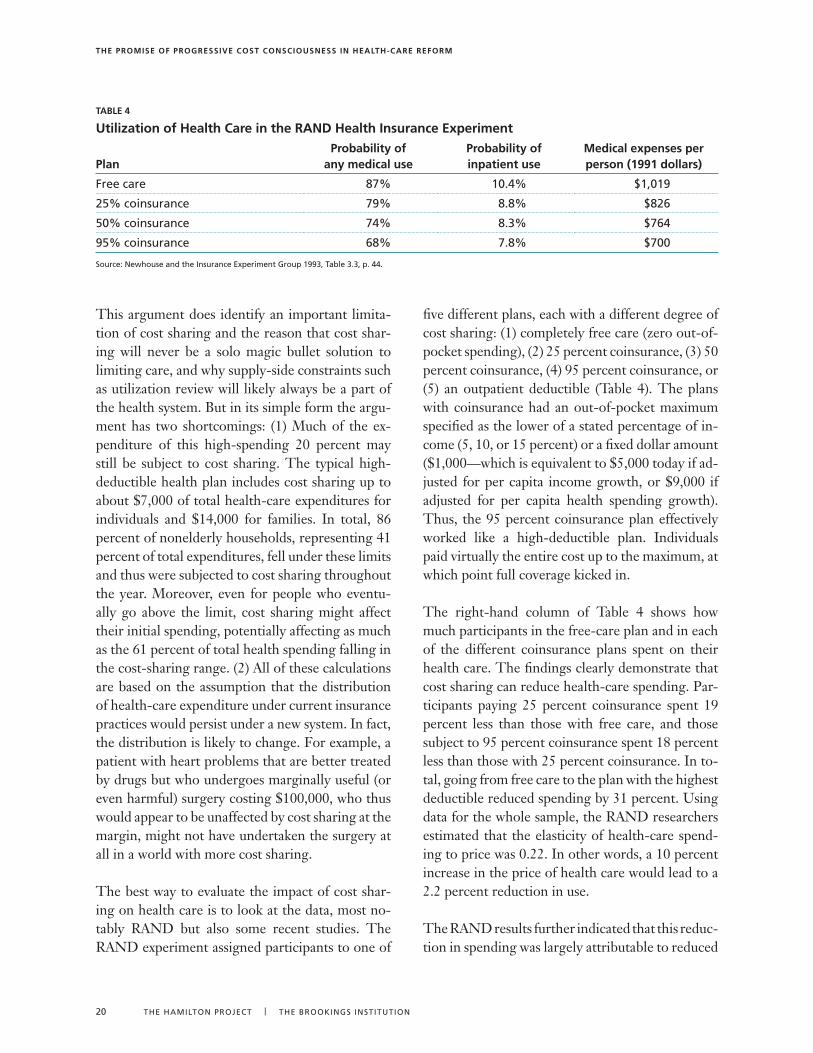
The best way to evaluate the impact of cost shar-ing on health care is to look at the data, most no-tably RAND but also some recent studies. The RAND experiment assigned participants to one of
five different plans, each with a different degree of cost sharing: (1) completely free care (zero out-of-pocket spending), (2) 25 percent coinsurance, (3) 50 percent coinsurance, (4) 95 percent coinsurance, or (5) an outpatient deductible (Table 4). The plans with coinsurance had an out-of-pocket maximum specified as the lower of a stated percentage of in-come (5, 10, or 15 percent) or a fixed dollar amount ($1,000—which is equivalent to $5,000 today if ad-justed for per capita income growth, or $9,000 if adjusted for per capita health spending growth). Thus, the 95 percent coinsurance plan effectively worked like a high-deductible plan. Individuals paid virtually the entire cost up to the maximum, at which point full coverage kicked in.
The right-hand column of Table 4 shows how much participants in the free-care plan and in each of the different coinsurance plans spent on their health care. The findings clearly demonstrate that cost sharing can reduce health-care spending. Par-ticipants paying 25 percent coinsurance spent 19 percent less than those with free care, and those subject to 95 percent coinsurance spent 18 percent less than those with 25 percent coinsurance. In to-tal, going from free care to the plan with the highest deductible reduced spending by 31 percent. Using data for the whole sample, the RAND researchers estimated that the elasticity of health-care spend-ing to price was 0.22. In other words, a 10 percent increase in the price of health care would lead to a 2.2 percent reduction in use.
The RAND results further indicated that this reduc-tion in spending was largely attributable to reduced
TaBle 4
utilization of health Care in the ranD health insurance experiment
PlanProbability of
any medical useProbability of inpatient use
medical expenses per person (1991 dollars)
Free care 87% 10.4% $1,019
25% coinsurance 79% 8.8% $826
50% coinsurance 74% 8.�% $764
95% coinsurance 68% 7.8% $700
source: Newhouse and the Insurance Experiment group 199�, Table �.�, p. 44.
The Promise of Progressive CosT ConsCiousness in healTh-Care reform
www.HAMILTONPROJECT.ORg | APRIL 2007 21
contacts with health providers: people who went to a doctor or entered a hospital at all during the ex-perimental period had relatively similar spending, regardless of the level of cost sharing. Also, con-sumption of each of the various types of health ser-vices—physician visits, hospital visits, emergency room visits, prescription drugs, and mental health care—responded similarly to a given percentage in-crease in price. Finally, there was no evidence that any of the spending reductions among those with high cost sharing were offset by more costly visits to the hospital later on, for example.
One important and much noted finding is that the RAND group found that people in the experiment cut back just as much on care that was deemed nec-essary as they cut back on care that was deemed unnecessary, casting doubt on the proposition that people were making completely rational decisions. Presumably, people subject to cost sharing also cut back on care that was actually more harmful than beneficial, although the study did not explicitly identify such a category. The importance of this deviation from rationality is best measured by the impact of these changing patterns of use on health outcomes, the subject of §3.2. Moreover, an impor-tant policy question is how an individual’s less-than-
optimal choices compare to the less-than-optimal choices that would otherwise be made by insurance companies or by the government.
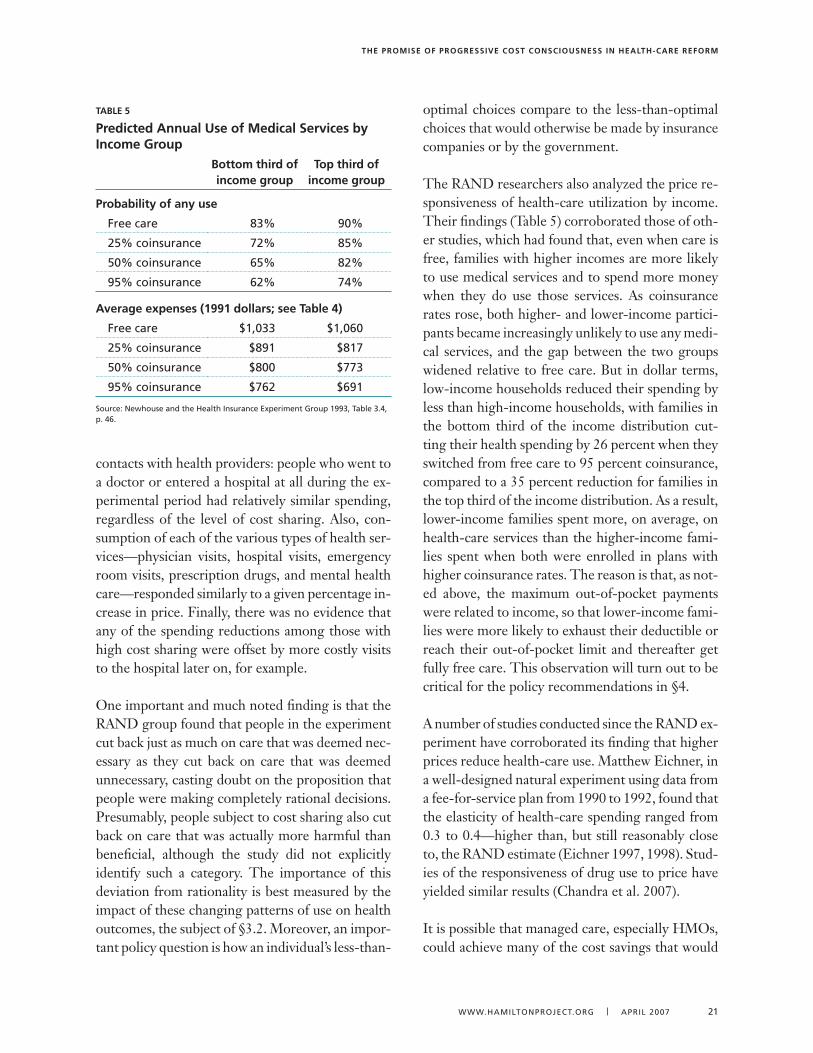
The RAND researchers also analyzed the price re-sponsiveness of health-care utilization by income. Their findings (Table 5) corroborated those of oth-er studies, which had found that, even when care is free, families with higher incomes are more likely to use medical services and to spend more money when they do use those services. As coinsurance rates rose, both higher- and lower-income partici-pants became increasingly unlikely to use any medi-cal services, and the gap between the two groups widened relative to free care. But in dollar terms, low-income households reduced their spending by less than high-income households, with families in the bottom third of the income distribution cut-ting their health spending by 26 percent when they switched from free care to 95 percent coinsurance, compared to a 35 percent reduction for families in the top third of the income distribution. As a result, lower-income families spent more, on average, on health-care services than the higher-income fami-lies spent when both were enrolled in plans with higher coinsurance rates. The reason is that, as not-ed above, the maximum out-of-pocket payments were related to income, so that lower-income fami-lies were more likely to exhaust their deductible or reach their out-of-pocket limit and thereafter get fully free care. This observation will turn out to be critical for the policy recommendations in §4.
A number of studies conducted since the RAND ex-periment have corroborated its finding that higher prices reduce health-care use. Matthew Eichner, in a well-designed natural experiment using data from a fee-for-service plan from 1990 to 1992, found that the elasticity of health-care spending ranged from 0.3 to 0.4—higher than, but still reasonably close to, the RAND estimate (Eichner 1997, 1998). Stud-ies of the responsiveness of drug use to price have yielded similar results (Chandra et al. 2007).
It is possible that managed care, especially HMOs, could achieve many of the cost savings that would
TaBle 5
Predicted annual use of medical services by income group
Bottom third of income group
Top third of income group
Probability of any use
Free care 8�% 90%
25% coinsurance 72% 85%
50% coinsurance 65% 82%
95% coinsurance 62% 74%
average expenses (1991 dollars; see Table 4)
Free care $1,0�� $1,060
25% coinsurance $891 $817
50% coinsurance $800 $77�
95% coinsurance $762 $691
source: Newhouse and the Health Insurance Experiment group 199�, Table �.4, p. 46.
The Promise of Progressive CosT ConsCiousness in healTh-Care reform
22 THE HAMILTON PROJECT | THE BROOkINgs INsTITuTION
otherwise be achieved by cost sharing, thus blunt-ing the impact. On the other hand, adding cost sharing to managed care could result in even more cost savings, and possibly even a more sustainable complement of demand- and supply-side policies. These important questions have not been studied in any detail, but evidence such as Eichner (1997) and other studies suggests that this may not be a major limitation, given that the responsiveness of health-care spending to prices seems to have been similar in the early 1990s to what it was during the RAND experiment. Moreover, with strict managed care well below the levels it reached in the 1990s, this issue is less relevant today.
As already noted, the most significant limitation of the RAND experiment and subsequent studies is that they examined how individuals respond to greater cost sharing, but by design did not exam-ine the systemwide effects. Other research indi-cates that these effects could far exceed the direct effects on individual participants. A recent paper by Amy Finkelstein (2007) used the natural experi-ment provided by the introduction of Medicare in 1966 to infer the effect of expanding insurance, and thus reducing cost sharing, on health-care spend-ing. She compared the impact of Medicare in states such as Alabama, Kentucky, Mississippi, and Ten-nessee, whose residents had relatively limited in-surance coverage before Medicare (the “treatment group”) with states such as Michigan and Ohio, whose residents had relatively extensive insurance coverage before Medicare (the “control group”). Finkelstein found that the systemwide effects of in-creased insurance on spending were six times larger than the individual effects in the RAND estimates. She further estimated that fully half of the increase in health expenditure from 1950 to 1990 resulted from the spread of health insurance and the conse-quent reduction in the out-of-pocket cost of health care.
Finkelstein (2007) explains why her systemwide natural experiment produced different results than RAND’s more limited randomized trial: “I find that the introduction of Medicare is associated with sub-
stantial new hospital entry. I also find some sug-gestive evidence that Medicare’s introduction is associated with increased adoption of cardiac tech-nologies and increased spending on non-Medicare patients” (p. 3).
What might account for these associations? Fin-kelstein argues that the introduction of Medicare might have crossed an important demand thresh-old, making it a viable option for hospitals to un-dertake the fixed costs of entering new markets or buying expensive new equipment. In addition, the expansion of insurance might have altered broader cultural norms and specific practice with regard to which treatments are appropriate in which circum-stances.
Over longer periods, cost sharing or its absence likely affects the incentive to develop technology (Weisbrod 1991). Relatively low cost sharing re-duces demand for technologies that save money, yet guarantees virtually unlimited demand for ex-pensive new technologies. To use an improbable analogy, if automobile insurance covered the cost of gasoline, automakers would probably devote less research toward making cars more fuel effi-cient and devote more research toward improving acceleration, comfort, and other aspects of per-formance unrelated to gas prices. But an observer who sees only the current level of fuel-saving tech-nology might fail to appreciate how much more fuel efficient cars could be if consumers had to pay out of pocket at the pump. As a result, cost sharing—through its impact on the invention and adoption of technology—has the potential to in-crease not only the level of spending, but also its growth rate. Over long periods, this effect grows more important.
More speculatively, some have claimed that great-er cost sharing would improve the functioning of health-care markets by stimulating both the avail-ability of information about prices and consumer awareness of that information, putting consumers in a position to bargain for better prices (e.g., Good-man 2006). There is little evidence for this propo-
The Promise of Progressive CosT ConsCiousness in healTh-Care reform
www.HAMILTONPROJECT.ORg | APRIL 2007 2�
sition, although it is hard to test in the absence of the systemwide change that would give rise to in-stitutional mechanisms to present price and qual-ity information that do not exist today. Moreover, there is reason to be skeptical that markets would function significantly better: insurance companies are very effective at bargaining for lower prices. For example, the largest type of health plan is PPOs, which bargain with providers over a fee schedule, using the threat of expelling the provider from the network to enforce the lower prices. It is far from clear that consumers could do a better job bargain-ing. In fact, greater cost sharing could reduce the incentives that insurance companies have to bar-gain for lower prices because consumers would be picking up more of the higher prices.
3.2. effects on health outcomes
Increasing cost sharing has the potential to re-duce health-care spending substantially, whether it is going from free care to some cost sharing, or from some cost sharing to more cost sharing. But do these reductions come at the expense of good health outcomes?
According to the RAND team, the answer for a large majority of adults is clearly no: “Our results show that the 40 percent increase in services on the free-care plan had little or no measurable effect on health status for the average adult” (Newhouse and the Insurance Experiment Group 1993, p. 243). This conclusion applied to all middle- and high-in-come people and to low-income people in initially normal or good health. However, for an important minority of the population—the 6 percent of peo-ple who had both low incomes and initially poor health—shifting from free care to cost sharing did come at the expense of health outcomes.13
In interpreting the relevance of these results to public policy, it is important to emphasize that the
RAND health plans linked maximum out-of-pocket payments to incomes, capping them at 5, 10, or 15 percent of income—or a fixed maximum amount. Thus, low- and middle-income families were sub-ject to less cost sharing than were high-income fam-ilies. The RAND results do not support the claim that a fixed deductible, such as in an HSA-qualified plan, would leave health outcomes unchanged.
Health outcomes can be measured along several dimensions, including mortality (the probability of dying within some stated period) and quality of life (often proxied by the absence of disability or health-related restrictions on one’s activity). Among all participants in the RAND study, mortality—or the predicted risk of dying—was virtually indistin-guishable between free-care and cost-sharing plans. Disability actually improved with more cost shar-ing: the average number of restricted-activity days per year due to “illness, injury, medical treatment, or some other health problem” fell from an average of ten in the plan with free care to eight in the plan with the greatest cost sharing. Days lost from work also fell under the cost-sharing plans.
One of the strengths of the RAND experiment was the extraordinary level of medical detail tracked by the researchers. Their data included dozens of ob-jective and subjective measures of health status in five general areas: “general health, including physi-cal, mental, and social health; physiologic health (presence and effect of various chronic diseases); health habits; prevalence of symptoms and disabil-ity days; and risk of dying from any cause related to various risk factors” (Newhouse and the Insurance Experiment Group 1993, p. 183). Here, however, the results were ambiguous: of thirty-two measures of health status, fifteen were better for people in the plan with free care, and seventeen were better in the plans with cost sharing. In most cases, however, the results were relatively close and were not statisti-cally significantly better in either case.
13. Even for this group, however, RAND found no evidence that going from some cost sharing to more cost sharing would reduce health out-comes. The samples used for this later comparison were, however, much smaller, making the finding less definitive than the comparisons between free care and cost sharing.
The Promise of Progressive CosT ConsCiousness in healTh-Care reform
24 THE HAMILTON PROJECT | THE BROOkINgs INsTITuTION
For the sample as a whole, a summary General Health Index was slightly—but again not statistical-ly significantly—better for people in the cost-shar-ing plans than for those in free care. The same was true for the subgroups of low-income people who were initially in good health and of high-income people regardless of their health status. The sub-jective results also favored the cost-sharing plans: participants were less likely to report health-related worries (for nine out of eleven conditions surveyed) or pain (for eight out of eleven) than participants in the free-care plan, although the differences were statistically insignificant.
These results on outcomes put the RAND finding on the equal reductions in “necessary” and “un-necessary” care in perspective. They suggest one of two possibilities: (1) The “necessary” care itself was not very beneficial to health. (2) Under free care, people consume more necessary, unnecessary, and flat-out harmful care. The net result is that health outcomes are not any better with more overall care than with less.
The RAND evidence finds that the relatively smaller effects associated with their randomized experiment do not harm health for most people. But if cost sharing were increased for everyone, then there would be systemwide effects that would likely lead to larger reductions in health spend-ing. We do not have definitive evidence of the effects of these on health outcomes, but evidence from the introduction of Medicare is consistent with the general RAND result. Finkelstein and Robin McKnight (2005) found, on a wide range of indicators, no discernible impact of Medicare on elderly mortality from 1965 to 1975, despite its contribution to a 28 percent increase in medi-cal spending. There are several reasons why this might be the case. First, before the introduction of Medicare, even the uninsured elderly had access to hospital treatment for the most serious treat-able conditions. Those who could not pay usually received free care. Second, medical technology in the 1960s was inferior to that available today, thus Medicare did not immediately expand access to the
full range of expensive but life-saving treatments that are available today because many of those treatments did not yet exist. Third, the study only covered ten years, and some of the larger effects on mortality may have taken longer to materialize. Finally, the study assessed only mortality and not morbidity (the incidence of ill health among those who survive) or other health factors. In short, al-though the Medicare evidence is not completely applicable to health care in the twenty-first centu-ry, it does provide another indication that greater cost sharing need not worsen health.
The important exception to the generally favorable results in the RAND study was the subgroup con-sisting of low-income people in initially poor health (see Ku 2003, Hudman and O’Malley 2003). The 6 percent of people in this category fared worse with cost sharing in some important dimensions. One was that people in this group were less likely to receive a diagnosis of hypertension and less likely to have the condition treated when they were subject to cost sharing. Because of this difference alone, members of this group who were in cost-sharing plans had a 10 percent higher rate of expected mortality. The same group of people was also somewhat less likely to have vision problems corrected and to have their dental cavities filled. Most other health indicators for this group were not affected by the level of cost sharing. Other studies have corroborated the nega-tive effect of cost sharing on low-income popula-tions. One study on the introduction of cost shar-ing among welfare recipients in Quebec found that cost sharing reduced therapeutic drug use, at the expense of a large increase in emergency room ad-missions and serious adverse events (Tamblyn et al. 2001). Other studies, although less definitive, have also found that increasing cost sharing can result in the underuse of drugs by the chronically ill (Gibson et al. 2005, Goldman et al. 2004, Thorpe 2006).
The RAND results on health outcomes are consid-erably more difficult to generalize with confidence to the current health system than are the results on the responsiveness of health-care spending to pric-es because of the revolutionary changes in health
The Promise of Progressive CosT ConsCiousness in healTh-Care reform
www.HAMILTONPROJECT.ORg | APRIL 2007 25
care. In the late 1970s and early 1980s, there was considerably less that could be done to control hy-pertension. With today’s drugs, the downside of not diagnosing hypertension could be far more conse-quential. Conversely, the advent and extensive use of expensive medical imaging technologies—such as computed tomography (CT) scans, ultrasound, magnetic resonance imaging (MRIs), and nuclear medicine—might be a good example of “flat of the curve medicine” that has relatively little benefit at the margin, and which was not present in the RAND experiment.
3.3. effects on families’ financial Well-being
The core function of any insurance is to protect against financial risk. Obviously, one direct effect of greater cost sharing in health insurance is to im-pose greater financial risk on those insured.14 The key question is whether the burden of this greater risk outweighs the potential savings for families on lower health-care spending for a given level of health outcomes. The answer again turns out to depend on the income of the person subjected to cost sharing.
For example, critics of flawed cost-saving vehicles, such as the high-deductible health insurance plans associated with HSAs, correctly argue that they impose unaffordable out-of-pocket costs on those low-income families who fall ill. Supporters coun-ter that “A number of features make HSA coverage potentially attractive to low-income workers. Pre-miums for high-deductible insurance are typically much lower than premiums for traditional cover-age. That alone makes HSA-compatible coverage more affordable” (Cannon 2006, p.16). This would be a valid rebuttal were it not for the fact that a giv-en increase in risk is less tolerable for a low-income family than it would be for a middle- or high-in-
come family, and therefore the mere fact that high deductibles allow cheaper premiums avoids the real issue. The real issue is whether the savings from the lower premium are worth the added risk to families. In the case of low-income families, the answer to this question will often be no.
Consider a simple coin toss, where heads means winning $5,000 and tails means losing $5,000. The loss of $5,000 would be devastating for a fam-ily making only $10,000 a year, but much less of a problem for a family making $100,000. Suppose, further, that both families are allowed to demand compensation for submitting to the coin toss. The low-income family would probably require more compensation than the high-income family to will-ingly accept the bet. To put it differently, but in the end equivalently, a low-income family should be willing to pay more for insurance to protect against the risk of losing $5,000.
Now consider two hypothetical insurance plans offered to a nonelderly family: an insurance plan that covers all costs with no out-of-pocket pay-ments (what economists call “complete insurance”) and a typical high-deductible plan with a $4,000 deductible, 20 percent coinsurance, and a $6,000 out-of-pocket maximum. For simplicity of exposi-tion, assume that both plans are actuarially fair, in the sense that the sum of premiums paid exactly equals in present value the expected total payout of health benefits, and that there are no admin-istrative costs or profits.15 Table 6 compares total health-care spending for an insured family under both plans. Spending under the high-deductible plan is calculated under two scenarios: the first assumes that health-care expenditure in the ag-gregate is unchanged by the introduction of the cost-sharing plan, and the second assumes that the increased cost sharing lowers aggregate expendi-ture by 5 percent.16
14. The indirect effect depends on whether greater cost sharing for small costs leads more people to get insurance or to have insurance that limits large out-of-pocket risks. In this case, more cost sharing for smaller costs could end up reducing risks overall.
15. These hypothetical premiums and the estimates derived from them are based on the distribution of health-care spending in 2004, updated to 2006 levels using the growth of per capita health expenditures.
16. Equivalently, it could be assumed, for example, that health care expenditure falls by 20 percent and that, at the margin, $1 of health-care
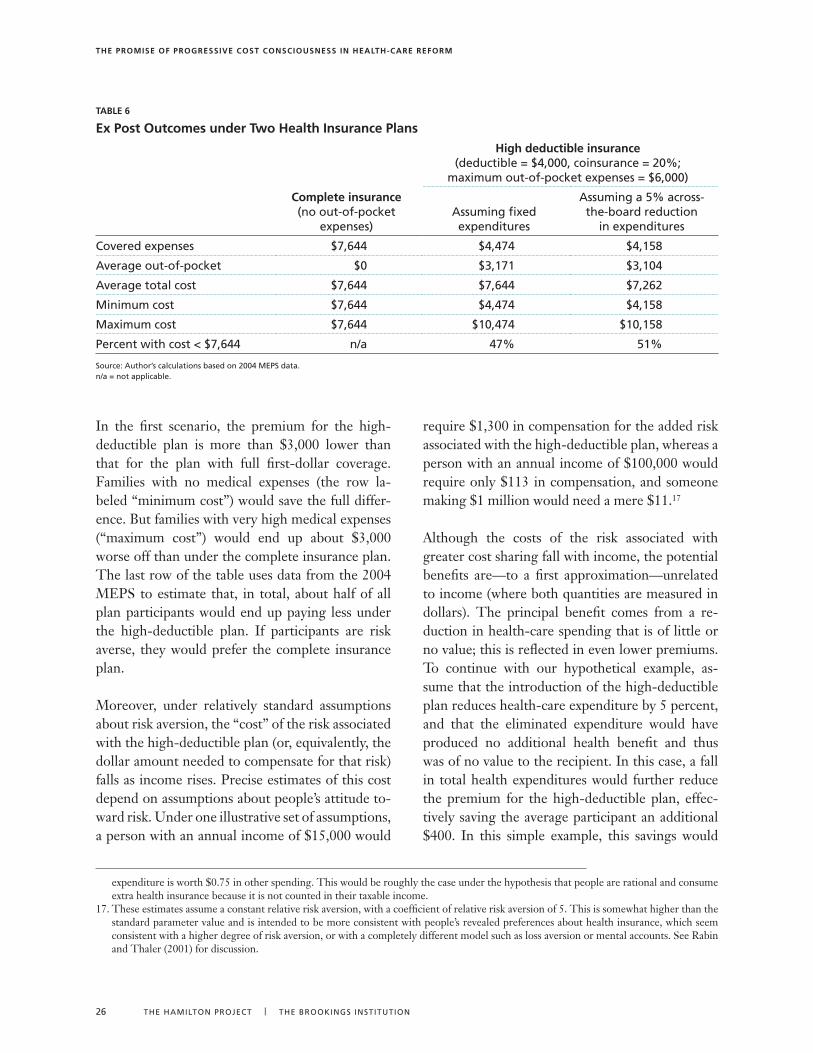
The Promise of Progressive CosT ConsCiousness in healTh-Care reform
26 THE HAMILTON PROJECT | THE BROOkINgs INsTITuTION
In the first scenario, the premium for the high-deductible plan is more than $3,000 lower than that for the plan with full first-dollar coverage. Families with no medical expenses (the row la-beled “minimum cost”) would save the full differ-ence. But families with very high medical expenses (“maximum cost”) would end up about $3,000 worse off than under the complete insurance plan. The last row of the table uses data from the 2004 MEPS to estimate that, in total, about half of all plan participants would end up paying less under the high-deductible plan. If participants are risk averse, they would prefer the complete insurance plan.
Moreover, under relatively standard assumptions about risk aversion, the “cost” of the risk associated with the high-deductible plan (or, equivalently, the dollar amount needed to compensate for that risk) falls as income rises. Precise estimates of this cost depend on assumptions about people’s attitude to-ward risk. Under one illustrative set of assumptions, a person with an annual income of $15,000 would
require $1,300 in compensation for the added risk associated with the high-deductible plan, whereas a person with an annual income of $100,000 would require only $113 in compensation, and someone making $1 million would need a mere $11.17
Although the costs of the risk associated with greater cost sharing fall with income, the potential benefits are—to a first approximation—unrelated to income (where both quantities are measured in dollars). The principal benefit comes from a re-duction in health-care spending that is of little or no value; this is reflected in even lower premiums. To continue with our hypothetical example, as-sume that the introduction of the high-deductible plan reduces health-care expenditure by 5 percent, and that the eliminated expenditure would have produced no additional health benefit and thus was of no value to the recipient. In this case, a fall in total health expenditures would further reduce the premium for the high-deductible plan, effec-tively saving the average participant an additional $400. In this simple example, this savings would
TaBle 6
ex Post outcomes under Two health insurance Plans
Complete insurance (no out-of-pocket
expenses)
high deductible insurance (deductible = $4,000, coinsurance = 20%;
maximum out-of-pocket expenses = $6,000)
Assuming fixed expenditures
Assuming a 5% across-the-board reduction
in expenditures
Covered expenses $7,644 $4,474 $4,158
Average out-of-pocket $0 $�,171 $�,104
Average total cost $7,644 $7,644 $7,262
Minimum cost $7,644 $4,474 $4,158
Maximum cost $7,644 $10,474 $10,158
Percent with cost < $7,644 n/a 47% 51%
source: Author’s calculations based on 2004 MEPs data. n/a = not applicable.
expenditure is worth $0.75 in other spending. This would be roughly the case under the hypothesis that people are rational and consume extra health insurance because it is not counted in their taxable income.
17. These estimates assume a constant relative risk aversion, with a coefficient of relative risk aversion of 5. This is somewhat higher than the standard parameter value and is intended to be more consistent with people’s revealed preferences about health insurance, which seem consistent with a higher degree of risk aversion, or with a completely different model such as loss aversion or mental accounts. See Rabin and Thaler (2001) for discussion.
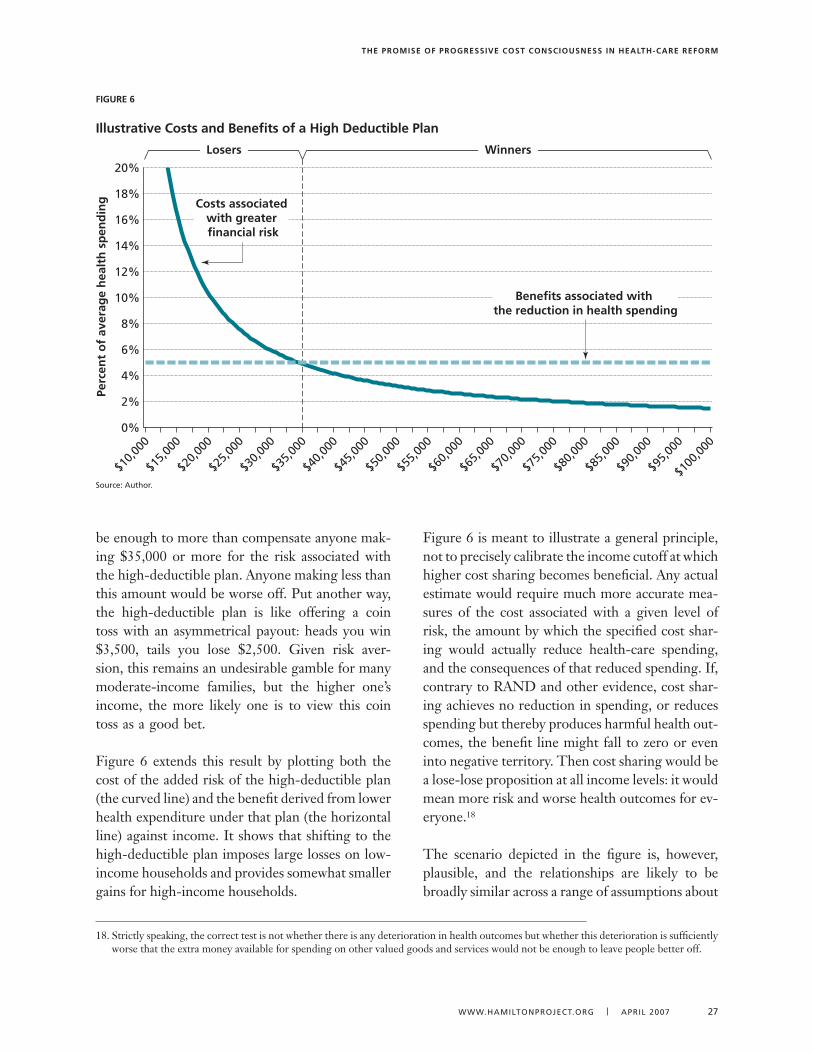
The Promise of Progressive CosT ConsCiousness in healTh-Care reform
www.HAMILTONPROJECT.ORg | APRIL 2007 27
be enough to more than compensate anyone mak-ing $35,000 or more for the risk associated with the high-deductible plan. Anyone making less than this amount would be worse off. Put another way, the high-deductible plan is like offering a coin toss with an asymmetrical payout: heads you win $3,500, tails you lose $2,500. Given risk aver-sion, this remains an undesirable gamble for many moderate-income families, but the higher one’s income, the more likely one is to view this coin toss as a good bet.
Figure 6 extends this result by plotting both the cost of the added risk of the high-deductible plan (the curved line) and the benefit derived from lower health expenditure under that plan (the horizontal line) against income. It shows that shifting to the high-deductible plan imposes large losses on low-income households and provides somewhat smaller gains for high-income households.
Figure 6 is meant to illustrate a general principle, not to precisely calibrate the income cutoff at which higher cost sharing becomes beneficial. Any actual estimate would require much more accurate mea-sures of the cost associated with a given level of risk, the amount by which the specified cost shar-ing would actually reduce health-care spending, and the consequences of that reduced spending. If, contrary to RAND and other evidence, cost shar-ing achieves no reduction in spending, or reduces spending but thereby produces harmful health out-comes, the benefit line might fall to zero or even into negative territory. Then cost sharing would be a lose-lose proposition at all income levels: it would mean more risk and worse health outcomes for ev-eryone.18
The scenario depicted in the figure is, however, plausible, and the relationships are likely to be broadly similar across a range of assumptions about
figure 6
illustrative Costs and Benefits of a high Deductible Plan
source: Author.
$10,0
00
$15,0
00
$20,0
00
$25,0
00
$30,0
00
$35,0
00
$40,0
00
$45,0
00
$50,0
00
$55,0
00
$60,0
00
$65,0
00
$70,0
00
$75,0
00
$80,0
00
$85,0
00
$90,0
00
$95,0
00
$100
,000
0%
2%
4%
6%
8%
10%
12%
14%
16%
18%
20%
Perc
ent
of
aver
age
hea
lth
sp
end
ing
Losers Winners
Benefits associated with the reduction in health spending
Costs associated with greater financial risk
18. Strictly speaking, the correct test is not whether there is any deterioration in health outcomes but whether this deterioration is sufficiently worse that the extra money available for spending on other valued goods and services would not be enough to leave people better off.
The Promise of Progressive CosT ConsCiousness in healTh-Care reform
28 THE HAMILTON PROJECT | THE BROOkINgs INsTITuTION
benefits and costs. In fact, the RAND evidence dis-cussed above implies that the picture could look even worse for lower-income households because reducing their health-care spending may worsen their health outcomes more than it does those of higher-income households. In that case, the hori-zontal line would become upward sloping, possibly even starting at or below zero on the left-hand side. That would strengthen the conclusions of this anal-ysis. Conversely, it is conceivable that reductions in health-care spending would be more valuable for
lower-income households because the money saved would be more valuable to them in meeting their other needs. Put another way, given that health-care spending, in total from all sources, now averages 80 percent of income for families below the 125 per-cent of the poverty line and 8 percent of income for high-income families above 400 percent of poverty, it is conceivable that, at the margin, shifting $1 out of health into other consumption would raise the low-income household’s well-being more than it would raise that of the high-income household.
The Promise of Progressive CosT ConsCiousness in healTh-Care reform
www.HAMILTONPROJECT.ORg | APRIL 2007 29
The analysis thus far suggests that, ideally, cost sharing should be a function of income, and it should not be the same for all households.
The evidence on the effects of cost sharing on health-care spending (which are larger when cost sharing is related to income), on health outcomes (which were worse for chronically ill low-income people subjected to increased cost sharing), and on risk (a given degree of which is more costly for low-er-income families) all points in this direction. This section explores this concept of income-related cost sharing further by simulating its effects on health-care spending and overall economic welfare in the United States, using health-care expenditure data from 2004.19
4.1. The simulation method
The basic approach of the simulation method is to identify a set of insurance policies that differ in the degree and type of cost sharing and then calculate what each, if implemented for all the nonelderly with private insurance, would do to the price of health care, and how much this change in price would affect the consumption of health care.20 No attempt is made to treat different types of health-care spending differently, to model what people’s actual insurance plans are today, or to take into account the realistic case where people’s health spending is spread out unpredictably throughout the year.
It turns out that the estimates depend crucially on how responsive health-care spending is to changes in prices. Two possibilities are considered: (1) The
first uses the estimated elasticity from the RAND experiment, which found that a 10 percent increase in cost would lead to a 2.2 percent reduction in spending on health care. This can be interpreted as a short-run estimate that reflects immediate behav-ioral changes but ignores any longer-term, econ-omywide responses such as the development and adoption of new medical technologies and practice styles. Alternatively, the RAND figure can be in-terpreted as an estimate of what would happen if only a minority of people were switched into a cost-sharing plan, so that the systemwide effects do not occur. (For example, in 2006 fewer than 5 percent of Americans had HSAs, and thus no systemwide effects are likely.)
(2) As Finkelstein and other researchers have stressed, however, when change is systemwide, the effects can be substantially larger, even over a relatively brief five- to ten-year period. To account for this possibility, the simulation also includes an alternative set of estimates intended to show what would happen if a 10 percent increase in the cost of health care led to a 6 percent reduction in spend-ing. This is roughly half the elasticity found in the Finkelstein study.
The experiment thus analyzes several discrete sce-narios, each of which assumes that a single insur-ance plan with a specific form of cost sharing is im-plemented nationwide.21 The plans are as follows:
n a conventional plan with lower cost shar-ing. This plan is assumed to have a deductible of $350 for individuals ($700 for families) and
19. This analysis is similar to Feldstein and Gruber (1995), who used health-care expenditure data from 1987. Note that 2004 data are ad-justed to 2006 levels using the per capita growth in the corresponding aggregate.
20. In the income-related cost sharing plans the percentage reductions in health spending would be somewhat smaller if the simulation included Medicaid beneficiaries because, unlike the privately insured population, they would see little if any reduction in their health expenditures.
21. Of course, any real-world reform would allow for a much wider variety of plans. Unfortunately, the microdata do not provide any detail about cost sharing for each individual. As a result, this simulation follows the standard assumption of initially assigning everyone to the same plan. (See, for example, Keeler 1996, Remler and Glied 2006, and Feldstein and Gruber 1995.)
4. The effects of income-based Cost sharing on health-care spending and Consumer Well-being
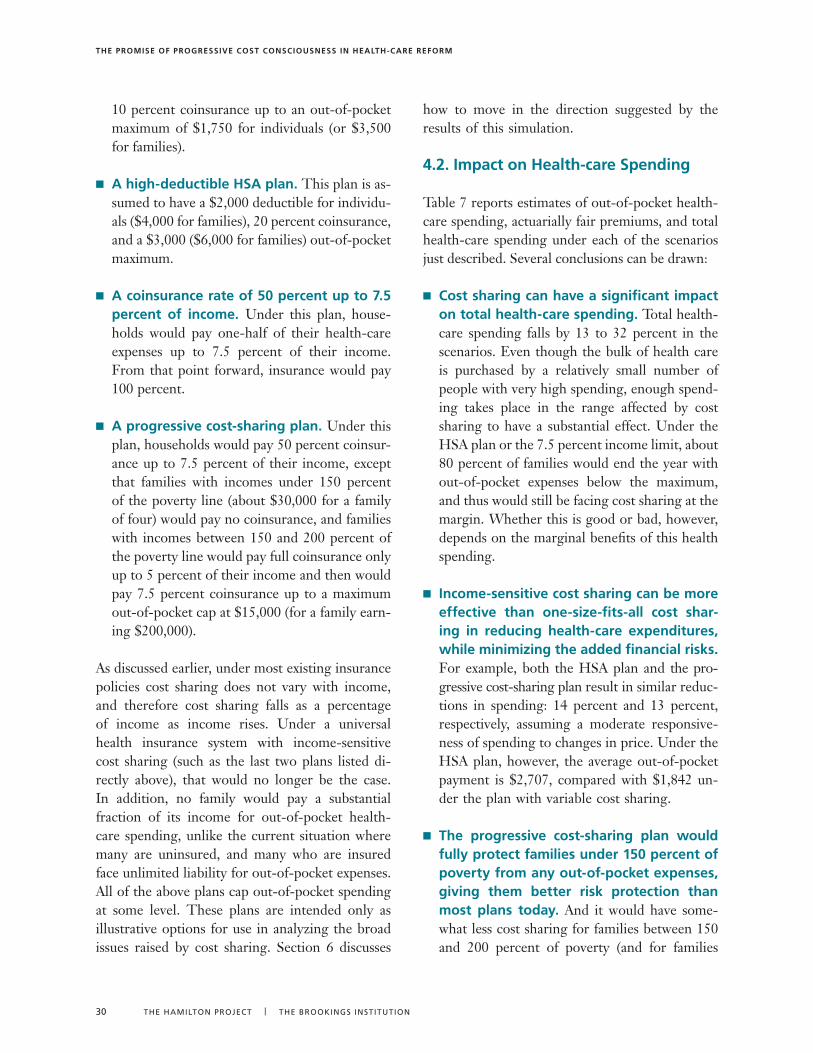
The Promise of Progressive CosT ConsCiousness in healTh-Care reform
�0 THE HAMILTON PROJECT | THE BROOkINgs INsTITuTION
10 percent coinsurance up to an out-of-pocket maximum of $1,750 for individuals (or $3,500 for families).
n a high-deductible hsa plan. This plan is as-sumed to have a $2,000 deductible for individu-als ($4,000 for families), 20 percent coinsurance, and a $3,000 ($6,000 for families) out-of-pocket maximum.
n a coinsurance rate of 50 percent up to 7.5 percent of income. Under this plan, house-holds would pay one-half of their health-care expenses up to 7.5 percent of their income. From that point forward, insurance would pay 100 percent.
n a progressive cost-sharing plan. Under this plan, households would pay 50 percent coinsur-ance up to 7.5 percent of their income, except that families with incomes under 150 percent of the poverty line (about $30,000 for a family of four) would pay no coinsurance, and families with incomes between 150 and 200 percent of the poverty line would pay full coinsurance only up to 5 percent of their income and then would pay 7.5 percent coinsurance up to a maximum out-of-pocket cap at $15,000 (for a family earn-ing $200,000).
As discussed earlier, under most existing insurance policies cost sharing does not vary with income, and therefore cost sharing falls as a percentage of income as income rises. Under a universal health insurance system with income-sensitive cost sharing (such as the last two plans listed di-rectly above), that would no longer be the case. In addition, no family would pay a substantial fraction of its income for out-of-pocket health-care spending, unlike the current situation where many are uninsured, and many who are insured face unlimited liability for out-of-pocket expenses. All of the above plans cap out-of-pocket spending at some level. These plans are intended only as illustrative options for use in analyzing the broad issues raised by cost sharing. Section 6 discusses
how to move in the direction suggested by the results of this simulation.
4.2. impact on health-care spending
Table 7 reports estimates of out-of-pocket health-care spending, actuarially fair premiums, and total health-care spending under each of the scenarios just described. Several conclusions can be drawn:
n Cost sharing can have a significant impact on total health-care spending. Total health-care spending falls by 13 to 32 percent in the scenarios. Even though the bulk of health care is purchased by a relatively small number of people with very high spending, enough spend-ing takes place in the range affected by cost sharing to have a substantial effect. Under the HSA plan or the 7.5 percent income limit, about 80 percent of families would end the year with out-of-pocket expenses below the maximum, and thus would still be facing cost sharing at the margin. Whether this is good or bad, however, depends on the marginal benefits of this health spending.
n income-sensitive cost sharing can be more effective than one-size-fits-all cost shar-ing in reducing health-care expenditures, while minimizing the added financial risks. For example, both the HSA plan and the pro-gressive cost-sharing plan result in similar reduc-tions in spending: 14 percent and 13 percent, respectively, assuming a moderate responsive-ness of spending to changes in price. Under the HSA plan, however, the average out-of-pocket payment is $2,707, compared with $1,842 un-der the plan with variable cost sharing.
n The progressive cost-sharing plan would fully protect families under 150 percent of poverty from any out-of-pocket expenses, giving them better risk protection than most plans today. And it would have some-what less cost sharing for families between 150 and 200 percent of poverty (and for families
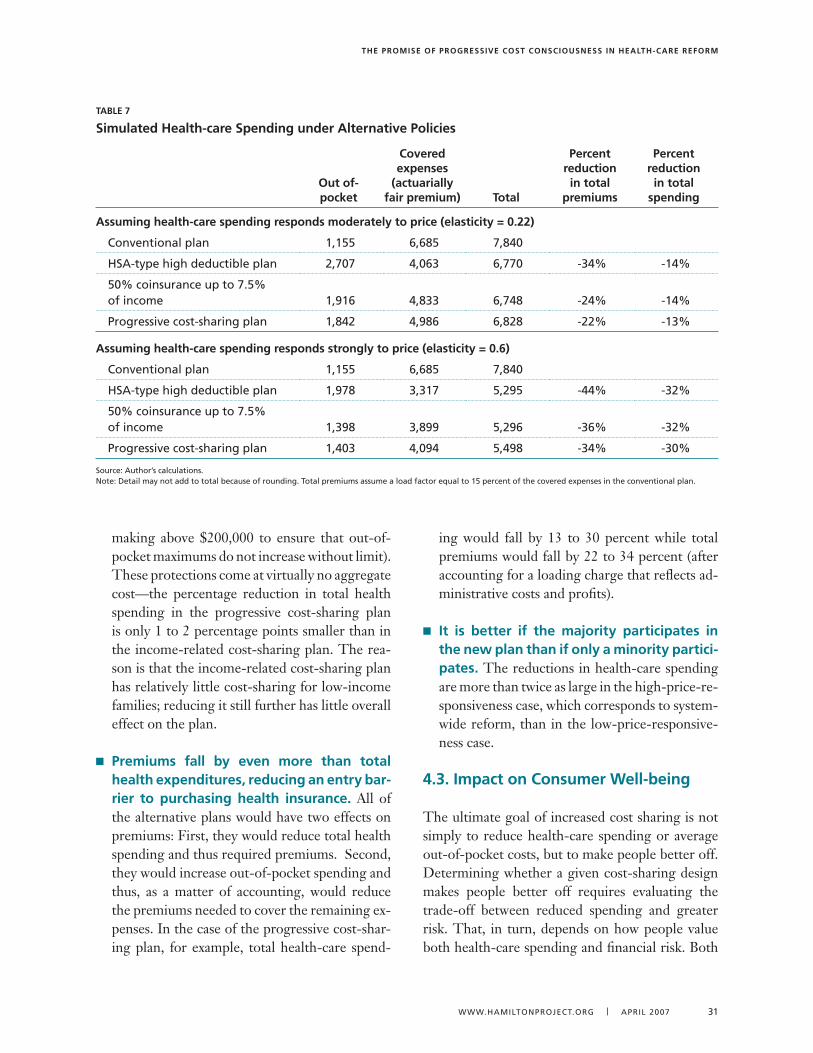
The Promise of Progressive CosT ConsCiousness in healTh-Care reform
www.HAMILTONPROJECT.ORg | APRIL 2007 �1
making above $200,000 to ensure that out-of-pocket maximums do not increase without limit). These protections come at virtually no aggregate cost—the percentage reduction in total health spending in the progressive cost-sharing plan is only 1 to 2 percentage points smaller than in the income-related cost-sharing plan. The rea-son is that the income-related cost-sharing plan has relatively little cost-sharing for low-income families; reducing it still further has little overall effect on the plan.
n Premiums fall by even more than total health expenditures, reducing an entry bar-rier to purchasing health insurance. All of the alternative plans would have two effects on premiums: First, they would reduce total health spending and thus required premiums. Second, they would increase out-of-pocket spending and thus, as a matter of accounting, would reduce the premiums needed to cover the remaining ex-penses. In the case of the progressive cost-shar-ing plan, for example, total health-care spend-
ing would fall by 13 to 30 percent while total premiums would fall by 22 to 34 percent (after accounting for a loading charge that reflects ad-ministrative costs and profits).
n it is better if the majority participates in the new plan than if only a minority partici-pates. The reductions in health-care spending are more than twice as large in the high-price-re-sponsiveness case, which corresponds to system-wide reform, than in the low-price-responsive-ness case.
4.3. impact on Consumer Well-being
The ultimate goal of increased cost sharing is not simply to reduce health-care spending or average out-of-pocket costs, but to make people better off. Determining whether a given cost-sharing design makes people better off requires evaluating the trade-off between reduced spending and greater risk. That, in turn, depends on how people value both health-care spending and financial risk. Both
TaBle 7
simulated health-care spending under alternative Policies
out of- pocket
Covered expenses
(actuarially fair premium) Total
Percent reduction in total
premiums
Percent reduction in total
spending
assuming health-care spending responds moderately to price (elasticity = 0.22)
Conventional plan 1,155 6,685 7,840
HsA-type high deductible plan 2,707 4,06� 6,770 -�4% -14%
50% coinsurance up to 7.5% of income 1,916 4,8�� 6,748 -24% -14%
Progressive cost-sharing plan 1,842 4,986 6,828 -22% -1�%
assuming health-care spending responds strongly to price (elasticity = 0.6)
Conventional plan 1,155 6,685 7,840
HsA-type high deductible plan 1,978 �,�17 5,295 -44% -�2%
50% coinsurance up to 7.5% of income 1,�98 �,899 5,296 -�6% -�2%
Progressive cost-sharing plan 1,40� 4,094 5,498 -�4% -�0%
source: Author’s calculations. Note: Detail may not add to total because of rounding. Total premiums assume a load factor equal to 15 percent of the covered expenses in the conventional plan.
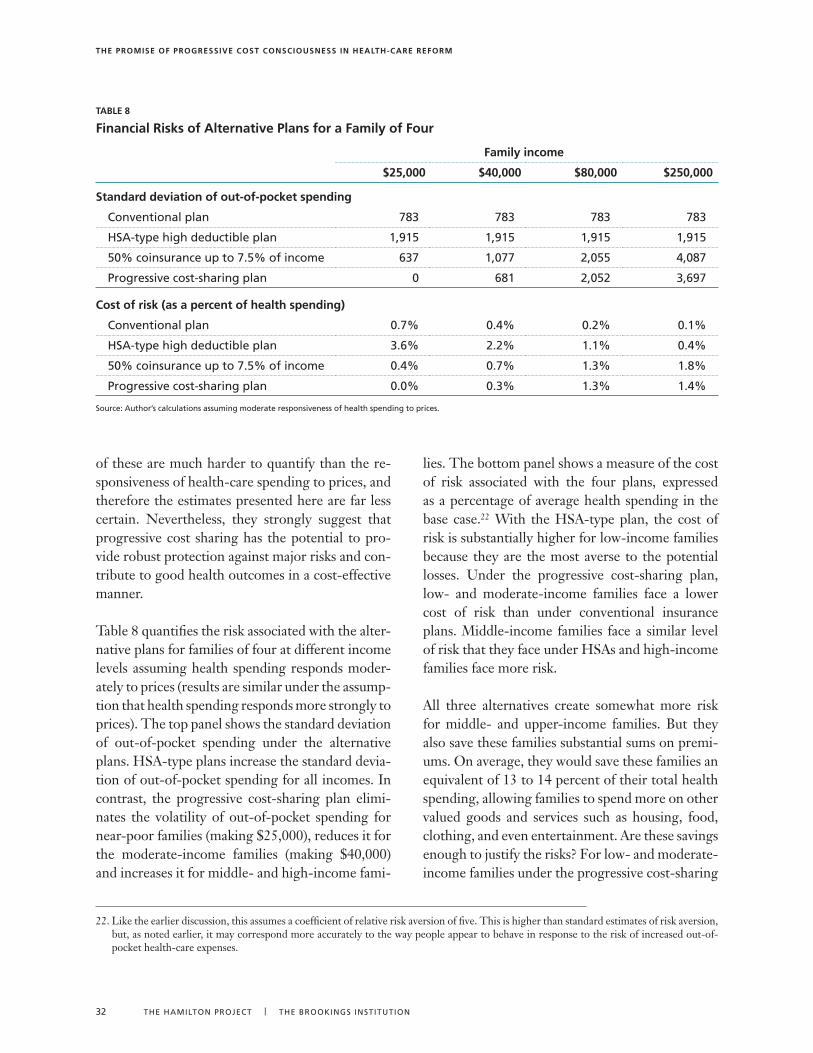
The Promise of Progressive CosT ConsCiousness in healTh-Care reform
�2 THE HAMILTON PROJECT | THE BROOkINgs INsTITuTION
of these are much harder to quantify than the re-sponsiveness of health-care spending to prices, and therefore the estimates presented here are far less certain. Nevertheless, they strongly suggest that progressive cost sharing has the potential to pro-vide robust protection against major risks and con-tribute to good health outcomes in a cost-effective manner.
Table 8 quantifies the risk associated with the alter-native plans for families of four at different income levels assuming health spending responds moder-ately to prices (results are similar under the assump-tion that health spending responds more strongly to prices). The top panel shows the standard deviation of out-of-pocket spending under the alternative plans. HSA-type plans increase the standard devia-tion of out-of-pocket spending for all incomes. In contrast, the progressive cost-sharing plan elimi-nates the volatility of out-of-pocket spending for near-poor families (making $25,000), reduces it for the moderate-income families (making $40,000) and increases it for middle- and high-income fami-
lies. The bottom panel shows a measure of the cost of risk associated with the four plans, expressed as a percentage of average health spending in the base case.22 With the HSA-type plan, the cost of risk is substantially higher for low-income families because they are the most averse to the potential losses. Under the progressive cost-sharing plan, low- and moderate-income families face a lower cost of risk than under conventional insurance plans. Middle-income families face a similar level of risk that they face under HSAs and high-income families face more risk.
All three alternatives create somewhat more risk for middle- and upper-income families. But they also save these families substantial sums on premi-ums. On average, they would save these families an equivalent of 13 to 14 percent of their total health spending, allowing families to spend more on other valued goods and services such as housing, food, clothing, and even entertainment. Are these savings enough to justify the risks? For low- and moderate-income families under the progressive cost-sharing
TaBle 8
financial risks of alternative Plans for a family of four
family income
$25,000 $40,000 $80,000 $250,000
standard deviation of out-of-pocket spending
Conventional plan 78� 78� 78� 78�
HsA-type high deductible plan 1,915 1,915 1,915 1,915
50% coinsurance up to 7.5% of income 6�7 1,077 2,055 4,087
Progressive cost-sharing plan 0 681 2,052 �,697
Cost of risk (as a percent of health spending)
Conventional plan 0.7% 0.4% 0.2% 0.1%
HsA-type high deductible plan �.6% 2.2% 1.1% 0.4%
50% coinsurance up to 7.5% of income 0.4% 0.7% 1.�% 1.8%
Progressive cost-sharing plan 0.0% 0.�% 1.�% 1.4%
source: Author’s calculations assuming moderate responsiveness of health spending to prices.
22. Like the earlier discussion, this assumes a coefficient of relative risk aversion of five. This is higher than standard estimates of risk aversion, but, as noted earlier, it may correspond more accurately to the way people appear to behave in response to the risk of increased out-of-pocket health-care expenses.
The Promise of Progressive CosT ConsCiousness in healTh-Care reform
www.HAMILTONPROJECT.ORg | APRIL 2007 ��
plan the answer is obviously yes: these families save money and face less risks.23 Under the HSA-plan the answer is much more equivocal: these families face more risks and the evidence from RAND and subsequent studies suggest that these families could also face significant health risks. For middle- and high-income families, the evidence from RAND strongly suggests that the savings of 13 to 14 per-cent of total health spending will come at virtually no cost in terms of health, more than repaying the added financial risks.
4.4. for some, income-related Cost sharing Could reduce financial risk and increase health-care spending
This analysis assumes that the entire population is shifted from a conventional insurance plan with a $1,750 ($3,500 for families) out-of-pocket maxi-
mum to a plan that may have more cost shar-ing, depending on the person’s income. In reality, many people today are uninsured or underinsured. Income-related cost sharing will unambiguously reduce the price of their health care, reduce the financial risk they face, and increase their health-care spending. In total, 22 percent of workers have insurance plans that expose them to unlimited li-ability.24 In contrast, the progressive cost-sharing plan would have out-of-pocket limits for all fami-lies, providing more financial protection against major risks and probably contributing to better health outcomes. Even HSA-qualified insurance plans are required to have an out-of-pocket lim-it no greater than $5,500 for an individual and $11,000 for a family, making them better at mini-mizing major health risks than some of the insur-ance plans on the market today.
23. Note, the implicit assumption in Table 8 is that all families pay a premium that reflects their maximum out-of-pocket expenses. In other words, it assumes that lower-income families pay a higher premium because they have a lower out-of-pocket limit. If premiums were equal for all families then in addition to the other effects there would also be a substantial redistribution from higher-income families to lower-income families.
24. Some of these workers are in HMOs with little cost sharing, though, so this exposure does not represent a general risk.
The Promise of Progressive CosT ConsCiousness in healTh-Care reform
�4 THE HAMILTON PROJECT | THE BROOkINgs INsTITuTION
Further refinements in the design of cost shar-ing can have additional positive effects on the health-care system. One such refinement
would be to exempt from cost sharing certain types of health care that have been well documented to be particularly beneficial. This kind of “smart,” evi-dence-based cost sharing can improve the delivery of health care, particularly of health care for the chronically ill.
5.1. evidence-based Cost sharing
As the RAND study, the evidence from the large disparities in Medicare spending across coun-ties, and other evidence demonstrates, we can achieve equally good health outcomes as we are getting today for substantially less money and with substantially fewer treatments. In many cas-es, American health care is being practiced on what is called the “flat of the curve,” with little marginal health benefit for additional spending and treatments. There are many important ex-ceptions, however. In those cases, indiscriminate, across-the-board cost sharing is likely to make people worse off. The RAND experiment identi-fied some important exceptions involving low-in-come people with chronic conditions. According to Joseph Newhouse and the Insurance Experi-ment Group (1993), all of these conditions shared three characteristics:
n “The conditions in question are relatively common.
n The standard diagnostic tests for these conditions are relatively inexpensive (for example, measuring blood pressure, giving a vision refraction test, taking an X-ray of a tooth).
n The standard treatment is well known, inexpensive, and more effective than the standard treatments for many other medi-cal conditions.” (p. 351)
Newhouse goes on to note that it would be easy to carve dental care and vision care out of the broader health-care system and institute cost sharing for them separately. Hypertension is harder to carve out because it is normally diagnosed and treated by the same medical professionals who provide most other health care, and as part of the same process. Even with hypertension, though, the RAND ex-periment found that blood pressure screening alone provided half the total benefit of free care at a frac-tion of the total cost. Moreover, once individuals knew they were hypertensive, there was little dif-ference in treatment between those receiving free care and those with cost sharing.
The rules under which high-deductible plans qual-ify as HSAs are designed with some of these lessons in mind. HSAs are allowed to provide first-dollar coverage for preventive services, thus exempting these from cost sharing. Prevention is defined to include “periodic health evaluations . . . such as an-nual physicals, routine pre-natal and well-child care, child and adult immunizations, tobacco cessation programs, obesity weight-loss programs, screening services” (U.S. Department of the Treasury Notice 2004-23). In 2006, 82 percent of workers enrolled in HSA-qualified high-deductible plans had at least some cost-sharing exemptions for preventive ser-vices (Kaiser et al. 2006). The current exceptions under HSAs may be inadequate, however, because they relate only to preventive care, including screen-ings. They fail to address disease management for the high-risk insured and the chronically ill, includ-ing diabetics, people with high cholesterol, people with a history of heart disease, and depression.
There is substantial evidence that high-risk indi-viduals and the chronically ill underutilize care, and there is some evidence that cost sharing could make the problem worse. With respect to these issues, policy makers and the insurance industry are focusing most of their attention on the sup-
5. other important Considerations in Designing effective Cost sharing
The Promise of Progressive CosT ConsCiousness in healTh-Care reform
www.HAMILTONPROJECT.ORg | APRIL 2007 �5
ply side: providers are encouraged to apply more evidence-based care, through techniques ranging from better dissemination of information to pay-for-performance rules, which reimburse providers on the basis of health-care inputs used, or even outcomes. These supply-side measures could, however, be complemented by demand-side mea-sures that relate cost sharing to medical evidence (Fenwick et al. 2001). In a sense, utilization review already does this by requiring people to pay in full for denied health treatments (i.e., 100 percent co-insurance). But for plans where cost sharing is the norm, the goal would be to carve out exceptions based on the best evidence. Such exceptions would not just lower the relative price of certain services-they would also send a strong signal about the ef-fectiveness of those services, thus complementing the supply-side measures.
The devil, of course, is in the details, and our cur-rent state of knowledge is very poor about both links in the chain: how cost sharing (including differen-tial cost sharing) affects the use of different types of health care and how health care affects health out-comes. We simply do not know enough to design an effective system of exceptions. Additional research would help. The best evidence remains the RAND Health Insurance Experiment, but it was launched more than thirty years ago, when health technology and health insurance were very different from what they are today. Although subsequent studies have generally corroborated its results, the confidence that we should have in approaching such an impor-tant issue is still lacking. Further research into which health measures should be cost free for consumers is critical: another round of RAND-like experiments would repay its cost several hundredfold. Yet even if we had perfect knowledge about what conditions should be exempted from cost sharing, a substantial political risk would remain: the decisions might be influenced not by solid medical evidence alone, but also by political pressure from medical providers.
There are two possible ways to deal with both of these problems. The first is to establish a respected national board, such as Britain’s National Institute
for Health and Clinical Excellence, to promulgate standards not just for treatment, but also for evi-dence-based cost sharing and other aspects of the demand side of health insurance. The second way would be to give insurance companies some flex-ibility to experiment with their own designs for evidence-based cost sharing, possibly by allowing them broad exceptions but then putting a percent-age limit on the services they may exempt. The re-sulting competition and freedom of choice might help in arriving at a better recipe. At the very least, it would give researchers and policy makers more information to use in designing more effective cost-sharing regimes.
Ultimately, any such change would offset some of the spending reductions from the greater cost sharing, but substantial savings are likely to remain. Lambrew (2007), for example, estimates that total prevention spending is $70 billion, or 3 percent of total health spending. Carving this spending out, either through Lambrew’s proposed Wellness Trust or through smart cost sharing, would have only a small impact on the analysis in §4. Carving out drugs to manage chronic conditions would be somewhat more important, but still would not undo the ben-efits of lower premiums. For example, exempting all drugs from the progressive cost-sharing plan, and instead treating them as they are under insur-ance today, would lead to a reduction in total health spending of 10 percent instead of 13 percent.
5.2. insurance for the Chronically ill
The other major shortcoming of increased cost sharing is its effect on the chronically ill. In effect, the earlier discussion of risk assumed that medical risks are of a one-time nature: an individual policy-holder might fall ill and receive insurance payouts one year, but be in good health again the next and receive nothing. But insurance also covers—and should cover—the cost of chronic illness. Unlike those who suffer an acute illness and then return to full health, the insured who are chronically ill are quite likely to receive more in insurance payouts than they contribute over a period that can extend
The Promise of Progressive CosT ConsCiousness in healTh-Care reform
�6 THE HAMILTON PROJECT | THE BROOkINgs INsTITuTION
into many decades. Health insurance thus redis-tributes resources from the usually healthy to the chronically ill. In a just and equitable society, this is seen as a good thing, but increasing cost sharing undoes some of the extra support that the chroni-cally ill receive. It puts a greater financial burden on many of the chronically ill than they can or should bear.
The issue is a serious one and requires a response. Smarter, evidence-based cost sharing could help by providing more first-dollar coverage for treatments known to be highly effective in managing chronic illness. In such cases, presumably, there is little overuse of care, and thus removing the price signal has little downside, while the insurance itself pro-vides protection against financial risk on the upside (Chandra et al. 2007).
Other measures should also be considered, includ-ing income tax credits for people who reach their out-of-pocket limit year after year. Although po-tentially complicated to administer, such a measure would make the redistribution from the healthy to the chronically ill more transparent. It would also
offer greater assurance that such redistribution will continue, compared with the risk-pooling mecha-nisms under the current system that are fragment-ing and that may collapse.
Finally, as argued above, greater cost sharing would ideally be implemented as part of a broader health reform that includes universal coverage. Any such reform should also include other measures—such as new pooling options, community rating, guaran-teed renewal, reinsurance, and risk-adjusted vouch-ers—that could improve the availability and effec-tiveness of insurance for the chronically ill.
Anything that helps provide insurance for the chronically ill will also reduce the extent of adverse selection, the process by which healthier people opt into plans with higher cost sharing plans, leaving sicker people in plans with lower cost sharing. Ad-verse selection is a problem not just because of the need for equity, but also because it can lead to mar-ket failures that lead people into the wrong insur-ance plans or even can cause some types of desirable insurance plans to cease to exist.
The Promise of Progressive CosT ConsCiousness in healTh-Care reform
www.HAMILTONPROJECT.ORg | APRIL 2007 �7
In practice, a number of impediments stand in the way of the health insurance market develop-ing income-related cost sharing on its own. For
one thing, it would be difficult for private insur-ance companies to develop and administer policies that have different cost sharing for families with different incomes, especially in the context of an employer-sponsored system. Additionally, the cur-rent tax code is biased toward plans with lower cost sharing: it allows employees to exclude employer contributions to their health insurance premiums from their taxable income, but does not allow a corresponding deduction of their out-of-pocket health-care expenses.25 This bias also reduces the transparency of health premiums, masking the trade-off between health-care spending and spend-ing on all other goods. All else equal, no one would choose a plan with higher cost sharing, and all else equal, no one would choose a plan with a higher premium. However, if insured workers observe their own out-of-pocket expenses but do not ob-serve the premiums they pay indirectly, because the payment takes the form of lower wages, it is harder to make this trade-off.
Another reason people end up in insurance plans that do not provide coverage against major risks is that health-care providers—primarily hospitals and physicians—often simply write off large, uncovered expenses that the patient cannot or will not pay. This weakens the demand for insurance to cover these major risks. Finally, there may be significant behavioral obstacles in the way people understand insurance, especially for small risks. The follow-ing subsection discusses some possible strategies to overcome these obstacles and move closer to a sys-tem of cost sharing that minimizes major financial risks and improves health outcomes in a cost-effec-tive manner.
6.1. how to make Cost sharing income sensitive
The simplest and cleanest way to implement in-come-related cost sharing would be as part of a far-reaching fundamental health reform. For instance, a single-payer insurance system could easily incorpo-rate income-related cost sharing, either in the form of a 7.5-percent-of-income limit on out-of-pocket expenses, or with different tiers of cost sharing for different income groups. Alternatively, a system of risk-adjusted vouchers, such as that proposed by Victor Fuchs and Ezekiel Emanuel (2005), could include income-related cost sharing in the benefit mandate for private insurance companies under the proposal. As discussed earlier, the potential benefits of greater cost sharing will be larger if the change is made systemwide.
Alternatively, the federal government could start by introducing income-sensitive cost sharing into its own programs, such as Medicare, or the Federal Employee Health Benefits Program, which covers about 9 million current and former government workers and their dependents (Government Ac-countability Office 2006). The government could also encourage private insurance companies to of-fer income-related coinsurance, possibly by lim-iting the current tax exclusion to employers that purchase plans with this feature. Alternatively, the government could implement income-sensitive cost sharing directly, with a tax credit for out-of-pocket medical expenses in excess of a certain frac-tion of income. This approach, however, raises seri-ous issues of complexity and the timing of payments (U.S. Department of the Treasury 1977, Seidman 1980). (The credit would presumably be claimable only once a year, on the taxpayer’s annual income tax return.)
25. Exceptions include flexible spending accounts and out-of-pocket expenses exceeding 7.5 percent of income, although this applies only for people that itemize their deductions.
6. implementing Better Cost sharing
The Promise of Progressive CosT ConsCiousness in healTh-Care reform
�8 THE HAMILTON PROJECT | THE BROOkINgs INsTITuTION
Income-related coinsurance would entail some ad-ditional administrative complexities, but the poten-tial gains are so large that it is worth the effort to try to overcome them. It is certainly feasible to do so: the RAND experiment implemented income-related cost sharing in the mid-1970s. Doing it at scale and with today’s superior information tech-nology would be easier. Moreover, income-related cost sharing already exists to a limited degree in Medicaid, the State Children’s Health Insurance Program, and a handful of private plans. Any addi-tional administrative costs would be well worth the expected benefits. The alternatives, in contrast, are not very desirable: limiting cost sharing for every-one is an inefficient way to protect the low-income, chronically ill minority, and imposing an aggressive form of cost sharing on everyone would harm the most vulnerable.
6.2. income-related Compensation
Income-related compensation could be an admin-istratively simpler alternative to income-related co-insurance. Assume, for example, that every family in the country was enrolled in a plan with a $4,000 deductible. Families could then receive match-ing funds or tax credits from the government to offset their payments against this deductible, and the contributions could be inversely proportional to income. Or, equivalently, lower-income house-holds could receive a larger subsidy on their pre-mium payments than higher-income households, as Medicare is now starting to do.
But income-related compensation would not be as efficient or desirable as income-related coinsur-ance, for two reasons. First, it would not change the incentives to consume health insurance. Income-related premiums in Medicare, for example, are a form of progressive tax financing for the program, but they are effectively a sunk cost that does not affect further spending. Second, the RAND study and other evidence indicate that low-income indi-viduals and the chronically ill may end up worse off
if they are forced to pay substantial amounts out of pocket. Specifically, the RAND experiment found no evidence that the income effect associated with compensation would lead to higher health spending and thus remedy the problem.
Notably, HSAs have the opposite effect of income-related compensation. They provide larger tax breaks for higher-income families that can afford to save more and are in higher tax brackets; these families thus benefit more from the tax-free accu-mulation of interest on those savings. So not only do HSAs impose more risk on the lower-income families who can least afford it, but they also get the compensation for this risk backward.
6.3. reforming the Tax Treatment of health insurance
Another way to increase cost sharing and improve the cost effectiveness of health insurance involves reforming the tax treatment of health insurance. The excludability of employer contributions to health insurance would be limited or eliminated and replaced with a progressive tax credit or voucher.26
Eliminating the tax advantage of premiums over out-of-pocket payments in this way would encour-age more cost sharing, which, moreover, would be economywide, magnifying the benefits due to the systemic effects of any reform. In addition, turning the regressive deduction into a progressive credit would effectively compensate low- and moderate-income households for the cost of the additional risk they would bear under increased cost sharing.
Done the wrong way, however, changing the tax treatment could be more damaging than benefi-cial. If this reform extended the tax benefits to the purchase of health insurance in the individual mar-ket, then it would be critical to also put in place complementary reforms to prevent the employer-sponsored system from unraveling without creat-ing a sound pooling mechanism in its place. Plans such as the Bush administration’s proposal, which
26. Butler (1991) was an early proponent of this.
The Promise of Progressive CosT ConsCiousness in healTh-Care reform
www.HAMILTONPROJECT.ORg | APRIL 2007 �9
lack this safeguard risk, would result in substantial numbers of people losing their health insurance as employers drop coverage.27
6.4. encouraging greater Transparency
Finally, greater transparency about the trade-off be-tween health-care spending and spending on other goods and services could make a helpful difference in reducing the former or improving the ways in which it is spent. Everyone wants lower premiums, no out-of-pocket outlays, and unlimited access to specialists, high-technology tests, and expensive
treatments. Ultimately, however, the trade-offs be-tween these conflicting desires must be acknowl-edged. It is to the advantage of us all to understand that we pay for health care in four ways: (1) direct outlays, (2) insurance premiums, (3) lower wages, and (4) higher taxes. In the absence of such aware-ness, increased cost sharing will be misperceived as shifting costs to individual consumers while provid-ing a windfall to insurers, health providers, or other groups, rather than potentially increasing one type of consumer payment while reducing another type of consumer payment by even more.
27. See Furman (2006a) and Burman et al. (2007) for a more detailed discussion of how to transform the tax exclusion without disrupting pooling mechanisms.
The Promise of Progressive CosT ConsCiousness in healTh-Care reform
40 THE HAMILTON PROJECT | THE BROOkINgs INsTITuTION
The extent to which individual consumers bear the cost of the health care they receive clearly influences overall health-care spending. Over
the past four decades, large relative reductions in cost sharing have contributed to a steady increase in total health-care expenditure. Reversing some of that decline could help bring health costs down, freeing up resources to spend on more highly valued goods and services—perhaps including other, more beneficial kinds of health care—with little or no ad-verse impact on health outcomes. Undoing some of the reduction in cost sharing could also bring down the cost of health insurance, reducing the number of uninsured. Finally, exposure to smaller risks—but caps on bigger risks—could improve financial security, both directly by limiting large health bills and indirectly by making insurance more affordable and thus more sustainable.
Increased cost sharing for small risks while protect-ing against large risks is not, however, a panacea. Instead, it is one dimension of a difficult trade-off, the other being the financial risk of high out-of-pocket health-care expenses. For some, including families below or near the poverty line and the bulk of Medicaid beneficiaries, the trade-off is prob-ably not worth it. These families should be largely shielded from cost sharing. But, for the majority of households, adding small risks are worth the sav-ings, especially if cost sharing—or the associated compensation—can be related to income and any changes are made in a “smart” way that improves health outcomes.
Like any major public policy—especially one de-signed to reduce health-care spending—increased
cost sharing will produce winners and losers. But far from derailing such reform, this should be an impetus to reformers to be careful about the way in which cost sharing is implemented, and to make adjustments as the emerging evidence warrants. For example, we already know it is much cheaper to protect low-income individuals from the health consequences of hypertension by providing free blood pressure screenings than it is to offer free care for all. Smart cost sharing can be tailored to keep such beneficial interventions cost free, and therefore widely used, while achieving the goal of cost containment.
No health-care system is perfect. Trying to provide complete, first-to-last-dollar protection for every-one would be expensive and unrealistic. Moreover, complete first-to-last dollar protection has been ac-companied by stricter controls by insurance com-panies to control use that have not proven popular with much of the public. Increased cost sharing at least has the merit of giving individuals greater con-trol over tough choices.
Increased cost sharing can be part of a very good health-care system. It would be a critical step for-ward, freeing up funds to fix the other chronic problems that plague the system, in particular the plight of the tens of millions who are uninsured or underinsured. It could be imaginatively designed to steer health-care spending to where it is most ef-fective. In short, progressive cost sharing could be an integral part of a reformed health-care system that, while far from perfect, is better than what we have—and moving in the right direction.
7. Conclusions
The Promise of Progressive CosT ConsCiousness in healTh-Care reform
www.HAMILTONPROJECT.ORg | APRIL 2007 41
references
Aaron, Henry J., and William B. Schwartz, with Melissa Cox. 2005. Can We Say No: The Challenge of Rationing Health Care. Washington, DC: Brookings Institution Press.
Artiga, Samantha and Molly O’Malley. 2005. Increasing premiums and cost sharing in Medicaid and SCHIP: Recent state experiences. Kaiser Commission on Medicaid and the Uninsured, May. <http://www.kff.org/medicaid/loader.cfm?url=/commonspot/security/getfile.cfm&PageID=53261>.
Bureau of Economic Analysis (BEA). 2007a. National Income and Product Accounts: Personal Income and Outlays, December 2006. Washington, DC: Bureau of Economic Analysis. <http://www.bea.gov/newsreleases/national/pi/2007/pi1206.htm>.
Bureau of Economic Analysis. 2007b. National Income and Product Accounts: Growth Domestic Product, 4th quarter 2006 (preliminary). Washington, DC: Bureau of Economic Analysis. <http://www.bea.gov/newsreleases/national/gdp/2007/gdp406p.htm>.
Bureau of Labor Statistics. Various years. Consumer expenditure survey. Bureau of Labor Statistics, Washington, DC.<http://www.bls.gov/cex/>.
Bureau of Labor Statistics. 2006. Employer costs for employee compensation. Bureau of Labor Statistics, Washington, DC. <http://www.bls.gov/news.release/ecec.toc.htm>
Burman, Leonard, Jason Furman, Greg Leiserson, and Roberton C. Williams. 2007. An evaluation of the President’s health insurance proposal. Tax Notes 114 (10).
Butler, Stuart M. 1991. A tax reform strategy to deal with the uninsured. Journal of the American Medical Association 265 (19).
Cannon, Michael F. 2006. Health savings accounts: Do the critics have a point? Policy Analysis 569, Cato Institute, Washington, DC. <http://www.cato.org/pubs/pas/pa569.pdf>.
Center for Medicare and Medicaid Services (CMS). 2007. National Health Expenditure Accounts, 2005. National Health Expenditure: Historical and projections, 1965–2016. <http://www.cms.hhs.gov/NationalHealthExpendData/03_NationalHealthAccountsProjected.asp#TopOfPage>.
Chandra, Amitabh, Jonathan Gruber, and Robin McKnight. 2007. Patient cost sharing, hospitalization offsets, and the design of optimal health insurance for the elderly. Working Paper 12972, National Bureau of Economic Research, Cambridge, MA.
Cogan, John F., Glenn R. Hubbard, and Daniel P. Kessler. 2005. Healthy, Wealthy, and Wise: Five Steps to a Better Health Care System. Washington, DC: AEI Press.
Collins, Sara R. 2006. Health savings accounts: Why they won’t cure what ails U.S. health care. Invited testimony. House Committee on Ways and Means. Hearing on health savings accounts. June 28. <www.cmwf.org/usr_doc/Collins_WaysandMeans_Testimony__6-28-06.pdf>.
Cutler, David M., Allison B. Rosen, and Sandeep Vijan. 2006. The value of medical spending in the United States, 1960–2000. New England Journal of Medicine 355 (9): 920–27. <http://content.nejm.org/cgi/content/short/355/9/920?query=prevarrow>.
Eichner, Matthew Jason. 1997. Medical expenditures and major risk health insurance. Doctoral dissertation, Massachusetts Institute of Technology, Cambridge, MA.
Eichner, Matthew Jason. 1998. The demand for medical care: What people pay does matter. American Economic Review 88 (2): 117–21.
Feldstein, Martin S. 1971. A new approach to national health insurance. Public Interest 23: 93–105.
Feldstein, Martin S., and Jonathan Gruber. 1995. A major risk approach to health insurance reform. In Tax Policy and the Economy, vol. 9, ed. James Poterba. Cambridge, MA: MIT Press.
Fenwick, E., K. Claxton, and M. Sculpher. 2001. Representing uncertainty: The role of cost-effectiveness acceptability curves. Health Economics 10 (8):779–87.
Finkelstein, Amy. 2007. The aggregate effects of health insurance: Evidence from the introduction of Medicare. Quarterly Journal of Economics 122 (1): 1–37.
Finkelstein, Amy, and Robin McKnight. 2005. What did Medicare do (and was it worth it)? Working Paper 1609, National Bureau of Economic Research, Cambridge, MA (September). <http://www.nber.org/papers/w11609>.
Fisher, Elliott S. 2003. Medical care: Is more always better? New England Journal of Medicine 349 (17): 1665.
Frank, Richard and Joseph Newhouse. 2007. Mending the prescription drug benefit: Improving consumer choices and restructuring purchasing. Discussion Paper 2007-03, The Hamilton Project, Washington DC.
Fuchs, Victor R., and Ezekiel J. Emanuel. 2005. Health care vouchers: A proposal for universal coverage. New England Journal of Medicine 352 (12):1255–60. <http://content.nejm.org/cgi/content/short/352/12/1255>.
Furman, Jason. 2006a. Our unhealthy tax code. Democracy Journal. Issue #1 (Summer). <http://www.democracyjournal.org/article.php?ID=6466>.
Furman, Jason. 2006b. Two wrongs do not make a right. National Tax Journal 59: 491–508.
Gibson, Teresa B., Ronald J. Ozminkowski, and Ron Z. Goetzel. 2005. The effects of prescription drug cost sharing: A review of the evidence. American Journal of Managed Care (11): 730–40.
Goldman, Dana P., Geoffrey F. Joyce, Jose J. Escarce, Jennifer E. Pace, Matthew D. Solomon, Marianne Laouri, Pamela B. Landsman, and Steven M. Teutsch. 2004. Pharmacy benefits and the use of drugs by the chronically ill. Journal of the American Medical Association 291 (19): 2344–50.
Goodman, John C. 2006. What is consumer-directed health care? Comparing patient power with other decision mechanisms. Health Affairs Web Exclusive (October 24). <http://content.healthaffairs.org/cgi/reprint/25/6/w540>.
Government Accountability Office (GAO). 2006. Federal Employees Health Benefits Program First-Year Experience with High-Deductible Health Plans and Health Savings Accounts. GAO-06-271. Washington, DC: GAO. <www.gao.gov/new.items/d06271.pdf>.
Gruber, Jonathan. 1994. The incidence of mandated maternity benefits. American Economic Review 84: 622–41. <http://www.uh.edu/~adkugler/GruberMaternity.pdf>.
Gruber, Jonathan. 2006. The role of consumer copayments for health care: Lessons from the RAND Health Insurance Experiment and beyond. Kaiser Family Foundation. <http://www.kff.org/insurance/upload/7566.pdf>.
The Promise of Progressive CosT ConsCiousness in healTh-Care reform
42 THE HAMILTON PROJECT | THE BROOkINgs INsTITuTION
Hadley, Jack, and John Holahan. 2003. Covering the uninsured: How much would it cost? Health Affairs Web exclusive (June 4). <http://content.healthaffairs.org/cgi/content/full/hlthaff.w3.250v1/DC1>.
Hall, Robert E., and Charles I. Jones. 2007. The value of life and the rise in health spending. Quarterly Journal of Economics 122 (1): 39–72.
Henderson, James W. 2005. Health Economics and Policy with Economic Applications. 3rd edition. Mason, OH: South-Western College Publishing.
Hudman, Julie, and Molly O’Malley. 2003. Health insurance premiums and cost sharing: Findings from the research on low-income populations. Kaiser Commission on Medicaid and the Uninsured, Menlo Park, CA (April).
Institute of Medicine (IOM). 2003. Hidden Costs, Value Lost: Uninsurance in America. IOM Committee on the Consequences of Uninsurance. Washington, DC: Institute of Medicine.
Kaiser Family Foundation, the Health Research and Educational Trust and the Center for Studying Health System Change. 2006. Employer health benefits: 2006 annual survey. <http://www.kff.org/insurance/7527/upload/7527.pdf>.
Keeler, Emmett B., Jesse D. Malkin, Dana P. Goldman, and Joan L. Buchanan. 1996. Can medical savings accounts for the nonelderly reduce health care costs? Journal of the American Medical Association 275 (21): 1666-1671.
Ku, Leighton. 2003. Charging the poor more for health care: Cost sharing in Medicaid. Center on Budget and Policy Priorities, Washington, DC. <www.cbpp.org/5-7-03health.pdf>.
Ku, Leighton, and Victoria Wachino. 2005. The effect of increased cost sharing in Medicaid: A summary of research findings. Center on Budget and Policy Priorities, Washington, DC. <www.cbpp.org/5-31-05health2.pdf>.
Lambrew, Jeanne M. A wellness trust to prioritize disease prevention. Discussion Paper 2007-04, The Hamilton Project, Washington DC.
Manning, Willard G., Joseph P. Newhouse, Naihua Duan, Emmett B. Keeler, Arleen Leibowitz, and M. Susan Marquis.1987. Health insurance and the demand for medical care: Evidence from a randomized experiment. American Economic Review 77 (3): 251–77.
McGlynn, Elizabeth A. 1998. Assessing the appropriateness of care: How much is too much?. RAND Research Brief, RB-4522. RAND, Santa Monica, CA. <www.rand.org/pubs/research_briefs/RB4522>.
Medical Expenditure Panel Survey (MEPS). Various years. <http://www.meps.ahrq.gov/mepsweb/>. Agency for Healthcare Research and Quality, Rockville, MD.
Murphy, Kevin M., and Robert H. Topel. 2006. The value of health and longevity. Journal of Political Economy 114: 871–904.
National Medical Care Expenditure Survey (NMCES). 1977. National Center for Health Services Research, based out of Hyattsville, MD.
National Medical Expenditure Survey (NMES). 1987. Agency for Healthcare Research and Quality, Center for Financing, Access, and Cost Trends, U.S. Department of Health and Human Services, Rockville, MD.
Newhouse, Joseph P. 2004. Consumer-directed health plans and the RAND health insurance experiment. Health Affairs 23 (6): 107–13.
Newhouse, Joseph P., and the Insurance Experiment Group. 1993. Free for All? Lessons from the RAND Health Insurance Experiment. Cambridge, MA: Harvard University Press.
Organisation for Economic Co-operation and Development (OECD). 2006. OECD Health Data 2006: A comparative analysis of 30 countries. Internet subscription database. <http://www.oecd.org/health/healthdata>.
Rabin, Matthew and Richard H. Thaler. 2001. Anomalies: Risk aversion. Journal of Economic Perspectives 15 (1): 219–32.
Remler, Dahlia K. and Sherry A. Glied. 2006. How much more cost sharing will health savings accounts bring? Health Affairs 25 (4): 1070–78.
Rice, Thomas, and Kenneth E. Thorpe. 1993. Income-related cost sharing in health insurance. Health Affairs 12 (1): 21–39. <http://content.healthaffairs.org/cgi/reprint/12/1/21>.
Seidman, L. S. 1980. Income-related cost sharing: A strategy for the health sector. In National Health Insurance: What Now, What Later, What Never? ed. M. V. Pauly. Washington, DC: AEI Press.
Tamblyn, Robyn, Rejean Laprise, James A. Hanley, Michael Abrahamowicz, Susan Scott, Nancy Mayo, Jerry Hurley, Roland Grad, Eric Latimer, Robert Perreault, et al. 2001. Adverse events associated with prescription drug cost-sharing among poor and elderly persons. Journal of the American Medical Assocation 285: 421–29. <http://jama.highwire.org/cgi/content/abstract/285/4/421>.
Thorpe, Kenneth E. 2006. Cost sharing, caps on benefits, and the chronically ill: A policy mismatch. The New England Journal of Medicine 354 (22): 2385–86.
U.S. Census Bureau. 2006. Current population survey: Detailed data tables for 2005 (Person Income, Poverty, Health Insurance Coverage). Census Bureau, Washington, DC. <http://www.census.gov/cps/>.
U.S. Congress. 2003. Senate. Medicare Prescription Drug Improvement and Modernization Act of 2003. 108th Cong., 1st sess.
U.S. Department of the Treasury. 1977. Blueprints for Basic Tax Reform. Washington, DC: U.S. Government Printing Office.
U.S. Department of the Treasury Notice 2004-23. Provides a safe harbor for preventive care benefits. <http://www.ustreas.gov/press/releases/reports/notice200423.pdf>.
Weisbrod, Burton A. 1991. The Health Care Quadrilemma: An Essay on Technological Change, Insurance, Quality of Care, and Cost Containment. Journal of Economic Literature 29(2): 523–552.
Wennberg, John E., Elliot S. Fisher, and Jonathan S. Skinner. 2002. Geography and the debate over Medicare reform. Health Affairs Web exclusive (February 13). <http://content.healthaffairs.org/cgi/reprint/hlthaff.w2.96v1.pdf>.
The Promise of Progressive CosT ConsCiousness in healTh-Care reform
www.HAMILTONPROJECT.ORg | APRIL 2007 4�
author
JASON FURMANDirector, The Hamilton ProjectJason Furman is a Senior Fellow at the Brookings Institution and Director the Hamilton Project. Furman is also a Visiting Scholar at New York University’s Wagner Graduate School of Public Service. He has conducted research and policy work in a wide range of economic policy areas, including fiscal policy, tax policy, health economics, Social Security, and monetary policy. In 2005, CQ named him one of the five Social Security analysts who “exert more influence over the Social Security debate than any other indi-viduals outside government.”
Furman has worked in several public policy positions. He served as Special Assistant to the President for Economic Policy in the Clinton Administration where he chaired the interagency technical working group on Social Security reform and was the principal White House staff member responsible for budget and tax issues. Earlier in the Administration, Furman served as a Staff Economist at the Council of Eco-nomic Advisers and a Senior Director at the National Economic Council. Furman also served as Senior Economic Adviser to the Chief Economist of the World Bank, where he co-wrote (with Nobel Prize Laureate Joseph Stiglitz) one of the more widely cited papers on the East Asian financial crisis.
Furman has taught at Yale, Columbia, and now at NYU’s Wagner School. In addition, he was previously Senior Fellow at the Center on Budget and Policy Priorities. He has written numerous papers and articles on economic issues and testified frequently before Congress. Furman received his Ph.D. in economics from Harvard University.
acknowledgments
The author wishes to thank Henry Aaron, Gary Claxton, David Cutler, Douglas Elmendorf, Judy Feder, Eve Gerber, Robert Greenstein, Jonathan Gruber, Arnold Kling, Leighton Ku, Larry Levitt, Suzanne Nora-Johnson, Edwin Park, Meeghan Prunty-Edelstein, Robert Reischauer, Jonathan Skinner, and Lawrence Summers for helpful comments. Rebecca Kahane, Ariel Levin, and Iris Lin provided helpful research assistance.


HAMILTONTHE
PROJECT
Advancing Opportunity, Prosperity and Growth
Advisory CounCil
GEORGE A. AkERLOFkoshland Professor of Economics, University of California, Berkeley and 2001 Nobel Laureate in Economics
ROGER C. ALTmANChairman, Evercore Partners
HOwARD P. BERkOwITzmanaging Director, BlackRock Chief Executive Officer, BlackRock HPB management
ALAN S. BLINDERGordon S. Rentschler memorial Professor of Economics, Princeton University
TImOTHy C. COLLINSSenior managing Director and Chief Executive Officer, Ripplewood Holdings, LLC
ROBERT E. CUmByProfessor of Economics, School of Foreign Service, Georgetown University
PETER A. DIAmONDInstitute Professor, massachusetts Institute of Technology
JOHN DOERRPartner, kleiner Perkins Caufield & Byers
CHRISTOPHER EDLEy, JR.Dean and Professor, Boalt School of Law – University of California, Berkeley
BLAIR w. EFFRONPartner, Centerview Partners, LLC
JUDy FEDERDean and Professor, Georgetown Public Policy Institute
HAROLD FORDVice Chairman, merrill Lynch
mARk T. GALLOGLymanaging Principal, Centerbridge Partners
mICHAEL D. GRANOFFChief Executive Officer, Pomona Capital
GLENN H. HUTCHINSFounder and managing Director, Silver Lake Partners
JAmES A. JOHNSONVice Chairman, Perseus, LLC and Former Chair, Brookings Board of Trustees
NANCy kILLEFERSenior Director, mckinsey & Co.
JACOB J. LEwmanaging Director and Chief Operating Officer, Citigroup Global wealth management
ERIC mINDICHChief Executive Officer, Eton Park Capital management
SUzANNE NORA JOHNSONSenior Director and Former Vice Chairman The Goldman Sachs Group, Inc.
RICHARD PERRyChief Executive Officer, Perry Capital
STEVEN RATTNERmanaging Principal, Quadrangle Group, LLC
ROBERT REISCHAUERPresident, Urban Institute
ALICE m. RIVLINSenior Fellow, The Brookings Institution and Director of the Brookings washington Research Program
CECILIA E. ROUSEProfessor of Economics and Public Affairs, Princeton University
ROBERT E. RUBINDirector and Chairman of the Executive Committee, Citigroup Inc.
RALPH L. SCHLOSSTEINPresident, BlackRock, Inc.
GENE SPERLINGSenior Fellow for Economic Policy, Center for American Progress
THOmAS F. STEyERSenior managing Partner, Farallon Capital management
LAwRENCE H. SUmmERSCharles w. Eliot University Professor, Harvard University
LAURA D’ANDREA TySONProfessor, Haas School of Business, University of California, Berkeley
wILLIAm A. VON mUEFFLINGPresident and CIO, Cantillon Capital management, LLC
DANIEL B. zwIRNmanaging Partner, D.B. zwirn & Co.
JASON FURmANDirector

The Brookings Institution1775 Massachusetts Ave., NW, Washington, DC 20036(202) 797-6279 n www.hamiltonproject.org
The Brookings Institution
HAMILTONTHE
PROJECT
Advancing Opportunity, Prosperity and Growth