Embed Size (px)
Citation preview

HAMILTONTHE
PROJECT
Advancing Opportunity, Prosperity and Growth
The Brookings Institution
Pay-As-You-Drive Auto Insurance:A Simple Way to Reduce Driving-Related Harms and Increase Equity
D I S C U S S I O N P A P E R 2 0 0 8 - 0 9 J U LY 2 0 0 8
Jason E. Bordoff
Pascal J. Noel
The Hamilton Project seeks to advance America’s promise of
opportunity, prosperity, and growth. The Project’s economic
strategy reflects a judgment that long-term prosperity is best
achieved by making economic growth broad-based, by
enhancing individual economic security, and by embracing a
role for effective government in making needed public
investments. Our strategy—strikingly different from the
theories driving economic policy in recent years—calls for fiscal
discipline and for increased public investment in key growth-
enhancing areas. The Project will put forward innovative
policy ideas from leading economic thinkers throughout the
United States—ideas based on experience and evidence, not
ideology and doctrine—to introduce new, sometimes
controversial, policy options into the national debate with
the goal of improving our country’s economic policy.
The Project is named after Alexander Hamilton, the
nation’s first treasury secretary, who laid the foundation
for the modern American economy. Consistent with the
guiding principles of the Project, Hamilton stood for sound
fiscal policy, believed that broad-based opportunity for
advancement would drive American economic growth, and
recognized that “prudent aids and encouragements on the
part of government” are necessary to enhance and guide
market forces.
HAMILTONTHE
PROJECT
Advancing Opportunity, Prosperity and Growth

JULY 2008
HAMILTONTHE
PROJECT
Advancing Opportunity, Prosperity and Growth
NOTE: This discussion paper is a proposal from the authors. As emphasized in The Hamilton Project’s original strategy paper, the Project was designed in part to provide a forum for leading thinkers across the nation to put forward innovative and potentially important economic policy ideas that share the Project’s broad goals of promoting economic growth, broad-based partici-pation in growth, and economic security. The authors are invited to express their own ideas in discussion papers, whether or not the Project’s staff or advisory council agrees with the specific proposals. This discussion paper is offered in that spirit.
Pay-As-You-Drive Auto Insurance:A Simple Way to Reduce Driving-Related Harms
and Increase Equity
Jason E. Bordoff
Pascal J. Noel

Pay-as-you-Drive auto insurance
2 THE HAMILTON PROJECT | THE BROOkINgs INsTITUTION
Copyright © 2008 The Brookings Institution
abstract
The current lump-sum pricing of auto insurance is inefficient and inequitable. Drivers who are similar in other respects—age, gender, location, driving safety record—pay nearly the same premiums if they drive five thousand or fifty thousand miles a year. Just as an all-you-can-eat restaurant encourages more eating, all-you-can-drive insurance pricing encourages more driving. That means more accidents, congestion, carbon emissions, local pollution, and dependence on oil. This pricing system is inequitable because low-mileage drivers subsidize insurance costs for high-mileage drivers, and low-income people drive fewer miles on average.
In this discussion paper, we propose and evaluate a simple alternative: pay-as-you-drive (PAYD) auto insurance. If all motorists paid for accident insurance per mile rather than in a lump sum, they would have an extra incentive to drive less. We estimate driving would decline by 8 percent nationwide, netting society the equivalent of about $50 billion to $60 billion a year by reducing driving-related harms. This driving reduction would reduce carbon dioxide emissions by 2 percent and oil consumption by about 4 percent. To put it in perspective, it would take a $1-per-gallon increase in the gasoline tax to achieve the same reduction in driving. Unlike an increase in the gas tax, PAYD would save most drivers money regardless of where they live. We estimate almost two-thirds of households would pay less for auto insurance, with each of those households saving an average of $270 per car.
Despite the large social benefits from PAYD, there are currently several barriers to its widespread adoption, including the cost to monitor miles traveled and some state insur-ance regulations. In order to facilitate the spread of PAYD, we propose a three-part strat-egy. First, states should pass legislation permitting mileage-based insurance premiums. Second, the federal government should increase the funding available to PAYD pilot pro-grams by $15 million over five years. Finally, since the monitoring costs may exceed the expected benefit of PAYD to insurance firms but are much smaller than the social benefit, the federal government should offer a $100 tax credit for each new mileage-based policy that an insurance company writes, to be phased out once 5 million vehicles nationwide are covered by PAYD policies. In short, PAYD represents a win-win policy. What is good for drivers, in this case, is also good for society.

Pay-as-you-Drive auto insurance
www.HAMILTONPROJECT.ORg | JULY 2008 �
contents
1. Overview 5
2. The Challenge 7
�. A New Approach 12
4. A Three-Part strategy to Encourage PAYD Adoption 21
5. Impacts, Costs, and Benefits 24
6. why PAYD Is Preferable to Various Alternative Insurance Models 4�
7. Questions and Concerns 44
8. Conclusion 48
Appendix 49
References 52

Pay-as-you-Drive auto insurance
4 THE HAMILTON PROJECT | THE BROOkINgs INsTITUTION

Pay-as-you-Drive auto insurance
www.HAMILTONPROJECT.ORg | JULY 2008 5
If you are like most Americans, you probably eat too much when you dine at an all-you-can-eat buffet. Now imagine that Americans paid for
gasoline on an “all-you-can-drive” basis—paying a set fee each year for as much as they use. People would invariably drive more since there would be little cost to doing so. The idea may seem absurd, but that is how auto insurance is priced today. Driv-ers who are similar in all respects—age, gender, driving record—pay roughly the same premiums whether they drive five thousand or fifty thousand miles a year, even though the likelihood of being in-volved in a collision increases with each mile driven. (Some firms do offer a modest discount for driving below a certain number of miles, but even that is based on a self-reported estimate.) Moreover, just as people consume more food when they do not bear the cost of extra food, so too do they drive more when they do not bear the cost of insurance for the additional miles driven. The increased driving that results imposes significant costs on society: more traffic accidents, increased congestion, decreased air quality, growing greenhouse gas (GHG) emis-sions, and deepening dependence on oil. The cur-rent system is also inequitable, because low-mileage drivers subsidize the accident costs of high-mileage drivers, and low-income people drive fewer miles on average.
A better approach is simple and obvious: pay-as-you-drive (PAYD) auto insurance. With PAYD, in-surance premiums would be priced per mile driven. Pricing insurance per mile is more equitable be-cause low-mileage drivers would no longer sub-sidize high-mileage drivers. With insurance costs that vary with miles driven, people would be able to save money by reducing their driving, and this incentive would lead to decreased driving-related externalities like carbon emissions and congestion. PAYD is a simple and pragmatic reform. Moreover, it is more politically feasible than alternatives like a gas tax because PAYD does not increase the cost of
driving in the aggregate. It saves money for those who drive less than average, shifting the cost to those who drive more and who thus are responsible for more accidents. Geography is already a key risk factor in pricing insurance, so those in rural areas where people drive greater distances will not be dis-proportionately impacted because their premiums will be determined relative to how many miles the average driver in their area drives.
With insurance costs that vary with miles driven, we estimate that drivers nationwide would reduce miles traveled by about 8 percent. To put that in perspective, it would take a $1-per-gallon increase in the gas tax to achieve an equivalent reduction in vehicle miles traveled (VMT). An 8 percent reduc-tion in VMT would yield net social benefits of $50 billion to $60 billion per year, largely from reduced congestion and accidents. It also would reduce carbon emissions by 2 percent and oil consump-tion by around 4 percent. In addition, PAYD can achieve these gains while actually reducing the cost of driving for most drivers. Almost two-thirds of households would enjoy reduced premiums under PAYD, and the average savings for those two-thirds of households would be $270 per car a year, equal to 28 percent of the average annual U.S. car insur-ance premium.
Despite the large social benefits from PAYD, there are currently several barriers to its widespread adoption. For one, insurance companies would in-cur costs to monitor miles traveled and develop new pricing models whereas most of the benefits would accrue to other insurance companies and society as a whole. In addition, insurance regulations in many states prohibit or pose significant barriers to pricing insurance by the mile.
In order to overcome these barriers and facilitate the spread of PAYD, we propose a three-part strategy. First, states should pass legislation permitting mile-
1. overview

Pay-as-you-Drive auto insurance
6 THE HAMILTON PROJECT | THE BROOkINgs INsTITUTION
age-based insurance premiums. Second, the federal government should increase the funding available to PAYD pilot programs to $15 million over five years. Finally, the federal government should offer a $100 tax credit for each new mileage-based policy that an insurance company writes, to be phased out once 5 million vehicles nationwide are covered by PAYD policies.

Pay-as-you-Drive auto insurance
www.HAMILTONPROJECT.ORg | JULY 2008 7
Ever since Henry Ford made cars affordable to the masses, Americans have had a love affair with their automobiles. We run our cars almost
3 trillion miles a year, using 140 billion gallons of gaso-line in the process. Currently, car owners pay roughly the same in automobile insurance regardless of how many miles they drive. To be sure, some companies offer a discount if a driver drives below a certain num-ber of miles. For example, Liberty Mutual and State Farm offer a discount of about 15 percent if a driver drives less than 7,500 miles annually, but even that discount is based on a self-reported estimate, which limits the amount of discount offered.1 There is no reliable method to verify the number of miles driven or adjust premiums accordingly. Progressive, one of the nation’s largest auto insurers, explains as follows: “A principal problem with . . . conventional insur-ance determination systems is that much of the data gathered from the applicant is not verifiable, and even existing public records contain only minimal infor-mation, much of which has little relevance towards an assessment of the likelihood of a claim subsequently occurring.”2
With this pricing scheme, there is almost no mar-ginal insurance cost to driving another mile, yet the likelihood that a driver will be involved in a collision necessarily increases with mileage driven.3 For exam-ple, as seen in Figure 1, a vehicle that travels twenty thousand miles is roughly twice as likely to have an accident as one that travels less than five thousand miles. As Nobel Prize–winning economist William Vickrey puts it, “The manner in which [auto insur-ance] premiums are computed and paid fails mis-
erably to bring home to the automobile user the costs he imposes in a manner that will appropriately influence his decisions” (Vickrey 1968).
Notably, the relationship between VMT and acci-dents is not proportional. In aggregate, motorists that drive more tend to have fewer accidents per mile. One who drives thirty thousand miles a year will be involved in fewer than three collisions per million miles driven, whereas one who drives fewer than eight thousand miles a year will be involved on average in more than seven collisions per million miles driven (Figure 2).
Some reasons the relationship is not proportional include the following (Litman 2005):
• Higher-mileage drivers tend to be more skilled than lower-mileage drivers.
• Newer (thus, mechanically safer) vehicles tend to be driven more.
• Urban drivers tend to have higher crash rates and lower annual mileage.
• High-mileage drivers tend to do a greater share of driving on safer, grade-separated highways.
While a comparison across different vehicles does not yield a proportional relationship, it is impor-tant to bear in mind that the risk of any individual vehicle being involved in an accident necessarily declines roughly proportionally with a reduction in VMT. Thus, while a high-mileage motorist may be only twice as likely to have an accident as a low-mileage motorist who drives one-fourth as much,
2. the challenge
1. Liberty Mutual offers a discount in forty-five states plus the District of Columbia of between 5 and 18 percent to drivers who drive less than 7,500 miles per year. Most of these states offer a 13 percent discount. State Farm considers those who drive less than 7,500 miles a year to be low-annual-mileage drivers, and they receive a 15 percent discount on average. Geico also offers a discount to those who drive less than 7,500; the average amount of the discount was unavailable to us, however.
2. U.S. Patent No. 6,868,386 (filed May 15, 2000).3. Of course, insurance premiums are not completely outside a driver’s control: they do in some sense respond to mileage. Someone consid-
ering whether to drive another mile knows there is a chance she may get into an accident or be cited for a moving violation and thereby cause her insurance rates to jump in subsequent years. But given that the average driver has an accident every twenty years or two hundred thousand miles or so, this incentive does little on the margin (Insurance Information Institute n.d.).

Pay-as-you-Drive auto insurance
8 THE HAMILTON PROJECT | THE BROOkINgs INsTITUTION
if the high-mileage driver reduces her VMT by 10 percent she will also reduce her risk of getting into an accident by about 10 percent. That relationship is likely to be proportional because the individual driver’s attributes do not change if she drives less. Reliable data on individual VMT variations and ac-cidents to confirm this proportional relationship for individual drivers are lacking because insurance companies generally do not make accident data publicly available. Unlike snapshot comparisons of vehicles across the distribution of VMT (such as in Figure 1), however, a better way to answer this question is to look at accident decline overall when there is an aggregate drop in VMT for all vehicles due to exogenous factors. For example, a recession in 1981–82 caused a 10 percent reduction in VMT and a 12 percent reduction in insurance claims in British Columbia (Litman 2005), which is a more-than-proportional decline.
While insurance companies do not price auto in-surance based on miles driven, they do use other
risk information as proxies. Their current pricing structure is thus already picking up some of the mileage differences between drivers. Companies may indirectly capture mileage risk, for example, by charging drivers who say they live far from work and who have poor accident histories a higher premium than they charge those with the opposite character-istics. This does not mean actual mileage should not be taken into account, however. Pricing per mile would still be a far more accurate way to price based on risk than using such proxies, particularly given that accidents necessarily and evidently (Figure 1) increase with mileage. A motorist’s driving record also is not an adequate proxy since the likelihood of having an accident is so low; neither a low-mile-age driver nor a high-mileage driver may thus have been in an accident, even though the likelihood of the high-mileage driver being in one is still several times higher. Indeed, in interviews we conducted with insurance companies and their actuaries, there was consistent agreement that charging for mile-age would be preferable to the current system. One
Figure 1
yearly accident claims by annual Mileage
source: Progressive 2005.
0
0.01
0.02
0.03
0.04
0.05
0.06
0.07
0.08
0.09
0.10
0 5,000 10,000 15,000 20,000 25,000 30,000
Acc
iden
t C
laim
s p
er Y
ear
Annual Mileage Class
Bodily Injury ClaimsProperty Damage ClaimsCollision Claims

Pay-as-you-Drive auto insurance
www.HAMILTONPROJECT.ORg | JULY 2008 9
company executive called charging per mile the “last barrier of insurance pricing.”
Fundamentally, the pricing structure of auto insur-ance has not changed since Vickrey’s observations forty years ago. In 1968, he wrote the following:
The basic difficulty is that the insurance premium ap-pears to the individual automobile owner almost entire-ly as part of the fixed cost of owning a car. The amount of the premium, given the coverage he selects, is fixed by factors largely independent of most of the decisions that are at all marginal as to how much he will use his car. The only attempts that are made to vary premiums in relation to use are typically to classify the risk accord-ing to whether and how far the car is driven to work or whether it is used for business; the classifications are very broad and to a considerable extent are based on the unverified statements of the applicant. Moreover, the variations in premiums based on such classifications
remain relatively small. The result is that with the pos-sible exceptions of the decisions as to whether to drive to work or use public transportation, and of the decision as to whether younger members of the family are al-lowed to drive at all, the added exposure to risk involved in added usage is not brought to bear on the decision. (Vickrey 1968, 470–71)
There are two problems with the current lump-sum pricing structure. First, low-mileage drivers end up subsidizing high-mileage drivers in each risk class, even though the former are responsible for fewer accidents. This problem is particularly disturbing given that low-income people tend to drive less on average (Figure 3). In 2001, households with in-comes above $100,000 drove each of their vehicles on average 25 percent more miles than households with incomes below $25,000. Recent survey data from the Greater Vancouver Regional District show an even stronger correlation (Litman 2007b).
Figure 2
accident claims per Million Miles by annual Mileage
source: Authors’ calculation based on Progressive 2005.
0
1
2
3
4
5
6
7
8
9
Acc
iden
t C
laim
s p
er O
ne
Mill
ion
Mile
s
0 5,000 10,000 15,000 20,000 25,000 30,000Annual Mileage Class
Bodily Injury ClaimsProperty Damage ClaimsCollision Claims

Pay-as-you-Drive auto insurance
10 THE HAMILTON PROJECT | THE BROOkINgs INsTITUTION
Second, lump-sum pricing leads to an inefficiently high level of driving and thus makes drivers worse off. Since insurance is priced in a lump-sum fashion, a driver does not take the marginal cost of insur-ance into consideration when deciding how much to drive (the way she might consider the costs of fuel and maintenance, for example). The result is that some of the miles she drives are not worth the marginal cost to her if she were actually to pay for insurance per mile driven. If she could pay for in-surance by the mile and save that cost by reduc-ing miles driven, she would do so and be better off by paying lower total premiums. PAYD makes this possible. A driver only needs accident-related car insurance when she is driving. But unlike for almost every other good available to consumers, under the current system a driver cannot pay less for car in-surance by consuming less of it.
The result of this inefficient pricing structure, as
Vickrey (1968) explained, is an increased number of VMT, and all these extra miles also impose signifi-cant costs on society. Burning fossil fuels in vehicles releases carbon dioxide (CO2), a heat-trapping gas that can remain in the atmosphere for more than a hundred years. CO2 is the principal GHG respon-sible for global warming, a human-caused process that is now widely accepted as real. This warming may cause massive climatic shifts, characterized by changes in precipitation and runoff, increased flooding, drought, and more-frequent and severe storms. Continuing to burn such high quantities of fossil fuels could trigger climate change costing the economy up to 1.5 percent of GDP (Cazorla and Toman 2000).
Increased gasoline use also deepens our nation’s reliance on oil, increasingly understood as a threat to economic and national security. Oil price shocks have played a role in nine of the ten U.S. reces-
Figure 3
average Mileage per vehicle, by Household income Level
source: Authors’ calculation based on data from the 2001 National Household Transportation survey.
0
$2,50
0
$7,50
0
$12.5
00
$17,5
00
$22,5
00
$27,5
00
$32,5
00
$37,5
00
$42,5
00
$47,5
00
$52,5
00
$57,5
00
$62,5
00
$67,5
00
$72,5
00
$77,5
00
$90,0
00
> $100
,000
0
8,000
9,000
10,000
11,000
12,000
13,000
14,000
15,000
Ave
rag
e A
nn
ual
Mile
age
Annual Household Income

Pay-as-you-Drive auto insurance
www.HAMILTONPROJECT.ORg | JULY 2008 11
sions since World War II. Oil wealth strengthens oil-exporting authoritarian governments and limits America’s foreign policy options for meeting their growing threats. Reducing oil consumption is the key factor in improving America’s energy security.
Every additional mile driven also adds gases to the atmosphere that contaminate the air we breathe. Ni-trogen oxides (NOX) and hydrocarbons (HC) have serious and negative impacts on human health.
Even greater than these environmental and secu-rity concerns is the estimated impact of increased driving on traffic congestion. Urban traffic conges-tion in 2005 caused the average peak-period trav-eler to spend thirty-eight extra hours in travel time (Schrank and Lomax 2007). The number of urban areas with more than forty hours of annual delay per peak traveler has grown from only one in 1982 to twenty-eight in 2005. This wasted time costs the country $78 billion annually, which is almost exact-ly the size of the entire U.S. federal transportation budget.
Finally, more driving increases the number of auto accidents. Even when a driver is not at fault, merely being on the road increases the likelihood of an ac-
cident because there is one more car with which another car could potentially collide. Thus, even adding the safest of drivers to the road increases total accident costs because there are more cars on the road. Economist Aaron Edlin (2003) finds that the elasticity of accidents with respect to VMT may be around 1.7, meaning that a 10 percent reduction in VMT would lead to a 17 percent reduction in to-tal crashes. The costs of accidents—in terms of lives lost, injuries to victims, lost productivity, property damages, medical costs, travel delays, and legal ex-penses—are staggering. Ian Parry, Margaret Walls, and Winston Harrington (2007) estimate that acci-dents cost the United States $433 billion in 2000.
To be clear, PAYD would not address these driv-ing-related externalities in full by forcing drivers to internalize the cost of the social harm caused by their activities. Doing so would require a set of op-timized user fees specifically calibrated to capture each externality. By reforming the way auto insur-ance is priced, however, PAYD also begins to make progress on all these issues by creating an incentive to reduce driving. PAYD is a politically viable way to make progress on all these issues because it actu-ally reduces the cost of driving for most people.

Pay-as-you-Drive auto insurance
12 THE HAMILTON PROJECT | THE BROOkINgs INsTITUTION
A relatively simple and pragmatic way to ad-dress the problems with the way auto in-surance is priced also would help reduce
all these driving-related externalities. Under PAYD auto insurance, the price of auto insurance would be tied to the number of miles driven. Other rat-ing factors such as location, age, vehicle type, and driving record still would be incorporated into this price, so higher-risk drivers would pay more per mile than lower-risk drivers. PAYD ensures that low-mileage drivers stop subsidizing the accident costs of high-mileage drivers. By allowing people to save money by driving less, PAYD creates incentives for reducing the various costs that driving imposes on society.
A small portion of current premiums cover risks not directly related to mileage, so they would remain unchanged. This includes, most prominently, com-
3. a new approach
prehensive coverage, which covers damage caused by fire, theft, vandalism, and weather. The majority of car insurance premiums cover risks that vary di-rectly with mileage; these premiums thus would be switched to a per-mile rate. These include liability coverage (for the costs of bodily injury and prop-erty damage imposed on others when the insured causes an accident); collision or accident coverage (for medical payments, personal injury costs, and collision damages incurred by the insured and her vehicle when the insured causes an accident); and uninsured motorist coverage (for damages to the insured and her vehicle caused by an uninsured motorist). According to personal email communi-cation with Progressive County Mutual Insurance Company, liability, accident, and uninsured cover-age make up 89 percent of the typical premium it collects (Figure 4).
Figure 4
Distribution of Progressive auto insurance Premium, by type of coverage
source: Personal e-mail communication with Progressive, 5/14/08.
Bodily Injury 24%
Property Damage22%
Collision28%
Personal InjuryProtection
8%
Medical Payments 2%
Uninsured/Underinsured Motorist 5%
Comprehensive9%
Other 2%

Pay-as-you-Drive auto insurance
www.HAMILTONPROJECT.ORg | JULY 2008 1�
a. Designing PayD insurance
There are several specific design features firms will need to choose. Under the simplest model, motor-ists would prepay for the miles they expect to drive in a year and then pay more or receive a refund at the end of the year depending on actual miles driven. In order to avoid people purposely underestimating to defer payments, firms might automatically set each year’s estimate at the total number of miles driven in the prior year. Drivers would be free to change that estimate if they anticipated driving more or less than the prior year, but might pay a penalty if the actual miles driven exceeded the estimate by more than a certain amount (say, 20 percent). Alternative-ly, insurance companies could bill motorists based on their monthly or bimonthly vehicle mileage, just as utilities currently do. This would require more-frequent mileage data collection, however, probably via a telematic device in the vehicle. Though more costly, this approach may result in larger social ben-efits by effecting a larger reduction in VMT, as dis-cussed further below.
PAYD requires verified mileage data. One way to do that is through odometer audits. Licensed pro-fessionals such as safety and emissions inspectors could verify mileage every year, or even more fre-quently. They would have to ensure the odometer was not tampered with and then transmit the data to insurance companies. Drivers would bear the cost of taking their cars in to be checked, though in some states and many urban areas annual inspec-tions are already required at which an odometer reading could be done (in some cases this is being done now). Currently, nine states have mandatory annual inspections for all vehicles, four states have mandatory inspections for all vehicles every two years, and various localities in nine other states have mandatory inspections every one or two years. One company, CARFAX, claims to aggregate all these
various publicly available odometer readings into its vehicle history reports, available to insurance companies on any car and light truck model 1981 or later. Individual consumers can have unlimited access to vehicle history reports for one month for $29.99, but commercial rates vary by volume and purpose.
Another option is to use electronic devices that au-tomatically record and transmit mileage data. Most new cars already electronically record mileage in the engine computer, and new technologies such as global positioning system (GPS) transponders provide a means of wireless transmission. Table 1 describes several technology options available to insurers. Davis, an American company based in California, offers its CarChipPro technology to individual consumers for $119. The CarChipPro is a small data-collection device that plugs in to a car’s on-board diagnostics (OBD) port, reading and storing data from the car’s on-board comput-ers. (OBD ports have been mandatory for new cars in all states since 1996.) Consumers connect the small device to their home computers via a USB cable to download driving data. A wireless version is available, tailored to fleet managers, which allows for wireless transmission of the data when a vehi-cle is parked near a receiving transponder. Other versions of similar technology are available from companies such as IMS and Sky-meter. Both these firms market specifically to insurance companies and offer wireless data transmission. The device from Sky-meter is leased to the consumer (or com-pany) for a $5 monthly fee plus a portion of the insurance premium. Conversations with auto in-surance executives and manufacturers reveal prices have been declining and are expected to continue declining significantly as the technology advances. Most of these devices do not record or transmit in-formation about a driver’s location, and even those devices that have such a capacity may be tailored to eliminate any privacy concerns.

Pay-as-you-Drive auto insurance
14 THE HAMILTON PROJECT | THE BROOkINgs INsTITUTION
tabLe 1
cost of commercially available telematic Mileage-recording Devices
Manufacturer Data recorded: Method of transmission installation cost Monthly/yearly fee Distance, speed, time
Davis
CarChipPro Distance, speed, time UsB cable/port $119 None (could include other (customer loaded) features for higher price )
CarChipFleetPro Distance, speed, time UsB cable/port $169 (plus a $�95 None (could include (customer loaded) charge for software, other features) one per fleet) Can also be used wirelessly with a $200 base unit
IMs iPAID Distance, speed, time UsB cable (manual $60–$80 for Varies upload on PC) or mileage Bluetooth (automatic measurement only upload) or cellular (gPRs)
sky-meter Distance, speed, time gPRs/CDMA $50 - $250 $5 per month plus (incl. other features) (other protocols activation fee 5%–8% of monthly available at extra premium charge) (depending on volume)
Onstar Distance, speed, Automatic through gPs First year free for $18.95 per month time, (incl. other new gM cars after one year features) (only available for gM)
source: Company web sites and personal communications with authors.

Pay-as-you-Drive auto insurance
www.HAMILTONPROJECT.ORg | JULY 2008 15
Other models of monitoring mileage exist. For example, one is being developed by start-up insur-ance firm MileMeter. Under its model, individuals would go online and purchase a specific number of miles of coverage. A driver would not be covered in the event of an accident if the car’s odometer in-dicated that the driver had exceeded the amount of insurance purchased. This approach negates the need for odometer audits, though it may raise con-cerns about uninsured cars. MileMeter would still collect odometer readings from vehicle emissions, maintenance, and registration databases (similar to the information available from CARFAX).
Some established companies are already using monitoring technology to offer mileage discounts on insurance premiums. In June 2008, Progressive announced a national rollout of its MyRate insur-ance program. Under MyRate, cars driven less of-ten, in less-risky ways, and at less-risky times of day can receive a lower premium (Progressive 2008). According to Progressive, the impact on premiums could be anywhere from a 60 percent discount to a 9 percent surcharge. The MyRate program evolved out of Progressive’s TripSense program in Michi-gan, Minnesota, and Oregon. Under that program, participating drivers receive a TripSensor based on the Davis CarChip technology. The TripSensor re-cords how much, how fast, and when the vehicle is driven—information that is used to calculate dis-counts of 5–20 percent when the customer renews the policy. (This program is thus not true per-mile pricing.) The collected data and the potential dis-count are communicated to the customer before they are shared with Progressive. The customer has the option of sharing the information with Progres-sive and earning the discount or withholding the data and paying the normal premium.
General Motors Acceptance Corporation (GMAC) Insurance has offered mileage-based discounts to OnStar subscribers located in certain states; driv-ers in thirty-four states are currently eligible. The system reports the odometer reading at the begin-ning and end of the policy term, and the customer receives discounts on a sliding scale for driving less
than fifteen thousand miles: 1–2,500 miles (50 per-cent discount), 2,501–5,000 (33 percent), 5,001–7,500 (28 percent), 7,501–10,000 (20 percent), 10,001–12,500 (11 percent), and 12,501–15,000 (5 percent). GMAC currently has about twenty-five thousand OnStar subscribers, some of whom are signed up for the mileage discount. OnStar is free for the first year for new GM car owners, but costs $18.95 per month subsequently.
While the precise manner in which PAYD insur-ance is implemented may vary, how the pricing is designed can have a significant impact on the extent to which PAYD reduces VMT. Insights from behav-ioral economics about loss aversion, for example, teach us that consumers would prefer to avoid a surcharge than to receive a discount (Kahneman, Knetsch, and Thaler 1986). PAYD would thus be more likely to result in a greater reduction in VMT if drivers were charged an insurance price for each mile driven than if they were to receive discounts for driving fewer miles than expected.
In addition, the frequency with which the cost of in-surance is communicated to drivers and the clarity and simplicity with which that cost is communicated will affect how much drivers change their behavior. To be clear, the goal of PAYD pricing should not be to maximize driving reductions at all cost, but rather to send accurate and consistent price signals to con-sumers, enabling them to make individually opti-mal decisions. Economist Amy Finkelstein recently found that when tolls switch from cash payments to electronic toll collection, toll prices increase more sharply. She also finds that the short-run elasticity of driving with respect to the actual toll declines after electronic tolls are introduced. After rejecting various other possible explanations, she concludes the most likely reason is that it is easier for toll col-lectors to raise prices when drivers are less aware of the price they are paying (Finkelstein 2007). This phenomenon also can be seen in recent anecdotal evidence that hybrid car drivers alter their driving behavior to maximize fuel economy in response to real-time information about how many miles they are getting per gallon, as Michael S. Rosenwald

Pay-as-you-Drive auto insurance
16 THE HAMILTON PROJECT | THE BROOkINgs INsTITUTION
points out in the Washington Post (“For Hybrid Drivers, Every Trip Is a Race for Fuel Efficiency,” May 26, 2008). The lesson for PAYD would be that a driver is more likely to reduce VMT if she re-ceives frequent price signals about the cost of her insurance than if she receives an insurance bill at the end of the year based on annual VMT, such as after an annual odometer reading.
b. Why PayD Has not spread More Widely on its own
If PAYD is more efficient and equitable, why is it not already offered? There are three market and regulatory failures that prevent PAYD from emerg-ing on its own: monitoring costs, state insurance regulations, and patents.
i. Monitoring costs. First, the monitoring costs borne by insurers may exceed the private benefits to firms, even though the private benefits are far less than the potential social benefits (see Edlin 2003; Rea 1992; William-son, Olson, and Ralston 1967). In order to price in-surance per mile, insurance firms or their customers would need to incur the cost of verifying mileage, either through odometer checks (fitted with tam-per proof technology) or through a device fitted in each vehicle. Though in theory odometer readings could be inexpensive procedures if done on a wide-spread basis, there currently is no infrastructure of certified providers to provide reliable odometer readings that insurance firms can use. Without the ability to rely on the accuracy of a service station’s odometer reading, firms would have to employ their own teams of odometer readers, which might be cost prohibitive. They also would have to compen-sate customers somehow for their time if they were not able to combine the odometer reading with normal inspections or maintenance work. Install-ing GPS or similar technology to monitor VMT might be expensive. As seen in Table 1, it can cost well over $100 just to install a device that records VMT, and can cost several times that amount, in-cluding monthly service fees, for a device that also wirelessly transmits the information to the compa-
ny. These monitoring costs are borne by firms and their customers, but the benefits spill over to other insurance companies, other drivers, and society as a whole. If an insurance company is able to reduce the driving of its insureds, substantial savings will accrue to other insurance companies too, insofar as their insureds are less likely to be involved in ac-cidents if fewer vehicles are on the road. Reduced driving benefits all other drivers also, via reduced congestion. Finally, savings will accrue to society as a whole from reductions in local and global pollu-tion and oil dependence.
Despite the substantial social savings from switch-ing to per-mile auto insurance, there may be very little direct savings that actually accrue to insurance companies. We calculate in §4 that if insurance com-panies captured all the benefit from reduced acci-dents of their insureds they would save $34 per year per vehicle that switched from traditional lump-sum premiums to PAYD. We also calculate that the aver-age low-mileage driver might save as much as $318 per vehicle as PAYD eliminates the implicit subsidy to high-mileage drivers. Those savings would be offset in aggregate by higher premiums charged to high-mileage drivers, but in the short term it might be possible for first-mover auto insurers to capture some of these gains by signing up low-mileage driv-ers currently with other insurers. In the long run, any private gain would likely be much lower since expected benefits would be competed away once other firms also adopt PAYD. Moreover, it may be difficult for insurance firms to capture fully these gains from any particular customer, given the high churn rate for customers in the auto industry. To capture that return from new or existing customers the firm must develop a new billing and administra-tive infrastructure, retool their advertising to edu-cate consumers, and develop new actuarial models to determine how to price per-mile premiums, all of which would add to the cost.
The private incentive pales in comparison to the social benefit from switching a vehicle to PAYD, which we calculate in §4 to be $257 per vehicle. In other words, there are large positive externali-

Pay-as-you-Drive auto insurance
www.HAMILTONPROJECT.ORg | JULY 2008 17
ties arising from PAYD that cannot be captured by private firms offering it. The significant discrepancy between the social and private benefits suggests that even if the benefits to the firm and its insureds do not justify an insurance company’s incurring the monitoring and plan development costs, the full social benefits would justify the costs.
ii. state insurance regulations. Second, state insurance regulations can pose a barri-er to PAYD. State regulators must explicitly approve the type of insurance policies that insurers can offer; in several states, current regulations appear to pro-hibit pricing insurance per mile. Current efforts to permit PAYD pricing in California are indicative of the types of barriers that PAYD faces due to various state laws and regulations. Proposition 103 requires that automobile insurance premiums be based pri-marily on three factors in descending order of im-portance: (1) driving safety record, (2) annual miles driven, and (3) years of driving experience. Despite this law’s intention to ensure that mileage be taken into strong consideration, the regulations that imple-ment it may actually stand in the way of offering true PAYD pricing. Insurance firms in California typically offer only very wide mileage bands because they must accept self-reported estimates of miles driven. As a result, low-mileage drivers are paying too much for auto insurance and are subsidizing high-mileage driv-ers. The regulations implementing Proposition 103, however, prohibit an insurance firm from charging a PAYD customer whose VMT was verified a lower premium than a customer of identical risk profile whose VMT was not. These implementing regula-tions thus preclude offering an insurance product to low-mileage drivers that more accurately reflects their accident risk because other low-mile drivers in traditional insurance plans would be paying a differ-ent (and higher) rate. Currently, the California De-partment of Insurance has undertaken a rulemaking process, and a bill is pending in the state Senate (AB 2800), both of which are aimed at overcoming such obstacles to offering PAYD in California.
A 2002 survey by the Georgia Institute of Technol-ogy of forty-three state insurance commissioners found that 37 percent indicated state regulations would not permit PAYD insurance in their state (Guensler, Amekudzi, Williams, Mergelsberg, and Ogle 2002).4 Even in states in which regulation does not explicitly prohibit PAYD, certain legisla-tive reforms might be needed because of potential conflicts with existing law. Michigan, for example, requires an upfront statement of the premium charge, and the policy must have an expiration date and must be renewable. This might be difficult un-der PAYD since the total premium for any period is unknown at the start of the period (although a program could theoretically be designed to charge a fixed up-front cost and then offer per-mile dis-counts based on miles actually traveled). In Georgia, companies need to ensure that their policy requires a down payment for at least sixty days of coverage and that the minimum insurance term was not less than six months, but such temporal requirements might be inconsistent with certain per-mile pricing models. Until the law was modified in 2001, the Texas Transportation Code required proof of insur-ance (for vehicle title changes) to be a one-month policy, which a PAYD policy would not satisfy; presumably several other states may have a similar regulatory obstacle to PAYD.
Even in states that permit PAYD in theory, several insurance commissioners indicated that regulations in their state would prohibit certain commonly proposed methods of pricing PAYD. Roughly half of the states responding would not permit a PAYD pricing model whereby premiums would be based on the driver’s current annual fees and reported mileage (Guensler et al. 2002). The survey respon-dent in Tennessee, for example, indicated the state would not accept such a pricing method because the structure constituted a retrospective rating scheme, which its regulations do not allow. In West Virginia, the regulations require that customers be insured at all times, and PAYD might mean that drivers would
4. This survey is several years old and was imprecise in its design, thus its findings should be viewed with considerable caution. Nonetheless, it is instructive of the types of regulatory barriers PAYD faces.

Pay-as-you-Drive auto insurance
18 THE HAMILTON PROJECT | THE BROOkINgs INsTITUTION
lose coverage if they exceeded the prepaid number of miles (although an insurer could structure a PAYD program to ensure that participating drivers are never uninsured).
Furthermore, auto insurance agencies must have their rate plans approved by state regulators each year. Whereas regulators typically approve as a rou-tine matter current rate plans submitted for reap-proval, they closely scrutinize changes to rate plans. In interviews, insurance firms argue that they are thus reluctant to attract extra scrutiny from regu-lators by offering innovative products. Insurance regulators whose primary charge is to ensure that insurance consumers are not harmed may be reluc-tant to approve a rate plan as revolutionary as PAYD, given such uncertainty about what the ultimate rate plans will look like. Regulators’ reticence is likely exacerbated by the limited familiarity with PAYD and widespread misunderstandings regarding its ef-fects. For example, the New York respondent to the aforementioned survey stated that cents-per-mile programs would not be equitable because upstate drivers tend to drive more than downstate drivers do (Guensler et al. 2002). (In practice, premiums are risk-adjusted, so upstate drivers would be charged more only if they drive more than the average simi-larly situated driver.)
Finally, the heavily regulated insurance field may pose barriers for new entrants, a concern confirmed by conversations with start-up firms in the industry. Established firms may be content with the status quo, notwithstanding its inequities and failings. Inertia, high start-up costs, and uncertainty may discourage them from adopting a radically new business model like PAYD. In well-functioning competitive markets, new entrants might promote such innovation at a more rapid pace. To the extent
such competitive forces are blunted in the insur-ance sector, however, innovations like PAYD may be discouraged.
iii. Patents. Finally, for the past decade Progressive has aggres-sively sought patents around innovations in tele-matic auto insurance (Tom Bakos Consulting and Markets, Patents and Alliances 2004).5 Indeed, even the title “Pay As You Drive” is registered to Progres-sive, which precluded Unigard from using that title for its per-mile insurance product launched as part of a federally funded pilot program in King County, Washington. In interviews with the authors, several auto insurance executives have identified these pat-ents as a barrier to adoption of PAYD insurance.
Progressive holds four patents related to PAYD, each of which is quite broad in scope. Three of these patents involve a “monitoring system for determin-ing and communicating a cost of insurance.”6 A few of the most relevant claims include the following:
• “A method of determining a cost of automobile insurance for a selected period based upon moni-toring, recording and communicating data rep-resentative of operator and vehicle driving char-acteristics during said period, whereby the cost is adjustable by relating the driving characteristics to predetermined safety standards.”7
• “A process for acquiring and recording vehicle insurance related data during a time period via an on-board computer and recording system for adjusting an insurance cost during the time pe-riod.”8
• “A method of insuring a vehicle operator for a se-
5. MileMeter also holds patents related to PAYD. We focus on Progressive’s, however, since they are broadest in scope.6. U.S. Patent No. 6,868,386 (filed May 15, 2000) is a continuation-in-part of U.S. Patent No. 6,064,970 (filed August 17, 1998), which is a
continuation of U.S. Patent No. 5,797,134 (filed January 29, 1996). A continuation is a copy of an original patent application except the inventor adds new “claims,” and a continuation-in-part is similar except that the inventor adds a description of the improvements to an invention and submits claims covering the improvements.
7. U.S. Patent No. 5,797,134 (filed January 29, 1996) (claim 1).8. U.S. Patent No. 5,797,134 (filed January 29, 1996) (claim 12).

Pay-as-you-Drive auto insurance
www.HAMILTONPROJECT.ORg | JULY 2008 19
lected period based upon operator driving char-acteristics during the period.”9
• “A system for Internet on-line communicating between an insurer and insured, of detected oper-ating characteristics of a unit of risk for a selected period, as decided by the insurer in consideration of the detected operating characteristics.”10
Additionally, Progressive holds a fourth patent, U.S. Patent 7,124,088 (filed July 30, 1999), which claims “[a]n on-line insurance policy service system” that comprises various specific design elements (claim 1).
Any insurance firm interested in offering per-mile insurance pricing understandably might be con-cerned that doing so would open it up to a possible patent infringement suit. Even if the firm believed it had developed a method of per-mile insurance pric-ing that did not violate the patent or that the patent was invalid, it might be deterred by the mere threat of a lawsuit from Progressive. Defending a patent infringement suit can be enormously expensive (Jaffe and Lerner 2004). As several recent studies have lamented, the sharp increase in the number of patents granted in the past two decades (including so-called bad patents that are overbroad or should not have been granted in the first place) has cre-ated high costs for firms and individuals that need to litigate patent lawsuits or pay unwarranted licens-ing fees, thus deterring the pursuit of pursuing new ventures (Jaffe and Lerner 2004; Lichtman 2006; Merrill, Levin, and Myers 2004).
Nonetheless, Progressive’s PAYD patents may not be a serious barrier to PAYD adoption for three reasons. First, Progressive has expressed (in an in-terview with the authors) a willingness to license
PAYD, although it is unclear to whom and on what terms. Second, there might exist several ways to de-sign a PAYD system that does not infringe on Pro-gressive’s patents, an opinion expressed by several industry and patent experts. Indeed, several firms, such as GMAC, currently offer limited forms of mileage-based pricing without eliciting allegations of patent violation. Finally, there is a legitimate question about the extent to which Progressive’s patents would be upheld in a patent infringement lawsuit, particularly in light of recent legal develop-ments (Greenberg 2007). Of course, for any rival firm the legal process of challenging these patents’ validity involves some risk and considerable ex-pense, and thus acts as a significant deterrent itself, regardless of the eventual outcome.
Regarding the validity of Progressive’s patents, a challenge could be brought in theory on “obvious-ness” grounds. To qualify for a patent, an invention must not have been “obvious at the time the inven-tion was made to a person having ordinary skill in the art to which said subject matter pertains” (35 U.S.C. §103(a) (2000)). Recently, the Supreme Court clarified the meaning of “obviousness,” en-couraging lower courts to be more open to the pos-sibility that an issued patent might still in fact be invalid for obviousness.11
As a result, the Progressive patents may be vulner-able. Four decades ago, Vickrey (1968) observed that optimal auto insurance pricing should take ac-count of VMT. “There is no real conceptual diffi-culty in charging an insurance premium according to mileage,” he explained. “The problem is one of implementation” (Vickrey, 1968). There was thus a known problem with auto insurance pricing, and “[u]nder the correct analysis, any need or problem
9. U.S. Patent No. 6,064,970 (filed August 17, 1998), (claim 4).10. U.S. Patent No. 6,868,386 (filed May 15, 2000), (claim 10).11. KSR Int’l Co. v. Teleflex Inc., 127 S. Ct. 1727 (2007). The issue in that case was a patent describing the combination of an adjustable pedal
assembly with a pedal position sensor attached to the supporting shaft of the pedal assembly. Originally, adjustable pedal systems were designed to work in vehicles without computer-controlled engines. In the mid-1990s, however, the auto industry largely switched to computer-controlled engines that required electronic throttle controls. While the older systems relied on cables to link the pedal to the throttle, these new systems required the use of pedal position sensors to achieve the same interaction. KSR argued that Teleflex’s patent was invalid because the combination of an adjustable pedal assembly and a pedal position sensor was “obvious.”

Pay-as-you-Drive auto insurance
20 THE HAMILTON PROJECT | THE BROOkINgs INsTITUTION
known in the field of endeavor . . . can provide a reason for combining the elements in the manner claimed” (KSR, 127 S. Ct. at 1742). As GPS and other telematic systems became broadly available in automobiles, combining these devices with auto insurance to address the problem Vickrey identi-fied may well be considered to have been obvious. Although GPS-type technology was often used for other purposes, such as tracking a vehicle’s loca-tion, “familiar items may have obvious uses beyond their primary purposes, and in many cases a person of ordinary skill will be able to fit the teachings of multiple patents together like pieces of a puzzle” (KSR, 127 S. Ct. at 1742). As the Court explained, “[a] person of ordinary skill is also a person of or-dinary creativity, not an automaton” (KSR, 127 S. Ct. at 1742). Moreover, the literature about how to price auto insurance more accurately to reflect driver risk is replete with references to a limited number of conceivable options: require manual odometer checks, add the cost of insurance to the price of gasoline purchased at the pump, or install
devices in vehicles to track VMT. (A few additional ideas may be found here and there, such as Vickrey’s theoretical suggestion to add the cost of insurance to the price of tires.) When there is an identified problem of the kind Vickrey observed, “there are a finite number of identified, predictable solutions, [so] a person of ordinary skill has good reason to pursue the known options within his or her techni-cal grasp.” If the result is success in solving the prob-lem, “is it likely the product not of innovation but of ordinary skill and common sense. In that instance the fact that a combination was obvious to try might show that it was obvious under section 103” (KSR, 127 S. Ct. at 1742).
Like most legal issues, of course, there also are strong arguments on the other side as well. A full discus-sion of all these arguments is beyond the scope of this paper. The purpose of the above discussion is simply to indicate that a rival firm wishing to offer a PAYD product may still be able to do so despite existing patents.

Pay-as-you-Drive auto insurance
www.HAMILTONPROJECT.ORg | JULY 2008 21
It is hard to tell how significant each of the three barriers is by itself. The paucity of mileage-re-lated insurance offerings and the nonexistence of
true PAYD pricing, however, indicate the barriers together pose a real roadblock. Given the potential for significant social benefits from wide adoption of PAYD combined with the small expected private benefits for firms there is a clear rationale for ef-fective public policy solutions. Policymakers should take the following three steps in response to these barriers to encourage PAYD adoption.
First, enact regulatory and legal reforms to promote PayD. At a minimum, states, where necessary, should enact model legislation and regulatory guidance permitting PAYD. For example, legislation passed in Texas in 2001 gave insurers permission to offer cents-per-mile pricing for vehicle insurance. The bill also required insurance companies to separately track and report the claim losses and premium revenues for mileage-based and time-based premiums (Texas House Bill 45). Even in many states where PAYD is technically permissible it may be necessary for the legislature to enact legislation clarifying that PAYD is permitted in order to signal that insurance regulators will look favorably on PAYD rate submissions and reconcile potential conflicts with existing regulations that were written for lump-sum rate plans. As already discussed, in California, for example, a bill and rulemaking process is aimed at permitting insurance firms to vary per-mile premiums depending on whether the odometer readings are verified or self-reported.
While state regulatory action is needed, states may undervalue the importance of PAYD because some of the benefits, like energy security and cli-mate change, are national (indeed, global). If state regulation continues to be a barrier to firms offer-ing PAYD and states do not address the issue, the federal government should encourage states to act
4. a three-Part strategy to encourage PayD adoption
by conditioning the receipt of federal discretion-ary grants and formula allocations on the reform of state insurance regulations to permit PAYD.
second, expand funding for PayD pilot programs. There is a lack of knowledge on the part of insurance firms and state regulators about how to price and design PAYD, significant start-up costs involved with being a first mover, and barriers to potential entrants. Given the small private benefit but large social benefit from PAYD, a booster shot from the government may be needed for an insurance firm to offer it, which may then push other firms to follow suit. Such a pilot program would teach insurance firms, regulators, and the public about the feasibility and benefits of PAYD.
Currently, funding for PAYD pilot programs has come from the federal Value Pricing Pilot (VPP) program, authorized under the Safe, Accountable, Flexible, Efficient Transportation Equity Act: A Legacy for Users (SAFETEA-LU), from federal funds distributed to states by formula, and from oth-er government sources. The VPP program provides $12 million a year for pilots related to congestion pricing, innovative parking programs, PAYD, and other pricing strategies to reduce congestion. Of these funds, a minimum of $3 million a year must be used for pricing projects not involving tolls, such as PAYD. PAYD grants have ranged between $1 mil-lion to $2 million. In March 2007, King County, Washington was awarded $1.9 million in Federal Highway Administration (FHWA) discretionary funds for its PAYD pilot, which also received $1.2 million in state and local funds. Unigard, the win-ning bidder, is matching these grants, investing $3.3 million in the pilot. In 2006, Progressive was award-ed $1.3 million in federal, state, and local funding for a mileage-based (but not true PAYD) pilot in North Central Texas. This study monitored the re-sponse of three thousand customers.

Pay-as-you-Drive auto insurance
22 THE HAMILTON PROJECT | THE BROOkINgs INsTITUTION
Given that the monitoring costs may exceed the ex-pected benefit of PAYD to insurance firms but are much smaller than the social benefit, government should respond to the classic market failure arising from PAYD’s positive externalities by providing a temporary tax credit to any insurance company for each customer it signs up to a true per-mile pre-mium. As discussed in §3 (B.i), monitoring costs can total well over $100, while the benefit to the firm is likely to be quite small. Thus, we would propose a $100 per-vehicle tax credit for each new true per-mile policy, which would be phased out once 5 mil-lion vehicles are covered by PAYD policies. Given that there are roughly 225 million light-duty ve-hicles (cars, vans, pickup trucks and SUVs) in the United States, the tax credit would be eliminated once 2 percent of all premiums were of the PAYD variety. The $100 tax credit would be available to any firm, although customers involved in a feder-ally funded pilot program would not qualify. The tax credit could be tailored, in theory, to give private firms incentives to set up their programs in a man-ner likely to give the best information to consum-ers and elicit a reduction in VMT. For example, the credit could increase depending on how many times a year the customer is billed, or if the firm’s moni-toring technology informs the driver in real time about how his driving is affecting his premium.
We cap the credit at roughly 2 percent of all vehicles because we believe that while this new product needs a push, once PAYD is offered its dynamic effects on the market will quickly induce more and more driv-ers to adopt this form of insurance pricing. Presum-ably, the first 2 percent of customers signing up to PAYD policies will be low-risk, low-mileage drivers that have a financial incentive to do so. But once these drivers are out of the per-year risk pools, aver-age annual accident costs for the remaining drivers will increase, thus so too will annual premiums, over time. This will give even more drivers a financial incentive to switch to PAYD, which will further in-crease costs for those remaining under traditional
12. Insurers would have the option of varying the policy rate by speed, time of day, or other information gathered about the exposure unit.
Congress should reauthorize the VPP when the SAFETEA-LU bill is up in 2009, and should add $3 million a year targeted solely to funding true PAYD pilot programs. A true PAYD insurance program is one where the unit of exposure is equal to one ve-hicle mile, and the total units are multiplied by the policy rate to produce the policy premium.12 The new, targeted funding would be enough to support a new pilot in five to ten large metro areas over the life of the program, which we expect to last five years.
third, address the market failure around mon-itoring costs. The government should require that odometer readings be performed as part of re-quired safety and emissions inspections or by cer-tifying vehicle service businesses in other states to perform odometer readings. Odometer audits are inexpensive and can be performed while the vehicle is undergoing other servicing (Litman 2007a). If these audits were performed along with traditional servicing, the time inconvenience to customers would be minimal. The trouble is that today there is no infrastructure in place to certify and regulate providers of odometer readings to ensure their credibility.
Still, even with these reforms, trying to read each vehicle’s odometers in a verifiable manner may prove difficult. Technological options are more costly but are less burdensome on individuals be-cause they obviate the need to bring vehicles for odometer readings. They are also likely to elicit a stronger behavioral response because the price sig-nals would be sent more frequently to the driver, as discussed in §3 (A). Some technology options would allow risk-adjusted mileage pricing, based on features such as time of day, driving area, and driver actions related to speed, acceleration, and braking (though these may raise more privacy concerns). In addition to the technology costs, firms face high development costs associated with switching from lump-sum to per-mile premiums, whatever forms of mileage monitoring they choose.

Pay-as-you-Drive auto insurance
www.HAMILTONPROJECT.ORg | JULY 2008 2�
policies, leading a few more drivers to adopt PAYD. A virtuous circle will soon develop that leads nearly all drivers to opt for PAYD policies. Another ben-efit of this dynamic is that PAYD adoption should quickly grow without having to make PAYD man-datory. Customers will always have the option to keep their current premiums, but over time more and more drivers will have a financial incentive to switch to PAYD.
The roughly $515 million cost of both the pi-lot program expansion and tax credits is less than 1 percent of the annual social benefits expected from PAYD, to which we turn in the next section. Moreover, even this small amount of government spending would not require new revenue. As dis-cussed in §5 (B iii), the federal government would save roughly $1.4 billion annually because fewer accidents would mean less Medicaid and Medicare payments to accident victims and less lost tax rev-enue from reduced productivity of incapacitated or fatally injured workers.

Pay-as-you-Drive auto insurance
24 THE HAMILTON PROJECT | THE BROOkINgs INsTITUTION
The net social benefits if PAYD were universally adopted would be approximately $50 to $60 billion a year, mostly from reduced accidents
and congestion, as well as from reduced local pollu-tion, carbon emissions, and oil dependence. Insur-ance premiums would decline for almost two-thirds of drivers, since a minority of high-mileage drivers are responsible for the majority of miles driven. In this section, we discuss in more detail the expected social and individual benefits, and consider who might be harmed.
a. estimating the national impact of PayD
Two previous studies have quantified the effect that a switch to per-mile premiums would have on driv-ing and welfare. Edlin (2003) uses insurance premi-um data to calculate the average per-mile insurance premium in each state. He inserts per-mile premium estimates into a driving and accident model to pre-dict driving reduction and accident savings state by state. Using data from the late 1990s, he estimates driving would decrease by about 10 percent nation-ally, resulting in up to $20.5 billion in benefits from reduced accidents and congestion (updated to 2007 dollars). Parry (2005) builds a general equilibrium model that simplifies the analysis by aggregating all consumers into one representative agent. He in-cludes a more comprehensive set of driving exter-nalities: carbon emissions, oil dependence, and local pollution, in addition to accidents and congestion. Parry uses gas price and fuel economy data from the first half of this decade and borrows Edlin’s es-timate of national average per-mile premiums. He finds that a switch to PAYD would decrease driving and fuel consumption by 9.1 percent, resulting in a $20.5 billion welfare gain (updated to 2007 dol-lars).
We extend the previous analyses by using data on vehicles, driving, and household characteristics from the 2001 National Household Transporta-tion Survey (NHTS), which allows us to estimate the driving reduction and cost impact of PAYD at the vehicle and household levels. The national data set includes observations from 21,374 households with full information on annual mileage and fuel economy for each vehicle owned by that house-hold. We assume PAYD is available for light-duty vehicles (cars, vans, pickup trucks, and SUVs). We ignore buses and heavy trucks because their insur-ance companies probably have more information about their mileage, and thus their premiums prob-ably already closely reflect mileage. Light-duty ve-hicles were responsible for 92 percent of all vehicle miles in 2006 (U.S. Department of Transportation [DOT] 2006, Table VM-1). In total, 41,672 vehicles are included in our sample.
We combine the information on annual mileage and fuel economy from the NHTS data set with other driving-related data to calculate the expected driv-ing reduction from PAYD. We follow Parry (2005) in modeling the driving response from PAYD. Drawing on gasoline and mileage demand elastici-ties from previous literature, Parry assumes per-mile insurance premiums as high as a vehicle’s per-mile fuel costs would reduce that vehicle’s mileage by 15 percent (for details, see appendix). As explained ear-lier, only the collision, liability, and uninsured mo-torist portions of auto insurance premiums would be expected to switch to per-mile rates. For state-level data on these rates, we use a more recent ver-sion of the data that Edlin (2003) analyzed from the National Association of Insurance Commissioners (2007, Tables 1 and 2).13 In 2001, these portions of the premium accounted for 84 percent of average
5. impacts, costs, and benefits
13. In the NAIC tables, premiums for uninsured motorist coverage are included in liability premiums.

Pay-as-you-Drive auto insurance
www.HAMILTONPROJECT.ORg | JULY 2008 25
expenditures on car insurance nationwide, or $809 of the $964 average total premium (updated to 2007 dollars). We divide average annual 2001 premiums by the average annual mileage for a vehicle in that state (from the 2001 NHTS data) to generate aver-age per-mile insurance premium estimates for each state. We adjust for inflation to generate estimated per-mile premiums in 2007. The $809 average pre-mium comes to 6.6 cents per mile. The NHTS data report the census division instead of the state for vehicles in small states (to avoid identification of the household), so we report aggregate per-mile pre-miums for those states. Estimated per-mile premi-ums are reported in Table 2. We use pretax gasoline prices in 2007 by state from the Energy Informa-tion Agency (EIA) data series “Gasoline Prices by Formulation, Grade, Sales Type,” and pretax diesel prices from EIA’s series “No. 2 Diesel Fuel Prices–Sales to End Users.”14 State and federal tax rates are from Petroleum Marketing Monthly, EIA, Table
EN1 (“Federal and State Motor Fuels Taxes”). We divide the per-gallon retail price of fuel by the fuel economy of each vehicle to get per-mile fuel cost for that vehicle. Combining the initial mileage for each vehicle as reported in the NHTS, the driving response to per-mile premiums from Parry (2005), the per-mile premiums and the per-mile fuel cost, we can estimate driving reductions for each vehicle in the sample. The results aggregated by state are reported in Table 2. We find a nationwide reduction in driving and fuel consumption of 8 percent among the vehicles we consider. There is significant varia-tion from state to state. States with more accidents and higher premiums would see larger reductions: New Jersey would see 13.5 percent reductions, and New York would see 11.5 percent reductions. States with fewer accidents and lower premiums would see lower driving reductions: Iowa and Kansas each would see 6 percent reductions.
14. Data on fuel prices were only available for the first eleven months of 2007 at the time of our analysis.

Pay-as-you-Drive auto insurance
26 THE HAMILTON PROJECT | THE BROOkINgs INsTITUTION
source: Authors’ calculations.
state or Division
Alabama Alaska
Arizona Arkansas California Colorado
Connecticut Floridageorgia Hawaii Illinois Indiana
Iowa kansas
kentucky Louisiana Maryland
Massachusetts Michigan
Minnesota Mississippi Missouri
New Jersey New York
North Carolina Ohio
Oklahoma Oregon
Pennsylvania south Carolina
Tennessee TexasUtah
Virginia washington wisconsin
New Hampshire Maine
Rhode Island Vermont Nebraska
North Dakota south Dakota
DelawareD.C.
west Virginia Idaho
Montana Nevada
New Mexico wyoming
u.s. total
Division 1: new england
Division 4: West north
central
Division 5: south atlantic
Division 8: Mountain
Per-mile insurance premium (cents)
5.59.67
5.46.88.18.18
6.19.96
5.5556
7.66.68.76.45.95.55.59.79.25.�6.15.66.97.�5.75.86.26.65.67.55
5.9
4.6
7
7.2
6.6
Driving reduction from PayD (percent)
6.610.88.46.48
9.49.910.27.911.67.26.75.95.97.19.18.210.77.47.26.46.71�.511.56.�7.26.67.78.67.27
7.48.27.�8.�5.7
7
5
8.5
8.�
8
initial traffic Density
(vehicles per lane year)
�01,940165,755477,�9816�,206861,111265,905700,527760,88�455,0�4
1,080,4���66,88��57,5501��,405105,64229�,459�54,446824,781727,705406,986207,987268,104262,098898,418587,108465,909418,592207,857267,497428,418�60,012�65,951�65,717284,07�516,9�0�24,775251,425
�66,�08
67,972
�64,145
164,244
357,946
external accident cost per mile at
initial traffic density (cents)
1-0.86.5-0.8�1.10.�18.72�5.652.92.62.�-0.9-0.90.82.�28
20.6�.9-0.50.40.��4.411.8
64.2-0.50.�4.62.42.62.60.68.21.50.1
2.6
-0.7
2.5
-0.8
2.4
individual accident cost savings net of lost driving
benefits (millions of dollars)
100241695281917211776425�5�21�12142419�1441402�6228109671154526891542228487�1�941�25006515216277
86
�9
9�
2�1
7,703
external accident cost
savings (millions of dollars)
�0-4
277-16
6,8446
482�,88941150616190-15-142071
1,08698624�-1965
2,7591,511�2�278-155
�447010��629
40�5�0
66
-12
57
-52
21,306
tabLe 2
Driving reduction and accident cost savings from PayD

Pay-as-you-Drive auto insurance
www.HAMILTONPROJECT.ORg | JULY 2008 27
Our estimated 8 percent reduction in driving and fuel consumption (assuming all light-duty vehicles switch to PAYD) is somewhat smaller than the pre-vious estimates by Edlin (2003) and Parry (2005). This is primarily because fuel prices have increased since the earlier studies, meaning that the intro-duction of per-mile premiums today would have a smaller proportionate impact on marginal driving costs and thereby elicit a smaller consumer response. In 2007, the nationwide average retail gasoline price was $2.73 per gallon, or roughly 13.6 cents per mile. Per-mile premiums of 6.6 cents per mile would have increased marginal fuel and insurance cost by 48 percent in aggregate. By contrast, in 2001 (the year in which the original NHTS data we used was col-lected) average retail gasoline prices were $1.42 per gallon, or roughly 7.7 cents per mile, and insurance premiums averaged 5.7 cents per mile. At that rate, per-mile premiums would have increased marginal fuel and insurance cost by 77 percent in aggregate.
Our estimated 8 percent reduction in VMT is based on 2007 fuel prices, though fuel prices at the time of publication are significantly higher. While full price data are not available to run our analysis using true fuel prices as of summer 2008, a back-of-the-en-velope calculation assuming a nationwide average premium of 6.6 cents and a nationwide retail price of fuel of $4 per gallon (20 cents per mile) would reduce our estimated reduction in VMT to between 5 and 6 percent. We use 2007 fuels prices because they are the latest comprehensive data available at the time of our analysis and because future oil prices are notoriously difficult to forecast, recent increases notwithstanding.15
Moreover, even if fuel prices remain at their 2008 levels, there is reason to believe the driving response may not be much lower than we estimate. The mod-el for driving response that we and others use based
on fuel price elasticities is only accurate so long as fuel prices remain a relatively constant fraction of total marginal driving costs, which also include the costs of time and vehicle wear and tear. But when fuel costs grow faster than these other costs, pro-portional changes in fuel costs will have greater impacts on total driving costs and thus would be expected to have proportionately greater impacts on driving. Indeed, a recent analysis by Kenneth Small and Kurt Van Dender (2007) specifically al-lowed for such a relationship and found that a 58 percent increase in fuel prices would increase the elasticity of VMT with respect to fuel prices by 44 percent. Since we are comparing per-mile premi-ums to fuel prices, the Small and Van Dender result implies we should adjust our elasticity upwards as fuel prices increase and become a larger fraction of total driving costs. If we assume the Small and Van Dender findings (based on fuel price changes from 2001 to early 2006) apply similarly to the fuel price change between 2007 and 2008, then the 47 per-cent increase in fuel prices from $2.73 to $4 per gal-lon would imply the elasticity we should use is 35 percent greater, or -0.2 instead of -0.15. Using this higher elasticity with a fuel price of $4 per gallon would only reduce our driving reduction estimate from 8 percent to about 7 percent.
There are other reasons to view all the estimates with caution. For one, our model assumes every driver in the same state faces the same per-mile pre-mium. In reality, though, there would be significant variation in rates, just as there is today. Drivers and vehicles that insurance companies deem higher risk per mile will be charged a higher premium. For ex-ample, younger drivers, drivers of unsafe cars, and drivers with poor driving records will all probably face higher per-mile premiums than we assumed, whereas other drivers would face lower premiums. Since driving more seems to lead to increased driv-
15. The EIA predicts that average regular gas prices will be $4.23 in the fourth quarter of 2008 but that they will then decline and average $4.06 in 2009 (EIA 2008). Economists at the Dallas Federal Reserve Board are even more skeptical that oil prices will remain at current levels, writing that “Absent supply disruptions, it will be difficult to sustain oil prices above $100 (in 2008 dollars) over the next 10 years” (Brown, Virmani and Alm 2008). Conversely, Goldman Sachs analysts in May 2008 predicted oil prices reaching between $150 and $200 per barrel by 2010 (Murti, Singer, Koh, and della Vigna 2008). Similarly, economist Jeff Rubin at Canadian brokerage CIBC World Mar-kets predicts oil prices reaching $200 per barrel by 2010 (Rubin 2008).

Pay-as-you-Drive auto insurance
28 THE HAMILTON PROJECT | THE BROOkINgs INsTITUTION
ing skill (see Figure 2), high-mileage drivers would tend to be in the low per-mile risk group. Then if high-mileage drivers were charged lower-than-av-erage per-mile premiums because they are better drivers, whereas low-mileage drivers were charged higher than average per-mile premiums, our ag-gregate 8 percent driving reduction estimate would be biased upward. This upward bias occurs because those being charged the most per mile would be low-mileage drivers to begin with.
Second, we assume all drivers respond equally to a proportionate change in marginal driving costs. It is possible that low-income drivers are more sensi-tive to marginal price increases than high-income drivers. This also could lead our aggregate driv-ing reduction estimate to be upward biased since, as we showed earlier, low-income drivers already drive less on average. Assuming a constant elasticity across all drivers also ignores significant heteroge-neity in drivers’ alternative transportation options. All else being equal, a driver in a metropolitan area with reliable public transit options is more likely to be able to reduce vehicle mileage than a driver in a rural area with fewer options.
Third, if PAYD were implemented nationwide, the ensuing fall in vehicle mileage would clear traffic from roads and thus reduce the likelihood of ac-cidents for every mile driven. If insured accident costs fell, this should cause per-mile premiums to fall as well, mitigating a small fraction of the initial driving reduction response. Reduced congestion also would lower the time cost of driving and thus encourage more driving.
Fourth, we have followed Edlin (2003) and Parry (2005) in assuming no change in the number of drivers and vehicles. Because PAYD reduces the fixed cost of owning and driving a car by allowing consumers to pay less for insurance by driving less, though, it could result in more vehicle purchases. However, as Parry points out, mileage per car falls
with PAYD so it is unclear whether vehicle demand would increase or decrease.
Despite these cautions which together imply an esti-mated 8 percent reduction in VMT may be overstat-ed, and despite the fact that the effects of sweeping changes in pricing insurance nation-wide are inher-ently unknowable, limited real-world experience also suggests that PAYD would yield a reduction in driving of around 8 to 10 percent. The FHWA and the Minnesota Department of Transportation cosponsored a demonstration project to test how consumers would change their driving behavior un-der PAYD pricing. They monitored driving behav-ior of participants and gave each a per-mile insur-ance price of between 5 cents and 25 cents per mile based on their mileage levels during an initial pre-experimentation period. An analysis of the results performed by Cambridge Systematics (2006) found a total reduction in driving of 8 percent. Similarly, in a 2006 PAYD pilot program by Progressive Insur-ance in Texas, drivers who opted for PAYD drove 10 percent fewer miles (Progressive 2007). In that pilot, participants received $25 for every 5 percent fewer miles driven than expected, an average of 4 cents per mile, up to $350 a year.
One problem, however, is that the real-world ex-perience is based on extremely small sample sizes. The Minnesota study involved only one hundred thirty households. In addition, it is difficult to gen-erate real-world evidence about the effects of PAYD because, even in the few cases in which a program similar to PAYD has been offered, there is usually no reliable information about a driver’s VMT prior to entering the program. Of the 3,014 volunteer participants in Progressive’s pilot, only 93 had odometer reading data available from the previous year’s emissions inspection.16 Thus, both the eco-nomic estimates and real-world experience need to be viewed with a certain degree of caution.
16. A more-extensive follow-up analysis evaluating the response of all 3,014 participants in Progressive’s pilot program in conjunction with the North Central Texas Council of Governments is to be released shortly.

Pay-as-you-Drive auto insurance
www.HAMILTONPROJECT.ORg | JULY 2008 29
b. national benefits of PayD
The benefits of reducing mileage and fuel consump-tion by anything around the 8 percent we predict are substantial. An 8 percent reduction in driving by light-duty vehicles (a 7.4 percent reduction in driving from all vehicles on the road) would decrease total vehicle mileage by 222 billion miles and fuel consumption by 11.2 billion gallons (based on driving and fuel consumption data from 2006, the most recent year of reported data). To understand the magnitude of PAYD’s impact, consider that a 40-cent increase in the gas tax would be needed to reduce gasoline use
tabLe 3
estimated gross benefits of adopting PayD auto insurance in the united states
by 8 percent, and a 99-cent increase would be needed to reduce driving by 8 percent.17 (The tax needed to reduce VMT is more than twice that required to re-duce gasoline use because roughly 60 percent of the reduction in gasoline use from a gas tax comes from increased fuel efficiency rather than a reduction in VMT [Parry and Small 2005].)
As Table 3 shows, an 8 percent reduction of driving and gasoline consumption would have significant benefits for society from reduced accident costs, congestion, local pollution, CO2 emissions, and oil dependence.
17. The equivalent gasoline tax increase assumes an initial retail price of $2.73 per gallon, which was the national average for the first eleven months of 2007, the most up-to-date data at the time of this paper’s data analysis. To achieve an 8 percent reduction in driving and with an initial gasoline price of $4-a-gallon, an increase of $1.45 in the gasoline tax would be required.
impact of PayD social values benefits u.s. total Per vehicle ($ billions ) (dollars)
total gross benefits
source: Authors’ calculations Notes: savings in 2007 dollars. Individual and external insurance cost savings calculated based on state-by-state driving reductions estimated by authors. All other benefits based on nationwide 8 percent reduction in driving and fuel consumption from initial 2006 values for all light-duty vehicles. 1. Other accident cost savings include reduced accident-related traffic delay, medical costs accruing to accident victims and their private medical insurance companies, and lost wages and household productivity incurred by accident victims who are incapacitated or fatally injured.
Reduce driving by 8 percent
(222 billion miles)
Reduce fuelconsumptionby 8 percent
(11.2 billion gallons)
Individual insurance cost savings net of lost driving benefits
External auto insurance cost savings
government accident cost savings
Other accident cost savings1
Reduced congestion
Reduced local pollution
Reduced carbon emissions
Reduced oil dependence
Varies by state
Varies by state
N/A
N/A
6 cents/mile
1.5 cents/mile
$25 ton/CO2 (22 cents/gallon)
50 cents/gallon
7.7
21.�
2.0
�.2
1�.�
�.�
2.5
5.6
58.9
�4
9�
9
14
58
15
11
25
257
Reduced Accidents

Pay-as-you-Drive auto insurance
�0 THE HAMILTON PROJECT | THE BROOkINgs INsTITUTION
i. individual auto insurance cost savings. A switch from lump-sum to per-mile auto insurance premiums allows people to save money by driving less. As we have discussed, lump-sum insurance premiums lead to inefficiently high driving. For ex-ample, suppose driver Dan travels twelve thousand miles a year and is charged $1,200 a year in liability, collision, and uninsured motorist insurance premi-ums. Dan is implicitly charged 10 cents per mile for insurance. Because Dan pays the insurance premi-um up front and in a lump sum, though, he does not consider it in deciding how much to drive. He only considers the costs that depend directly on mile-age, what economists call his marginal costs: fuel, vehicle maintenance, internal accident costs (the value he puts on his own life and limbs given a risk of injury), and the value of his time. He drives up to the point where the benefits he derives from each additional mile just equals these marginal costs. To be sure, as noted earlier he knows that if he drives more he is more likely to get into an accident or be cited for a moving violation, which would make his premiums go up next year. However, considering that the average driver only gets into an accident every twenty years, this is far from a direct incentive (Insurance Information Institute n.d.). If Dan faced per-mile insurance premiums, however, he would recognize that each additional mile actually costs him an additional 10 cents. Some of the miles he is driving would not be worth 10 extra cents to him. If he could save 10 cents by eliminating the miles he values at less than 10 cents he would be better off. PAYD allows this to happen, whereas lump-sum pricing does not.
Each driver’s benefit from switching to PAYD equals his insurance cost savings net of the surplus he was enjoying from driving the miles he gives up. For example, if Dan valued one hundred of the miles he drove at only 4 cents a mile above his marginal cost, he would not drive them anymore if he were charged 10 more cents for them. By not driving them, he loses 4 cents in surplus but gains 10 cents
in reduced insurance costs, so he is 6 cents per-mile-avoided better off than before. State-by-state estimates for these individual accident cost savings net of lost driving benefits are reported in Table 2. Nationally, we calculate the savings would total $7.7 billion a year (see appendix).
These savings could in theory go partly to insur-ance companies if the market is not immediately competitive (Edlin 2003). Knowing that per-mile premiums will make their customers better off by billions of dollars in aggregate, insurance compa-nies initially may be able to extract some of that benefit as profit. If all the benefit went to insurance companies, they could make $34 per vehicle that switched to PAYD. Eventually, as the market be-came competitive, we would expect these savings to accrue instead to drivers. (As detailed in §5 (D), PAYD also eliminates the transfer from low-mile-age to high-mileage drivers implicit in the current lump-sum pricing scheme. We calculate the average low-mileage driver will save $318 per vehicle from the elimination of this transfer. While this will be offset in aggregate by higher premiums charged to high-mileage drivers, a first-mover insurance com-pany able to lure low-mileage drivers from other companies could in theory capture some of that $318 in savings itself.)
ii. external auto insurance cost savings. Accident savings accrue to all other drivers and their insurance companies when any one driver forgoes a mile. Again, consider driver Dan. For each car with which Dan crosses paths when he drives one mile, there is a (small) probability that Dan’s car and the other car might collide. If Dan does not drive that mile, that probability goes to zero.18 So for every mile that Dan avoids driving, he reduces the acci-dent risk of all other drivers on the same road at the same time. Dan does not consider this cost when he decides whether to drive, but when he reduces driving all other drivers are better off.
18. This is not to say the other cars no longer have any accident risk: they just have no risk of colliding with Dan.

Pay-as-you-Drive auto insurance
www.HAMILTONPROJECT.ORg | JULY 2008 �1
One way to measure the accident externality is to calculate how much all other drivers’ insurance costs rise when any one driver decides to drive an-other mile. Aaron Edlin and Pinar Karaca-Mandic (2006) use a panel data set on insurance premiums, insurance costs, traffic density, and control vari-ables from 1987–95 to measure this relationship. They model the accident externality as a function of traffic density in each state. In states where traf-fic density is high, the probability of crossing paths with another driver is high, and thus so is the ac-cident cost imposed on them. We use the relation-ship Edlin and Karaca-Mandic find to calculate the accident externality in each state (for details see ap-pendix). Following those authors, we obtain data on total VMT and total lane miles in each state from Highway Statistics, published by the U.S. Depart-ment of Transportation (DOT 2006).
Our resulting estimates of the per-mile accident ex-ternality for each state are reported in Table 2. As we would expect, the accident externality is highest in the states with highest traffic density (measured in vehicles per lane-year, also reported in Table 2). In Hawaii, the most traffic dense state, the external accident cost is 53 cents a mile, more than five times the individual driver’s per-mile premium. In New Jersey, the second-most traffic dense state, the ex-ternal accident cost is 34.4 cents per mile, three and a half times the individual driver’s per-mile premi-um. In most states, however, the external accident cost is smaller than the per-mile premium. In some states with very low traffic density, the external ac-cident cost is even negative. This could be because, as driving increases, it causes other drivers to drive more slowly and thus reduces the frequency or se-verity of accidents. Such a scenario is more likely in extremely high-traffic-density situations, where more drivers plausibly might cause speeds to fall, not in the less-dense states for which we find nega-tive external accident costs. More likely, the nega-tive external cost numbers result because the partic-ular model developed by Edlin and Karaca-Mandic
(2006) is not designed for states with very low traffic densities. The model treats external accident costs as a quadratic function of density in a given state. In their results, the coefficient on density-squared is positive but the coefficient on density is negative and of greater magnitude. In states with very low traffic densities, the negative term dominates. None of the negative externality numbers for these states on the edges of the distribution are statistically sig-nificant (see appendix).
External accident cost savings from PAYD are re-ported in Table 2.19 Nationally, we estimate the sav-ings would total around $21 billion a year, which should be thought of as a conservative estimate for an 8 percent reduction in driving. We have assumed every driver in each state faces the same premium, but in reality per-mile insurance premiums would be adjusted by all the other normal risk factors. The drivers most likely to get into accidents would be charged the highest per-mile premiums. Hence the reduction in mileage will be concentrated among the most risky drivers, generating higher accident savings than a proportional mileage reduction across all drivers (Edlin 2003).
iii. other external accident cost savings. Traffic accidents have many social costs that are not covered by auto insurance and that do not accrue to those responsible for the accidents. These costs are thus additional external accident costs. One part of these costs are medical costs incurred by victims, paid for out of their own savings or through private insurance plans such as Blue Cross-Blue Shield, HMOs, commercial insurance policies, or worker’s compensation. Another is lost wages and household productivity incurred by accident victims who are incapacitated or fatally injured. A third and major cost is the time delay incurred by drivers suffering in traffic caused by accidents (which is not captured in the figures measuring delay caused by high traffic volume discussed below). A widely cited report con-ducted by the National Highway Traffic Safety Ad-
19. In calculating external accident cost savings, we incorporate that external accident costs fall as mileage falls. We are grateful to Aaron Edlin and Pinar Karaca-Mandic for sharing the full results of their analysis and for confirming our results.

Pay-as-you-Drive auto insurance
�2 THE HAMILTON PROJECT | THE BROOkINgs INsTITUTION
ministration (NHTSA 2002) estimated these costs together accounted for 15 percent of total social costs from accidents in 2000, amounting to $40.2 billion (updated to 2007 dollars). If we assume an 8 percent reduction in driving will lead to an 8 per-cent reduction in crashes and an 8 percent reduc-tion in these costs, the social benefits would total $3.2 billion. This may be a conservative assumption, because there is theoretical and anecdotal evidence (which we have already discussed) to suggest ac-cidents would fall more than proportionately with mileage. Conversely, reduced mileage could open up roads and increase driving speed, increasing the frequency or severity of crashes.
The other part of additional external accident costs are those that accrue to federal, state, and lo-cal governments. These include medical payments through Medicare and Medicaid, lost tax revenues from reduced productivity by incapacitated or fa-tally injured workers, and the cost of emergency services responding to crashes and cleaning up af-ter crashes. The NHTSA (2002) study estimated that government costs accounted for 9 percent of total social costs of accidents in 2000, amounting to $25.3 billion (updated to 2007 dollars).20 Making the same assumptions as above, an 8 percent reduc-tion in these costs would save the government $2 billion, $1.4 billion of which would accrue to the federal government.
While the above figures account for the economic costs of lost workplace and household productiv-ity from injuries and fatalities, there are obviously many other benefits to reducing the number of fa-talities and injuries—and the impact of PAYD could be substantial. According to the Fatality Analysis Reporting System (FARS) of the NHTSA, in 2006 there were 1.4 fatalities per 100 million VMT in the United States. Using the same assumption as above, if fatalities dropped proportionally by 1.4 per 100 million vehicle miles avoided from PAYD, the re-duction in driving of 222 billion miles would lead
to 3,108 fewer fatalities a year. The estimates for avoided injuries are less precise. While the FARS database is an accurate count of fatalities on all pub-lic roads in the United States, there is no such com-prehensive data source for injuries. The previously mentioned NHTSA report (2002) compiled data from various different sources and estimated an in-jury rate of 116 per 100 million VMT in 2000. The report found a decrease throughout the 1990s of on average 3.5 injuries per 100 million VMT a year. Assuming that trend continued into this decade, the rate would stand at ninety-five injuries per 100 million VMT in 2006. Based on this estimate, an 8 percent reduction in driving would lead to 210,900 fewer injuries.
iv. reduced congestion. Only two studies have been done that attempt to estimate the marginal external congestion cost for the United States. The FHWA (U.S.DOT 1997, 2000) provided an estimate of 5 cents per mile us-ing speed-flow curves for certain rural and urban road classes and weighting these by their respec-tive U.S. mileage shares. Fischer, Harrington, and Parry (2007) recently developed another estimate by using the results from a computational model of the metropolitan Washington, DC road network. Extrapolating over the seventy-five largest U.S. cit-ies and including data on all driving in the U.S., they find an average marginal congestion cost of 6.5 cents per mile for driving on all U.S. roads. We fol-low Fischer and colleagues in combining both esti-mates and using 6 cents per mile as the parameter. An 8 percent reduction in VMT would thus yield a benefit of $13.3 billion in the form of reduced congestion. This is a highly simplified figure. Ex-ternal congestion costs are not the same for each mile driven. It varies by location and time of day. The above studies try to find the cost of the average mile in America, but this is inherently imprecise. Another assumption behind the $13.3 billion figure is that mileage reduction from PAYD is the same in more-congested as in less-congested areas of each
20. To complete the picture, the study found that 50 percent of social accident costs are covered by auto insurance, and that 26 percent are internalized by drivers who are responsible for crashes.

Pay-as-you-Drive auto insurance
www.HAMILTONPROJECT.ORg | JULY 2008 ��
state. But it may be possible that wages are higher in more congested urban areas, which possibly would lead to lower driving price elasticities, and hence less reductions in urban areas. However, urban ar-eas have more-extensive and more-reliable public transit alternatives to driving (CBO 2008), which pushes in the other direction.
v. reduced local pollution. Vehicles burning gasoline emit NOX and HC into the air. NOX and HC react in sunlight to form ozone, which is the main component of smog. Smog is especially problematic for senior citizens, children, and people with pulmonary conditions because it can inflame breathing passages and de-crease lung capacity. Smog also increases the body’s susceptibility to illness. In addition to ozone, NOX and HC react to form particulate matter that can be small enough to reach lung tissue. A study by Lad-en, Schwartz, Speizer, and Dockery (2006) found a positive and statistically significant relationship between particulate matter concentrations and car-diovascular and lung cancer mortality in six Ameri-can cities.
Most studies trying to quantify the social cost of NOX and HC pollution from vehicles treat the damage as proportional to distance traveled because new passenger vehicles have been subject to grams-per-mile standards for NOX and HC since the 1970 Clean Air Act (see Parry and Small 2005; Fischer et al. 2007). These standards ensure that virtually all vehicles, regardless of age or fuel economy, emit local pollutants at the same per-mile rate (Parry et al. 2007) We follow the recent study by Fischer and colleagues that estimated the cost specifically for the United States. That study finds an external local pollution cost of 1.5 cents per mile, which implies a $3.3 billion savings from an 8 percent reduction in mileage.
vi. reduced co2 emissions. PAYD will reduce fuel consumption by the same proportion that it reduces driving. From the NHTS data, we calculate that 99.7 percent of the fuel consumed by light-duty vehicles is gasoline, so
we focus on gasoline in this section. Each gallon of gasoline contains 0.0024 tons of carbon (National Research Council 2002), which when burned be-comes 0.0088 tons of CO2. An 8 percent reduction in gasoline consumption by these types of vehicles (an 11.2 billion gallon reduction) would directly reduce emissions of CO2 by 99 million tons (Table 4.)
Reducing consumption of one gallon of gasoline saves more than just the carbon in that gallon. Car-bon is emitted all along the process of turning the oil in the ground into gasoline in a vehicle’s tank. It is emitted in drilling, transporting, refining, and blending. A study by Bringkman, Wang, Weber, and Darlington (2005) sought to measure these total “well-to-wheels” emissions. Based on their results, we calculate that reducing consumption of gaso-line by one gallon reduces total CO2 emissions by 0.0112 tons, 27 percent more than the direct emis-sions reductions. By that count, reducing gasoline consumption by 8 percent reduces CO2 emissions by 126 million tons, 2 percent of total U.S. CO2
emissions in 2006 and 8.5 percent of all emissions from cars and trucks in 2006 (Table 4).
Estimates of the external social cost of CO2 are notoriously varied. The Nobel Prize–winning In-tergovernmental Panel on Climate Change (IPCC) recently surveyed one hundred estimates and found a range from $3 to $95 per ton (IPCC 2007). In a recent paper for The Hamilton Project, economist Gilbert Metcalf (2007) surveyed the literature on the social cost of carbon and proposed a CO2 tax of $15 per ton that would quickly ramp up to and pass $25. In another Hamilton Project paper, economist Rob Stavins (2007) proposed a cap-and-trade sys-tem with an implied initial CO2 cost between $18 and $41 per ton. Given the wide range of estimates, we use a central value of $25 per ton of CO2. Based on that estimate, each gallon of gasoline saved yields a 22-cent benefit (using direct CO2 emissions) for a total savings of $2.5 billion.
vii. reduced oil dependence. Reducing driving and fuel consumption by 8 per-

Pay-as-you-Drive auto insurance
�4 THE HAMILTON PROJECT | THE BROOkINgs INsTITUTION
cent among the vehicles we consider (7.4 percent among all vehicles on the road) would reduce U.S. oil consumption by about 4 percent. This reduced oil consumption has national and economic secu-rity benefits. Various studies have tried to quantify the specific economic costs of oil dependence. The economic costs are generally divided into three cat-egories, and the estimates for each depend heavily on highly uncertain parameters. First, imperfect competition in the oil market implies the world price is inflated above its competitive level. To the extent that the United States has monopsony power—as a consumer of one-fourth of the world’s daily oil supplies—domestic consumers over-con-sume because they ignore the impact they can have on world prices. Studies estimate the external cost from this monopsony component to be between 8 and 48 cents per gallon, depending on various as-sumptions (Leiby 2007; Newbury 2005). Second, market imperfections such as wage and price rigidi-ties and producers’ inability to rapidly adjust energy inputs decrease the economy’s capacity to adjust to
price shocks, leading to excessive underutilization of available resources and increasing aggregate eco-nomic costs during price spikes. While mechanisms to help businesses and households adjust more eas-ily (such as oil futures markets and energy conser-vation measures) have proliferated in recent years, consumers and producers will only take protective actions against the risks that they expect to bear di-rectly, failing to consider the impact of their deci-sions on wider disruption costs. Leiby estimates this cost at between 6 and 20 cents per gallon. Finally, some studies find that oil consumption leads to in-creased military expenditures in sensitive oil-pro-ducing areas. Analyzing only the Middle East, De-lucchi and Murphy (2008) estimated the marginal gallon of gasoline consumption increases military expenditure by 3 to 15 cents. Aggregating the three components of marginal external costs of oil depen-dence leads to a range of 17 to 83 cents per gallon of gasoline.
tabLe 4
co2 emissions reductions from PayD
tons of co2 as a percent as a percent of co2 of total co2 emissions from cars emissions, and trucks, 2006 2006 (percent) (percent)
Direct CO2 emission reductions 98,912,000 1.67 6.69
well-to-wheel CO2 emission reductions 125,888,000 2.12 8.51
source: Authors’ calculations.

Pay-as-you-Drive auto insurance
www.HAMILTONPROJECT.ORg | JULY 2008 �5
None of these studies includes the arguably signifi-cant geopolitical costs of oil consumption:
• increasingly wealthy oil-supported authoritarian governments,
• the inability of U.S. foreign policy to deal with hostile states for fear of oil supply–related reper-cussions,
• the demise of freedoms in these countries (Fried-man 2006),
• the increase in resentment toward U.S. military presence in the Middle East (tied to securing stable oil supplies), and
• the flow of oil funds to terrorist organizations.
These costs are widely recognized (see Council on Foreign Relations 2006; Bordoff, Deshpande, and Noel forthcoming) but are virtually impossible to measure in dollar terms. This would push us to-ward using the high range of the estimates for the economic costs of oil dependence as an estimate of the combined economic and national security costs. However, there is also reason to believe the high estimates of the economic costs are too high. Lower energy intensity, improved management of mon-etary policy, and greater flexibility in the economy have decreased the economy’s vulnerability to oil shocks (Blanchard and Gali 2007; Nordhaus 2007). Conversely, at the time of this writing the current oil shock had pushed U.S. spending on oil as a per-cent of GDP up to its highest level in twenty-five years, and the economy is showing signs of signifi-cant strain. Given the large uncertainty about the external cost of oil consumption, we adopt an esti-mate of 50 cents per gallon, the mid-point in the 17 to 83 cent range of values for the economic portion of the external cost of oil dependence. At this rate, the oil demand reduction from PAYD saves $5.6 billion.
viii. Fuel taxes, road maintenance and roadway investment costs. As driving falls, so will the cost of maintaining exist-ing roads and building new roads to meet demand. We do not count savings on road maintenance in the social benefits, though, because we assume cur-
rent fuel taxes roughly offset marginal maintenance and roadway investment costs of additional miles driven. In other words, we assume these user costs are already internalized by drivers.
This is a simplifying assumption, but it is not clear in what direction it biases our results. On the one hand, fuel tax and other user fee revenues have been steadily declining as a share of total road and highway spending. In 2006, user fees only covered 63 percent of the $147.6 billion that federal, state, and local governments raised to support road and highway programs (DOT 2006, Table HF-10). This would imply that the infrastructure costs im-posed by drivers are not fully internalized by the fuel taxes they pay, and thus that reduced driving would have some additional social benefits. On the other hand, it is impossible to determine whether that spending reflects the true costs that users im-pose on the system. Without user fees such as tolls, VMT taxes, or congestion charges, no price signals are sent to planners indicating the efficient level or distribution of physical infrastructure spend-ing (Deshpande and Elmendorf 2008). The minor social savings calculated by using current spending as an indicator of imposed infrastructure costs is dwarfed by the uncertainty about the true level of a driver’s imposed costs, so we do not take a stand one way or the other.
ix. total gross benefits. If all light-duty vehicles switched to PAYD auto in-surance, we estimate gross social benefits would to-tal $58.9 bllion a year. The benefit per car would be $257, over seven times higher than the direct sav-ings to insurance companies and their customers.
In addition, PAYD would have other social benefits that are harder to quantify. For example, PAYD would likely reduce the number of uninsured ve-hicles on the road. The current policy of lump-sum auto insurance premiums makes insurance very expensive for people who own cars but use them infrequently. Some of these motorists forgo auto insurance altogether, even in states that require it. Bringing down the cost of auto insurance for such

Pay-as-you-Drive auto insurance
�6 THE HAMILTON PROJECT | THE BROOkINgs INsTITUTION
drivers would encourage more of them to purchase insurance. In the calculations presented in this sec-tion, we implicitly assume such drivers do obtain insurance when PAYD becomes available. The cal-culations present benefits from reducing mileage and fuel consumption by 8 percent from all light-duty vehicles, not just those that were previously insured.
x. estimated costsSwitching every vehicle to PAYD would come at a cost because insurers would need to monitor miles driven, but estimating this cost is difficult. We re-port in Table 1 that commercially available telemat-ic devices cost between $50 and $170 up front and sometimes entail monthly or yearly data transmis-sion costs as well. But conversations with insurance companies indicated the cost of these devices is fall-ing quickly and that the price reported to us may be higher than the price for a bulk buyer such as a large insurance company. If PAYD became widely offered with telematic devices to record mileage, it is likely the costs of these devices would fall still faster. Fur-ther, as previously discussed PAYD does not neces-sarily require telematic devices. Simple odometer audits performed by accredited safety and emis-sions inspectors or others could provide verified mileage data at far lower costs than with telematic devices. Other PAYD models also exist that do not require high up-front costs; for example, Milemeter allows consumers to buy insurance online for a cer-tain number of miles and requires them to monitor their own odometer miles and purchase additional insurance as needed in order to be covered.
Given this wide range of potential costs, we do not endeavor to predict what they would be. But even taking a high-end cost estimate, the benefits of PAYD remain substantial. For example, if we as-sume a monitoring cost of $40 per vehicle per year (which would be the cost if a telematic device were $100, consumers replaced them every five years, and it cost $20 per year for transmission of data to the insurance firm), the net benefits of PAYD would still be $50 billion per year.
c. estimating the Distributional impact of PayD
Although Edlin (2003) and Parry (2005) estimated the national benefits from PAYD, we can find no previous study that endeavored to estimate impacts on a driver or household level. With the detailed data in the 2001 NHTS described above, we are able to begin answering the distributional ques-tion.
First, we calculate the major distributional impact from PAYD: the elimination of the subsidy from low-mileage to high-mileage drivers. To estimate this transfer we divide vehicles into risk classes. We group them by their state, by their registration in either urban or rural areas, and by their vehicle type (car, van, pickup truck, or SUV). We calculate the average mileage for a vehicle in each risk group. We then assume that vehicles driven less than the average for their risk group save insurance premi-ums equal to the product of the average per-mile premiums charged in their state and the difference between their annual mileage and the average mile-age for their risk group. Under this calculation, the total insurance premium paid by all drivers in the risk group remains the same. There is simply a re-allocation away from those who drive less to those who drive more and thus probably have more ac-cidents.
Second, we measure the benefit to all drivers who can now save money on auto insurance by driving fewer miles. This calculation was described above and is explained in detail in the appendix. Even driv-ers who now lose from the elimination of the sub-sidy to high-mileage drivers save money by having the opportunity to lower their (now higher) premi-ums by driving less.
To get a clearer picture on a household level, we group the results of all vehicles in a household to determine how each household is affected. Because the NHTS data include information on household variables such as income, we are able to break down the impact by income group.

Pay-as-you-Drive auto insurance
www.HAMILTONPROJECT.ORg | JULY 2008 �7
Of course, this gives only a rough idea of the true distributional impact of PAYD. As with the driving reduction benefit, our analysis is limited because we assume that all drivers in each state face the same per-mile premium, regardless of their risk class, and that that all drivers in each state initially purchased the same amount of insurance coverage. We do this because we only have insurance premium data by state. More significantly for the distributional analysis, however, is the limited way we are able to group drivers into different risk classes. We have only considered three of the many variables insur-ance companies price insurance on. We are limited for two reasons. First, we simply do not have data on some of the relevant variables, most notably acci-dent history. This is a significant issue that biases our estimates upwards. As shown in Figure 2, we would expect low-mileage drivers to be more risky per mile. Many of the “winners” in our current analysis probably would be charged higher per-mile premi-ums as a result, while many of the “losers” would be charged lower per-mile premiums than we assume. This implies that the magnitude of predicted sav-ings and losses are somewhat overstated. Another related issue is that some low-mileage drivers are already receiving some (minor) premium discounts from insurance companies who offer them, further biasing our estimated savings upwards. But since all current discounts are based on self-reported data, it is impossible to know if those receiving such dis-counts are actually low-mileage drivers, so the de-gree this impacts our results is unclear.
The second reason we are limited in grouping into risk class is that we quickly run into small sample problems. The NHTS includes many relevant vari-ables that we know companies consider when eval-uating a vehicle’s risk exposure, such as information on the age and gender of all the vehicle’s drivers as well as the make, model, and year of the vehicle itself. We cannot use this information because the three variables we do group by already divide the 41,672 vehicles into several hundred risk groups. Adding another variable into the mix leaves too many vehicles in the sample in a group by them-selves. In proceeding with an imperfect grouping
along a subsample of the relevant variables, we ac-knowledge the incompleteness of our data and the limitations of our analysis. We nevertheless believe the exercise leads to important observations.
D. Distributional impacts of PayD
Table 5 describes the broad results from the analy-sis described above, aggregating individual accident savings and the elimination of subsidies from low-mileage to high-mileage drivers. Assuming every vehicle switches to PAYD, almost two-thirds of all households save money, with the average savings for those households that save totaling $270 per vehicle, which is 28 percent of current average auto insurance payments (including comprehensive). The elimination of subsidies accounts for most of the distributional impact. Savings per vehicle from reduced mileage average only $18 per vehicle for households who save money, and only $48 per ve-hicle for households who would pay more in total. The elimination of subsidies, on the other hand, ac-counts for $252 of the savings for households who save money and $418 of the increased costs for households who would pay more. If we look at the vehicle instead of the household level, almost two-thirds (63.4 percent) of vehicles would have lower insurance premiums, with the average savings for those with lower premiums of $333 per vehicle ($15 from driving reductions and $318 from the elimina-tion of the subsidies to high-mileage drivers). The savings for those who save (and losses for those who pay more) are greater at the vehicle level than at the household level because within each household there may be some vehicles driven more than aver-age and some driven less than average.
The high proportion of drivers that would pay less under PAYD reflects the fact that a minority of high mileage drivers is responsible for a majority of driv-ing within each risk class. Figure 5 shows that the top 20 percent of drivers are responsible for 45 per-cent of all miles driven. In other words, the average number of miles driven is higher than the median number of miles driven. Thus, PAYD results in a transfer from the minority of high-mileage drivers

Pay-as-you-Drive auto insurance
�8 THE HAMILTON PROJECT | THE BROOkINgs INsTITUTION
tabLe 5
insurance savings from PayD
Figure 5
Distribution of Driving, by Mileage Decile
63.5 percent of households 36.5 percent of households save money pay more
Average change in insurance premium per household −$496 $71�
Average change in insurance premium per vehicle −$270 $�70
Changeinpremiumpervehiclefrom −$252 $418 eliminationoftransferfromlowmileage tohighmileagedrivers Changeinpremiumpervehicle −$18 −$48 fromreducedmileage,netoflostdriving benefits
Change in premium as a percent of −28% �8% annual insurance premium (including comprehensive coverage)
source: Authors’ calculations. Note: Numbers may not add up due to rounding.
source: Authors’ calculations based on data from the 2001 National Household Transportation survey.
0
5
10
15
20
25
30
35
Tota
l Mile
s D
rive
n b
y V
ehic
les
in T
his
Dec
ile a
s a
Perc
ent
of
Tota
l Mile
s D
rive
n
Mileage Decile1
1
2
3
3
5
4
6
5
7
6
9
7
11
8
13
9
16
10
29

Pay-as-you-Drive auto insurance
www.HAMILTONPROJECT.ORg | JULY 2008 �9
to the majority of low-mileage drivers. This transfer is fair because it eliminates the subsidy low-mileage drivers were paying to cover the accident costs for the high-mileage drivers in their risk class.
The very limited real-world experience with PAYD confirms these potential savings. In a pilot program in the U.K. administered by Norwich Union, a quarter of their customers saved 30 percent com-pared to what they would have paid under the stan-dard Norwich Union Motor Insurance premium (Norwich Union n.d.).
Low-income families will especially benefit, on
average. Our data show that they make up a dis-proportionately large fraction of the low-mileage drivers within any risk class. Figure 6 breaks down the accident cost and transfer savings by income group reported in the 2001 NHTS. As the figure shows, every household income group making less than $52,500 (in 2001) saves on average. This is es-pecially significant because their savings make up a far greater proportion of their incomes, whereas the losses for the high-income groups are virtually insignificant (Figure 6). This should not be con-strued as implying that most high-income drivers are worse off. On the contrary, Figure 7 shows that a majority of drivers in each income group saves money with PAYD.
Figure 6
estimated Household savings from PayD, by annual Household income
Note: savings in 2007 dollars but household income groups in 2001 dollars. savings are deflated to 2001 dollars to calculate percentage of 2001 income levels. source: Authors’ calculations.
-300
-200
-100
0
100
200
300
Do
llars
Annual Household Income
-10
-8
-6
-4
-2
0
2
4
6
8
10
Percent o
f Ho
useh
old
Inco
me
$2,50
0
$7,50
0
$12.5
00
$17,5
00
$22,5
00
$27,5
00
$32,5
00
$37,5
00
$42,5
00
$47,5
00
$52,5
00
$57,5
00
$62,5
00
$67,5
00
$72,5
00
$77,5
00
$90,0
00
> $100
,000
Average Household Savings (dollars) Household Savings as a Percent of Income

Pay-as-you-Drive auto insurance
40 THE HAMILTON PROJECT | THE BROOkINgs INsTITUTION
In addition to benefiting specific demographic groups, PAYD can benefit all households by increas-ing the affordability of vehicles. Because car insur-ance is currently priced as a large fixed yearly cost (roughly one-fifth of the annual financial costs of owning an intermediate sized car [Litman 2007a]), some families simply cannot afford to own a car, which limits their mobility. Also, PAYD makes it cheaper for families to purchase a second or third car (although they have less incentive to do so than before because PAYD gives them the incentive to drive less). Currently, a family would pay signifi-cantly more in auto insurance for two cars than it would for one car, even if the total miles the fam-ily drove did not increase but was spread over two cars. PAYD might thus encourage the purchase of a small, fuel-efficient second car in addition to a nec-essary larger car that can accommodate the whole family (and should thus be an attractive policy re-form to the car manufacturers).
Figure 7
Proportion of Households saving Money with PayD, by annual Household income
Others have suggested that PAYD would dispro-portionately help female drivers because women tend to drive less than men (Butler 1996). While we also find that a slightly greater proportion of women than men benefit from PAYD, this effect is not significant in our model. This is primarily be-cause we have analyzed vehicles rather than drivers. When analyzing our data at the driver level, we find the same distribution as in previous studies, name-ly that the average male driver drives significantly more miles (63 percent more) than the average female driver (Table 6). However, as Butler points out, vehicles, not drivers, are insured. The relevant comparison from an insurance perspective then is to compare vehicles with women as the primary driver to vehicles with men as the primary driver. While such a comparison was not possible with the data available to the earlier studies, we were able to analyze this question. And on this score, we find a much smaller difference. Vehicles with male pri-
source: Authors’ calculations.
0
10
20
30
40
50
60
70
80
90
Pro
po
rtio
n o
f H
ou
seh
old
s Sa
vin
g M
on
ey (
per
cen
t)
0
$2,50
0
$7,50
0
$12.5
00
$17,5
00
$22,5
00
$27,5
00
$32,5
00
$37,5
00
$42,5
00
$47,5
00
$52,5
00
$57,5
00
$62,5
00
$67,5
00
$72,5
00
$77,5
00
$90,0
00
> $100
,000
Annual Household Income

Pay-as-you-Drive auto insurance
www.HAMILTONPROJECT.ORg | JULY 2008 41
tabLe 6
Distribution of Driving, by Driver, vehicle, and gender
mary drivers are driven only 7 percent more than vehicles with female primary drivers (Table 6). This explains why our results show similar proportions of men and women drivers benefit from PAYD.
e. Who is Harmed?
Unless PAYD is mandated for all drivers, high-mileage drivers would not initially sign up because they would lose money by doing so. As the per-year insurance pool becomes limited to high-mileage drivers, average annual accident costs per driver will increase. This will lead to higher per-year pre-miums on high-mileage drivers, in effect a sort of back door mileage charge. We predict this will push ever more (and eventually all) high-mileage drivers into per-mile premiums. Either way, high-mileage drivers will pay more each year under our proposed reforms. This is only fair: high-mileage drivers get into more accidents (and impose greater external costs on the rest of society as well).
Still, policymakers may rightly be concerned about the impacts of a switch to PAYD on low-income drivers. Although most end up better off on aver-age, there are undoubtedly many low-income driv-ers who drive more than the average and will thus end up worse off under PAYD. Given that the pur-pose of PAYD is to make drivers bear more of the insurance cost they impose, it is inevitable that some drivers, across the income distribution, will pay more in auto insurance. Indeed, it is that marginal cost of driving that provides the incentive to drive less. Concerns about the impact of such a policy on low-income people should, like concern for low-income people and rising inequality more broadly, be addressed through measures such as progressive tax reform (Furman, Summers, Bordoff 2007).
Another concern is that those who live in rural areas and drive many more miles will be adversely affect-ed, but this concern is unfounded. That is because PAYD premiums will vary depending on other risk
Distribution of Driving by Driver Distribution of Driving by vehicle
All drivers Males Females All Vehicles Vehicles Vehicles with with Male Female Primary Primary Drivers Drivers
Mean mileage 1�,968 17,049 10,4�5 12,465 12,90� 12,007
Median mileage 10,000 12,000 10,000 10,245 10,415 10,092
source: Authors’ calculations based on data from the 2001 National Household Transportation survey.

Pay-as-you-Drive auto insurance
42 THE HAMILTON PROJECT | THE BROOkINgs INsTITUTION
tabLe 7
Households with Light-Duty vehicles saving Money with PayD
factors, and geography is one of the largest factors. Current insurance schemes are tailored down to the zip code. People that drive their cars in busy cities get in more accidents, and consequently pay more each year. People in rural areas driving on empty roads get in fewer accidents, and pay less each year. PAYD would keep the same distinction. We calcu-late that drivers in New Jersey would pay on average 9.7 cents per mile while drivers in Nebraska, North Dakota, and South Dakota would pay only 4.6 cents per mile. Since geography is a key risk factor, those in rural areas where people drive more will not be unfairly impacted because their premiums will be determined relative to how many miles the average driver in their areas drives. Table 7 shows almost two-thirds of household in both urban and rural households save money with PAYD.
Percent who save
urban households 6�.7
rural households 62.9
source: Authors’ calculations.

Pay-as-you-Drive auto insurance
www.HAMILTONPROJECT.ORg | JULY 2008 4�
6. Why PayD is Preferable to various alternative insurance Models
Recognizing the fundamental flaw that the pricing of auto insurance does not bring home to the driver the cost of the marginal
mile driven, others have proposed variants of PAYD. For many years, the most discussed alternative to the current all-you-can-drive insurance system has been Pay-at-the-Pump (PATP). Under PATP, mo-torists would pay for their insurance as they buy fuel for their vehicles through a surcharge on fuel price, plus additional charges for high-risk drivers. Remarkably, the first published reference to PATP came in an address given in 1925 by Henry Swift Ives before the Safety Committee of the Cincin-nati Automobile Club, revealing that people started to question the justification for charging for auto insurance on a lump-sum basis when cars were first starting to appear en masse on America’s roads. Lat-er, Daniel Patrick Moynihan proposed the idea in an article in the New York Times Magazine in 1967 (“Next: A New Auto Insurance Policy.” The New York Times, August 27.)
Though people often conflate PATP and PAYD, PATP was motivated not by problems with the way auto insurance was priced, but rather with the inef-ficiency of the auto insurance system itself. PATP was thus primarily a tort reform proposal. Under one common variant of PATP, drivers would pay an additional charge per gallon of gasoline (which would be the largest source of funds). Drivers also would pay additional charges based on driving re-cord and a vehicle ownership charge that would vary based on the vehicle’s safety record (Sugarman 1994). PATP was thus one of the first no-fault auto insurance proposals. It would have replaced the law-suit system of tort liability for bodily injury. Drivers would no longer have needed to purchase insurance covering bodily injury or liability insurance. Rather, the system, similar to worker’s compensation, would have provided compensation to motor vehicle acci-dent victims, based on a schedule of benefits.
By raising the cost of gasoline, PATP also would have created an incentive for people to reduce driving. However, PATP is inferior to PAYD in two key respects. First, most PATP proposals, such as Sugarman’s Vehicle Injury Plan in California (1994), would have priced for accident risk much less precisely than traditional risk-based individual premiums. Indeed, some proposals did not vary the charges based on driver characteristics such as driv-ing record. Second, because PATP insurance is tied to the amount of fuel used rather than the number of miles driven, much of the response comes from improvements in fuel economy rather than reduced driving, thereby providing far less benefit than PAYD toward reducing congestion and accidents (although this would provide larger benefits from reducing the less costly fuel-related externalities). Conversely, PATP may be better than PAYD in en-suring all drivers have insurance coverage, since you need to fill up to drive (electric cars aside).
A corresponding notion to adding the price of in-surance to the cost of gasoline was advanced forty years ago by Vickrey (1968): adding the price of in-surance to the cost of tires. Even Vickrey observed such a scheme was likely unworkable. For one thing, it would create an incentive for people to drive on bald tires, though he suggested that could be ad-dressed by offering people a partial refund when they replace their old tires. The most serious defect he saw, though, was that the idea would not permit adequate geographical variation in the rates: there would be no way of preventing tires purchased in a rural low-risk area being used predominantly in a congested high-risk area.

Pay-as-you-Drive auto insurance
44 THE HAMILTON PROJECT | THE BROOkINgs INsTITUTION
7. Questions and concerns
Several objections to PAYD may be raised, which are addressed below. But perhaps one way to address them all in a general way is to
pose a hypothetical question and ask how people would likely react in the reverse scenario. Suppose that decades ago the technology existed to permit easy and low-cost odometer monitoring and a sys-tem developed whereby drivers were charged per mile traveled for auto insurance—which, as Vick-rey (1968) observed forty years ago, makes more conceptual sense and may well have developed but for odometer fraud concerns. Imagine now that a legislator proposed to require insurance firms to abandon that system and charge all cars a lump sum each year for insurance regardless of how much a car’s owner drives. What would the likely reaction be? It seems quite likely that the proposed system would be viewed as massively unfair to those who drive less than average and a much less precise way of charging people for use of insurance. Because higher income people tend to drive more, there would likely be allegations that legislators were helping those who were already well off at the ex-pense of everyone else. It would be seen as harmful to a driver who owns several cars (and, incidental-ly, would thus be opposed vigorously by the auto manufacturers as a potential deterrent against the purchase of second and third cars). Although people tend to see the flaws with proposed reforms more than with those of the status quo, viewing the ques-tion through such a reverse hypothetical suggests strongly that the potential downsides of the status quo vastly outweigh those of PAYD. With that ab-stract conceptualization of the question, we address specific objections.
is it fair to charge per mile given that someone who drives four times as much is only twice as likely to have an accident?
We noted earlier that the relationship between VMT and accidents is not proportional. One may
ask, therefore, whether it is fair to charge a driver who drives twenty thousand miles four times as much as one who drives five thousand miles, even though the former is only twice as likely to be in an accident as the latter. First, the former will not be charged four times as much with per-mile premi-ums because the premiums are still risk adjusted. The premium will account for various other fac-tors, such as driver age or experience, so that a lower risk driver will pay less per mile than a higher risk driver. Since per-mile crash rates differ significantly between motorists, it would indeed be unfair to use per-mile charges alone instead of other risk factors, but actuarial accuracy is increased when per-mile premiums are based on other rating factors.
Second, as already discussed, it is incorrect to sug-gest that because a comparison across different ve-hicles does not yield a proportional relationship, the risk of any individual vehicle being involved in an accident also does not. The driver who drives twen-ty thousand miles and the driver who drives five thousand miles are, on average, not equally good drivers, which is why the high-mileage driver is not four times as likely to have an accident—though she is still more likely. But for any individual twenty-thousand-mile good driver, her risk of having an accident does decline by 10 percent if she drives 10 percent fewer miles, unless the miles she forgoes are somehow lower-risk than the average mile she drives.
Will people actually choose PayD over normal insurance premiums?
Almost two-thirds of American drivers will have a clear financial incentive to switch over to PAYD be-cause they drive less than average. Under the current system, most drivers overpay compared to the acci-dent and insurance costs they actually cause. Under PAYD, these drivers will be paying less. Some driv-ers may be hesitant if their miles vary widely from

Pay-as-you-Drive auto insurance
www.HAMILTONPROJECT.ORg | JULY 2008 45
year to year and they are not sure whether they will save money by switching, but evidence shows most people prefer fees closely tied to usage rather than lump-sum premiums. In a survey commissioned by Norwich Union, the largest insurance group in the United Kingdom, nine out of ten people say they would prefer their auto insurance to reflect the usage of their car and the type of journeys they make (Lit-man 2007a). More than 50 percent favored “pay as you go” systems similar to what is offered by gas and electricity suppliers—precisely what PAYD offers. In a Minnesota study, 25 percent of respondents said they would definitely be interested in PAYD (Cam-bridge Systematics, 2006). According to Progressive, 34 percent of its customers in Michigan, Minnesota, and Oregon who signed up via telephone or the internet have been choosing their usage-based pro-grams since 2004 (M. P. McQueen, “How Technolo-gy Can Help Trim Auto Insurance,” Wall Street Jour-nal, June 26, 2008). Based on the positive response to its TripSense Program, Progressive recently an-nounced a national rollout of a usage-based insur-ance program. According to GMAC, enrollment in its Low-Mileage Discount Program with OnStar has tripled in the last year (ibid.).
Will mileage-monitoring systems raise privacy concerns?
Odometer readings are already widely publicly avail-able. They are collected during vehicle servicing, vehi-cle sales, and crash investigations. Many are even sold by private companies such as CARFAX to used vehicle purchasers and insurance companies. The odometer auditing proposed in this paper simply standardizes and requires the collection of this information.
Electronic monitoring technologies, though, have the potential to go beyond simple mileage measure-ments by recording when and where a vehicle has
been driven. There are four responses to this poten-tial privacy problem. First, PAYD will always remain optional. If people prefer yearly premiums—because they do not want to share private information or for any other reason—they should still be able to get them, although adverse selection will make that a costlier option over time. Second, some people al-ready have technologies that record all of this private information (such as OnStar) without any problem. Third, several of the technology options we have re-viewed in this paper can be used to record total mile-age only instead of capturing other personal driving data. Fourth, individuals are increasingly willing to share private information with companies if they can derive some benefit from doing so. For exam-ple, people type ever-more-revealing questions into Google’s search engine, questions it uses to more-effectively target advertising, in exchange for quick and efficient access to information. Now people are even signing up to cell phone services that allow oth-ers to know their exact locations at any time (Amol Sharma and Jessica E. Vascellaro, “Phones Will Soon Tell Where You Are,” Wall Street Journal, March 28, 2008). Indeed, Progressive has confirmed that in sur-veys of its customers more than half say they would be willing to allow Progressive to monitor their driv-ing behavior in exchange for lower premiums; the response was even higher among low-mileage driv-ers who would benefit.21
Will PayD actually reduce driving?
Americans pay an average of 6.6 cents in collision and liability insurance premiums for every mile they drive. Considering the average noncommer-cial vehicle gets about twenty miles per gallon in fuel economy, having drivers pay their insurance cost per mile rather than per year would give car owners the same incentive to drive less as adding $1.32 to the price of gasoline.22 While recent expe-
21. Interview with authors. Progressive has not made its survey data available to the public.22. This is consistent with our earlier claim that it would take a 99-cent increase in the gasoline tax to induce an 8 percent reduction in driving.
Higher gas prices lead people who own cars to reduce driving and discourages potential buyers from buying a car (Parry 2005). Pricing auto insurance per mile driven, by contrast, only induces the former behavioral change (and may induce the opposite of the later change if people buy more cars because they can now afford insurance on cars driven few miles). Thus, it takes a higher per-mile premium per gallon than it takes tax per gallon to achieve the same reduction in driving.

Pay-as-you-Drive auto insurance
46 THE HAMILTON PROJECT | THE BROOkINgs INsTITUTION
rience with a more-than-doubling of gasoline pric-es since January 2003 confirms that consumption is relatively inelastic in the short run, driving be-havior and fuel consumption is starting to change. Long-term evidence shows that consumers will turn these modest short-term behavioral changes into significant decreases in gasoline demand in the long run if gas prices remain at their current levels (Congressional Budget Office [CBO] 2008). At current prices, even the short-run response has been notable. The FHWA reported that total VMT fell 4.3 percent in March 2008 compared to March 2007, the first time March travel has fallen from the previous year since 1979 and the largest yearly drop from any month in FHWA history (DOT 2008). Whereas gasoline price changes are often perceived to be temporary, a switch to PAYD would give con-sumers a permanent, long-term incentive to change their driving habits.
Has PayD ever worked anywhere else?
PAYD is being implemented successfully in a num-ber of other countries (Litman 2007a). In Israel, 15 percent of all vehicles (two hundred thousand of them) run with PAYD insurance offered by Aryeh Insurance. Miles are recorded by small wireless transmitters in vehicles and received at fuel pumps. Polis Direct in the Netherlands has been offering its Kilometre Policy since 2004. Under this policy, participants pay an advance premium—90 percent of current prices—and can receive rebates of up to 50 percent off their premium for lower mileage. Mileage data are collected in annual vehicle inspec-tions. Other countries with limited PAYD pilot pro-grams include Canada (where Aviva Canada offers it in Ontario), Japan (offered by Aioi), and South Africa. Norwich Union in the United Kingdom has a pilot program, though it was recently paused.
Will PayD disproportionately hurt truckers and bus drivers?
We assume that PAYD will not be offered to bus and truck drivers. They will thus not be impacted either way. Insurers must already have a much bet-
ter idea how much such vehicles are driven and thus must develop premium programs tailored to them. Even if they did adopt a form of PAYD, per-mile premiums do not increase aggregate insurance costs for any risk class as a whole (and to the degree that it reduces driving, it reduces insurance costs for all risk classes). Rather, PAYD simply reallocates the burden of insurance costs within each risk category to those vehicles responsible for a greater propor-tion of the accident cost burden. The same would apply to buses and trucks if they were to adopt per-mile premiums: as a whole, they would be no worse off, but those who drove the most would pay more while those who drove less than average would pay less. Since the variance in miles among these groups is probably quite small, and certainly much smaller than among the vehicles we analyzed, the redistri-butional impact of PAYD also likely would be quite small.
is PayD the optimal insurance pricing scheme?
While adding mileage to the rating mix will increase efficiency and equity in the auto insurance market, even more can be done to price auto insurance more accurately and efficiently. Optimal premiums would incorporate other factors that contribute to accident risk, such as speed, time of day, and aggressiveness. Progressive is pursuing just such an approach. More sophisticated pricing schemes could lead to even greater social benefits than we have calculated. For example, telematic devices might detect aggressive braking patterns. If higher premiums for this activ-ity cause drivers to drive more evenly, this could reduce congestion, fuel consumption, and pollution even if mileage remains constant. The EPA, for ex-ample, estimates that aggressive driving could lower gas mileage by 33 percent at highway speeds (U.S. Department of Energy, 2008).
To maximize impact on driving behavior, such in-formation about driving behavior should be com-municated in real time to drivers. Consider the ef-forts of Southern California Edison to encourage its consumers to conserve energy. While attempts to

Pay-as-you-Drive auto insurance
www.HAMILTONPROJECT.ORg | JULY 2008 47
notify people by e-mail or text message about their energy use had little effect, people reduced energy use in peak periods by 40 percent when they were given an Ambient Orb, a little ball that glows red when a customer is using a large amount of energy, but green when energy use is modest (Thaler and Sunstein 2008). One can envision a similar indica-tor on the dashboards of cars that glows red when people are driving too fast, braking too hard, or driving aggressively, but green when they are driv-ing more safely.23
is PayD the most efficient way to reduce driving-related externalities?
The purpose of PAYD is not to reduce driving ex-ternalities, but rather to correct a failure with the way that auto insurance is priced today and the inefficient and inequitable consequences of that pricing structure. While this failure is an impor-tant problem, what makes PAYD such an attractive policy is that by addressing it PAYD also would help reduce a range of driving-related externalities by creating an incentive at the margin for people to reduce their VMT.
That PAYD reduces driving-related externalities, however, does not mean that these externalities should not be priced to make drivers bear the full social costs of their driving. In a Hamilton Project paper, for example, economist David Lewis (2008) proposed a congestion fee, showing social benefits could exceed $10 billion a year. Global pollution costs from CO2 emissions do not vary uniformly with mileage; large gains can come from increased fuel efficiency and the substitution of gasoline for renewable alternatives. The most efficient ap-proach is a carbon pricing mechanism that cre-ates an incentive to use less carbon, whether that takes the form of a carbon tax (Metcalf 2007) or a cap-and-trade system (Stavins 2007). The external costs of oil security vary with total consumption,
not driving or even quantity of oil imported (Fur-man et al. 2007). The current system of gasoline taxes are the most efficient way of tackling this ex-ternality (as long as they apply only to oil, and not to renewable additives that can be mixed in with oil) (Bordoff, Deshpande and Noel, forthcoming). Harvard economist Greg Mankiw has proposed a $1 increase in the gas tax partly to reflect the cost of oil dependence (“The Pigou Club Manifesto.” The Wall Street Journal. October 20, 2006 ), while his colleague Martin Feldstein has proposed a sys-tem of tradable gasoline rights as a way of reducing oil consumption and increasing national security (“Tradeable Gasoline Rights.” The Wall Street Jour-nal. June 5, 2006).
PAYD is not the answer to all driving-related ex-ternalities. The optimal strategy for dealing with the diverse driving-related social costs is a set of optimized user fees specifically calibrated to cap-ture each externality, i.e., a combination of PAYD and the measures described above. Indeed, if moni-toring for PAYD is done using mileage recording and transmitting technology inserted in vehicles, PAYD could pave the way for full network pric-ing that could piggyback on the PAYD technology. Yet all these additional proposals raise the cost of driving in the aggregate and thus are likely to pro-voke significant political opposition, particularly in a climate of rising gasoline prices. The promise of PAYD is that it can achieve some of the benefits of these user fees by creating incentives to reduce driving without raising the cost of driving in the aggregate, and indeed lowering it for the majority of drivers.
23. We thank Jeff Kling for suggesting that orbs be put in cars. We note that Thaler and Sunstein (2008) suggested the behavioral response could be even stronger if it “made annoying sounds, such as cuts from ABBA’s Gold: Greatest Hits,” but because tastes differ and their suggestion would actually encourage us to drive more dangerously, we decline to adopt their suggestion that audio be incorporated into the orb.

Pay-as-you-Drive auto insurance
48 THE HAMILTON PROJECT | THE BROOkINgs INsTITUTION
8. conclusion
As record-high gas prices squeeze American households, PAYD could offset some of that pain by reducing the costs of driving
for two-thirds of households. It is also more equi-table, because low-income families would benefit disproportionately from lower insurance costs. At the same time, as our nation struggles with such challenges as oil dependence and climate change, PAYD would create incentives to reduce driving, thus helping to address these and other driving-re-lated harms. In short, PAYD represents a win-win policy. What is good for drivers, in this case, is also good for society.

Pay-as-you-Drive auto insurance
www.HAMILTONPROJECT.ORg | JULY 2008 49
appendix
a. Driving response From per-Mile Premiums
We follow Parry (2005) who uses the literature on driving responses to fuel price changes to estimate the impact of per-mile premiums. We assume a constant elasticity demand function, where driv-ers respond to a switch from lump-sum to per-mile premiums by decreasing mileage from each vehicle as follows:
where MO and M1 are initial and final miles traveled, respectively; < 0 is the gasoline demand elastic-ity in the long run; ßM is the fraction of reduced gasoline demand that comes from reduced vehicle miles rather than increased fuel efficiency; ßM is the fraction of reduced VMT that comes from reduced miles per vehicle rather than reduced vehicle de-mand; and PI and PF are the per-mile insurance and fuel costs, respectively. The ratio can be thought of as the proportionate increase in marginal fuel plus insurance cost from a starting point with an initial marginal insurance cost of zero. We exclude the portion of VMT reductions that traditionally come from decreased vehicle demand when fuel prices rise because the PAYD reform does not in-crease the cost of driving in aggregate the same way that fuel price increases do. Rather, it simply switches what was once a fixed cost of owning a car to a variable cost.
Parry (2005) reviews the literature and assigns a value of −0.55 for the long-run gasoline demand elasticity, 0.4 for the portion due to reductions in mileage, and 0.67 for the portion due to miles per vehicle. This model implies that per-mile insurance premiums as high as a vehicle’s per-mile fuel costs would reduce that vehicle’s mileage by 15 percent.
b. individual accident cost savings
The private benefit from reducing mileage as pre-miums are switched from lump sum to per mile is the total premium saved net of the consumer sur-plus lost. Given the linear driving demand assumed above,
Individual savings
We report statewide savings in Table 2. Note that this assumes the driver was originally paying M0P1 in lump-sum insurance premiums (i.e., the per-mile premium that driver faces is equivalent to his current lump-sum premium divided by his annual mileage). Of course part of the impact of PAYD is that many people would pay a different rate even if they did not reduce mileage. This is the elimination of the implicit subsidy from low-mileage to high-mileage drivers under the current system. The elimination of the subsidy is a transfer and thus is not counted in the social benefit analysis, but is considered in the distributional impact.
c. external accident cost savings
Aaron Edlin and Pinar Karaca-Mandic (2006) esti-mate an equation that treats per-mile insurer costs as a quadratic function of traffic density:
where r is the insurance cost for one driver driving one mile, and D is the traffic density in that state in any given year. Traffic density is a function of total VMT (M) and total lane miles in that state (L):
.Edlin and Karaca-Mandic (2006) explain that den-sity can be understood as the number of vehicles crossing a given point on a typical lane of road over a one-year period. In this model, any extra mile
F
IFFmM P
PMMM 001 ηββ+=
F
I
P
P
2321 DcDccr ++=
L
MD ≡
, II PMMPMM )(5.0)( 1010 −−−=
.
FFη

Pay-as-you-Drive auto insurance
50 THE HAMILTON PROJECT | THE BROOkINgs INsTITUTION
driven increases the per-mile insurance cost for each other mile driven that year. The total external accident cost can then be calculated as:
external marginal cost per mile of driving
for large M. This is the same result as Equation (4) in Edlin and Karaca-Mandic (2006) but with the coefficients having different meanings.
We calculate the accident externality for each state using 2006 values for VMT and lane miles from
24. We are grateful to Aaron Edlin and Pinar Karaca-Mandic for sharing the full results of their analysis and for confirming our results.
the FHWA’s Highway Statistics (DOT 2006), using the relevant values for coefficients c2 and c3 that Ed-lin and Karaca-Mandic (2006, Table 3 column 10) estimate. The results, updated to 2007 dollars, are reported in Table 8.24
To calculate the external accident cost savings from PAYD driving reductions, we integrate the external accident cost over the aggregate mileage reduction in each state:
External accident cost savings from driving reduc-tions
The results are reported in Table 8.
−=dMdr
M )1(
232
232
2
2)1(
DcDc
LM
cLc
M
+≈
+−=
€
= c2
ML
+ 2c3
ML
2
M 1
M 0
∫ dM
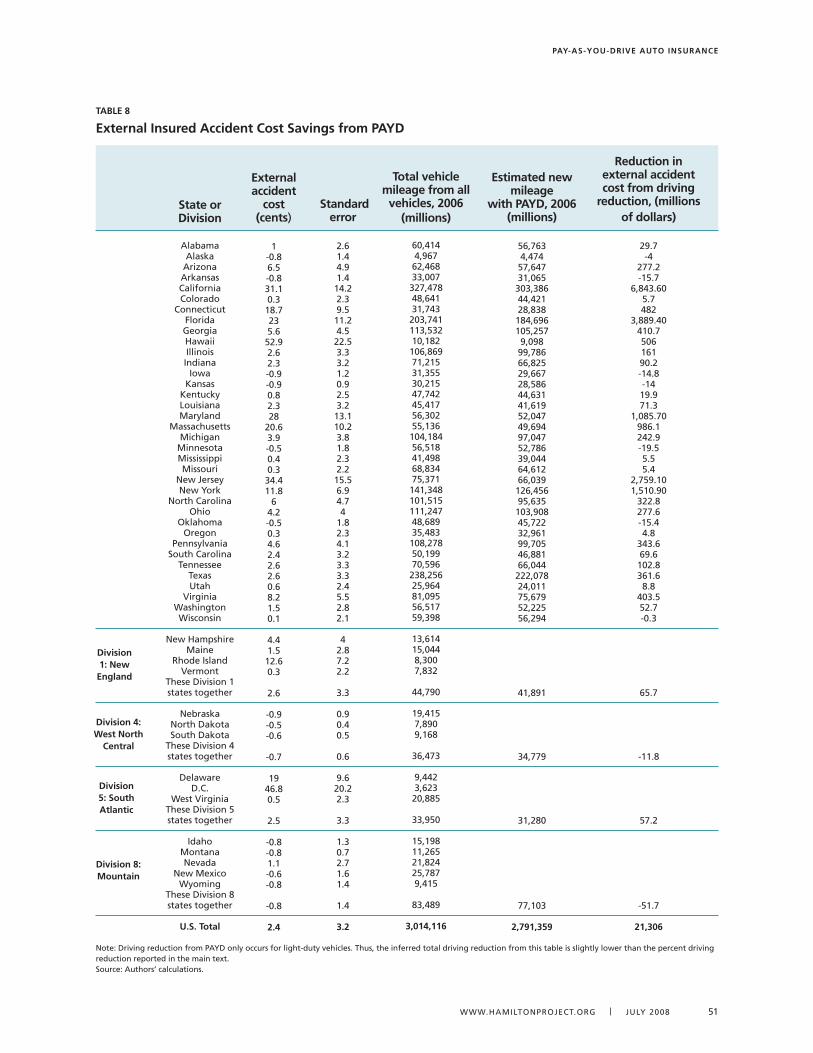
Pay-as-you-Drive auto insurance
www.HAMILTONPROJECT.ORg | JULY 2008 51
tabLe 8
external insured accident cost savings from PayD
state or Division
Alabama Alaska
Arizona Arkansas California Colorado
Connecticut Floridageorgia Hawaii Illinois Indiana
Iowa kansas
kentucky Louisiana Maryland
Massachusetts Michigan
Minnesota Mississippi Missouri
New Jersey New York
North Carolina Ohio
Oklahoma Oregon
Pennsylvania south Carolina
Tennessee TexasUtah
Virginia washington wisconsin
New Hampshire Maine
Rhode Island Vermont
These Division 1 states together
Nebraska North Dakota south Dakota
These Division 4 states together
DelawareD.C.
west VirginiaThese Division 5 states together
Idaho Montana Nevada
New Mexico wyoming
These Division 8 states together
u.s. total
Division 1: new england
Division 4: West north
central
Division 5: south atlantic
Division 8: Mountain
external accident
cost (cents)
1-0.86.5-0.8�1.10.�18.72�5.652.92.62.�-0.9-0.90.82.�28
20.6�.9-0.50.40.��4.411.8
64.2-0.50.�4.62.42.62.60.68.21.50.1
4.41.512.60.�
2.6
-0.9-0.5-0.6
-0.7
1946.80.5
2.5
-0.8-0.81.1-0.6-0.8
-0.8
2.4
standard error
2.61.44.91.414.22.�9.511.24.522.5�.��.21.20.92.5�.21�.110.2�.81.82.�2.215.56.94.74
1.82.�4.1�.2�.��.�2.45.52.82.1
42.87.22.2
�.�
0.90.40.5
0.6
9.620.22.�
�.�
1.�0.72.71.61.4
1.4
3.2
total vehicle mileage from all vehicles, 2006
(millions)
60,4144,96762,468��,007�27,47848,641�1,74�20�,74111�,5�210,182106,86971,215�1,�55�0,21547,74245,41756,�0255,1�6104,18456,51841,49868,8�475,�71141,�48101,515111,24748,689�5,48�108,27850,19970,5962�8,25625,96481,09556,51759,�98
1�,61415,0448,�007,8�2
44,790
19,4157,8909,168
�6,47�
9,442�,62�20,885
��,950
15,19811,26521,82425,7879,415
8�,489
3,014,116
estimated new mileage
with PayD, 2006 (millions)
56,76�4,47457,647�1,065�0�,�8644,42128,8�8184,696105,2579,09899,78666,82529,66728,58644,6�141,61952,04749,69497,04752,786�9,04464,61266,0�9126,45695,6�510�,90845,722�2,96199,70546,88166,044222,07824,01175,67952,22556,294
41,891
�4,779
�1,280
77,10�
2,791,359
reduction in external accident cost from driving
reduction, (millions of dollars)
29.7-4
277.2-15.7
6,84�.605.7482
�,889.40410.750616190.2-14.8-1419.971.�
1,085.70986.1242.9-19.55.55.4
2,759.101,510.90
�22.8277.6-15.44.8
�4�.669.6102.8�61.68.8
40�.552.7-0.�
65.7
-11.8
57.2
-51.7
21,306
Note: Driving reduction from PAYD only occurs for light-duty vehicles. Thus, the inferred total driving reduction from this table is slightly lower than the percent driving reduction reported in the main text. source: Authors’ calculations.
Pay-as-you-Drive auto insurance
52 THE HAMILTON PROJECT | THE BROOkINgs INsTITUTION
references
Blanchard, Oliver J. and Jordi Gali. 2007. “The Macroeconomic Effects of Oil Shocks: Why Are the 2000s So Different from the 1970s?” Working Paper 13368, National Bureau of Economic Research, Cambridge, MA (September).
Bordoff, Jason E., Manasi Deshpande, and Pascal J. Noel. Forthcoming. Chapter in Energy Security: Economics, Politics, Strategies and Implications, ed. Carlos Pasqual and Jon Elkind. Washington, DC: Brookings Institution.
Brown, Stephen P. A., Raghav Virmani, and Richard Alm. 2008. “Economic Letter: Insights from the Federal Reserve Ban of Dallas.” Federal Reserve Bank of Dallas 3 (5) (May).
Brinkman, Norman, Michael Wang, Trudy Weber, and Thomas Darlington. 2005. “Well-to-Wheels Analysis of Advanced Fuel/Vehicle Systems: A North American Study of Energy Use, Greenhouse Gas Emissions, and Criteria Pollutant Emissions.” General Motors Corporation, Argonne National Laboratory, and Air Improvement Resources, Inc. (May).
Butler, Patrick. 1996. “Automobile Insurance Pricing: Operating Cost versus Ownership Cost; the Implications for Women” Proceedings, Women’s Travel Issues Second National Conference, Chapter 39, 737–51. Federal Highway Administration, U.S. Department of Transportation, Washington, DC.
Cambridge Systematics, Inc. 2006. “Mileage-Based User Fee Demonstration Project: Potential Public Policy Implications of Pay-As-You-Drive Leasing and Insurance Products.” Prepared for Minnesota Department of Transportation, Cambridge, MA (March).
Cazorla, Marina, and Michael Toman. 2000. “International Equity and Climate Change Policy.” Climate Issue Brief No. 27, Resources for the Future, Washington, DC (December).
Congressional Budget Office (CBO). 2008. “Effects of Gasoline Prices on Driving Behavior and Vehicle Markets.” CBO, Washington, DC (January).
Council on Foreign Relations. 2006. “National Security Consequences of U.S. Oil Dependency.” Independent Task Force Report No. 58, Council on Foreign Relations Press, New York (October).
Delucchi, Mark A., and James Murphy. 2008. “U.S. Military Expenditures to Protect the Use of Persian Gulf Oil for Motor Vehicles.” Report #15 in the Series: The Annualized Social Cost of Motor-Vehicle Use in the United States, based on 1990–91 Data. Energy Policy 36 (6).
Deshpande, Manasi, and Douglas W. Elmendorf. 2008. “An Economic Strategy for Investing in America’s Infrastructure.” Strategy Paper, The Hamilton Project, Washington, DC.
Edlin, Aaron S. 2003. “Per Mile Premiums for Auto Insurance.” In Economics for an Imperfect World: Essays In Honor of Joseph Stiglitz, ed. Richard Arnott, Bruce Greenwald, Ravi Kanbur, and Barry Nalebuff. Cambridge: MIT Press.
Edlin, Aaron S., and Pinar Karaca-Mandic. 2006. “The Accident Externality from Driving.” Journal of Political Economy 114 (5): 931–55.
Energy Information Administration (EIA). 2008. “EIA Short-Term Energy Outlook.” EIA, Washington, DC (July 8).
Finkelstein, Amy. 2007. “E-Z Tax: Tax Salience and Tax Rates.” Working Paper 12924, National Bureau of Economic Research, Cambridge, MA (February).
Fischer, Carolyn, Winston Harrington, and Ian W. H. Parry. 2007. “Should Automobile Fuel Economy Standards be
Tightened?” The Energy Journal 28 (4): 1–29.Friedman, Thomas L. 2006. “The First Law of Petropolitics.”
Foreign Policy (May/June).Furman, Jason, Jason E. Bordoff, Manasi Deshpande, and Pascal
J. Noel. 2007. “An Economic Strategy to Address Climate Change and Promote Energy Security.” Strategy Paper, The Hamilton Project, Washington, DC.
Furman, Jason, Lawrence H. Summers, and Jason E. Bordoff. 2007. “Achieving Progressive Tax Reform in an Increasingly Global Economy.” Strategy Paper, The Hamilton Project, Washington, DC.
Greenberg, Allen. 2007. “Lowering the Patent Barrier to Pay-as-You-Drive Insurance.” Federal Highway Administration, U.S. Department of Transportation, Washington, DC (November 15).
Guensler, Randall, Adjo Amekudzi, Jennifer Williams, Shannon Mergelsberg, and Jennifer Ogle. 2002. “Current State Regulatory Support for Pay-as-You-Drive Automobile Insurance Options.” Journal of Insurance Regulation 21(3) (Spring). National Association of Insurance Commissioners, Kansas City, MO.
Insurance Information Institute. n.d. “Factsheet on Auto Insurance.” http://www.iii.org/media/facts/statsbyissue/auto/?printerfiendly=yes. Accessed 4/2/08.
Intergovernmental Panel on Climate Change (IPCC). 2007. “Contribution of Working Group II to the Fourth Assessment Report.” IPCC, Geneva.
Jaffe, Adam B., and Josh Lerner. 2004. Innovation and Its Discontents: How Our Broken Patent System is Endangering Innovation and Progress, and What to Do About It. Princeton, NJ: Princeton University Press.
Kahneman, Daniel, Jack L. Knetsch, and Richard H. Thaler. 1986. “Fairness and the Assumptions of Economics.” Journal of Business 59 (4): 285–300.
Laden, Francine, Joel Schwartz, Frank E. Speizer, and Douglas W. Dockery. 2006. “Reduction in Fine Particulate Air Pollution and Mortality: Extended Follow-up of the Harvard Six Cities Study.” American Journal of Respiratory and Critical Care Medicine 173: 667–72.
Leiby, Paul N. 2007. “Estimating the Energy Security Benefits of Reduced U.S. Oil Imports.” Prepared by Oak Ridge National Laboratory for the U.S. Department of Energy, Oak Ridge, TN (February 28).
Lewis, David. 2008. “America’s Traffic Congestion Problem: Toward a Framework for Nationwide Reform.” DP 2008-05, The Hamilton Project, Washington, DC.
Lichtman, Doug. 2006. “Aligning Patent Presumptions with the Reality of Patent Review: A Proposal for Patent Reform.” DP 2006-10, The Hamilton Project, Washington, DC.
Litman, Todd. 2005. “Pay-As-You-Drive Pricing and Insurance Regulatory Objectives,” Journal of Insurance Regulation 23 (3) (Spring).
———. 2007a. “Distance-Based Vehicle Insurance as a TDM Strategy.” Victoria Transportation Policy Institute, Victoria, British Columbia (August 16).
______. 2007b. “Pay-As-You-Drive Pricing in British Columbia.” Victoria Transportation Policy Institute, Victoria, British Columbia (October 6).
Merrill, Stephen A., Richard C. Levin, and Mark B. Myers. 2004. “A Patent System for the 21st Century.” National Academic

Pay-as-you-Drive auto insurance
www.HAMILTONPROJECT.ORg | JULY 2008 5�
Rea, Samuel A. 1992. “Insurance Classifications and Social Welfare.” In Contributions to Insurance Economics, ed. George Dionne. Boston: Kluwer Academic Publishers.
Rubin, Jeff. 2008. “Heading for the Exit Lane.” CIBC World Markets, Inc., New York (June 26).
Schrank, David, and Tim Lomax. 2007. “The 2007 Urban Mobility Report.” Texas Transportation Institute, College Station, TX.
Small, Kenneth A., and Kurt Van Dender. 2007. “Fuel Efficiency and Motor Vehicle Travel: The Declining Rebound Effect.” The Energy Journal 28 (1).
Stavins, Robert N. 2007. “A U.S. Cap-and-Trade System to Address Global Climate Change.” DP 2007-13, The Hamilton Project, Washington, DC.
Sugarman, Stephen D. 1994. “‘Pay at the Pump’ Auto Insurance. The Vehicle Injury Plan (VIP) for Better Compensation , Fairer Funding, and Greater Safety.” Journal of Policy Analysis and Management 13 (2): 363–68.
Thaler, Richard H., and Cass R. Sunstein. 2008. Nudge: Improving Decisions About Health, Wealth, and Happiness. Yale University Press: New Haven, CT.
Tom Bakos Consulting and Markets, Patents and Alliances. 2004. “Patent Watch: Progressive Builds a Fortress of Patent Protection.” Insurance IP Bulletin 3 (October 15). http://www.bakosenterprises.com/IP/B-10152004/pwcomplete.html.
U.S. Department of Energy. 2008. “Driving more efficiently.” http://www.fueleconomy.gov/FEG/driveHabits.shtml, accessed on 7/17/08
U.S. Department of Transportation (DOT), Federal Highway Administration (FHWA). 1997. Federal Highway Cost Allocation Study: Final Report. Washington, DC: DOT.
———. 2000. Addendum to the 1997 Federal Highway Cost Allocation Study: Final Report. Washington, DC: DOT.
———. 2006. “Highway Statistics.” Federal Highway Administration, DOT, Washington, DC.
———. 2008. “FHWA Traffic Volumes Report.” Federal Highway Administration, DOT, Washington, DC.
Vickrey, William. 1968. “Automobile Accidents, Tort Law, Externalities and Insurance: An Economist’s Critique.” Law and Contemporary Problems 33: 464–87.
Williamson, Oliver, Douglas G. Olson, and August Ralston. 1967. “Externalities, Insurance, and Disability Analysis.” Economica (August): 235–53.
Press, Washington, DC.Metcalf, Gilbert. 2007. “A Proposal for a U.S. Carbon Tax Swap:
An Equitable Tax Reform to Address Global Climate Change.” DP 2007-12, The Hamilton Project, Washington, DC.
Murti, Arjun N., Brian Singer, Kelvin Koh, and Michele della Vigna. 2008. “$100 Oil Reality, Part 2: Has the Super-Spike End Game Begun?” Global Investment Research, The Goldman Sachs Group, Inc., New York (May 5).
National Association of Insurance Commissioners (NAIC). 2007. “2004/2005 Auto Insurance Database Report.” NAIC, Kansas City, MO
National Highway Traffic Safety Administration (NHTSA). 2002. “The Economic Impact of Motor Vehicle Crashes 2000.” NHTSA, U.S. Department of Transportation, Washington, DC.
National Research Council. 2002. “Effectiveness and Impact of Corporate Average Fuel Economy (CAFE) Standards.” National Academy Press, Washington, DC.
Newbury, David M. 2005. “Why Tax Energy? Towards a More Rational Policy.” The Energy Journal 26 (3).
Nordhaus, William D. 2007. “Who’s Afraid of the Big Bad Oil Shock?” The Brookings Papers on Economic Activity, Brookings Institution, Washington, DC (fall).
Norwich Union n.d. PAYD homepage: http://www.norwichunion.com/pay-as-you-drive/. Accessed 4/3/08.
Parry, Ian W. H. 2005. “Is Pay-as-You-Drive Insurance a Better Way to Reduce Gasoline Than Gasoline Taxes?” AEA Papers and Proceedings 95 (2): 287–93 (May).
Parry, Ian W. H., and Kenneth A. Small. 2005. “Does Britain or the United States Have the Right Gasoline Tax?” American Economic Review 95 (4): 1276–89.
Parry, Ian W.H., Margaret Walls, and Winston Harrington. 2007. “Automobile Externalities and Policies.” Journal of Economic Literature 45 (June 2007): 373–99.
Progressive County Mutual Insurance Company. 2005. “Texas Mileage Study: Relationship between Annual Mileage and Insurance Losses.” Progressive, Mayfield, OH (December).
———. 2007. “Pay As You Drive (PAYD) Insurance Pilot Program Phase 2 Mid-Course Project Report.” Progressive, Mayfield, OH (March).
———. 2008. “One-of-a-Kind Car Insurance Program Lets Drivers Save Big Bucks Based on How They Drive.” Press release. Mayfield, OH.
acknowledgments
We gratefully acknowledge helpful comments and suggestions from Karen Anderson, Patrick Butler, Manasi Deshpande, Aaron Edlin, Doug Elmendorf, Jason Furman, Allen Greenberg, Winston Harrington, Justin Horner, Mark Israel, Pinar Karaca-Mandic, Jeff Kling, Doug Lichtman, Todd Litman, Lauren Navarro, Ian Parry, Ed Pike, Carrie Russell, Bill Sheppard, Paige Shevlin, Stephen Sugarman, Tim Taylor and Cliff Winston. We also would like to thank those in the auto insurance industry who took the time to speak with us, including Peggy Brinkman, Harris Clarke, Jane Davis, Chris Gay, Richard Hutchinson, Cory Six, John Swigart, Joshua Thomas and Tom Warden. King County Executive Ron Sims and his team provided valu-able insight into their mileage based insurance pilot. Julie Anderson and Leandra English provided helpful research assistance. Sarah Anders’ expertise was invaluable for the data simulations.

Pay-as-you-Drive auto insurance
54 THE HAMILTON PROJECT | THE BROOkINgs INsTITUTION
authors
JASON E. BORDOFF
Jason Bordoff is Policy Director of The Hamilton Project, an economic policy initiative housed at the Brook-ings Institution committed to promoting more broadly shared prosperity. Jason has written on a broad range of economic policy matters, particularly climate change and energy policy, income security and inequality, and tax policy. Jason is also a term member of the Council on Foreign Relations and serves on the board of the Association of Marshall Scholars. He is a member of the New York and Washington, DC Bar Associations. He previously served as an advisor to Deputy Secretary Stuart E. Eizenstat at the U.S. Treasury Department, and worked as a consultant for McKinsey & Co. in New York. Jason graduated with honors from Harvard Law School, where he was treasurer and an editor of the Harvard Law Review. Later, he clerked on the U.S. Court of Appeals for the DC Circuit. He also holds a Master of Letters degree from Oxford University, where he studied as a Marshall Scholar, and a Bachelor’s magna cum laude and Phi Beta Kappa from Brown University.
PASCAL J. NOEL
Pascal Noel is a research analyst at the Brookings Institution’s Hamilton Project. Previously, he worked as a consultant on energy and climate issues. He has written on the economics of climate change policy, energy security, alternative energy, and a range of transportation issues. Pascal was awarded the Donald Dell Fel-lowship to fund research in public finance and energy economics from 2006 to 2007. He holds a Master’s in economics with highest distinction from the London School of Economics, and a Bachelor’s summa cum laude and Phi Beta Kappa from Yale University in economics and the joint degree in ethics, politics, and economics (EPE).

HAMILTONTHE
PROJECT
Advancing Opportunity, Prosperity and Growth
GEORGE A. AkERLOfkoshland Professor of Economics, University of California, Berkeley and 2001 Nobel Laureate in Economics
ROGER C. ALTmANChairman, Evercore Partners
HOwARD P. BERkOwITzmanaging Director, BlackRock Chief Executive Officer, BlackRock HPB management
ALAN S. BLINDERGordon S. Rentschler memorial Professor of Economics, Princeton University
TImOTHY C. COLLINSSenior managing Director and Chief Executive Officer, Ripplewood Holdings, LLC
ROBERT E. CUmBYProfessor of Economics, School of foreign Service, Georgetown University
PETER A. DIAmONDInstitute Professor, massachusetts Institute of Technology
JOHN DOERRPartner, kleiner Perkins Caufield & Byers
CHRISTOPHER EDLEY, JR.Dean and Professor, Boalt School of Law – University of California, Berkeley
BLAIR w. EffRONPartner, Centerview Partners, LLC
HAROLD fORDVice Chairman, merrill Lynch
mARk T. GALLOGLYmanaging Principal, Centerbridge Partners
mICHAEL D. GRANOffChief Executive Officer, Pomona Capital
GLENN H. HUTCHINSfounder and managing Director, Silver Lake Partners
JAmES A. JOHNSONVice Chairman, Perseus, LLC and former Chair, Brookings Board of Trustees
NANCY kILLEfERSenior Director, mckinsey & Co.
Advisory CounCil
JACOB J. LEwmanaging Director and Chief Operating Officer, Citigroup Global wealth management
ERIC mINDICHChief Executive Officer, Eton Park Capital management
SUzANNE NORA JOHNSONSenior Director and former Vice Chairman The Goldman Sachs Group, Inc.
RICHARD PERRYChief Executive Officer, Perry Capital
STEVEN RATTNERmanaging Principal, Quadrangle Group, LLC
ROBERT REISCHAUERPresident, Urban Institute
ALICE m. RIVLINSenior fellow, The Brookings Institution and Director of the Brookings washington Research Program
CECILIA E. ROUSEProfessor of Economics and Public Affairs, Princeton University
ROBERT E. RUBINChairman, Citigroup
RALPH L. SCHLOSSTEINPresident, BlackRock, Inc.
GENE SPERLINGSenior fellow for Economic Policy, Center for American Progress
THOmAS f. STEYERSenior managing Partner, farallon Capital management
LAwRENCE H. SUmmERSCharles w. Eliot University Professor, Harvard University
LAURA D’ANDREA TYSONProfessor, Haas School of Business, University of California, Berkeley
wILLIAm A. VON mUEffLINGPresident and CIO, Cantillon Capital management, LLC
DANIEL B. zwIRNmanaging Partner, D.B. zwirn & Co.
DOUGLAS w. ELmENDORfDirector

The Brookings Institution1775 Massachusetts Ave., NW, Washington, DC 20036(202) 797-6279 n www.hamiltonproject.org
The Brookings Institution
HAMILTONTHE
PROJECT
Advancing Opportunity, Prosperity and Growth