Embed Size (px)
Citation preview

THE GLOBAL WARMING-EXTREME WEATHER LINK
A REVIEW OF THE STATE OF SCIENCE
Madhav L. Khandekar
Foreword by Professor Brian R. Pratt
The Global Warming Policy FoundationGWPF Report 11

2
GWPF REPORTS
Views expressed in the publications of the Global Warming Policy Foundation are those of the authors, not those of the GWPF, its Trustees, its Academic Advisory Council members or its Directors.
THE GLOBAL WARMING POLICY FOUNDATION
DirectorDr Benny Peiser
Assistant Director Philipp Mueller
BOARD OF TRUSTEES
Lord Lawson (Chairman)Lord DonoughueLord FellowesRt Rev Peter ForsterBishop of ChesterSir Martin Jacomb
ACADEMIC ADVISORY COUNCIL
Professor David Henderson (Chairman) Adrian Berry Sir Samuel BrittanSir Ian Byatt Professor Robert CarterProfessor Vincent CourtillotProfessor Freeman DysonChristian GerondeauDr Indur GoklanyProfessor William HapperProfessor Terence KealeyProfessor Anthony KellyProfessor Deepak Lal
Baroness NicholsonLord TurnbullSir James Spooner
Professor Richard LindzenProfessor Ross McKitrickProfessor Robert MendelsohnProfessor Sir Alan PeacockProfessor Ian PlimerProfessor Paul ReiterDr Matt Ridley Sir Alan RudgeProfessor Nir ShavivProfessor Philip StottProfessor Henrik SvensmarkProfessor Richard TolDr David Whitehouse

The Global Warming-Extreme Weather Link
The Global Warming-Extreme Weather Link
A Review Of The State Of Science
Madhav L. Khandekar
Foreword by Professor Brian R. Pratt
ISBN: 978-0-9573880-1-7©Copyright 2013The Global Warming Policy Foundation

Dr Madhav L. Khandekar Madhav Khandekar is a former research scientist from Environment Canada and was an Expert Reviewer for the IPCC (Intergovernmental Panel on Climate Change) 2007 climate change documents. He is a lead author of a chapter on extreme weather in the forthcoming report Climate Change Reconsidered II, published by Non-governmental International Panel on Climate Change in 2013.
Professor Brian R. PrattBrian Pratt is a senior professor in the Department of Geological Sciences at the University of Saskatchewan in Saskatoon, Canada. A well known sedimentologist and palaeontologist, he is a winner of the W. W. Hutchison Medal of the Geological Association of Canada, active in numerous learned societies, associate editor of several national and international journals, and is currently editor of a leading palaeontological journal.
Table of Contents
Table of contents 2About the author 2Foreword 3Summary 4Introduction 5Extreme weather: an integral part of the Earth’s climate 6The IPCC on extreme weather 7Recent extreme weather events 10Increasing cold weather extremes 15The reality of climate change 16Summary and concluding remarks 19Acknowlegements 21References 22Appendix: a list of notable extreme weather events during 1945-1977 26

3
The Global Warming-Extreme Weather Link
Foreword
As kids growing up in Canada the difference between weather and climate was well drummed into our heads. That weather patterns varied from year to year was no surprise, such that we knew that the rainiest July holiday ever or the freak snowstorm in June did not portend something larger at play. Chances were, summer next year was going to be gorgeous. The farmer’s almanac was just superstition: nobody could predict the weather a year in advance. Even so, some of us might have wondered if the skating rink did freeze over earlier or the snowdrifts were bigger when we were younger.
Fast forward to the fractious world of climate change today: anecdotal notions like these have been parlayed into facts. The chaotic nature of weather is funnelled into definitive support for one claim or another. Every typhoon or hurricane gets a personal name and automatic membership in the global warming fan club. Emphatic pronouncements and predictions – always dire – are made and repeated so often that folks can be forgiven for assuming them to be fact. Yet, much of what we hear and read so defies common sense we are left incredulous.
Climatology, or more broadly, climate science, is still supposed to be science: open to measurement and testing, free from bias in observation and interpretation, and anchored by an awareness of the limitations of what is known and understood. Climate models, like ecological models, are mathematical attempts to reduce complex natural systems to manageable and satisfying equations. While they may be clever, climate models should not be invested with authority by themselves, and nor should they contradict observational fact. Beyond that, no scientific discipline should form a political platform or underpin a faith. No scientific subject occupies a moral high ground that renders it immune to hard questions and healthy scepticism.
My own preoccupation with climate change is grounded in geology: determining the signature of weather and climate in the stratigraphic record. Geology is an historical science of what happened millions and billions of years ago – what we can call ‘deep time’ – and Mother Nature made sure that reconstructing Earth history is a lesson in humility. Still, rocks do show that Earth’s climate has always changed and natural processes were responsible. Proponents of anthropogenic climate change must muster incontrovertible facts founded upon what physics tells us about greenhouse gases, the role of other climate drivers and how they interact.
Many climate scientists and their supporters have insisted that ‘extreme weather events’ have been increasing in frequency and intensity since the Industrial Revolution, and especially over the past half-century. But is this really true? Retired Environment Canada scientist, meteorologist Dr Madhav Khandekar offers a dispassionate assessment of the factual evidence provided by observational data. It is therefore a welcome contribution and let us hope that it will help inform honest, rational discussion, thereby rescuing weather from the mire of misinformation and manipulation that assail it.
Brian R. Pratt, November 2013

4
Summary
The debate over a possible link between global warming and worldwide extreme weather continues unabated. The debate seems to get into high gear every time an extreme weather event such as a heatwave, flood or drought occurs over Europe or North America. TV and print media speculate about possible links to manmade global warming and weather and climate scientists issue dire warnings that such events will occur more frequently in future. Recent examples of this kind of hype were the landfall of hurricane Sandy on the east coast of the United States on 29–30 October 2012 and the landfall of typhoon Haiyan in the Philippines (8–9 November 2013). Most of the news media, while linking these tropical cyclones to human activity, made no attempt to make an analysis of past hurricanes, typhoons and other extreme weather events and their possible links to climate change, whether human-induced or natural.
In this report, a brief overview of global warming science is presented. This is followed by a discussion of the definition of extreme weather and its association with changes in large-scale atmosphere–ocean circulation patterns. Several recent extreme weather events are examined and discussed in the context of past climatology. A brief section is devoted to the increasing incidence of cold weather extremes, such as the recent severe winters in Europe, northern India and in parts of South America. Finally, the possible impact of the recent warming of the Earth’s climate on present and future extreme weather events is discussed.
5
The Global Warming-Extreme Weather Link
Introduction
Global warming is the increase of the Earth’s mean temperature due to human activity and in particular due to human emissions of carbon dioxide in the atmosphere. The present debate on global warming science may have begun with a landmark paper by Revelle and Suess (1956), which postulated that:
…humans are carrying out a large-scale geophysical experiment through world-wide industrial activity that could lead to build-up of atmospheric carbon dioxide greater than the rate of carbon dioxide production by volcanoes.
Revelle and Suess estimated the rate at which humans were increasing the levels of carbon dioxide in the atmosphere and expressed concern that this build-up could adversely impact the Earth’s climate in the future. Revelle, an eminent American geophysicist, was instrumental in establishing the first carbon dioxide measuring station at Mauna Loa in Hawaii in 1956. Another carbon dioxide measuring station was later established at Antarctica, and today we have several dozen around the world. Based on data from these stations, it is now well established that the atmospheric concentration of carbon dioxide has increased from about 330 ppmv (parts per million by volume) in 1956 to over 390 ppmv today. It must, however, be recognized that the Earth’s atmosphere consists mainly of nitrogen (~78%), oxygen (~21%) and argon (~0.93%), with carbon dioxide making up only about 0.03% of the total atmospheric gases. Furthermore, the total carbon dioxide exchange between the atmosphere and ocean is about 150 Gt (billions of tons) on an annual basis, while human emissions are estimated to be about 15–20 Gt per year, or about 10–15% of the total carbon dioxide exchange between atmosphere and ocean.
The paper by Revelle and Suess has led to a number of computer-based modelling studies in the last 30 years. These have attempted to simulate the warming of the Earth’s climate due to increasing concentrations of carbon dioxide, and many have suggested a mean temperature increase of 1.4–5.8°C by the end of 2100. A recent study by Knutti (2008) examined a suite of climate models and obtained a best estimate of 2.8°C, with a range of 1.7–4.4°C, for the mean temperature increase by the end of the twenty-first century. Many climate modellers now focus on the possible future warming of the climate for a doubling of carbon dioxide concentrations compared to preindustrial levels, this value being termed the ‘climate sensitivity’. The climate sensitivity obtained by most climate models is about 3°C or higher. However, some recent studies (Lindzen 2007; Schwartz 2007) have obtained values of just under 1°C, and Lindzen and Choi (2011) have documented how water vapour feedback in most climate models is inadequately treated, leading to higher estimates of sensitivity.
The present debate now hinges on the adoption of a greenhouse gas emission strategy that will keep temperature rises below 2°C, so as to avoid the adverse impacts of future climate change. Among these possible adverse impacts, according to the Intergovernmental Panel on Climate Change (IPCC; 2007) are more heatwaves, floods (due to more intense precipitation), droughts, more damaging hurricanes and tropical cyclones, escalating sea level rise and coastal erosion etc. The latest IPCC statement on
6
extreme weather, which is discussed in a later section, reiterates the conclusions, albeit with different confidence levels assigned to each.
In the following section, the mechanics of extreme weather events in the context of large-scale atmospheric flow are discussed in brief.
Extreme weather: an integral part of the Earth’s climate
It is important to realize at the outset that extreme weather events – heatwaves, droughts, floods (localized or larger scale), rainstorms, tropical cyclone landfalls and so on – are an integral part of the Earth’s climate system. Throughout the recorded history of the Earth’s climate, extreme weather events have always occurred, the result of large-scale atmosphere–ocean circulation patterns and their complex interaction with local weather and climate elements. As an example, the El Niño–Southern Oscillation (ENSO) phenomenon in the equatorial eastern Pacific Ocean has been linked with global weather and climate anomalies (Kiladis and Diaz 1989; Ropelewski and Halpert 1989). Such weather and climate anomalies can lead to an extreme weather event, depending on how the ENSO phase evolves over the equatorial Pacific. For example, a moderate-to-strong El Niño event leads to a drought in the Indian summer monsoon season (Khandekar and Neralla 1984), while a strong La Niña (the inverse of El Niño) usually produces good monsoon rains. A strong La Niña also brings colder winters over western Canada (Shabbar and Khandekar 1996).
Even without an (extreme) ENSO phase, large-scale atmosphere–ocean patterns can and do produce strong interactions between high-latitude colder air and low-latitude warmer air, resulting in a commonly observed mid-latitude weather system called a ‘frontal cyclone’. Depending on how they evolve, these cyclones produce a variety of extreme weather events: heavy rains, snow and extreme cold, coastal storms and associated strong coastal winds and so on. Standard textbooks in meteorology provide a number of examples of extreme weather events associated with frontal cyclones. For example, Petterssen (1958) gives the example of the weather in North America on 20 December 1955, with extreme cold conditions over the Midwest and cold Arctic air carried into many southeastern US states as well. The book by Palmen and Newton (1969) provides an example of an ‘upper-air cut-off low’, which moved westwards from Siberia and produced extreme cold weather over central and northern Europe from 8–15 November 1959. Such an atmospheric circulation system can also develop in the western US, producing extreme weather events such as sustained cold spells in the Midwest and/or heavy rains in the north-eastern states. The textbook by Battan (1980) provides an interesting set of data on the number of deaths due to hurricane landfalls, tornado outbreaks and lightning strikes in the coterminous USA. This dataset is presented below in Table 1. Of particular interest is the number of deaths due to lightning strikes in the USA: about 200 per year. Surprisingly, this number is larger than the combined deaths due to hurricane landfalls and tornado outbreaks over the conterminous USA.

7
The Global Warming-Extreme Weather Link
Table1. Storm deaths and damage in the USA, 1959–75.
Type of storm Approx. annual deaths
Approx. property damage $m
Lightning 198 200Tornado 136 300Hurricane 52 500
Source: Battan 1980.
The IPCC on extreme weather
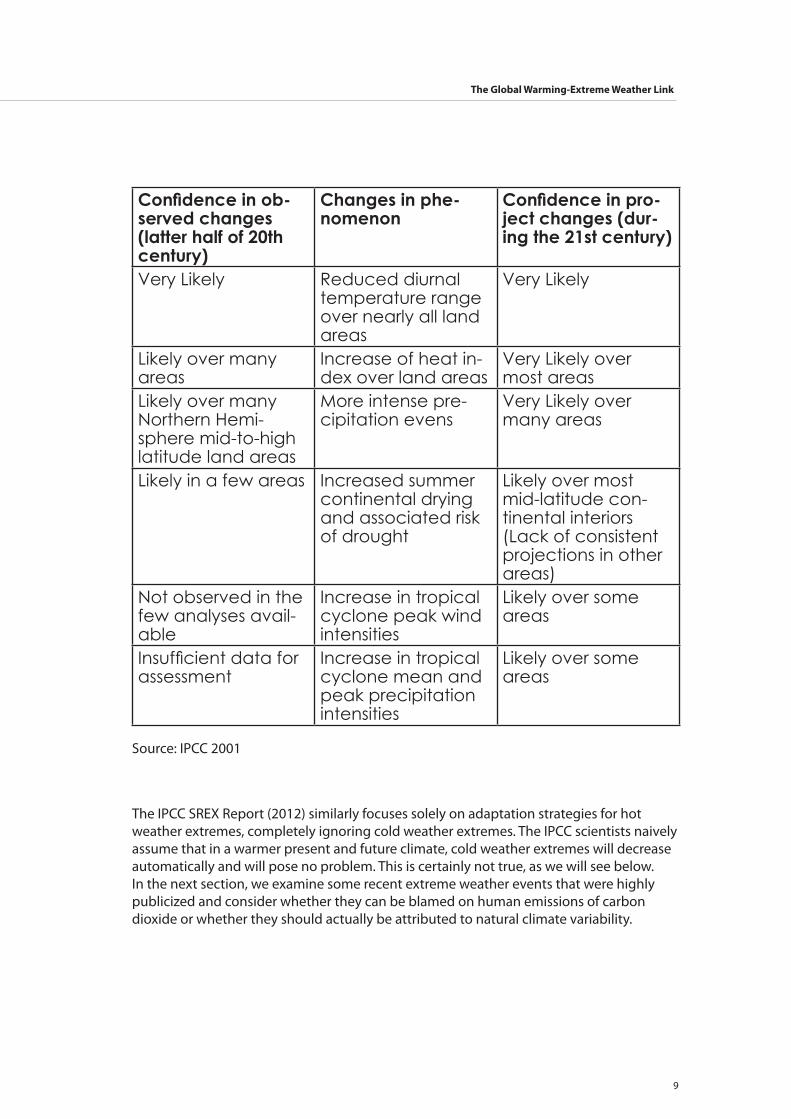
The IPCC is a body of scientists and environmentalists that was established by the United Nations in 1988 to provide periodic assessments of climate change and its possible (adverse) impacts on various regions of the Earth. In its first comprehensive report (IPCC 1996), a reference to concentrations of greenhouse gases in the atmosphere and in particular increasing concentrations of carbon dioxide was made, with a link to global mean temperature using a now somewhat notorious phrase: ‘the balance of evidence suggests a discernible human influence on Earth’s climate’. The Third Assessment Report (IPCC 2001) explicitly included a table of extreme weather events that it said were impacted by climate change. This is reproduced in Table 2. Among the extreme weather events identified by the IPCC as being affected by climate change are heatwaves, rainstorms (accompanied by localized or regional flooding), droughts, hurricanes and tropical cyclones. The IPCC also categorically stated that there would be ‘fewer frost days and colder nights’ in a warmer future climate.
The IPCC does not provide any physical rationale for the alleged increased incidence of these extreme weather events, but a simple (perhaps deceptively so) explanation is sometimes given by the IPCC and its supporters: a warmer climate will hold more atmospheric moisture and this can lead to enhanced thunderstorms and/or rainstorms in some areas while producing dryer areas and hot weather elsewhere. This simple statement has now been morphed into a hypothesis that ‘a warmer future climate will lead to increased extreme weather events in future’.
The IPCC documents do not provide a long-term climatology of extreme weather events, nor do they make any assessment of past extreme weather events. The latest IPCC (2013) ‘Summary for Policymakers’ (SPM), which was released in Stockholm Sweden on 26 September 2013, provides an assessment and update on extreme weather, since the last (IPCC 2007) assessment and the Special Report SREX (2012) on ‘Managing the risks of extreme events and disasters to advance climate change adaptation’. The SPM makes only general statements such as ‘the number of cold days and nights has decreased since 1950 and heat waves have increased in parts of Europe, Asia and Australia’. Chapter 2 of

8
the Working Group I (WGI) report makes more specific statements, such as the ‘number of heavy precipitation events over land has increased since 1950’ (high confidence), while assessment of observed trend in drought (on global scale) has ‘low confidence’. Also long-term change in tropical cyclone activity is now assessed with only ‘low confidence’. This latest assessment on extreme weather is a significant departure from its previous (AR4) assessment where ‘higher confidence’ was attributed to an increasing trend in tropical cyclone activity and increasing global-scale drought (see Table 2 below from IPCC 2001). Elsewhere in Chapter 2 are general statements on decreasing snowfall amounts over land, fewer frost days and melting of Arctic sea ice and the cryosphere. The IPCC continues its theme of a warmer present and future climate ushering more hot weather extremes.
The reality of climate change, as we shall discuss below, is that there have been increasing cold weather extremes in recent years, which have been totally ignored by the IPCC and its adherents. Chapter 2 of the IPCC WGI (AR5) entitled: ‘Observations: atmosphere and surface’, makes no mention of cold weather extremes of recent years. There have, however, been news reports of hundreds of deaths due to extreme cold weather in central and eastern Europe, northern India and parts of South America in the last six years. Regional as well as international news media (TV, newspapers, internet blogs) have reported cold weather extremes in various parts of the world. Also, several peer-reviewed papers on the increasing severity of cold weather extremes over Europe and elsewhere have also appeared in the literature in the last few years. None of these is mentioned anywhere, either in the SPM-AR5 or in Chapter 2 of the WGI. The IPCC scientists, while sifting through hundreds of peer-reviewed papers, appear to be completely oblivious of the evidence of climate change.
Table 2. Estimates of confidence in observed and projected changes in extreme weather and extreme climate events (IPCC 2001).
Confidence in ob-served changes (latter half of 20th century)
Changes in phe-nomenon
Confidence in pro-ject changes (dur-ing the 21st century)
Likely (66-90% chance)
Higher maximum temperatures and more hot days over nearly all land areas
Very Likely
Very Likely (90-99%) Higher minimum temperatures, fewer cold days and frost over nearly all land areas
Very Likely
9
The Global Warming-Extreme Weather Link
Confidence in ob-served changes (latter half of 20th century)
Changes in phe-nomenon
Confidence in pro-ject changes (dur-ing the 21st century)
Very Likely Reduced diurnal temperature range over nearly all land areas
Very Likely
Likely over many areas
Increase of heat in-dex over land areas
Very Likely over most areas
Likely over many Northern Hemi-sphere mid-to-high latitude land areas
More intense pre-cipitation evens
Very Likely over many areas
Likely in a few areas Increased summer continental drying and associated risk of drought
Likely over most mid-latitude con-tinental interiors (Lack of consistent projections in other areas)
Not observed in the few analyses avail-able
Increase in tropical cyclone peak wind intensities
Likely over some areas
Insufficient data for assessment
Increase in tropical cyclone mean and peak precipitation intensities
Likely over some areas
Source: IPCC 2001
The IPCC SREX Report (2012) similarly focuses solely on adaptation strategies for hot weather extremes, completely ignoring cold weather extremes. The IPCC scientists naively assume that in a warmer present and future climate, cold weather extremes will decrease automatically and will pose no problem. This is certainly not true, as we will see below. In the next section, we examine some recent extreme weather events that were highly publicized and consider whether they can be blamed on human emissions of carbon dioxide or whether they should actually be attributed to natural climate variability.
10
Recent extreme weather events
Heatwave 2012, US Midwest
In the central USA, the summer of 2012 saw a prolonged heatwave accompanied by an exceptionally dry summer, which led to a sharp decline in corn yield. This decline led to increases in food prices in many parts of the world. Much of the media (in the USA, Canada and elsewhere) carried articles about the extreme weather and its alleged links to warming of the climate due to atmospheric carbon dioxide. Some articles went even further, suggesting that ‘such extreme weather events in future could lead to reduced grain yield and would adversely impact world food supply’. The main theme of many reports was that ‘extreme weather has now become a norm’, an idea that was echoed by Connie Hedegaard, the Climate Commissioner of the European Union, in an article she wrote for European Voice on 11 September 2012, which was entitled: ‘Weather extremes: the new normal’.
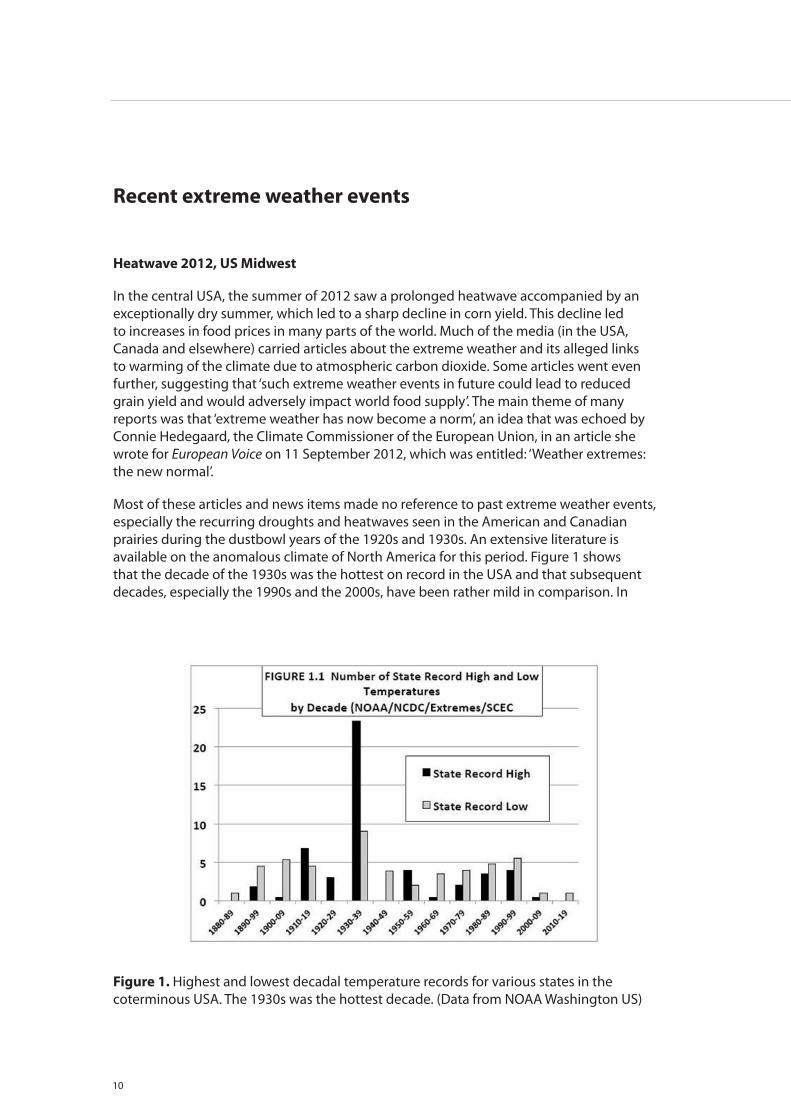
Most of these articles and news items made no reference to past extreme weather events, especially the recurring droughts and heatwaves seen in the American and Canadian prairies during the dustbowl years of the 1920s and 1930s. An extensive literature is available on the anomalous climate of North America for this period. Figure 1 shows that the decade of the 1930s was the hottest on record in the USA and that subsequent decades, especially the 1990s and the 2000s, have been rather mild in comparison. In
Figure 1. Highest and lowest decadal temperature records for various states in the coterminous USA. The 1930s was the hottest decade. (Data from NOAA Washington US)

11
The Global Warming-Extreme Weather Link
Canada, the hottest temperature on record (at 45°C) was on 5 July 1937 on the Canadian prairies. The deadliest heatwave in Canada took place during the period 5–12 July 1936, when the city of Toronto recorded a maximum temperature of 41°C for three days in a row and over 1000 people died as a result in central Canada and southern Ontario (Khandekar 2002). The North American heatwave of summer 2012 was therefore by no means unprecedented. Moreover, the occurrence of heatwaves and droughts in 1952–54 and 1980 (see Namias 1954, 1982) suggests that such extreme heatwaves in the US Midwestern states and the American–Canadian prairies are not uncommon at all.
Summer 2010: Pakistan floods and Russian heatwave
The Pakistan floods and Russian heatwave during the summer of 2010 captured newspaper headlines for several days. The impacts of these two events were tragic, with over 1500 people dying in flood waters in Pakistan and over 50,000 in the Russian heatwave, which was centred on Moscow and its vicinity. Were these two events related? Some news articles attempted to link them, but a close analysis shows that they were completely independent of each other.
Were the two events linked to human emissions of carbon dioxide? Let us examine this question as follows:
1. The floods in Pakistan were associated with a vigorous summer 2010 monsoon over the Indian subcontinent, which produced floods in parts of northwest India during late July and early August. A persistent low-pressure system developed over northwest India and brought additional moisture into Pakistan by early August producing heavy rains and subsequent flooding of over 20% of Pakistan’s land area. According to Khandekar (2010):
…a rapid transition of the ENSO phase from El Niño to La Niña between spring and summer of 2010 appears to be the key element in triggering a vigorous monsoon of 2010 over the Indian subcontinent. The La Niña phase was responsible for enhanced convection over the Bay of Bengal, where several monsoon depressions were formed. These depressions, while traveling along the axis of monsoon trough, carried enough moisture into northwest India and Pakistan leading to extensive flooding.
2. The unusually hot summer of July 2010, especially in Moscow and its vicinity, was certainly an exceptional event and a number of peer-reviewed papers have analyzed the sequence of events that preceded it. According to Dole et al. (2011), the Russian heatwave was caused by ‘internal atmospheric dynamic processes that produced and maintained an intense and long-lived (atmospheric) blocking event’. Several recent papers have identified atmospheric blocking as a possible mechanism in producing extreme events (cold or warm) over Europe in particular. For more discussion on how atmospheric blocking could produce a hot summer or a cold winter over Europe, see the NIPCC website Climate Change Reconsidered and read the post ‘Extreme weather: the Russian heat wave’ dated 13 July 2011.

12
Summer 2003: the European heatwave
The summer of 2003 was exceptionally warm and dry over large parts of Europe and in particular over most of France, where there was significant mortality (mostly of elderly people) during July. This extreme weather event attracted a large number of newspaper reports as well as scientific commentaries and peer-reviewed studies (see for example Beniston and Diaz 2004; Stott et al. 2004). These studies explicitly linked the heatwave to increasing concentrations of carbon dioxide and further speculated that such heatwaves would become more frequent in future. This was the first time an extreme heatwave anywhere in the world was specifically linked to human activity. However, a recent paper has reached very different conclusions. Weisheimer et al. (2011) analyzed climate model simulations in an attempt to understand the predictability of dry hot summers over Europe and concluded that the dry soil conditions that had persisted throughout Europe for several months prior to summer 2003 were a key factor in triggering the exceptional heatwave. The authors discounted the possibility of carbon dioxide having had any effect.
Hurricanes
Hurricane Katrina (a category 5 hurricane, and the strongest in the last 25 years) killed over 1000 people and caused extensive damage to the US Gulf coast city of New Orleans on 30 August 2005. Prominent environmentalists and climate scientists blamed this tragedy on the warming of sea surface temperatures due to human activity (in particular, human emissions of carbon dioxide) and this leading to intensification of hurricanes and tropical cyclones. Coincidently, scientific papers published around the same time (Emanuel 2005, Webster 2005) suggested just such a linkage, adding fuel to the suggestion that hurricane and tropical cyclones were indeed becoming stronger and that they could in future have devastating impacts on humanity. A reality check, however, shows that in recent years, worldwide hurricane and tropical cyclone numbers have diminished and fewer landfalls have occurred. For the US east coast, there has not been a single landfall of a hurricane of category 3 or higher since Katrina in August 2005. It should be noted here that Sandy, which caused extensive damage to New York and New Jersey on 29–30 October 2012, was actually only a category 1 storm when it made landfall. A recent study by Maue (2011) shows that tropical cyclone activity as measured by the accumulated cyclone energy has not increased and is at a low value at present (see Figure 2). Another study by Chan (2008) documents decadal variations of intense typhoons in the western North Pacific. Chan’s study discounts the possibility of rising surface or ocean temperatures affecting the intensity of typhoons. Moreover, an earlier study by Landsea et al. (2006) had questioned whether is it possible to detect trends in extreme tropical cyclones at all.
When all the latest studies are carefully analyzed, the view that emerges is that hurricanes and tropical cyclones have decadal variability in frequency and strength and that they do not appear to be influenced by global warming or climate change. It is of interest to note the reaction to typhoon Haiyan, which slammed into the Philippines on 8–9 November 2013, killing over 2000 people (per the latest reports) and inflicting extensive damage to property and infrastructure. Once again, the news media linked this event to climate change and decried wealthy nations’ lack of funding for tackling global warming and

13
The Global Warming-Extreme Weather Link
climate disasters. Even some climate scientists have attempted to make a link between climate and extreme weather. In reality, typhoon Haiyan was a category 4 storm, with maximum sustained wind speeds of 147 mph (~128 knots, or ~65 m/s). Many typhoons and tropical cyclones in the past have exhibited faster wind speeds. For example, typhoon Tip, which made landfall in Japan on 19-20 October 1979, was estimated to have maximum sustained wind speeds of about 85 m/s or 191 mph (Dunnavan and Diercks 1980). As for human fatalities, a tropical cyclone in the Bay of Bengal which struck Bangladesh on 12–13 November 1970 killed over 250,000 people, the largest death toll for a single weather disaster (Murty 1984). Finally, the current (June–November 2013) hurricane season in the North Atlantic has been one of least active on record, according to a recent commentary by Ryan Maue, a hurricane specialist in the US.
Figure 2a and 2b. Variation of accumalated cyclone energy for the period 1972 - 2011; (a) global and (b) hemisperic. (Units: 104 knots2; from Maue 2011).
Tornadoes
The conterminous US records the largest number of tornadoes anywhere in the world; about 1200–1500 per year. Tornadoes are an intense small-scale weather phenomenon, and they have immense destructive power. In 2011, the US south-eastern states witnessed several instances of intense tornado outbreaks, which killed several dozen people and

14
inflicted heavy damage on residential and business property. Several news articles were published linking tornadoes to global warming and climate change.
Among the scientific papers linking US tornado activity to global warming is a recent article by Diffenbaugh et al. (2008) entitled ‘Does global warming influence tornado activity?’ The article suggests that tornado count has increased steadily over the past half century, but that it is difficult to determine if there is a robust trend: in the past, many tornadoes were completely missed due to the lack of an adequate observational network. According to Balling and Cervany (2003), however, the tornado count for severe tornadoes (F3–F5 on the Fujita scale) has declined in recent years. As to the devastating impact of tornadoes on residential and business property, a recent paper by Simmons et al. (2012) concludes that ‘when normalized for inflation, GDP (gross domestic product) and societal changes, the tornado damage in the US has actually decreased in recent years’.
It is instructive to note here that tornadoes are intimately linked to severe thunderstorms in the US. Many excellent studies on thunderstorm climatology (e.g. Changnon 2001) have used over 100 years of data to document that ‘thunderstorms and related activity in the US peaked during the 1920s and 1930s and since then have declined in the late 1990s’. Another painstaking study extracts useful data from several thousand prairie-farm newsletters and reconstructs windstorm activity from 1880 to 1995 for the Canadian prairies (Hage 2003). The study (by Hage) concluded that ‘severe windstorms and associated thunderstorm activity peaked during the early part of the 20th century and has since then declined steadily’.
Floods
Extreme precipitation and floods are another area that is being hotly debated at present. In a short but comprehensive paper, Kunkel (2003) analyzed extreme precipitation data for the US and Canada and found that in the coterminous USA the extreme precipitation index (EPI) for 1-day duration (with one-year return period) has increased in recent years. Kunkel’s study also documents substantial variability in EPI over decadal timescales, with the USA having experienced a similar increase at the beginning of the twentieth century, thus implying a prominent role for natural climate variability. Interestingly, a similar study (Zhang et al. 2001) finds no long-term trend in the frequency or intensity of extreme precipitation events over Canada during the twentieth century. A recent (February 2011) issue of the journal Nature Climate Change had an editorial on the topic ‘Human influence on rainfall’, citing several papers that suggested a strong human influence (via increased concentrations of atmospheric carbon dioxide) on recent rainfall extremes in the UK. A careful analysis of these papers, however, reveals that there is no consistent trend in extreme precipitation in any region of the UK. Two recent papers on extreme precipitation – one for the UK (Rodda et al. 2010) and the other for the Zhujiang river basin in South China (Gemmer et al. 2011) – use daily precipitation data for over 100 rain-gauge stations in the UK and China over the period 1960–2006. Both papers conclude that extreme precipitation trends are not consistent everywhere and that natural variability can explain most of the observed trends. The study by Rodda et al. concludes that ‘Ascribing changes in extreme rainfall in the UK to human-induced climate change remains problematical’.

15
The Global Warming-Extreme Weather Link
For the monsoon climate over India, a paper by Kishtawal et al. (2010) uses over 100 years of excellent rainfall data and concludes that ‘increase in the heavy rainfall climatology over the Indian monsoon region is a signature of urban-induced rainfall anomaly’. In summary, the link between extreme precipitation and human emissions of carbon dioxide remains unsubstantiated at this point in time. For additional comments see the NIPCC post ‘Extreme precipitation over UK and Zhujiang river basin’, dated 18 May 2011.
We conclude with some remarks on the possibility of droughts increasing in a warmer future climate, as suggested in the latest paper by Dai (2012). Dai analyzes historical records of precipitation, streamflow and drought indices since about 1950 and makes a comprehensive analysis of model-simulated soil moisture, drought indices and ‘precipitation–evaporation’ differences, concluding that ‘observed global aridity changes up to 2010 (since 1950) are consistent with model predictions, which suggest severe and widespread droughts in the next 30–90 years over many land areas resulting from either decreased precipitation and/or increased evaporation’. Dai’s projection of exacerbation of droughts in a warmer future climate appears at odds with many recent papers, which generally predict more precipitation in a warmer future climate. Moreover, the most recent paper (Sheffield et al. 2012) suggests that worldwide drought areas have not increased in the last 60 years. The latest IPCC assessment, ‘linking observed trend in global-scale drought to warming of the climate with low confidence’, seems to corroborate the study by Sheffield et al. on global drought.
Elsewhere, summer monsoon droughts and floods over the Indian subcontinent have always occurred irregularly, as revealed by the excellent dataset, close to 200 years long, published by Sonetakke et al. (2008); these droughts and floods have not been impacted by global warming up to now (Kripalani et al. 2003). Some past megadroughts (e.g. in 1876–77) over India and Indonesia have been linked to strong El Niño events in the equatorial Pacific (Cook et al. 2010). Also droughts and floods over parts of South Africa and in south-eastern Australia are linked to the ENSO and Pacific Decadal Oscillation (PDO) phases (Fauchereau et al. 2003: Cai and van Rensch 2012).
Increasing cold weather extremes
Have cold weather extremes been on the rise in recent years? A quick survey of weather extremes since the millennium seems to suggest this may be the ‘new’ reality of climate change. The northern hemisphere has witnessed four severe winters (2002/03, 2005/06, 2007/08, 2009/10) since 2000, with the European continent bearing the brunt of the cold weather. The severity of winter 2002/03 was felt all the way to south Asia, where hundreds of people in Vietnam and Bangladesh were reported to have died due to exposure to colder weather (due to lack of adequate heating in residential houses). The winter of 2011/12 was quite severe, especially the month of February 2012 when minimum temperatures in parts of eastern Europe plunged to −40°C in some locales, leading to several hundred deaths. The winter of 2012/13 was also colder than normal,

16
with March 2013 setting record-breaking low temperatures in the UK, Berlin and parts of eastern Germany. Over North America, the winters of 2002/03, 2007/08 and 2009/10 were significantly colder and snowier than normal and were linked to an extreme negative phase of the North Atlantic Oscillation, a slow-varying large-scale atmospheric flow pattern (Seager et al. 2010). Winter severity has also increased in northern India in recent years, where several hundred deaths (mostly of elderly people living in houses with no heat or insulation) have been reported in the last five years.
Several papers published in the last three years (Benestad 2010; Cattiaux et al. 2010; Lockwood et al. 2010) have linked the cold European winters of the last ten years to low solar activity (see NIPCC post on ‘Extreme cold winters over Europe’, dated 12 February 2012). Many solar scientists now suggest that winters in Europe could become even colder, as the sun enters a grand minimum in the next few years.
Besides Europe and North America, the entire continent of South America has seen colder winters over the last five years. The winters of 2007 (July in particular) and 2010 (June–July) were significantly colder than normal and several dozen deaths were reported in Argentina and Chile. Some locales in Argentina recorded low temperatures of −25°C, and in July 2007 Buenos Aires recorded its first snowfall since 1918. The most recent winter (July 2013) saw snowfall at several dozen locales in Argentina, Chile and parts of southern Brazil (see Khandekar 2010, for a list of additional cold weather extremes).
It is of interest to note here the lack of news items on cold weather extremes in the media. Most of the media seem to be obsessed with extremes of heat, completely ignoring cold weather extremes, despite these apparently being on the rise and despite the IPCC’s science failing to offer an explanation for them. In fact, the IPCC extreme weather events table projects ‘fewer cold days and frost in future’. It is also of interest to note here that most climate scientists and advocates of the global warming hypothesis have ignored the ‘cold’ reality of present climate change. The IPCC (2007) has discussed in some detail the European heatwave of summer 2003, but made no mention of the severely cold winter of 2002/03 and the deaths it caused in south Asia. The latest IPCC SPM-AR5 released in Stockholm in September 2013 once again fails to mention increasing cold weather extremes of recent years.
The reality of climate change
It is now accepted by most scientists that the Earth’s climate has changed and continues to change. What is being debated at present is whether the observed climate change is due primarily to human emissions of carbon dioxide or to natural climate variability. Advocates of human-induced climate change point to the ongoing warming of the Earth’s climate, as evidenced by the mean temperature trend. However, the most recent temperature trend released by the UK Met Office shows a warming pause over the last 16 years or so (see Figure 3 on next page). In an accompanying statement, the Met Office

17
The Global Warming-Extreme Weather Link
notes that since about mid-1997, the mean temperature trend shows a warming of only about 0.03°C per decade.
Figure 3. Earth’s mean temperature trend 1997-2012. Data from UK Met Office.
If there has been a warming pause for 16 years, as suggested by the above graph, how can recent extreme weather events be attributed to warming of the Earth’s climate? Could these extreme weather events be attributed to natural variability of the climate, as many scientists are now suggesting (e.g. Deser et al. 2012)? Furthermore, there has been almost no detailed analysis of extreme weather events in the period from 1945 to 1977, when the Earth’s mean temperature was declining (see Figure 4). Extreme weather events (warm as well as cold) continued to occur during this time: a list is provided in the Appendix.

18
Figure 4. Global mean temperature trend 1860–2005 (IPCC 2007). Note the declining mean temperature trend during 1945–1977.
The most severe and tragic of these was the landfall of a tropical cyclone in Bangladesh (the former East Pakistan), on 12–13 November 1970, which killed an estimated 250,000 people. This is the largest number of deaths in a single weather disaster. Among some of the other notable extreme weather events of the 1945–77 were:
• extensive country-wide flooding leading to several hundred deaths during the 1961 summer monsoon over India and vicinity
• exceptionally cold winter over most of Europe, 1962–63;
• Hurricane Camille, a powerful (category 4 or 5) hurricane, which struck the US Gulf coast in July 1969, killing over 250 people
• The largest one-day outbreak of tornadoes in the US Midwest on 3 April 1974.
There was hardly any discussion of these and other extreme weather events and their possible links to climate change at the time, either in the media or in the scientific literature.
Thus, it can be concluded that when the Earth’s mean temperature was declining during the period 1945–77, extreme weather events occurred with about the same frequency as today. It is of interest to note here that a recent report on extreme climate prepared by the World Meteorological Organization (WMO 2013) suggests that the decade 2001–2010 was the hottest since 1880 and that this led to extreme weather events such as the 2003 European heatwave, the 2010 Moscow heatwave, the 2010 Pakistan floods and Hurricane Katrina. Such a conclusion is rather simplistic, as it does not explain why extreme weather events such as those listed in the Appendix occurred when the Earth’s mean temperature was declining. Moreover, the decade 2001–2010 also witnessed several cold weather extremes, as described above. The WMO report does mention some of these, but makes no attempt to explain why cold weather extremes have increased since the start of the new millennium. It also makes no reference to the UK Met Office’s latest mean

19
The Global Warming-Extreme Weather Link
temperature trend (Figure 3), which shows a temperature pause for the past 16 years or so.
The WMO report does suggest a need to examine longer-term extreme weather data to determine if climate change or natural variability is the primary driving mechanism for recent weather extremes. As pointed out earlier (Deser et al. 2012), there is an urgent need to examine the role of natural variability in driving present climate change. Future research efforts must focus on this important issue.
Summary and concluding remarks
The discussion above allows us to summarize several points as follows:
• Extreme weather events are an inherent aspect of the Earth’s climate system.
• Extreme weather events have occurred throughout the recorded history of the Earth’s climate.
• The Earth’s climate warmed quickly during the first half of the twentieth century. In North America, the decades of 1920s and 1930s, known as the dustbowl years, witnessed extremes of climate, with recurring droughts and heatwaves.
• During the period 1945–1977 when the mean temperature of the Earth declined by about 0.25°C, there were a number of notable (and tragic) extreme weather events. Most climate scientists attributed these extreme weather events to natural climate variability.
• Many climate scientists and environmentalists have attributed recent extreme weather events to the warming of the Earth’s climate. However, this attribution is not substantiated at this point in time. A careful assessment of many well-publicized extreme weather events of the last ten years suggests that they are due to natural climate variability.
• Hurricanes and tropical storms do not show increasing trends in frequency or in intensity.
• When closely examined there appears to be no increase in extreme weather events in recent years compared to the period 1945–77, when the Earth’s mean temperature was declining. The global warming/extreme weather link is more a perception than reality (Khandekar et al. 2005). The purported warming/extreme weather link has been fostered by increased and uncritical media attention to recent extreme weather events. The latest IPCC documents appear to de-emphasize the warming/extreme weather link by suggesting ‘low confidence’ in linking some of the events to recent warming of the climate.
20
• Cold weather extremes have definitely increased in recent years; for example, the severe winters in Europe (2012/13, 2011/12, 2009/10) and North America (2012/13, 2007/08). There have also been colder winters in parts of Asia (2012/13, 2002/03) and South America (2007, 2010 and 2013).
• The Earth’s climate may witness cold as well as warm weather extremes in future (between now and 2025).
The best way to cope with present and future extreme weather events is to develop improved seasonal (long-range) climate forecasting capability, so as to minimize any adverse impacts of such events. A recent report (Goklany 2011) documents how human fatalities from extreme weather have declined significantly during the global warming era of the twentieth century. The report points out that improved food productivity and increased wealth in developing nations has enabled these countries to cope with such extreme weather events and to reduce damage to property and the loss of human life.
A final comment: global warming and extreme weather pose no threat to humanity, either at present or in the next ten to twenty-five years.

21
The Global Warming-Extreme Weather Link
Acknowledgements
It is a pleasure to express my appreciation to Dr Benny Peiser of the GWPF for his invitation to prepare this report and his encouragement along the way. Special thanks to Andrew Montford (UK) for his careful editing of the manuscript and to Professor Roger Pielke Sr (USA) for his useful suggestions. Thanks are also due to my wife Shalan for her help with extraction of the figures.

22
References
Balling RG and RS Cerveny (2003). Compilation and discussion of trends in severe storms in the United States: popular perception vs climate reality. Natural Hazards; 29: 103–112.
Batten LJ (1979). Fundamentals of Meteorology. Prentice Hall.
Benestad RE (2010). Low solar activity is blamed for winter chill over Europe. Environmental Research Letters 5 doi:10.1088/1748-9326/5/2/021001.
Beniston M and HF Diaz (2004). The 2003 heatwave as an example of summers in greenhouse climate? Observations and climate model simulations for Basel, Switzerland. Global and Planetary Change; 44: 73–81.
Cattiaux J, R Vautard, C Cassou, P Yiou, V Masson-Delmotte and F Codron (2010). Winter 2010 in Europe; a cold extreme in a warming climate. Geophysical Research Letters, 37 L20704 doi:10.1029/2010GL044613.
Chan JCL (2008). Decadal variations of intense typhoon occurrences in the western North Pacific. Proc R Soc Series A; 464: 249–272.
Changnon SA (2001). Thunderstorms Across the Nation: An Atlas of Storms, Hail and their Damages in the 20th Century. Diane Pub Co.
Cook ER et al. (2010). Asian monsoon failure and mega-droughts during the last millennium. Science; 328: 486–489.
Dai A (2012). Increasing drought under global warming in observations and models. Nature Climate Change, doi:10.1038/NCLIMATE1633 p.1-7
Deser C et al. (2012). Communication of the role of natural variability in future North American climate. Nature Climate Change; 2: 775–779.
Diffenbaugh NS, RJ Trapp and H Brooks (2009). Does global warming influence tornado activity? EOS; 89: 553–554.
Dole R et al. (2011). Was there a basis for anticipating the 2010 Russian heatwave? Geophysical Research Letters 38 L06702 doi:10.1029/2010GL046582
Dunnavan GM and JW Diercks (1980): An analysis of super typhoon Tip (October 1979): Monthly Weather Review 108: 1915-1923
Emanuel KA (2005). Increasing destructiveness of tropical cyclones over the past 30 years. Nature; 436: 686–688.
Eos (2010): Vol. 91, No. 30 American Geophysical Union.
Fauchereau N et al. (2003). Rainfall variability and changes in South Africa during the 20th

23
The Global Warming-Extreme Weather Link
century in the global warming context. Natural Hazards; 29: 139–154.
Gemmer M et al. (2011). Trends in precipitation extremes in the Zhujiang River basin, south China. Journal of Climate; 24: 750–761.
Goklany IM (2011). Wealth and safety: the amazing decline in deaths from extreme weather in an era of global warming, 1900–2010. Reason Foundation.
Hage KD (2003).; On destructive Canadian prairie windstorms and severe winters. Natural Hazards; 29: 207–228
IPCC (2001). Climate Change 2001: The scientific basis. Contribution to the Working Group I to the Third Assessment Report of the Intergovernmental Panel on Climate Change. Cambridge University Press.
IPCC 2007: Climate Change 2007: The physical science basis. Contribution of the Working Group I to the Fourth Assessment Report of the Intergovernmental Panel on Climate Change, edited by S Solomon et al., Cambridge University Press.
Khandekar ML and VR Neralla (1984). On the relationship between the sea surface temperatures in equatorial Pacific and the Indian monsoon rainfall. Geophysical Research Letters; 11: 1137–1140.
Khandekar ML (2002). Trends and changes in extreme weather events: an assessment with a focus on Alberta and Canadian Prairies. Alberta Environment (Canada), October 2002, p. 56.
Khandekar ML, TS Murty and P Chittibabu (2005). The global warming debate: A review of the state of science. Pure and Applied Geophysics; 162: 1557–1586.
Khandekar ML (2010a). Pakistan floods 2010: climate change or natural variability? CMOS Bulletin 38, No.5 Canadian Meteorological and Oceanographic Society, p. 165–167.
Khandekar ML (2010b). Weather extremes of summer 2010: global warming or natural variability? Energy and Environment; 21: 1005–1010.
Kiladis GN and HF Diaz (1989). Global climatic anomalies associated with extremes of the Southern Oscillation. Journal of Climate; 2: 1069–1090.
Kishtawal CM et al. (2010). Urbanization signature in the observed heavy rainfall climatology over India. International Journal of Climatology; 30: 1908–1916.
Knutti R et al. (2008). A review of uncertainties in global temperature projections over the twenty-first century. Journal of Climate; 21: 2651–2663.
Kripalani RH et al. (2003). Indian monsoon variability in a global warming scenario. Natural Hazards; 29: 189–206.
Kunkel KE (2003). North American trends in extreme precipitation. Natural Hazards; 29: 291–305.

24
Landsea CW et al. (2006). Can we detect trends in extreme tropical cyclones? Science; 313: 452–454.
Lindzen RS (2007). Taking greenhouse warming seriously, Energy and Environment; 18: 937–950.
Lindzen RS and Y-S Choi (2011). On the observational determination of climate sensitivity and its implications. Asia-Pacific Journal of Atmospheric Sciences; 47: 377–390.
Lockwood M et al. (2010). Are cold winters in Europe associated with low solar activity? Environmental Research Letters 5 doi:10.1088/1748-9326/5/2/024001.
Maue RN (2011). Recent historically low global tropical cyclone activity. Geophysical Research Letters 38 L14803 doi:10.1029/2011GL047711.
Murty TS (1984). Storm surges: meteorological ocean tides. Dept of Fisheries and Oceans, Ottawa, Canada,1984, 897p.
Namias J (1955). Some meteorological aspects of droughts: with special reference to the summers of 1952–54 over the United States. Monthly Weather Review; September 1955: 199–205.
Namias J (1982). Anatomy of Great Plains protracted heatwaves (especially the 1980 US summer drought). Monthly Weather Review; 110: 824–838.
Palmen E and CW Newton (1969). Atmospheric Circulation Systems: Their Structure and Physical Interpretation. Academic Press International Geophysical Series; 13: 603.
Petterssen S (1958). Introduction to Meteorology. McGraw-Hill, p. 327.
Rodda JC et al. (2010). A comparative study of the magnitude, frequency and distribution of intense rainfall in the United Kingdom. International Journal of Climatology; 30: 1776–1783.
Schwartz SE (2007). Heat capacity, time constant and sensitivity of Earth’s climate system, Journal of Geophysical Research 112 D24S05 doi:10.1029/2007JD008746.
Seager R et al. (2010). Northern hemisphere winter snow anomalies: ENSO, NAO and the winter of 2009/10. Geophysical Research Letters 37, L14703 doi:10.1029/2010GL043830.
Shabbar A and ML Khandekar (1996). The impact of El Niño-Southern Oscillation on the temperature field over Canada. Atmosphere-Ocean; 34: 401–416.
Simmons KM, D Sutter and R Pielke Jr (2012). Normalized tornado damage in the United States: 1951–2011. Environmental Hazards (to be published)
Sontakke NA, N Singh and HN Singh (2008). Instrumental period rainfall series of the India region (AD 1813-2005): revised reconstruction, update and analysis. Holocene; 18: 1055–1066.
25
The Global Warming-Extreme Weather Link
Stott PA, DA Stone and MR Allen (2004). Human contribution to the European heatwave of 2003. Nature; 432: 610–614.
Webster PJ et al. (2005). Changes in tropical cyclone number, duration and intensity in a warming environment. Science; 309: 1844–1846.
Weisheimer A et al. (2011). On the predictability of the extreme summer 2003 over Europe. Geophysical Research Letters, 38 L05704 doi:10.1029/2010GL046455.
WMO (2013): The global climate 2001-2010: A decade of climate extremes. WMO No: 1119.
Wenju C and P van Rensch (2012). The 2011 southeast Queensland extreme summer rainfall: A confirmation of a negative Pacific Decadal Oscillation? Geophysical Research Letters 39 L08702 doi:10.1029/2011GL050820
Zhang X, WD Hogg and E Mekis (2001). Spatial and temporal characteristics of heavy precipitation events over Canada. Journal of Climate; 14: 1923–1936.

26
Appendix: A list of notable extreme weather events during 1945–1977
1952-54 An extended drought over conterminous USA, with Octo-ber 1952 the driest month ever recorded, according to the US Weather Bureau.
October 1954 Deadliest flood in Canada. Over 80 people drowned in southern Ontario, as a result of flooding due to the remnants of Hurricane Hazel
Summer 1961 Disastrous India-wide floods with heaviest ever summer (June-September) monsoon rains, 1961: several hundred people died; extensive flood-induced damages over many regions.
1962-63 Exceptionally cold winter over most of Europe; average mean daily temperature anomaly of −4.0°C over many European stations.
May 1968 A cyclone in the Bay of Ben-gal struck Myanmar (Burma) coast, killing over 1000; nearby Bangladesh recorded up to 5 m of storm surge with possible deaths
July 1969 Hurricane Camille (category 4 or 5) hit US Gulf coast killing over 250 people.
November 13, 1970 A tropical cyclone in the Bay of Bengal struck Bangladesh (former East Pakistan) killing over 250,000 people; most hu-man fatalities in single weather disaster ever (Murty 1984).

27
The Global Warming-Extreme Weather Link
Summer 1972 Severe drought in Indian sum-mer monsoon, June–Septem-ber, sharply reduced yields of rice and other crops; India had to import grain for several years afterwards.
April 1974 Largest outbreak of tornadoes in central US in one day (3 April 1974). Over 250 people died with property damage in ex-cess of $1 billion.
1976-1977 One of the most severe winters over US and Canada. Buffalo NY recorded several feet of snow! Also, southeastern US recorded extreme cold for sev-eral days in January 1977.
Many more extreme weather events were recorded world-wide during 1945–77.

28

29
The Global Warming-Extreme Weather LinkThe Really Inconvenient Truth

For further information about the GWPF or a print copy of this report contact:
The Global Warming Policy Foundation10 Upper Bank Street, London E14 5NPT 020 7006 5827M 07553 361717 www.thegwpf.org
Registered in England, no 6962749Registered with the Charity Commission, no 1131448
The Global Warming Policy Foundation is an all-party and non-party think tank and a registered educational charity which, while open-minded on the contested science of global warming, is deeply concerned about the costs and other implications of many of the policies currently being advocated.
Our main focus is to analyse global warming policies and their economic and other implications. Our aim is to provide the most robust and reliable economic analysis and advice.
Above all we seek to inform the media, politicians and the public, in a newsworthy way, on the subject in general and on the misinformation to which they are all too frequently being subjected at the present time.
The key to the success of the GWPF is the trust and credibility that we have earned in the eyes of a growing number of policy makers, journalists and the interested public.
The GWPF is funded overwhelmingly by voluntary donations from a number of private individuals and charitable trusts. In order to make clear its complete independence, it does not accept gifts from either energy companies or anyone with a significant interest in an energy company.
Views expressed in the publications of the Global Warming Policy Foundation are those of the author(s), not those of the GWPF, its Trustees, its Academic Advisory Council members or its Directors.
Published by the Global Warming Policy Foundation, November 2013.ISBN: 978-0-9573880-1-7