Embed Size (px)
Citation preview
Quantifying the extent of change in extreme weather events in
response to global warming
Travis Roger Moore
A Thesis
in
The department
of
Geography, Planning and Environment
Presented in Partial Fulfillment of the Requirements
for the Degree of Master of Science (Geography, Urban, and
Environmental Studies) at
Concordia University
Montreal, Quebec, Canada
August 2013
© Travis Roger Moore, 2013

CONCORDIA UNIVERSITY
School of Graduate Studies
This is to certify that the thesis prepared
By: Travis Roger Moore
Entitled: Quantifying the extent of change in extreme weather events in response to
global warming
and submitted in partial fulfillment of the requirements for the degree of
M.Sc. Geography, Urban & Environmental Studies
complies with the regulations of the University and meets the accepted standards with
respect to originality and quality.
Signed by the final examining committee:
Dr. Pascale Biron________ Chair
Dr. Hashem Akbari______ Examiner
Dr. Judith Patterson______ Examiner
Dr. Damon Matthews____ Supervisor
Approved by ____________________________________________
Chair of Department or Graduate Program Director
____________________________________________
Dean of Faculty
Date ____________________________________________
iii
Abstract
Quantifying the extent of change in extreme weather events in response to global
warming
Travis Moore
Weather extremes have been documented in the context of a warming climate in
association with increasing greenhouse gas concentrations. However, there remains much
uncertainty as to how these extreme events will respond to future climate warming. In
particular, climate modeling studies have predicted changes in the frequency and severity
of weather extremes, and the range of changes reported in the literature is very large, and
sometimes contradictory, as the nature of many extreme weather phenomena is not fully
understood. This uncertainty stems, in part, from the limited ability of coarse resolution
climate models to accurately measure and simulate weather events that occur at the
microscale level, such as tornadoes and severe thunderstorms. However, some of the
range of results reported originates simply from a wide variety of scenarios of future
climate change used to drive climate model simulations, which hampers our ability to
make generalizations about predicted changes in extreme weather events. The goal of this
study is to conduct a meta-analysis of the literature on projected future extreme weather
events, so as to identify trends, using global mean temperature change as a common
frame of reference. Results indicate that global warming could significantly alter the
behavior of multiple extreme weather events, such as mid-latitude drought, severe
thunderstorms and tornadoes, as well as the selected important meteorological variables
that engender them, into the 21st century.

iv
Acknowledgements
I am deeply thankful to my supervisor, Dr. Damon Matthews, for funding this research,
and for his extensive dedication and commitment in guiding me throughout this project,
from its preliminary stages to its completion.
I would also like to extend my thanks to Dr. Claudia Tebaldi for kindly preparing and
supplying the necessary data pertaining to Figure 4.1 of “Climate Stabilization Targets:
Emissions, Concentration and Impacts over Decades to Millennia (2011)”. This data was
extremely useful in the upscaling process of projected regional temperature changes.
Finally, I would like to offer my heartfelt thanks to my family, friends and colleagues for
their support and encouragement throughout the duration of this project.
v
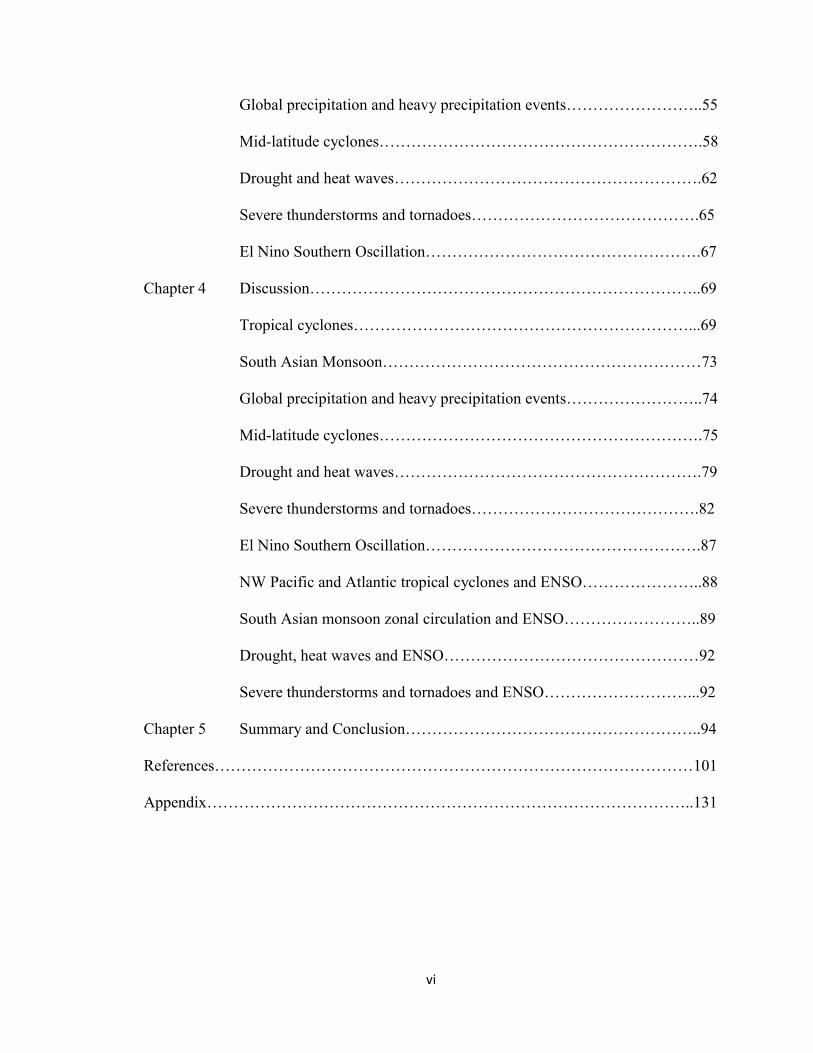
Table of Contents
List of Figures……………………………………………………………………………vii
List of Tables……………………………………………………………………………viii
List of Acronyms…………………………………………………………………………ix
Introduction………………………………………………………………………..……....1
Chapter 1 Literature review…………………………………………………………..6
Tropical cyclones……………………………………………………….....6
South Asian monsoon…………………………………………….…...…11
Global precipitation and heavy precipitation events………..…………....13
Mid-latitude cyclones…………………………………………………….16
Drought and heat waves………………………………………………….18
Severe thunderstorms and tornadoes…………………………………….22
El Nino Southern Oscillation…………………………………………….26
Chapter 2 Methodology……………………………………………………………..30
Search and scanning phase……………………………………………….30
Selected weather extremes……………………………………………….32
Data collection and interpretation………………………………………..34
Statistical analysis………………………………………………………..38
Chapter 3 Results……………………………………………………………………46
Global and regional tropical cyclones……………………………………46
South Asian monsoon……………………………………………………54
vi
Global precipitation and heavy precipitation events……………………..55
Mid-latitude cyclones…………………………………………………….58
Drought and heat waves………………………………………………….62
Severe thunderstorms and tornadoes…………………………………….65
El Nino Southern Oscillation…………………………………………….67
Chapter 4 Discussion………………………………………………………………..69
Tropical cyclones………………………………………………………...69
South Asian Monsoon……………………………………………………73
Global precipitation and heavy precipitation events……………………..74
Mid-latitude cyclones…………………………………………………….75
Drought and heat waves………………………………………………….79
Severe thunderstorms and tornadoes…………………………………….82
El Nino Southern Oscillation…………………………………………….87
NW Pacific and Atlantic tropical cyclones and ENSO…………………..88
South Asian monsoon zonal circulation and ENSO……………………..89
Drought, heat waves and ENSO…………………………………………92
Severe thunderstorms and tornadoes and ENSO………………………...92
Chapter 5 Summary and Conclusion………………………………………………..94
References………………………………………………………………………………101
Appendix………………………………………………………………………………..131
vii
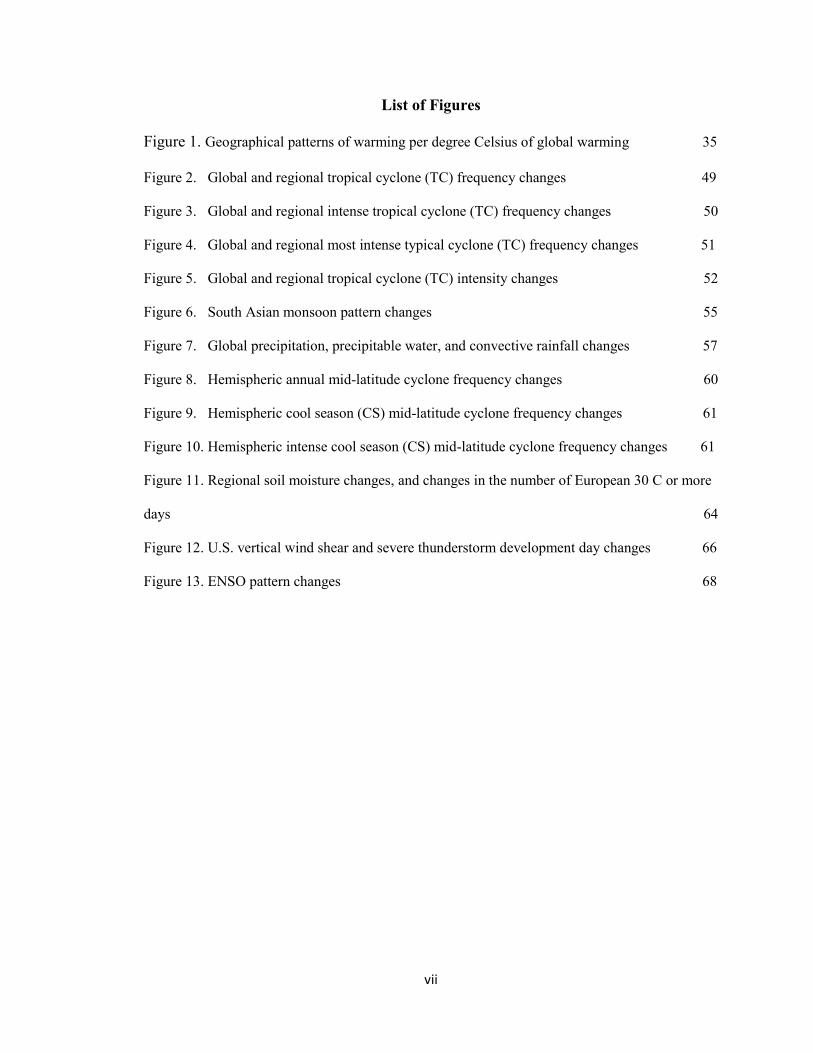
List of Figures
Figure 1. Geographical patterns of warming per degree Celsius of global warming 35
Figure 2. Global and regional tropical cyclone (TC) frequency changes 49
Figure 3. Global and regional intense tropical cyclone (TC) frequency changes 50
Figure 4. Global and regional most intense typical cyclone (TC) frequency changes 51
Figure 5. Global and regional tropical cyclone (TC) intensity changes 52
Figure 6. South Asian monsoon pattern changes 55
Figure 7. Global precipitation, precipitable water, and convective rainfall changes 57
Figure 8. Hemispheric annual mid-latitude cyclone frequency changes 60
Figure 9. Hemispheric cool season (CS) mid-latitude cyclone frequency changes 61
Figure 10. Hemispheric intense cool season (CS) mid-latitude cyclone frequency changes 61
Figure 11. Regional soil moisture changes, and changes in the number of European 30 C or more
days 64
Figure 12. U.S. vertical wind shear and severe thunderstorm development day changes 66
Figure 13. ENSO pattern changes 68
viii
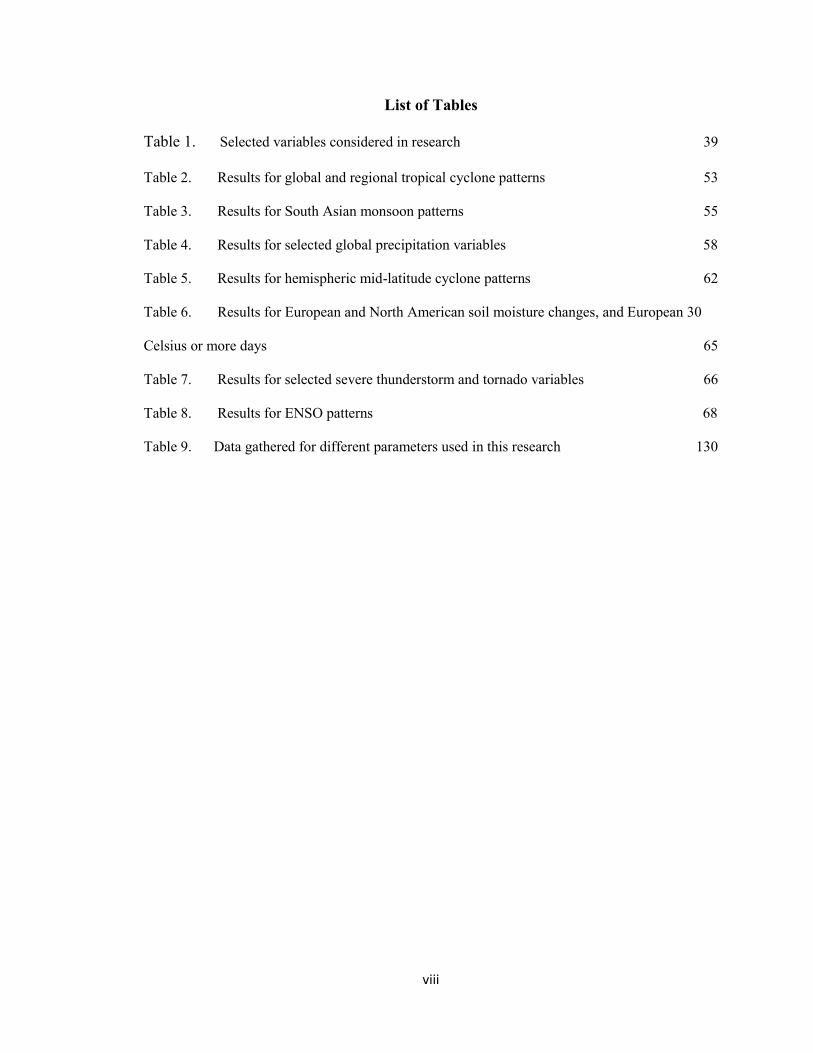
List of Tables
Table 1. Selected variables considered in research 39
Table 2. Results for global and regional tropical cyclone patterns 53
Table 3. Results for South Asian monsoon patterns 55
Table 4. Results for selected global precipitation variables 58
Table 5. Results for hemispheric mid-latitude cyclone patterns 62
Table 6. Results for European and North American soil moisture changes, and European 30
Celsius or more days 65
Table 7. Results for selected severe thunderstorm and tornado variables 66
Table 8. Results for ENSO patterns 68
Table 9. Data gathered for different parameters used in this research 130
ix
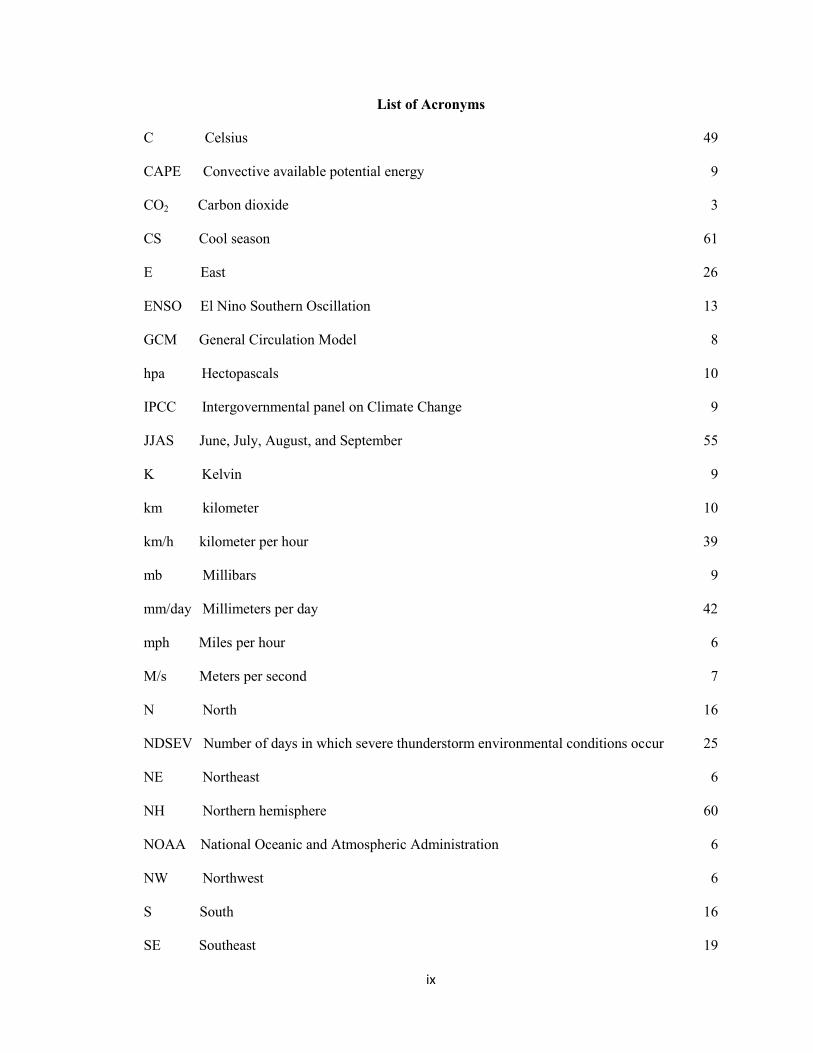
List of Acronyms
C Celsius 49
CAPE Convective available potential energy 9
CO2 Carbon dioxide 3
CS Cool season 61
E East 26
ENSO El Nino Southern Oscillation 13
GCM General Circulation Model 8
hpa Hectopascals 10
IPCC Intergovernmental panel on Climate Change 9
JJAS June, July, August, and September 55
K Kelvin 9
km kilometer 10
km/h kilometer per hour 39
mb Millibars 9
mm/day Millimeters per day 42
mph Miles per hour 6
M/s Meters per second 7
N North 16
NDSEV Number of days in which severe thunderstorm environmental conditions occur 25
NE Northeast 6
NH Northern hemisphere 60
NOAA National Oceanic and Atmospheric Administration 6
NW Northwest 6
S South 16
SE Southeast 19
x
SH Southern hemisphere 60
SSTs Sea-surface temperatures 7
SW Southwest 11
TC Tropical cyclone 49
U.S. United States 1
W West 26
1
Introduction
Extreme weather events can be defined as weather phenomena that are at the
extremes of the historical distribution, largely severe or unseasonable weather, and are
rare occurrences that, by definition, only take place less than 5% of the time (Zhu &
Toth). Though rare, extreme weather can dramatically impact society and have
significant short and long term repercussions, particularly in terms of loss of life and
major environmental, social and economic impacts. From 1990 to 2008, weather
extremes accounted for, on average, nearly 35,000 deaths at a global scale annually
(Goklany, 2009). In the U.S. (United States) alone, tornadoes and hurricanes combined
are responsible for billions of dollars in damage and attributed to over 100 fatalities
annually (McNeill, 2012); in 2011, there was a record 12 major weather disasters that
each generated costs of over $1 billion while the nation experienced one of the deadliest
tornado seasons in recorded history (Rice, 2011).
The response of extreme weather events to anthropogenic climate change has
received considerable attention in climate science literature. Recent studies have linked a
warming climate to changing frequency and severity of various weather extremes,
including severe thunderstorms and tornadoes (Trapp et al., 2007), tropical cyclones
(Stowasser et al., 2007; Sugi et al., 2009), heat waves (Gregory et al., 1997; Beniston,
2004), and winter storms at mid-latitudes (Carnell & Senior, 1998; Trapp, et al., 2009;
Lambert, 2004). However, the range of changes documented for different events in the
literature is large and is likely due to climate models being unable to fully simulate or
represent certain extreme weather phenomena, especially those that occur at the
microscale level. The uncertainties are also the result of the wide range of scenarios used
to drive the models, which increasingly hinders our ability to make assertions about
2
projected trends in extreme weather events into the 21st century. Thus, the study of
climate change science becomes increasingly relevant with respect to the ability of a
warming climate to potentially modify extreme weather events for the future.
The science of climate change has rapidly evolved over the last 100 years, and
especially over the last 40-50 years. However, the discovery of the science can be traced
as early as the beginning of the 18th century, when natural changes in climate were first
identified, as well as the role of the natural greenhouse effect (Weart, 2003). The
definition of climate change can be described in multiple ways. For the context of this
study, however, climate change can be defined as any change that occurs in the statistical
distribution of weather patterns at different spatial scales. A distinction should also be
made between “weather” and “climate”. Weather refers to short term variations in
various meteorological parameters (i.e. temperature, air pressure, precipitation, wind,
etc.), while the discipline of climatology applies and studies the same meteorological
variables over larger time scales, commonly in periods of decadal, centennial or
millennial scales, and, for geological temporal scales, millions to even billions of years.
Climate feedbacks are particularly important in climate science in interpreting, for
example, potential changing interactions between land-ocean-atmospheric relations, as a
result of climate warming. A “climate feedback” is a mechanism by which an initial
climate forcing (warming or cooling) is either accelerated or reduced through a response
in subsequent climate systems. Although there is now a better understanding of how
climate change might influence climate system interactions through climate feedback
mechanisms, there remains uncertainty as to which feedbacks will be the most dominant
in regulating global and regional climate; this will likely persist in being one of the major
3
challenges in the field of climate science in future climate modeling studies, primarily
because of the complex nature of the climate system, and the interactions that occur
between components of the system in response to climate change. In particular, the
warming effect associated with increased atmospheric CO2 (carbon dioxide) is important
in terms of the potential response of extreme weather. Global warming related to rapidly
increasing atmospheric CO2 concentrations over the last few decades has been shown to
potentially affect extreme weather events in terms of frequency and intensity into the 21st
century. For example, warmer global temperatures can lead to an increase in the amount
of atmospheric moisture (or water vapor) available for thunderstorm development. An
enhancement of moisture can, in turn, contribute to an increase in the number of intense
thunderstorms with vigorous updrafts. Similarly, increased atmospheric moisture,
through climate warming, can act to increase the intensity of tropical cyclones. Overall,
increases in global temperatures can play a significant role in changing the frequency
and/or intensity of extreme weather events for the future.
The intent of this study is to explore to what extent changes in extreme weather
events can be quantified as a function of global mean temperature change. Other
questions of interest that stem from this objective can be related specifically to how
individual extreme events may respond to changes in global mean temperature. For
example, will tropical cyclones or heat waves becoming increasingly frequent in the
future, as a result of a warming climate? Similarly, might we expect an increase or
decrease in their overall intensity? Or, are there no significant trends in predictions of the
frequency and intensity of specific extreme weather events? Do certain weather extremes
appear to be more sensitive to global warming relative to others?
4
In this study, I have used a meta-analysis to critically evaluate and statistically
combine results from climate impacts literature in order to quantify selected weather
extremes by using global mean temperature change as a common frame of reference.
Most studies use climate modeling techniques to assess how various weather extremes
may change over time in response to global warming. Other research employs
observational analyses to evaluate past trends to make projections for the future.
However, no climate-related work has yet integrated a meta-analysis to study potential
future trends in weather extremes.
A meta-analysis incorporates results or findings derived from a collection of
research that has a related set of hypotheses, with the purpose of increasing statistical
power, increasing the level of reliability of the results, as well as improve estimates of the
effect size of an association or intervention (Statistical Solutions, 2011). A meta-analysis
is a particularly useful method for the nature of this study, as it combines the ideas and
results from a large body of academic literature while making it less influenced by local
findings, and it similarly makes it possible to show if publication bias exists (Statistical
Solutions, 2011). Meta-analyses make generalizations to the population of studies, and
they have the ability to control for between-study variation (Statistical Solutions, 2011).
Meta-analyses also offer more precise estimates of the size of any of the effects
uncovered (Crombie & Davies, 2009). In addition, this method can show if results are
more varied than what is expected from the sample diversity, and it includes moderators
to explain variation.
Through the technique of meta-analysis, I have quantified how a warming climate
may alter the frequency and severity of extreme weather events at regional to global
5
scales. I have based some of the methodological approach on a recent study, which used
meta-analyses to quantify ecological impacts associated with climate change, focused on
the effect of global mean temperature rise on ecosystems (Warren et al., 2010). My
research will extend and apply this analysis to changing weather extremes. I have
considered individual extreme phenomena based on projected future changes in
frequency and intensity, typically by the end of the 21st century. Specifically, I have
analyzed the literature on tornadoes, severe thunderstorms, tropical cyclones, the South
Asian monsoon, heavy precipitation events, drought, heat waves, and the El Nino
Southern Oscillation, through the extraction of model output data that project changes in
their frequency and intensity in response to projected changes in global mean
temperature. As such, this paper has first provided an overview of the literature
pertaining to each event under investigation, followed by a description of the systematic
approach used for the meta-analysis. A discussion of the results derived from the
statistical analyses employed has then been given.
6
Literature Review
In this section, I will briefly review the current literature on specific weather
extremes.
-Tropical cyclones
A tropical cyclone is defined as an intense area of low pressure consisting of a
rotating band of organized thunderstorms that typically initiates in tropical and
subtropical waters and has a closed low-level circulation (NOAA, 2012). “Tropical
cyclone” is a term used to collectively identify and describe tropical depressions, tropical
storms, hurricanes (NE(Northeast) Pacific and Atlantic), cyclones (North Indian Ocean)
and typhoons (NW(Northwest) Pacific). Each of these terms is designated to a tropical
cyclone based on sustained surface wind speeds and central surface pressures over a
given period of time and is contingent with specified thresholds on the Saffir-Simpson
scale. Tropical depressions are areas of low pressure with little defined structural
characteristics that its superior stages possess, typically a prominent eye. Tropical
depressions are upgraded to tropical storms when sustained surface wind speeds achieve
and/or surpass 39 mph (miles per hour), while tropical storm status is established when
maximum surface sustained winds of between 39-73 mph. Once sustained surface winds
exceed tropical storm status, hurricane, typhoon, tropical cyclone, severe tropical storm,
or severe cyclonic storm status is attained, depending on the region in question. For all
major tropical cyclones (categories 3 through 5), however, NOAA (National Oceanic and
Atmospheric Administration) uniformly stipulates an achieved maximum surface wind
speed of 111 mph or greater.
7
Source regions are regions of development where ideal conditions are most
suitable for cyclogenesis, a process used to describe and study the formation or evolution
of tropical or mid-latitude cyclones over time. The cyclogenesis of a tropical cyclone
becomes most favorable under the influence of warm SSTs (sea-surface temperatures) of
at least 26.5 degrees Celsius, with generally warm waters that extend to sufficient depths
(ideally about 60 meters in depth). The presence of warm SSTs is particularly important
because they provide ample amounts of sensible and latent heat to a tropical cyclone
(Ahrens, 2007).
Warm SSTs also need to be occurring with strong surface convergence and upper-
level divergence, accompanied by sufficient vertical uplift and ample surface/near-
surface moisture (Ahrens, 2007). If a tropical cyclone is to initiate successfully, an area
of convergence is required to allow tropical squall line thunderstorms to become more
organized. Surface convergence may take place with an easterly tropical shortwave
trough, or a pre-existing frontal feature, such as a modified cold front that has migrated
towards the tropics from mid-latitudes. Little vertical wind shear is also crucial. Vertical
wind shear, defined as a change in both speed and direction with increasing altitude, is a
meteorological variable that is very important in forecasting the evolution of a tropical
cyclone over time. Vertical wind shear values surpassing 15 m/s (meters per second) are
considered detrimental to the development of tropical cyclones; this is largely because
high levels of vertical wind shear act to disperse heat and moisture, effectively disrupting
the vertical structure of a given storm and limiting organized convection from occurring.
Consequently, tropical cyclones will gradually weaken when exposed to a zone of high
vertical wind shear, even when other ideal environmental conditions are in place.
8
Tropical cyclones are known to have devastating impacts on society, and potential
changes for the future are, thus, of great importance in a warming climate. Over the last
two centuries, tropical cyclones have been responsible for nearly two million fatalities,
and recent projections show that these storms could potentially account for as much as
$109 billion in damage by 2100 (Mendelsohn et al., 2012). Damage costs have also been
suggested to increase in the U.S. Gulf and East Coasts by the end of the 21st century due
to Atlantic hurricanes (Emanuel, 2011), particularly with respect to storm surge, such as
in New York City (Lin et al., 2012). Climate research revealed that the distribution of
global tropical cyclones may be changing in response to CO2-induced warming
(Stowasser et al., 2007; Sugi et al., 2009). Atlantic hurricane activity has also been
attributed to naturally occurring cycles in tropical climate patterns near the equator
(Cheetham, 2011). These natural cycles are referred to as the “tropical multi-decadal
signal”, and it has been shown that this signal can significantly affect the oceanic and
atmospheric conditions in and around the tropical Atlantic. The tropical multi-decadal
signal commonly moves through active and inactive phases, lasting for as much as 20-30
years at a time, or perhaps even longer (Cheetham, 2011). Studies have suggested that the
increase in active hurricane seasons, particularly since 1995, may be due to a more active
phase of the tropical multi-decadal signal, and it is likely that this active phase provided
the key conditions necessary for producing an increase in the number of active seasons
between 1995 and present day (Beven, et al., 2008).
Several GCM (general circulation modeling) studies that have examined tropical
cyclones in the context of a warming climate have done so by typically using a variety of
CO2 scenarios (Knutson et al., 1998; Oouchi et al., 2006; Yoshimura et al., 2006;
9
Stowasser et al., 2007). Since the early 1990’s, increased research efforts have attempted
to study how a progressively warming climate may modify the behavior of tropical
cyclonic systems. In this sector, studies employ a variety of climate models participating
with the IPCC (Intergovernmental Panel on Climate change) to assess and predict
changes in storm trajectory, genesis (cyclogenesis), core rainfall, mean surface wind
speeds, and general changes in the frequency and intensity of tropical cyclonic systems
through these parameters. Experiments that are commonly employed in the literature
integrate one or more warming scenarios that are used to simulate tropical cyclone
tendencies at various points into the 21st century at different spatial scales. Experimental
design is mostly driven by a combination of IPCC and transient greenhouse gas
scenarios, as well as prescribed SST changes, typically at tropical latitudes and cyclone
development regions. In some cases, the inclusion of a coupled ocean-atmosphere model
(e.g. Knutson et al., 2001) is used to study the influence of oceans on the physical
processes of cyclogenesis. However, the response of tropical cyclone climatology has
differed amongst the findings, largely due to the practical limitation of coarse resolution
numerical models (Stowasser at al., 2007). With that said, a trend towards increasing
tropical cyclone intensity, as well as increasing intense tropical cyclone frequency is
shown in several studies. For example, results given by Knutson et al. (1998) suggested
that in a high-CO2 scenario, surface pressure, on average, for typhoons was 20 mb
(millibars) lower, maximum wind speeds increased, and CAPE (convectional available
potential energy) increased. Stowasser et al. (2007) showed a substantial warming of
tropical surface waters, where SSTs increased by approximately 3 K (Kelvin), and global
surface air temperatures increased by 4.5 K under a six-fold increase of present-day
10
atmospheric CO2. This resulted in a significant increase in the number of intense tropical
cyclones over the entire NW Pacific, while the total number of cyclones in the basin
increased only slightly. Yoshimura et al. (2006) have shown that under a doubled CO2
scenario, the global frequency of weak tropical cyclones may decrease, but the number of
intense tropical cyclones could increase in a warmer climate.
In particular, multiple modeling studies show a tendency towards decreasing
cyclone frequency at global and regional scales. For instance, Oouchi et al. (2006), Sugi
et al., (2009) have shown a consistently large reduction in tropical cyclones at a global
scale in a warmer climate, which is similarly projected in Yoshimura et al. (2006) under
doubled CO2 conditions, especially in the Southern hemisphere. Using a 50 km
(kilometer)-resolution global atmospheric model, Held & Zhao (2011) similarly found
that tropical cyclone frequency decreased by 20% under the combined effect of
atmospheric warming, and an increase of 2 K in SSTs. The general reduction in cyclone
frequency is shown to be attributed to enhanced upper-tropospheric stability in a warmer
climate. Static stability is defined as the stability of the atmosphere in hydrostatic
equilibrium with respect to vertical displacement (Peppler, 1988) and determines the
buoyancy frequency of dry perturbations in the vertical, and the magnitude of the
greenhouse effect (Frierson, 2006). Static stability may also be defined as the difference
in potential temperature between two height pressure surfaces, usually between mid- to
upper-levels of the atmosphere, most often the 200 to 500 hpa (hectopascals) and surface
level (Stowasser et al., 2007; Oouchi et al. 2006; Yoshimura et al., 2006). In the tropics,
the moist convection occurring over warm waters alters upper-tropospheric temperature
profiles, in which the moist adiabatic structure results in upper-tropospheric amplification
11
of global warming (Frierson, 2006). Because this warming is principally driven by deep,
moist convection, warmer surface temperatures may lead to further warming in the
tropical upper-troposphere through greater latent heat release associated with
condensation. As such, the tropical upper-tropospheric temperatures would warm
proportionally more than those in the boundary layer (Bengtsson et al., 2009), effectively
reducing the potential for more numerous tropical cyclone activity across all, or most,
storm basins by limiting the potential for deep convection, reducing upward vertical
velocities and mid-level vorticity, and weakening the intensity of the tropical circulation
flow (Sugi et al., 2002; Stowasser et al., 2007). At the same time, particularly in the
Eastern Pacific and tropical Atlantic, other analyses have shown that wind shear increases
per degree Celsius global warming, revealing a potential decrease in the number and
intensity of Atlantic hurricanes and tropical storms for the future (Vecchi & Soden, 2007;
Zhao et al. 2009).
-South Asian monsoon
The Asian monsoon is considered the most spectacular manifestation of the global
climate system and is responsible for providing a major percentage of water sources to
the largest and most densely populated areas of the world (Ueda et al., 2006). Therefore,
how the Asian monsoon may respond to future global warming is of great climatic
importance throughout much of the Asian continent. A “monsoon” is widely accepted as
a seasonal reversal of wind circulation patterns, and corresponding alterations in
precipitation, over a given region. Though the effect of a monsoon is most prominent
over much of the Asian continent, monsoons do occur in other regions of the world, such
as in Europe, Africa, the SW (Southwest) U.S. and Australia. The Asian monsoon may be
12
subdivided into region-specific monsoons, such as the South Asian monsoon, as well as
the East/NE Asian monsoon. The South/SW Asian monsoon is the most influential of the
global monsoons, especially for much of the Indian subcontinent, and it is, consequently,
of significant cultural, agricultural and economic importance in India. The monsoon
accounts for approximately 55% of the subcontinent’s observed annual rainfall (Lal et al.,
1998) and, as such, the South Asian and Indian monsoon is of particular interest amongst
climate studies.
The Summer South/SW Asian monsoon typically spans from June through to
September, with maximum intensity occurring during June, July and August. By late-
Spring, as surface temperatures warm much more rapidly, a broad area of low pressure,
often termed a “heat low”, develops and progressively intensifies over the Indian
subcontinent, replacing the anti-cyclone (Siberian High) that is common during the
Northern hemisphere Winter. This area of low pressure is also accompanied by a trough
of low pressure, called the “Monsoon trough”, stationed over the Gangetic Plains, which
acts as an important feature for surface convergence and upward vertical motion. Areas
of low pressure that move inland along this trough often bring moist convective clouds,
inducing intense spells of rainfall (Lal et al., 2001). As the land continues to heat, a steep
pressure and temperature gradient becomes established, and because of the circulation
around low pressure, prevailing SW winds draw moisture from the Indian Ocean and
transport it towards much of South and SW Asia.
Modeling studies have suggested that climate change could strengthen the
seasonal monsoon patterns in East Asia (Chen et al., 2004). In a doubled CO2 scenario,
the climate tends to be warmer and wetter and regional climate models have predicted an
13
overall increase in annual precipitation across much of China, including 23% over
Northern China, 21% over central regions, and 8% in southern regions (Chen et al.,
2004). Transient greenhouse gas concentration simulations also showed that the effect of
El Nino events on the Asian monsoon could decrease due to climate warming (Ashrit et
al., 2001), leading to a net increase in rainfall, despite ENSO (El Nino Southern
Oscillation) moving into a warmer mean state (Ashrit et al., 2001). Another transient
greenhouse warming experiment that used the IPCC IS92 emissions scenario also found
an intensification of the Asian monsoon, as well as an increase year-to-year variability,
due to an increase in land-sea temperature contrasts, a northward shift in the inter-tropical
convergence zone, and a westward shift in the ascending branch of the Walker
Circulation (Hu et al., 2000). Kripalani et al., 2003 conversely found, in an observational
data analysis, that there is no clear evidence to suggest that both the strength and
variability of the Indian monsoon rainfall or its epochal changes (characterized as
alternate 30-year periods of above or below normal rainfall) have been impacted by
global warming to date.
-Global precipitation and heavy precipitation events
Precipitation is considered to be one of the most important meteorological
variables and is of great interest when studying potential changes in extreme precipitation
events in a warmer climate, particularly heavy snowfall or convective rainfall events.
Precipitation is characterized as having smaller spatial and temporal scales than
temperature, and observational data is taken mostly over land (Boer et al., 2000). In many
discussions centered on global warming, it is implicitly assumed that the atmosphere will
become more energetic as it warms (Held and Soden, 2006), and it is often shown that
14
precipitation intensity and extreme precipitation scale with column water vapor under
climate change (O’Gorman & Muller, 2010).
Precipitable water, also referred to as (integrated) column water vapor, is
commonly used as an indicator for the amount of water vapor and moisture in the
atmosphere over a particular region or location at different intervals of time. Column
water vapor is a useful predictor for favorable conditions associated with deep
convection, which is particularly important for lifted parcels experiencing entrainment
(Holloway et al., 2009). Higher values of precipitable water have been associated with
severe thunderstorms, as the effect of increased water loading from large quantities of
water in the main downdraft region of a storm can produce heavy bursts of rain, as well
as damaging downdrafts along the gust front. As such, increased precipitable water in the
troposphere increases the potential intensity of convective systems by supplying
additional moisture or water vapor that could be condensed and precipitated out over a
given location. Entrainment plumes have been suggested to become much more buoyant
at middle to upper levels of the troposphere when column water vapor values are high,
and enhanced free-tropospheric moisture plays an important role in the transition from
shallow to deep convection (Holloway et al., 2009). The factors necessary for heavy
precipitation events, however, vary by region and season and are, therefore, either
dynamically- or thermodynamically-driven (O’Gorman & Muller, 2010; Radermacher &
Tomassini, 2012).
The Clausius-Clapeyron relation is used to describe temperature dependence of
the saturation vapor pressure and stipulates that a 7% increase in water holding capacity
of the atmosphere is produced for every corresponding degree Kelvin change
15
(Radermacher & Tomassini, 2012). Climate simulations show that warmer temperatures
effectively increase the atmosphere’s holding capacity of water vapor, consistent with the
Clausius-Clapeyron relationship (Boer, 1993; Bosilovich et al., 2005; Held & Soden,
2006). Precipitation, however, is shown not to significantly increase at the Clausius-
Clapeyron rate because energy constraints appear to control the strength of the
hydrological cycle, though these constraints are much less significant at lower
temperatures, suggesting that cool season precipitation increases at a rate more consistent
with this relationship (Lorenz & DeWeaver., 2007).
Increased atmospheric moisture content in a warmer climate is shown to enhance
precipitation and heavy precipitation events, which may be the result of enhanced
moisture convergence (Trenberth, 1998). A comparison of observed and multi-model
simulated changes in extreme precipitation over the latter half of the 20th century showed
that human-induced increases in greenhouse gases have led to observed intensification of
heavy precipitation events over two thirds of the Northern hemisphere land areas (Min et
al., 2011). Observational data analysis also shows a trend in increased heavy precipitation
in the U.S., with a larger number of days annually exceeding 50.8 mm (Easterling et al.,
2000). Over most of Australia, GCM analyses, using an equilibrium-enhanced
greenhouse effect, showed that a doubled CO2 scenario increased the frequency of heavy
rainfall events, while decreasing low-rainfall events, implying a greater likelihood of
increased flooding (Whetton et al., 1993). Lenderink & Meijgaard (2008) also find in
their simulations with a high-resolution regional climate model that one-hour
precipitation extremes increase by twice as much with rising temperatures, as well as a
16
14% increase per degree of warming over large parts of Europe, implying an increase in
local flooding.
-Mid-latitude cyclones
Mid-latitude cyclones, also known as extra-tropical cyclones, are cyclonic storms
that occur at mid-latitudes (30-55 N (North) and S (South)) as synoptic-scale areas of low
pressure. These weather systems are often associated with a variety of extreme weather,
including Winter storms, severe thunderstorms, tornadoes, heat waves, and strong winds.
Unlike tropical cyclones, mid-latitude cyclones are driven largely by baroclinic
instability, where a large pole-equator temperature gradient exists, promoting appreciable
to significant warm and cold air advection that is conducive to cyclogenesis. As a cyclone
experiences intensification, its precipitation coverage and intensity are also
correspondingly enhanced, further promoting cyclonic development.
Moisture availability is also a critical factor that is essential for the development
of mid-latitude cyclones. Large amounts of moisture drawn into a mid-latitude cyclone
facilitates the release of vast quantities of latent heat, which further promotes atmospheric
de-stabilization and allows for potentially vigorous cyclogenesis. It is revealed that about
70% of precipitation associated with mid-latitude cyclones is derived from pre-existing
moisture in the atmosphere at the time a given storm formed, while the remaining amount
comes from evapotranspiration (Trenberth et al., 2005). With a large quantity of moisture
available, enhanced condensation can occur, releasing more latent heat. Reed et al. (1988)
showed that over a 24-hour period, latent heating accounted for 40-50% of mid-latitude
cyclones’ intensification. Consequently, a warming climate can lead to an increased
17
availability of lower- and mid-tropospheric humidity and moisture content and, therefore,
latent heat release (Lambert 1995; Lambert, 2004). The effect of latent heat is also
represented in Watterson (2006), where latent heat enhancement occurs with precipitation
intensification in a warmer climate, indicating increased genesis in mid-latitude cyclones.
Changes in frequency, intensity and storm track have been documented in various
modeling studies (Lambert, 1995; Finnis et al., 1997; Carnell & Senior, 1998; Geng &
Sugi, 2003; Lambert et al., 2004; Lambert & Fyfe, 2006). Carnell & Senior (1998), for
example, using the Hadley Center coupled ocean-atmosphere model, reported a reduction
in the total number of storms during the Northern hemisphere Winter but observed a
tendency towards deeper low pressure storm centers, suggesting enhanced intensification
of storms. Geng & Sugi (2003) also show that the cyclone density of stronger storms
increased by almost 20% in both hemispheres during the June-July-August period. An
ensemble of 250-year transient enhanced greenhouse simulations conducted in Lambert
(2004) similarly yielded decreases in Winter cyclonic events in both the Northern and
Southern hemispheres but an increase in the number of intense events, but the overall
reduction in cyclonic frequency was most prevalent in the Southern hemisphere (Lambert
& Fyfe, 2006).
In terms of storm track, modeling studies have suggested that storm tracks from
the North Pacific and North Atlantic may become shorter and decrease in length at the
Northeastern end of the tracks (Carnell & Senior, 1998) in a warmer climate. Compared
with the present climate, storms tended to propagate faster, and storm tracks exhibited
trajectories that have resulted in storms traveling slightly poleward toward the North
Atlantic coast (Geng & Sugi, 2003). Similarly, atmospheric warming may cause
18
Northwest Atlantic storms to increase in radius, propagate faster, become more severe in
nature, and occur in storm tracks that shift slightly poleward (Jiang & Perrie, 2007). It has
also been suggested that spatial and structural differences in the distribution of mid-
latitude extratropical cyclones in warming-induced conditions exist, where a larger
horizontal extent of storms was present as compared to those in the present climate, and
stronger wind speeds also tended to occur at greater radii from the storms’ center in the
climate change scenario simulations (Jiang & Perrie, 2007).
-Drought and heat waves
Drought is not considered an extreme weather event in itself, but it is a condition
that is produced by changes in surface and weather patterns, such as deficiencies in soil
moisture, rainfall, snowfall, and increased evaporation rates relative to the total amount
of precipitation that occurs over a given region or area. Studies that have directly
examined drought intensity and frequency in response to future global warming are
relatively few in number, and other studies largely explore observational records to
identify potential mechanisms behind ongoing drying at regional scales, rather than
projecting future changes with global warming.
Soil moisture is an important modulator in the evolution of Summer drought, as
well as for surface temperatures. If abundant, moisture stored in the soil evaporates as the
surface warms, causing warm, moist air to rise and condense into colder air aloft, which
generates late-day rain showers while serving as an additional moisture supply to
convective systems. Abundant soil moisture can also significantly contribute to the
severity of thunderstorms, as well as tornadic activity in the U.S. When soil moisture is
deficient during the late-Spring to Summer, surface evaporation becomes smaller, and the
19
surface can readily become much hotter because of the lack of evaporative cooling under
these conditions, which would otherwise moderate surface temperatures more efficiently.
As the snowmelt period ends earlier, the soil, having a lower albedo, is exposed to
incoming solar radiation, causing soil moisture stored during the Winter to more quickly
evaporate with onset of consistent Spring temperatures. By the late-Spring to Summer
period, reduced soil moisture prompts a corresponding decrease in evaporation, and this
process is further accelerated by reduced lower-tropospheric relative humidity, which, in
turn, prevents saturation and, therefore, rainfall is inhibited (Wetherald & Manabe, 2002).
Indeed, we can see that the Winter of 2012 across North America was characterized by
very little snow over much of the continent, leading to a deficit in soil moisture, which
contributed to extreme drought conditions for much of Canada and the U.S. into the
following Summer.
Historical trends, from 1950 to 2010, reveal that progressive global aridity has
increased, mostly due to drying taking place over SE (Southeast) Asia, Eastern Australia,
Southern Europe, and over much of the African continent (Dai, 2011; Dai, 2013). This
upward trend in global drought areas may be attributed to the ongoing warming that had
occurred since the 1980s, which prompted an 8% increase in the areas under drought over
the first decade of this century (Dai, 2013). Time-dependent coupled ocean-atmosphere
GCM studies have shown that with increased levels of CO2, precipitation and soil
moisture are greatly reduced across central North America and Southern Europe
(Gregory et al., 1997). Over recent decades, drought events have been linked to changes
in tropical SSTs, particularly those of the tropical and equatorial Pacific (Dai, 2011).
Therefore, historical changes in ENSO patterns (Dai, 2011) have been an important
20
climatic factor in global drought since the 1950s, where La Nina events have been
associated with drying in North America, while El Nino has often generated drought
conditions over much of Asia, particularly East Asia, when it is present, possibly due to a
weaker monsoon circulation when an El Nino event occurs.
Because of climatological variations at the regional scale, there is generally no
universal definition that characterizes a heat wave. However, the World Meteorological
Organization defines a heat wave as when maximum temperatures for more than five
consecutive days exceed five degrees Celsius, relative to the climatological norm for a
given location or region (usually with respect to 1961-1990 climatology). However,
different regions establish different standards as to when a heat wave formally occurs; a
hot, moist climate, which is common in equatorial and tropical regions of the globe, may
define a heat wave much more differently than a given location stationed in the mid-
latitudes. Heat waves may also have different thresholds within the same country. In
Canada, for example, a heat wave is declared when at least three consecutive days attain
32 Celsius or more, but in the province of Quebec, the threshold is 30 Celsius over the
same period of time.
Heat waves during the late-Spring to Summer season at mid-latitudes are common
under a variety of meteorological conditions. Heat waves are largely associated with a
combination of dynamic and thermodynamic processes interacting with hydrological
changes at the land surface (Lau & Nath, 2012). Most frequently, high pressure
developing at mid-levels of the troposphere provide the most favorable conditions for the
development of a heat wave. Building high pressure at mid- to high-levels of the
troposphere that become stationary often induce air subsidence towards the surface and
21
creates a “lid” (a temperature inversion) at mid-levels of the atmosphere, causing
building heat to be trapped near the surface while preventing the rising motion of air, and,
therefore, convection, from occurring for as much as several days to even over a week.
Such conditions would also produce positive geopotential height anomalies (Huth et al.,
2000; Lau & Nath, 2012; Meehl & Tebaldi, 2004). Because of the extreme dry conditions
associated with air subsidence, soil moisture is quickly exhausted, leading to further
drying through a decline in surface and near-surface relative humidity. In other cases, a
heat wave may be accompanied by sweltering humidity. In North America, for instance,
when a strengthening area of high pressure that displaces over the Atlantic and becomes
stationary, the Southwesterly circulation located at its back end allows for very warm and
moist air to flow into much of the central and Eastern sections of the continent, aided by
areas of low pressure forming to the West.
Soil moisture, like drought, is a determinant for the intensity and frequency of
heat waves, especially for mid-latitude regions. In particular, the European and North
American continents have received attention with respect to potential changes in heat
waves and drought in a warmer climate, notably in Europe. Observational and modeling
studies that focus on European heat waves have also been emerging over the last decade,
and the motivation for this research was primarily due to the extreme Summer heat of
2003 that affected much of the continent. As is the case for drought-like conditions, a
lack of soil moisture during the Winter can create extremely dry conditions in time for
the late-Spring to Summer period. It is suggested that the frequency of very hot days
could increase tenfold in Summer under drier soil conditions (Attinger, 2012). Regional
climate models running simulations of increased greenhouse gas concentrations have also
22
revealed that temperature variability increased by up to 100% in future European climate,
with maximum changes occurring in Eastern and central Europe (Schar et al., 2004).
Other findings similarly suggest that European Summers will become progressively as
hot as the heat wave of 2003 by the latter part of the 21st century (Beniston, 2004;
Beniston & Diaz, 2004). Similarly other projections estimate that under a doubled CO2
scenario, the resultant Summer temperature could be as high as 4.5 Celsius over South
Moravia (Czech Republic), which could induce a five-fold increase in the frequency of
tropical days, and a larger number of heat waves and dry spells globally (Huth et al.,
2000). Climate studies have shown that the snowmelt period could end sooner in a
warmer climate (Wetherald & Manabe, 2002), suggesting that soil moisture would have
more time to evaporate, as an increase in solar radiation would be absorbed by the surface
for a prolonged period. This corresponds to a decrease in annual soil moisture at regional
scales, especially mid-latitudes and semi-arid regions. However, most of the annual
decrease in soil moisture is attributed to large decreases found during the warmer months.
-Severe thunderstorms and tornadoes
Severe thunderstorms and tornadoes are some of the most violent and destructive
weather events on Earth and accounted for nearly $20 billion in damage from 1950-1994
in the U.S. alone (NOAA, 2013). Yet, in spite of their destructive power, and the
significant impacts associated with them, they have received considerably less attention
in the literature, as compared to other forms of extreme weather, such as tropical
cyclones. This is likely because of very limited data availability, and climate models’
inability to fully simulate those weather events that occur at such small spatial scales.
Severe thunderstorms can, with the exception of Antarctica, occur on any continent, but a
23
major proportion of these storms principally develop in the U.S. every year and take
place largely during the Northern hemisphere Spring, where the vast majority of annual
average number of tornadoes (approximately 1000) occur. Tornadoes are defined as a
spinning vortex of air that extend from the base of a severe thunderstorm (as a funnel)
and makes contact with the surface. The strength rating of a tornado is estimated by using
the Fujita scale, or Enhanced Fujita scale, which are both scales entirely based on the
nature of the damage a given tornado induces. Both the Fujita and Enhanced Fujita scales
are subdivided into six categories, ranging from F0/EF0 to F5/EF5, representing the
weakest to strongest rating, respectively.
Severe thunderstorms are largely associated with enhanced atmospheric
baroclinicity, in which boundary layer and mid-level tropospheric cool and warm air
advection is occurring. The degree of baroclinicity is most often at its peak during the
Spring season, when cold air to the North and warm air to the South strongly interact,
often generating a defined meridional temperature and pressure gradient that supports
vigorous cyclogenesis. The U.S. offers a classic, yet unique, atmospheric and geographic
combination for conflicting air mass interactions to occur. During the tornado season
within the tornado alley of the U.S., maritime tropical air masses originating from the
Gulf of Mexico circulate farther North, which commonly mingle with cold, drier air to
the North. It is this interaction that facilitates vigorous cyclogenesis to take place across
much of the U.S. Midwest and Great Plains, in addition to the occasional presence of dry
air migration from the U.S. SW. In addition, the NE-SW orientation of the Appalachians
to the East and North-South extent of the Rockies to the West means that warm, moist air
24
from the South is not hindered in its Northward migration, allowing these air masses to
frequently collide with colder air to the North.
As air masses of differing densities collide at low- to mid- levels of the
troposphere, this favors the development of strong, deep areas of low pressure, as well as
creating suitable low-level and deep-layer vertical wind shear, in which, as specified
previously, winds change in both direction and speed with increasing elevation within the
troposphere. A high amount of vertical shear is crucial for long-lasting severe
thunderstorms to occur, as it acts to displace the storms’ downdraft from their main
updraft region, thereby preventing any significant weakening of the storms’ updraft
associated with the downward motion of air, an effect that does not occur within ordinary
single-cell thunderstorms. As deep-layer vertical shear becomes increasingly favorable,
the likelihood for vertically-defined mesocyclonic activity (rotating updraft) within
supercell thunderstorms becomes enhanced.
In addition to sufficient vertical wind shear, severe thunderstorms also require
suitable levels of CAPE in order to successfully develop. CAPE is a thermodynamic
measure that assesses the degree of instability, or buoyant energy, that is present in the
troposphere over a given period of time. High levels of CAPE, measured in units of
Joules per kilogram (J/kg) often result when strong thermodynamic instability is
occurring in a given area. When CAPE values are in excess of 2500 J/kg, significant
levels of atmospheric instability are occurring, and any thunderstorms in development
within this environment will possess vigorous updrafts, reducing the effect of water
loading on a storm’s updraft. Larger levels of boundary layer moisture and surface
heating drive large surface-based thermodynamic instability. Thus, the most severe
25
thunderstorms are mostly found in environments where sufficient vertical wind shear and
large amounts of CAPE are occurring concurrently. Abundant soil moisture can also
enhance CAPE by releasing more water vapor to the atmosphere. Consequently, warm
seasons with abundant soil moisture can yield a greater number of days where higher
levels of CAPE can exist.
Ongoing greenhouse warming has been documented as a factor in influencing
thunderstorm and tornadic activity at regional scales. However, data availability and
reliability is a very limiting factor in small-scale meteorological phenomena (Davis &
Walsh, 2008). Research has considered the transient response of severe thunderstorms to
increased greenhouse gas concentrations and have shown that severe thunderstorms
increased with time in response to climate warming (Trapp et al., 2007; Trapp et al.,
2009), particularly East of the North American Rocky mountains (e.g. Diffenbaugh et al.,
2008). “NDSEV” refers to the number of days in which severe thunderstorm
environmental conditions occur and is the product of wind shear and CAPE (Trapp et al.,
2007). Modeling studies have revealed that by the end of the 21st century, NDSEV may
increase significantly in some locations of the U.S. (Trapp et al., 2007), suggesting an
increase in both severe thunderstorm and tornadic occurrences in the U.S.
Water vapor in the atmosphere is also an important factor in the development of
thunderstorms and supercells. GCM studies predicted that increased warming associated
with doubled CO2 could lead to greater evaporation from the oceans, which would
increase atmospheric water vapor concentration and enhance surface warming and,
therefore, thunderstorm development (Rind, 1998; Held & Soden, 2000; Held & Soden,
2006).
26
To another extent, lightning frequency has been used as an indicator to predict
thunderstorm occurrence trends for the future (Fosberg et al., 1990; Michalon et al.,
1999; Vellinga et al., 2001; Price, 2009). It has been suggested that lightning frequency
may increase across the Northern hemisphere with warmer mean temperature anomalies
due to a corresponding increase in convective activity (Fosberg et al., 1990). In a doubled
CO2 climate, with a corresponding 4.2 Celsius warming, another study found that global
cloud-to-ground lightning could increase by as much as 72% over continental regions
(Vellinga et al., 2001).
-El Nino Southern Oscillation
ENSO, or the El Nino Southern Oscillation, is the most important climatic
modulator on global inter-annual variability (Carnell & Senior, 1998; Timmermann et al.,
1999). ENSO variability is monitored throughout the equatorial and tropical Pacific
Ocean, typically between 80 W (West) and 120 E (East) longitudes, where variations in
SSTs between the Eastern and Western equatorial Pacific determine the overall phase of
the oscillation. When the central and Eastern sections of the equatorial and tropical
Pacific are at least a few degrees warmer relative to the Western Pacific, El Nino
conditions dominate, whereas the reverse occurs for La Nina. Both El Nino and La Nina
events are commonly categorized as weak, moderate and strong, and these sub-divisions
are determined based on the persistence of SST departures in the Nino3.4 (5 N to 5 S and
170 to 120 W) to Nino3 region (5 N to 5 S and 90-150 W) over a given period of time. If
cooler than normal SSTs are present over the central and Eastern equatorial Pacific, then
a La Nina event is established. An El Nino or La Nina event is declared when SSTs in the
Nino3.4 region exhibit departures (relative to 1961-1990 climatology) of at least above or
27
below 0.5 degrees Celsius and endure for a minimum of five consecutive months. SST
anomalies are measured as three-month running means.
Changes in the variability of ENSO dictate convective patterns across the
equatorial Pacific. During an El Nino event, convection is enhanced across the central
and Eastern equatorial Pacific, resulting in more convective rains and pronounced
thunderstorm activity there. The warmer SST anomalies also result in a deepening of the
thermocline, as above average SSTs extend to greater depths. The presence of El Nino
also weakens the Walker circulation by weakening the surface trade winds, as well as the
upper-level westerlies. The Walker circulation is characterized by vertical and horizontal
winds (upper and lower level), and the circulation changes in response to changes in
ENSO variability. During an El Nino (or ENSO warm phase), the weakening of the trade
winds prevents upwelling of cool, nutrient-rich waters from occurring in the Eastern
equatorial Pacific. The Western Pacific, under these conditions, is marked by cooler than
normal SST anomalies, whose occurrence is aided by the anomalous surface easterlies
that are common during a given El Nino event. At the same time, convection is
suppressed over this region. During a La Nina phase, these conditions are reversed, with
convection suppressed over the Eastern and central equatorial Pacific, while enhanced
over Western sections. Both El Nino and La Nina occur, on average, on intervals of three
to seven years.
El Nino and La Nina events control temperature and precipitation variability at a
global scale. In years where an El Nino event is occurring, drought, or reduced
precipitation occur over regions located in the Western Pacific, where Australia,
especially Eastern sections, often experience severe to extreme drought. At the same time
28
in South and SE Asia, the weakening of the Walker circulation associated with El Nino
subsequently weakens the Summer monsoon circulation by causing a reversal in the
lower-tropospheric wind patterns, where easterly winds replace the climatological
Southwesterlies that commonly circulate warm, moist air from the Indian Ocean.
Elsewhere, the likelihood for increased flooding occurs in North America, and the North
American Winter is usually marked by above-normal temperatures and reduced snowfall.
Atlantic tropical cyclone activity is also often significantly reduced during El Nino years,
owing to an enhancement of vertical wind shear over much of the tropical Atlantic.
Tornado and severe thunderstorm activity North America have also been correlated with
El Nino and La Nina events (Marzban & Schaefer, 2001).
In recent decades, ENSO variability has shown an increase in the number of El
Nino events, including an increase in the number of stronger El Nino events (Marzan &
Schaeffer, 2001, Kug et al., 2008). This has raised the fundamental question as to
whether anthropogenic warming could affect El Nino dynamics (Kug et al., 2008).
Potential future ENSO statistics (amplitude and period), however, have been debated due
to the inability of the models to fully simulate ENSO (Timmermann et al., 1999), and
some authors have suggested that it is crucial to explore the parameter space of the
coupled climate models used to make predictions ( e.g. Collins, 2000).
Climate modeling studies have found that as global air temperatures increase, the
mean state of the Pacific shifts toward a more prevalent El Nino state, with greater
relative surface warming in the equatorial Eastern Pacific (Kug et al., 2008). In another
study, Collins et al. (2000) used an ocean-atmosphere coupled model (HadCM2) and
found that a CO2 quadrupling resulted in dramatic changes to ENSO statistics. However,
29
a later study conducted with the HadCM3 model revealed opposite results with a
quadrupling of CO2, where no changes in ENSO statistics were observed (Collins,
2000b). Other studies also showed that, under global warming, the mean climate of the
Pacific may undergo significant changes, including weakened tropical easterly winds,
faster warming taking place near the equator, and temperature gradients becoming steeper
between surface and sub-surface waters (Collins et al., 2010).
30
Methodology
In order to conduct a meta-analysis, this study required a systematic approach that
collects, compiles and organizes data through the searching, scanning and analysis of
peer reviewed literature pertaining to potential future changes in weather extremes.
-Search and scanning phase
In the scanning process, I used a set of criteria to include and exclude articles
from the study. I have considered only peer reviewed articles, collected from a large
variety of journals in the environmental sciences. These journals include the Journal of
Climate, Nature Climate Change, Geophysical Research Letters, Global and Planetary
Change, Atmospheric Research, Nature Geoscience, Natural Hazards, International
Journal of Climatology, Climate Dynamics, Science, Nature, Tellus, and the Bulletin of
the American Meteorological Society. I have used a combination of specific keyword
searches using the Web of Science search engine in order to retrieve the selected various
articles of interest. Keywords include “climate change”, “greenhouse warming”, or
“global warming”, or “doubled CO2”. The specific weather events under investigation
would then be attached to these keywords in order to refine the search. Because this study
is focused on examining weather extremes in a global context, I have only included
specific regions, as several extreme weather events under study are most dominant on
certain regions. I have also focused on relatively recent research; consequently, articles
published prior to 1990 were excluded. Studies during the 1990’s had begun to
increasingly focus on the relationship between global warming and extreme weather
events; however, much of the research dedicated towards tropical cyclones began to
particularly surface beyond 2004, following the dramatic hurricane seasons of 2004 and
31
2005. 1995 also exhibited an active Atlantic hurricane season, leading to more research
efforts following that year, not only with respect to tropical storms, but for other forms of
weather extremes, as well.
In the next phase of the scanning process, I have first identified and collected
academic climate research papers that typically utilize climate modeling experiments to
project various levels of global warming based on prescribed greenhouse gas
concentration increases. Ideally, the intent of the research articles gathered for this study
was to simulate and quantify projected changes in various weather extremes that
correspond to proposed scenarios of greenhouse gas increases for the future. CO2 is one
of the most important greenhouse gases, due to its ability to strongly absorb near-infrared
and infrared radiation, and its long residence time in the atmosphere. CO2 is, therefore,
frequently used in climate impacts studies to forecast potential future climate trends,
including in terms of weather extremes. Specific CO2 scenarios used in the climate
modeling research include a doubling, tripling, quadrupling, or even a six-fold increase in
atmospheric CO2 towards various points of the 21st century, relative to pre-industrial
values, 1961-1990 climatology, or specified present-day concentrations.
In general, I have retrieved articles which focus on weather extreme occurrences
consistent with the definition of “extreme weather”, that is, weather phenomena that are
at the extremes of the historical distribution, such as severe or unseasonable weather.
Certain weather extremes, however, can be grouped with those considered in this study.
For example, changes in the frequency or intensity of mid-latitude cyclones can also be
used as an indicator for drought, or an increase/decrease in the number of major snowfall
events. Strong winds (sustained and gusts) have also been classified as an extreme
32
weather phenomenon. Strong winds are frequently attributed to a strong air pressure
gradient and are, apart from tropical cyclones and tornadoes, usually associated with
intense mid-latitude cyclonic storms. As such, changes in the number of intense mid-
latitude cyclones can reflect changes in extreme wind events.
In situations where specific articles are of particular importance, I have also
retrieved research that had been cited in these papers, especially for weather events where
keyword searches did not readily display a sufficient number of focused articles, or when
search results became less varied. Similarly, I have used cited reference searches in Web
of Science to identify and retrieve more recent articles which have cited key studies.
Conversely, I have excluded articles that only draw on results or findings from other
literature, but these articles may be useful to retrieve the original research articles in order
to gather additional data. In total, 124 articles were used for all extreme weather events
considered in this study.
-Selected weather extremes
The extreme weather events that I have considered in this study are the following:
-Tropical cyclones
-Severe thunderstorms
-Tornadoes
-Heavy precipitation (rainfall) events
-Heat waves
-Drought
-Tropical monsoons
-Mid-latitude cyclones (seasonal)
-ENSO
For a number of these events, I used a variety of proxies to assist in the
assessment of how these extreme events may change in response to future climate
warming. Parameters, such as wind shear, precipitable water, severe thunderstorm
33
development days, or soil moisture, are also helpful as proxies for multiple extreme
weather events mentioned above. I have categorized these parameters based on the
weather event(s) that they are commonly associated with, as well as those events that
depend on their presence in order to occur. For example, wind shear, soil moisture and
precipitable water are important determinants and indicators in the development of severe
thunderstorms, heavy rainfall events, tornadoes, and tropical cyclones. Heat waves and
drought can be related to soil moisture reductions. Many climate impacts literature use
this approach to help explain how, for instance, severe thunderstorms may change for the
future based on how the variables that are conducive to their development respond to
greenhouse warming.
I have also included the El Nino Southern Oscillation in this study, as it is one of
the most influential climate modulators at a global scale. Many studies have classified El
Nino and La Nina phases as being extreme events of ENSO, which, in turn, can
contribute to the development of weather extremes at a global scale at regular intervals of
3 to 7 years. Therefore, it is of interest to assess how ENSO may change in response to
climate warming in this study. It is also worth noting that I have included mid-latitude
cyclonic storms as a potential weather extreme. Mid-latitude cyclones may not
necessarily be considered an extreme event in themselves, but they can be categorized as
such if they are expected to become more numerous or increasingly intense. Furthermore,
mid-latitude cyclones are responsible for many of the weather extremes that occur at mid-
latitudes, including severe thunderstorms, strong winds, tornadoes or heat waves, and,
during the winter, they are attributed to major snowfall events, especially in the Northern
hemisphere.
34
-Data collection and interpretation
I have gathered principal findings from research papers, either from the abstract,
results, or concluding sections. I have examined the methods to identify the greenhouse
gas concentration scenarios used, as well as the corresponding global temperature
increase that was projected. I have also considered other climate studies that use
observational data analysis for context but have not include these as part of the data
collection process. When retrieving results, I have focused on identifying the specified
change in intensity and/or frequency in selected weather events for different regions.
Many articles typically use coupled GCM analyses, driven by either transient or
equilibrium greenhouse gas increases. Greenhouse gas scenarios include the IPCC
Second Report on Emissions Scenarios (A1B, A1T, A1FI, A2, B1, B2), as well as the
IS92 scenario from the IPCC Second Assessment Report. In some cases, experimentation
details do not include how global mean temperatures would change in response to
specified greenhouse gas increases. Here, it is possible that the authors of those papers
assumed that the resultant temperature increases are easily accessible; this may be
particularly true for studies that use the IPCC scenarios in their experiments, where
resulting temperature increases can be found in the original IPCC reports. When this
information was not readily available, I have attempted to contact the author(s) of those
articles directly to request the necessary data.
The majority of the literature that I surveyed included information about global
mean temperature change and was centered within a global context. However, there are
some studies that report temperature changes at a regional, rather than a global scale.
Where regional mean temperatures are provided, it was necessary to apply upscaling
35
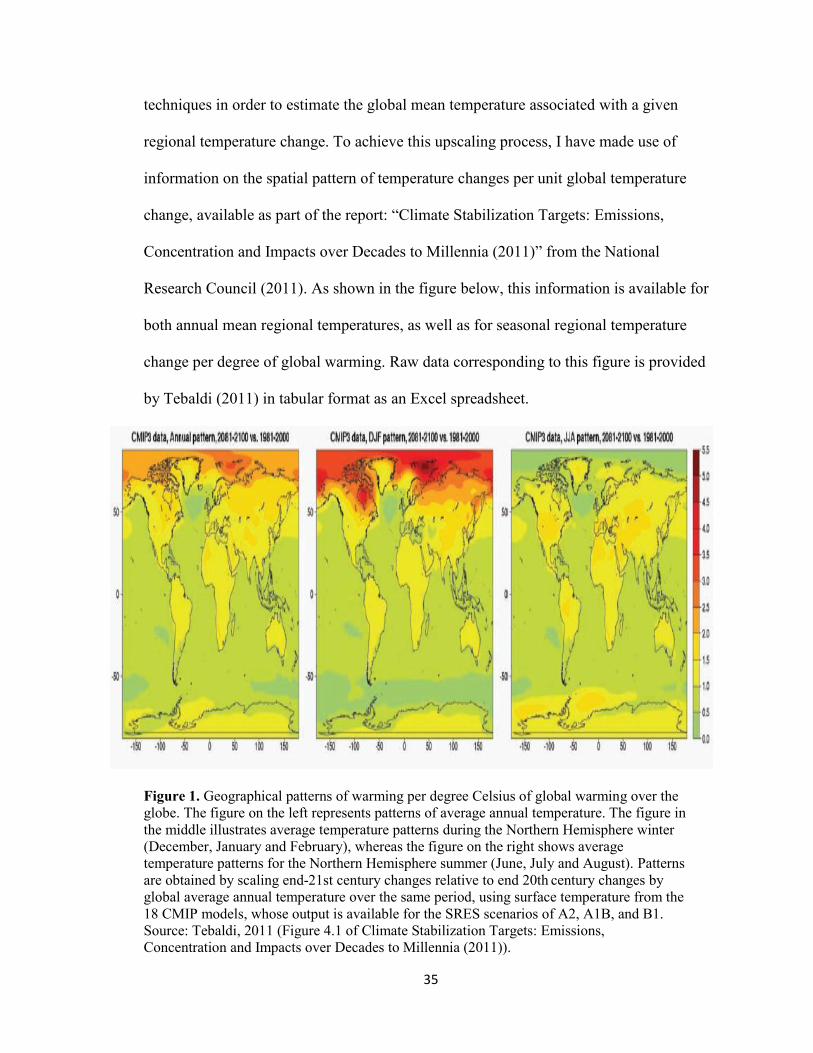
techniques in order to estimate the global mean temperature associated with a given
regional temperature change. To achieve this upscaling process, I have made use of
information on the spatial pattern of temperature changes per unit global temperature
change, available as part of the report: “Climate Stabilization Targets: Emissions,
Concentration and Impacts over Decades to Millennia (2011)” from the National
Research Council (2011). As shown in the figure below, this information is available for
both annual mean regional temperatures, as well as for seasonal regional temperature
change per degree of global warming. Raw data corresponding to this figure is provided
by Tebaldi (2011) in tabular format as an Excel spreadsheet.
Figure 1. Geographical patterns of warming per degree Celsius of global warming over the
globe. The figure on the left represents patterns of average annual temperature. The figure in
the middle illustrates average temperature patterns during the Northern Hemisphere winter
(December, January and February), whereas the figure on the right shows average
temperature patterns for the Northern Hemisphere summer (June, July and August). Patterns
are obtained by scaling end-21st century changes relative to end 20th century changes by
global average annual temperature over the same period, using surface temperature from the
18 CMIP models, whose output is available for the SRES scenarios of A2, A1B, and B1.
Source: Tebaldi, 2011 (Figure 4.1 of Climate Stabilization Targets: Emissions,
Concentration and Impacts over Decades to Millennia (2011)).
36
Warm SSTs are an important parameter for the development of a tropical
cyclone. As such, prescribed SSTs, or resultant SSTs from global warming scenarios, are
commonly used in climate modeling studies that simulate and project changes in tropical
cyclone behavior. Because this study focused on global mean temperature changes, I
have used upscaling methods to convert projected SST warming, either globally or
regionally, into a global mean air temperature change. I have employed upscaling
methods by using combined air temperature anomaly data (water + land), and global air
temperature anomaly data over water alone. The data that I used was supplied by the
Climate Research Unit and covers a time series from 1850 to the present, and it shows a
total estimated warming of 0.6 Celsius between the 1850-1879 and 1981-2010
climatologies. It also assumes that air temperature anomalies directly over water are
identical to SST anomalies. Thus, it was feasible to convert a given SST change, relative
to a prescribed baseline period, into an approximate global warming by using these
available historical SST anomalies. In cases where only regional or local SSTs were
given, I used data from Tebaldi (2011) and interpolated it in GIS software to calculate
relevant average temperature changes, so that a conversion factor may be found for a
given area of interest. As such, I upscaled a regional or local SST change into a global
mean temperature change in this way. Again, I have assumed that SST warming is similar
to the warming of the air directly above the sea-surface. Data is provided in this manner
because marine air temperatures lack consistency in coverage and are, consequently, not
spatially homogeneous, as compared to SSTs (Climate Research Unit, 2013).
For this study, the data that I collected for all the selected variables is expressed as
a percentage change, which is relative to given prescribed baseline periods adhering to
37
their respective climate modeling studies. In many cases, data is originally given as a
percent change in climate studies, but absolute values are not provided. Where data is
expressed as absolute changes, however, I have derived a percent change. As a result, all
changes, both global mean temperature, and corresponding (percent) changes for a given
extreme weather event, is provided relative to various reference periods for the different
studies considered. Once percentage changes are gathered, I have converted them into a
percent change per degree Celsius of global warming. In some cases, multiple studies use
different climate change scenarios for the same model(s). Under these circumstances,
associated results are not considered to be independent, and the effect of pseudo-
replication exists. To account for replicated data, I averaged data given for scenarios
corresponding to the same model into a single data point. I have then placed a discussion
of the results given by the output of the statistical tests, followed by a synthesis of
meteorological factors that may be attributed to the changes.
All of the studies that I considered in this paper, as well as their documented
changes per degree Celsius of global warming, are presented in Table 9 (Appendix), and
all variables used, along with a brief description and number of data points for each, are
outlined in the following table (Table 1). The number of data points for each selected
parameter is defined as a collection of results gathered from the body of climate impacts
literature. Data points do not represent the total number of studies for a given parameter
but instead reflect the total number of results derived from the studies for that particular
parameter. This is especially true where studies use multiple models to assess changes in
a specified variable with respect to global warming; thus, results from individual models
from the same study represent a separate data point. Each individual data point represents
38
a change (percent or absolute) per degree Celsius of global warming. In cases of
replicated results, these data points were averaged into a single point.
-Statistical analysis
Once the necessary data is compiled for each extreme weather event, I have
employed the one-sample t-test, as well as its non-parametric counterpart, the Wilcoxon
Rank Sum test, using R software. “R” is a programming software used largely for
statistical computing and graphics. These tests were particularly useful to statistically
evaluate the degree of significance associated with a derived change in intensity and/or
frequency of selected extreme weather events per degree Celsius of global warming. The
one-sample t-test is a widely used statistical test to compare the means of groups and
primarily assumes that data is normally distributed, and that random sampling has no
selection bias. The Wilcoxon Rank Sum test, on the other hand, assumes that the data is
not normally distributed and is only based on the ranking of observations of a given
sample. As such, the test statistic given by the Wilcoxon Rank Sum test is based on the
sum of ranks for observations from a sample. The null hypothesis would be that there is
no significant change in a given extreme weather event per degree Celsius of global
warming. Small p-value results derived from these tests would, thus, indicate statistically
significant changes in the patterns of a given extreme weather event per degree Celsius of
global warming. Before the appropriate statistical test could be determined, however, I
have used the Normal Quantile-Quantile diagnostic plot to test and verify if the various
collected datasets are of normally distributed nature. Here, the normality of a given
dataset can be determined based on linearity exhibited by the Normal Quantile-Qunatile
plots. Thus, when these plots show a data distribution that is linear in nature, the data
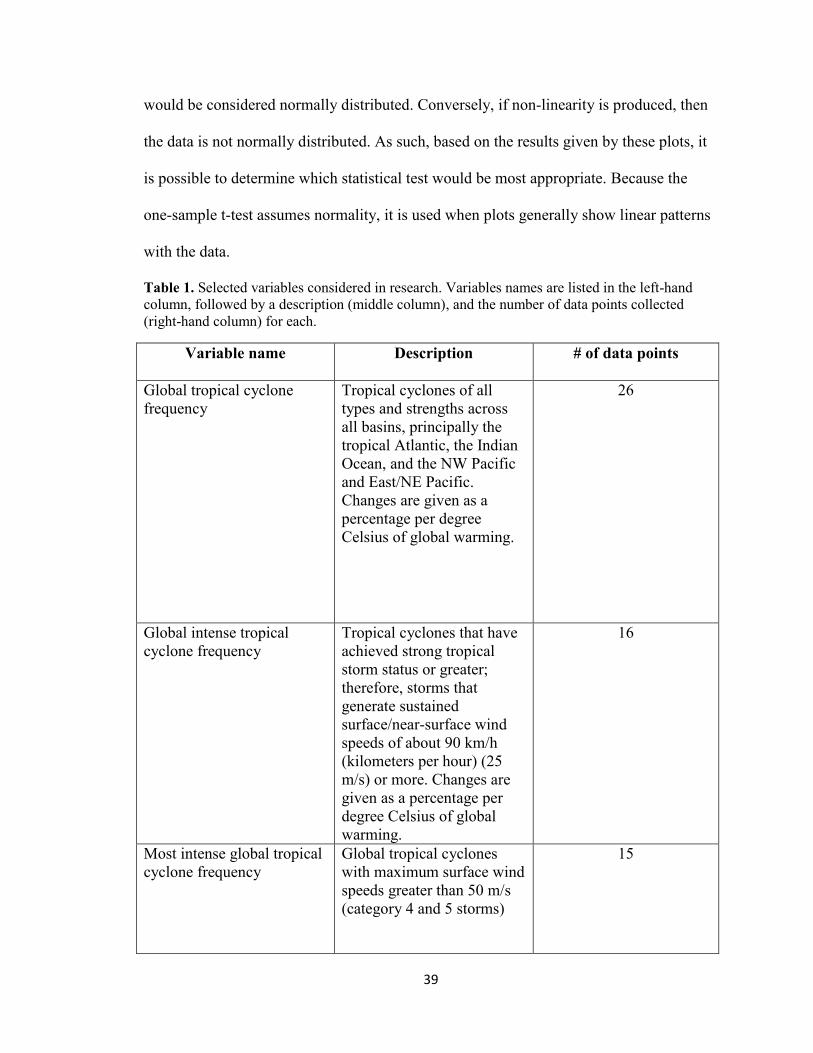
39
would be considered normally distributed. Conversely, if non-linearity is produced, then
the data is not normally distributed. As such, based on the results given by these plots, it
is possible to determine which statistical test would be most appropriate. Because the
one-sample t-test assumes normality, it is used when plots generally show linear patterns
with the data.
Table 1. Selected variables considered in research. Variables names are listed in the left-hand
column, followed by a description (middle column), and the number of data points collected
(right-hand column) for each.
Variable name Description # of data points
Global tropical cyclone
frequency
Tropical cyclones of all
types and strengths across
all basins, principally the
tropical Atlantic, the Indian
Ocean, and the NW Pacific
and East/NE Pacific.
Changes are given as a
percentage per degree
Celsius of global warming.
26
Global intense tropical
cyclone frequency
Tropical cyclones that have
achieved strong tropical
storm status or greater;
therefore, storms that
generate sustained
surface/near-surface wind
speeds of about 90 km/h
(kilometers per hour) (25
m/s) or more. Changes are
given as a percentage per
degree Celsius of global
warming.
16
Most intense global tropical
cyclone frequency
Global tropical cyclones
with maximum surface wind
speeds greater than 50 m/s
(category 4 and 5 storms)
15
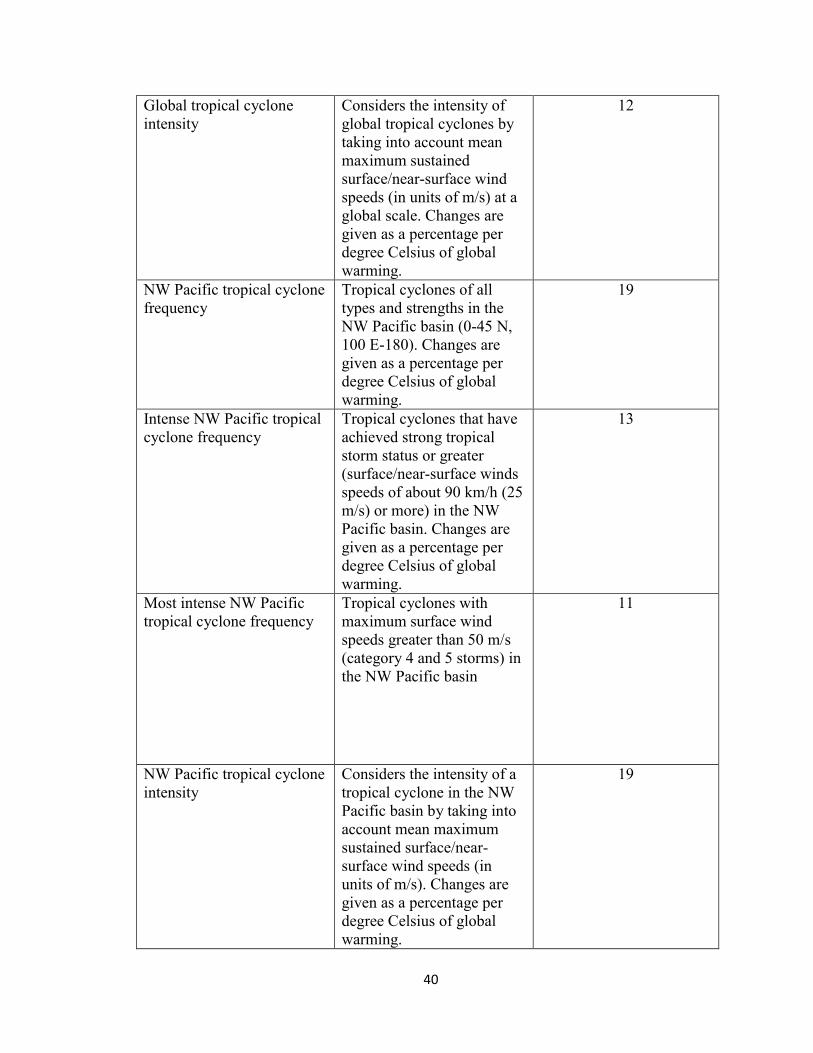
40
Global tropical cyclone
intensity
Considers the intensity of
global tropical cyclones by
taking into account mean
maximum sustained
surface/near-surface wind
speeds (in units of m/s) at a
global scale. Changes are
given as a percentage per
degree Celsius of global
warming.
12
NW Pacific tropical cyclone
frequency
Tropical cyclones of all
types and strengths in the
NW Pacific basin (0-45 N,
100 E-180). Changes are
given as a percentage per
degree Celsius of global
warming.
19
Intense NW Pacific tropical
cyclone frequency
Tropical cyclones that have
achieved strong tropical
storm status or greater
(surface/near-surface winds
speeds of about 90 km/h (25
m/s) or more) in the NW
Pacific basin. Changes are
given as a percentage per
degree Celsius of global
warming.
13
Most intense NW Pacific
tropical cyclone frequency
Tropical cyclones with
maximum surface wind
speeds greater than 50 m/s
(category 4 and 5 storms) in
the NW Pacific basin
11
NW Pacific tropical cyclone
intensity
Considers the intensity of a
tropical cyclone in the NW
Pacific basin by taking into
account mean maximum
sustained surface/near-
surface wind speeds (in
units of m/s). Changes are
given as a percentage per
degree Celsius of global
warming.
19
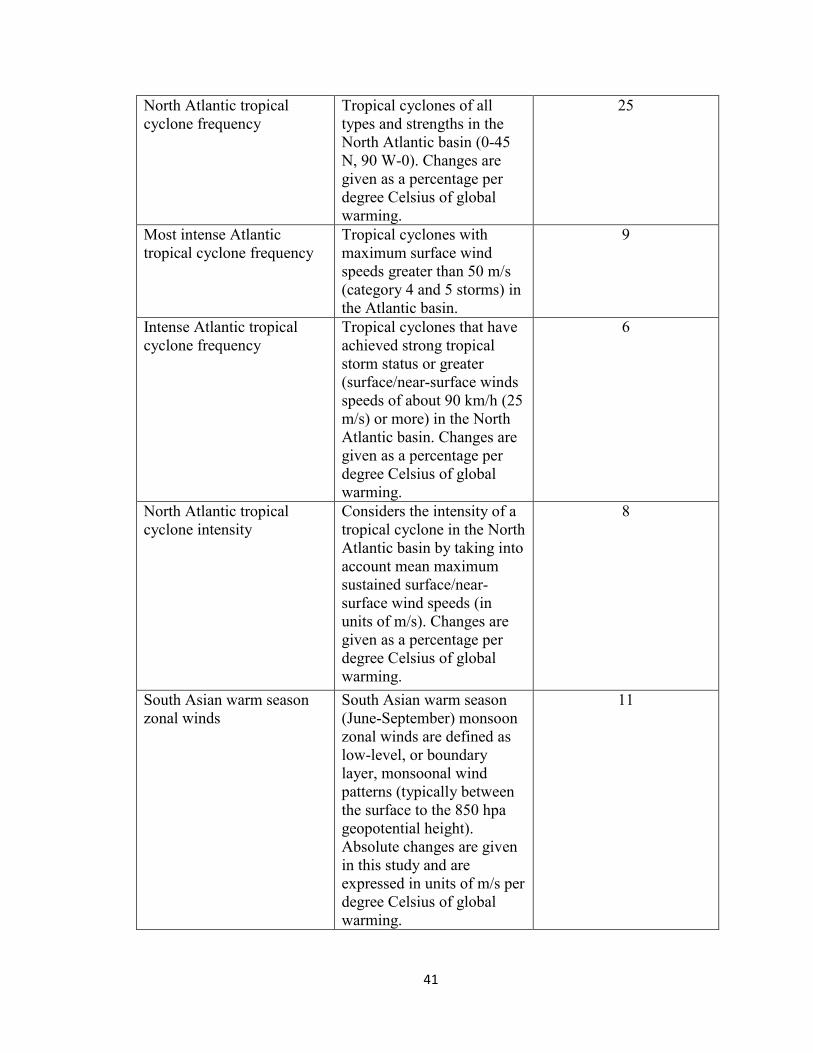
41
North Atlantic tropical
cyclone frequency
Tropical cyclones of all
types and strengths in the
North Atlantic basin (0-45
N, 90 W-0). Changes are
given as a percentage per
degree Celsius of global
warming.
25
Most intense Atlantic
tropical cyclone frequency
Tropical cyclones with
maximum surface wind
speeds greater than 50 m/s
(category 4 and 5 storms) in
the Atlantic basin.
9
Intense Atlantic tropical
cyclone frequency
Tropical cyclones that have
achieved strong tropical
storm status or greater
(surface/near-surface winds
speeds of about 90 km/h (25
m/s) or more) in the North
Atlantic basin. Changes are
given as a percentage per
degree Celsius of global
warming.
6
North Atlantic tropical
cyclone intensity
Considers the intensity of a
tropical cyclone in the North
Atlantic basin by taking into
account mean maximum
sustained surface/near-
surface wind speeds (in
units of m/s). Changes are
given as a percentage per
degree Celsius of global
warming.
8
South Asian warm season
zonal winds
South Asian warm season
(June-September) monsoon
zonal winds are defined as
low-level, or boundary
layer, monsoonal wind
patterns (typically between
the surface to the 850 hpa
geopotential height).
Absolute changes are given
in this study and are
expressed in units of m/s per
degree Celsius of global
warming.
11
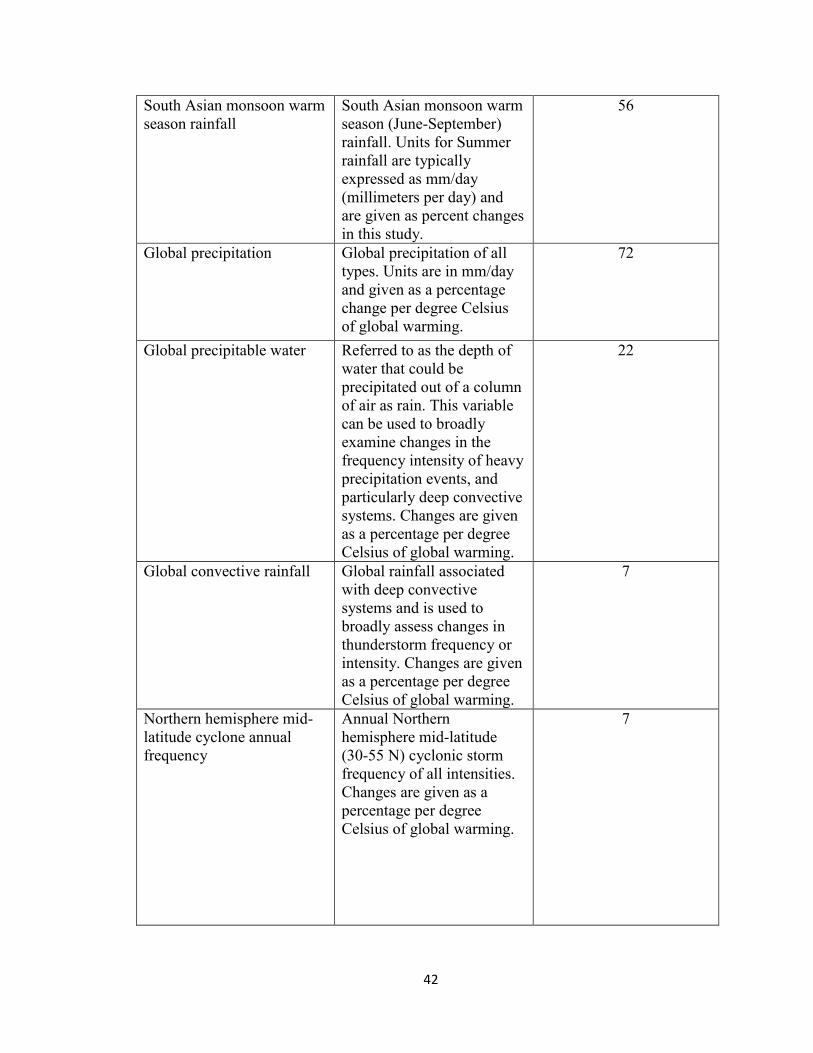
42
South Asian monsoon warm
season rainfall
South Asian monsoon warm
season (June-September)
rainfall. Units for Summer
rainfall are typically
expressed as mm/day
(millimeters per day) and
are given as percent changes
in this study.
56
Global precipitation Global precipitation of all
types. Units are in mm/day
and given as a percentage
change per degree Celsius
of global warming.
72
Global precipitable water Referred to as the depth of
water that could be
precipitated out of a column
of air as rain. This variable
can be used to broadly
examine changes in the
frequency intensity of heavy
precipitation events, and
particularly deep convective
systems. Changes are given
as a percentage per degree
Celsius of global warming.
22
Global convective rainfall Global rainfall associated
with deep convective
systems and is used to
broadly assess changes in
thunderstorm frequency or
intensity. Changes are given
as a percentage per degree
Celsius of global warming.
7
Northern hemisphere mid-
latitude cyclone annual
frequency
Annual Northern
hemisphere mid-latitude
(30-55 N) cyclonic storm
frequency of all intensities.
Changes are given as a
percentage per degree
Celsius of global warming.
7
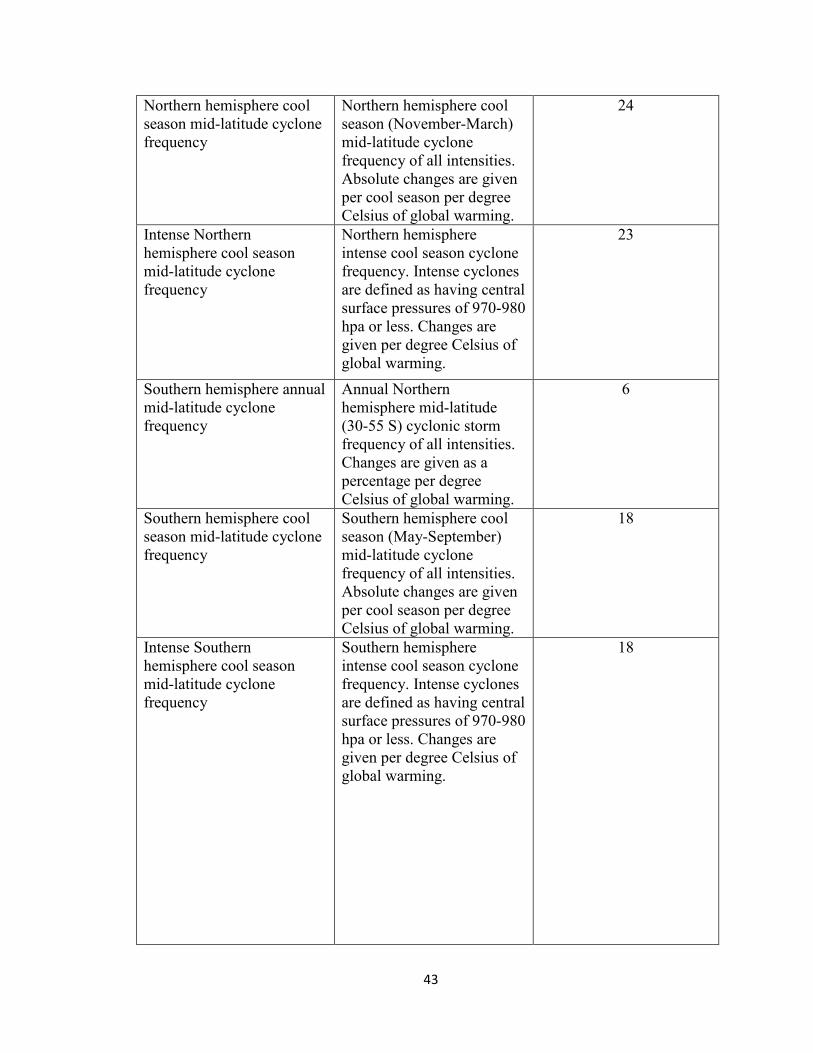
43
Northern hemisphere cool
season mid-latitude cyclone
frequency
Northern hemisphere cool
season (November-March)
mid-latitude cyclone
frequency of all intensities.
Absolute changes are given
per cool season per degree
Celsius of global warming.
24
Intense Northern
hemisphere cool season
mid-latitude cyclone
frequency
Northern hemisphere
intense cool season cyclone
frequency. Intense cyclones
are defined as having central
surface pressures of 970-980
hpa or less. Changes are
given per degree Celsius of
global warming.
23
Southern hemisphere annual
mid-latitude cyclone
frequency
Annual Northern
hemisphere mid-latitude
(30-55 S) cyclonic storm
frequency of all intensities.
Changes are given as a
percentage per degree
Celsius of global warming.
6
Southern hemisphere cool
season mid-latitude cyclone
frequency
Southern hemisphere cool
season (May-September)
mid-latitude cyclone
frequency of all intensities.
Absolute changes are given
per cool season per degree
Celsius of global warming.
18
Intense Southern
hemisphere cool season
mid-latitude cyclone
frequency
Southern hemisphere
intense cool season cyclone
frequency. Intense cyclones
are defined as having central
surface pressures of 970-980
hpa or less. Changes are
given per degree Celsius of
global warming.
18
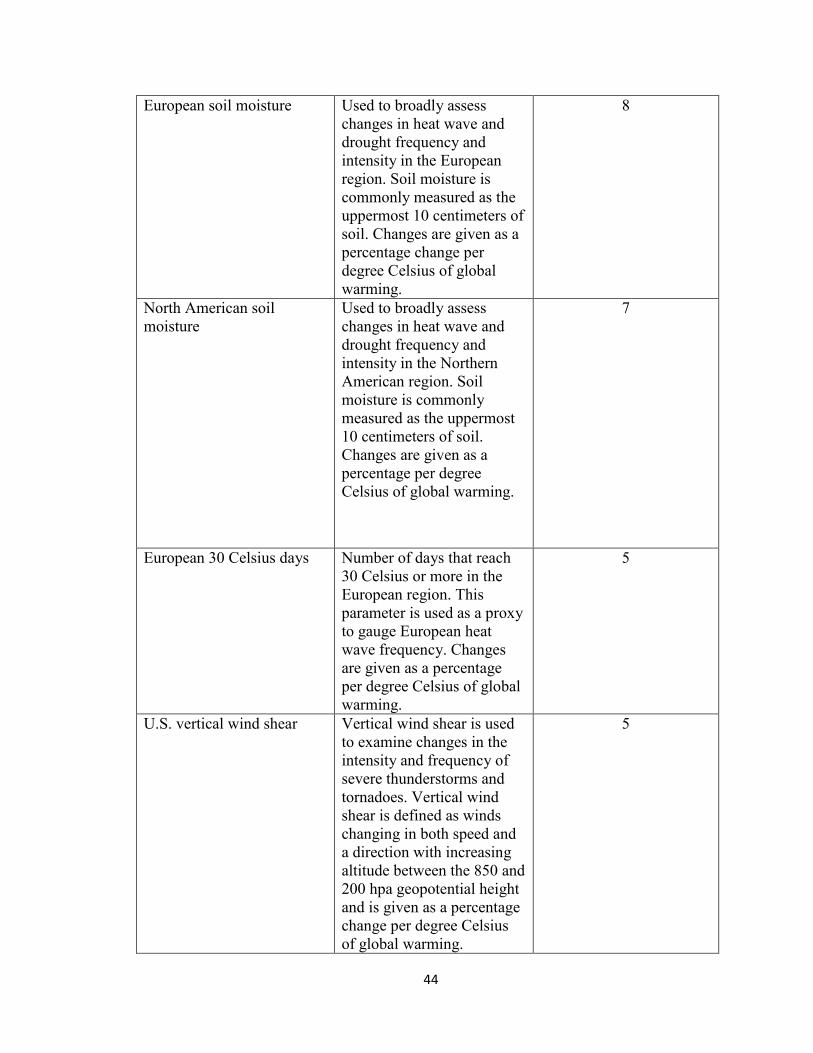
44
European soil moisture Used to broadly assess
changes in heat wave and
drought frequency and
intensity in the European
region. Soil moisture is
commonly measured as the
uppermost 10 centimeters of
soil. Changes are given as a
percentage change per
degree Celsius of global
warming.
8
North American soil
moisture
Used to broadly assess
changes in heat wave and
drought frequency and
intensity in the Northern
American region. Soil
moisture is commonly
measured as the uppermost
10 centimeters of soil.
Changes are given as a
percentage per degree
Celsius of global warming.
7
European 30 Celsius days Number of days that reach
30 Celsius or more in the
European region. This
parameter is used as a proxy
to gauge European heat
wave frequency. Changes
are given as a percentage
per degree Celsius of global
warming.
5
U.S. vertical wind shear Vertical wind shear is used
to examine changes in the
intensity and frequency of
severe thunderstorms and
tornadoes. Vertical wind
shear is defined as winds
changing in both speed and
a direction with increasing
altitude between the 850 and
200 hpa geopotential height
and is given as a percentage
change per degree Celsius
of global warming.
5
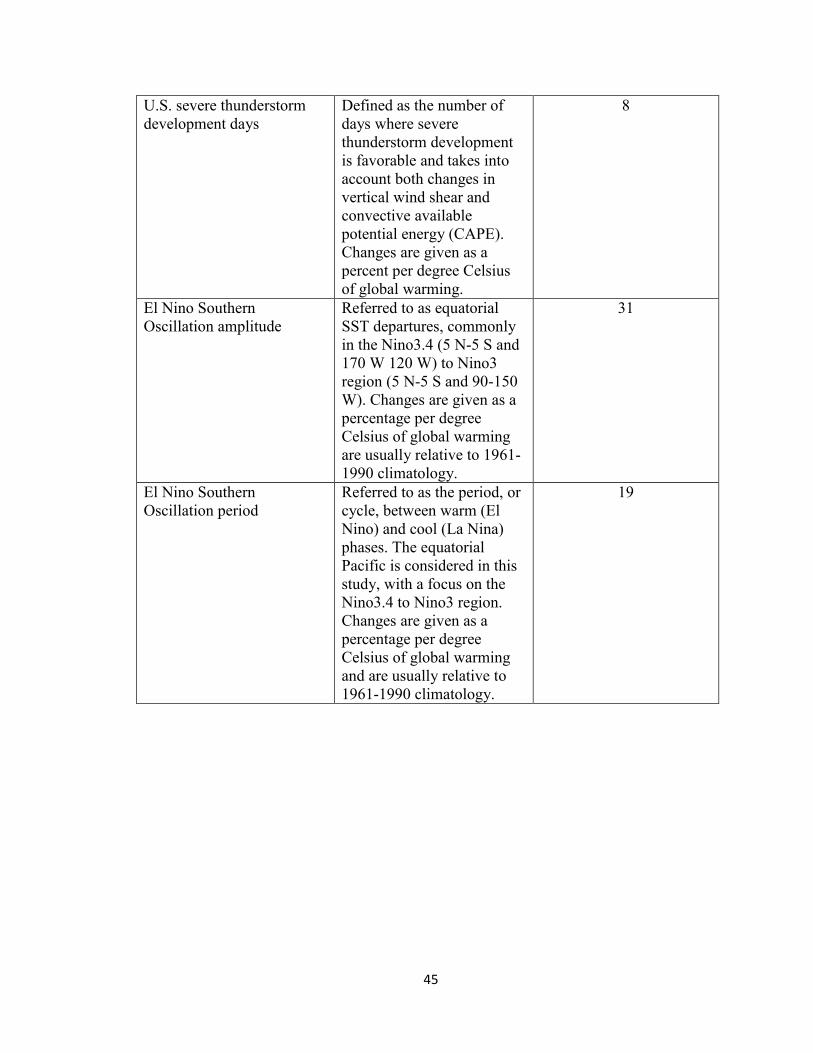
45
U.S. severe thunderstorm
development days
Defined as the number of
days where severe
thunderstorm development
is favorable and takes into
account both changes in
vertical wind shear and
convective available
potential energy (CAPE).
Changes are given as a
percent per degree Celsius
of global warming.
8
El Nino Southern
Oscillation amplitude
Referred to as equatorial
SST departures, commonly
in the Nino3.4 (5 N-5 S and
170 W 120 W) to Nino3
region (5 N-5 S and 90-150
W). Changes are given as a
percentage per degree
Celsius of global warming
are usually relative to 1961-
1990 climatology.
31
El Nino Southern
Oscillation period
Referred to as the period, or
cycle, between warm (El
Nino) and cool (La Nina)
phases. The equatorial
Pacific is considered in this
study, with a focus on the
Nino3.4 to Nino3 region.
Changes are given as a
percentage per degree
Celsius of global warming
and are usually relative to
1961-1990 climatology.
19
46
Results
-Global and regional tropical cyclones
This section draws on the findings provided for the frequency of global and
regional tropical cyclones, the number of intense storms, the number of the most intense
storms, as well as changes in storm intensity per degree Celsius of global warming, which
is represented in figures 2, 3, 4 and 5. Table 2 summarizes the significance results for the
selected variables used to assess global and regional tropical cyclone frequency and
intensity, along with corresponding statistical tests (either the one-sample t-test or
Wilcoxon Rank Sum test).
Global and regional tropical cyclone frequency is first examined. Figure 2a shows
a trend towards decreasing global tropical cyclones, where the majority of data points (20
out of 26) favor a decline with global warming, with an average decrease of 7.2% per
degree Celsius of global warming. The results given by the one-sample t-test show that
the decrease in global tropical cyclone frequency is highly statistically significant at the
1% significance level (p=0.01), as shown in Table 2.
When analyzing regional variations in tropical cyclone frequency in the Atlantic
and NW Pacific basins, the overall distribution of these frequencies follows a similar
pattern to that exhibited at the global scale, mostly for the NW Pacific, as shown in figure
2b. Like global patterns, a trend towards a decrease in tropical cyclones is observed in the
NW Pacific, with most data points (11 out of 19) indicating a decline, with an average
decrease of -5.5% per degree Celsius of global warming. However, the results are not
statistically significant (p=0.18), as noted in Table 2. In the Atlantic basin, a similar trend
towards a decrease in tropical cyclones can be seen per degree Celsius of global warming
47
(figure 2c), where a large number of the total data points (16 out of 25) suggests a
decrease, although the result, much like for the NW Pacific, is not significant (p=0.60).
In contrast to tropical cyclone frequency at global and regional scales, the
findings show that there is an increase in the number of intense storms at regional scales.
At the global scale, no apparent change (p=0.91) in the number of intense storms is
obvious (figure 3a), where a near-even divide in the number of data points shows an
increase and decrease. At regional scales, however, the results are shown to differ. In the
NW Pacific, for example, as shown in figure 3b, the number of intense storms favors a
significant increasing trend (p=0.03), with a mean increase of 12.3%. By comparison, for
intense tropical cyclone frequency, with respect to the Atlantic basin (figure 3c), a
decrease in the number of these storms is given, where most of the data points (7 out of
9) support a decline, with an average decrease of about 6.7%. This decrease is also shown
to be significant within the 5% significance level (p=0.04). When specifically examining
the most intense tropical cyclones, that is, category 4 and 5 cyclones, the patterns are
shown to be generally similar to the number of intense storms. Globally, an average
increase of 13% in the most intense storms is shown, though the results are not significant
(p=0.15), as given in Table 2. Figure 4b, by contrast, illustrates a clearer trend towards an
increase in the most intense storms for the NW Pacific basin, where all of the data points
(11) indicate an increase, with an average increase of 18.7% per degree Celsius of global
warming. This increase is shown to be highly statistically significant (p<0.01). In the
Atlantic, a similar average increase (about 20%), as shown in figure 4c, is observed, but
the result is not significant (p=0.22).
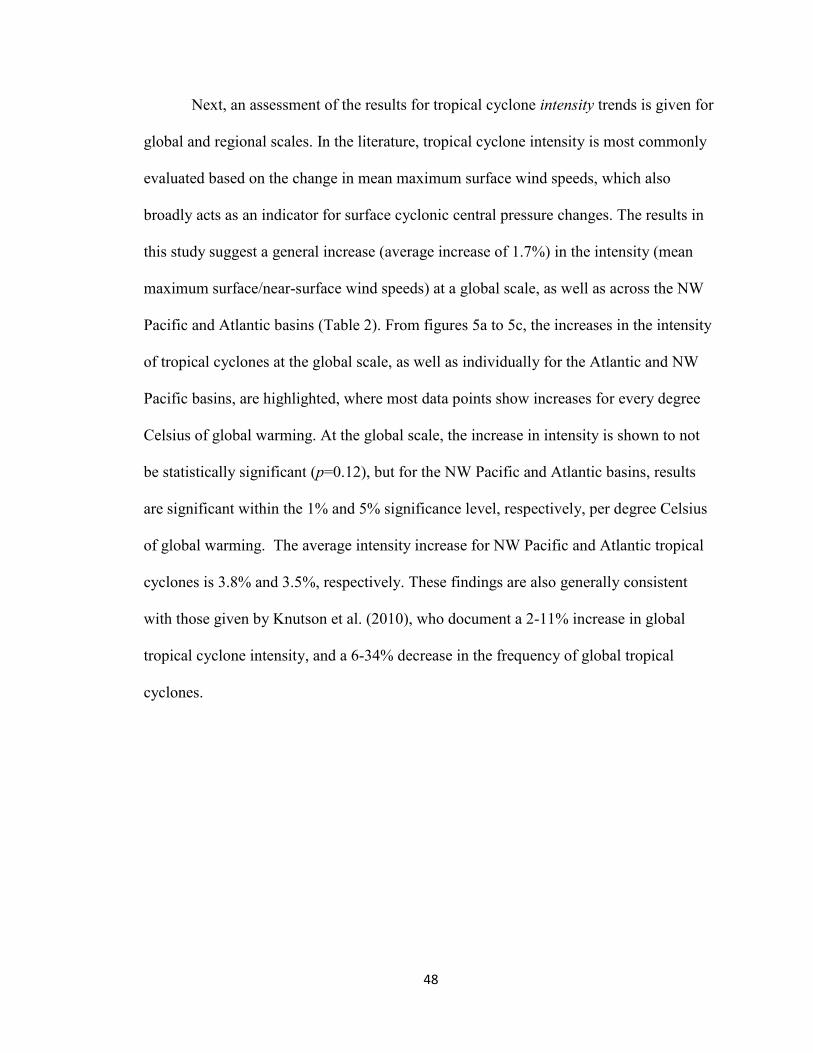
48
Next, an assessment of the results for tropical cyclone intensity trends is given for
global and regional scales. In the literature, tropical cyclone intensity is most commonly
evaluated based on the change in mean maximum surface wind speeds, which also
broadly acts as an indicator for surface cyclonic central pressure changes. The results in
this study suggest a general increase (average increase of 1.7%) in the intensity (mean
maximum surface/near-surface wind speeds) at a global scale, as well as across the NW
Pacific and Atlantic basins (Table 2). From figures 5a to 5c, the increases in the intensity
of tropical cyclones at the global scale, as well as individually for the Atlantic and NW
Pacific basins, are highlighted, where most data points show increases for every degree
Celsius of global warming. At the global scale, the increase in intensity is shown to not
be statistically significant (p=0.12), but for the NW Pacific and Atlantic basins, results
are significant within the 1% and 5% significance level, respectively, per degree Celsius
of global warming. The average intensity increase for NW Pacific and Atlantic tropical
cyclones is 3.8% and 3.5%, respectively. These findings are also generally consistent
with those given by Knutson et al. (2010), who document a 2-11% increase in global
tropical cyclone intensity, and a 6-34% decrease in the frequency of global tropical
cyclones.
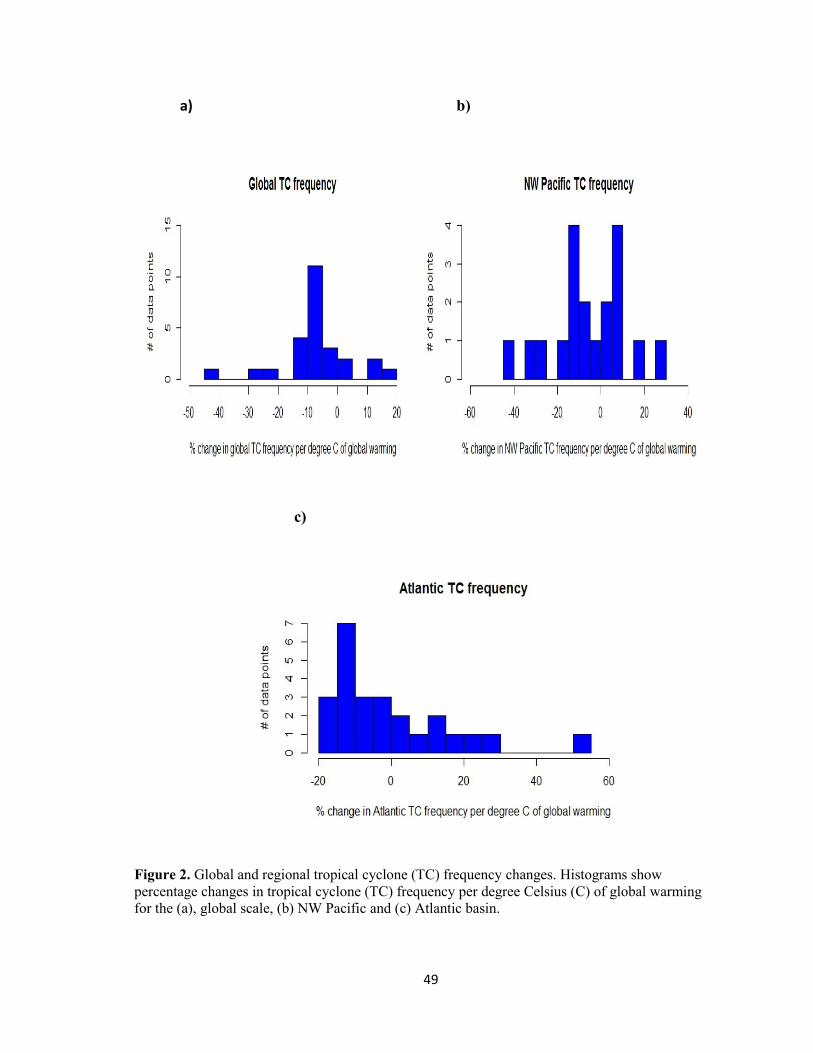
49
a) b)
c)
Figure 2. Global and regional tropical cyclone (TC) frequency changes. Histograms show
percentage changes in tropical cyclone (TC) frequency per degree Celsius (C) of global warming
for the (a), global scale, (b) NW Pacific and (c) Atlantic basin.
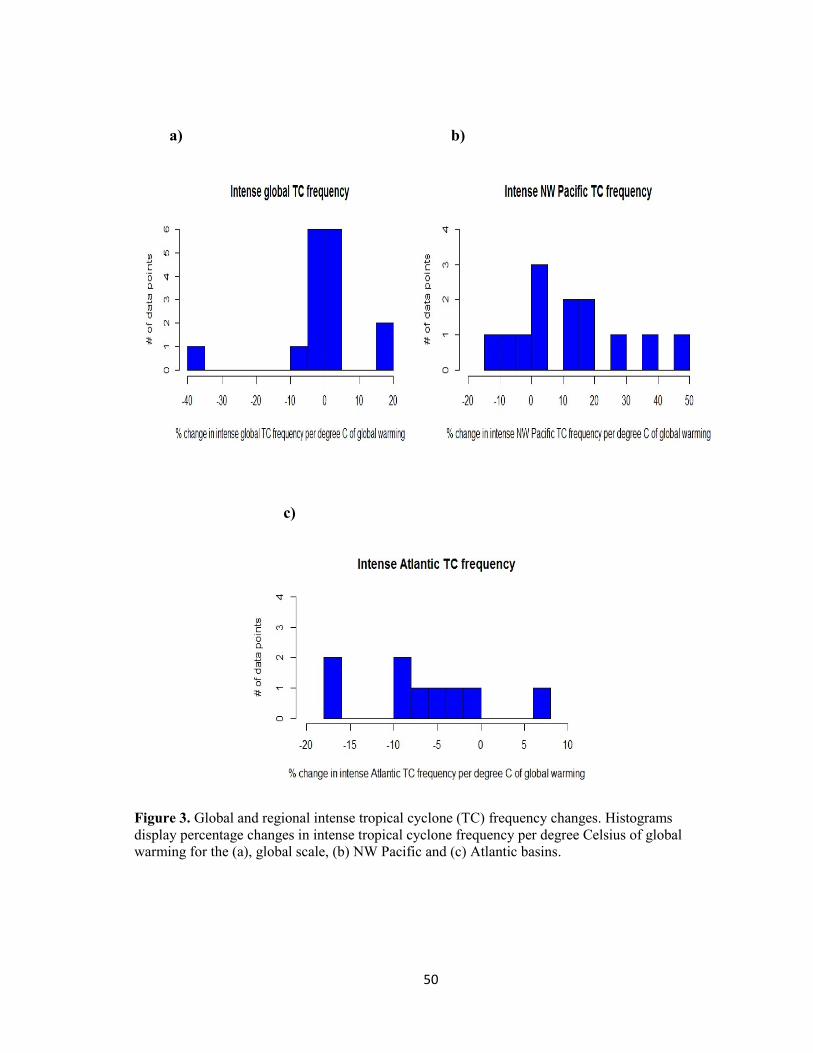
50
a) b)
c)
Figure 3. Global and regional intense tropical cyclone (TC) frequency changes. Histograms
display percentage changes in intense tropical cyclone frequency per degree Celsius of global
warming for the (a), global scale, (b) NW Pacific and (c) Atlantic basins.
51
a) b)
c)
Figure 4. Most intense global and regional tropical cyclone (TC) frequency changes, based on
maximum sustained surface winds greater than 50 m/s, or category 4 and 5 cyclones. Histograms
display percentage changes for the frequency of the most intense tropical cyclones per degree
Celsius of global warming for the (a), global scale, (b) NW Pacific and (c) Atlantic basins.
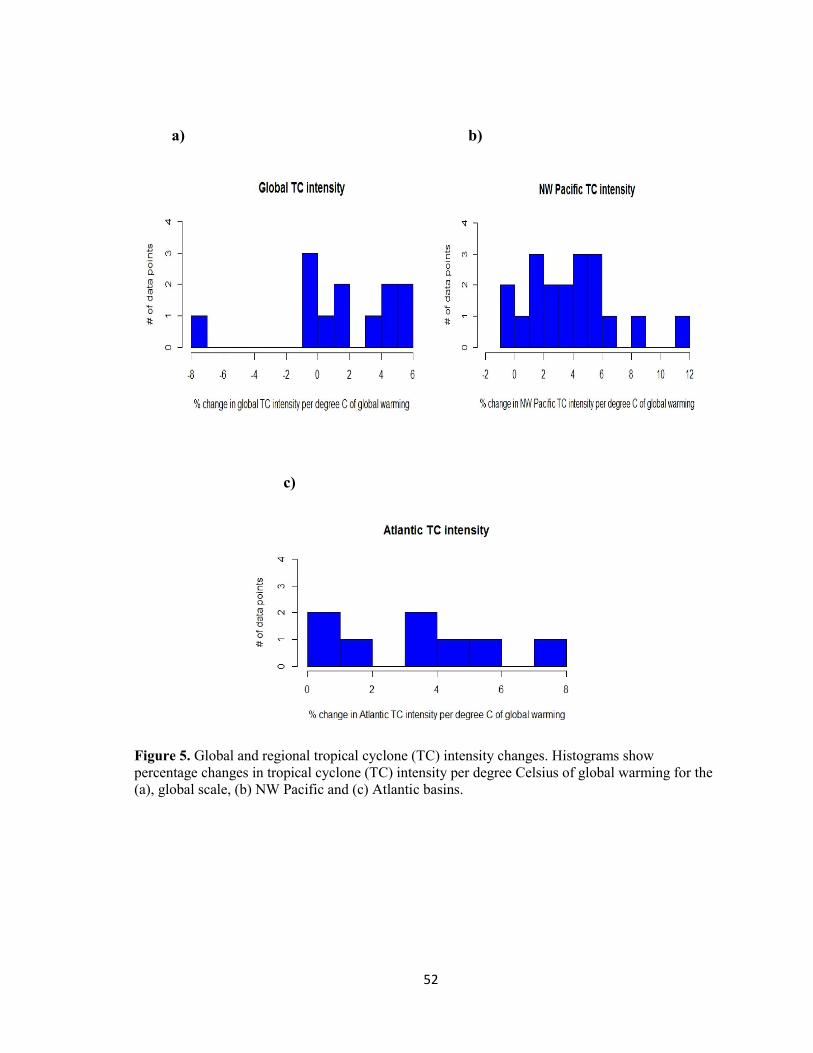
52
a) b)
c)
Figure 5. Global and regional tropical cyclone (TC) intensity changes. Histograms show
percentage changes in tropical cyclone (TC) intensity per degree Celsius of global warming for the
(a), global scale, (b) NW Pacific and (c) Atlantic basins.
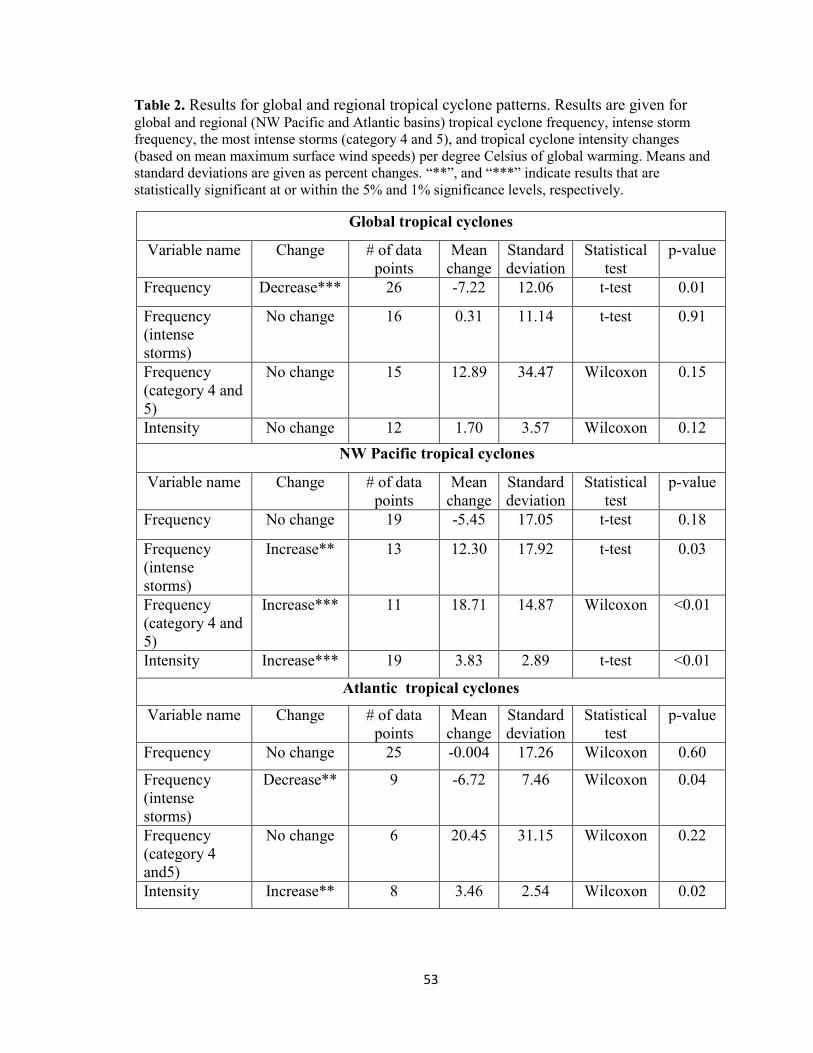
53
Table 2. Results for global and regional tropical cyclone patterns. Results are given for global and regional (NW Pacific and Atlantic basins) tropical cyclone frequency, intense storm
frequency, the most intense storms (category 4 and 5), and tropical cyclone intensity changes
(based on mean maximum surface wind speeds) per degree Celsius of global warming. Means and
standard deviations are given as percent changes. “**”, and “***” indicate results that are
statistically significant at or within the 5% and 1% significance levels, respectively.
Global tropical cyclones
Variable name Change # of data
points
Mean
change
Standard
deviation
Statistical
test
p-value
Frequency Decrease*** 26 -7.22 12.06 t-test 0.01
Frequency
(intense
storms)
No change 16 0.31 11.14 t-test 0.91
Frequency
(category 4 and
5)
No change 15 12.89 34.47 Wilcoxon 0.15
Intensity No change 12 1.70 3.57 Wilcoxon 0.12
NW Pacific tropical cyclones
Variable name Change # of data
points
Mean
change
Standard
deviation
Statistical
test
p-value
Frequency No change 19 -5.45 17.05 t-test 0.18
Frequency
(intense
storms)
Increase** 13 12.30 17.92 t-test 0.03
Frequency
(category 4 and
5)
Increase*** 11 18.71 14.87 Wilcoxon <0.01
Intensity Increase*** 19 3.83 2.89 t-test <0.01
Atlantic tropical cyclones
Variable name Change # of data
points
Mean
change
Standard
deviation
Statistical
test
p-value
Frequency No change 25 -0.004 17.26 Wilcoxon 0.60
Frequency
(intense
storms)
Decrease** 9 -6.72 7.46 Wilcoxon 0.04
Frequency
(category 4
and5)
No change 6 20.45 31.15 Wilcoxon 0.22
Intensity Increase** 8 3.46 2.54 Wilcoxon 0.02
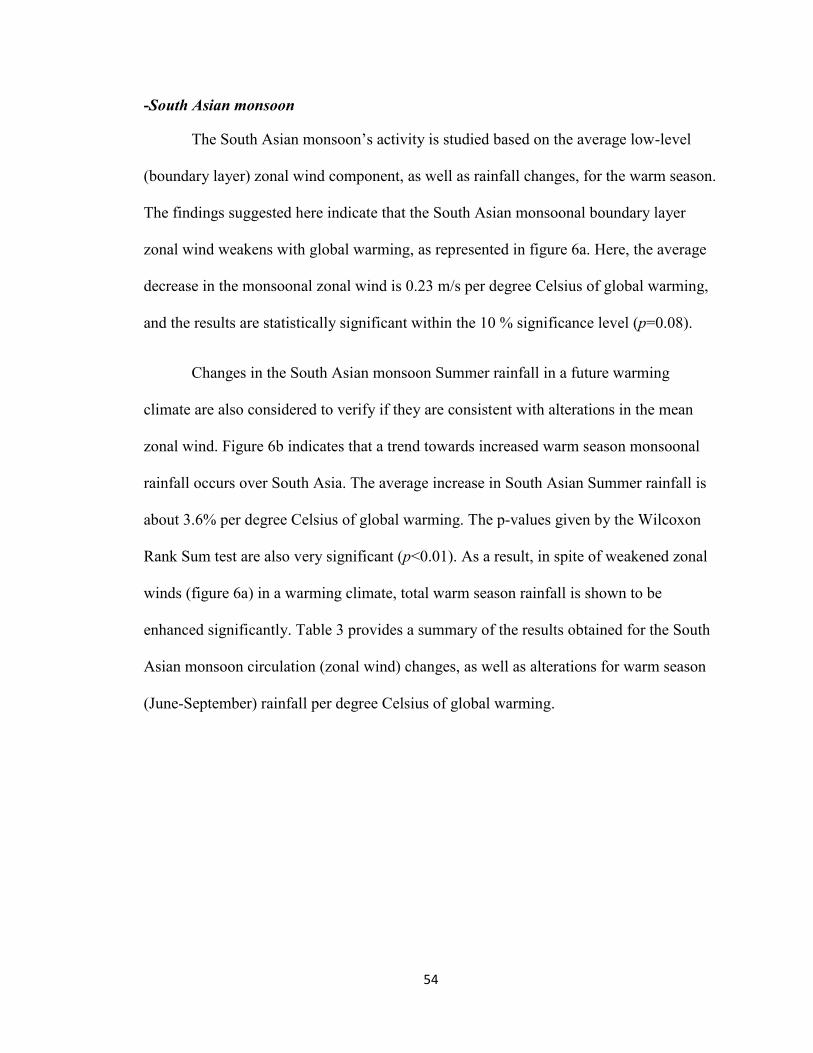
54
-South Asian monsoon
The South Asian monsoon’s activity is studied based on the average low-level
(boundary layer) zonal wind component, as well as rainfall changes, for the warm season.
The findings suggested here indicate that the South Asian monsoonal boundary layer
zonal wind weakens with global warming, as represented in figure 6a. Here, the average
decrease in the monsoonal zonal wind is 0.23 m/s per degree Celsius of global warming,
and the results are statistically significant within the 10 % significance level (p=0.08).
Changes in the South Asian monsoon Summer rainfall in a future warming
climate are also considered to verify if they are consistent with alterations in the mean
zonal wind. Figure 6b indicates that a trend towards increased warm season monsoonal
rainfall occurs over South Asia. The average increase in South Asian Summer rainfall is
about 3.6% per degree Celsius of global warming. The p-values given by the Wilcoxon
Rank Sum test are also very significant (p<0.01). As a result, in spite of weakened zonal
winds (figure 6a) in a warming climate, total warm season rainfall is shown to be
enhanced significantly. Table 3 provides a summary of the results obtained for the South
Asian monsoon circulation (zonal wind) changes, as well as alterations for warm season
(June-September) rainfall per degree Celsius of global warming.
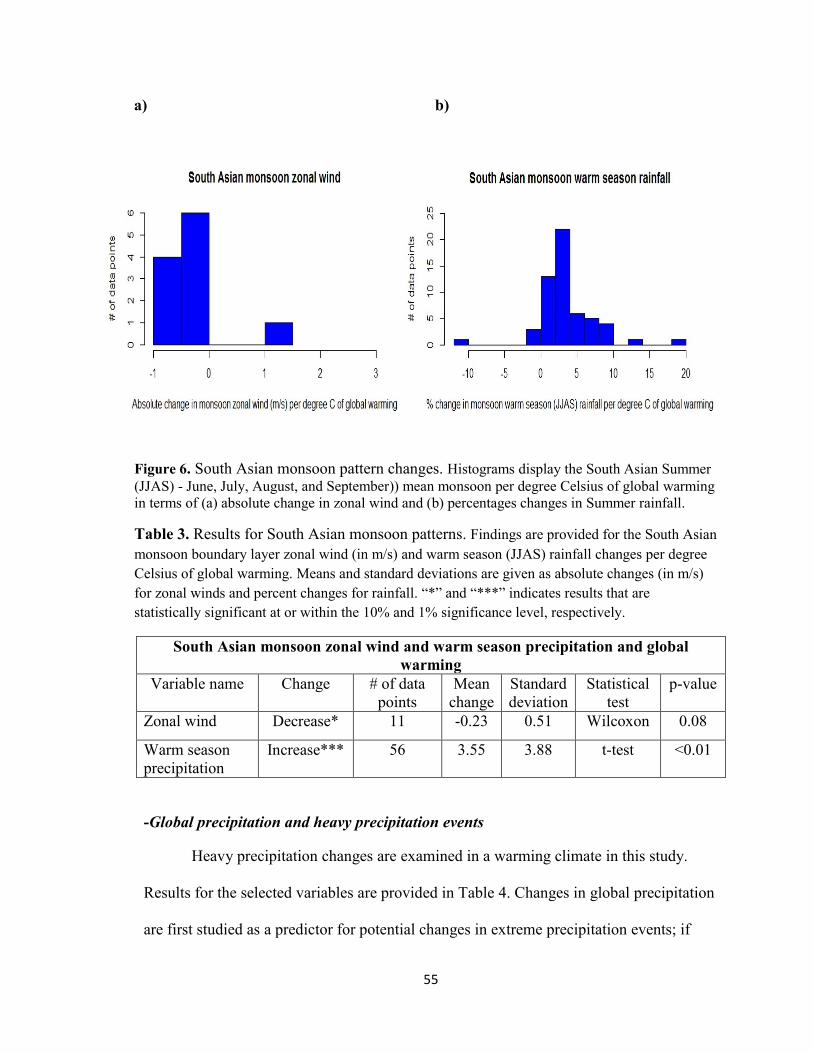
55
a) b)
Figure 6. South Asian monsoon pattern changes. Histograms display the South Asian Summer
(JJAS) - June, July, August, and September)) mean monsoon per degree Celsius of global warming
in terms of (a) absolute change in zonal wind and (b) percentages changes in Summer rainfall.
Table 3. Results for South Asian monsoon patterns. Findings are provided for the South Asian
monsoon boundary layer zonal wind (in m/s) and warm season (JJAS) rainfall changes per degree
Celsius of global warming. Means and standard deviations are given as absolute changes (in m/s)
for zonal winds and percent changes for rainfall. “*” and “***” indicates results that are
statistically significant at or within the 10% and 1% significance level, respectively.
South Asian monsoon zonal wind and warm season precipitation and global
warming
Variable name Change # of data
points
Mean
change
Standard
deviation
Statistical
test
p-value
Zonal wind Decrease* 11 -0.23 0.51 Wilcoxon 0.08
Warm season
precipitation
Increase*** 56 3.55 3.88 t-test <0.01
-Global precipitation and heavy precipitation events
Heavy precipitation changes are examined in a warming climate in this study.
Results for the selected variables are provided in Table 4. Changes in global precipitation
are first studied as a predictor for potential changes in extreme precipitation events; if
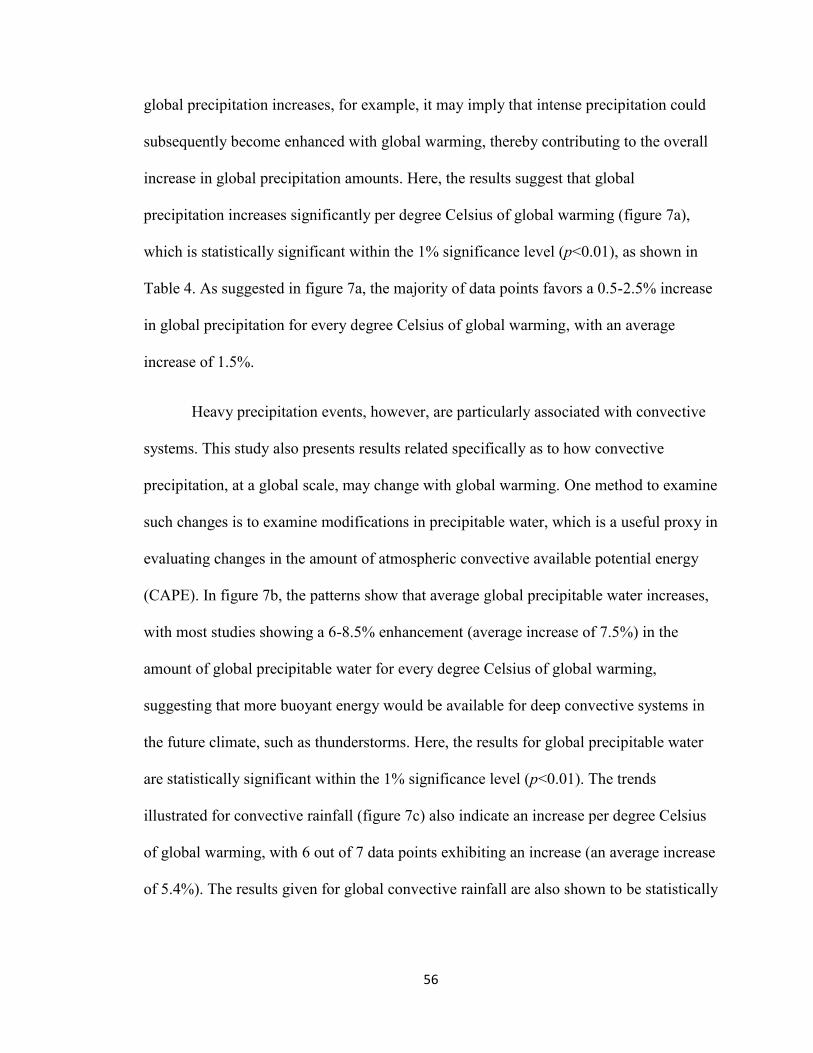
56
global precipitation increases, for example, it may imply that intense precipitation could
subsequently become enhanced with global warming, thereby contributing to the overall
increase in global precipitation amounts. Here, the results suggest that global
precipitation increases significantly per degree Celsius of global warming (figure 7a),
which is statistically significant within the 1% significance level (p<0.01), as shown in
Table 4. As suggested in figure 7a, the majority of data points favors a 0.5-2.5% increase
in global precipitation for every degree Celsius of global warming, with an average
increase of 1.5%.
Heavy precipitation events, however, are particularly associated with convective
systems. This study also presents results related specifically as to how convective
precipitation, at a global scale, may change with global warming. One method to examine
such changes is to examine modifications in precipitable water, which is a useful proxy in
evaluating changes in the amount of atmospheric convective available potential energy
(CAPE). In figure 7b, the patterns show that average global precipitable water increases,
with most studies showing a 6-8.5% enhancement (average increase of 7.5%) in the
amount of global precipitable water for every degree Celsius of global warming,
suggesting that more buoyant energy would be available for deep convective systems in
the future climate, such as thunderstorms. Here, the results for global precipitable water
are statistically significant within the 1% significance level (p<0.01). The trends
illustrated for convective rainfall (figure 7c) also indicate an increase per degree Celsius
of global warming, with 6 out of 7 data points exhibiting an increase (an average increase
of 5.4%). The results given for global convective rainfall are also shown to be statistically
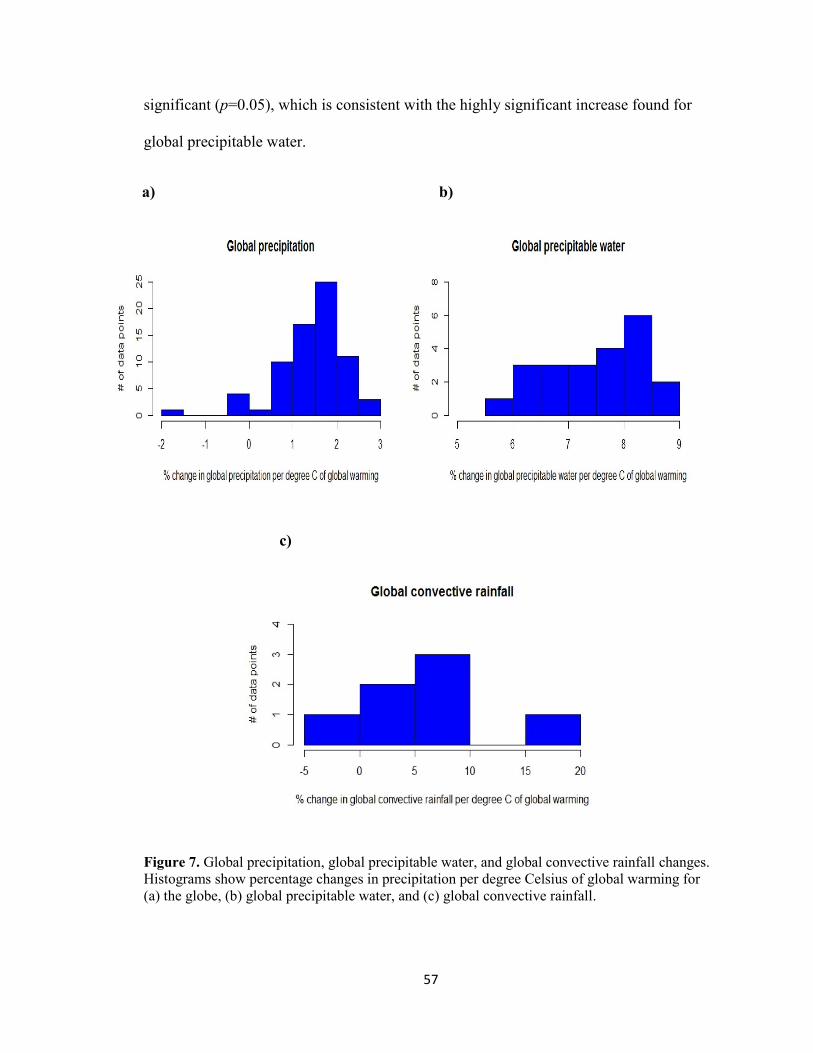
57
significant (p=0.05), which is consistent with the highly significant increase found for
global precipitable water.
a) b)
c)
Figure 7. Global precipitation, global precipitable water, and global convective rainfall changes.
Histograms show percentage changes in precipitation per degree Celsius of global warming for
(a) the globe, (b) global precipitable water, and (c) global convective rainfall.
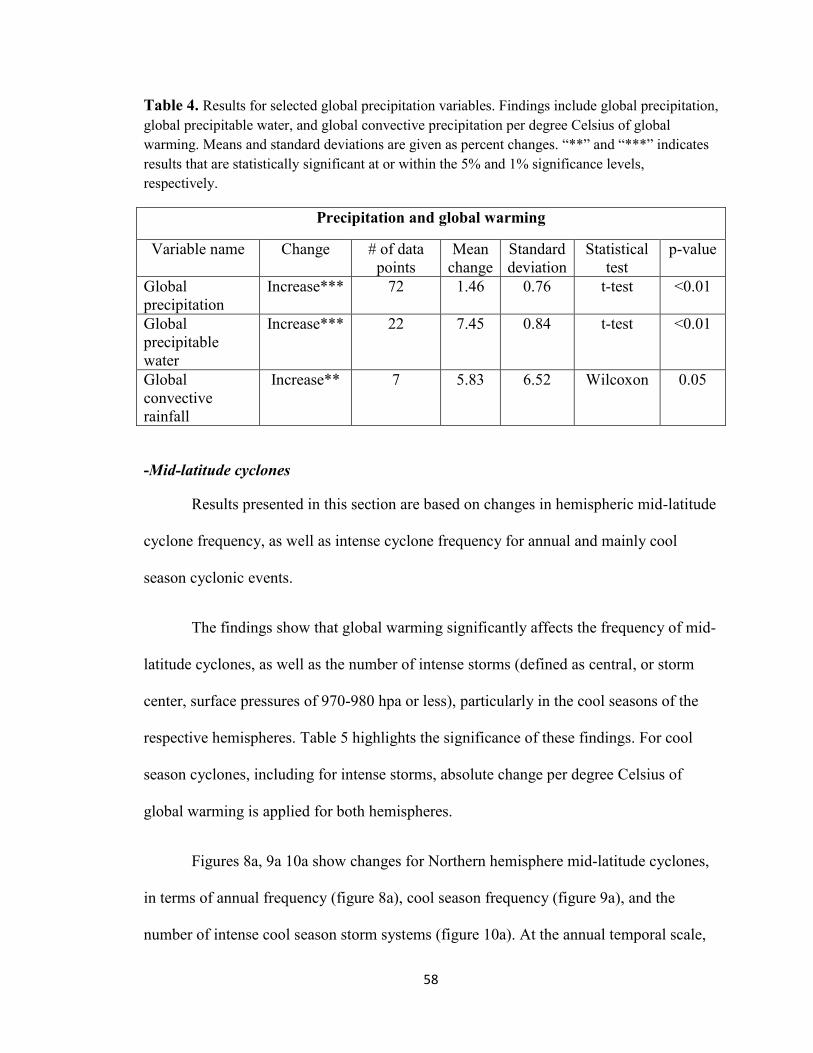
58
Table 4. Results for selected global precipitation variables. Findings include global precipitation,
global precipitable water, and global convective precipitation per degree Celsius of global
warming. Means and standard deviations are given as percent changes. “**” and “***” indicates
results that are statistically significant at or within the 5% and 1% significance levels,
respectively.
Precipitation and global warming
Variable name Change # of data
points
Mean
change
Standard
deviation
Statistical
test
p-value
Global
precipitation
Increase*** 72 1.46 0.76 t-test <0.01
Global
precipitable
water
Increase*** 22 7.45 0.84 t-test <0.01
Global
convective
rainfall
Increase** 7 5.83 6.52 Wilcoxon 0.05
-Mid-latitude cyclones
Results presented in this section are based on changes in hemispheric mid-latitude
cyclone frequency, as well as intense cyclone frequency for annual and mainly cool
season cyclonic events.
The findings show that global warming significantly affects the frequency of mid-
latitude cyclones, as well as the number of intense storms (defined as central, or storm
center, surface pressures of 970-980 hpa or less), particularly in the cool seasons of the
respective hemispheres. Table 5 highlights the significance of these findings. For cool
season cyclones, including for intense storms, absolute change per degree Celsius of
global warming is applied for both hemispheres.
Figures 8a, 9a 10a show changes for Northern hemisphere mid-latitude cyclones,
in terms of annual frequency (figure 8a), cool season frequency (figure 9a), and the
number of intense cool season storm systems (figure 10a). At the annual temporal scale,
59
the average total number of storms is projected to decrease in a warmer climate in the
Northern hemisphere. Figure 8a shows that most data points (6 out of 7) indicate a 0.5-
2% decrease in the average number of total annual storms, with an average decline of
1%. Similarly, the total annual number of cool season storms exhibits a decrease in a
warmer climate, as shown in figure 9a, which illustrates absolute changes in storm counts
per Winter/cool season for every degree Celsius of global warming. All of the 24 data
points show reductions in annual Northern hemisphere cool season storm counts, with
most showing decreases of 25 to 100 storms per degree Celsius of global warming. In
both the Northern hemisphere annual and cool season temporal scales, the results are
statistically significant within the 5% (p=0.02) and 1% (p<0.01) significance level,
respectively, as shown in Table 5. In contrast, the average total number of intense
Northern hemisphere cool season cyclones show a distinct increase with global warming,
as represented in figure 10a (units are similar to figure 9a). Here, the results are also
statistically significant, though at the 5% significance level (p=0.05), with most data
points (15 out of 23) indicating annual intense cool season storm increases, most of
which are within the 0 to 20 range (figure 10a). The average increase is about seven
cyclones for the Northern hemisphere cool season intense storms.
In the Southern hemisphere, similar patterns are found for mid-latitude cyclones.
Figures 8b, 9b and 10b show changes in Southern hemisphere annual cyclone frequency,
annual cool season frequency, and intense cool season cyclone frequency, respectively.
For Southern hemisphere annual cyclone frequency (figure 8b), much like the
Northern hemisphere (figure 8a), a trend towards a decrease is observed, though the
results are not statistically significant (p=0.11), as compared to the degree of significance
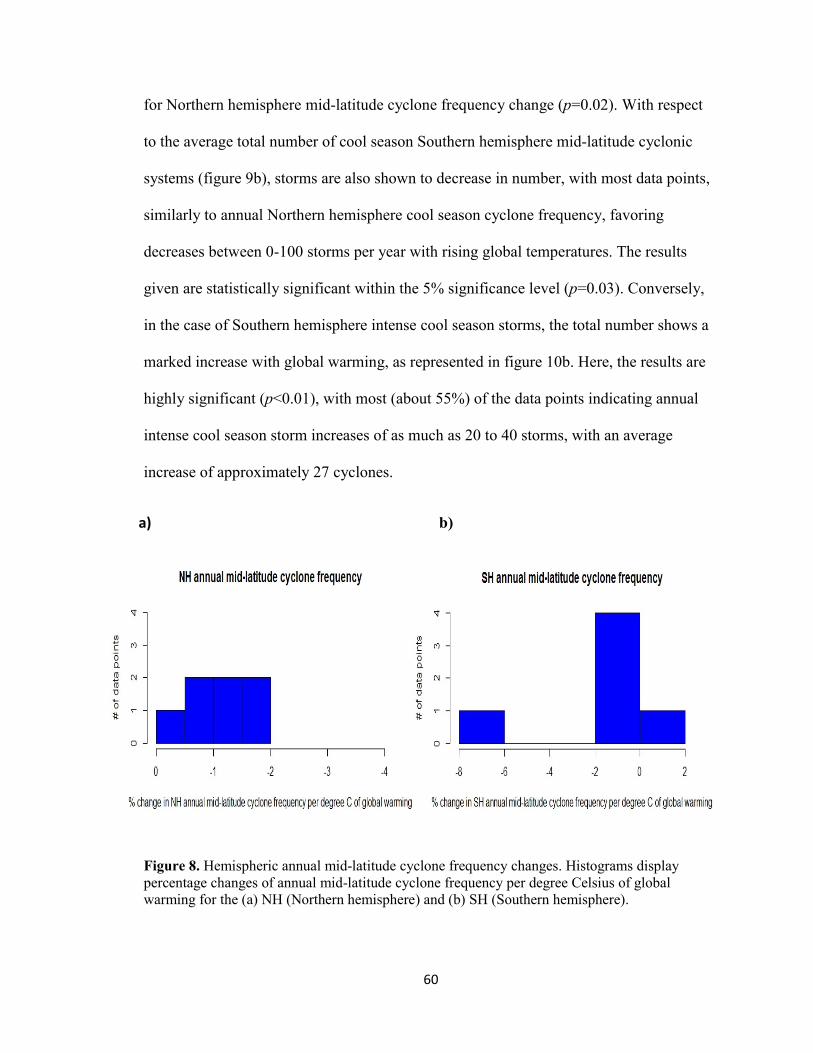
60
for Northern hemisphere mid-latitude cyclone frequency change (p=0.02). With respect
to the average total number of cool season Southern hemisphere mid-latitude cyclonic
systems (figure 9b), storms are also shown to decrease in number, with most data points,
similarly to annual Northern hemisphere cool season cyclone frequency, favoring
decreases between 0-100 storms per year with rising global temperatures. The results
given are statistically significant within the 5% significance level (p=0.03). Conversely,
in the case of Southern hemisphere intense cool season storms, the total number shows a
marked increase with global warming, as represented in figure 10b. Here, the results are
highly significant (p<0.01), with most (about 55%) of the data points indicating annual
intense cool season storm increases of as much as 20 to 40 storms, with an average
increase of approximately 27 cyclones.
a) b)
Figure 8. Hemispheric annual mid-latitude cyclone frequency changes. Histograms display
percentage changes of annual mid-latitude cyclone frequency per degree Celsius of global
warming for the (a) NH (Northern hemisphere) and (b) SH (Southern hemisphere).
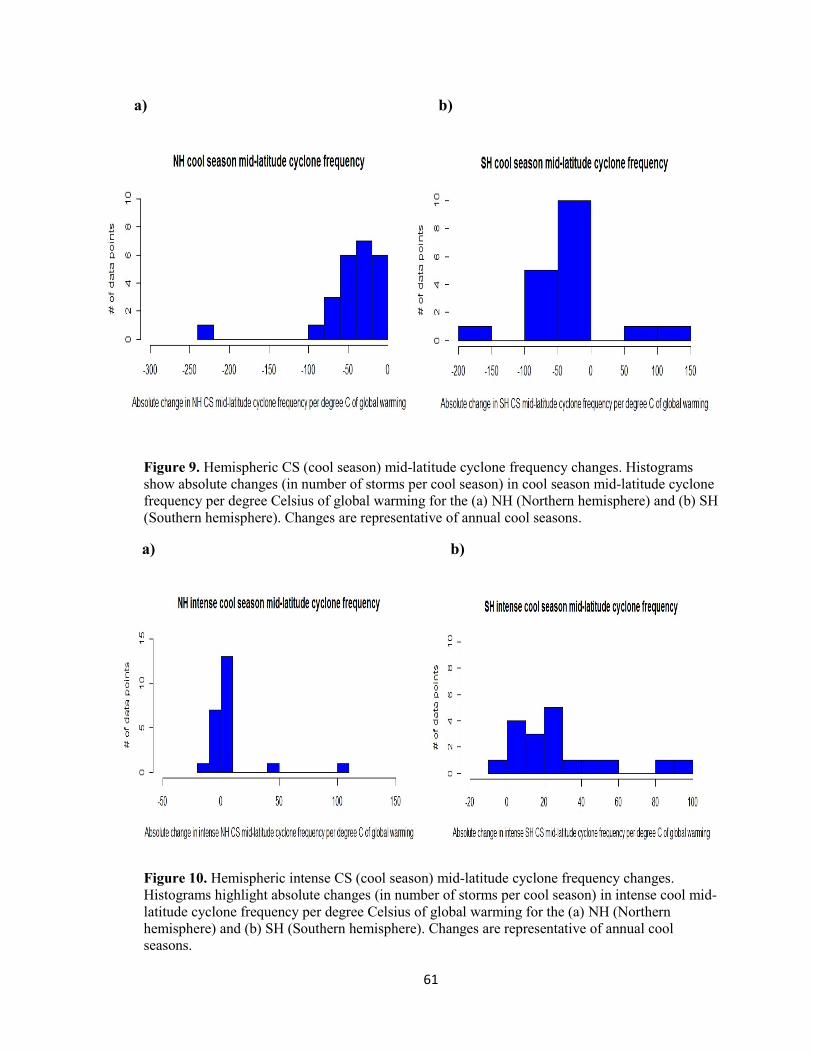
61
a) b)
Figure 9. Hemispheric CS (cool season) mid-latitude cyclone frequency changes. Histograms
show absolute changes (in number of storms per cool season) in cool season mid-latitude cyclone
frequency per degree Celsius of global warming for the (a) NH (Northern hemisphere) and (b) SH
(Southern hemisphere). Changes are representative of annual cool seasons.
a) b)
Figure 10. Hemispheric intense CS (cool season) mid-latitude cyclone frequency changes.
Histograms highlight absolute changes (in number of storms per cool season) in intense cool mid-
latitude cyclone frequency per degree Celsius of global warming for the (a) NH (Northern
hemisphere) and (b) SH (Southern hemisphere). Changes are representative of annual cool
seasons.
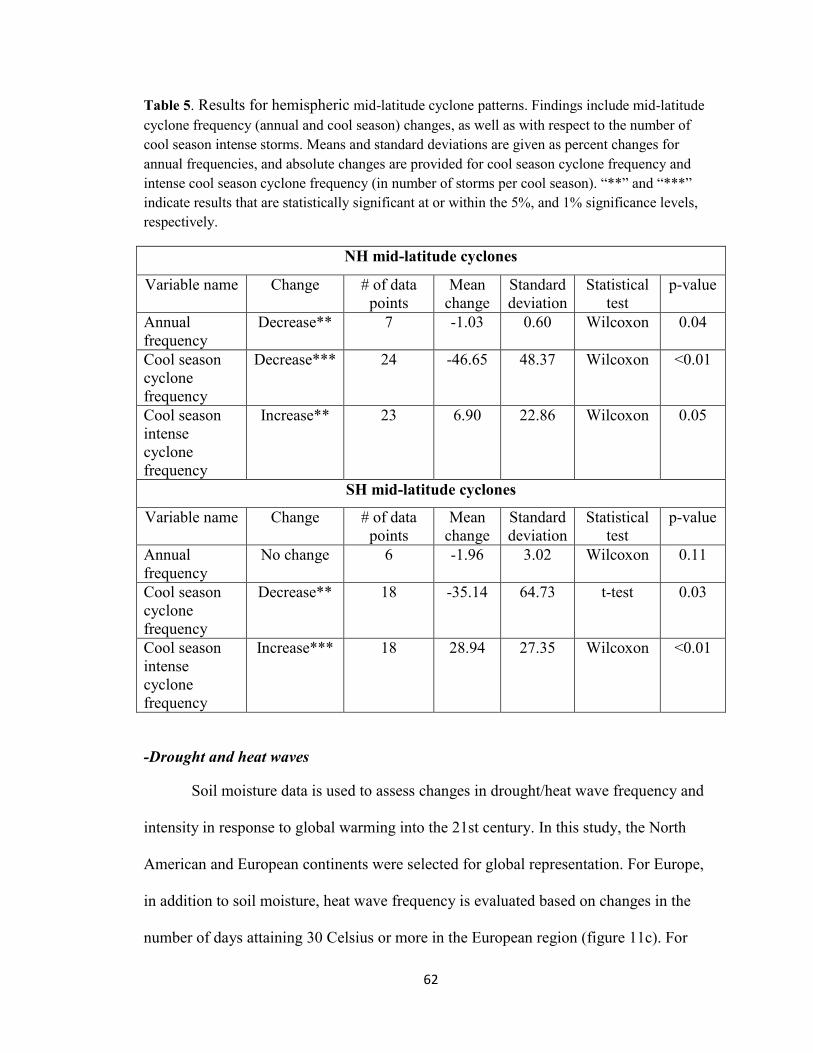
62
Table 5. Results for hemispheric mid-latitude cyclone patterns. Findings include mid-latitude
cyclone frequency (annual and cool season) changes, as well as with respect to the number of
cool season intense storms. Means and standard deviations are given as percent changes for
annual frequencies, and absolute changes are provided for cool season cyclone frequency and
intense cool season cyclone frequency (in number of storms per cool season). “**” and “***”
indicate results that are statistically significant at or within the 5%, and 1% significance levels,
respectively.
NH mid-latitude cyclones
Variable name Change # of data
points
Mean
change
Standard
deviation
Statistical
test
p-value
Annual
frequency
Decrease** 7 -1.03 0.60 Wilcoxon 0.04
Cool season
cyclone
frequency
Decrease*** 24 -46.65 48.37 Wilcoxon <0.01
Cool season
intense
cyclone
frequency
Increase** 23 6.90 22.86 Wilcoxon 0.05
SH mid-latitude cyclones
Variable name Change # of data
points
Mean
change
Standard
deviation
Statistical
test
p-value
Annual
frequency
No change 6 -1.96 3.02 Wilcoxon 0.11
Cool season
cyclone
frequency
Decrease** 18 -35.14 64.73 t-test 0.03
Cool season
intense
cyclone
frequency
Increase*** 18 28.94 27.35 Wilcoxon <0.01
-Drought and heat waves
Soil moisture data is used to assess changes in drought/heat wave frequency and
intensity in response to global warming into the 21st century. In this study, the North
American and European continents were selected for global representation. For Europe,
in addition to soil moisture, heat wave frequency is evaluated based on changes in the
number of days attaining 30 Celsius or more in the European region (figure 11c). For
63
European soil moisture (figure 11a), the results derived from the Wilcoxon test indicate a
general decrease in a warmer climate, and these findings are shown to be statistically
significant (p=0.01). Similarly, for North American soil moisture (figure 11b), a general
reduction is also shown, with all data points exhibiting a 2 to 14% decrease per degree
Celsius of global warming. Here, results are significant within the 5% level (p=0.02).
When examining the percentage changes corresponding to the number of days reaching
30 Celsius or more in Europe, as shown in figure 11c, all of the five data points show an
increase, with statistically significant results given from the Wilcoxon test within the
10% significance level (p=0.06). Table 6 shows the obtained results for both changes in
soil moisture across Europe and North America, as well as for the number of European
30 C day changes with global warming.
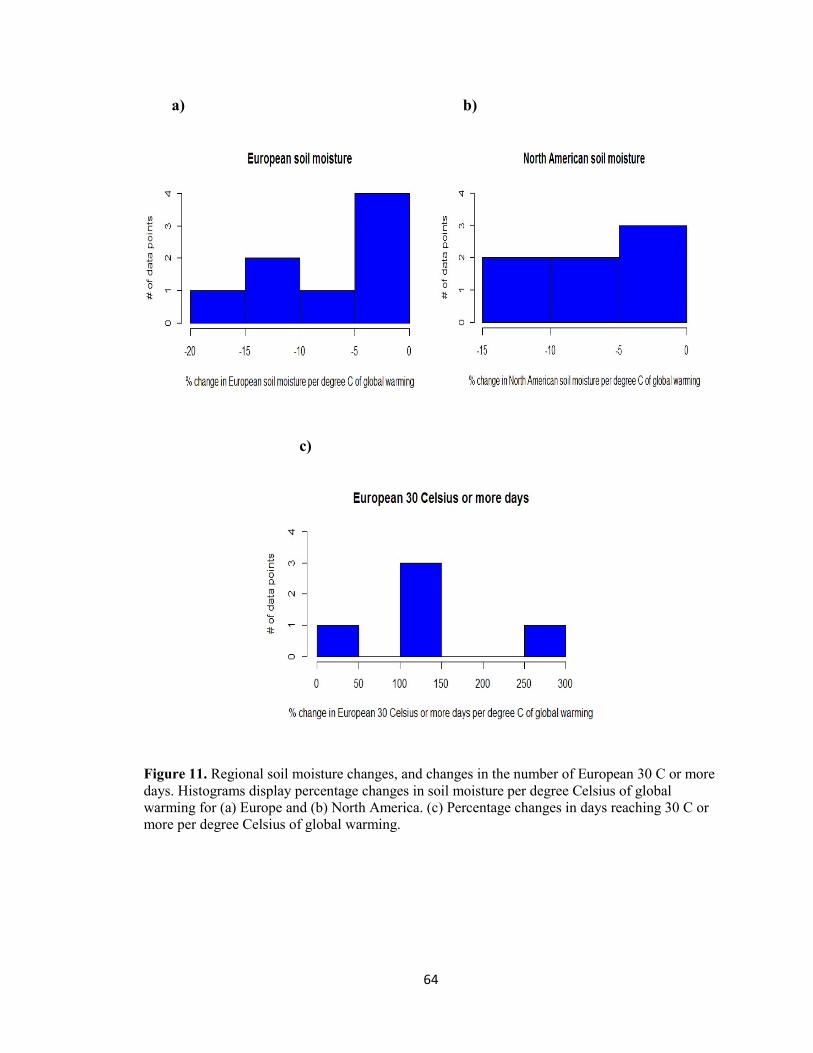
64
a) b)
c)
Figure 11. Regional soil moisture changes, and changes in the number of European 30 C or more
days. Histograms display percentage changes in soil moisture per degree Celsius of global
warming for (a) Europe and (b) North America. (c) Percentage changes in days reaching 30 C or
more per degree Celsius of global warming.
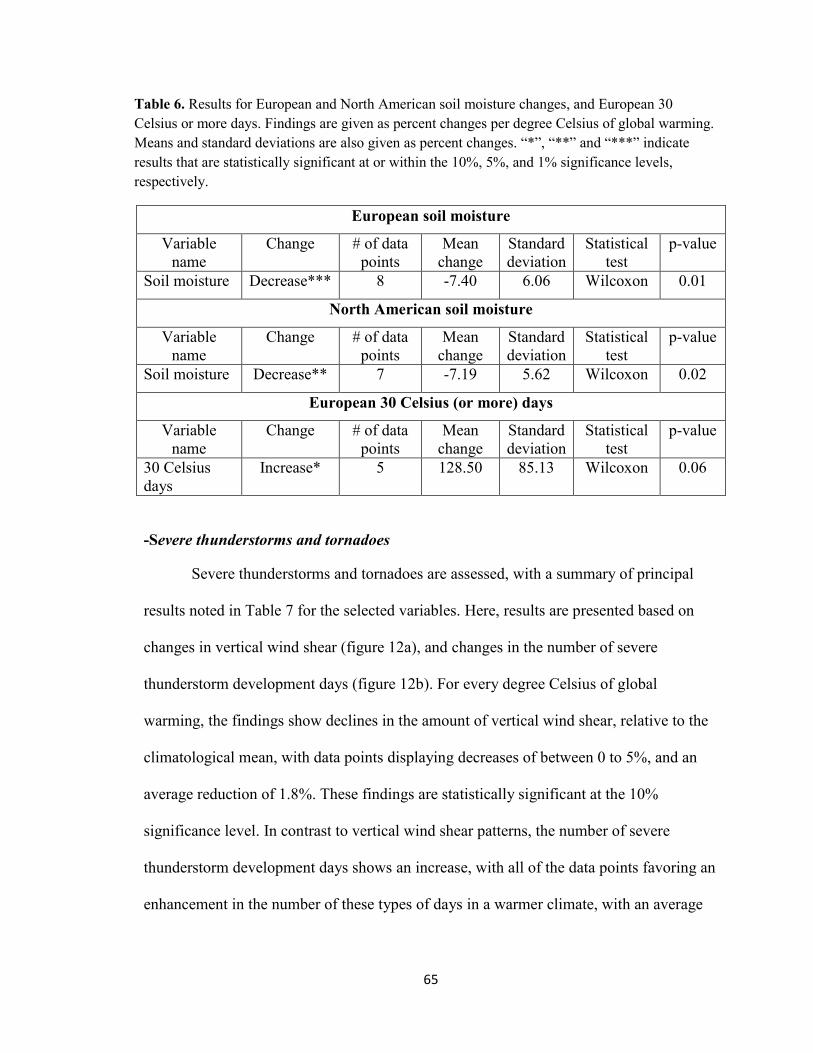
65
Table 6. Results for European and North American soil moisture changes, and European 30
Celsius or more days. Findings are given as percent changes per degree Celsius of global warming.
Means and standard deviations are also given as percent changes. “*”, “**” and “***” indicate
results that are statistically significant at or within the 10%, 5%, and 1% significance levels,
respectively.
European soil moisture
Variable
name
Change # of data
points
Mean
change
Standard
deviation
Statistical
test
p-value
Soil moisture Decrease*** 8 -7.40 6.06 Wilcoxon 0.01
North American soil moisture
Variable
name
Change # of data
points
Mean
change
Standard
deviation
Statistical
test
p-value
Soil moisture Decrease** 7 -7.19 5.62 Wilcoxon 0.02
European 30 Celsius (or more) days
Variable
name
Change # of data
points
Mean
change
Standard
deviation
Statistical
test
p-value
30 Celsius
days
Increase* 5 128.50 85.13 Wilcoxon 0.06
-Severe thunderstorms and tornadoes
Severe thunderstorms and tornadoes are assessed, with a summary of principal
results noted in Table 7 for the selected variables. Here, results are presented based on
changes in vertical wind shear (figure 12a), and changes in the number of severe
thunderstorm development days (figure 12b). For every degree Celsius of global
warming, the findings show declines in the amount of vertical wind shear, relative to the
climatological mean, with data points displaying decreases of between 0 to 5%, and an
average reduction of 1.8%. These findings are statistically significant at the 10%
significance level. In contrast to vertical wind shear patterns, the number of severe
thunderstorm development days shows an increase, with all of the data points favoring an
enhancement in the number of these types of days in a warmer climate, with an average
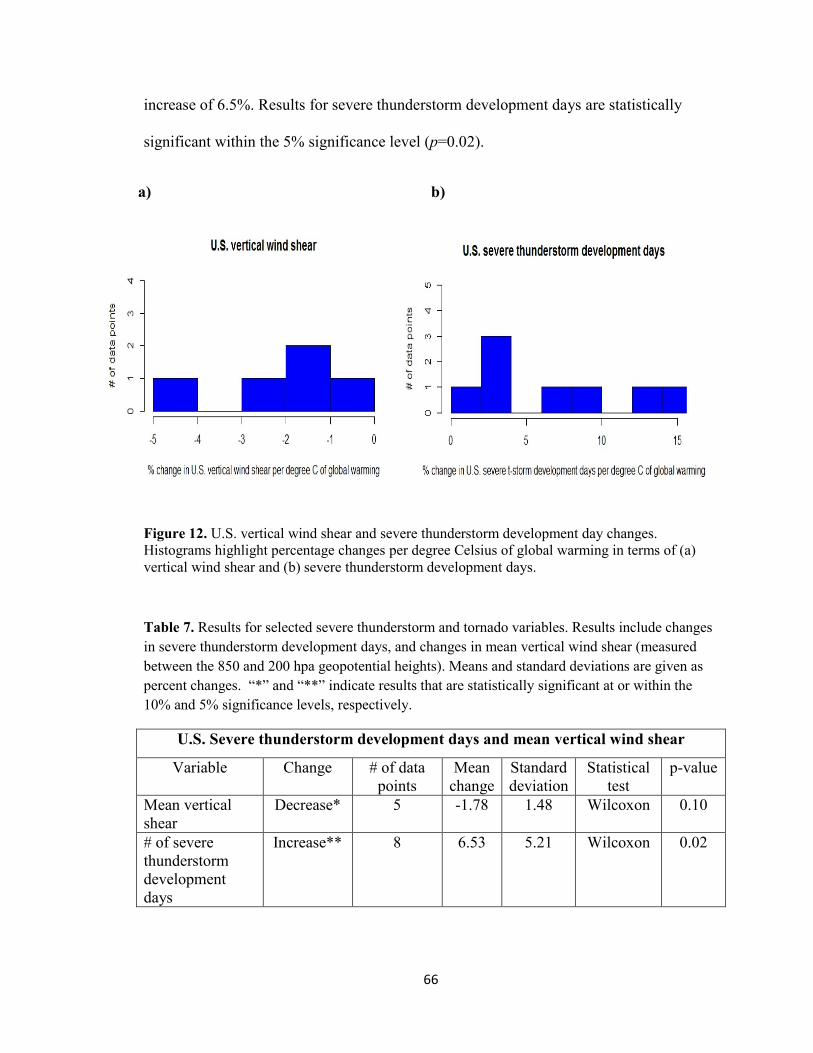
66
increase of 6.5%. Results for severe thunderstorm development days are statistically
significant within the 5% significance level (p=0.02).
a) b)
Figure 12. U.S. vertical wind shear and severe thunderstorm development day changes.
Histograms highlight percentage changes per degree Celsius of global warming in terms of (a)
vertical wind shear and (b) severe thunderstorm development days.
Table 7. Results for selected severe thunderstorm and tornado variables. Results include changes
in severe thunderstorm development days, and changes in mean vertical wind shear (measured
between the 850 and 200 hpa geopotential heights). Means and standard deviations are given as
percent changes. “*” and “**” indicate results that are statistically significant at or within the
10% and 5% significance levels, respectively.
U.S. Severe thunderstorm development days and mean vertical wind shear
Variable Change # of data
points
Mean
change
Standard
deviation
Statistical
test
p-value
Mean vertical
shear
Decrease* 5 -1.78 1.48 Wilcoxon 0.10
# of severe
thunderstorm
development
days
Increase** 8 6.53 5.21 Wilcoxon 0.02
67
-El Nino Southern Oscillation
Changes in the behavior of ENSO with global warming can be utilized to assess
future changes in regional drought, Atlantic tropical cyclone activity, the South Asian
monsoon, as well as, to some extent, severe thunderstorms and tornadoes. Figures 13a
and 13b show percent changes in ENSO amplitude and period per degree Celsius of
global warming, respectively. ENSO amplitude shows no significant change (p=0.91).
More distinct, however, is the significant trend towards a decrease in ENSO period per
degree Celsius of global warming, as represented in figure 13b, indicating an increase in
both El Nino and La Nina events. Here, the results are statistically significant at the 1%
significance level (p=0.01), and a large number of data points (14 out of 19) show a trend
towards a decrease of between 0 to 10% for ENSO period in a warmer climate (figure
13b), with an average decrease of 3.4%. Table 8 summarizes the results for ENSO
amplitude and period per degree Celsius of global warming.
a) b)
Figure 13. ENSO pattern changes. Histograms show percentage changes of ENSO behavior per
degree Celsius of global warming for (a) ENSO amplitude and (b) period.
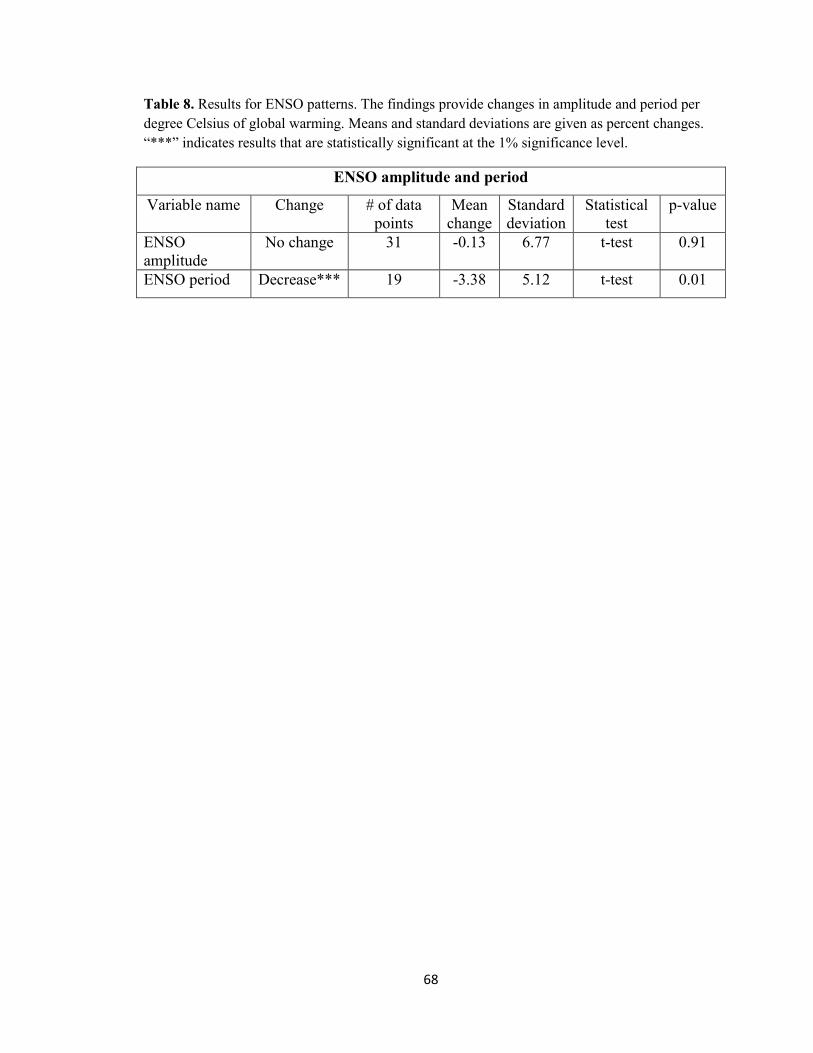
68
Table 8. Results for ENSO patterns. The findings provide changes in amplitude and period per
degree Celsius of global warming. Means and standard deviations are given as percent changes.
“***” indicates results that are statistically significant at the 1% significance level.
ENSO amplitude and period
Variable name Change # of data
points
Mean
change
Standard
deviation
Statistical
test
p-value
ENSO
amplitude
No change 31 -0.13 6.77 t-test 0.91
ENSO period Decrease*** 19 -3.38 5.12 t-test 0.01
69
Discussion
-Tropical cyclones
It is widely suggested in the literature that the frequency of global tropical
cyclones will decrease in response to different levels of global warming, along with an
increase in intensity, as well as an increase in the number of intense storms. The results in
this study indicate that tropical cyclone numbers, at a global scale, decrease significantly
per degree Celsius of global warming, and though there is no statistically significant
change in intensity, the intensity of storms is shown to significantly increase in both the
Atlantic and Pacific basins. As a result, in spite of the global decline in tropical cyclones
in a warmer climate, as well as generally statistically insignificant changes for regional
frequency, the storms that do occur, at least in the NW Pacific and Atlantic, could
potentially become more severe and, thus, damaging, as consistently shown through an
enhancement in storm intensity in these basins, with results that are all statistically
significant in this study. The increase in storm intensification could also imply a shift
towards more intense tropical cyclones, where a larger number of storms attain higher
category strength. This is particularly evident for the NW Pacific basin, where the
number of category 4 and 5 storms is shown to increase significantly with global
warming. The increase in cyclonic intensification is also consistent with the significant
increase in intense storms, in general, in the NW Pacific. By contrast, in the Atlantic, an
increase in intensification is shown to occur in conjunction with a significant decrease in
the frequency of intense storms, as well as no statistically significant change in the
frequency of the most intense storms. This combination may imply that the cyclones that
do form could become more intense with global warming, even in spite of a decrease in
the number of intense storms shown for the basin. However, the degree of intensification
70
may mostly not be enough for cyclones to commonly advance into higher category
storms, as compared to the NW Pacific, where the number of intense storms increases
significantly.
The significant decline in global tropical cyclone frequency and consistent
increase in intensity at regional scales with global warming may be explained through
multiple factors, but the trend towards increased tropical upper-tropospheric stability in a
warming climate appears to play a leading role in the decreasing pattern shown by global
tropical cyclone frequency. Modeling studies (e.g. Knutson & Tuleya, 2004) have
projected that rising global mean temperatures into the 21st century favor an increase in
warming throughout much of the troposphere, but it is illustrated that the rate of warming
in the tropical upper-troposphere is significantly larger than that of which occurs at or
near the surface over these regions, enhancing the effect of static stability.
Despite decreased global tropical cyclone frequency, the significant increase in
intensity noted in this study for the Atlantic and NW Pacific implies that the impact of an
enhanced thermodynamically stable environment is effectively offset by changes in other
specific environmental conditions that are important for cyclogenesis. As such, while
global tropical cyclone frequency is likely more sensitive to enhanced upper-tropospheric
warming, increased severity of Atlantic and NW Pacific tropical cyclones, as well as the
number of intense storms in the NW Pacific, could be driven more so by an increase in
potency of dynamical features, such as boundary layer moistening, decreased wind shear,
and SST warming, such that the negative effects of atmospheric stability would be offset.

71
Increased global atmospheric moisture may be a significant contributor in the
intensification of tropical cyclones in a warmer climate, which could lead to an increase
in CAPE, especially in tropical regions. A warming climate may, thus, act to supply more
buoyant energy to tropical cyclones through enhanced moisture content. This effect has
been documented in Knutson et al. (1998), highlighting that tropical cyclone
intensification in the NW Pacific basin in their simulations is primarily due to increases
in CAPE and tropical SSTs, which compensate for the impact of tropospheric stability at
upper-levels. Gualdi et al. (2008) also note a 24% increase in CAPE, relative to the pre-
industrial period, due to an increase in lower-tropospheric water vapor with CO2
doubling. In this study, global precipitable water serves as a proxy for global moisture
and is related to the amount of CAPE present in the atmosphere. As shown in Table 4,
global precipitable water increases significantly per degree Celsius of global warming,
suggesting a correspondingly significant increase in CAPE through boundary layer
moistening. Consequently, the increase in precipitable water, as per the results of this
study, could explain general patterns in tropical cyclone intensification with global
warming at regional and global scales.
In summary, the significant decline of global tropical cyclones found here may be
related to the dominating effect of mid- to upper-tropospheric warming in a warmer
climate. By comparison, the consistent and very significant increase in tropical cyclone
intensity given for regional-scale storms, as well as for both the NW Pacific and Atlantic
basins, may be attributed to an increase in tropical CAPE and warmer SSTs, which,
together, could act to overcome the hindering effect associated with predicted
tropospheric stability. In the NW Pacific, however, in addition to the highly significant
72
increase in storm intensification, there is also a very significant increase in the frequency
of category 4 and 5 storms, as well as in terms of the number of intense storms, in
general. This could likely be due to the combination of increased tropical CAPE, warmer
SSTs, and a tendency towards decreased vertical wind shear projected to occur
simultaneously with global warming (e.g. Stowasser et al., 2007); this would suggest that
tropical cyclone intensification would be most pronounced in this region while fostering
ideal environmental conditions that promote an enhancement in the number of intense
storms. Indeed, these patterns are consistent with the results presented in this study with
respect to NW Pacific cyclones, where the increase in intense storms, the most intense
tropical cyclone frequency and general storm intensification are shown to be most
statistically significant. In the Atlantic, differing results are given. Because Atlantic
tropical cyclone frequency remains largely unchanged with global warming, the increase
in intensification would suggest typically more intense storms with global warming.
However, the degree of intensification may mostly not be enough for cyclones to
commonly advance into higher category storms, as compared to the NW Pacific, where
the number of intense storms increases significantly.
The observational record shows that there has been no distinct trend highlighting
any increases in global and regional land-falling tropical cyclone frequency, and with
respect to the number of the most intense storms, since the 1950s (Weinkle et al., 2012),
though there is some tendency towards an increase in cyclone frequency in the Atlantic
since the mid-1990s. The patterns exhibited in the historical record are, therefore,
somewhat similar to the results provided in this study, in that there is generally no
statistically significant change in the frequency of intense or most intense cyclones (with
73
the exception of the NW Pacific), as well as in terms of the NW Pacific cyclone
frequency.
-South Asian monsoon
For the South Asian monsoon, an increasingly warmer climate is shown to
weaken the general monsoonal circulation during the warm season (JJAS). The results
presented here indicate that the zonal wind component of this circulation will decrease as
a result of global warming. However, a simultaneous increase in warm season monsoonal
rainfall is shown to significantly increase in a warmer climate, suggesting that rainfall
exhibits a trend towards an increase, in spite of weakened monsoon circulation.
The increased monsoonal rainfall finding follows well with the clear trend
towards global precipitation increases, which implies an increase in more heavy rainfall
events associated with the South Asian Summer monsoon. Also, due to the significant
increase in global precipitable water, we might expect enhanced convective rainfall
associated with the South Asian Summer monsoon, which is consistent with the
significant increase in global convective rainfall found in this study. The increased
rainfall tendencies might also be related to a weakened ENSO-monsoon relationship with
global warming, suggesting that the effect of ENSO, in terms of ENSO-warm phases (El
Nino events), may have little effect on South Asian Summer precipitation (this effect is
further discussed in the ENSO section). As such, although monsoonal circulation is to
significantly weaken with global warming through a decline in mean warm season zonal
wind flow, this trend is likely to be counteracted by an enhancement in convective
activity, with respect to more moisture availability (precipitable water) and moisture
74
convergence, while a more enduring and increased land-ocean pressure gradient, as is
documented in many studies (e.g. Meehl & Washington, 1993; Lal et al., 2000), could
also increase the potential for more heavy rainfall events through surface convergence.
-Global precipitation
The results indicate that a very significant increase in global precipitation is
expected in a warmer climate. This finding adheres to the increase in observed global
precipitation shown over nearly the last century, as given in Kumar et al. (2013), who
show an average global increase of 0.78 mm/decade during the 1930-2004 period.
To assess potential trends in heavier precipitation events, changes in precipitable
water and convective rainfall, at a global scale, are examined. Like global precipitation,
the findings suggest that precipitable water increases significantly with global warming
and are consistent with the Clausius-Clapeyron relationship. Similarly, a significant
increase in convective rainfall is also shown per degree Celsius of global warming. In the
historical record, atmospheric moisture has also been particularly increasing from 1973 to
1995 (Trenberth et al., 2005).
From the results given, the increase in global precipitation may be significantly
attributed to a rise in precipitable water. Because convection is dominant in tropical and
equatorial regions, we might expect that most of the increase in global precipitation in a
warmer climate would occur over those latitudes, as compared to farther North or South
towards mid-latitudes. Indeed, annual mid-latitude cyclonic systems, as discussed in the
following section, are shown to significantly decrease, especially in the Northern
hemisphere, and there is also a significant decline in both European and North American
75
soil moisture; the combination of these factors would imply a decrease in annual
precipitation at mid-latitudes, in spite of a significant global increase in precipitation. By
contrast, because mid-latitude cyclones are heavily dependent on moisture availability, an
increase in global precipitable water could, like tropical cyclones, lead to an increased
intensification of these storms through greater latent heat release, which is shown to
significantly increase the number of intense storms in a warmer climate. This would also
indicate that convection, at least in tropical to equatorial regions, becomes enhanced in a
warmer climate because of more moisture availability in the atmosphere, which would
lead to greater latent heat release of condensation and, therefore, promoting further
atmospheric instability. Increased moisture may also lead to more severe thunderstorm
development days. As discussed in the previous sub-sections, tropical cyclonic
intensification may similarly be attributed to increases in atmospheric moisture, which, in
turn, favor an enhancement in CAPE. At the same time, the South Asian monsoonal
rainfall may become enhanced in a warmer climate with more moisture availability and
increased convective activity.
-Mid-latitude cyclones
The findings indicate that global mean temperature rise will likely act to reduce
mid-latitude cyclones for the future but will conversely increase the number of intense
cool season storms, a trend that is highlighted mostly for the Northern hemisphere in this
study. For Northern hemisphere mid-latitude cyclones, a consistent decrease in the annual
number of storms is found. At seasonal scales, similar patterns are also observed for the
Northern hemisphere cool season, showing a notable decrease in the number of storms
per cool season in a warming climate. In terms of intense storm counts, an increase is
76
shown per cool season. Similar results are also found for the Southern hemisphere,
although there is no statistically significant change in annual cyclone frequency in the
Southern hemisphere.
The decreasing trend in mid-latitude cyclones may be related to a projected
decrease in baroclinicity at mid-latitudes (e.g. Konig et al., 1993; Beersma et al., 1997;
Geng & Sugi, 2003; Catto et al., 2011), which, in turn, may be linked to the weakening of
the equatorward meridional temperature gradient associated with reduced Winter sea ice
and snow coverage in a warmer climate. As per the results of this study, weakened
baroclinicity may be a particularly important factor contributing to the decrease in annual
cyclones shown for the Northern hemisphere. With a weakened latitudinal temperature
gradient, mid-latitude Rossby waves (specifically troughs), which are crucial for the
development of cyclonic development at the surface, could subsequently become less
prominent and, thus, increase the likelihood for a decrease in the number of cyclones that
do occur. To another extent, the significant reduction of global tropical cyclone frequency
may also partly explain the general declining pattern of mid-latitude cyclones. In the
Northern hemisphere, for example, as tropical cyclones mature and propagate North to
Northeastward, they undergo a gradual weakening that is attributed to either prolonged
exposure to cooler SSTs, or boundary layer frictional influences associated with land
surfaces. It is this cyclonic weakening that transpires into storm systems that assume
extra-tropical cyclone characteristics. Consequently, the significant decrease in global
tropical cyclones could partly contribute to the overall decrease of mid-latitude storms,
principally during the warm season.
77
That said, an increase in the number of intense storms could yield more
significant snowfall events, along with a subsequently elevated number of strong wind
incidences, as the pressure gradient associated with these systems would be stronger. This
trend could likely become more pronounced in the Southern hemisphere, as the increase
in the number of cool season intense storms appears to respond more significantly to
global warming there. The increase in the number of hemispheric intense cool season
storms may also, in part, be due to increased moisture availability. The significant
increase in precipitable water and, therefore, atmospheric moisture content found in this
study could explain this increase, as it would act to fuel the development of cool season
mid-latitude cyclones in a warmer climate and, consequently, enhance the potential for
heavier snowfall events. As a result, the increase in precipitable water is consistent with
the increase in intense hemispheric cool season mid-latitude cyclones. This tendency is
also highlighted in Sinclair & Watterson (1999) and Geng & Sugi (2003), who show that
increased water vapor and humidity in a warmer climate favors the development of more
intense mid-latitude cyclonic storms. The increase in the number of intense storms
during the austral Winter could be that the poleward storm track allows for easier
accessibility to Antarctic air masses, thereby increasing the available potential energy for
storms, as suggested in Bengtsson et al., (2006).
Decreased mid-latitude cyclone frequency may also be related to a change in
storm track with global warming. Because of a poleward increase in temperature
gradients in a warmer climate, as documented in multiple studies, the increase in the
number of intense storms, as well as potentially enhanced cyclone frequency, in general,
is more likely to occur farther towards higher latitudes and poleward due to a more active
78
storm track. Mizuta et al. (2011), for instance, show in their simulations that the number
of intense storms during the Northern hemisphere Winter in a warmer climate is found on
the polar side, North of the storm track. Similarly, Bengtsson et al. (2006) find that
Southern and Northern hemisphere mid-latitude cyclones are reduced slightly due to a
poleward shift in the maximum SST gradient, prompting an approximately 5 degree
Southward or Northward shift in storm track induced by a corresponding change in the
upper-tropospheric jet stream. This shift is also represented in Fyfe (2003) for the
Southern hemisphere in the sub-Antarctic Ocean, showing a poleward shift in
baroclinicity towards the Antarctic Ocean, resulting in increased cyclone frequency there.
As such, the decreases in mid-latitude cyclone frequency found in this study are
likely associated with decreases in mid-latitude baroclinicity, which, in turn, are related
to a reduced temperature gradient. In addition, because the strongest temperature
gradients shift farther poleward, the polar jet stream would also correspondingly migrate
poleward, as well, resulting in more pronounced temperature variability and increasing
the potential for more intense cyclogenesis over these regions. As a result, though the
significant increase in the number of intense storms shown here may lead to more heavy
snowfall events in a warmer climate, these storms may be found farther poleward near
high-latitudes, or the poleward extent of mid-latitudes, due to a shift in storm track, while
leaving more rainfall for mid-latitudes because of increased exposure to associated warm
sectors of these storms. In another context, despite a significant global increase in
precipitation, the findings presented for mid-latitude cyclones would suggest that most of
this increase occurs over tropical regions, given the decline in annual cyclonic frequency
at mid-latitudes (mostly in the Northern hemisphere), especially during the cool season.
79
Also, because of a poleward shift in temperature gradients, we might expect an increase
in precipitation towards the poleward extent of mid-latitudes and Northward (Southward)
in the Northern hemisphere (Southern hemisphere) into high latitudes, which has been
projected to occur in some studies (e.g. Lau et al., 2013).
Wang et al. (2013) show that extra-tropical cyclones, in both hemisphere, have
exhibited signs of increasing over the 1871-2010 period for both the Northern and
Southern hemisphere, with the greatest increase in the Southern hemisphere. Though the
results in this study largely favor a significant decrease in cyclone frequency in the
Northern hemisphere per degree Celsius of global warming, as well as for cool season
cyclones in both hemispheres, an increase in cyclones towards poleward sections of mid-
latitudes could occur in a warmer climate, due to a shift in baroclinicity.
-Drought and heat waves
A significant decrease in soil moisture is found for the European continent in this
study. Nearly similar decreases are displayed for the North American continent. It has
been shown that decreased soil moisture, especially at mid-latitudes, may be attributed to
an increase in the rain to snow ratio during the cooler seasons, coupled with earlier
snowmelt in the Spring, which prompts a deficit in soil moisture during the Summer
(Sheffield & Wood, 2008). Indeed, the significant decline in soil moisture in the results
presented here is consistent with a trend towards decreased mid-latitude cyclone
frequency, both annually, and during the Northern hemisphere cool season. As discussed
in the previous section, particularly notable is the decrease in cyclonic frequency during
the cool season over mid-latitudes. By contrast, though the number of intense storms is
80
shown to increase, the shift towards a more poleward track of these storms, as suggested
in the literature, would imply a decreased likelihood for heavy snowfall events to occur
farther South because of a rise in boundary layer temperatures. This would then result in
less Winter precipitation in the form of snow over the mid-latitudes of the Northern
hemisphere, including Europe and North America, mostly with respect to total snowfall
and, thus, snow coverage, which are important in the soil moisture recharge process. As a
result, drought and heat waves would increase in both frequency and intensity under these
conditions in time for the warm season.
Though soil moisture is shown to decrease, this study, counter-intuitively, also
finds a significant increase in global precipitation per degree Celsius of global warming,
as previously discussed, which would alternatively suggest a corresponding decline in
drought through an increase in soil moisture. This effect may be related to a simultaneous
increase in the rate of potential evapotranspiration with global warming, which offsets the
increase in precipitation, as shown in Rind et al. (1990). In this study, most of the global
precipitation increase may be associated with significant increases in precipitable water,
which could increase the intensity and frequency of convective precipitation. At mid-
latitudes, however, annual precipitation may decrease due to a decrease in cyclonic
storms (as described in the previous section), but because of increases in global
precipitable water, the frequency of heavy precipitation events could increase, allowing
for a subsequent increase in flooding (or flash-flooding) events during the warm season.
This occurs due to the combination of drier soils and a significant increase in the intensity
and frequency of heavy (convective) rainfall, as dry soils cannot efficiently accommodate
the intensified nature of heavier rainfall events.
81
Heat waves are shown to change in frequency and severity into the future over
Europe and North America (Meehl & Tebaldi, 2004). As with drought, regional heat
waves are also found to increase, at least in North America and Europe, with global
warming through a significant reduction in soil moisture. According to historical data
pertaining to daily high temperatures for the contiguous U.S. from the 1950s to 2000s, for
example, the number of record daily highs and record daily highs have increased since
the 1970s, with unusually hot Summer days becoming more common, as well as a higher
frequency of warmer Summer overnight lows (EPA, 2013). The results presented here for
North American heat waves, therefore, further this trend with future global warming.
Similarly, the number of days reaching 30 Celsius or more across the European continent
is shown to increase significantly. This result is consistent with the decrease in soil
moisture content over the region, which would also lead to a declining rate of evaporative
cooling. These patterns are represented in Schar et al. (2004), where future temperature
and precipitation patterns for 2071-2090 are similar to those present during the
anomalously hot Summer of 2003 across much of Europe, likely attributed to increased
soil moisture depletion and convective inhibition.
Because positively strong geopotential heights, especially at the 500 hpa level, are
commonly associated with distinct warming episodes (warm air advection), the results
suggested here could imply that a trend towards more of these anomalies could occur
through increased air expansion. This effect is found in Meehl & Tebaldi (2004), where
the 500 hpa geopotential height increases by 55 and 50 geopotential meters over areas
near the upper U.S. Midwest and France, respectively, with end-21st century warming.
Nearly identical tendencies have been found into the Southern U.S. and Mediterranean,
82
as well as areas near Moravia, Czech Republic (Huth et al., 2000). Similar mid-
tropospheric anomalies are also displayed in Lau & Nath (2012), who show that the anti-
cyclonic circulation associated with the blocking ridge patterns at the 500 hpa level
hinders the movement of synoptic-scale systems throughout many regions of the U.S.,
while decreased eddy motion projected in their model simulations suggest a more
stagnant environment that favors prolonged conditions that are warm and dry.
Though solely two continents are used to assess drought and heat waves, the
results provided here may be valid at a global scale, as well, especially at mid-latitudes,
where snow coverage could significantly decrease with a significant decline in cool
season mid-latitude tropical cyclones. Indeed, Mueller & Seneviratne (2012) show in
their findings that for many areas of the globe, there is a strong relationship between the
number of hot days during the hottest month, and preceding precipitation deficits.
-Severe thunderstorms and tornadoes
An overall trend towards an increasing frequency of severe thunderstorms over
the U.S. in this study is shown to occur with rising global mean temperatures, and results
for this increase are highly significant. This is particularly evident when examining the
results given for the number of days where severe thunderstorm development takes place,
in which case, an increase occurs in a warmer climate. However, the increase in severe
thunderstorm development days coincides with a consistent significant decrease in deep-
layer vertical wind shear with global warming, which would, intuitively, act to suppress
the overall severity of thunderstorms. The results, then, suggest that severe thunderstorm
frequency would increase in response to global warming, in spite of decreasing levels of
83
wind shear. One explanation for this contradiction could be that precipitable water
increases significantly, which would largely contribute to an elevated amount of CAPE
distributed in the troposphere in a warmer climate. In this study, the amount of
precipitable water, at a global scale, is shown to be enhanced substantially per degree
Celsius of global warming, with statistically significant increases. Consequently, it is
likely that the increase in precipitable water and, therefore, CAPE, is leading to an
increase in the number of severe thunderstorm days occurring across the U.S., enough to
offset the negative effect associated with decreased vertical wind shear. The influence of
increased buoyancy on thunderstorm development in a warmer climate has also been
suggested in Trenberth (2012). Thus, the net effect is an increase in the number of severe
thunderstorm development days, which is consistent with the findings presented in Trapp
et al. (2007), as well as Trapp et al. (2009), who show that NDSEV increases, in spite of
decreases in vertical wind shear with global warming. On the other hand, decreases in
wind shear in a warmer climate may restrict the number of tornadic (or supercell)
thunderstorms that do develop, while suppressing the potential for severe tornadoes, and
limiting the endurance and/or organization of severe thunderstorms. Limited
thunderstorm and tornado intensity may also be attributed to statistically significant
decreases in North American soil moisture. Decreased soil moisture content could act to
moderate, to some extent, the regional precipitable water, which may lead to less water
vapor that could be released to the atmosphere during the warm season and, as a
consequence, weakening atmospheric instability, and the overall severity of
thunderstorms and tornadoes with global warming.
84
The increase in severe thunderstorm development days is also not consistent with
a decrease in annual Northern hemisphere mid-latitude cyclones in a warmer climate, as
severe thunderstorm and tornadic activity are often associated with these cyclonic storms.
The declining tendencies exhibited by mid-latitude cyclone frequency, as noted
previously, are likely related to decreasing baroclinicity and may also be associated with
a decrease in the North-South temperature gradient developing at low- to mid-levels of
the troposphere (e.g. Van klooster & Roebber, 2009). The decreasing trend in mid-
latitude cyclones is, by contrast, consistent with reductions in vertical wind shear, as the
presence of these cyclones, especially the stronger storms, enhances deep-layer shear
profiles, particularly in terms of the directional component. However, Finnis et al. (2007)
and Trapp et al. (2009) find that the general decrease in mid-latitude cyclones is more
pronounced in the cool season, as compared to the warm season. A tendency towards
significant decreases in cool season cyclone frequency at Northern hemisphere mid-
latitudes is also shown here. Furthermore, Trapp et al. (2009) note that severe
thunderstorms can develop in the absence of synoptic-scale systems, and the projected
changes (decreases or any increases) in warm season mid-latitude cyclone frequency in
their study are found to be statistically insignificant. In Lee (2012), an increase of U.S. F2
or greater tornado days is found due to changes in synoptic-scale activity, though much
of this increase is shown to occur during the late-Northern hemisphere Winter to early-
Spring period (February to April) because of a shift in seasonality with end-21st century
global warming. As such, it may be that, based on the results of this study, as well as
those findings in other works, severe thunderstorms and tornadoes could increase in
frequency in the U.S. in a warmer climate, as the degree of instability increases with
85
enhanced atmospheric moistening (precipitable water), even with a decline in mid-
latitude cyclone frequency. The increased moistening would generate more CAPE during
the warm season, which could lead to powerful thunderstorm development because of
potentially stronger updrafts more frequently present inside thunderstorms. However,
because of the potential northward shift in baroclinicity with global warming, it is
possible that most of the increase in severe thunderstorm development days would be
located farther North into Northern regions of the U.S. and Southern Canada.
Alternatively, based on the results found here, the trend of decreased vertical wind
shear would suggest a generally more limited potential for vigorous mesocyclonic
development that is conducive to more violent tornadoes and longer sustained
thunderstorm updrafts, as larger degrees of shear would otherwise provide conditions
more suitable for enduring single and multi-cellular thunderstorm cells, and related storm
modes (such as squall lines or derechos). In addition, although increased moisture content
would favor larger surface-based CAPE, the effect of increased precipitable water content
could also act to weaken stronger updrafts due to the increasing influence of water
loading, though the negative effect associated with water loading will ultimately depend
on the vertical distribution of CAPE throughout the troposphere. Consequently,
thunderstorms that do form in such environments will have an enhanced capability of
producing flash-flooding, frequent lightning and stronger downdrafts (outflow) because
of a greater quantity of water being condensed into the thunderstorms. The potential for
flash-flooding may be further exacerbated by weaker speed shear, which could cause
storms to propagate at a slower rate and, therefore, allowing them to remain over areas
for a prolonged period of time. In another scenario, as North American soil moisture
86
content is shown to be significantly reduced with global warming, regional precipitable
water could also be reduced in this way. With decreased moisture availability, severe
thunderstorm development days may not necessarily decrease but could, instead, have a
more dominant storm mode, that is, thunderstorms that have a greater potential of
producing stronger downdrafts and larger hail due to enhanced mid-level evaporative
cooling associated with drier air. That said, tornadoes would generally be weaker under
these circumstances, since cloud bases are more elevated when supercells are of the low-
precipitation variety.
Historical decadal tornado counts spanning from the early 20th century to present
day would suggest that tornado frequency, including the number of intense tornadoes, has
increased sharply in the U.S. (NOAA, 2013). However, much of this drastic change is
likely attributed to increases in densely populated areas, storm spotters, weather watchers,
storm chasers, as well as communication systems (warning systems formally introduced
in the 1970s). The combination of these factors has mostly contributed to the increase in
tornadoes observed in the historical record due to enhanced detection. A closer inspection
of recent decades, however, shows that there is no significant change in tornado
frequency, or in terms of the most intense tornadoes (EF3 to EF5), though, since the
1980s, there has been a trend towards a slight decline in the most intense tornadoes. As a
result, tornado trends over the last few decades are inconsistent with those results found
in this study. However, there are some similarities between the results shown for intense
tornadoes, and the trend towards a slight decrease in the strongest tornadoes depicted in
the most recent decades.
87
-El Nino Southern Oscillation
The results outlined here show that ENSO could significantly decrease in period,
while ENSO amplitude exhibits no significant change. These findings imply that global
warming could alter ENSO-warm and cool cycles but leave the amplitude largely
unchanged, indicating an increase in both ENSO warm and cool phases (i.e. more El
Nino and La Nina events), but with similar intensities to the present climate. The
decrease in ENSO period may be associated with a greater rate of heat content entering
and leaving through a larger meridional temperature gradient on either side of the
equator, as suggested by Collins (2000a). ENSO period changes may also be driven by an
enhancement in the equatorial wave speed caused by increased stratification associated
with the surface-intensified nature of ocean warming, which is found in Chen et al.
(2005) and Merryfield (2006).
In a recent study that used tree-ring data from the American Southwest to re-
construct a 1,100-year history of ENSO cycles, the records revealed a 50-90-year cycle of
strengthening and weakening of El Nino intensity (Li et al., 2011). The records also
showed that the variance between El Nino and La Nina events becomes more pronounced
when the background temperature is warmer, and less during cooler periods; this suggests
that future warming could enhance ENSO variability, as well as more extreme global
climate conditions (Li et al., 2011), which is consistent with the results presented here, in
terms of ENSO period.
88
-NW Pacific and Atlantic tropical cyclones and ENSO
The Pacific Walker circulation is driven by zonal and vertical pressure differences
occurring between the East and West tropical Pacific, and its circulatory intensity is
principally controlled by ENSO. The weakening of the Pacific Walker circulation in
climate experiments has been attributed to decreased wind shear over the NW Pacific
development region, which favors an increase in tropical cyclone frequency and intensity.
When an El Nino event is present, vertical wind shear weakens over much of the tropical
NW Pacific basin, including over the main development region for cyclones. It has been
shown by Saunders et al. (2000) that El Nino years foster conditions that are conducive
for more land-falling typhoons to occur in the NW Pacific. Consequently, during El Nino
years, decreased wind shear considerably increases the likelihood for storm formation,
often allowing tropical storms to evolve into full-fledged typhoons. In this study, the
intense and most intense tropical cyclones, and storm intensification, are shown to
significantly increase per degree Celsius of global warming and could be related to the
statistically significant decrease in ENSO period with a warming climate, where an
increase in El Nino events could lead to a greater number of years for active typhoon
seasons. As a result, modifications to ENSO period with global warming may partly
explain the significant intensification of NW Pacific tropical cyclones shown in this
study, as well as with respect to the significant increase in the number of category 4 and 5
storms in this basin, and strong storms, in general.
Similarly, in the Atlantic basin, a decrease in ENSO period in a warmer climate
may lead to an increase in years where Atlantic tropical cyclones undergo an increase in
intensification, which may, in part, explain the significant increase found for Atlantic
89
cyclone intensity because of decreased vertical wind shear associated with more La Nina
years. An increase in La Nina events would ideally strengthen the Walker circulation and,
thus, enhance ENSO-neutral conditions. Consequently, weaker vertical shear profiles
generated over the Atlantic basin during these years would more frequently favor further
intensification of tropical Atlantic cyclones. On the other hand, the significant decrease in
the number of Atlantic intense storms in a warmer climate may be related to an increase
in El Nino years, which could decrease the frequency for favorable cyclogenesis. That
said, the results between both the NW Pacific and Atlantic suggest that changes in ENSO
period may have more of an influence in decreasing intense storm counts in the Atlantic,
as compared to the Pacific. This may be that the increase in vertical wind shear associated
with La Nina events over the NW Pacific in a warming climate may not be as significant
as the increase in shear that occurs over the tropical Atlantic during an El Nino, allowing
tropical cyclone development to remain active over the NW Pacific, even during La Nina
years.
-South Asian monsoon zonal circulation and ENSO
The Asian monsoon can be influenced by various climatic factors, such as ENSO.
The ENSO-monsoon relationship has been extensively documented in the literature as a
major influence on the Summer South Asian monsoon (e.g. Kripalani et al., 2007), as an
increase in ENSO-warm phases in a warmer climate may act to suppress precipitation
increases over the region. When ENSO exhibits El Nino-like patterns, the Walker
circulation 850 hpa winds weaken due to a reversal of SST differential heating between
the central and East tropical Pacific, and the West tropical Pacific and East Indian Ocean.
These changes manifest themselves as anomalous low-level easterly winds in place of the
90
climatological low-level Southwesterlies that are typical of the Summer Asian monsoon.
This is likely attributed to strengthening subsidence associated with cooler SSTs present
in the Eastern Indian Ocean and Western Pacific relative to the central and East Pacific.
These patterns are also represented by precipitation patterns in the tropical Pacific, where
central and Eastern sections show an increase in convective activity, while suppression
occurs in the West. The reverse holds true during the course of La Nina years. Of
particular interest are potential changes in the Walker circulation.
The results found in this study suggest that the overall South Asian Summer
monsoonal circulation, in terms of its zonal component, is reduced, indicating a
weakening in the overall circulation with global warming. This would imply that
boundary layer easterlies in the Indian Ocean become more pronounced in a warmer
climate, which, in turn, would suggest that the Walker circulation weakens to promote
these anomalous easterlies. A further examination of ENSO tendencies in this study
would also support changes in the Walker circulation in a warmer climate, particularly in
terms of ENSO period. The results presented here show that ENSO period is significantly
reduced in a warming climate. This, as mentioned above, represents an increase in both
El Nino and La Nina events. However, an increase in the number of El Nino phases
would explain more frequent modifications to the Summer monsoon climatological
boundary layer zonal winds, in which case, they would more often weaken in a warmer
climate. With a significant weakening in the boundary layer zonal winds of the Summer
South Asian monsoon circulation shown in this study, one would hypothesize that warm
season rainfall would considerably be reduced in a warmer climate. As shown in figure
6b and Table 3, this is not the case, as the results yield an increase in Summer monsoonal
91
rainfall. The implication is that other climatic factors may be playing an important role in
order to offset the weakened monsoon circulation with global warming, as well as the
increase in El Nino events in a warmer climate. It is projected that the ENSO-monsoon
relationship could weaken in a warmer climate (Ashrit et al., 2001; Vecchi et al., 2006;
Kripalani et al., 2007), as increased moisture transport into South Asia, reduced Eurasian
snow depth/coverage during the Northern hemisphere Winter associated with enhanced
Eurasian warming, and a stronger land-ocean temperature and pressure contrast between
the Indian subcontinent and Indian Ocean, may lead to a net-increase in the South Asian
monsoon circulation. As such, the cumulative effect of these factors may offset the
potential increase in warmer ENSO events, as well as possible tropical upper-
tropospheric warming in a warmer climate. Increased evaporation over the tropical
Pacific could also be a more important factor to monsoon variability, where increased
precipitation and, therefore, latent heat release in the central tropical Pacific is transmitted
to the Indian Ocean by the anomalous East-West lower atmospheric circulation in a
warmer climate, subsequently inducing an increase in upward vertical velocity in the
Indian Ocean. Thus, warmer tropical Pacific SSTs may suggest an increase in monsoon
precipitation, even in the absence of a strong Walker circulation and, therefore, more El
Nino-like patterns. In addition, the significant increases in global precipitable water
found here also suggest that convection, at the global scale, would be considerably
enhanced in a warming climate, which could act to increase the intensity of heavy rainfall
events from deep convective systems during the Summer monsoon season.
92
-Drought, heat waves and ENSO
Changes in ENSO patterns were also considered in this study to examine how
they might influence heat waves and drought in a warmer climate. An increase in ENSO
period would result in more episodes of drought and heat waves for many regions,
including North America, Europe, and Australia. With more El Nino events, Australia
could see more occurrences of drought, while more La Nina events would favor increased
drying and heat wave potential in sections of North America. That said, ENSO has been
exhibiting a trend towards cooler phases since 1999 (Dai, 2013). Over Asia, increased El
Nino events could also lead to more drought conditions there through the weakening of
the monsoonal circulation in a warmer climate. However, the weakened ENSO-monsoon
relationship, as described in the sub-section above, through increases in warm season
rainfall, indicates that Asia, at least South Asia, would not be affected significantly by an
increase in El Nino (or ENSO-warm) events, while increased La Nina events would
amplify the overall strength of the circulation with global warming. The impact of ENSO
may also amplify heat wave frequency and/or intensity in a similar manner to drought,
that is, increased El Nino events would favor an increase in Australian heat waves, while
more La Nina episodes may enhance heat waves over parts of North America.
-Severe thunderstorms changes and ENSO
The effect of changing ENSO patterns in a warming climate is explored to explain
trends in severe thunderstorm development days. Marzban & Schaefer (2001) show in
their study that cooler equatorial SSTs, or La Nina events, tend to increase the number of
tornado and, therefore, severe thunderstorm days across the U.S., particularly into the
93
U.S. NE and SE Canada due to the dominant influence of the mid-latitude jet stream
persisting over the regions. In this study, the statistically significant reduction in ENSO
period would lead to an increase in the number of El Nino and La Nina events. This
would suggest more years with an enhanced frequency of severe thunderstorm/tornado
days during the tornado season due to an increase in La Nina years. The increase in these
severe weather days through decreased ENSO period is consistent with the significant
increase in severe thunderstorm development days, and it is, therefore, possible that
ENSO may be an important contributor to North American severe thunderstorm
development in a warmer climate in this way.
94
Summary and conclusion
In this study, I have employed a meta-analysis to quantify trends for specific
extreme weather events in response to global warming. Using a combination of the one-
sample t-test and Wilcoxon Rank Sum test on datasets collected for a wide variety of
selected variables representing specific weather phenomena, it was possible to identify
potential trends of weather extremes and statistically measure their degree of significance
with 21st century global warming.
For global tropical cyclones, the results indicate that the overall frequency of
these storms will decrease significantly, while their intensity will increase in a warmer
climate. In terms of both the Atlantic and NW Pacific basins, the changes in tropical
cyclone intensity are shown to also be significant, but unlike global tropical cyclone
frequency, no obvious trend is shown for these basins. For the number of intense tropical
cyclones, no significant trend is identified at a global scale, nor for the Pacific and
Atlantic basins. That said, a clear pattern towards an increase in the most intense tropical
cyclones is highlighted per degree Celsius of global warming for the NW Pacific. The
decreased global tropical cyclone frequency with global warming may be the result of
increasing upper-tropospheric stability, while the general intensification of storms is
more likely associated with increased levels of tropical CAPE and warmer SSTs
offsetting the effects of increased thermodynamic stability. Decreases in ENSO period
may also play a role in intensification, mostly in the NW Pacific and Atlantic. These
factors may be most pronounced in the NW Pacific, which could be related to the
significant increase in the most intense tropical cyclones there.
95
The South Asian Summer monsoon and heavy precipitation events are also shown
to be altered in a warmer climate. With global warming, the zonal wind component of the
Summer monsoon significantly weakens and may be attributed to a transition from
climatological boundary layer southwesterlies to largely easterlies, reducing moisture
transport to South Asia. By contrast, despite this weakening, the results also show an
increase in Summer rainfall per degree Celsius of global warming. This enhancement
likely arises from more moisture available in a warmer climate, as shown by significant
increases in global precipitable water, which may act to suppress the hindering effect of
weaker zonal winds and instead increase the intensity of deep convective systems,
notably thunderstorms. Increased monsoonal rainfall in a warmer climate may also be
due to a steeper land-ocean temperature gradient being more established, and a
significant increase in global convective rainfall. These results imply that the increase in
global precipitation can be largely related to the increase in atmospheric moisture, which,
like the enhancement in South Asian monsoon warm season rainfall, may be related to
increased precipitable water, especially in tropical and equatorial regions.
Mid-latitude cyclones were also explored for both the Northern and Southern
hemisphere. The findings indicate that annual Northern hemisphere mid-latitude cyclonic
events decrease significantly in frequency with global warming, with similar results given
for cool season mid-latitude cyclone events. By contrast, the number of intense cool
season cyclones is shown to increase. In the Southern hemisphere, the results are also
significant for the cool season mid-latitude cyclone frequencies, though the level of
significance is less, as compared to the Northern hemisphere. However, the increase in
intense cool season cyclonic events is shown to be even more significant than that of the
96
Northern hemisphere. The decreased tendency represented for global mid-latitude
cyclone frequency, especially in the Northern hemisphere, may be related to a decreased
equator-pole boundary layer and upper-tropospheric temperature gradient associated with
global warming, resulting in reduced baroclinicity. Because the strongest temperature
gradient may be found farther poleward, a more active storm track should also become
more prominent for those regions. Thus, the significant increase in intense storms found
for both hemispheres, especially in the Southern hemisphere, could be more prevalent
towards higher latitudes, where temperature gradients are most pronounced. This would
imply that heavy snowfall events increase with global warming, but the overall cool
season snowfall could decline in equatorward sections of mid-latitudes, owing to a
potential poleward shift in cyclonic activity in a warmer climate, including the significant
increase in the number of intense cyclones.
Trends in heat waves and drought were also assessed with a changing climate
through modifications in soil moisture. This study shows that soil moisture, at least for
both Europe and North America, significantly decreases per degree Celsius of global
warming, with significant decreases for the European continent, and for North America.
The decreases in soil moisture are consistent with decreases in mid-latitude cyclone
frequency in the Northern hemisphere, leading to less cool season snowfall coverage for
mid-latitudes and more rapid melting (due to an increase in bare ground) that would
occur into the late-Winter to Spring period, which subsequently induces faster moisture
withdrawal rates at the surface over the course of the warm season. Significant increases
in 30 Celsius or more days for Europe also correspond well with soil moisture declines
found in this study and may, therefore, be the result of less evaporative cooling. In
97
addition, the combination of increased convective rainfall (through increased precipitable
water) and drier/unsaturated surfaces could yield more incidences of flooding during the
warmer seasons.
Global warming is also shown to significantly affect severe thunderstorm and
tornado days. The results presented here show that U.S./North American vertical wind
shear decreases with global warming, but the number of severe thunderstorm
development days significantly increases, in spite of weakened levels of vertical wind
shear. The decrease in North American soil moisture also would suggest less energy
available for thunderstorm development. The increase in severe thunderstorm
development days would, conversely, suggest that a stronger thermodynamic
environment (or enhanced atmospheric instability) would compensate for decreases in
vertical wind shear, as well as decreases in soil moisture. This indicates that CAPE would
increase considerably in magnitude in a warmer climate, which may, in part, be reflected
by significant increases in moisture through global precipitable water. That being said,
because of decreasing levels of vertical wind shear, or deep-layer shear, this would
suggest that mesocyclonic activity is reduced, leading to potentially less tornadic
thunderstorms in a warmer climate, or declines with respect to the number of more
intense tornadoes. Increases in precipitable water may also play a role in weakening
thunderstorm updrafts due to enhanced water loading but increasing the overall strength
of the downdraft and flash flooding potential. In a drier environment, which may occur
with decreased warm season soil moisture, severe thunderstorms that do form may
produce strong downdrafts and damaging hail.
98
Finally, ENSO was examined in this study in a warming climate to potentially
provide more insight as to the changes in extreme weather events. Here, this study shows
that ENSO amplitude remains unchanged in a warmer climate, but there is a distinct
decrease in the oscillation’s period. The decrease in period, along with constant
amplitude would suggest more El Nino and La Nina events, with degrees of intensity
similar to the present-day climate. Because several extreme weather events, at a global
scale, are largely dependent on changes in ENSO, this would imply an increase in the
number of extreme events. For example, more El Nino episodes could explain the
increase in the number of the most intense NW Pacific cyclones and cyclonic
intensification in the NW Pacific basin by weakening vertical shear. Similarly, more La
Nina events in a warmer climate could also explain the significant increase in cyclone
intensity found for the Atlantic basin. An increase in El Nino may also suggest more
drought and heat wave occurrences across Australia and South Asia, though with
significant increases in rainfall during the South Asian Summer monsoon found here, this
would suggest a weakened ENSO-monsoon relationship with global warming. In parts of
North America, an increase in drought and heat waves may also take place with an
increase in the number of La Nina events, as well as increases in severe
thunderstorm/tornado days for the central-East U.S., especially towards the U.S NE.
The results presented herein imply that global warming could significantly
influence all of the selected extreme weather events chosen for this study through a
number of important metrics, particularly those that relate to both frequency and
intensity. This study, therefore, would suggest that all events examined may be very
sensitive to differing levels of global warming, including in smaller amounts, and because
99
most of the events studied are interconnected, their frequency and intensity could
ultimately be affected by subsequent changes in other extreme weather events. This is
particularly evident with respect to potential increases in drought and heat waves through
decreases in soil moisture, which may lead to considerable losses in the agricultural
sector, most notably at mid-latitudes, where precipitation may decrease because of
decreases in cyclonic events. The combination of unsaturated soil surfaces and heavy
rainfall events could also lead to more localized flooding, including in South Asia, where
warm season monsoonal rains are shown to increase in a warmer climate. In another
context, consistently significant increases in tropical cyclone intensification with global
warming, in spite of either decreased or unchanged cyclone frequency at both a global
and regional scale, may lead to more incidences of coastal inundation, as well as
enhanced property damage, because of stronger sustained land-falling tropical cyclone
surface winds. More severe thunderstorm development days through increased moisture
availability could also lead to more costly severe weather seasons for sections of the U.S.
in a warmer climate, not just in terms of tornadoes, but also with respect to other
hazardous elements that constitute severe thunderstorms, such as hail, damaging winds,
or heavy rainfall, during the Spring to early-Summer. Though other important parameters
that are conducive to the development of extreme weather are not explicitly taken into
account to explain trends, mostly due to limited data availability, the findings provide
some representation as to how certain events may change with global warming and, as
such, show significant global implications for the future. These effects may further be
amplified through changes in ENSO teleconnections, especially in terms of ENSO
period. As shown here, the effects of global warming on ENSO behavior is of particular
100
importance, as ENSO plays a critical role in governing the frequency and severity of
extreme weather at a global scale. This study also highlights the significant role of
atmospheric moisture in the intensification of multiple weather events, especially with
respect to tropical cyclones, mid-latitude cyclones, severe thunderstorms, and tornadoes.
As such, with global temperatures projected to continue rising throughout the 21st
century, it is important to consider mitigation measures that would reduce impacts
associated with a potentially more extreme future climate, as per the results presented in
this study. On the other hand, this work also indirectly demonstrates where more research
is needed to be focused, mostly in terms of those weather events or parameters that have
a more restrictive availability of data. This is especially true for the events that occur at
the microscale level, such as severe thunderstorms and tornadoes, as well as with respect
to the meteorological variables that engender them. Enhancing data quality and
availability is particularly crucial because of the relatively low predictability associated
with tornadic thunderstorms, and other related phenomena. Also, other necessary
variables should be accounted for in order to examine certain extreme weather events, as
it may very well be that some of these are equally (or even more) significant to their
development. More importantly, many uncertainties are also present with respect to
ENSO behavior in a warming climate, simply because the fundamental physical
processes that drive this phenomenon are not yet understood and are, thus, not fully
represented amongst climate models in a completely meaningful way. Understanding
ENSO in a warmer climate is, arguably, at the forefront for assessing future trends in
extreme weather, as this can significantly improve short- and long-term predictability of
these events.
101
References
Ahrens, D. (2007). Meteorology Today: An introduction to Weather, Climate, and the
Environment (8th ed). Belmont, CA: Thompson/Brooks/Cole.
An, S., Kug, J., Ham, Y., & Kang, I. (2008). Successive modulation of ENSO to the
future greenhouse warming. Journal of Climate, 21(1), 3-21. doi:
10.1175/2007JCLI1500.1
Andre, J., Royer, J., & Chauvin, F. (2008). Tropical cyclones and climate change.
Comptes Rendus Geoscience, 340(9-10), 575-583. doi: 10.1016/j.crte.2008.07.003
Ashrit, R., Douville, H., & Kumar, K. (2003). Response of the Indian monsoon and
ENSO-monsoon teleconnection to enhanced greenhouse effect in the CNRM
coupled model. Journal of the Meteorological Society of Japan, 81(4), 779-803. doi:
10.2151/jmsj.81.779
Ashrit, R., Kumar, K., & Kumar, K. (2001). ENSO-monsoon relationships in a
greenhouse warming scenario. Geophysical Research Letters, 28(9), 1727-1730. doi:
10.1029/2000GL012489
Attinger, G. (2012). Soil responsible for heat waves.
http://www.ethlife.ethz.ch/archive_articles/101213_hitzewellen_paper_ga/index_EN
Retrieved on February 3rd, 2013.
102
Beersma, J., Rider, K., Komen, G., Kaas, E., & Kharin, V. (1997). An analysis of extra-
tropical storms in the north atlantic region as simulated in a control and 2xCO(2)
time-slice experiment with a high-resolution atmospheric model. Tellus Series A-
Dynamic Meteorology and Oceanography, 49(3), 347-361. doi: 10.1034/j.1600-
0870.1997.t01-2-00003.x
Bender, M. A., Knutson, T. R., Tuleya, R. E., Sirutis, J. J., Vecchi, G. A., Garner, S. T.,
& Held, I. M. (2010). Modeled impact of anthropogenic warming on the frequency
of intense atlantic hurricanes. Science, 327(5964), 454-458. doi:
10.1126/science.1180568
Bengtsson, L., Botzet, M., & Esch, M. (1996). Will greenhouse gas-induced warming
over the next 50 years lead to higher frequency and greater intensity of hurricanes?
Tellus Series A-Dynamic Meteorology and Oceanography, 48(1), 57-73. doi:
10.1034/j.1600-0870.1996.00004.x
Bengtsson, L., Hodges, K. I., Esch, M., Keenlyside, N., Kornblueh, L., Luo, J., &
Yamagata, T. (2007). How may tropical cyclones change in a warmer climate?
Tellus Series A-Dynamic Meteorology and Oceanography, 59(4), 539-561. doi:
10.1111/j.1600-0870.2007.00251.x
Bengtsson, L., Hodges, K. I., & Keenlyside, N. (2009). Will extratropical storms
intensify in a warmer climate? Journal of Climate, 22(9), 2276-2301. doi:
10.1175/2008JCLI2678.1
103
Bengtsson, L., Hodges, K. I., & Roeckner, E. (2006). Storm tracks and climate change.
Journal of Climate, 19(15), 3518-3543. doi: 10.1175/JCLI3815.1
Beniston, M. (2004). The 2003 heat wave in Europe: A shape of things to come? an
analysis based on swiss climatological data and model simulations. Geophysical
Research Letters, 31(2), L02202. doi: 10.1029/2003GL018857
Beniston, M., & Diaz, H. (2004). The 2003 heat wave as an example of summers in a
greenhouse climate? observations and climate model simulations for basel,
switzerland. Global and Planetary Change, 44(1-4), 73-81. doi:
10.1016/j.gloplacha.2004.06.006
Beniston, M., & Goyette, S. (2007). Changes in variability and persistence of climate in
switzerland: Exploring 20th century observations and 21st century simulations.
Global and Planetary Change, 57(1-2), 1-15. doi: 10.1016/j.gloplacha.2006.11.004
Beven, J. et al. (2008). “Atlantic Hurricane Season of 2005”. Monthly Weather Review,
136 (2), p.1109-1173.
Bhaskaran, B., Mitchell, J., Lavery, J., & Lal, M. (1995). Climatic response of the Indian
subcontinent to doubled Co2 concentrations. International Journal of Climatology,
15(8), 873-892. doi: 10.1002/joc.3370150804
Boer, G. (1993). Climate change and the regulation of the surface moisture and energy
budgets. Climate Dynamics, 8(5), 225-239.
104
Boer, G., Flato, G., & Ramsden, D. (2000). A transient climate change simulation with
greenhouse gas and aerosol forcing: Projected climate to the twenty-first century.
Climate Dynamics, 16(6), 427-450. doi: 10.1007/s003820050338
Boer, G., Flato, G., Reader, M., & Ramsden, D. (2000). A transient climate change
simulation with greenhouse gas and aerosol forcing: Experimental design and
comparison with the instrumental record for the twentieth century. Climate
Dynamics, 16(6), 405-425. doi: 10.1007/s003820050337
Boer, G., McFarlane, N., & Lazare, M. (1992). Greenhouse gas induced climate change
simulated with the ccc 2nd-generation general-circulation model. Journal of
Climate, 5(10), 1045-1077. doi: 10.1175/1520-
0442(1992)005<1045:GGCCSW>2.0.CO;2
Bosilovich, M., Schubert, S., & Walker, G. (2005). Global changes of the water cycle
intensity. Journal of Climate, 18(10), 1591-1608. doi: 10.1175/JCLI3357.1
Carnell, R., & Senior, C. (1998). Changes in mid latitude variability due to increasing
greenhouse gases and sulphate aerosols. Climate Dynamics, 14(5), 369-383. doi:
10.1007/s003820050229
Catto, J. L., Shaffrey, L. C., & Hodges, K. I. (2011). Northern hemisphere extratropical
cyclones in a warming climate in the HiGEM high-resolution climate model. Journal
of Climate, 24(20), 5336-5352. doi: 10.1175/2011JCLI4181.1
105
Cheetham, A. (2011). Climatic Events – Hurricanes. Global Warming Science.
http://www.appinsys.com/GlobalWarming/GW_4CE_Hurricanes.htm
Chen, H. et al, (2004). Regional Climate Change in East Asia Simulated by an
Interactive-Soil-Vegetation Model. Journal of Climate, 17(3). p. 557-572.
Chen, X., Kimoto, M., & Takahashi, M. (2005). Changes in ENSO in response to
greenhouse warming as simulated by the CCSR/NIES/FRCGC coupled GCM. Sola,
1, 149-152. doi: 10.2151/sola.2005-039
Climate Research Unit. (2013). Temperature.
http://www.cru.uea.ac.uk/cru/data/temperature/#faq4 Retrieved on June 8th
, 2012.
Collins, M. (2000). The El Nino-Southern Oscillation in the second Hadley Centre
coupled model and its response to greenhouse warming. Journal of Climate, 13(7),
1299-1312. doi: 10.1175/1520-0442(2000)013<1299:TENOSO>2.0.CO;2
Collins, M. (2000). Understanding uncertainties in the response of ENSO to greenhouse
warming. Geophysical Research Letters, 27(21), 3509-3512. doi:
10.1029/2000GL011747
Collins, M., et al. (2010). The impact of global warming on the tropical Pacific Ocean
and El Nino. Nature Geoscience, 3. p. 391-397.
Crombie, L. & Davies, H. (2009). What is Meta-Analysis?
http://www.medicine.ox.ac.uk/bandolier/painres/download/whatis/Meta-An.pdf
106
Dai, A., Meehl, G., Washington, W., & Wigley, T. (2001). Climate changes in the 21st
century over the Asia-Pacific region simulated by the NCAR CSM and PCM.
Advances in Atmospheric Sciences, 18(5), 639-658.
Dai, A., Washington, W., Meehl, G., Bettge, T., & Strand, W. (2004). The ACPI climate
change simulations. Climatic Change, 62(1-3), 29-43. doi:
10.1023/B:CLIM.0000013679.74883.e6
Dai, A., Wigley, T., Boville, B., Kiehl, J., & Buja, L. (2001). Climates of the twentieth
and twenty-first centuries simulated by the NCAR climate system model. Journal of
Climate,
Dai, A., Wigley, T., Meehl, G., & Washington, W. (2001). Effects of stabilizing
atmospheric CO2 on global climate in the next two centuries. Geophysical Research
Letters, 28(23), 4511-4514. doi: 10.1029/2001GL013359 14(4), 485-519. doi:
10.1175/1520-0442(2001)014<0485:COTTAT>2.0.CO;2
Dai, A. (2011). Characteristics and trends in various forms of the palmer drought severity
index during 1900-2008. Journal of Geophysical Research-Atmospheres, 116,
D12115. doi: 10.1029/2010JD015541
Dai, A. (2013). Increasing drought under global warming in observations and models.
Nature Climate Change, 3(1), 52-58. doi: 10.1038/NCLIMATE1633
107
Dairaku, K., & Emori, S. (2006). Dynamic and thermodynamic influences on intensified
daily rainfall during the asian summer monsoon under doubled atmospheric CO2
conditions. Geophysical Research Letters, 33(1), L01704. doi:
10.1029/2005GL024754
Davis, S. & Walsh, K.J.E. (2008). Southeast Australian thunderstorms: are they
increasing in frequency? Australian Meteorological Magazine, 57. p. 1-11.
Del Genio, A. D., Yao, M., & Jonas, J. (2007). Will moist convection be stronger in a
warmer climate? Geophysical Research Letters, 34(16), L16703. doi:
10.1029/2007GL030525
Diffenbaugh, N., Pal, J., Trapp, R., & Giorgi, F. (2005). Fine-scale processes regulate the
response of extreme events to global climate change. Proceedings of the National
Academy of Sciences of the United States of America, 102(44), 15774-15778. doi:
10.1073/pnas.0506042102
Diffenbaugh et al. (2008). Does Global Warming Influence Tornado Activity? American
Geophysical Union, 89(53), 553-554. DOI: 10.1029/2008EO530001
Easterling, D. et al. (2000). Observed Variability and Trends in Extreme Climate Events:
A Brief Review. Bulletin of the American Meteorological Society. p. 417-425.
Emanuel, K. (2011). Global warming effects on US hurricane damage. Weather Climate
and Society, 3(4), 261-268. doi: 10.1175/WCAS-D-11-00007.1
108
EPA (2013). Climate Change Indicators in the United States: High and Low
Temperatures. http://www.epa.gov/climatechange/science/indicators/weather-
climate/high-low-temps.html Retrieved on August 3rd
, 2013
Emanuel, K. (2013). Downscaling CMIP5 climate models shows increased
tropical cyclone activity over the 21st century. PNAS.
www.pnas.org/cgi/doi/10.1073/pnas.1301293110
Fischer, E. M., & Schaer, C. (2009). Future changes in daily summer temperature
variability: Driving processes and role for temperature extremes. Climate Dynamics,
33(7-8), 917-935. doi: 10.1007/s00382-008-0473-8
Finnis, J., Holland, M. M., Serreze, M. C., & Cassano, J. J. (2007). Response of northern
hemisphere extratropical cyclone activity and associated precipitation to climate
change, as represented by the community climate system model. Journal of
Geophysical Research-Biogeosciences, 112(G4), G04S42. doi:
10.1029/2006JG000286
Fosberg, M. et al. (1990) Global change: effects on forest ecosystems and wildfire
severity. Page 463-486 in J.G. Goldammer, ed. Fire in the Tropical Biota:
Ecosystem Processes and Global Challenges.
Frierson, D. M. W. (2006). Robust increases in midlatitude static stability in simulations
of global warming. Geophysical Research Letters, 33(24), L24816. doi:
10.1029/2006GL027504
109
Fyfe, J. (2003). Extratropical southern hemisphere cyclones: Harbingers of climate
change? Journal of Climate, 16(17), 2802-2805. doi: 10.1175/1520-
0442(2003)016<2802:ESHCHO>2.0.CO;2
Geng, Q., & Sugi, M. (2003). Possible change of extratropical cyclone activity due to
enhanced greenhouse gases and sulfate aerosols - study with a high-resolution
AGCM. Journal of Climate, 16(13), 2262-2274. doi: 10.1175/1520-
0442(2003)16<2262:PCOECA>2.0.CO;2
Goklany, I. (2009). Deaths and Death Rates from Extreme Weather Events: 1900-2008.
Journal of American Physicians and Surgeons, 14(4). p. 102-109.
Gordon, H., Whetton, P., Pittock, A., Fowler, A., & Haylock, M. (1992). Simulated
changes in daily rainfall intensity due to the enhanced greenhouse-effect -
implications for extreme rainfall events. Climate Dynamics, 8(2), 83-102.
Gregory, J., Mitchell, J., & Brady, A. (1997). Summer drought in northern midlatitudes in
a time-dependent CO2 climate experiment. Journal of Climate, 10(4), 662-686. doi:
10.1175/1520-0442(1997)010<0662:SDINMI>2.0.CO;2
Gualdi, S., Scoccimarro, E., & Navarra, A. (2008). Changes in tropical cyclone activity
due to global warming: Results from a high-resolution coupled general circulation
model. Journal of Climate, 21(20), 5204-5228. doi: 10.1175/2008JCLI1921.1
Haarsma, R., Mitchell, J., & Senior, C. (1993). Tropical disturbances in a gcm. Climate
Dynamics, 8(5), 247-257.
110
Hart, T., Bourke, W., McAvaney, B., Forgan, B., & McGregor, J. (1990). Atmospheric
general-circulation simulations with the bmrc global spectral model - the impact of
revised physical parameterizations. Journal of Climate, 3(4), 436-459. doi:
10.1175/1520-0442(1990)003<0436:AGCSWT>2.0.CO;2
Held & Soden. (2000). Water Vapor Feedback And Global Warming. Annual Review of
Energy and the Environment, 25. p. 441-475.
Held, I. M., & Soden, B. J. (2006). Robust responses of the hydrological cycle to global
warming. Journal of Climate, 19(21), 5686-5699. doi: 10.1175/JCLI3990.1
Held, I. M., & Zhao, M. (2011). The response of tropical cyclone statistics to an increase
in CO2 with fixed sea surface temperatures. Journal of Climate, 24(20), 5353-5364.
doi: 10.1175/JCLI-D-11-00050.1
Henderson-Sellers, A., Dickinson, R., Durbidge, T., Kennedy, P., McGuffie, K., &
Pitman, A. (1993). Tropical deforestation - modeling local-scale to regional-scale
climate change. Journal of Geophysical Research-Atmospheres, 98(D4), 7289-7315.
doi: 10.1029/92JD02830
Hennessy, K., Gregory, J., & Mitchell, J. (1997). Changes in daily precipitation under
enhanced greenhouse conditions. Climate Dynamics, 13(9), 667-680. doi:
10.1007/s003820050189
111
Holloway, C. E., & Neelin, J. D. (2009). Moisture vertical structure, column water vapor,
and tropical deep convection. Journal of the Atmospheric Sciences, 66(6), 1665-
1683. doi: 10.1175/2008JAS2806.1
Houghton, JT, et al. (1990) Climate change: the IPCC scientific assessment. Cambridge,
UK: Cambridge University Press.
Hu, Z., Latif, M., Roeckner, E., & Bengtsson, L. (2000). Intensified Asian summer
monsoon and its variability in a coupled model forced by increasing greenhouse gas
concentrations. Geophysical Research Letters, 27(17), 2681-2684. doi:
10.1029/2000GL011550
Huth, R., Kysely, J., & Pokorna, L. (2000). A GCM simulation of heat waves, dry spells,
and their relationships to circulation. Climatic Change, 46(1-2), 29-60. doi:
10.1023/A:1005633925903
Jiang, J. & Perrie, W. (2007). The Impacts of Climate Change on Autumn North Atlantic
Midlatitude Cyclones. Journal of Climate. 20. p. 1174-1187.
Johns, T., et al. (2003). Anthropogenic climate change for 1860 to 2100 simulated with
the HadCM3 model under updated emissions scenarios. Climate Dynamics, 20(6),
583-612. doi: 10.1007/s00382-002-0296-y
Kharin, V., & Zwiers, F. (2000). Changes in the extremes in an ensemble of transient
climate simulations with a coupled atmosphere-ocean GCM. Journal of Climate,
13(21), 3760-3788. doi: 10.1175/1520-0442(2000)013<3760:CITEIA>2.0.CO;2
112
Knutson, T.R., et al. (2010). Tropical cyclones and climate change. Nature Geoscience,
3(3), 157-163. doi: 10.1038/NGEO779
Knutson, T.R., Sirutis, J. J., Garner, S. T., Vecchi, G. A., & Held, I. M. (2008). Simulated
reduction in Atlantic hurricane frequency under twenty-first-century warming
conditions. Nature Geoscience, 1(6), 359-364. doi: 10.1038/ngeo202
Knutson, T.R., & Manabe, S. (1994). Impact of increased CO2 on simulated ENSO-like
phenomena. Geophysical Research Letters, 21(21), 2295-2298. doi:
10.1029/94GL02152
Knutson, T.R., Manabe, S., & Gu, D. (1997). Simulated ENSO in a global coupled
ocean-atmosphere model: Multidecadal amplitude modulation and CO2 sensitivity.
Journal of Climate, 10(1), 138-161. doi: 10.1175/1520-
0442(1997)010<0138:SEIAGC>2.0.CO;2
Knutson, T.R., & Tuleya, R. (1999). Increased hurricane intensities with CO2-induced
warming as simulated using the GFDL hurricane prediction system. Climate
Dynamics, 15(7), 503-519. doi: 10.1007/s003820050296
Knutson, T. R., & Tuleya, R. (2004). Impact of CO2-induced warming on simulated
hurricane intensity and precipitation: Sensitivity to the choice of climate model and
convective parameterization. Journal of Climate, 17(18), 3477-3495. doi:
10.1175/1520-0442(2004)017<3477:IOCWOS>2.0.CO;2
113
Knutson, T.R., Tuleya, R., & Kurihara, Y. (1998). Simulated increase of hurricane
intensities in a CO2-warmed climate. Science, 279(5353), 1018-1020. doi:
10.1126/science.279.5353.1018
Knutson, T.R., Tuleya, R., Shen, W., & Ginis, I. (2001). Impact of CO2-induced
warming on hurricane intensities as simulated in a hurricane model with ocean
coupling. Journal of Climate, 14(11), 2458-2468. doi: 10.1175/1520-
0442(2001)014<2458:IOCIWO>2.0.CO;2
Konig, W., Sausen, R., & Seilmann, F. (1993). Objective identification of cyclones in
gcm simulations. Journal of Climate, 6(12), 2217-2231. doi: 10.1175/1520-
0442(1993)006<2217:OIOCIG>2.0.CO;2
Kripalani, R. H., Oh, J. H., Kulkarni, A., Sabade, S. S., & Chaudhari, H. S. (2007). South
Asian summer monsoon precipitation variability: Coupled climate model simulations
and projections under IPCC AR4. Theoretical and Applied Climatology, 90(3-4),
133-159. doi: 10.1007/s00704-006-0282-0
Kug, J., Jin, F., Sooraj, K. P., & Kang, I. (2008). State-dependent atmospheric noise
associated with ENSO. Geophysical Research Letters, 35(5), L05701. doi:
10.1029/2007GL032017
Kumar, S., Merwade, V., Kinter,James L.,,III, & Niyogi, D. (2013). Evaluation of
temperature and precipitation trends and long-term persistence in CMIP5 twentieth-
century climate simulations. Journal of Climate, 26(12), 4168-4185. doi:
10.1175/JCLI-D-12-00259.1
114
Lal, M., Meehl, G. A., & Arblaster, J. M. (2000). Simulation of Indian summer monsoon
rainfall and its intraseasonal variability in the NCAR climate system model.
Regional Environmental Change, 1(3-4), 163-179. doi: 10.1007/s101130000017
Lal, M., et al. (2001). Future climate change: Implications for Indian summer monsoon
and its variability. Current Science, 81(9), 1196-1207.
Lal, M., Whetton, P., Pittock, A., & Chakraborty, B. (1998). The greenhouse gas-induced
climate change over the Indian subcontinent as projected by general circulation
model experiments. Terrestrial Atmospheric and Oceanic Sciences, 9(4), 673-690.
Lambert, S. (1995). The effect of enhanced greenhouse warming on winter cyclone
frequencies and strengths. Journal of Climate, 8(5), 1447-1452. doi: 10.1175/1520-
0442(1995)008<1447:TEOEGW>2.0.CO;2
Lambert, S. (2004). Changes in winter cyclone frequencies and strengths in transient
enhanced greenhouse warming simulations using two coupled climate models.
Atmosphere-Ocean, 42(3), 173-181. doi: 10.3137/ao.420302
Lambert, S., & Fyfe, J. (2006). Changes in winter cyclone frequencies and strengths
simulated in enhanced greenhouse warming experiments: Results from the models
participating in the IPCC diagnostic exercise. Climate Dynamics, 26(7-8), 713-728.
doi: 10.1007/s00382-006-0110-3
115
Lau, N., & Nath, M. J. (2012). A model study of heat waves over North America:
Meteorological aspects and projections for the twenty-first century. Journal of
Climate, 25(14), 4761-4784. doi: 10.1175/JCLI-D-11-00575.1
Lau, W. K. -., Wu, H. -., & Kim, K. -. (2013). A canonical response of precipitation
characteristics to global warming from CMIP5 models. Geophysical Research
Letters, 40(12), 3163-3169. doi: 10.1002/grl.50420
Lee, C. C. (2012). Utilizing synoptic climatological methods to assess the impacts of
climate change on future tornado-favorable environments. Natural Hazards, 62(2),
325-343. doi: 10.1007/s11069-011-9998-y
Lenderink, G., & Van Meijgaard, E. (2008). Increase in hourly precipitation extremes
beyond expectations from temperature changes. Nature Geoscience, 1(8), 511-514.
doi: 10.1038/ngeo262
Li, J., et al. (2011). Interdecadal modulation of El Nino amplitude during the past
millenium. Nature Climate Change, 1. p. 114-118.
Li, T., Kwon, M., Zhao, M., Kug, J., Luo, J., & Yu, W. (2010). Global warming shifts
pacific tropical cyclone location. Geophysical Research Letters, 37, L21804. doi:
10.1029/2010GL045124
Lin, N., Emanuel, K., Oppenheimer, M., & Vanmarcke, E. (2012). Physically based
assessment of hurricane surge threat under climate change. Nature Climate Change,
2(6), 462-467. doi: 10.1038/NCLIMATE1389
116
Lorenz, D. J., & DeWeaver, E. T. (2007). The response of the extratropical hydrological
cycle to global warming. Journal of Climate, 20(14), 3470-3484. doi:
10.1175/JCLI4192.1
Marzban, C., & Schaefer, J. (2001). The correlation between US tornadoes and pacific
sea surface temperatures. Monthly Weather Review, 129(4), 884-895. doi:
10.1175/1520-0493(2001)129<0884:TCBUST>2.0.CO;2
May, W. (2002). Simulated changes of the Indian summer monsoon under enhanced
greenhouse gas conditions in a global time-slice experiment. Geophysical Research
Letters, 29(7), 1118. doi: 10.1029/2001GL013808
May, W. (2004). Potential future changes in the indian summer monsoon due to
greenhouse warming: Analysis of mechanisms in a global time-slice experiment.
Climate Dynamics, 22(4), 389-414. doi: 10.1007/s00382-003-0389-2
May, W. (2011). The sensitivity of the Indian summer monsoon to a global warming of
2A degrees C with respect to pre-industrial times. Climate Dynamics, 37(9-10),
1843-1868. doi: 10.1007/s00382-010-0942-8
McDonald, R., Bleaken, D., Cresswell, D., Pope, V., & Senior, C. (2005). Tropical
storms: Representation and diagnosis in climate models and the impacts of climate
change. Climate Dynamics, 25(1), 19-36. doi: 10.1007/s00382-004-0491-0
117
McNeill, A. (2012). Annual Disaster/Death Statistics for US Storms. Wind Science and
Engineering Research Center, Texas Tech University.
http://www.depts.ttu.edu/weweb/Research/DebrisImpact/Reports/DDS.pdf
Meehl, G., & Arblaster, J. (2003). Mechanisms for projected future changes in south
asian monsoon precipitation. Climate Dynamics, 21(7-8), 659-675. doi:
10.1007/s00382-003-0343-3
Meehl, G., Collins, W., Boville, B., Kiehl, J., Wigley, T., & Arblaster, J. (2000).
Response of the NCAR climate system model to increased CO2 and the role of
physical processes. Journal of Climate, 13(11), 1879-1898. doi: 10.1175/1520-
0442(2000)013<1879:ROTNCS>2.0.CO;2
Meehl, G., & Tebaldi, C. (2004). More intense, more frequent, and longer lasting heat
waves in the 21st century. Science, 305(5686), 994-997. doi:
10.1126/science.1098704
Meehl, G., Teng, H., & Branstator, G. (2006). Future changes of El Nino in two global
coupled climate models. Climate Dynamics, 26(6), 549-566. doi: 10.1007/s00382-
005-0098-0
Meehl, G., & Washington, W. (1993). South Asian summer monsoon variability in a
model with doubled atmospheric carbon-dioxide concentration. Science, 260(5111),
1101-1104. doi: 10.1126/science.260.5111.1101
118
Meehl, G., Washington, W., Arblaster, J., Bettge, T., & Strand, W. (2000).
Anthropogenic forcing and decadal climate variability in sensitivity experiments of
twentieth- and twenty-first-century climate. Journal of Climate, 13(21), 3728-3744.
doi: 10.1175/1520-0442(2000)013<3728:AFADCV>2.0.CO;2
Mendelsohn, R., Emanuel, K., Chonabayashi, S., & Bakkensen, L. (2012). The impact of
climate change on global tropical cyclone damage. Nature Climate Change, 2(3),
205-209. doi: 10.1038/NCLIMATE1357
Merryfield, W. J. (2006). Changes to ENSO under CO2 doubling in a multimodel
ensemble. Journal of Climate, 19(16), 4009-4027. doi: 10.1175/JCLI3834.1
Michalon, N. et al. (1999). Contribution to the climatological study of lightning.
American Geophysical Union, 26(20). p. 3097-3100.
Min, S-K., et al. (2011). Human contribution to more-intense precipitation extremes.
Nature, 470(7334). p. 378–381.
Mitchell, J., & Ingram, W. (1992). Carbon-dioxide and climate - mechanisms of changes
in cloud. Journal of Climate, 5(1), 5-21. doi: 10.1175/1520-
0442(1992)005<0005:CDACMO>2.0.CO;2
Mizuta, R., Matsueda, M., Endo, H., & Yukimoto, S. (2011). Future change in
extratropical cyclones associated with change in the upper troposphere. Journal of
Climate, 24(24), 6456-6470. doi: 10.1175/2011JCLI3969.1
119
Mueller, B., & Seneviratne, S. I. (2012). Hot days induced by precipitation deficits at the
global scale. Proceedings of the National Academy of Sciences of the United States
of America, 109(31), 12398-12403. doi: 10.1073/pnas.1204330109
Murakami, H., Mizuta, R., & Shindo, E. (2012). Future changes in tropical cyclone
activity projected by multi-physics and multi-SST ensemble experiments using the
60-km-mesh MRI-AGCM. Climate Dynamics, 39(9-10), 2569-2584. doi:
10.1007/s00382-011-1223-x
Murakami, H., & Wang, B. (2010). Future change of north Atlantic tropical cyclone
tracks: Projection by a 20-km-mesh global atmospheric model. Journal of Climate,
23(10), 2699-2721. doi: 10.1175/2010JCLI3338.1
Murakami, H., Wang, B., & Kitoh, A. (2011). Future change of western north pacific
typhoons: Projections by a 20-km-mesh global atmospheric model. Journal of
Climate, 24(4), 1154-1169. doi: 10.1175/2010JCLI3723.1
Murakami, H., et al. (2012). Future changes in tropical cyclone activity projected by the
new high-resolution MRI-AGCM. Journal of Climate, 25(9), 3237-3260. doi:
10.1175/JCLI-D-11-00415.1
NOAA (2012). Tropical cyclone climatology. http://www.nhc.noaa.gov/climo/ Retrieved
on February 16th
, 2013.
120
NOAA (2013). Monthly and annual tornado summaries.
http://www.spc.noaa.gov/climo/online/monthly/newm.html Retrieved on April 2nd,
2013.
NOAA (2013). U.S. Tornado Climatology.
http://www.ncdc.noaa.gov/oa/climate/severeweather/tornadoes.html Retrieved on
July 28th, 2013.
National Research Council. (2011). Climate Stabilization Targets: Emissions,
Concentrations, and Impacts over Decades to Millennia (2011). Washington, DC:
The National Academies Press, 2011.
Noda, A., Kusunoki, S., Yoshimura, J., Yoshimura, H., Oouchi, K., & Mizuta, R. (2008).
In Hamilton K. O.,W. (Ed.), Global warming projection by an atmospheric general
circulation model with a 20-km grid doi: 10.1007/978-0-387-49791-4_7
Oglesby, R., & Saltzman, B. (1992). Equilibrium climate statistics of a general-
circulation model as a function of atmospheric carbon-dioxide .1. geographic
distributions of primary variables. Journal of Climate, 5(1), 66-92.
O'Gorman, P. A., & Muller, C. J. (2010). How closely do changes in surface and column
water vapor follow clausius-clapeyron scaling in climate change simulations?
Environmental Research Letters, 5(2), 025207. doi: 10.1088/1748-9326/5/2/025207
121
Oouchi, K., Yoshimura, J., Yoshimura, H., Mizuta, R., Kusunoki, S., & Noda, A. (2006).
Tropical cyclone climatology in a global-warming climate as simulated in a 20 km-
mesh global atmospheric model: Frequency and wind intensity analyses. Journal of
the Meteorological Society of Japan, 84(2), 259-276. doi: 10.2151/jmsj.84.259
Peppler, R. (1988). A review of static stability and related thermodynamic parameters.
http://www.isws.illinois.edu/pubdoc/MP/ISWSMP-104.pdf Retrieved on February
17th, 2013.
Pinto, J. G., Ulbrich, U., Leckebusch, G. C., Spangehl, T., Reyers, M., & Zacharias, S.
(2007). Changes in storm track and cyclone activity in three SRES ensemble
experiments with the ECHAM5/MPI-OM1 GCM. Climate Dynamics, 29(2-3), 195-
210. doi: 10.1007/s00382-007-0230-4
Price, C. (2009). Will a drier climate result in more lightning? Atmospheric Research,
91(2-4). p. 479-484.
Radermacher, C., & Tomassini, L. (2012). Thermodynamic causes for future trends in
heavy precipitation over europe based on an ensemble of regional climate model
simulations. Journal of Climate, 25(21), 7669-7689. doi: 10.1175/JCLI-D-11-
00304.1
Raisanen, J. (2002). CO2-induced changes in interannual temperature and precipitation
variability in 19 CMIP2 experiments. Journal of Climate, 15(17), 2395-2411. doi:
10.1175/1520-0442(2002)015<2395:CICIIT>2.0.CO;2
122
Reed, R. (1988). Advances in knowledge and understanding of extratropical cyclones
during the past quarter century - an overview. Palmen Memorial Symposium on
Extratropical Cyclones, 6-9.
Rice, D. (2011). USA Slammed by 12 disasters that each cost at least &1B. USA Today.
http://www.usatoday.com/weather/news/story/2011-12-07/billion-dollardisasters/
51704362/1
Rind, D., Goldberg, R., Hansen, J., Rosenzweig, C., & Ruedy, R. (1990). Potential
evapotranspiration and the likelihood of future drought. Journal of Geophysical
Research-Atmospheres, 95(D7), 9983-10004. doi: 10.1029/JD095iD07p09983
Rind, D. (1998). Just Add Water Vapor. Science, 281(5380). p.1152-1153.
Royer, J., & Chauvin, F. (2009). In Elsner J. J.,TH (Ed.), Response of tropical
cyclogenesis to global warming in an IPCC AR4 scenario
Sabade, S. S., Kulkarni, A., & Kripalani, R. H. (2011). Projected changes in South Asian
summer monsoon by multi-model global warming experiments. Theoretical and
Applied Climatology, 103(3-4), 543-565. doi: 10.1007/s00704-010-0296-5
Saunders, M. A., Chandler, R. E., Merchant, C. J., & Roberts, F. P. (2000). Atlantic
hurricanes and NW pacific typhoons: ENSO spatial impacts on occurrence and
landfall. Geophysical Research Letters, 27(8), 1147-1150. doi:
10.1029/1999GL010948
123
Schar, C., Vidale, P., Luthi, D., Frei, C., Haberli, C., Liniger, M., & Appenzeller, C.
(2004). The role of increasing temperature variability in European summer
heatwaves. Nature, 427(6972), 332-336. doi: 10.1038/nature02300
Semenov, V., & Bengtsson, L. (2002). Secular trends in daily precipitation
characteristics: Greenhouse gas simulation with a coupled AOGCM. Climate
Dynamics, 19(2), 123-140. doi: 10.1007/s00382-001-0218-4
Sheffield, J., & Wood, E. F. (2008). Projected changes in drought occurrence under
future global warming from multi-model, multi-scenario, IPCC AR4 simulations.
Climate Dynamics, 31(1), 79-105. doi: 10.1007/s00382-007-0340-z
Sinclair, M., & Watterson, I. (1999). Objective assessment of extratropical weather
systems in simulated climates. Journal of Climate, 12(12), 3467-3485. doi:
10.1175/1520-0442(1999)012<3467:OAOEWS>2.0.CO;2
Statistical Solutions. (2011). What is Meta Analysis? http://www.statistical-
solutionssoftware.com/what-is-meta-analysis/
Stowasser, M., Annamalai, H., & Hafner, J. (2009). Response of the south asian summer
monsoon to global warming: Mean and synoptic systems. Journal of Climate, 22(4),
1014-1036. doi: 10.1175/2008JCLI2218.1
Stowasser, M., Wang, Y., & Hamilton, K. (2007). Tropical cyclone changes in the
western north pacific in a global warming scenario. Journal of Climate, 20(11),
2378-2396. doi: 10.1175/JCLI4126.1
124
Sugi, M., Noda, A., & Sato, N. (2002). Influence of the global warming on tropical
cyclone climatology: An experiment with the JMA global model. Journal of the
Meteorological Society of Japan, 80(2), 249-272. doi: 10.2151/jmsj.80.249
Sugi, M., Murakami, H., & Yoshimura, J. (2009). A reduction in global tropical cyclone
frequency due to global warming. Sola, 5, 164-167. doi: 10.2151/sola.2009-042
Sugi, M., Murakami, H., & Yoshimura, J. (2012). On the mechanism of tropical cyclone
frequency changes due to global warming. Journal of the Meteorological Society of
Japan, 90A, 397-408. doi: 10.2151/jmsj.2012-A24
Sugi, M., & Yoshimura, J. (2012). Decreasing trend of tropical cyclone frequency in 228-
year high-resolution AGCM simulations. Geophysical Research Letters, 39, L19805.
doi: 10.1029/2012GL053360
Tebaldi, C. (2011). Climate Stabilization Targets: Emissions, Concentrations, and
Impacts over Decades to Millennia (2011). Washington, DC: The National
Academies Press, 2011.
Tett, S. (1995). Simulation of el nino-southern oscillation-like variability in a global
AOGCM and its response to C)2 increase. Journal of Climate, 8(6), 1473-1502. doi:
10.1175/1520-0442(1995)008<1473:SOENSO>2.0.CO;2
Thompson, S., & Pollard, D. (1995). A global climate model (genesis) with a land-
surface transfer scheme (lsx) .2. Co2 sensitivity. Journal of Climate, 8(5), 1104-
1121. doi: 10.1175/1520-0442(1995)008<1104:AGCMWA>2.0.CO;2
125
Timmermann, A., Jin, F., & Collins, M. (2004). Intensification of the annual cycle in the
tropical pacific due to greenhouse warming. Geophysical Research Letters, 31(12),
L12208. doi: 10.1029/2004GL019442
Timmermann, A., Oberhuber, J., Bacher, A., Esch, M., Latif, M., & Roeckner, E. (1999).
Increased el nino frequency in a climate model forced by future greenhouse
warming. Nature, 398(6729), 694-697.
Trapp, R. J., Diffenbaugh, N. S., Brooks, H. E., Baldwin, M. E., Robinson, E. D., & Pal,
J. S. (2007). Changes in severe thunderstorm environment frequency during the 21st
century caused by anthropogenically enhanced global radiative forcing. Proceedings
of the National Academy of Sciences of the United States of America, 104(50),
19719-19723. doi: 10.1073/pnas.0705494104
Trapp, R. J., Diffenbaugh, N. S., & Gluhovsky, A. (2009). Transient response of severe
thunderstorm forcing to elevated greenhouse gas concentrations. Geophysical
Research Letters, 36(1), L01703. doi: 10.1029/2008GL036203
Trenberth, K. (1998). Atmospheric moisture residence times and cycling: Implications
for rainfall rates and climate change. Climatic Change, 39(4), 667-694. doi:
10.1023/A:1005319109110
Trenberth, K., Fasullo, J., & Smith, L. (2005). Trends and variability in column-
integrated atmospheric water vapor. Climate Dynamics, 24(7-8), 741-758. doi:
10.1007/s00382-005-0017-4
126
Trenberth, K. E. (2012). Framing the way to relate climate extremes to climate change.
Climatic Change, 115(2), 283-290. doi: 10.1007/s10584-012-0441-5
Tsutsui, J. (2002). Implications of anthropogenic climate change for tropical cyclone
activity: A case study with the NCAR CCM2. Journal of the Meteorological Society
of Japan, 80(1), 45-65. doi: 10.2151/jmsj.80.45
Ueda, H., Iwai, A., Kuwako, K., & Hori, M. (2006). Impact of anthropogenic forcing on
the asian summer monsoon as simulated by eight GCMs. Geophysical Research
Letters, 33(6), L06703. doi: 10.1029/2005GL025336
Van Klooster, S. L., & Roebber, P. J. (2009). Surface-based convective potential in the
contiguous united states in a business-as-usual future climate. Journal of Climate,
22(12), 3317-3330. doi: 10.1175/2009JCLI2697.1
Vecchi, G., Soden, B., Wittenberg, A., Held, I., Leetmaa, A., & Harrison, M. (2006).
Weakening of tropical pacific atmospheric circulation due to anthropogenic forcing.
Nature, 441(7089), 73-76. doi: 10.1038/nature04744
Vecchi, G. A., & Soden, B. J. (2007). Global warming and the weakening of the tropical
circulation. Journal of Climate, 20(17), 4316-4340. doi: 10.1175/JCLI4258.1
Vecchi, G. A., & Soden, B. J. (2007). Increased tropical Atlantic wind shear in model
projections of global warming. Geophysical Research Letters, 34(8), L08702. doi:
10.1029/2006GL028905
127
Vellinga, P. V. et al. (2001). Insurance and Other Financial Services: Chapter 8 in
Climate Change 2001: Impacts, Vulnerability, and Adaptation. Geneva:
Intergovernmental Panel on Climate Change, Geneva: United Nations and World
Meteorological Organization.
Wang, C., & Wu, L. (2012). Tropical cyclone intensity change in the western north
pacific: Downscaling from IPCC AR4 experiments. Journal of the Meteorological
Society of Japan, 90(2), 223-233. doi: 10.2151/jmsj.2012-205
Wang, G. (2005). Agricultural drought in a future climate: Results from 15 global climate
models participating in the IPCC 4th assessment. Climate Dynamics, 25(7-8), 739-
753. doi: 10.1007/s00382-005-0057-9
Wang, W., Dudek, M., & Liang, X. (1992). Inadequacy of effective Co2 as a proxy in
assessing the regional climate change due to other radiatively active gases.
Geophysical Research Letters, 19(13), 1375-1378. doi: 10.1029/92GL01157
Wang, X. L., Feng, Y., Compo, G. P., Swail, V. R., Zwiers, F. W., Allan, R. J., &
Sardeshmukh, P. D. (2013). Trends and low frequency variability of extra-tropical
cyclone activity in the ensemble of twentieth century reanalysis. Climate Dynamics,
40(11-12), 2775-2800. doi: 10.1007/s00382-012-1450-9
Warren, R. et al. (2010). Increasing impacts of climate change upon ecosystems with
increasing global mean temperature rise. Climate Change, 106. p. 141-177.
128
Washington, W. et al. (2000). Parallel climate model (PCM) control and transient
simulations. Climate Dynamics, 16(10-11), 755-774. doi: 10.1007/s003820000079
Watterson, I. (2006). The intensity of precipitation during extratropical cyclones in global
warming simulations: A link to cyclone intensity? Tellus Series A-Dynamic
Meteorology and Oceanography, 58(1), 82-97. doi: 10.1111/j.1600-
0870.2006.00147.x
Watterson, I., Dix, M., Gordon, H., & McGregor, J. (1995). The csiro 9-level
atmospheric general-circulation model and its equilibrium present and doubled Co2
climates. Australian Meteorological Magazine, 44(2), 111-125.
Weart, S. (2003). The Discovery of Global Warming. Cambridge, U.S.A: Harvard
University Press. 240 pages.
Wehner, M. F., Bala, G., Duffy, P., Mirin, A. A., & Romano, R. (2010). Towards direct
simulation of future tropical cyclone statistics in a high-resolution global
atmospheric model. Advances in Meteorology, , 915303. doi: 10.1155/2010/915303
Weinkle, J., Maue, R., & Pielke, R., Jr. (2012). Historical global tropical cyclone
landfalls. Journal of Climate, 25(13), 4729-4735. doi: 10.1175/JCLI-D-11-00719.1
Wetherald, R., & Manabe, S. (1999). Detectability of summer dryness caused by
greenhouse warming. Climatic Change, 43(3), 495-511. doi:
10.1023/A:1005499220385
129
Wetherald, R., & Manabe, S. (2002). Simulation of hydrologic changes associated with
global warming. Journal of Geophysical Research-Atmospheres, 107(D19), 4379.
doi: 10.1029/2001JD001195
Whetton, P., Fowler, A., Haylock, M., & Pittock, A. (1993). Implications of climate-
change due to the enhanced greenhouse-effect on floods and droughts in Australia.
Climatic Change, 25(3-4), 289-317. doi: 10.1007/BF01098378
Yeh, S., & Kirtman, B. P. (2007). ENSO amplitude changes due to climate change
projections in different coupled models. Journal of Climate, 20(2), 203-217. doi:
10.1175/JCLI4001.1
Yoshimura, J., & Sugi, M. (2005). Tropical cyclone climatology in a high-resolution
AGCM -impacts of SST warming and CO2 increase. Sola, 1, 133-136. doi:
10.2151/sola.2005-035
Yoshimura, J., Sugi, M., & Noda, A. (2006). Influence of greenhouse warming on
tropical cyclone frequency. Journal of the Meteorological Society of Japan, 84(2),
405-428. doi: 10.2151/jmsj.84.405
Zelle, H., Van Oldenborgh, G., Burgers, G., & Dijkstra, H. (2005). El Nino and
greenhouse warming: Results from ensemble simulations with the NCAR CCSM.
Journal of Climate, 18(22), 4669-4683. doi: 10.1175/JCLI3574.1
130
Zhao, M., & Held, I. M. (2012). TC-permitting GCM simulations of hurricane frequency
response to sea surface temperature anomalies projected for the late-twenty-first
century. Journal of Climate, 25(8), 2995-3009. doi: 10.1175/JCLI-D-11-00313.1
Zhao, M., Held, I. M., Lin, S., & Vecchi, G. A. (2009). Simulations of global hurricane
climatology, interannual variability, and response to global warming using a 50-km
resolution GCM. Journal of Climate, 22(24), 6653-6678. doi:
10.1175/2009JCLI3049.1
Zhu, Y. & Toth, Z. Extreme Weather Events and Their Probabilistic Prediction By The
NCEP Ensemble Forecast
System.http://www.emc.ncep.noaa.gov/gmb/ens/target/ens/albapr/albapr.html
Zwiers, F., & Kharin, V. (1998). Changes in the extremes of the climate simulated by
CCC GCM2 under CO2 doubling. Journal of Climate, 11(9), 2200-2222. doi:
10.1175/1520-0442(1998)011<2200:CITEOT>2.0.CO;2
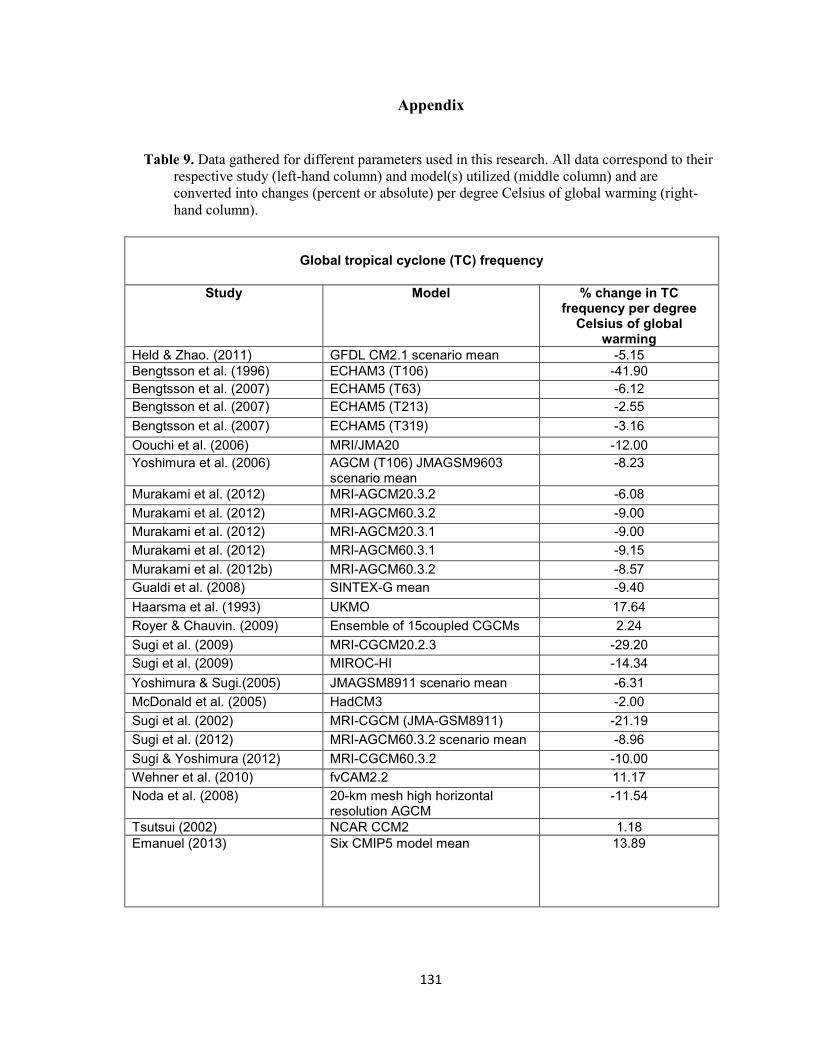
131
Appendix
Table 9. Data gathered for different parameters used in this research. All data correspond to their
respective study (left-hand column) and model(s) utilized (middle column) and are
converted into changes (percent or absolute) per degree Celsius of global warming (right-
hand column).
Global tropical cyclone (TC) frequency
Study Model % change in TC frequency per degree
Celsius of global warming
Held & Zhao. (2011) GFDL CM2.1 scenario mean -5.15
Bengtsson et al. (1996) ECHAM3 (T106) -41.90
Bengtsson et al. (2007) ECHAM5 (T63) -6.12
Bengtsson et al. (2007) ECHAM5 (T213) -2.55
Bengtsson et al. (2007) ECHAM5 (T319) -3.16
Oouchi et al. (2006) MRI/JMA20 -12.00
Yoshimura et al. (2006) AGCM (T106) JMAGSM9603 scenario mean
-8.23
Murakami et al. (2012) MRI-AGCM20.3.2 -6.08
Murakami et al. (2012) MRI-AGCM60.3.2 -9.00
Murakami et al. (2012) MRI-AGCM20.3.1 -9.00
Murakami et al. (2012) MRI-AGCM60.3.1 -9.15
Murakami et al. (2012b) MRI-AGCM60.3.2 -8.57
Gualdi et al. (2008) SINTEX-G mean -9.40
Haarsma et al. (1993) UKMO 17.64
Royer & Chauvin. (2009) Ensemble of 15coupled CGCMs 2.24
Sugi et al. (2009) MRI-CGCM20.2.3 -29.20
Sugi et al. (2009) MIROC-HI -14.34
Yoshimura & Sugi.(2005) JMAGSM8911 scenario mean -6.31
McDonald et al. (2005) HadCM3 -2.00
Sugi et al. (2002) MRI-CGCM (JMA-GSM8911) -21.19
Sugi et al. (2012) MRI-AGCM60.3.2 scenario mean -8.96
Sugi & Yoshimura (2012) MRI-CGCM60.3.2 -10.00
Wehner et al. (2010) fvCAM2.2 11.17
Noda et al. (2008) 20-km mesh high horizontal resolution AGCM
-11.54
Tsutsui (2002) NCAR CCM2 1.18
Emanuel (2013) Six CMIP5 model mean 13.89
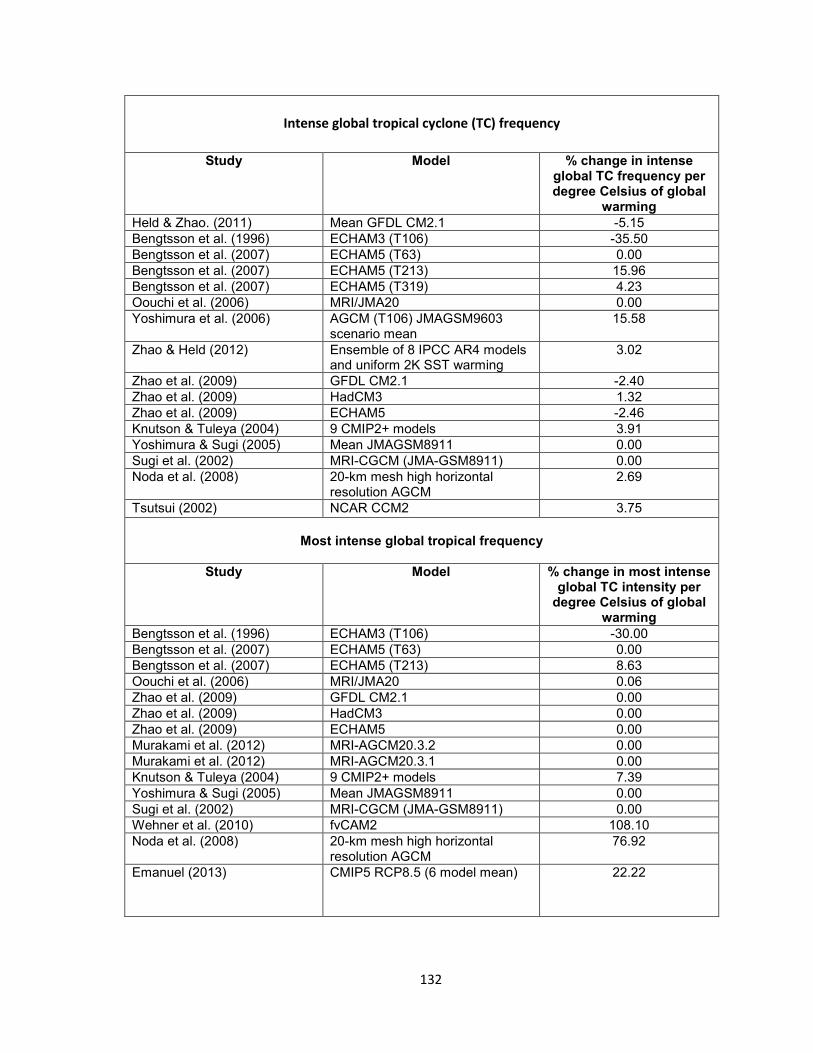
132
Intense global tropical cyclone (TC) frequency
Study Model % change in intense global TC frequency per degree Celsius of global
warming
Held & Zhao. (2011) Mean GFDL CM2.1 -5.15
Bengtsson et al. (1996) ECHAM3 (T106) -35.50
Bengtsson et al. (2007) ECHAM5 (T63) 0.00
Bengtsson et al. (2007) ECHAM5 (T213) 15.96
Bengtsson et al. (2007) ECHAM5 (T319) 4.23
Oouchi et al. (2006) MRI/JMA20 0.00
Yoshimura et al. (2006) AGCM (T106) JMAGSM9603 scenario mean
15.58
Zhao & Held (2012) Ensemble of 8 IPCC AR4 models and uniform 2K SST warming
3.02
Zhao et al. (2009) GFDL CM2.1 -2.40
Zhao et al. (2009) HadCM3 1.32
Zhao et al. (2009) ECHAM5 -2.46
Knutson & Tuleya (2004) 9 CMIP2+ models 3.91
Yoshimura & Sugi (2005) Mean JMAGSM8911 0.00
Sugi et al. (2002) MRI-CGCM (JMA-GSM8911) 0.00
Noda et al. (2008) 20-km mesh high horizontal resolution AGCM
2.69
Tsutsui (2002) NCAR CCM2 3.75
Most intense global tropical frequency
Study Model % change in most intense global TC intensity per
degree Celsius of global warming
Bengtsson et al. (1996) ECHAM3 (T106) -30.00
Bengtsson et al. (2007) ECHAM5 (T63) 0.00
Bengtsson et al. (2007) ECHAM5 (T213) 8.63
Oouchi et al. (2006) MRI/JMA20 0.06
Zhao et al. (2009) GFDL CM2.1 0.00
Zhao et al. (2009) HadCM3 0.00
Zhao et al. (2009) ECHAM5 0.00
Murakami et al. (2012) MRI-AGCM20.3.2 0.00
Murakami et al. (2012) MRI-AGCM20.3.1 0.00
Knutson & Tuleya (2004) 9 CMIP2+ models 7.39
Yoshimura & Sugi (2005) Mean JMAGSM8911 0.00
Sugi et al. (2002) MRI-CGCM (JMA-GSM8911) 0.00
Wehner et al. (2010) fvCAM2 108.10
Noda et al. (2008) 20-km mesh high horizontal resolution AGCM
76.92
Emanuel (2013) CMIP5 RCP8.5 (6 model mean) 22.22
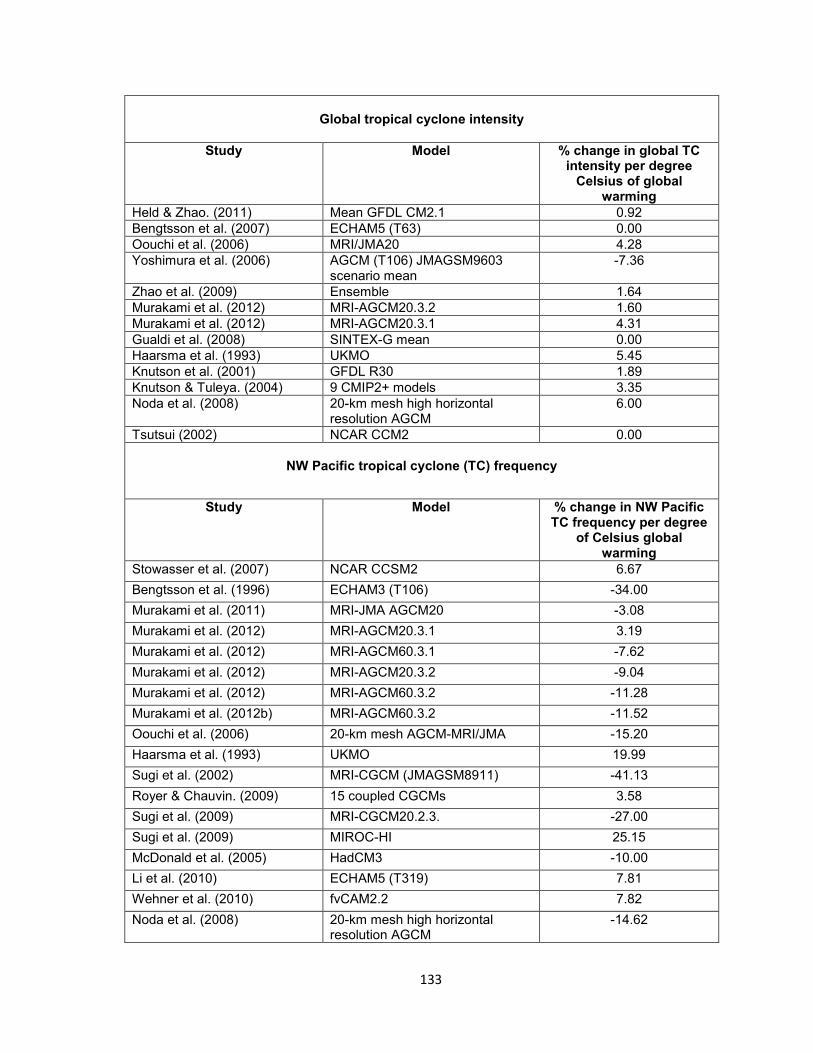
133
Global tropical cyclone intensity
Study Model % change in global TC intensity per degree
Celsius of global warming
Held & Zhao. (2011) Mean GFDL CM2.1 0.92
Bengtsson et al. (2007) ECHAM5 (T63) 0.00
Oouchi et al. (2006) MRI/JMA20 4.28
Yoshimura et al. (2006) AGCM (T106) JMAGSM9603 scenario mean
-7.36
Zhao et al. (2009) Ensemble 1.64
Murakami et al. (2012) MRI-AGCM20.3.2 1.60
Murakami et al. (2012) MRI-AGCM20.3.1 4.31
Gualdi et al. (2008) SINTEX-G mean 0.00
Haarsma et al. (1993) UKMO 5.45
Knutson et al. (2001) GFDL R30 1.89
Knutson & Tuleya. (2004) 9 CMIP2+ models 3.35
Noda et al. (2008) 20-km mesh high horizontal resolution AGCM
6.00
Tsutsui (2002) NCAR CCM2 0.00
NW Pacific tropical cyclone (TC) frequency
Study Model % change in NW Pacific TC frequency per degree
of Celsius global warming
Stowasser et al. (2007) NCAR CCSM2 6.67
Bengtsson et al. (1996) ECHAM3 (T106) -34.00
Murakami et al. (2011) MRI-JMA AGCM20 -3.08
Murakami et al. (2012) MRI-AGCM20.3.1 3.19
Murakami et al. (2012) MRI-AGCM60.3.1 -7.62
Murakami et al. (2012) MRI-AGCM20.3.2 -9.04
Murakami et al. (2012) MRI-AGCM60.3.2 -11.28
Murakami et al. (2012b) MRI-AGCM60.3.2 -11.52
Oouchi et al. (2006) 20-km mesh AGCM-MRI/JMA -15.20
Haarsma et al. (1993) UKMO 19.99
Sugi et al. (2002) MRI-CGCM (JMAGSM8911) -41.13
Royer & Chauvin. (2009) 15 coupled CGCMs 3.58
Sugi et al. (2009) MRI-CGCM20.2.3. -27.00
Sugi et al. (2009) MIROC-HI 25.15
McDonald et al. (2005) HadCM3 -10.00
Li et al. (2010) ECHAM5 (T319) 7.81
Wehner et al. (2010) fvCAM2.2 7.82
Noda et al. (2008) 20-km mesh high horizontal resolution AGCM
-14.62
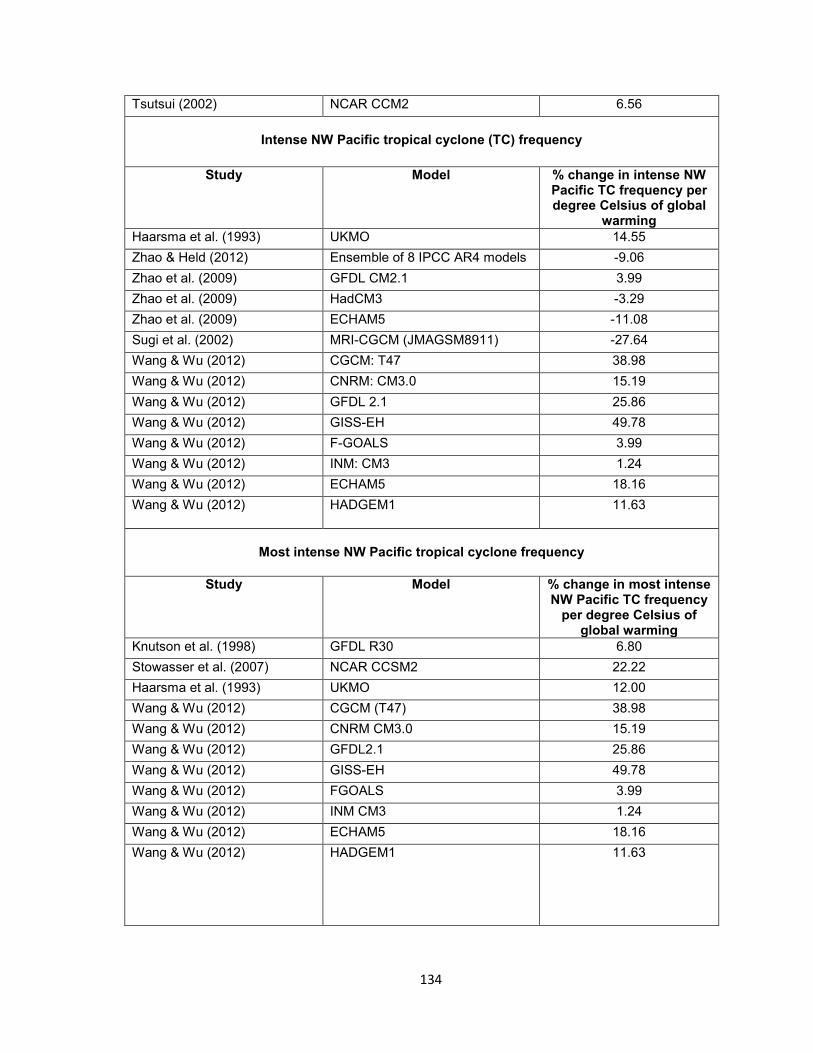
134
Tsutsui (2002) NCAR CCM2 6.56
Intense NW Pacific tropical cyclone (TC) frequency
Study Model % change in intense NW Pacific TC frequency per degree Celsius of global
warming
Haarsma et al. (1993) UKMO 14.55
Zhao & Held (2012) Ensemble of 8 IPCC AR4 models -9.06
Zhao et al. (2009) GFDL CM2.1 3.99
Zhao et al. (2009) HadCM3 -3.29
Zhao et al. (2009) ECHAM5 -11.08
Sugi et al. (2002) MRI-CGCM (JMAGSM8911) -27.64
Wang & Wu (2012) CGCM: T47 38.98
Wang & Wu (2012) CNRM: CM3.0 15.19
Wang & Wu (2012) GFDL 2.1 25.86
Wang & Wu (2012) GISS-EH 49.78
Wang & Wu (2012) F-GOALS 3.99
Wang & Wu (2012) INM: CM3 1.24
Wang & Wu (2012) ECHAM5 18.16
Wang & Wu (2012) HADGEM1 11.63
Most intense NW Pacific tropical cyclone frequency
Study Model % change in most intense NW Pacific TC frequency
per degree Celsius of global warming
Knutson et al. (1998) GFDL R30 6.80
Stowasser et al. (2007) NCAR CCSM2 22.22
Haarsma et al. (1993) UKMO 12.00
Wang & Wu (2012) CGCM (T47) 38.98
Wang & Wu (2012) CNRM CM3.0 15.19
Wang & Wu (2012) GFDL2.1 25.86
Wang & Wu (2012) GISS-EH 49.78
Wang & Wu (2012) FGOALS 3.99
Wang & Wu (2012) INM CM3 1.24
Wang & Wu (2012) ECHAM5 18.16
Wang & Wu (2012) HADGEM1 11.63
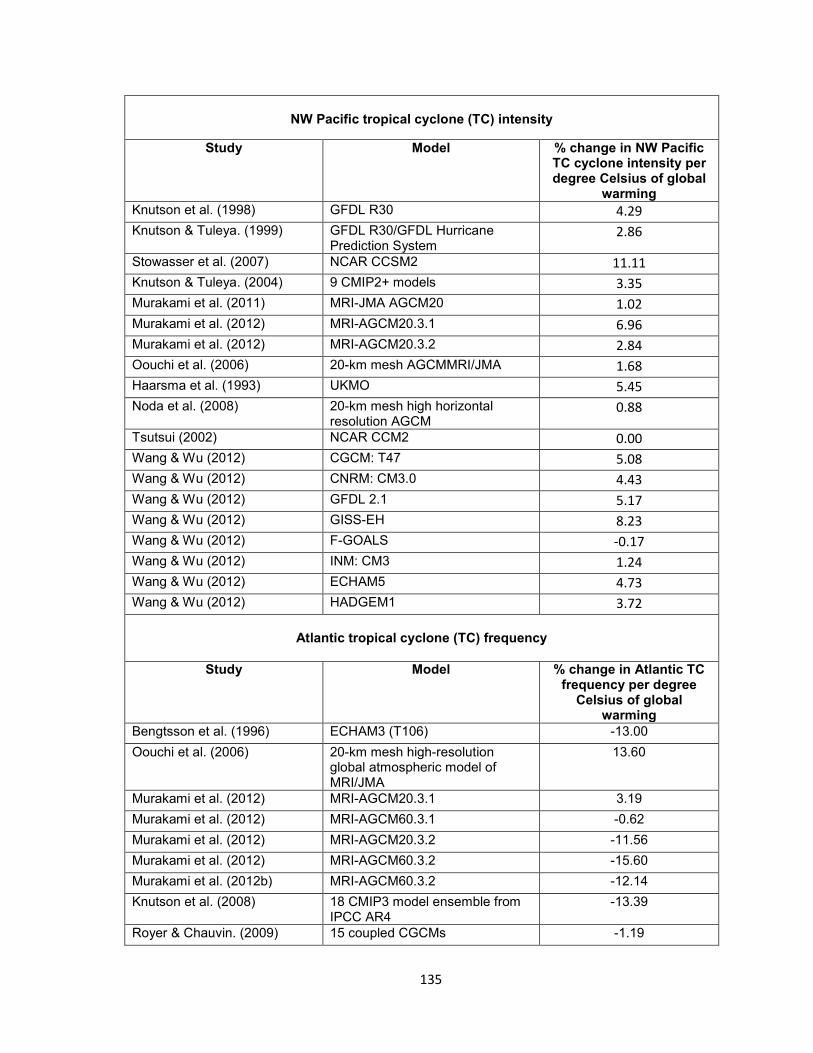
135
NW Pacific tropical cyclone (TC) intensity
Study Model % change in NW Pacific TC cyclone intensity per degree Celsius of global
warming
Knutson et al. (1998) GFDL R30 4.29
Knutson & Tuleya. (1999) GFDL R30/GFDL Hurricane Prediction System
2.86
Stowasser et al. (2007) NCAR CCSM2 11.11
Knutson & Tuleya. (2004) 9 CMIP2+ models 3.35
Murakami et al. (2011) MRI-JMA AGCM20 1.02
Murakami et al. (2012) MRI-AGCM20.3.1 6.96
Murakami et al. (2012) MRI-AGCM20.3.2 2.84
Oouchi et al. (2006) 20-km mesh AGCMMRI/JMA 1.68
Haarsma et al. (1993) UKMO 5.45
Noda et al. (2008) 20-km mesh high horizontal resolution AGCM
0.88
Tsutsui (2002) NCAR CCM2 0.00
Wang & Wu (2012) CGCM: T47 5.08
Wang & Wu (2012) CNRM: CM3.0 4.43
Wang & Wu (2012) GFDL 2.1 5.17
Wang & Wu (2012) GISS-EH 8.23
Wang & Wu (2012) F-GOALS -0.17
Wang & Wu (2012) INM: CM3 1.24
Wang & Wu (2012) ECHAM5 4.73
Wang & Wu (2012) HADGEM1 3.72
Atlantic tropical cyclone (TC) frequency
Study Model % change in Atlantic TC frequency per degree
Celsius of global warming
Bengtsson et al. (1996) ECHAM3 (T106) -13.00
Oouchi et al. (2006) 20-km mesh high-resolution global atmospheric model of MRI/JMA
13.60
Murakami et al. (2012) MRI-AGCM20.3.1 3.19
Murakami et al. (2012) MRI-AGCM60.3.1 -0.62
Murakami et al. (2012) MRI-AGCM20.3.2 -11.56
Murakami et al. (2012) MRI-AGCM60.3.2 -15.60
Murakami et al. (2012b) MRI-AGCM60.3.2 -12.14
Knutson et al. (2008) 18 CMIP3 model ensemble from IPCC AR4
-13.39
Royer & Chauvin. (2009) 15 coupled CGCMs -1.19
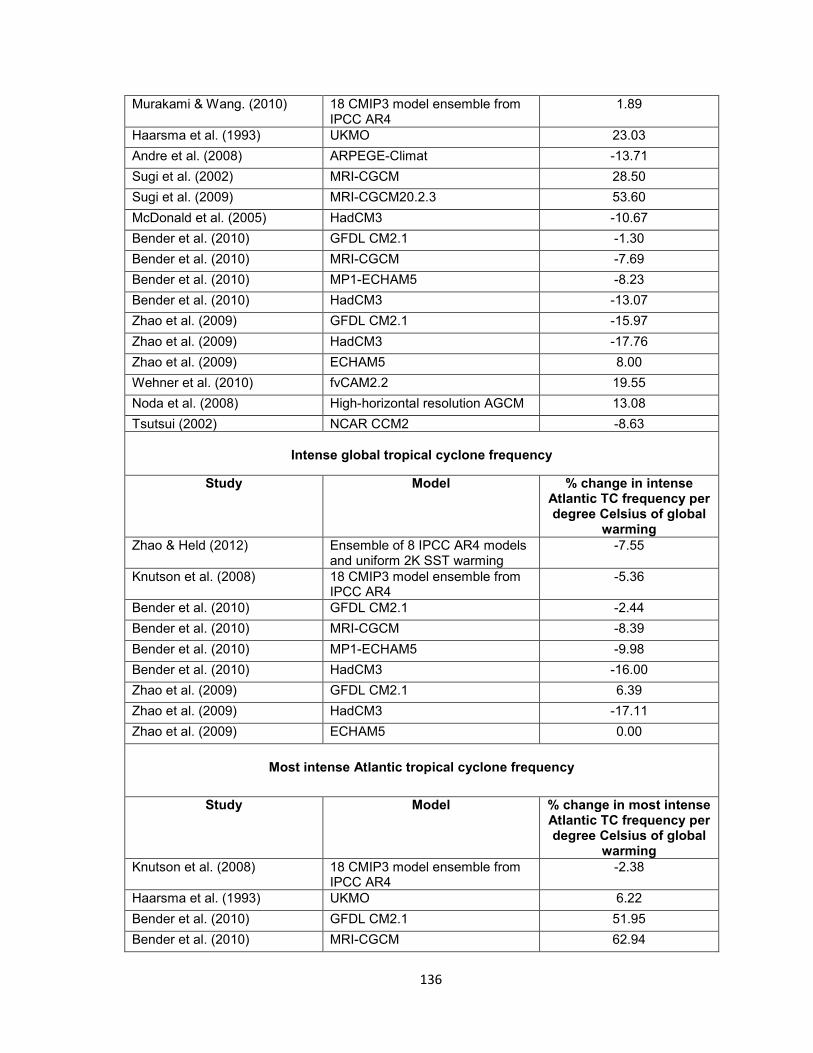
136
Murakami & Wang. (2010) 18 CMIP3 model ensemble from IPCC AR4
1.89
Haarsma et al. (1993) UKMO 23.03
Andre et al. (2008) ARPEGE-Climat -13.71
Sugi et al. (2002) MRI-CGCM 28.50
Sugi et al. (2009) MRI-CGCM20.2.3 53.60
McDonald et al. (2005) HadCM3 -10.67
Bender et al. (2010) GFDL CM2.1 -1.30
Bender et al. (2010) MRI-CGCM -7.69
Bender et al. (2010) MP1-ECHAM5 -8.23
Bender et al. (2010) HadCM3 -13.07
Zhao et al. (2009) GFDL CM2.1 -15.97
Zhao et al. (2009) HadCM3 -17.76
Zhao et al. (2009) ECHAM5 8.00
Wehner et al. (2010) fvCAM2.2 19.55
Noda et al. (2008) High-horizontal resolution AGCM 13.08
Tsutsui (2002) NCAR CCM2 -8.63
Intense global tropical cyclone frequency
Study Model % change in intense Atlantic TC frequency per degree Celsius of global
warming
Zhao & Held (2012) Ensemble of 8 IPCC AR4 models and uniform 2K SST warming
-7.55
Knutson et al. (2008) 18 CMIP3 model ensemble from IPCC AR4
-5.36
Bender et al. (2010) GFDL CM2.1 -2.44
Bender et al. (2010) MRI-CGCM -8.39
Bender et al. (2010) MP1-ECHAM5 -9.98
Bender et al. (2010) HadCM3 -16.00
Zhao et al. (2009) GFDL CM2.1 6.39
Zhao et al. (2009) HadCM3 -17.11
Zhao et al. (2009) ECHAM5 0.00
Most intense Atlantic tropical cyclone frequency
Study Model % change in most intense Atlantic TC frequency per degree Celsius of global
warming
Knutson et al. (2008) 18 CMIP3 model ensemble from IPCC AR4
-2.38
Haarsma et al. (1993) UKMO 6.22
Bender et al. (2010) GFDL CM2.1 51.95
Bender et al. (2010) MRI-CGCM 62.94
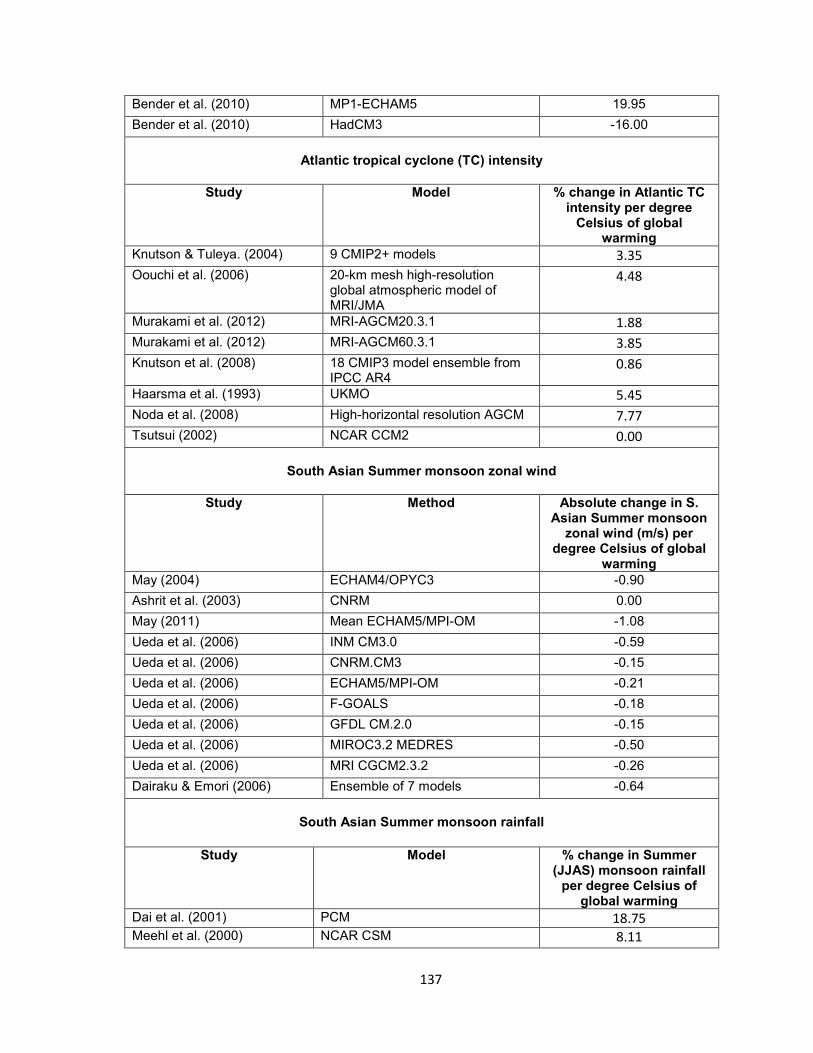
137
Bender et al. (2010) MP1-ECHAM5 19.95
Bender et al. (2010) HadCM3 -16.00
Atlantic tropical cyclone (TC) intensity
Study Model % change in Atlantic TC intensity per degree
Celsius of global warming
Knutson & Tuleya. (2004) 9 CMIP2+ models 3.35
Oouchi et al. (2006) 20-km mesh high-resolution global atmospheric model of MRI/JMA
4.48
Murakami et al. (2012) MRI-AGCM20.3.1 1.88
Murakami et al. (2012) MRI-AGCM60.3.1 3.85
Knutson et al. (2008) 18 CMIP3 model ensemble from IPCC AR4
0.86
Haarsma et al. (1993) UKMO 5.45
Noda et al. (2008) High-horizontal resolution AGCM 7.77
Tsutsui (2002) NCAR CCM2 0.00
South Asian Summer monsoon zonal wind
Study Method Absolute change in S. Asian Summer monsoon
zonal wind (m/s) per degree Celsius of global
warming
May (2004) ECHAM4/OPYC3 -0.90
Ashrit et al. (2003) CNRM 0.00
May (2011) Mean ECHAM5/MPI-OM -1.08
Ueda et al. (2006) INM CM3.0 -0.59
Ueda et al. (2006) CNRM.CM3 -0.15
Ueda et al. (2006) ECHAM5/MPI-OM -0.21
Ueda et al. (2006) F-GOALS -0.18
Ueda et al. (2006) GFDL CM.2.0 -0.15
Ueda et al. (2006) MIROC3.2 MEDRES -0.50
Ueda et al. (2006) MRI CGCM2.3.2 -0.26
Dairaku & Emori (2006) Ensemble of 7 models -0.64
South Asian Summer monsoon rainfall
Study Model % change in Summer (JJAS) monsoon rainfall
per degree Celsius of global warming
Dai et al. (2001) PCM 18.75 Meehl et al. (2000) NCAR CSM 8.11
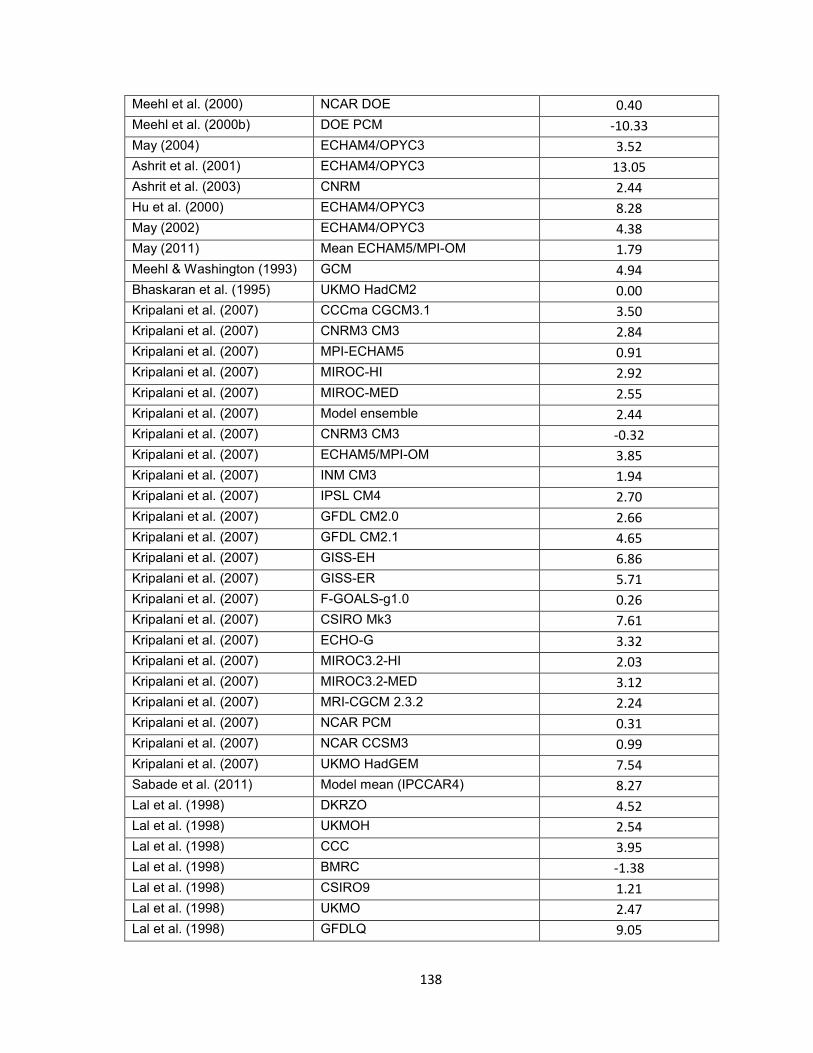
138
Meehl et al. (2000) NCAR DOE 0.40
Meehl et al. (2000b) DOE PCM -10.33
May (2004) ECHAM4/OPYC3 3.52
Ashrit et al. (2001) ECHAM4/OPYC3 13.05
Ashrit et al. (2003) CNRM 2.44
Hu et al. (2000) ECHAM4/OPYC3 8.28
May (2002) ECHAM4/OPYC3 4.38
May (2011) Mean ECHAM5/MPI-OM 1.79
Meehl & Washington (1993) GCM 4.94
Bhaskaran et al. (1995) UKMO HadCM2 0.00
Kripalani et al. (2007) CCCma CGCM3.1 3.50
Kripalani et al. (2007) CNRM3 CM3 2.84
Kripalani et al. (2007) MPI-ECHAM5 0.91
Kripalani et al. (2007) MIROC-HI 2.92
Kripalani et al. (2007) MIROC-MED 2.55
Kripalani et al. (2007) Model ensemble 2.44
Kripalani et al. (2007) CNRM3 CM3 -0.32
Kripalani et al. (2007) ECHAM5/MPI-OM 3.85
Kripalani et al. (2007) INM CM3 1.94
Kripalani et al. (2007) IPSL CM4 2.70
Kripalani et al. (2007) GFDL CM2.0 2.66
Kripalani et al. (2007) GFDL CM2.1 4.65
Kripalani et al. (2007) GISS-EH 6.86
Kripalani et al. (2007) GISS-ER 5.71
Kripalani et al. (2007) F-GOALS-g1.0 0.26
Kripalani et al. (2007) CSIRO Mk3 7.61
Kripalani et al. (2007) ECHO-G 3.32
Kripalani et al. (2007) MIROC3.2-HI 2.03
Kripalani et al. (2007) MIROC3.2-MED 3.12
Kripalani et al. (2007) MRI-CGCM 2.3.2 2.24
Kripalani et al. (2007) NCAR PCM 0.31
Kripalani et al. (2007) NCAR CCSM3 0.99
Kripalani et al. (2007) UKMO HadGEM 7.54
Sabade et al. (2011) Model mean (IPCCAR4) 8.27
Lal et al. (1998) DKRZO 4.52
Lal et al. (1998) UKMOH 2.54
Lal et al. (1998) CCC 3.95
Lal et al. (1998) BMRC -1.38
Lal et al. (1998) CSIRO9 1.21
Lal et al. (1998) UKMO 2.47
Lal et al. (1998) GFDLQ 9.05
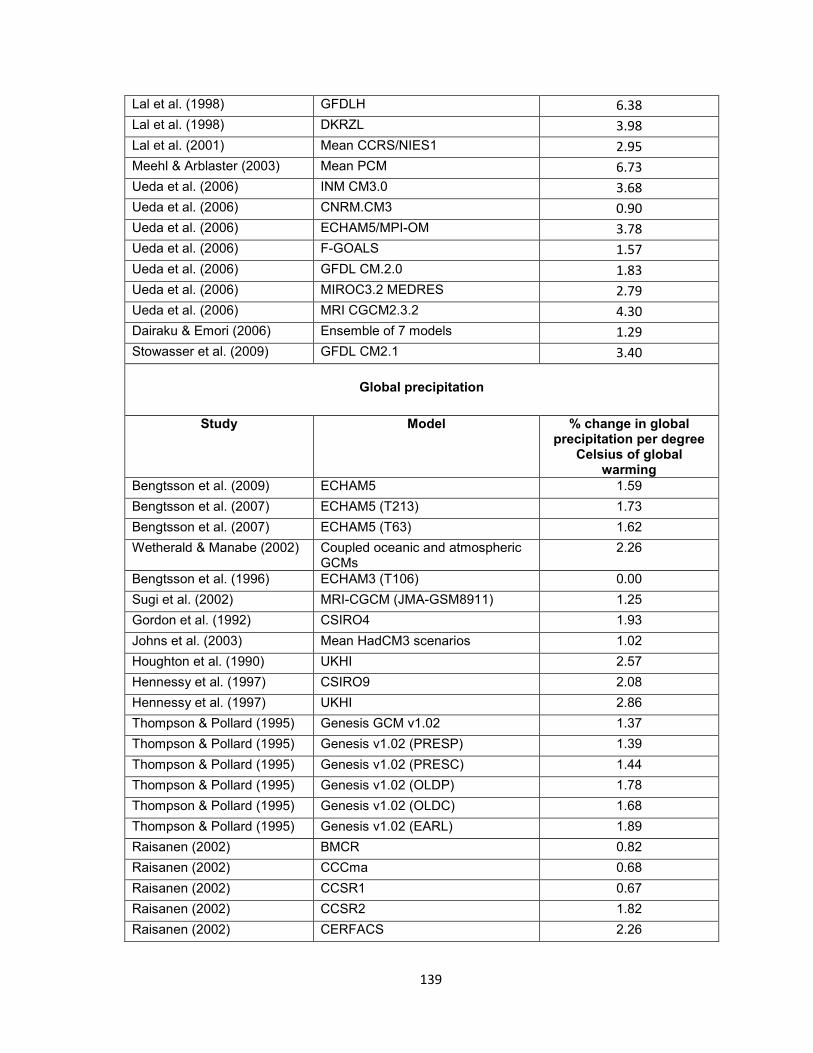
139
Lal et al. (1998) GFDLH 6.38
Lal et al. (1998) DKRZL 3.98
Lal et al. (2001) Mean CCRS/NIES1 2.95
Meehl & Arblaster (2003) Mean PCM 6.73
Ueda et al. (2006) INM CM3.0 3.68
Ueda et al. (2006) CNRM.CM3 0.90
Ueda et al. (2006) ECHAM5/MPI-OM 3.78
Ueda et al. (2006) F-GOALS 1.57
Ueda et al. (2006) GFDL CM.2.0 1.83
Ueda et al. (2006) MIROC3.2 MEDRES 2.79
Ueda et al. (2006) MRI CGCM2.3.2 4.30
Dairaku & Emori (2006) Ensemble of 7 models 1.29
Stowasser et al. (2009) GFDL CM2.1 3.40
Global precipitation
Study Model % change in global precipitation per degree
Celsius of global warming
Bengtsson et al. (2009) ECHAM5 1.59
Bengtsson et al. (2007) ECHAM5 (T213) 1.73
Bengtsson et al. (2007) ECHAM5 (T63) 1.62
Wetherald & Manabe (2002) Coupled oceanic and atmospheric GCMs
2.26
Bengtsson et al. (1996) ECHAM3 (T106) 0.00
Sugi et al. (2002) MRI-CGCM (JMA-GSM8911) 1.25
Gordon et al. (1992) CSIRO4 1.93
Johns et al. (2003) Mean HadCM3 scenarios 1.02
Houghton et al. (1990) UKHI 2.57
Hennessy et al. (1997) CSIRO9 2.08
Hennessy et al. (1997) UKHI 2.86
Thompson & Pollard (1995) Genesis GCM v1.02 1.37
Thompson & Pollard (1995) Genesis v1.02 (PRESP) 1.39
Thompson & Pollard (1995) Genesis v1.02 (PRESC) 1.44
Thompson & Pollard (1995) Genesis v1.02 (OLDP) 1.78
Thompson & Pollard (1995) Genesis v1.02 (OLDC) 1.68
Thompson & Pollard (1995) Genesis v1.02 (EARL) 1.89
Raisanen (2002) BMCR 0.82
Raisanen (2002) CCCma 0.68
Raisanen (2002) CCSR1 0.67
Raisanen (2002) CCSR2 1.82
Raisanen (2002) CERFACS 2.26
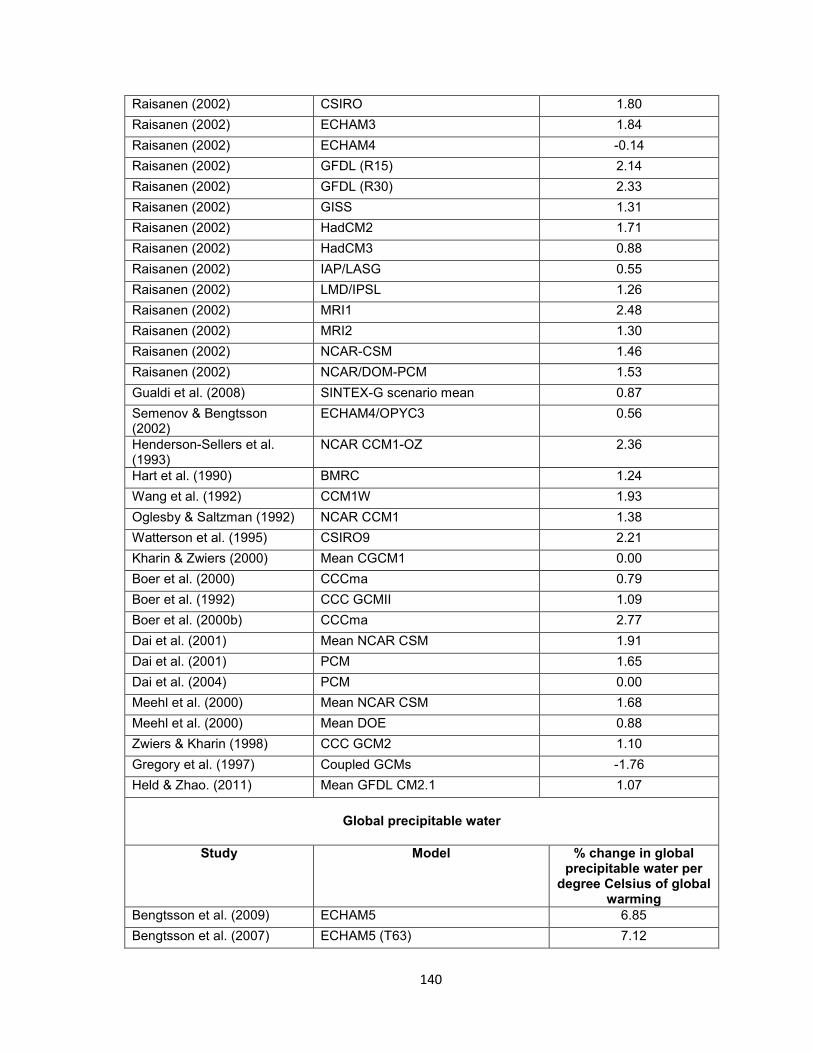
140
Raisanen (2002) CSIRO 1.80
Raisanen (2002) ECHAM3 1.84
Raisanen (2002) ECHAM4 -0.14
Raisanen (2002) GFDL (R15) 2.14
Raisanen (2002) GFDL (R30) 2.33
Raisanen (2002) GISS 1.31
Raisanen (2002) HadCM2 1.71
Raisanen (2002) HadCM3 0.88
Raisanen (2002) IAP/LASG 0.55
Raisanen (2002) LMD/IPSL 1.26
Raisanen (2002) MRI1 2.48
Raisanen (2002) MRI2 1.30
Raisanen (2002) NCAR-CSM 1.46
Raisanen (2002) NCAR/DOM-PCM 1.53
Gualdi et al. (2008) SINTEX-G scenario mean 0.87
Semenov & Bengtsson (2002)
ECHAM4/OPYC3 0.56
Henderson-Sellers et al. (1993)
NCAR CCM1-OZ 2.36
Hart et al. (1990) BMRC 1.24
Wang et al. (1992) CCM1W 1.93
Oglesby & Saltzman (1992) NCAR CCM1 1.38
Watterson et al. (1995) CSIRO9 2.21
Kharin & Zwiers (2000) Mean CGCM1 0.00
Boer et al. (2000) CCCma 0.79
Boer et al. (1992) CCC GCMII 1.09
Boer et al. (2000b) CCCma 2.77
Dai et al. (2001) Mean NCAR CSM 1.91
Dai et al. (2001) PCM 1.65
Dai et al. (2004) PCM 0.00
Meehl et al. (2000) Mean NCAR CSM 1.68
Meehl et al. (2000) Mean DOE 0.88
Zwiers & Kharin (1998) CCC GCM2 1.10
Gregory et al. (1997) Coupled GCMs -1.76
Held & Zhao. (2011) Mean GFDL CM2.1 1.07
Global precipitable water
Study Model % change in global precipitable water per
degree Celsius of global warming
Bengtsson et al. (2009) ECHAM5 6.85
Bengtsson et al. (2007) ECHAM5 (T63) 7.12
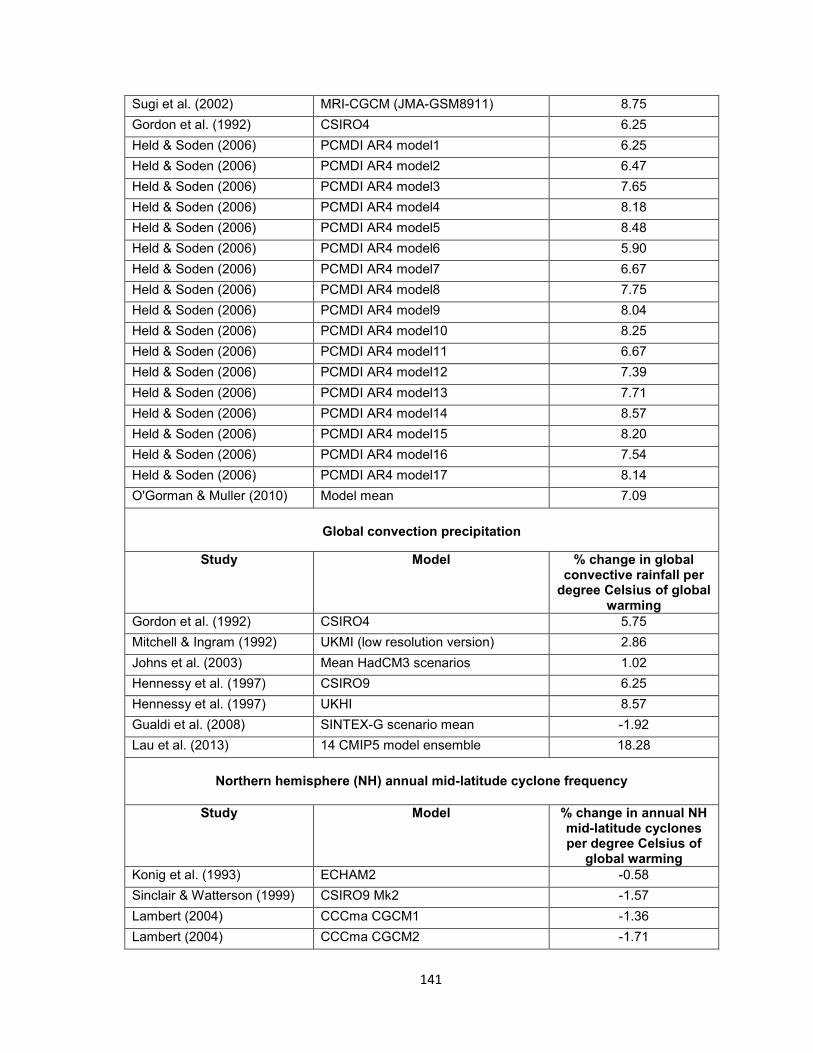
141
Sugi et al. (2002) MRI-CGCM (JMA-GSM8911) 8.75
Gordon et al. (1992) CSIRO4 6.25
Held & Soden (2006) PCMDI AR4 model1 6.25
Held & Soden (2006) PCMDI AR4 model2 6.47
Held & Soden (2006) PCMDI AR4 model3 7.65
Held & Soden (2006) PCMDI AR4 model4 8.18
Held & Soden (2006) PCMDI AR4 model5 8.48
Held & Soden (2006) PCMDI AR4 model6 5.90
Held & Soden (2006) PCMDI AR4 model7 6.67
Held & Soden (2006) PCMDI AR4 model8 7.75
Held & Soden (2006) PCMDI AR4 model9 8.04
Held & Soden (2006) PCMDI AR4 model10 8.25
Held & Soden (2006) PCMDI AR4 model11 6.67
Held & Soden (2006) PCMDI AR4 model12 7.39
Held & Soden (2006) PCMDI AR4 model13 7.71
Held & Soden (2006) PCMDI AR4 model14 8.57
Held & Soden (2006) PCMDI AR4 model15 8.20
Held & Soden (2006) PCMDI AR4 model16 7.54
Held & Soden (2006) PCMDI AR4 model17 8.14
O'Gorman & Muller (2010) Model mean 7.09
Global convection precipitation
Study Model % change in global convective rainfall per
degree Celsius of global warming
Gordon et al. (1992) CSIRO4 5.75
Mitchell & Ingram (1992) UKMI (low resolution version) 2.86
Johns et al. (2003) Mean HadCM3 scenarios 1.02
Hennessy et al. (1997) CSIRO9 6.25
Hennessy et al. (1997) UKHI 8.57
Gualdi et al. (2008) SINTEX-G scenario mean -1.92
Lau et al. (2013) 14 CMIP5 model ensemble 18.28
Northern hemisphere (NH) annual mid-latitude cyclone frequency
Study Model % change in annual NH mid-latitude cyclones per degree Celsius of
global warming
Konig et al. (1993) ECHAM2 -0.58
Sinclair & Watterson (1999) CSIRO9 Mk2 -1.57
Lambert (2004) CCCma CGCM1 -1.36
Lambert (2004) CCCma CGCM2 -1.71
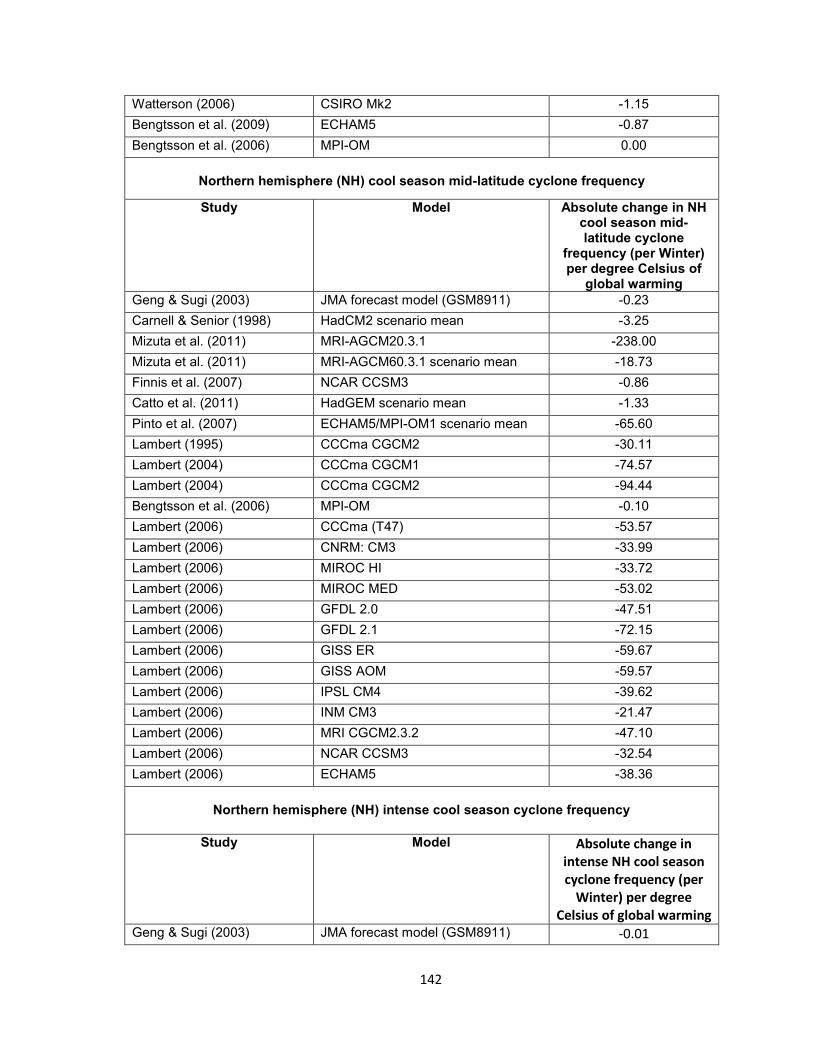
142
Watterson (2006) CSIRO Mk2 -1.15
Bengtsson et al. (2009) ECHAM5 -0.87
Bengtsson et al. (2006) MPI-OM 0.00
Northern hemisphere (NH) cool season mid-latitude cyclone frequency
Study Model Absolute change in NH cool season mid-latitude cyclone
frequency (per Winter) per degree Celsius of
global warming
Geng & Sugi (2003) JMA forecast model (GSM8911) -0.23
Carnell & Senior (1998) HadCM2 scenario mean -3.25
Mizuta et al. (2011) MRI-AGCM20.3.1 -238.00
Mizuta et al. (2011) MRI-AGCM60.3.1 scenario mean -18.73
Finnis et al. (2007) NCAR CCSM3 -0.86
Catto et al. (2011) HadGEM scenario mean -1.33
Pinto et al. (2007) ECHAM5/MPI-OM1 scenario mean -65.60
Lambert (1995) CCCma CGCM2 -30.11
Lambert (2004) CCCma CGCM1 -74.57
Lambert (2004) CCCma CGCM2 -94.44
Bengtsson et al. (2006) MPI-OM -0.10
Lambert (2006) CCCma (T47) -53.57
Lambert (2006) CNRM: CM3 -33.99
Lambert (2006) MIROC HI -33.72
Lambert (2006) MIROC MED -53.02
Lambert (2006) GFDL 2.0 -47.51
Lambert (2006) GFDL 2.1 -72.15
Lambert (2006) GISS ER -59.67
Lambert (2006) GISS AOM -59.57
Lambert (2006) IPSL CM4 -39.62
Lambert (2006) INM CM3 -21.47
Lambert (2006) MRI CGCM2.3.2 -47.10
Lambert (2006) NCAR CCSM3 -32.54
Lambert (2006) ECHAM5 -38.36
Northern hemisphere (NH) intense cool season cyclone frequency
Study Model Absolute change in intense NH cool season cyclone frequency (per
Winter) per degree Celsius of global warming
Geng & Sugi (2003) JMA forecast model (GSM8911) -0.01
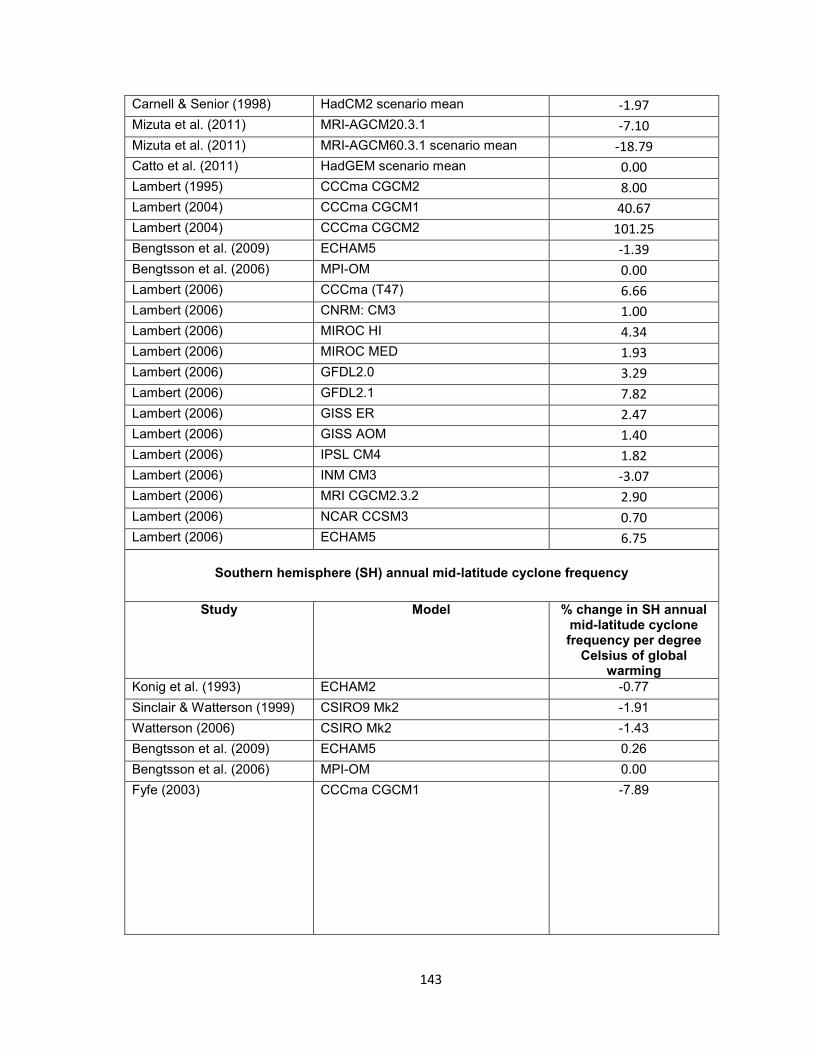
143
Carnell & Senior (1998) HadCM2 scenario mean -1.97
Mizuta et al. (2011) MRI-AGCM20.3.1 -7.10
Mizuta et al. (2011) MRI-AGCM60.3.1 scenario mean -18.79
Catto et al. (2011) HadGEM scenario mean 0.00
Lambert (1995) CCCma CGCM2 8.00
Lambert (2004) CCCma CGCM1 40.67
Lambert (2004) CCCma CGCM2 101.25
Bengtsson et al. (2009) ECHAM5 -1.39
Bengtsson et al. (2006) MPI-OM 0.00
Lambert (2006) CCCma (T47) 6.66
Lambert (2006) CNRM: CM3 1.00
Lambert (2006) MIROC HI 4.34
Lambert (2006) MIROC MED 1.93
Lambert (2006) GFDL2.0 3.29
Lambert (2006) GFDL2.1 7.82
Lambert (2006) GISS ER 2.47
Lambert (2006) GISS AOM 1.40
Lambert (2006) IPSL CM4 1.82
Lambert (2006) INM CM3 -3.07
Lambert (2006) MRI CGCM2.3.2 2.90
Lambert (2006) NCAR CCSM3 0.70
Lambert (2006) ECHAM5 6.75
Southern hemisphere (SH) annual mid-latitude cyclone frequency
Study Model % change in SH annual mid-latitude cyclone frequency per degree
Celsius of global warming
Konig et al. (1993) ECHAM2 -0.77
Sinclair & Watterson (1999) CSIRO9 Mk2 -1.91
Watterson (2006) CSIRO Mk2 -1.43
Bengtsson et al. (2009) ECHAM5 0.26
Bengtsson et al. (2006) MPI-OM 0.00
Fyfe (2003) CCCma CGCM1 -7.89
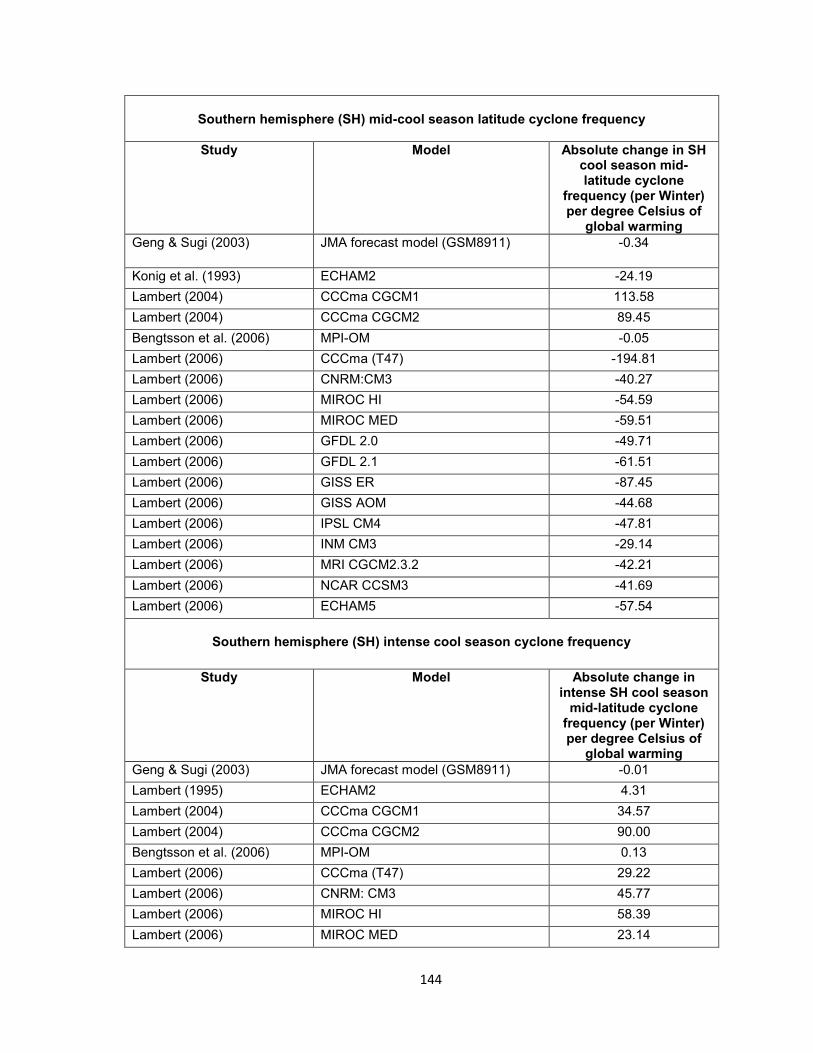
144
Southern hemisphere (SH) mid-cool season latitude cyclone frequency
Study Model Absolute change in SH cool season mid-latitude cyclone
frequency (per Winter) per degree Celsius of
global warming
Geng & Sugi (2003) JMA forecast model (GSM8911) -0.34
Konig et al. (1993) ECHAM2 -24.19
Lambert (2004) CCCma CGCM1 113.58
Lambert (2004) CCCma CGCM2 89.45
Bengtsson et al. (2006) MPI-OM -0.05
Lambert (2006) CCCma (T47) -194.81
Lambert (2006) CNRM:CM3 -40.27
Lambert (2006) MIROC HI -54.59
Lambert (2006) MIROC MED -59.51
Lambert (2006) GFDL 2.0 -49.71
Lambert (2006) GFDL 2.1 -61.51
Lambert (2006) GISS ER -87.45
Lambert (2006) GISS AOM -44.68
Lambert (2006) IPSL CM4 -47.81
Lambert (2006) INM CM3 -29.14
Lambert (2006) MRI CGCM2.3.2 -42.21
Lambert (2006) NCAR CCSM3 -41.69
Lambert (2006) ECHAM5 -57.54
Southern hemisphere (SH) intense cool season cyclone frequency
Study Model Absolute change in intense SH cool season
mid-latitude cyclone frequency (per Winter) per degree Celsius of
global warming
Geng & Sugi (2003) JMA forecast model (GSM8911) -0.01
Lambert (1995) ECHAM2 4.31
Lambert (2004) CCCma CGCM1 34.57
Lambert (2004) CCCma CGCM2 90.00
Bengtsson et al. (2006) MPI-OM 0.13
Lambert (2006) CCCma (T47) 29.22
Lambert (2006) CNRM: CM3 45.77
Lambert (2006) MIROC HI 58.39
Lambert (2006) MIROC MED 23.14
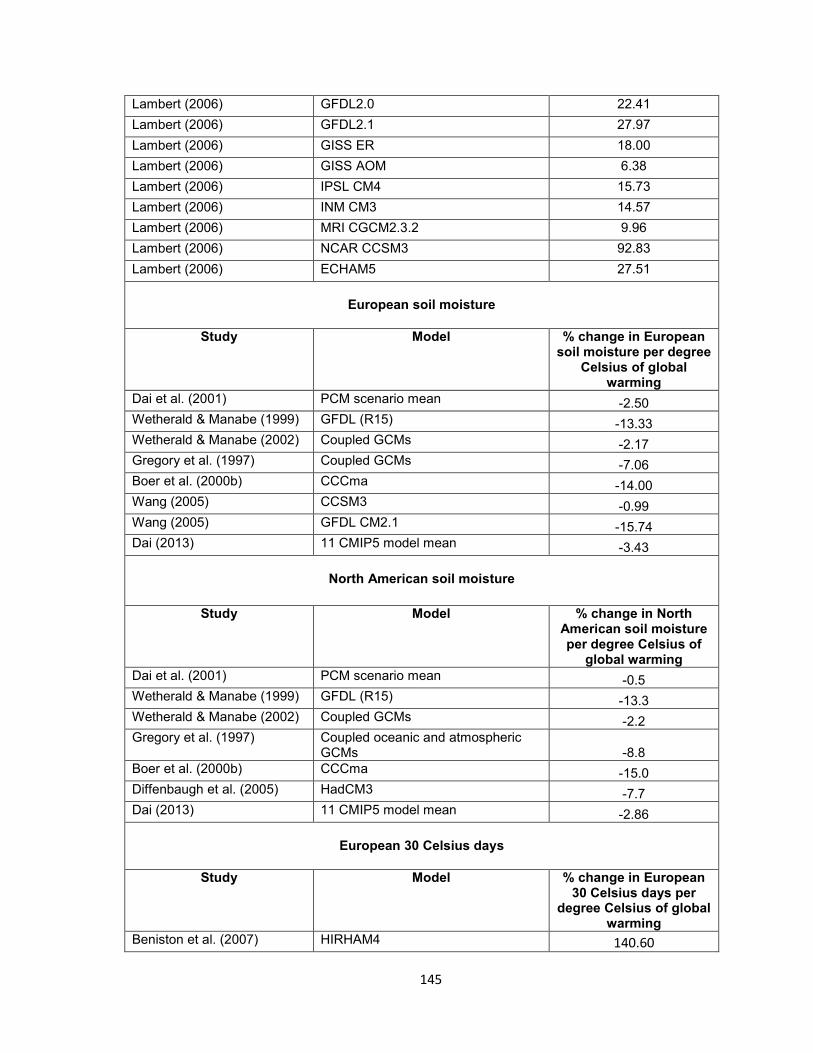
145
Lambert (2006) GFDL2.0 22.41
Lambert (2006) GFDL2.1 27.97
Lambert (2006) GISS ER 18.00
Lambert (2006) GISS AOM 6.38
Lambert (2006) IPSL CM4 15.73
Lambert (2006) INM CM3 14.57
Lambert (2006) MRI CGCM2.3.2 9.96
Lambert (2006) NCAR CCSM3 92.83
Lambert (2006) ECHAM5 27.51
European soil moisture
Study Model % change in European soil moisture per degree
Celsius of global warming
Dai et al. (2001) PCM scenario mean -2.50
Wetherald & Manabe (1999) GFDL (R15) -13.33
Wetherald & Manabe (2002) Coupled GCMs -2.17
Gregory et al. (1997) Coupled GCMs -7.06
Boer et al. (2000b) CCCma -14.00
Wang (2005) CCSM3 -0.99
Wang (2005) GFDL CM2.1 -15.74
Dai (2013) 11 CMIP5 model mean -3.43
North American soil moisture
Study Model % change in North American soil moisture per degree Celsius of
global warming
Dai et al. (2001) PCM scenario mean -0.5
Wetherald & Manabe (1999) GFDL (R15) -13.3
Wetherald & Manabe (2002) Coupled GCMs -2.2
Gregory et al. (1997) Coupled oceanic and atmospheric GCMs -8.8
Boer et al. (2000b) CCCma -15.0
Diffenbaugh et al. (2005) HadCM3 -7.7
Dai (2013) 11 CMIP5 model mean -2.86
European 30 Celsius days
Study Model % change in European 30 Celsius days per
degree Celsius of global warming
Beniston et al. (2007) HIRHAM4 140.60
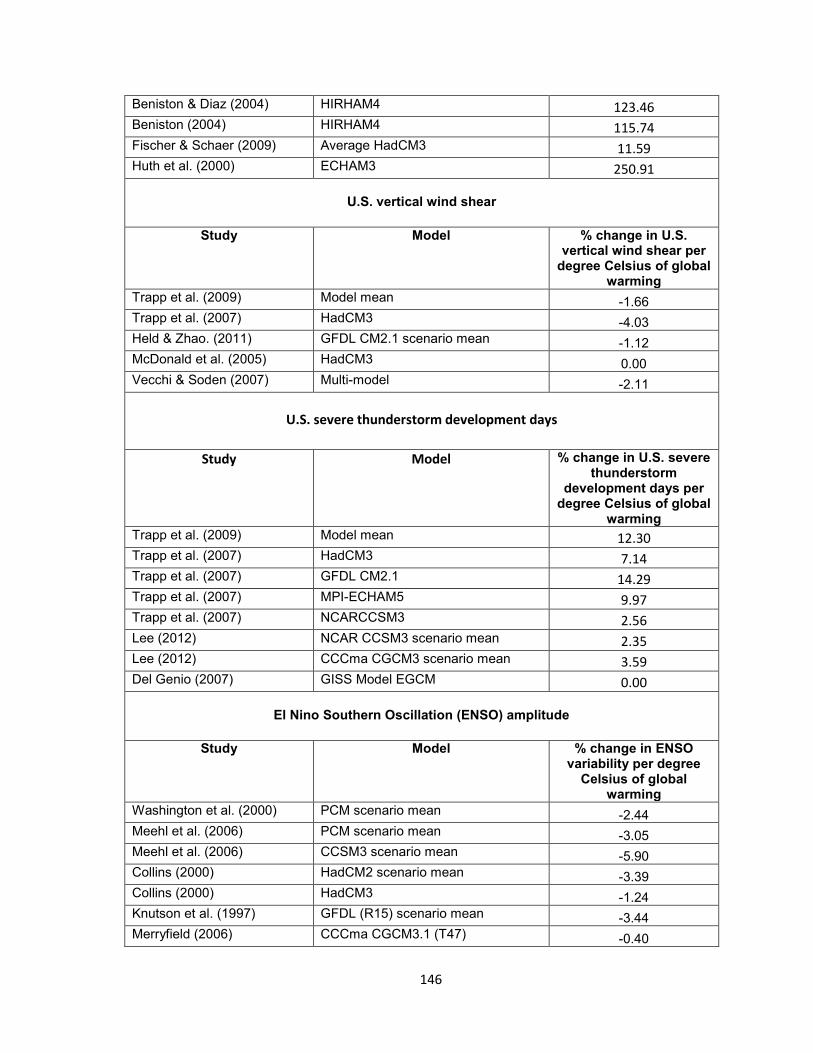
146
Beniston & Diaz (2004) HIRHAM4 123.46 Beniston (2004) HIRHAM4 115.74 Fischer & Schaer (2009) Average HadCM3 11.59 Huth et al. (2000) ECHAM3 250.91
U.S. vertical wind shear
Study Model % change in U.S. vertical wind shear per
degree Celsius of global warming
Trapp et al. (2009) Model mean -1.66
Trapp et al. (2007) HadCM3 -4.03
Held & Zhao. (2011) GFDL CM2.1 scenario mean -1.12
McDonald et al. (2005) HadCM3 0.00
Vecchi & Soden (2007) Multi-model -2.11
U.S. severe thunderstorm development days
Study Model % change in U.S. severe thunderstorm
development days per degree Celsius of global
warming
Trapp et al. (2009) Model mean 12.30 Trapp et al. (2007) HadCM3 7.14 Trapp et al. (2007) GFDL CM2.1 14.29 Trapp et al. (2007) MPI-ECHAM5 9.97 Trapp et al. (2007) NCARCCSM3 2.56 Lee (2012) NCAR CCSM3 scenario mean 2.35 Lee (2012) CCCma CGCM3 scenario mean 3.59 Del Genio (2007) GISS Model EGCM 0.00
El Nino Southern Oscillation (ENSO) amplitude
Study Model % change in ENSO variability per degree
Celsius of global warming
Washington et al. (2000) PCM scenario mean -2.44
Meehl et al. (2006) PCM scenario mean -3.05
Meehl et al. (2006) CCSM3 scenario mean -5.90
Collins (2000) HadCM2 scenario mean -3.39
Collins (2000) HadCM3 -1.24
Knutson et al. (1997) GFDL (R15) scenario mean -3.44
Merryfield (2006) CCCma CGCM3.1 (T47) -0.40
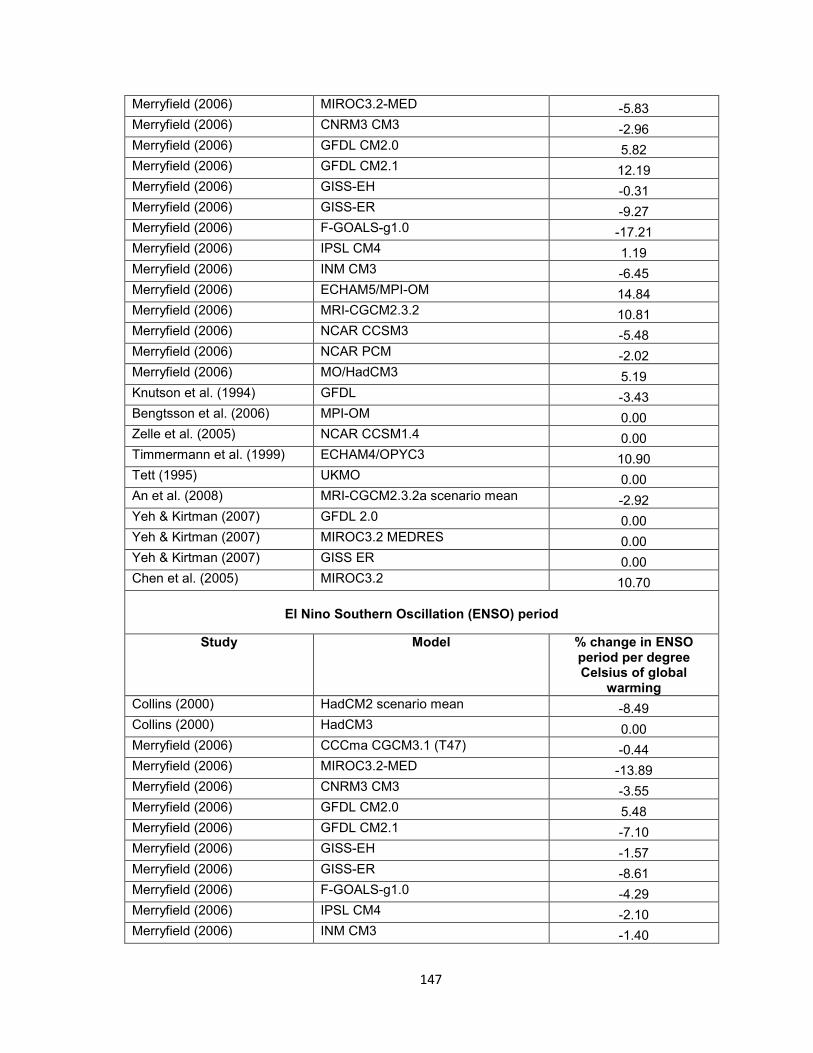
147
Merryfield (2006) MIROC3.2-MED -5.83
Merryfield (2006) CNRM3 CM3 -2.96
Merryfield (2006) GFDL CM2.0 5.82
Merryfield (2006) GFDL CM2.1 12.19
Merryfield (2006) GISS-EH -0.31
Merryfield (2006) GISS-ER -9.27
Merryfield (2006) F-GOALS-g1.0 -17.21
Merryfield (2006) IPSL CM4 1.19
Merryfield (2006) INM CM3 -6.45
Merryfield (2006) ECHAM5/MPI-OM 14.84
Merryfield (2006) MRI-CGCM2.3.2 10.81
Merryfield (2006) NCAR CCSM3 -5.48
Merryfield (2006) NCAR PCM -2.02
Merryfield (2006) MO/HadCM3 5.19
Knutson et al. (1994) GFDL -3.43
Bengtsson et al. (2006) MPI-OM 0.00
Zelle et al. (2005) NCAR CCSM1.4 0.00
Timmermann et al. (1999) ECHAM4/OPYC3 10.90
Tett (1995) UKMO 0.00
An et al. (2008) MRI-CGCM2.3.2a scenario mean -2.92
Yeh & Kirtman (2007) GFDL 2.0 0.00
Yeh & Kirtman (2007) MIROC3.2 MEDRES 0.00
Yeh & Kirtman (2007) GISS ER 0.00
Chen et al. (2005) MIROC3.2 10.70
El Nino Southern Oscillation (ENSO) period
Study Model % change in ENSO period per degree Celsius of global
warming
Collins (2000) HadCM2 scenario mean -8.49
Collins (2000) HadCM3 0.00
Merryfield (2006) CCCma CGCM3.1 (T47) -0.44
Merryfield (2006) MIROC3.2-MED -13.89
Merryfield (2006) CNRM3 CM3 -3.55
Merryfield (2006) GFDL CM2.0 5.48
Merryfield (2006) GFDL CM2.1 -7.10
Merryfield (2006) GISS-EH -1.57
Merryfield (2006) GISS-ER -8.61
Merryfield (2006) F-GOALS-g1.0 -4.29
Merryfield (2006) IPSL CM4 -2.10
Merryfield (2006) INM CM3 -1.40
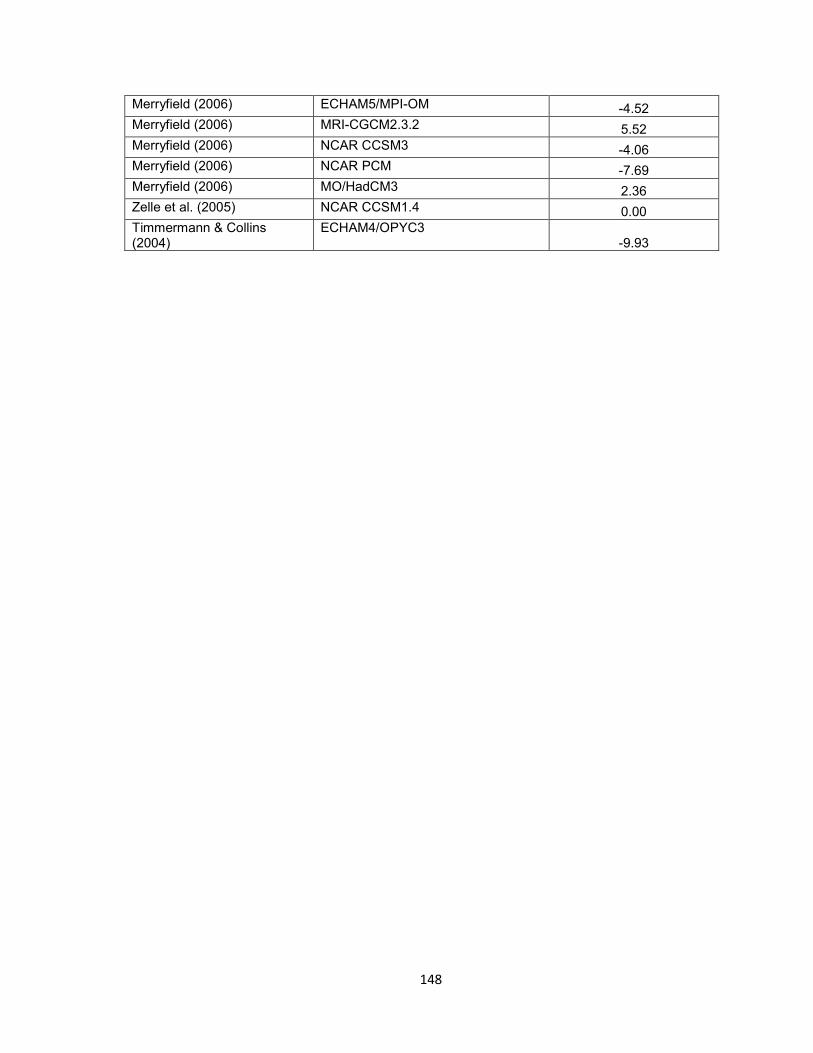
148
Merryfield (2006) ECHAM5/MPI-OM -4.52
Merryfield (2006) MRI-CGCM2.3.2 5.52
Merryfield (2006) NCAR CCSM3 -4.06
Merryfield (2006) NCAR PCM -7.69
Merryfield (2006) MO/HadCM3 2.36
Zelle et al. (2005) NCAR CCSM1.4 0.00
Timmermann & Collins (2004)
ECHAM4/OPYC3 -9.93