Embed Size (px)
Citation preview
Extreme Events and Climate Variability
Issues:
Scientists are telling us that global warming means more extreme weather.
Every year we seem to experience weather extremes.
What is the origin of extreme events?
1880 1900 1920 1940 1960 1980 2000 -1 .2
-0 .9
-0 .6
-0 .3
0 .0
0 .3
0 .6
0 .9
1 .2
-0 .4
-0 .1
0 .2
0 .5
0 .8
Ano
mal
y (°
C)
-0 .6
-0 .3
0 .0
0 .3
0 .6
0 .9
L a n d
O cea n
L a n d a n d O cea nA
nom
aly
(°C
)A
nom
aly
(°C
)
a
b
c
1880 1900 1920 1940 1960 1980 2000
1880 1900 1920 1940 1960 1980 2000
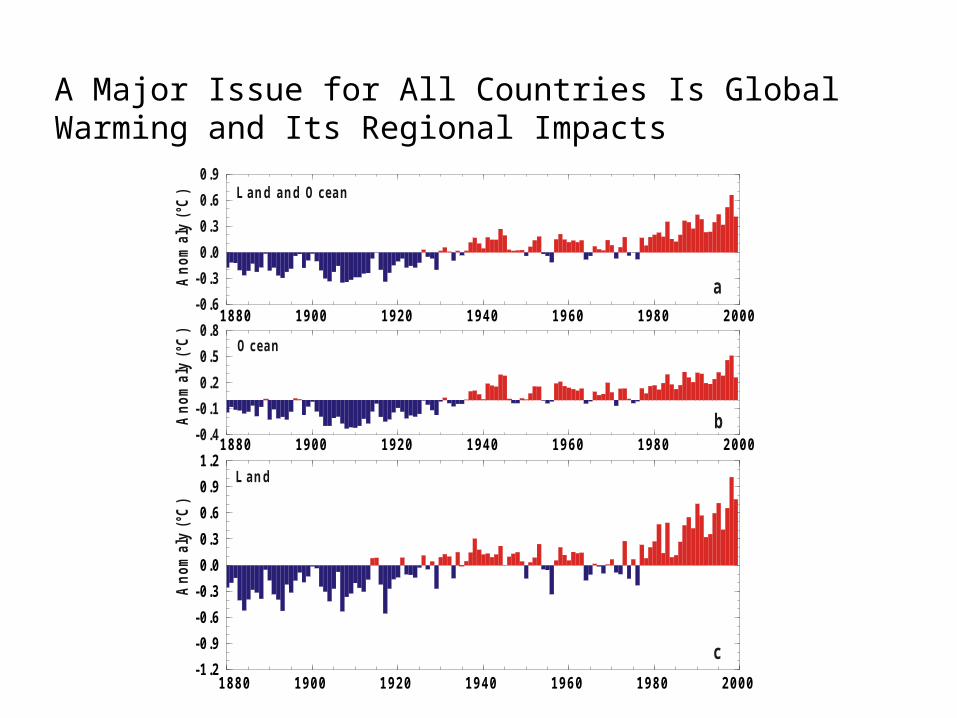
A Major Issue for All Countries Is Global Warming and Its Regional Impacts
Seasonal Climate Impacts Depend on theSimultaneous Influences of:
Natural Climate Variability El Nino/La Nina Pacific Decadal Oscillation (PDO) Arctic Oscillation (weak impact in Tropics)
Climate Change
Atmospheric Noise
Extreme Events are Mostly Related to Circulation Changes, i.e. to Variability
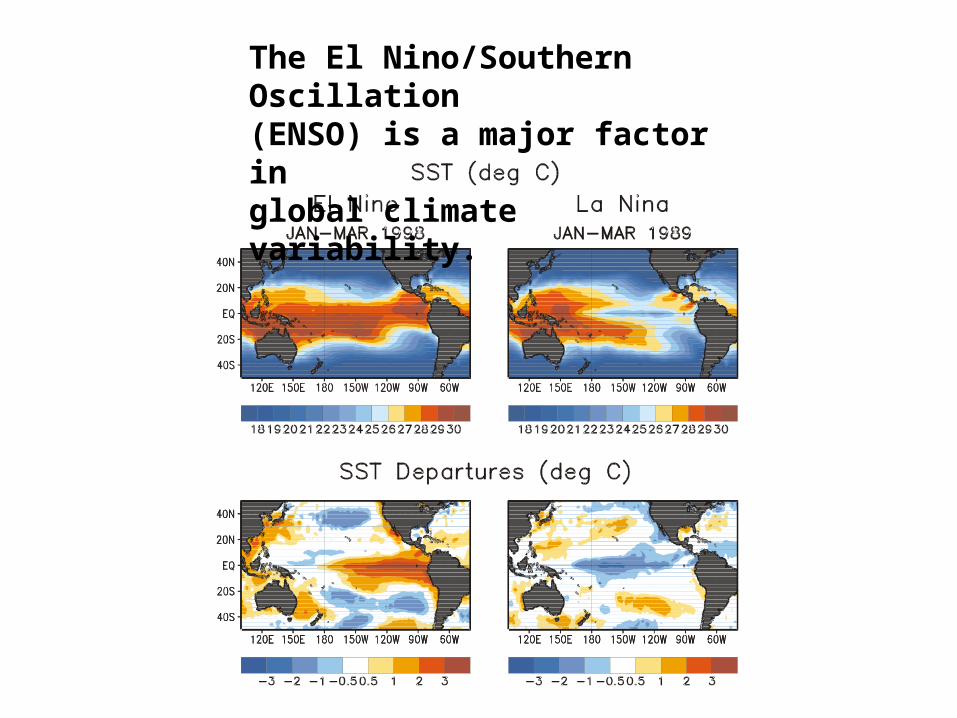
The El Nino/Southern Oscillation (ENSO) is a major factor in global climate variability.

R e fe re n c e : N a th a n M a n tu a U n iv e rs ity o f W a sh in g to n
The Pacific DecadalOscillation (PDO)
Typical wintertime Sea Surface Temperature (colors), Sea Level Pressure (contours) and surface windstress
(arrows) anomaly patterns during warm and cool phases of PDO


Departure from N ormal (mm)E l N ino (J uly 1997-J une 1998)~
Rainfall Changes A ssoc iated w ith EN SO are theL arges t Sourc e of Variability in the T ropic s
E N S O A ls o Impac ts H ur ric ane A c tivity
L a N ina (J uly 1998-J une 1999)~

Societal Impacts from 1997/98 El Nino
1. Crop/S toc k Damage 2. E nergy Savings 3. Famine 4. F ires 5. F isheries Dis ruption 6. Health R isks 7. Human Fata lit ies
8. P es ts Inc reased 9. P roper ty Damage10. Tourism Dec reased11. Transportation P roblems12. Soc ial Dis ruptions13. W ildlife Fata lit ies14. Water R ationing
Climate P redic tion Center
1
1 8
1011
136
4
14
610
11
14
3
4
7
11
12
1
5 1 144
1
11
1434
6
8
9
9 9
101213
5
1
14
69
9
11
789
91
4
78
91113
52


Major Weather-Related Natural Disasters (1999 La Nina)60 N
50 N
40 N
30 N
20 N
10 N
E Q
10 S
20 S30 S
40 S
50 S
60 S0 60 E 12 0E 18 0 12 0W 60 W 0
Climate P redic tion Center
SS
S
S S
S
S
F
F
FF
FF
F
F
FF
FF
FFF F
FF
F
F
F
F
F
F
F
FFF
HH
HH
D
D
S Storm s, Hail, TornadoesF Floods, LandslidesH Hurricanes, TyphoonsD Drought
Flood 55,360 $1.3BStorm s 16,863 $17.0BDroughts 404 - Cold Waves 409 $1.3B
VictimsInsured Losses

R egion al 1999 F lood s P ossib ly L ink ed to L a N ina
D a te E v e n t
A p ril 9 -1 6 M u d s lid e s & h e a v y ra in s C o lu m b ia : C a u c a , A rg e liaM a y 5 -1 5 H ig h w a te r in A m a z o n a s , P e ruA u g u s t 1 5 -2 2 F lo o d in g in e a s te rn Ve n e zu e laA u g 3 0 -S e p t 11 F lo o d in g in C o lu m b ia : A n tio q u ia , C o rd o b a , C h o c oS e p t 1 2 -2 9 P e rs is te n t ra in s , f lo o d s , m u d s lid e s in C o lu m b ia , H o n d u ra s , N ica ra g u a , G u a ta m a laD e c 1 2 -1 9 M ajo r f lo o d in g a n d m u d s lid e s in Ve n e z u e la (5 0 ,0 0 0 + v ic tim s )

Impacts of December 1999 Floods
in Venezuela
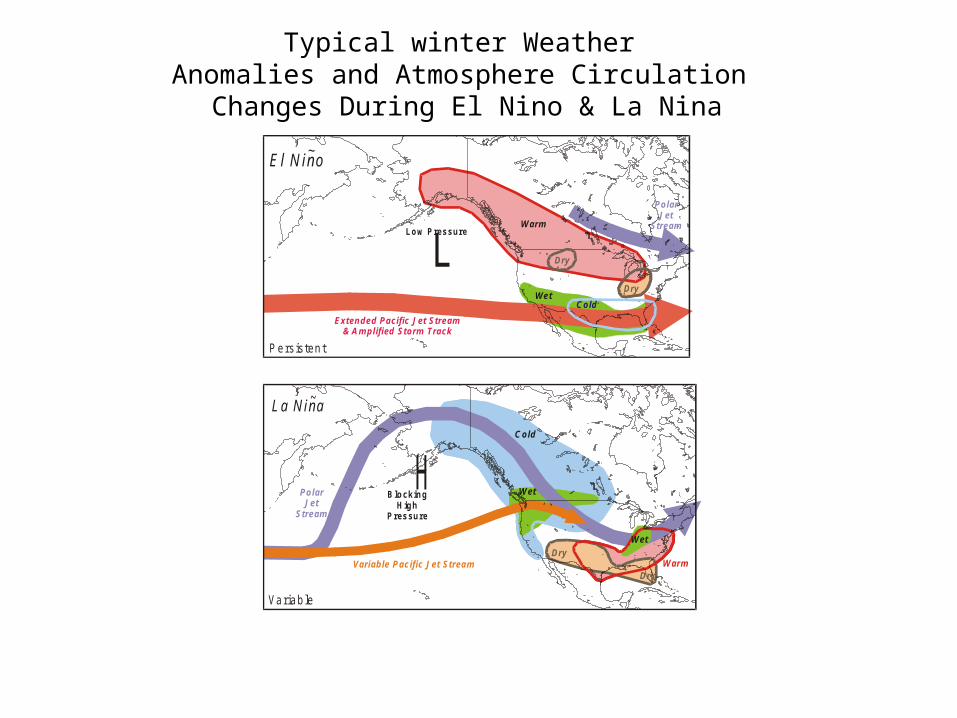
Typical winter Weather Anomalies and Atmosphere Circulation
Changes During El Nino & La Nina
Extended Pacific Jet Stream& Amplified Storm Track
LLow Pressure
PolarJet
StreamWarm
Cold
Dry
DryWet
Pers istent
E l N in o~
H
Variable Pacific Jet Stream
BlockingHigh
Pressure
PolarJet
Stream
Cold
Dry
Dry
Wet
Warm
Wet
Variab le
L a N in a~

Jet Stream Shifts Associated with Clim ate Variability Produce Regional Changes In Extrem e Weather Events
L ocation s F or M a jo r Sto rm s (D a ys P e r W in te r S ea s on )
E xten s iv e Sto rm sD ec 9 7-M a r 9 8
M a ss iveIce Sto rm
Ja n 98
Stro ng “N orthe aste r”
Sto rm sJa n-F eb 9 8
To rnad o O utb re akF eb 9 8
F re qu en t Sto rm sN ov 9 7-M a r 9 8
Examples of C limate Control Over Weather Patterns.The Basis of Linking Climate and Weather
LA N ina 1998-1999~Above AverageSto rm s, H u rricane
Force W indsN ov 98 - Feb 99
A ctive H urricaneSeason
A ug-N ov 98
TornadoesJan 1999
N o M ajo r “N ortheaste rs”
Be low N orm alSto rm iness
D ec 98 -Feb 99
M a jor Ice Sto rmJan 99
M a jorSnow Sto rm
Jan 99
Extensive IceSto rm
D ec 98D rought
Spring 1999
Dim inishedHurricane
Threat
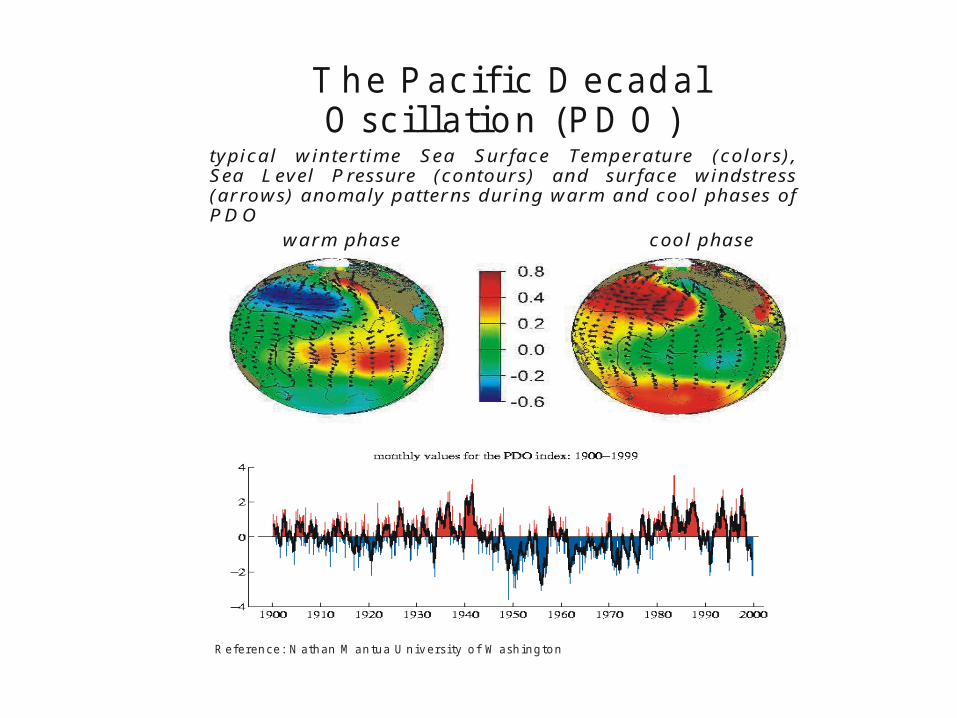
T h e P a c if ic D e c a d a l O sc illa tio n (P D O )
ty p ic a l w in te r tim e S e a S u r fa c e Tem p e ra tu re (c o lo rs ) ,S ea L ev e l P ressu re (co n to u rs) a n d su rfa ce w in d stress (a r ro w s) a n o m a ly p a tte rn s d u rin g w a rm a n d c o o l p h a ses o f P D O w a rm p h a se c o o l p h a se
R e fe re n c e : N a th a n M a n tu a U n iv e rs ity o f W a sh in g to n
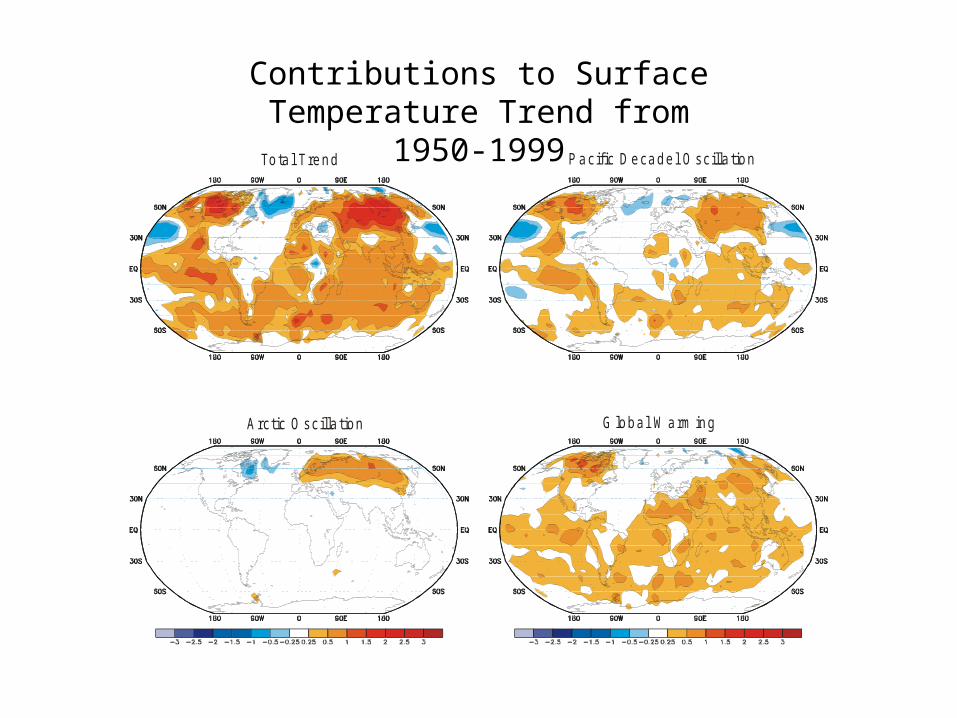
Contributions to Surface Temperature Trend from 1950-1999
Tota l Trend Pacific Decadel O scilla tion
Arctic O scilla tion G lobal Warm ing

SUMMARY
Extremes result from:
- major climate anomalies (e.g. especially El Nino
and La Nina in Tropics)
- unusual atmospheric circulation patterns
(mostly related to climate variability)
- factors acting together for air temperature
(e.g. ENSO, PDO, AO, global warming)
The impacts of the warming trend on circulation
changes, i.e. also extremes, is still a research issue