Embed Size (px)
Citation preview
1
The global Oil & Gas market trends Oil Supply scenarios, Demand-Supply balances, Stock changes and Price
Gas market in general with focus on the LNG market
Challenges and opportunities for Egypt
2
0
20
40
60
80
100
120
Inflated oil price (2015) (USD/bbl) Money of the day (USD / bbl) Linear (Inflated oil price (2015) (USD/bbl))
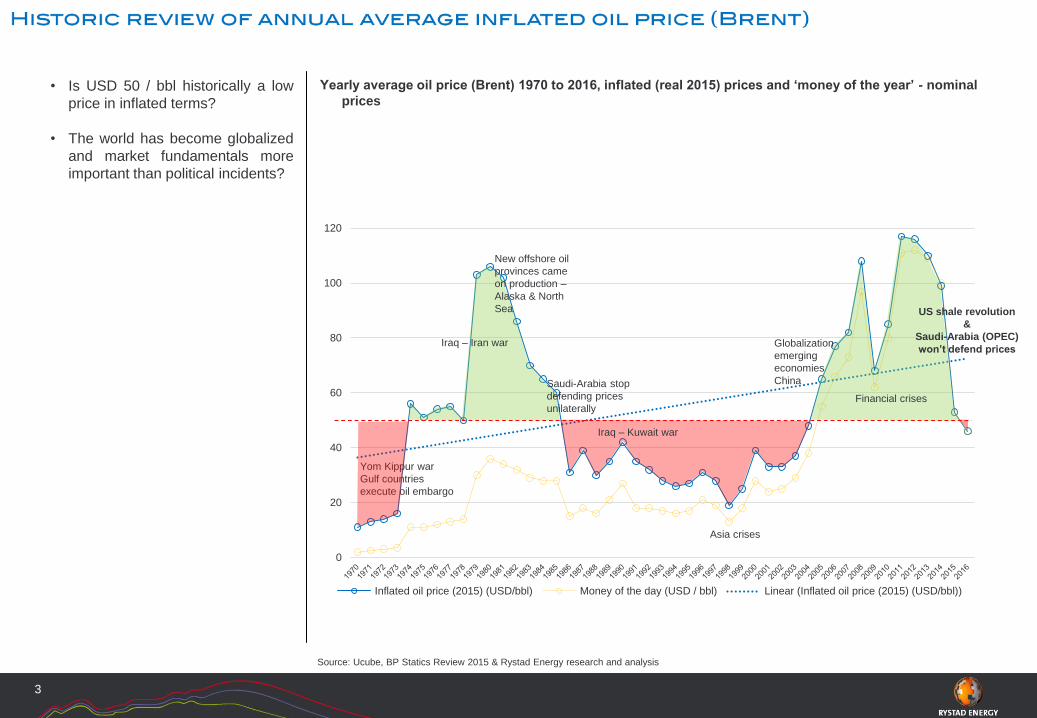
Source: Ucube, BP Statics Review 2015 & Rystad Energy research and analysis
Yearly average oil price (Brent) 1970 to 2016, inflated (real 2015) prices and ‘money of the year’ - nominal
prices
3
Yom Kippur war
Gulf countries
execute oil embargo
Iraq – Iran war
Iraq – Kuwait war
Asia crises
US shale revolution
&
Saudi-Arabia (OPEC)
won’t defend prices
New offshore oil
provinces came
on production –
Alaska & North
Sea
Saudi-Arabia stop
defending prices
unilaterallyFinancial crises
Globalization
emerging
economies
China
• Is USD 50 / bbl historically a low
price in inflated terms?
• The world has become globalized
and market fundamentals more
important than political incidents?
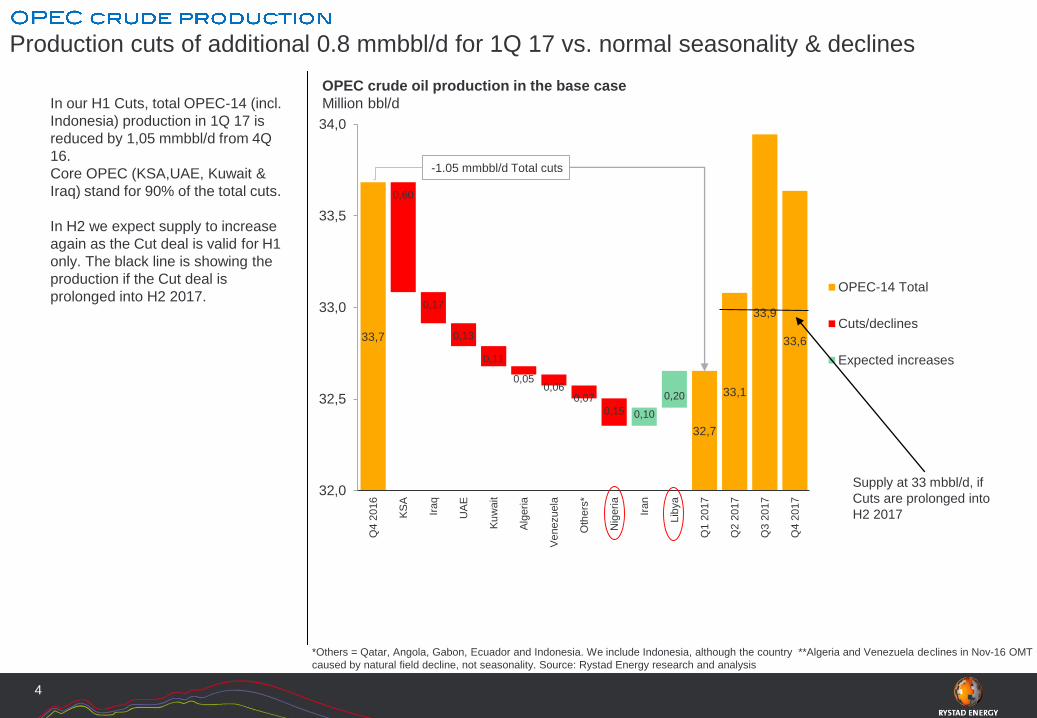
In our H1 Cuts, total OPEC-14 (incl.
Indonesia) production in 1Q 17 is
reduced by 1,05 mmbbl/d from 4Q
16.
Core OPEC (KSA,UAE, Kuwait &
Iraq) stand for 90% of the total cuts.
In H2 we expect supply to increase
again as the Cut deal is valid for H1
only. The black line is showing the
production if the Cut deal is
prolonged into H2 2017.
Production cuts of additional 0.8 mmbbl/d for 1Q 17 vs. normal seasonality & declines
*Others = Qatar, Angola, Gabon, Ecuador and Indonesia. We include Indonesia, although the country **Algeria and Venezuela declines in Nov-16 OMT
caused by natural field decline, not seasonality. Source: Rystad Energy research and analysis
4
OPEC crude oil production in the base case
Million bbl/d
33,7
32,7
33,1
33,9
33,6
0,60
0,17
0,13
0,11
0,050,06
0,07
0,15 0,10
0,20
32,0
32,5
33,0
33,5
34,0
Q4 2
016
KS
A
Iraq
UA
E
Ku
wait
Alg
eria
Ve
nezuela
Oth
ers
*
Nig
eria
Iran
Lib
ya
Q1 2
017
Q2 2
017
Q3 2
017
Q4 2
017
OPEC-14 Total
Cuts/declines
Expected increases
-1.05 mmbbl/d Total cuts
Supply at 33 mbbl/d, if
Cuts are prolonged into
H2 2017
H1 2017
0,0
0,2
0,4
0,6
0,8
1,0
1,2
1,4
1,6
1,8
2,0
Ja
n-1
6
Fe
b-1
6
Ma
r-1
6
Ap
r-1
6
Ma
y-1
6
Ju
n-1
6
Jul-16
Au
g-1
6
Se
p-1
6
Oct-
16
No
v-1
6
De
c-1
6
Ja
n-1
7
Fe
b-1
7
Ma
r-1
7
Apr-
17
Ma
y-1
7
Ju
n-1
7
Ju
l-1
7
Au
g-1
7
Se
p-1
7
Oct-
17
No
v-1
7
De
c-1
7
Nigeria
Nigeria Ave 2016/2017levelLibya
Libya Ave 2016/2017levelLibya upside risk
ForecastHistorical
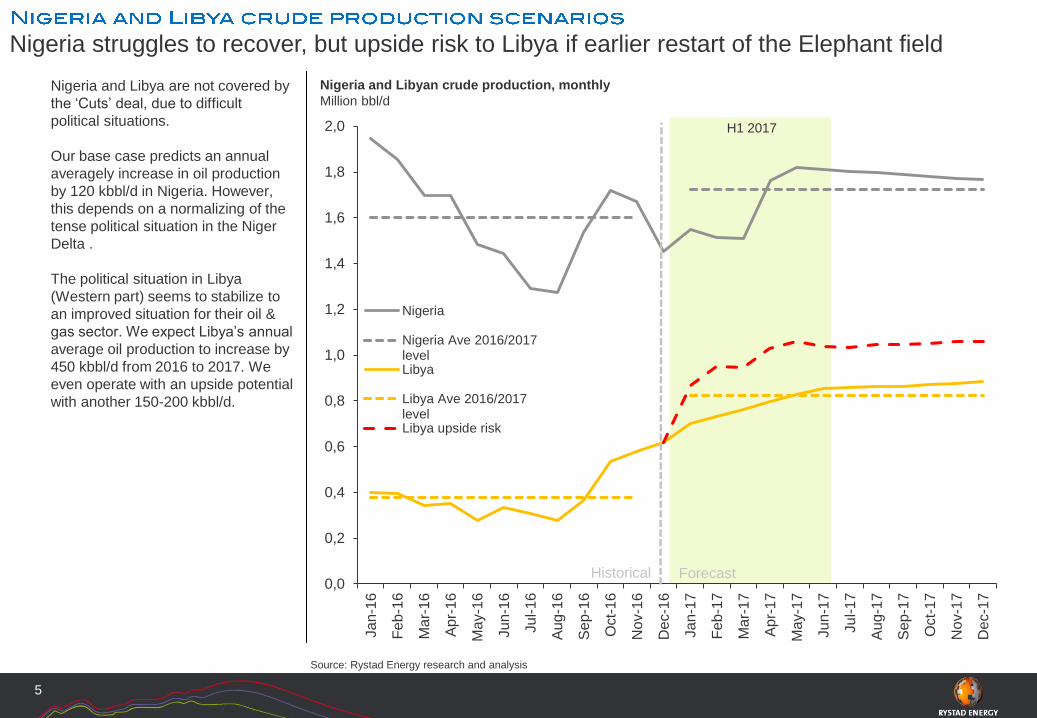
Nigeria and Libya are not covered by
the ‘Cuts’ deal, due to difficult
political situations.
Our base case predicts an annual
averagely increase in oil production
by 120 kbbl/d in Nigeria. However,
this depends on a normalizing of the
tense political situation in the Niger
Delta .
The political situation in Libya
(Western part) seems to stabilize to
an improved situation for their oil &
gas sector. We expect Libya’s annual
average oil production to increase by
450 kbbl/d from 2016 to 2017. We
even operate with an upside potential
with another 150-200 kbbl/d.
Nigeria struggles to recover, but upside risk to Libya if earlier restart of the Elephant field
Source: Rystad Energy research and analysis
Nigeria and Libyan crude production, monthly
Million bbl/d
5
18,22
17,89
17,81 17,8017,84
0,18
0,08
0,06
0,020,02
0,020,01
0,04
0,02 0,01 0,00
17,6
17,7
17,8
17,9
18,0
18,1
18,2
18,3
Tota
l N
on-O
PE
C *
Ru
ssia
Me
xic
o
Kazakhsta
n
Om
an
Aze
rbaija
n
Ma
laysia
Equa
toria
l G
uin
ea
South
Suda
n
Bru
nei
Suda
n
Bahra
in
1Q
2017
2Q
2017
3Q
2017
4Q
2017
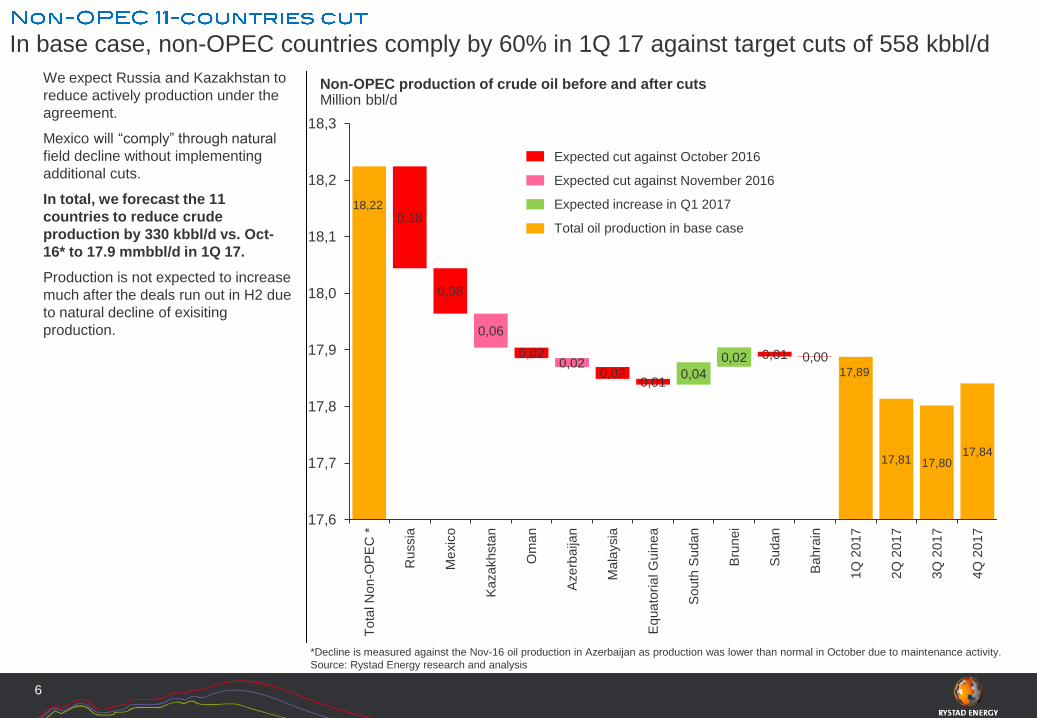
In base case, non-OPEC countries comply by 60% in 1Q 17 against target cuts of 558 kbbl/d
*Decline is measured against the Nov-16 oil production in Azerbaijan as production was lower than normal in October due to maintenance activity.
Source: Rystad Energy research and analysis
Non-OPEC production of crude oil before and after cutsMillion bbl/d
6
Expected cut against October 2016
Expected cut against November 2016
Expected increase in Q1 2017
Total oil production in base case
We expect Russia and Kazakhstan to
reduce actively production under the
agreement.
Mexico will “comply” through natural
field decline without implementing
additional cuts.
In total, we forecast the 11
countries to reduce crude
production by 330 kbbl/d vs. Oct-
16* to 17.9 mmbbl/d in 1Q 17.
Production is not expected to increase
much after the deals run out in H2 due
to natural decline of exisiting
production.
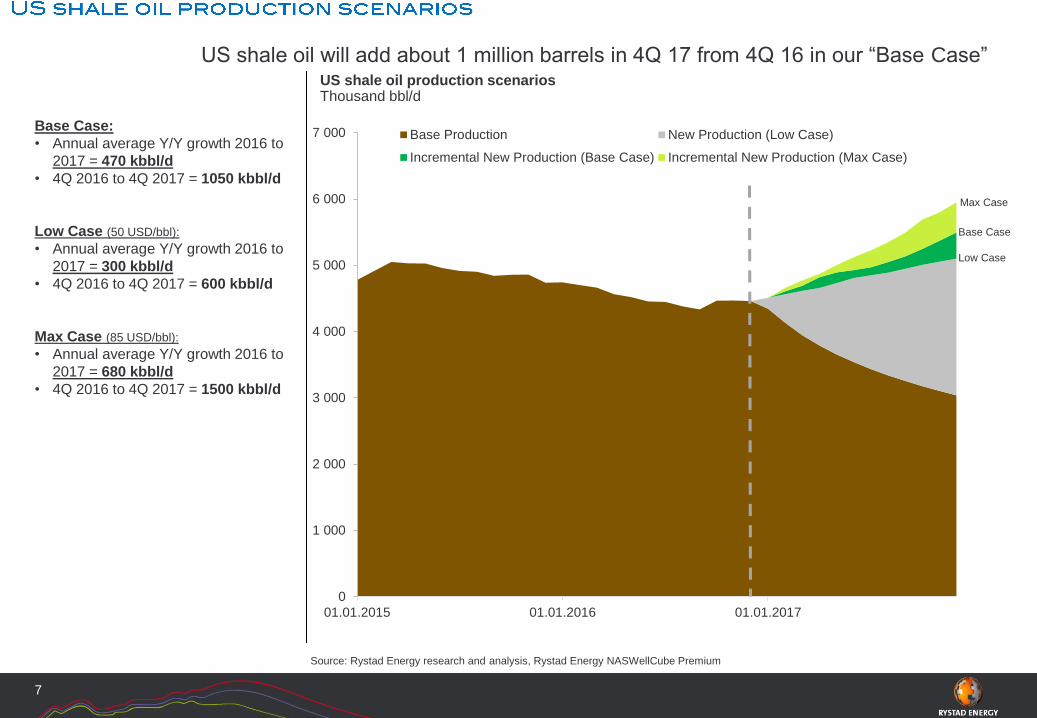
Base Case:
• Annual average Y/Y growth 2016 to
2017 = 470 kbbl/d
• 4Q 2016 to 4Q 2017 = 1050 kbbl/d
Low Case (50 USD/bbl):
• Annual average Y/Y growth 2016 to
2017 = 300 kbbl/d
• 4Q 2016 to 4Q 2017 = 600 kbbl/d
Max Case (85 USD/bbl):
• Annual average Y/Y growth 2016 to
2017 = 680 kbbl/d
• 4Q 2016 to 4Q 2017 = 1500 kbbl/d
US shale oil will add about 1 million barrels in 4Q 17 from 4Q 16 in our “Base Case”
Source: Rystad Energy research and analysis, Rystad Energy NASWellCube Premium
US shale oil production scenariosThousand bbl/d
7
0
1 000
2 000
3 000
4 000
5 000
6 000
7 000
01.01.2015 01.01.2016 01.01.2017
Base Production New Production (Low Case)
Incremental New Production (Base Case) Incremental New Production (Max Case)
Base Case
Low Case
Max Case
0,5
1,2
1,5
1,2
2,1
1,61,4
1,1 1,21,3 1,4
-1,5
-1,0
-0,5
0,0
0,5
1,0
1,5
2,0
2,5
3,0
2011 2012 2013 2014 2015 2016 2017 2018 2019 2020 2021
Other Non-OECD
Other Middle East
Brazil
Russia
Saudi Arabia
India
China
OECD Europe
OECD Americas
OECD Asia and Oceania
Total World
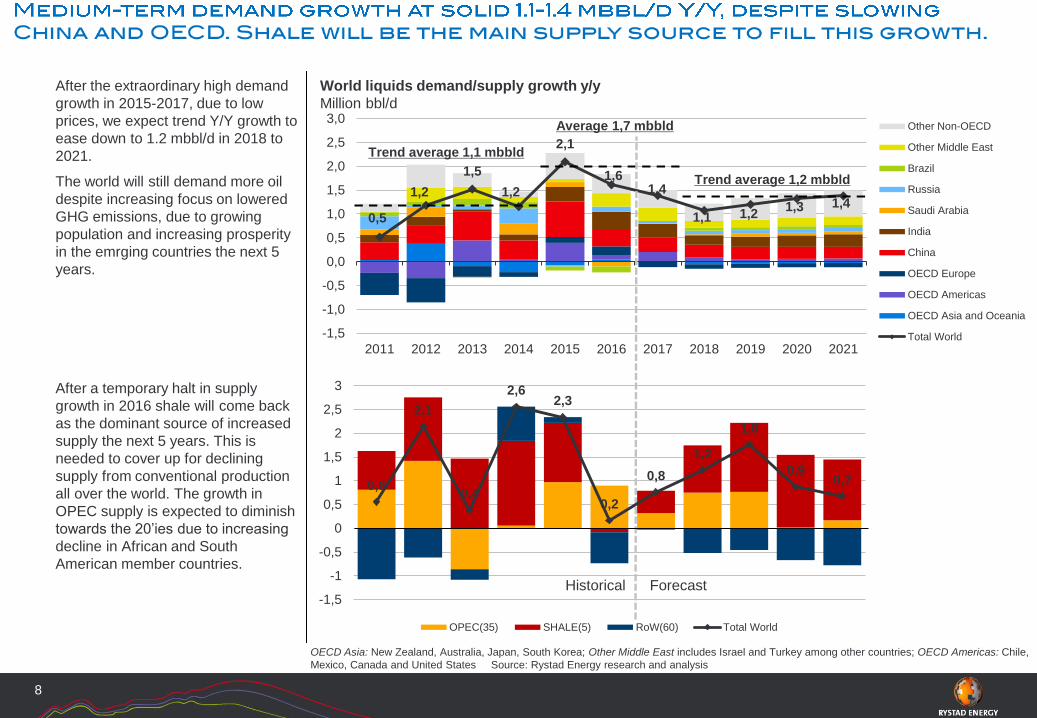
Trend average 1,2 mbbld
ForecastHistorical
After the extraordinary high demand
growth in 2015-2017, due to low
prices, we expect trend Y/Y growth to
ease down to 1.2 mbbl/d in 2018 to
2021.
The world will still demand more oil
despite increasing focus on lowered
GHG emissions, due to growing
population and increasing prosperity
in the emrging countries the next 5
years.
OECD Asia: New Zealand, Australia, Japan, South Korea; Other Middle East includes Israel and Turkey among other countries; OECD Americas: Chile,
Mexico, Canada and United States Source: Rystad Energy research and analysis
World liquids demand/supply growth y/y
Million bbl/d
8
Trend average 1,1 mbbld
Average 1,7 mbbld
0,6
2,1
0,4
2,62,3
0,2
0,8
1,2
1,8
0,90,7
-1,5
-1
-0,5
0
0,5
1
1,5
2
2,5
3
OPEC(35) SHALE(5) RoW(60) Total World
After a temporary halt in supply
growth in 2016 shale will come back
as the dominant source of increased
supply the next 5 years. This is
needed to cover up for declining
supply from conventional production
all over the world. The growth in
OPEC supply is expected to diminish
towards the 20’ies due to increasing
decline in African and South
American member countries.
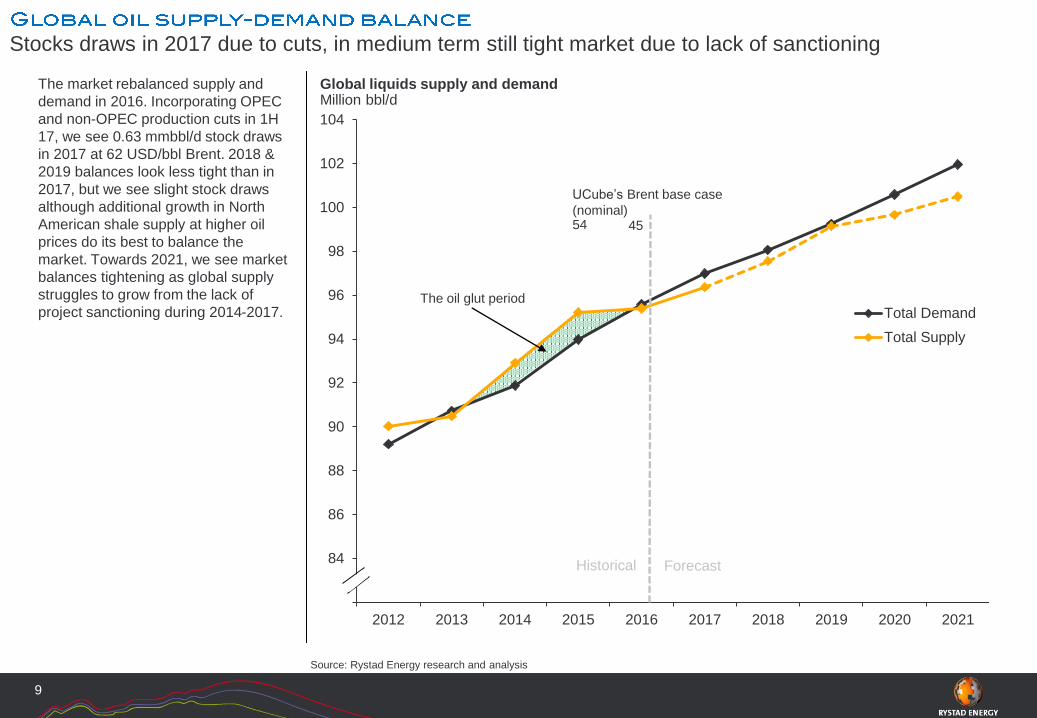
The market rebalanced supply and
demand in 2016. Incorporating OPEC
and non-OPEC production cuts in 1H
17, we see 0.63 mmbbl/d stock draws
in 2017 at 62 USD/bbl Brent. 2018 &
2019 balances look less tight than in
2017, but we see slight stock draws
although additional growth in North
American shale supply at higher oil
prices do its best to balance the
market. Towards 2021, we see market
balances tightening as global supply
struggles to grow from the lack of
project sanctioning during 2014-2017.
Stocks draws in 2017 due to cuts, in medium term still tight market due to lack of sanctioning
Source: Rystad Energy research and analysis
Global liquids supply and demandMillion bbl/d
9
82
84
86
88
90
92
94
96
98
100
102
104
2012 2013 2014 2015 2016 2017 2018 2019 2020 2021
Total Demand
Total Supply
ForecastHistorical
4554
UCube’s Brent base case
(nominal)
The oil glut period
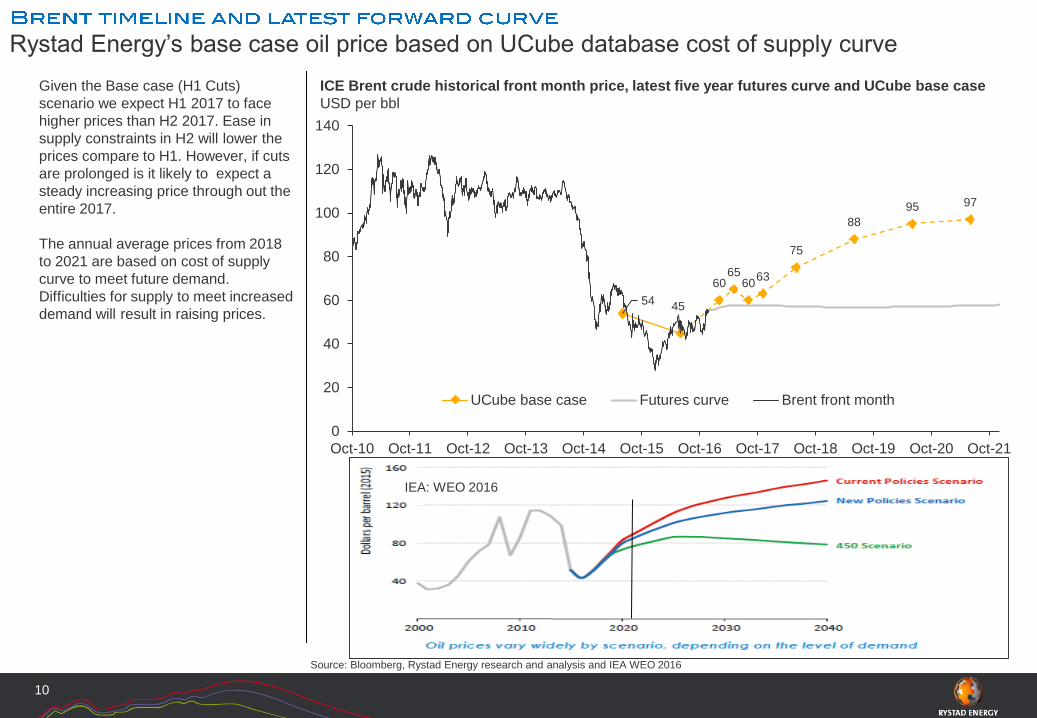
Given the Base case (H1 Cuts)
scenario we expect H1 2017 to face
higher prices than H2 2017. Ease in
supply constraints in H2 will lower the
prices compare to H1. However, if cuts
are prolonged is it likely to expect a
steady increasing price through out the
entire 2017.
The annual average prices from 2018
to 2021 are based on cost of supply
curve to meet future demand.
Difficulties for supply to meet increased
demand will result in raising prices.
Rystad Energy’s base case oil price based on UCube database cost of supply curve
Source: Bloomberg, Rystad Energy research and analysis and IEA WEO 2016
ICE Brent crude historical front month price, latest five year futures curve and UCube base case
USD per bbl
10
5445
6065
6063
75
88
95 97
0
20
40
60
80
100
120
140
Oct-10 Oct-11 Oct-12 Oct-13 Oct-14 Oct-15 Oct-16 Oct-17 Oct-18 Oct-19 Oct-20 Oct-21
UCube base case Futures curve Brent front month
IEA: WEO 2016
11
The global Oil & Gas market trends Oil Supply scenarios, Demand-Supply balances, Stock changes and Price
Gas market in general with focus on the LNG market
Challenges and opportunities for Egypt
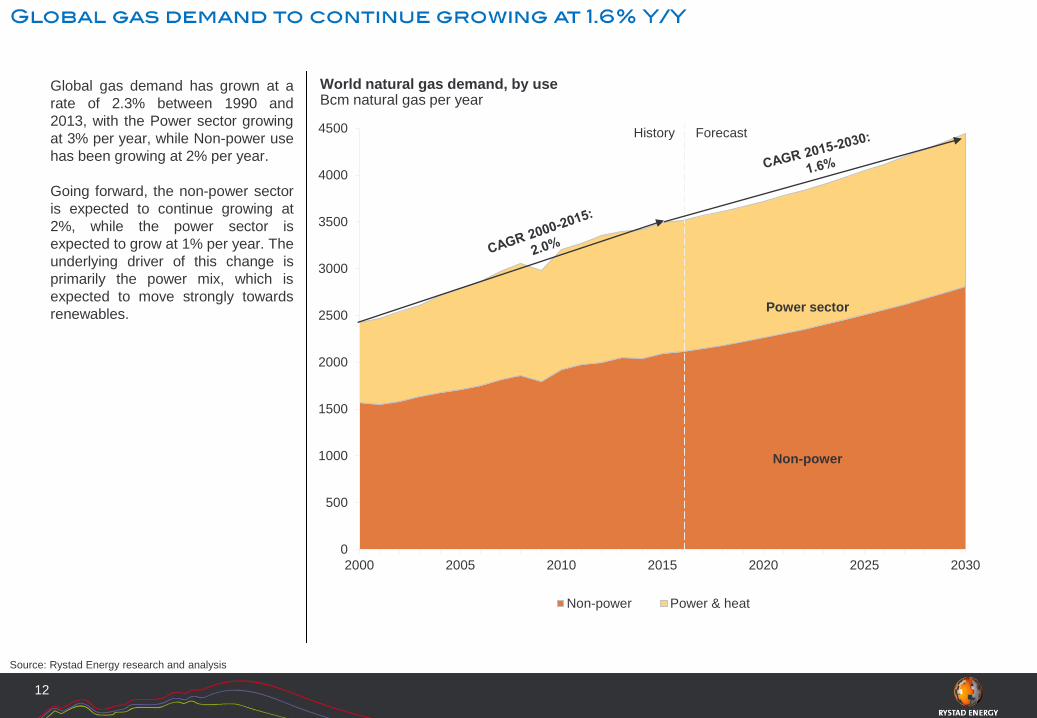
Global gas demand has grown at a
rate of 2.3% between 1990 and
2013, with the Power sector growing
at 3% per year, while Non-power use
has been growing at 2% per year.
Going forward, the non-power sector
is expected to continue growing at
2%, while the power sector is
expected to grow at 1% per year. The
underlying driver of this change is
primarily the power mix, which is
expected to move strongly towards
renewables.
Source: Rystad Energy research and analysis
World natural gas demand, by useBcm natural gas per year
0
500
1000
1500
2000
2500
3000
3500
4000
4500
2000 2005 2010 2015 2020 2025 2030
Non-power Power & heat
Non-power
Power sector
ForecastHistory
12
-400
200
800
1400
Net Export Net import
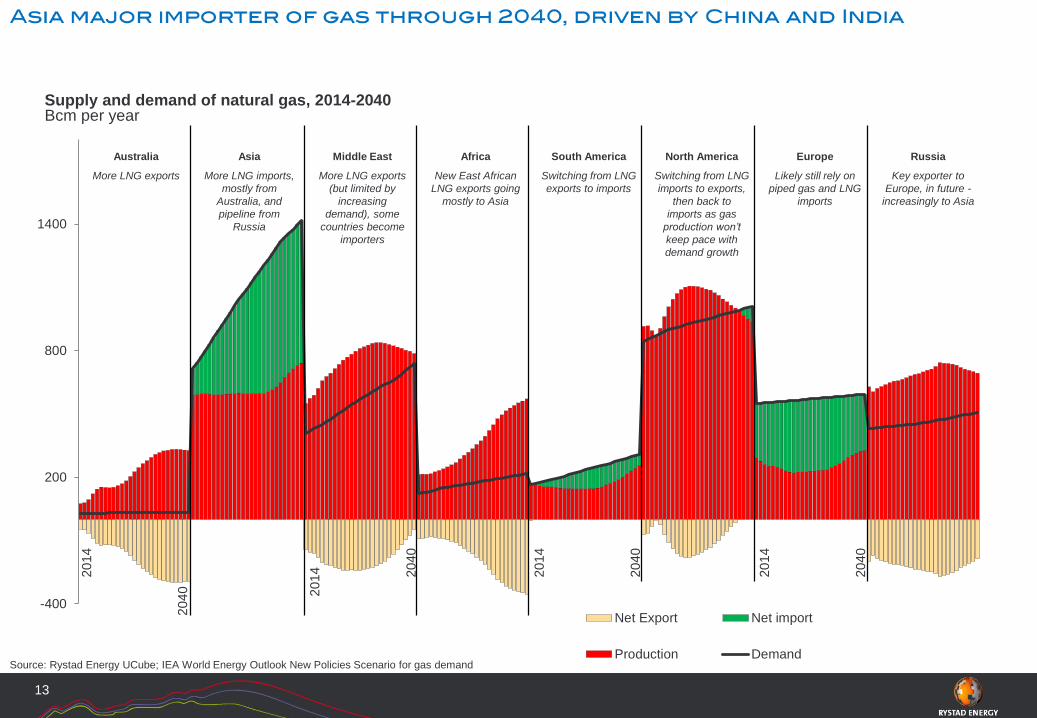
Production DemandSource: Rystad Energy UCube; IEA World Energy Outlook New Policies Scenario for gas demand
13
Supply and demand of natural gas, 2014-2040Bcm per year
Australia Asia Middle East Africa South America North America Europe Russia
More LNG exports More LNG imports,
mostly from
Australia, and
pipeline from
Russia
More LNG exports
(but limited by
increasing
demand), some
countries become
importers
New East African
LNG exports going
mostly to Asia
Switching from LNG
imports to exports,
then back to
imports as gas
production won’t
keep pace with
demand growth
Switching from LNG
exports to imports
Likely still rely on
piped gas and LNG
imports
Key exporter to
Europe, in future -
increasingly to Asia
2014
2040
2014
2040
2014 2040
2014
2040
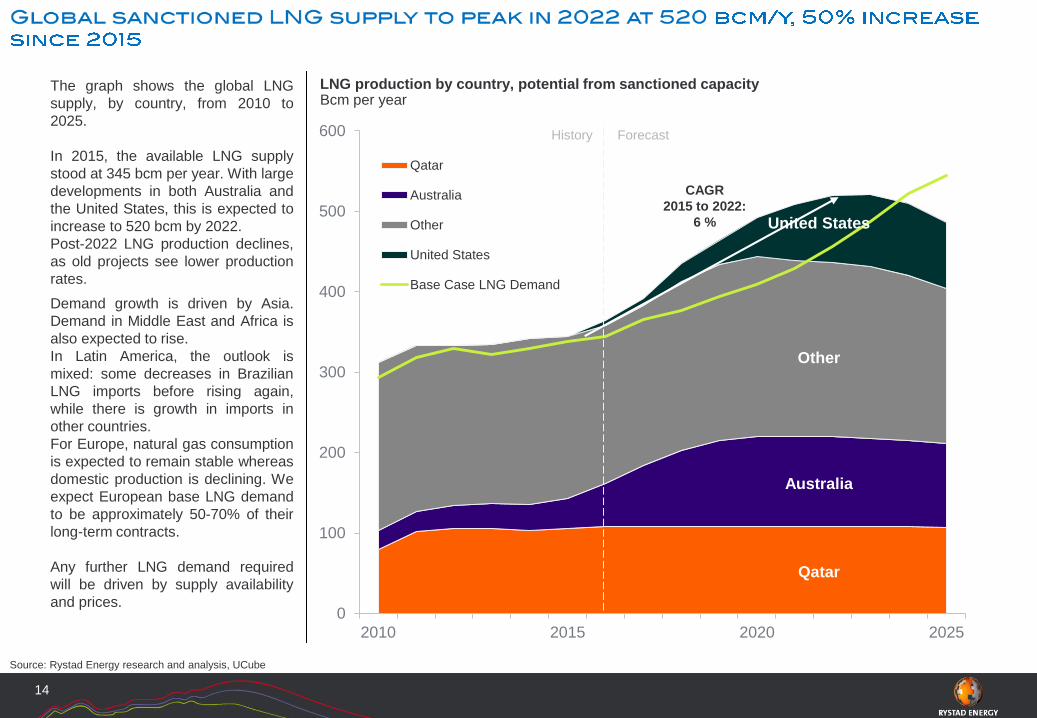
The graph shows the global LNG
supply, by country, from 2010 to
2025.
In 2015, the available LNG supply
stood at 345 bcm per year. With large
developments in both Australia and
the United States, this is expected to
increase to 520 bcm by 2022.
Post-2022 LNG production declines,
as old projects see lower production
rates.
Source: Rystad Energy research and analysis, UCube
LNG production by country, potential from sanctioned capacityBcm per year
14
0
100
200
300
400
500
600
2010 2015 2020 2025
Qatar
Australia
Other
United States
Base Case LNG Demand
United States
Other
Australia
Qatar
Demand growth is driven by Asia.
Demand in Middle East and Africa is
also expected to rise.
In Latin America, the outlook is
mixed: some decreases in Brazilian
LNG imports before rising again,
while there is growth in imports in
other countries.
For Europe, natural gas consumption
is expected to remain stable whereas
domestic production is declining. We
expect European base LNG demand
to be approximately 50-70% of their
long-term contracts.
Any further LNG demand required
will be driven by supply availability
and prices.
ForecastHistory
CAGR
2015 to 2022:
6 %
4,6
5,4
5,96,3 6,4 6,4 6,5
6,9
7,3
0
1
2
3
4
5
6
7
8
9
10
11
12
13
0 5 10 15 20 25 30 35 40 45 50 55 60 65 70 75 80 85 90 95 100
USD
/Mm
Btu
Bcm
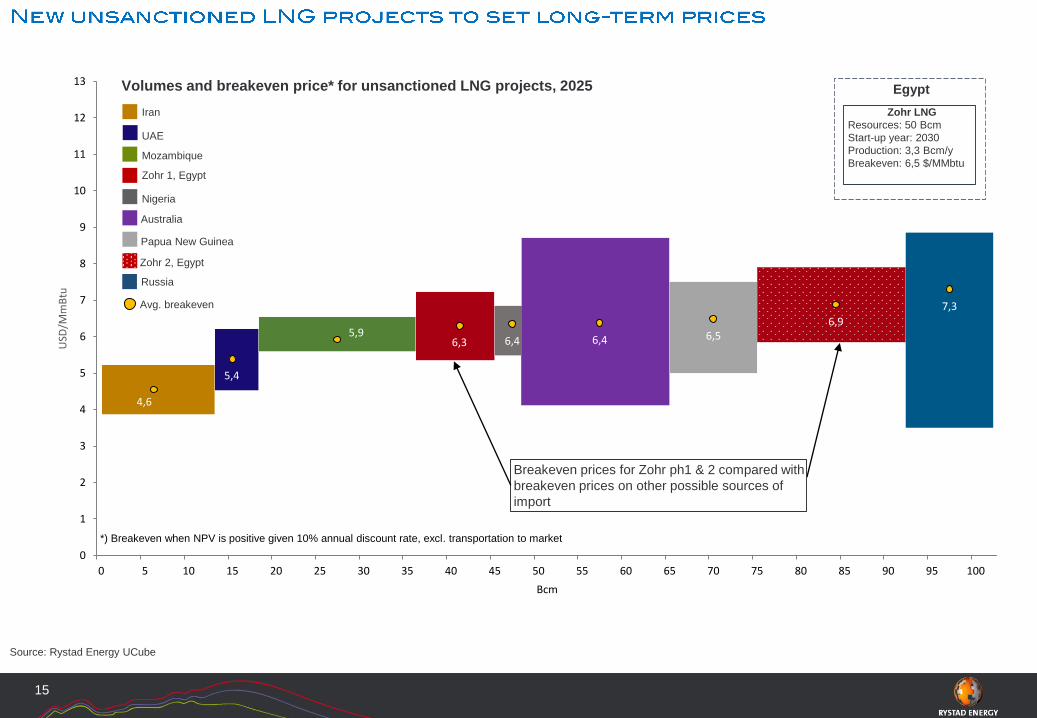
*) Breakeven when NPV is positive given 10% annual discount rate, excl. transportation to market
Egypt
Zohr LNG
Resources: 50 Bcm
Start-up year: 2030
Production: 3,3 Bcm/y
Breakeven: 6,5 $/MMbtu
Source: Rystad Energy UCube
15
Volumes and breakeven price* for unsanctioned LNG projects, 2025
Iran
UAE
Mozambique
Zohr 1, Egypt
Nigeria
Australia
Avg. breakeven
Papua New Guinea
Zohr 2, Egypt
Russia
Breakeven prices for Zohr ph1 & 2 compared with
breakeven prices on other possible sources of
import
6,4
9,3
10,5
4,7
5,9
8,1
0
20
40
60
80
100
0
2
4
6
8
10
12
14
16
18
2010
201
1
2012
2013
2014
2015
2016
2017
201
8
2019
2020
2021
2022
2023
2024
202
5
USD
/bb
l
USD
/MM
Btu
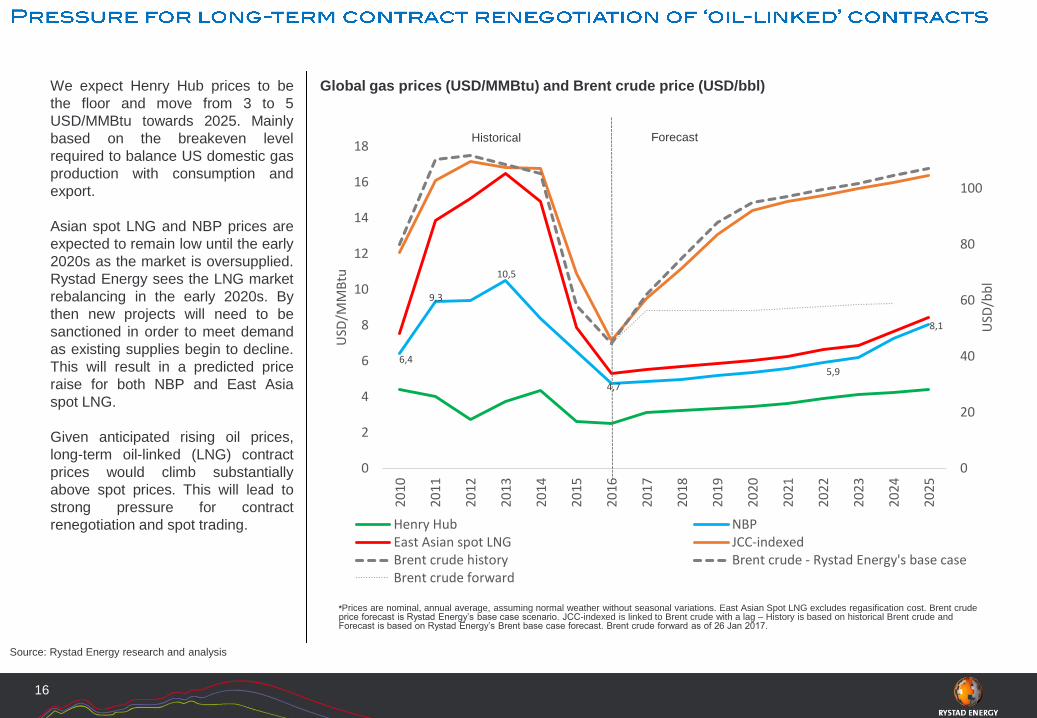
Henry Hub NBPEast Asian spot LNG JCC-indexedBrent crude history Brent crude - Rystad Energy's base caseBrent crude forward
We expect Henry Hub prices to be
the floor and move from 3 to 5
USD/MMBtu towards 2025. Mainly
based on the breakeven level
required to balance US domestic gas
production with consumption and
export.
Asian spot LNG and NBP prices are
expected to remain low until the early
2020s as the market is oversupplied.
Rystad Energy sees the LNG market
rebalancing in the early 2020s. By
then new projects will need to be
sanctioned in order to meet demand
as existing supplies begin to decline.
This will result in a predicted price
raise for both NBP and East Asia
spot LNG.
Given anticipated rising oil prices,
long-term oil-linked (LNG) contract
prices would climb substantially
above spot prices. This will lead to
strong pressure for contract
renegotiation and spot trading.
Source: Rystad Energy research and analysis
Global gas prices (USD/MMBtu) and Brent crude price (USD/bbl)
16
ForecastHistorical
*Prices are nominal, annual average, assuming normal weather without seasonal variations. East Asian Spot LNG excludes regasification cost. Brent crude price forecast is Rystad Energy’s base case scenario. JCC-indexed is linked to Brent crude with a lag – History is based on historical Brent crude and Forecast is based on Rystad Energy’s Brent base case forecast. Brent crude forward as of 26 Jan 2017.
17
The global Oil & Gas market trends Oil Supply scenarios, Demand-Supply balances, Stock changes and Price
Gas market in general with focus on the LNG market
Challenges and opportunities for Egypt
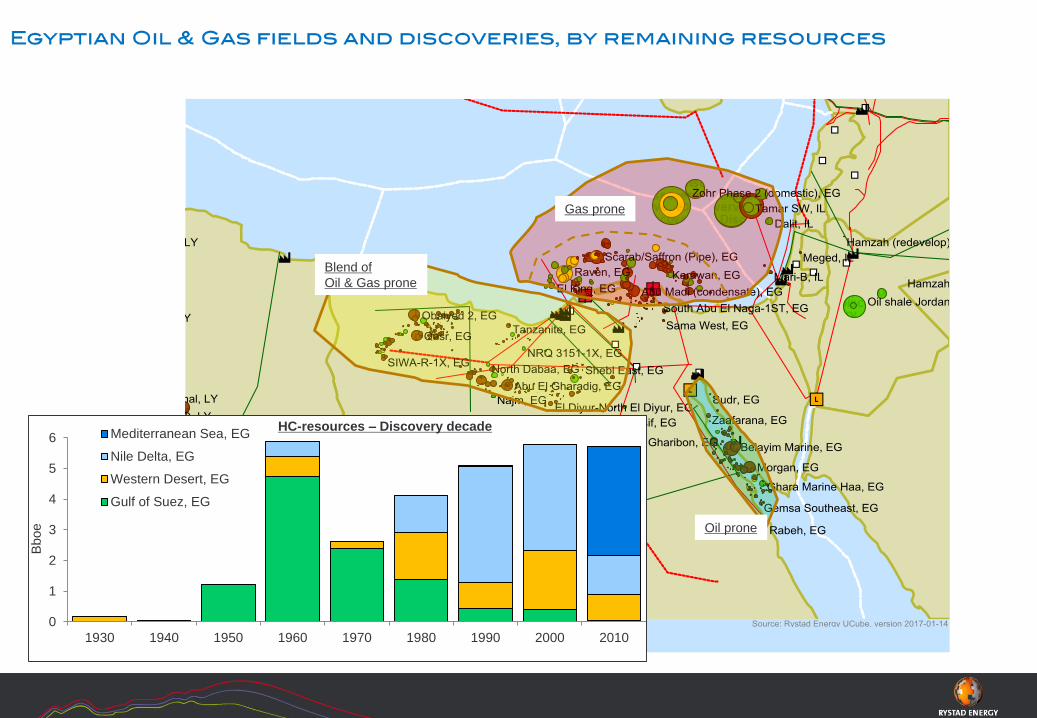
Oil prone
Gas prone
Blend of
Oil & Gas prone
0
1
2
3
4
5
6
1930 1940 1950 1960 1970 1980 1990 2000 2010
Mediterranean Sea, EG
Nile Delta, EG
Western Desert, EG
Gulf of Suez, EG
Bboe
HC-resources – Discovery decade
- 60 - 40 - 20 0 20 40 60 80
Produced
Liquids
Gas
Source: Rystad Energy research and analysis and UCube
19
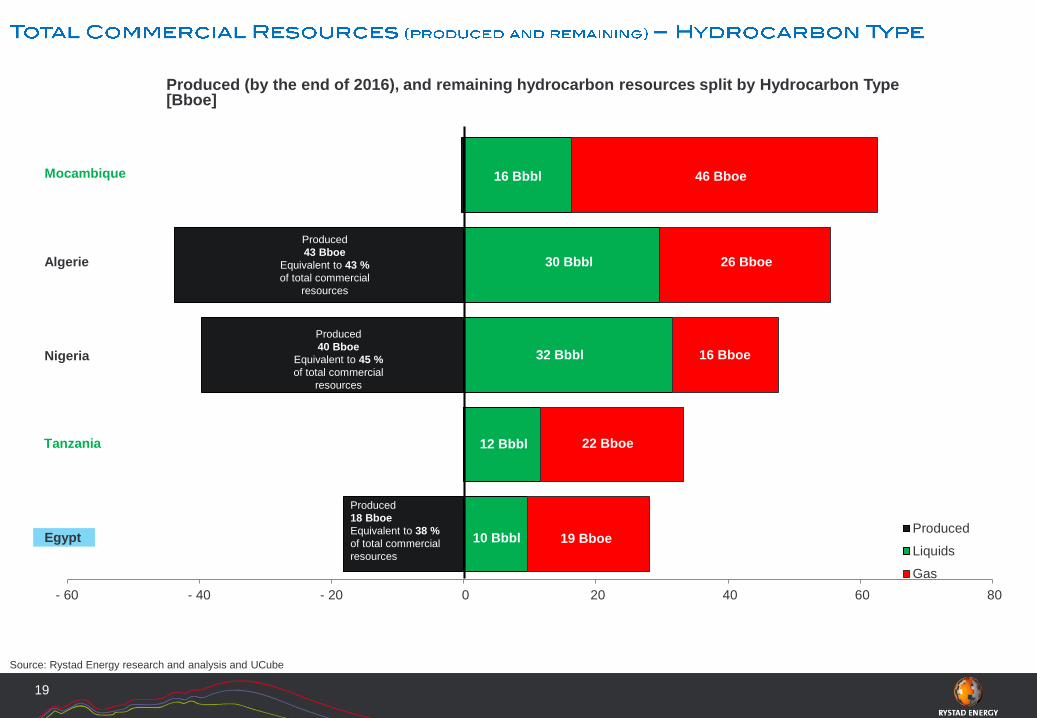
Produced (by the end of 2016), and remaining hydrocarbon resources split by Hydrocarbon Type[Bboe]
30 Bbbl 26 Bboe
12 Bbbl 22 Bboe
Produced
40 Bboe
Equivalent to 45 %
of total commercial
resources
Produced
18 Bboe
Equivalent to 38 %
of total commercial
resources
Produced
43 Bboe
Equivalent to 43 %
of total commercial
resources
16 Bbbl 46 BboeMocambique
Algerie
Nigeria
Egypt
Tanzania
10 Bbbl 19 Bboe
32 Bbbl 16 Bboe
Source: Rystad Energy research and analysis and UCube
20
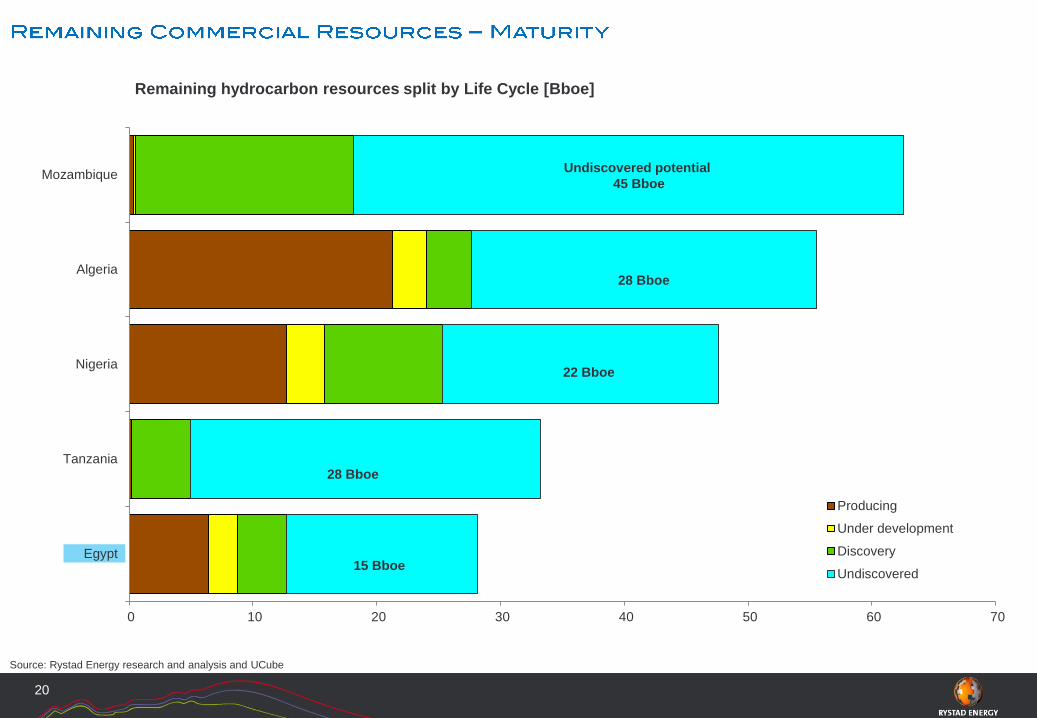
Remaining hydrocarbon resources split by Life Cycle [Bboe]
0 10 20 30 40 50 60 70
Mozambique
Algeria
Nigeria
Tanzania
Egypt
Producing
Under development
Discovery
Undiscovered
28 Bboe
15 Bboe
Undiscovered potential
45 Bboe
28 Bboe
22 Bboe
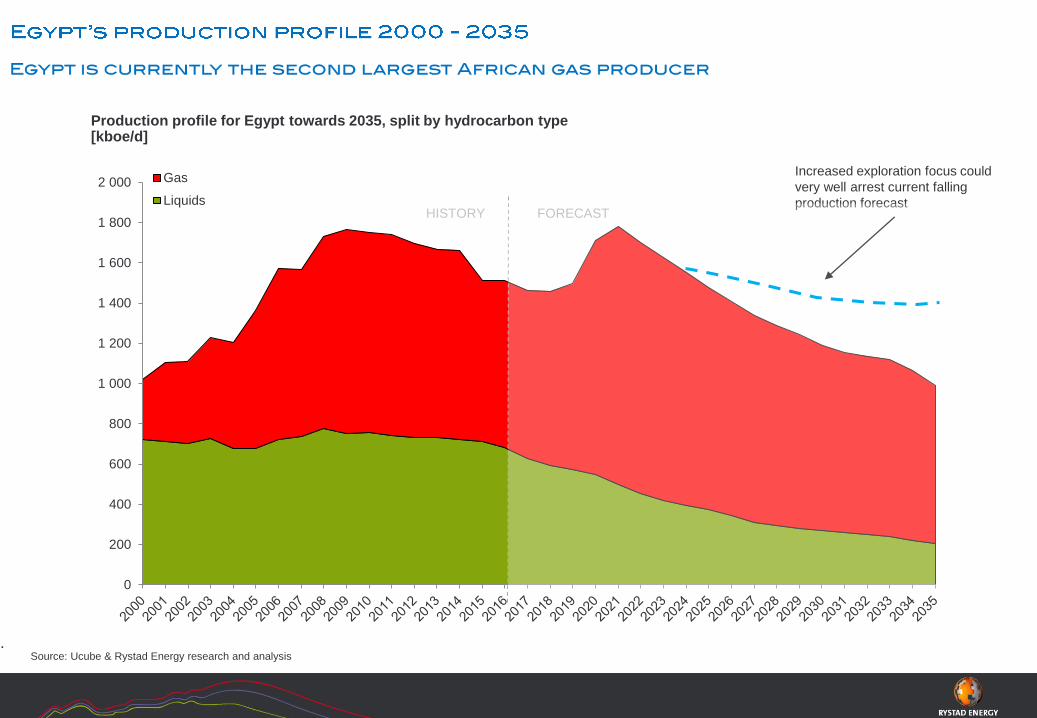
0
200
400
600
800
1 000
1 200
1 400
1 600
1 800
2 000 Gas
Liquids
Source: Ucube & Rystad Energy research and analysis.
Production profile for Egypt towards 2035, split by hydrocarbon type[kboe/d]
Increased exploration focus could
very well arrest current falling
production forecastHISTORY FORECAST
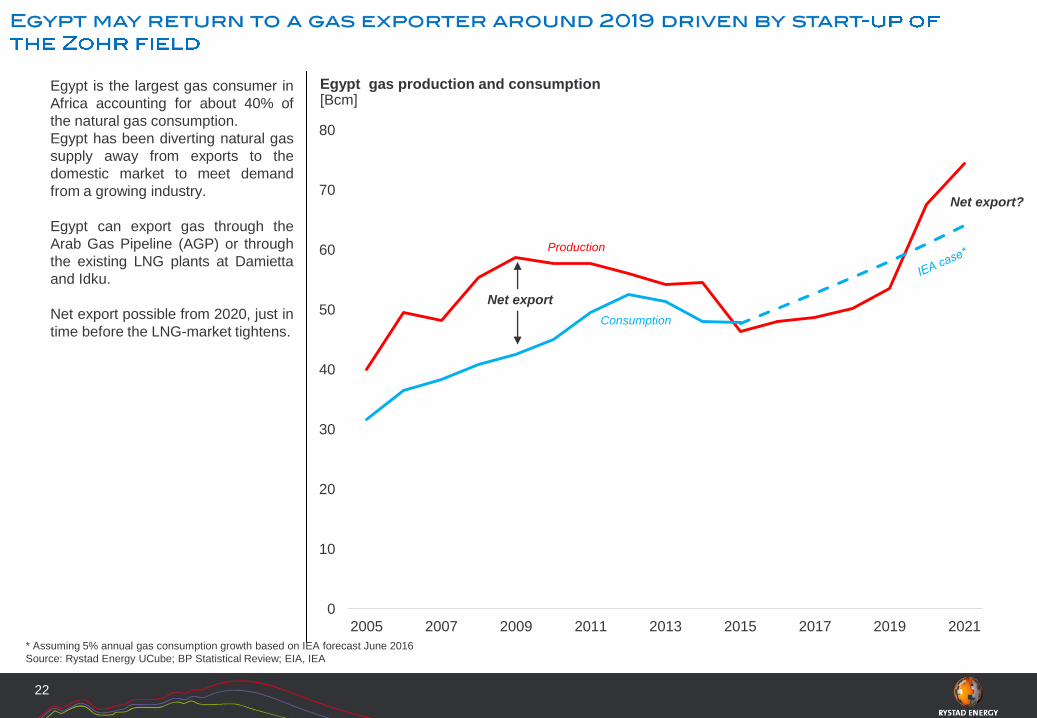
Egypt is the largest gas consumer in
Africa accounting for about 40% of
the natural gas consumption.
Egypt has been diverting natural gas
supply away from exports to the
domestic market to meet demand
from a growing industry.
Egypt can export gas through the
Arab Gas Pipeline (AGP) or through
the existing LNG plants at Damietta
and Idku.
Net export possible from 2020, just in
time before the LNG-market tightens.
Egypt gas production and consumption[Bcm]
22
0
10
20
30
40
50
60
70
80
2005 2007 2009 2011 2013 2015 2017 2019 2021
Production
Consumption
Net export
Net export?
* Assuming 5% annual gas consumption growth based on IEA forecast June 2016
Source: Rystad Energy UCube; BP Statistical Review; EIA, IEA
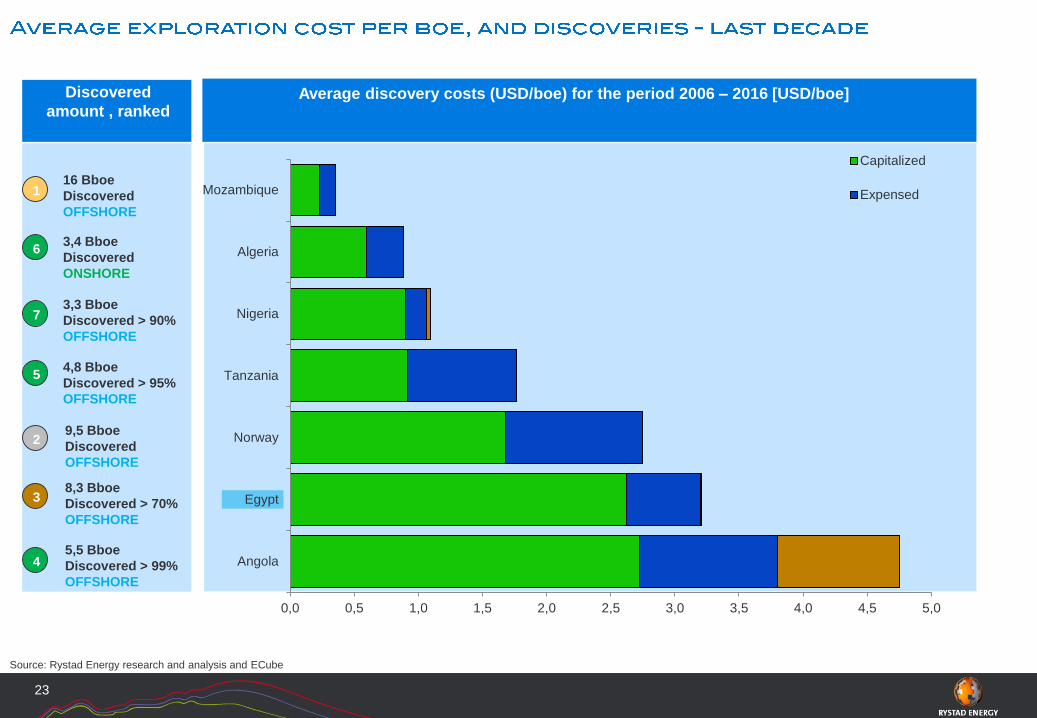
0,0 0,5 1,0 1,5 2,0 2,5 3,0 3,5 4,0 4,5 5,0
Mozambique
Algeria
Nigeria
Tanzania
Norway
Egypt
Angola
Capitalized
Expensed
Source: Rystad Energy research and analysis and ECube
23
Average discovery costs (USD/boe) for the period 2006 – 2016 [USD/boe]
3,3 Bboe
Discovered > 90%
OFFSHORE
4,8 Bboe
Discovered > 95%
OFFSHORE
3,4 Bboe
Discovered
ONSHORE
8,3 Bboe
Discovered > 70%
OFFSHORE
16 Bboe
Discovered
OFFSHORE
9,5 Bboe
Discovered
OFFSHORE
5,5 Bboe
Discovered > 99%
OFFSHORE
1
6
7
5
2
3
4
Discovered
amount , ranked
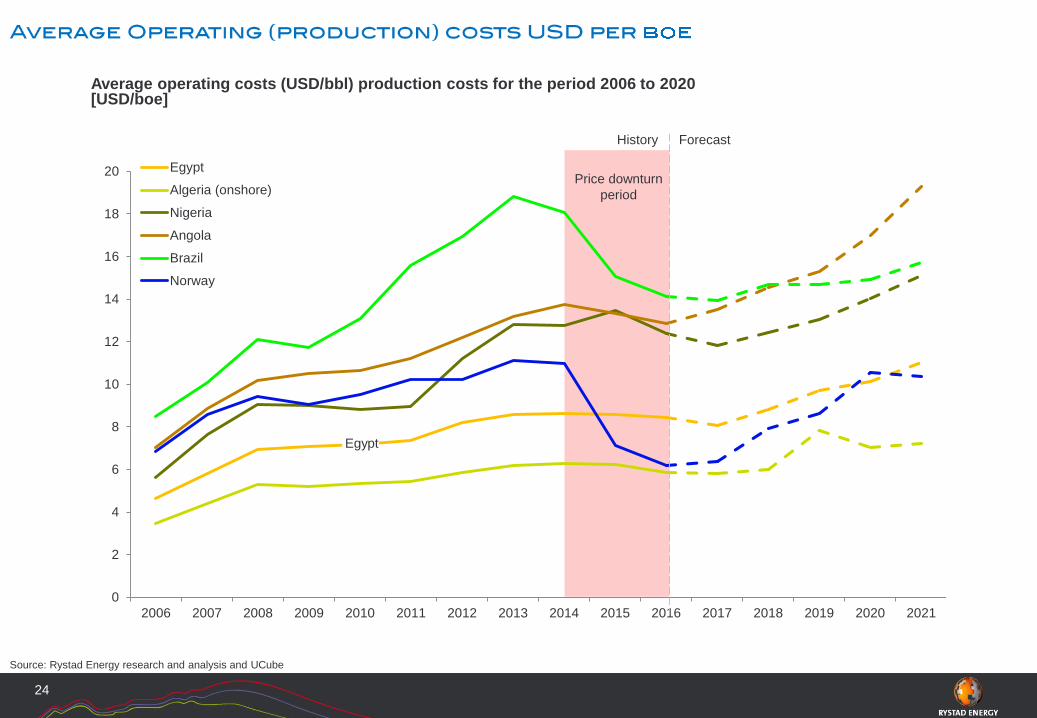
ForecastHistory
0
2
4
6
8
10
12
14
16
18
20
2006 2007 2008 2009 2010 2011 2012 2013 2014 2015 2016 2017 2018 2019 2020 2021
Egypt
Algeria (onshore)
Nigeria
Angola
Brazil
Norway
Source: Rystad Energy research and analysis and UCube
24
Average operating costs (USD/bbl) production costs for the period 2006 to 2020[USD/boe]
Egypt
Price downturn
period
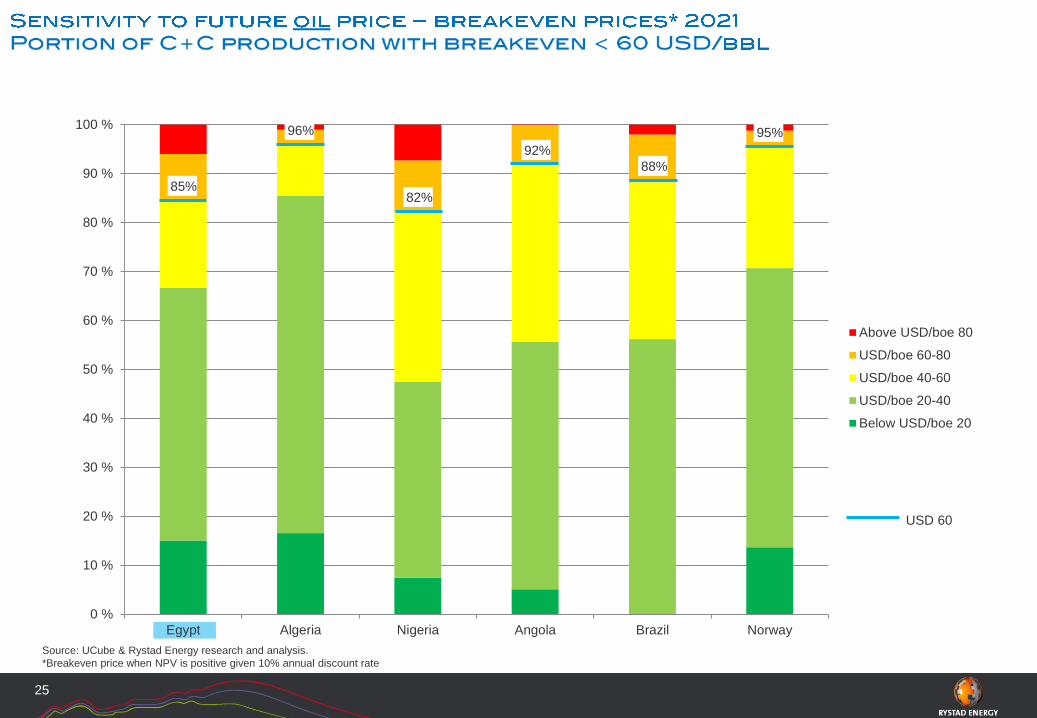
25
USD 60
Source: UCube & Rystad Energy research and analysis.
*Breakeven price when NPV is positive given 10% annual discount rate
0 %
10 %
20 %
30 %
40 %
50 %
60 %
70 %
80 %
90 %
100 %
Egypt Algeria Nigeria Angola Brazil Norway
Above USD/boe 80
USD/boe 60-80
USD/boe 40-60
USD/boe 20-40
Below USD/boe 20
92%
95%
85%
96%
82%
88%
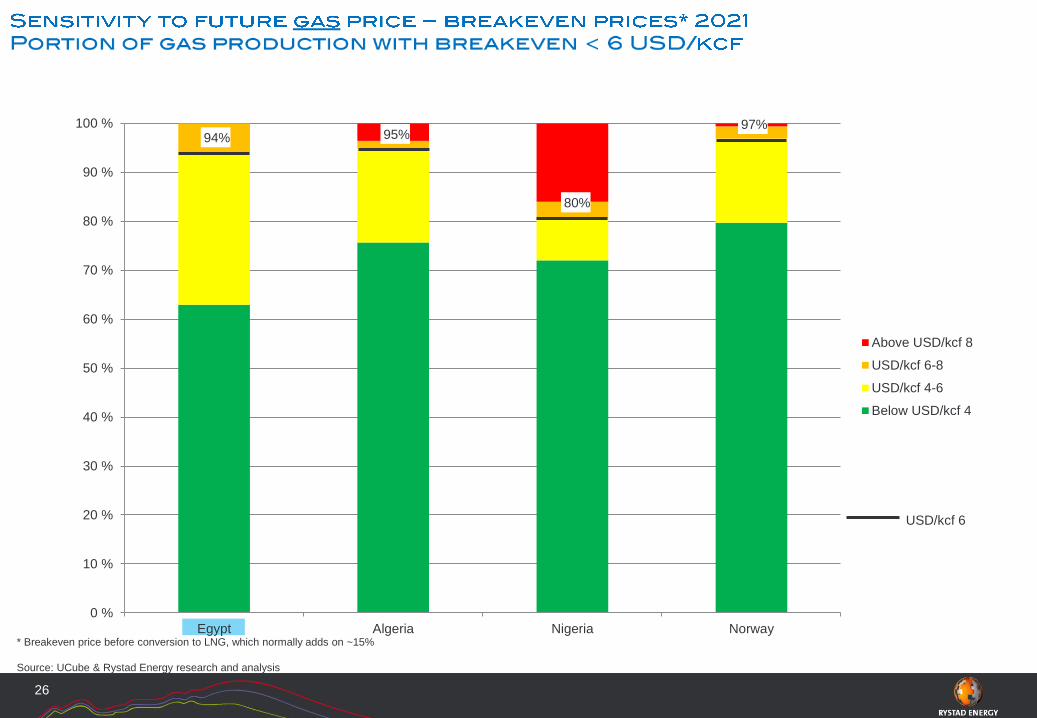
0 %
10 %
20 %
30 %
40 %
50 %
60 %
70 %
80 %
90 %
100 %
Egypt Algeria Nigeria Norway
Above USD/kcf 8
USD/kcf 6-8
USD/kcf 4-6
Below USD/kcf 4
80%
26
USD/kcf 6
* Breakeven price before conversion to LNG, which normally adds on ~15%
Source: UCube & Rystad Energy research and analysis
94% 95%97%
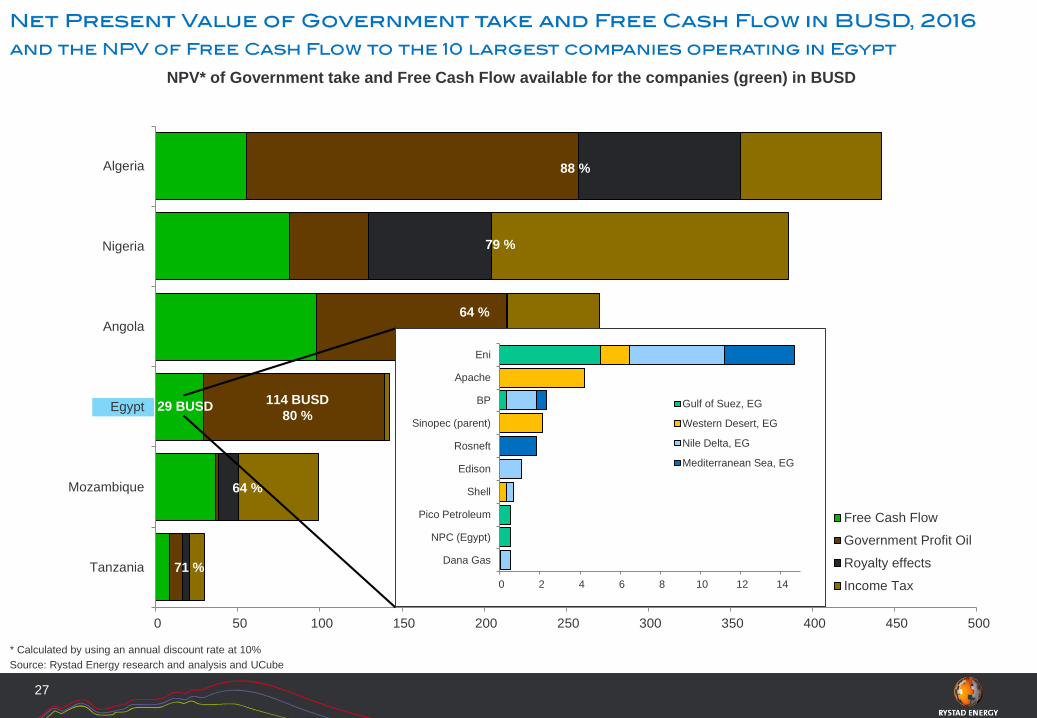
0 50 100 150 200 250 300 350 400 450 500
Algeria
Nigeria
Angola
Egypt
Mozambique
Tanzania
Free Cash Flow
Government Profit Oil
Royalty effects
Income Tax
Source: Rystad Energy research and analysis and UCube
27
NPV* of Government take and Free Cash Flow available for the companies (green) in BUSD
114 BUSD
80 %
88 %
71 %
6 BUSD
36 %
2 BUSD
15 %
79 %
64 %
64 %
29 BUSD
* Calculated by using an annual discount rate at 10%
0 2 4 6 8 10 12 14
Eni
Apache
BP
Sinopec (parent)
Rosneft
Edison
Shell
Pico Petroleum
NPC (Egypt)
Dana Gas
Gulf of Suez, EG
Western Desert, EG
Nile Delta, EG
Mediterranean Sea, EG
28
Keep a long term E&P mindset, which encompasses a balance between exploration, development and
production. Egypt has produced about 40% of its potential only.
Encourage exploration by opening new acreage, offer regular licensing rounds and maybe also consider tax
revisions in order to arrest falling production from the mid 20’ies.
Scrutinize cost improvements through out the entire development chain (exploration to production), even
though break even prices for most projects seem quite robust to low prices.
Don’t flare unsellable gas – re-inject it to maintain reservoir pressure, which increases recovery and lowers
emissions.
Continue the process on removing consumer subsidies.
Tax level maybe in the high end, even though the national participation is low. This may prevent industrial
investments and E&P development .


![M12 Power - Farnell · Number of positions 4 (3 + PE) 4 5 (4 + PE) 5 (4 + PE) AWG [mm2] 0,5 – 1,5 0,5 – 1,5 0,75 – 2,5 0,75 – 2,5 AWG 20 – 16 AWG 20 – 16 AWG 18 – 14](https://img.pdfslide.us/doc/110x75/5f0685397e708231d4186643/m12-power-number-of-positions-4-3-pe-4-5-4-pe-5-4-pe-awg-mm2-05.jpg)