Embed Size (px)
Citation preview

Resource
The Genetic Architecture of the Human Immune
System: A Bioresource for Autoimmunity andDisease PathogenesisGraphical Abstract
Highlights
d Resource of heritabilities and genetic associations of 80,000
immune traits in 669 twins
d Genetic associations with immune cell frequencies and
surface protein expression levels
d Of the top 150 traits, 11 genetic loci explained up to 36% of
variation of 19 traits
d Loci include autoimmune susceptibility genes, providing
etiological hypotheses
Roederer et al., 2015, Cell 161, 387–403April 9, 2015 ª2015 Elsevier Inc.http://dx.doi.org/10.1016/j.cell.2015.02.046
Authors
Mario Roederer, Lydia Quaye, ...,
Tim D. Spector, Frank O. Nestle
[email protected] (M.R.),[email protected] (T.D.S.)
In Brief
The study of a large and homogenous
population of human twins identifies
numerous genetic loci controlling the
phenotype or number of functionally
important immune subsets in the blood,
providing a database to test associations
of any genetic locus with more than
78,000 different immune traits.
Resource
The Genetic Architecture of the HumanImmune System: A Bioresourcefor Autoimmunity and Disease PathogenesisMario Roederer,1,7,* Lydia Quaye,2,7 Massimo Mangino,2,4,7 Margaret H. Beddall,1 Yolanda Mahnke,1,5
Pratip Chattopadhyay,1 Isabella Tosi,3,4 Luca Napolitano,3 Manuela Terranova Barberio,3 Cristina Menni,2
Federica Villanova,3,4 Paola Di Meglio,3,6 Tim D. Spector,2,8,* and Frank O. Nestle3,4,81ImmunoTechnology Section, Vaccine Research Center, NIAID, NIH, Bethesda, MD 20892, USA2Department of Twin Research & Genetic Epidemiology, King’s College London, London SE1 7EH, UK3Cutaneous Medicine Unit, St. John’s Institute of Dermatology, King’s College London, London SE1 9RT, UK4NIHR Biomedical Research Centre at Guy’s and St. Thomas’ NHS Foundation Trust, London SE1 9RT, UK5Present address: Translational and Correlative Sciences Laboratory, Translational Research Program, Perelman School of Medicine,The University of Pennsylvania, Philadelphia, PA 19104, USA6Present address: Division of Molecular Immunology, MRC National Institute for Medical Research, Mill Hill, London NW1 7AA, UK7Co-first author8Co-senior author*Correspondence: [email protected] (M.R.), [email protected] (T.D.S.)
http://dx.doi.org/10.1016/j.cell.2015.02.046
SUMMARY
Despite recent discoveries of genetic variantsassociated with autoimmunity and infection, geneticcontrol of the human immune system during homeo-stasis is poorly understood.We undertook a compre-hensive immunophenotyping approach, analyzing78,000 immune traits in 669 female twins. From thetop 151 heritable traits (up to 96% heritable), weused replicated GWAS to obtain 297 SNP associa-tions at 11 genetic loci, explaining up to 36% of thevariation of 19 traits. We found multiple associationswith canonical traits of all major immune cell subsetsand uncovered insights into genetic control forregulatory T cells. This data set also revealed traitsassociated with loci known to confer autoimmunesusceptibility, providing mechanistic hypotheseslinking immune traits with the etiology of disease.Our data establish a bioresource that links geneticcontrol elements associated with normal immunetraits to common autoimmune and infectious dis-eases, providing a shortcut to identifying potentialmechanisms of immune-related diseases.
INTRODUCTION
The immune system has evolved over millions of years into a
remarkable defense mechanism with rapid and specific protec-
tion of the host frommajor environmental threats and pathogens.
Such pathogen encounters have contributed to a selection of
immune genes at the population level that determine not only
host-specific pathogen responses but also susceptibility to
autoimmune disease and immunopathogenesis. Understanding
how such genes interplay with the environment to determine im-
mune protection and pathology is critical for unravelling the
mechanisms of common autoimmune and infectious diseases
and future development of vaccines and immunomodulatory
therapies.
Studies of rare disease established major genes, and their
associated pathways, that regulate pathogen-specific immune
responses (Casanova and Abel, 2004) and genome-wide associ-
ation studies (GWAS) of autoimmune disease have also been
productive for finding common variants (Cotsapas and Hafler,
2013; Parkes et al., 2013; Raj et al., 2014). Despite this progress,
there are still major limitations in our understanding of the ge-
netics of complex autoimmune or infectious diseases. A key
missing piece is the elucidation of the genes controlling critical
components of a normal human immune system under homeo-
static conditions. These include the relative frequencies of circu-
lating immune cell subsets and the regulation of cell-surface
expression of key proteins that we expect have strong regulatory
mechanisms.
Previous studies in humans and rodents have shown that vari-
ation in the levels of circulating blood T cells is in part heritable
(Amadori et al., 1995; Kraal et al., 1983). Identifying the underly-
ing genetic elements would help us understand the mechanisms
of homeostasis—and its dysregulation. Twin studies are ideal to
quantify the heritability of immune traits in healthy humans by al-
lowing adjustment for the influence of genes, early environment,
age, and cohort, plus a number of known and unknown con-
founders (van Dongen et al., 2012). Early studies from our group
demonstrated genetic control of CD8 and CD4 T cell levels in
twins (Ahmadi et al., 2001), and others have shown similar heri-
table effects in non-twins and rodents and with broad white
cell phenotypes (Amadori et al., 1995; Clementi et al., 1999;
Damoiseaux et al., 1999; Evans et al., 1999; Ferreira et al.,
2010; Hall et al., 2000; Kraal et al., 1983; Nalls et al., 2011; Okada
et al., 2011). A recent study, with a family design, was the first to
perform GWAS on a larger range of immune subtypes. The
authors analyzed 272 correlated immune traits derived from 95
Cell 161, 387–403, April 9, 2015 ª2015 Elsevier Inc. 387

0
10
30
25
15
5
FcGR Cluster
NFIANXRN1
PRKC1NT5E
SLC18A1FAS
ENTDP1KLR Cluster
FTO
10 P
-Val
ue
C
0
10
20
40
10 P
-Val
ue
FcGR Cluster ENTDP1
B
CD2 CD158a CD158b CD314 CD335 CD337 CCR7
6,651 CSFs 49 SPELsP
anel
4
Early NKCD56+CD16
Effector NKCD56+CD16+ Terminal NK
CD56 CD16+
CD8 CD27 CD28 CD45RA CCR5 CCR7
2,187 CSFs 54 SPELsP
anel
5
T
V 1+ V 2+ V 9+ V 2
V 9+
T CellsCD3+
Lymphocytes
PBMCStem cells
CD34+Lin1 CSF 5 SPELs
CD161 PD1 CCR4 CCR6 CCR10 CXCR3 CXCR5
8,748 CSFs 84 SPELs
Pan
el 3
CD25 CD38 CD39 CD45RO CD73 CD127 HLA-DR PD-1
26,244 CSFs 96 SPELs
Activated Memory Long-lived Memory Exhausted Treg
Pan
el 2
CD27 CD28 CD31 CD45RA CD57 CD95 CD127 CD244
26,244 CSFs 96 SPELs
RTE Naive TSCMTCMTTMTEMTTESenescent
Pan
el 1
T
CD4 T
CD8 T
DN T
DP T
CD1c
Plasmacytoid DCCD11cCD123+
APC for CD4CD1c+
APC for CD8CD141+
InflammatoryCD16+
CD16
Dendritic Cells
B CellsCD19+
CD5 CD24 CD27 CD38 IgD
243 CSFs
Pan
el 6
CD20 CD24 CD27 CD38
324 CSFs 88 SPELsP
anel
6Memory B
CD95+
CD95 IgM+
Immature BCD10+
1 CSF 4 SPELs
Naive BCD21+CD95
1 CSF 3 SPELs
Memory Activated Exhausted Plasmablasts
IgM+ IgG+ IgA+ IgE+
CD27 CD28 CD45RA CCR7
324 CSFs 67 SPELsP
anel
5
NKTCD1d Tetramer+
NaiveCD4+
CCR5
EarlyCD4+
CCR5+
TerminalCD4CD8+
EffectorCD4CD8
CD11c CD16 CD32 CD64 CD123 CD141 CD274 HLA-DR
6,561 CSFsP
anel
7
MonocytesCD14+
CD11c+
CD123+
Myeloid DCCD11c+CD123
NK Cells
Cytotoxic Immunomodulatory Activating KIR variants Anergic
TFH TH1TH2TH9TH17TH21TH22
CD32 CD64 CD274
162 CSFs 135 SPELsPan
el 7
A
Chromosome1 4 5 6 7 8 9 10 12 16 202 3 141 4 5 6 7 8 9 10 12 16 202 3
Chromosome14
Figure 1. Schematic Representation of Leukocyte Populations Analyzed and Summary Manhattan Plot
(A) This diagram illustrates the approach to analyzing the immunophenotyping data obtained by flow cytometry. It is not meant to convey differentiation stages of
leukocyte populations, though that property is largely reflected in this diagram. Each ‘‘lineage’’ of a subset of leukocytes was identified through hierarchical
gating. Within each of these lineages, all possible combinations of markers with heterogeneous expression within the lineage were analyzed. The number of
subsets identified by this combinatorial approach is shown in various lineages; the trait analyzed was the CSF within its parent lineage. In addition, the cell SPEL
was quantified by the median fluorescence intensity of the antibody staining on a given cell subset; the number of SPEL traits is indicated as well.
(legend continued on next page)
388 Cell 161, 387–403, April 9, 2015 ª2015 Elsevier Inc.

cell types and described 23 independent genetic variants within
13 independent loci (Orru et al., 2013).
Here, we report a comprehensive and high-resolution deep
immunophenotyping flow cytometry analysis in 669 female
twins using 7 distinct 14-color immunophenotyping panels that
captured nearly 80,000 cell types (comprising �1,800 indepen-
dent phenotypes) to analyze both immune cell subset fre-
quency (CSF) and immune cell-surface protein expression levels
(SPELs). This gave us a roughly 30-fold richer view of the healthy
immune system than was previously achievable. Taking advan-
tage of the twin model, we used a pre-specified analysis plan
that prioritized 151 independent immune traits for genome-
wide association analysis and replication.
We find 241 genome-wide significant SNPs within 11 genetic
loci, 9 of which are previously unreported. Importantly, they
explain up to 36% of the variation of 19 immune traits (18 previ-
ously unexplored). We identify pleiotropic ‘‘master’’ genetic loci
controlling multiple immune traits and key immune traits under
tight genetic control by multiple genetic loci. In addition, we
show the importance of quantifying cell-surface antigen expres-
sion rather than just cell-type frequency.
Critically, we show overlap between these genetic associa-
tions of normal immune homeostasis with previously established
autoimmune and infectious disease associations. This rich data-
base provides a vital, publicly accessible bioresource as a bridge
between genetic and immune discoveries that will expedite
the identification of disease mechanisms in autoimmunity and
infection.
RESULTS
SubjectsThe discovery stage comprised 497 female participants from
the UK Adult Twin Register (TwinsUK). There were 75 complete
monozygotic (MZ) twin pairs, 170 dizygotic (DZ) pairs, and 7 sin-
gletons (arising from quality control [QC] failures in one co-twin).
The mean age was 61.4 years (range: 40–77). The replication
stage comprised a further 172 participants, mean age 58.2
years (range: 32–83), with 46 MZ, 118 DZ, and 8 singletons.
We stained cryopreserved peripheral blood mononuclear cells
(PBMC) from each, using a set of 7 14-color immunophenotyp-
ing panels that delineate a large range of immune subsets (Fig-
ures 1A, S1, S2, and S3 and Table S1). Immune traits analyzed
included the CSF (i.e., the proportionate representation of a
given phenotype) and the SPEL (i.e., a quantitative measure of
gene expression on a per-cell basis). The variability of all traits
was assessed using longitudinal sampling on a small cohort of
individuals as described in the Experimental Procedures; of
the 50,000 traits meeting the first filter criterion (Figure S4),
the mean covariance across samples drawn 6 months apart is
0.86. All trait values and summary analyses, including variability,
are available for download. Data and statistical analysis of the
discovery stage was completed per a pre-defined statistical
(B and C) Summary Manhattan plots: green dots, genome-wide significan
threshold of p < 3.3 3 10�10, which corresponds to the standard geno
The variants shown are MAF R 0.1; call rate R 0.9; HWE p value R 1
associations (C).
analysis plan before samples from the replication stage were
thawed.
GWAS analysis of all 78,000 immune traits is computationally
prohibitive and would require a multiple comparisons correction
that dramatically reduces sensitivity. The ability to infer heritabil-
ity (proportion of variance explained solely by genetic factors) by
the use of twins dramatically enhanced our ability to focus on
those that are most likely to be informative. Co-variation of all
traits was computed; about 1,800 were independent at r < 0.7
(Figure S4).
We found no significant association of the analyzed traits with
self-reported tobacco use or alcohol consumption and so did not
include those behaviors as covariates. We identified many traits
associated with age and included age as a covariate in all ana-
lyses. Notably, an advantage of using a twin-based cohort is to
render age and other cohort effects minimally impactful. The
age range of our cohort was optimal for our goal of identifying im-
mune traits associated with genetic elements that show a risk for
autoimmune diseases. Because incidence for such diseases
often increases with age, the greatest power for such correla-
tions will be obtained using samples measurements most prox-
imal to the common onset of disease.
HeritabilityFalconer’s traditional formula (twice the difference in intraclass
correlations) was used to roughly estimate the heritabilities of
all 78,000 immune traits; after ranking, traits were selected for
further pre-specified analyses (Figure S4). Variance components
analysis (additive genetics, common environment, and unique
environment, or ACE model) was used to more precisely esti-
mate heritabilities of chosen traits. The heritabilities ranged
widely from 0%—suggesting purely environmental or stochastic
influences—to 96% (e.g., CD32 expression on dendritic cells),
indicating a strong genetic effect. Figure S5 shows the range
of heritabilities for selected traits, and the components of the
model are tabulated in Table S2 with full trait descriptions.
GWAS of Immune TraitsSingle-variant associationswereperformedon151 immune traits
selected for high heritability or biological interest, comprising
cell frequency (129 CSFs) and cell-surface protein expression
(22 SPELs). Many significant associations were found despite
the stringent Bonferroni multiple testing threshold of p < 3.3 3
10�10. We also performed a conditional analysis, including the
top SNP of each locus as a covariate, to identify potential
independent secondary signals. This analysis did not reveal any
significant evidence for additional independent signals.
Six SPELs were significant (Table 1), with the strongest be-
tween MFI:516 (CD39 SPEL on CD4 T cells) and the ENTPD1
(CD39 gene) SNP rs7096317 (p = 9.4 3 10�40). Many other var-
iants of ENTPD1 were also associated with this trait (Table S3).
Expression of five others (MFI:189, MFI:212, MFI:231, MFI:504,
and MFI:552, which include CD27 expression on B and T cell
t associations (p < 5 3 10�8). The red line indicates the significance
me-wide threshold after further adjustment for 151 independent tests.
3 10�8. Shown are separate plots for SPEL associations (B) and CSF
Cell 161, 387–403, April 9, 2015 ª2015 Elsevier Inc. 389
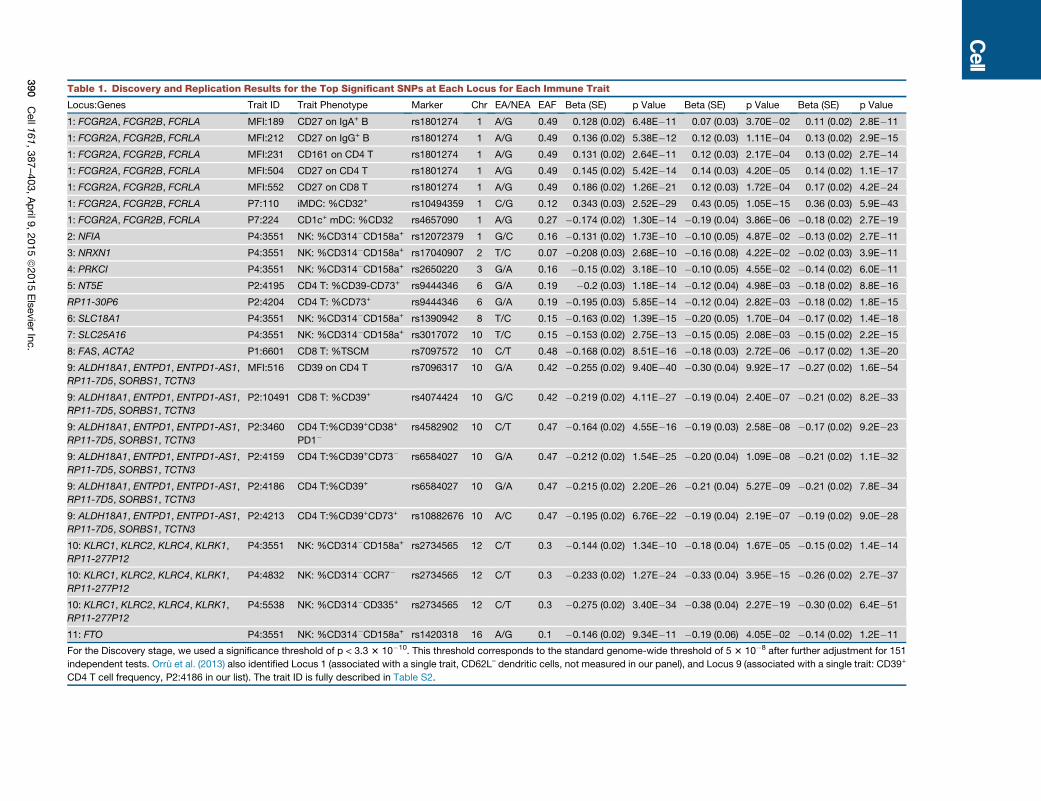
Table 1. Discovery and Replication Results for the Top Significant SNPs at Each Locus for Each Immune Trait
Locus:Genes Trait ID Trait Phenotype Marker Chr EA/NEA EAF Beta (SE) p Value Beta (SE) p Value Beta (SE) p Value
1: FCGR2A, FCGR2B, FCRLA MFI:189 CD27 on IgA+ B rs1801274 1 A/G 0.49 0.128 (0.02) 6.48E�11 0.07 (0.03) 3.70E�02 0.11 (0.02) 2.8E�11
1: FCGR2A, FCGR2B, FCRLA MFI:212 CD27 on IgG+ B rs1801274 1 A/G 0.49 0.136 (0.02) 5.38E�12 0.12 (0.03) 1.11E�04 0.13 (0.02) 2.9E�15
1: FCGR2A, FCGR2B, FCRLA MFI:231 CD161 on CD4 T rs1801274 1 A/G 0.49 0.131 (0.02) 2.64E�11 0.12 (0.03) 2.17E�04 0.13 (0.02) 2.7E�14
1: FCGR2A, FCGR2B, FCRLA MFI:504 CD27 on CD4 T rs1801274 1 A/G 0.49 0.145 (0.02) 5.42E�14 0.14 (0.03) 4.20E�05 0.14 (0.02) 1.1E�17
1: FCGR2A, FCGR2B, FCRLA MFI:552 CD27 on CD8 T rs1801274 1 A/G 0.49 0.186 (0.02) 1.26E�21 0.12 (0.03) 1.72E�04 0.17 (0.02) 4.2E�24
1: FCGR2A, FCGR2B, FCRLA P7:110 iMDC: %CD32+ rs10494359 1 C/G 0.12 0.343 (0.03) 2.52E�29 0.43 (0.05) 1.05E�15 0.36 (0.03) 5.9E�43
1: FCGR2A, FCGR2B, FCRLA P7:224 CD1c+ mDC: %CD32 rs4657090 1 A/G 0.27 �0.174 (0.02) 1.30E�14 �0.19 (0.04) 3.86E�06 �0.18 (0.02) 2.7E�19
2: NFIA P4:3551 NK: %CD314�CD158a+ rs12072379 1 G/C 0.16 �0.131 (0.02) 1.73E�10 �0.10 (0.05) 4.87E�02 �0.13 (0.02) 2.7E�11
3: NRXN1 P4:3551 NK: %CD314�CD158a+ rs17040907 2 T/C 0.07 �0.208 (0.03) 2.68E�10 �0.16 (0.08) 4.22E�02 �0.02 (0.03) 3.9E�11
4: PRKCI P4:3551 NK: %CD314�CD158a+ rs2650220 3 G/A 0.16 �0.15 (0.02) 3.18E�10 �0.10 (0.05) 4.55E�02 �0.14 (0.02) 6.0E�11
5: NT5E P2:4195 CD4 T: %CD39-CD73+ rs9444346 6 G/A 0.19 �0.2 (0.03) 1.18E�14 �0.12 (0.04) 4.98E�03 �0.18 (0.02) 8.8E�16
RP11-30P6 P2:4204 CD4 T: %CD73+ rs9444346 6 G/A 0.19 �0.195 (0.03) 5.85E�14 �0.12 (0.04) 2.82E�03 �0.18 (0.02) 1.8E�15
6: SLC18A1 P4:3551 NK: %CD314�CD158a+ rs1390942 8 T/C 0.15 �0.163 (0.02) 1.39E�15 �0.20 (0.05) 1.70E�04 �0.17 (0.02) 1.4E�18
7: SLC25A16 P4:3551 NK: %CD314�CD158a+ rs3017072 10 T/C 0.15 �0.153 (0.02) 2.75E�13 �0.15 (0.05) 2.08E�03 �0.15 (0.02) 2.2E�15
8: FAS, ACTA2 P1:6601 CD8 T: %TSCM rs7097572 10 C/T 0.48 �0.168 (0.02) 8.51E�16 �0.18 (0.03) 2.72E�06 �0.17 (0.02) 1.3E�20
9: ALDH18A1, ENTPD1, ENTPD1-AS1,
RP11-7D5, SORBS1, TCTN3
MFI:516 CD39 on CD4 T rs7096317 10 G/A 0.42 �0.255 (0.02) 9.40E�40 �0.30 (0.04) 9.92E�17 �0.27 (0.02) 1.6E�54
9: ALDH18A1, ENTPD1, ENTPD1-AS1,
RP11-7D5, SORBS1, TCTN3
P2:10491 CD8 T: %CD39+ rs4074424 10 G/C 0.42 �0.219 (0.02) 4.11E�27 �0.19 (0.04) 2.40E�07 �0.21 (0.02) 8.2E�33
9: ALDH18A1, ENTPD1, ENTPD1-AS1,
RP11-7D5, SORBS1, TCTN3
P2:3460 CD4 T:%CD39+CD38+
PD1�rs4582902 10 C/T 0.47 �0.164 (0.02) 4.55E�16 �0.19 (0.03) 2.58E�08 �0.17 (0.02) 9.2E�23
9: ALDH18A1, ENTPD1, ENTPD1-AS1,
RP11-7D5, SORBS1, TCTN3
P2:4159 CD4 T:%CD39+CD73� rs6584027 10 G/A 0.47 �0.212 (0.02) 1.54E�25 �0.20 (0.04) 1.09E�08 �0.21 (0.02) 1.1E�32
9: ALDH18A1, ENTPD1, ENTPD1-AS1,
RP11-7D5, SORBS1, TCTN3
P2:4186 CD4 T:%CD39+ rs6584027 10 G/A 0.47 �0.215 (0.02) 2.20E�26 �0.21 (0.04) 5.27E�09 �0.21 (0.02) 7.8E�34
9: ALDH18A1, ENTPD1, ENTPD1-AS1,
RP11-7D5, SORBS1, TCTN3
P2:4213 CD4 T:%CD39+CD73+ rs10882676 10 A/C 0.47 �0.195 (0.02) 6.76E�22 �0.19 (0.04) 2.19E�07 �0.19 (0.02) 9.0E�28
10: KLRC1, KLRC2, KLRC4, KLRK1,
RP11-277P12
P4:3551 NK: %CD314�CD158a+ rs2734565 12 C/T 0.3 �0.144 (0.02) 1.34E�10 �0.18 (0.04) 1.67E�05 �0.15 (0.02) 1.4E�14
10: KLRC1, KLRC2, KLRC4, KLRK1,
RP11-277P12
P4:4832 NK: %CD314�CCR7� rs2734565 12 C/T 0.3 �0.233 (0.02) 1.27E�24 �0.33 (0.04) 3.95E�15 �0.26 (0.02) 2.7E�37
10: KLRC1, KLRC2, KLRC4, KLRK1,
RP11-277P12
P4:5538 NK: %CD314�CD335+ rs2734565 12 C/T 0.3 �0.275 (0.02) 3.40E�34 �0.38 (0.04) 2.27E�19 �0.30 (0.02) 6.4E�51
11: FTO P4:3551 NK: %CD314�CD158a+ rs1420318 16 A/G 0.1 �0.146 (0.02) 9.34E�11 �0.19 (0.06) 4.05E�02 �0.14 (0.02) 1.2E�11
For the Discovery stage, we used a significance threshold of p < 3.3 3 10�10. This threshold corresponds to the standard genome-wide threshold of 5 3 10�8 after further adjustment for 151
independent tests. Orru et al. (2013) also identified Locus 1 (associated with a single trait, CD62L– dendritic cells, not measured in our panel), and Locus 9 (associated with a single trait: CD39+
CD4 T cell frequency, P2:4186 in our list). The trait ID is fully described in Table S2.
390
Cell1
61,387–403,April9
,2015ª2015ElsevierInc.

subsets, and CD161 expression on CD4 T cells) were associated
with variants on chromosome 1q23 in a genetic region contain-
ing the important immune-regulating genes FCGR2A, FCGR2B,
and FCRLA (Table 1). These associations were independently
verified in the replication cohort, and the combined discovery
and replication set p values of the 6 SPELs ranged from 2.8 3
10�11 to 1.63 10�54 (Table 1 and Figure 1B). Table S3 illustrates
other examples of genetic control of cell-surface expression,
including the expression of CD11c, CD123, and CD274 on
myeloid subsets.
Overall, 241 SNP variants with a minor allele frequency above
5% were significantly associated with various SPELs (Table S3);
of these, 35 SNPs were pleiotropically associated with multiple
SPELs.
Genetic control of SPEL may simply be due to promoter/
enhancer element variants or more complex regulation of tran-
scription, translation, or protein localization. In contrast, genetic
control of CSF may reveal homeostatic mechanisms regulating
cell subset representation in the blood. Genome-wide significant
associations were identified with 13 different CSFs (Figure 1C
and Table 1). Nearly all were verified in the replication cohort
(Table 1), and some reached a p value of 10�43.
Suggestive associations, which did not meet the conservative
significance threshold of 3.3 3 10�10, were also identified for
numerous SPELs and CSFs (Tables S3 and S4). The associa-
tions that were independently replicated (replication p < 0.05),
as well as meta-analyzed variants reaching p < 5 3 10�8, are
reported in Table S6.
Genetic Control of TREG CellsOne of the most heritable traits identified from our staining
panels was the frequency of CD39+ cells within the CD4
compartment (Figure 2), as previously reported (Orru et al.,
2013). CD39+CD4 T, as well as CD73+ CD4 T cells, have been
identified functionally as T regulatory (TREG) cells (Borsellino
et al., 2007), a key subset in the modulation of immune re-
sponses (Antonioli et al., 2013).
The heritability of CD39+CD4 T frequency was 89% (95% CI:
66%–93%) (Figure 2A). GWAS analysis revealed a single locus
on chromosome 10 that was highly associated with the trait (Fig-
ure 2B); this locusmaps to the CD39 gene itself. Quantification of
the expression of CD39 on a per-cell basis (i.e., SPEL) revealed
that the basis for this association was an ‘‘on/off’’ control of the
expression of the CD39 molecule on the cells, rather than a
homeostatic regulation of the circulating levels of these cells
(i.e., CSF). Specifically, individuals who are homozygous for
rs7096317A express the highest amount of this protein on the
cell surface; heterozygotes expressed half as much; and
rs7096317G homozygotes expressed virtually none (Figures
2C and 2D). Although the A/G heterozygotes have a significantly
decreasedCD39 SPEL, the cells express enough so as to remain
CD39+. Thus, in the analysis of the CD39 CSF by genotype, only
the G/G homozygotes have a reduced frequency of this popula-
tion (Figure 2E). This illustrates the power of the SPEL analysis to
de-convolute potential mechanisms of genetic control that are
missed by simple analysis of CSF.
Similarly, the frequency of CD4 T cells that are CD25+CD127–
CD45RO+ but do not express CD39 was also strongly associ-
ated with this same locus, showing the opposite association
(Figure 2F). In other words, genetic control is not over the fre-
quency of TREG (CD4+CD25+CD127–CD45RO+) but over the
quantitative expression of CD39 (the cell phenotype). Notably,
this genetic control also extends to lymphocytes that are not
TREG: a similar genotypic association (Figure S6) was found for
the relatively rare CD8+ and CD4–CD8– T cells expressing
CD39 (Figures S7A and S7B). Finally, CD73 is an ectonuclease
similar to CD39, and its expression has also been associated
with TREG cells (Antonioli et al., 2013). The expression of CD73
was also found to be genetically controlled (Figure S7C) and
associated with a single locus on chromosome 6 mapping to
the CD73 gene itself.
Thus, the main genetic control of CD39+ TREG appears to orig-
inate from a transcriptional or post-transcriptional regulation
leading to the presence or absence of this protein on the cell sur-
face of TREG cells; for those TREG defined on a basis independent
of CD39, we found no evidence of genetic control over their rep-
resentation in blood.
Genetic Influences on Leukocyte DifferentiationIn virtually every leukocyte population, we found examples in
which the frequency of certain differentiation stages was herita-
ble (Figure 3). In some cases, despite a very high heritability, we
were unable to identify genetic variants that correlated with the
trait. For example, the frequency of a CD4 transitional memory
(TTM) phenotype (CD28+CD127–), which comprises 15% to
20% of CD4 T cells, was very strongly heritable (Figure 3A) but
did not correlate with any SNP genotypes. We found similar ex-
amples of strong heritability without genetic associations for
other T cell stages, including recent thymic emigrants (RTE)
and central memory (TCM). This was not unexpected—our study
was only powered to find large effect sizes of gene variants,
which is unusual for most traditional disease GWASs that need
thousands of subjects per association. This suggests that
possibly multiple genes of modest influence act on these pheno-
types. Despite the lack of defined genetic association, the obser-
vation of strong heritability indicates that these cell types play an
important and unique role in immunity, such that their numbers
are strongly regulated.
For a number of leukocyte lineages, we were able to identify
genetic associations with differentiation stages and illustrate
four examples. (1) Within B cells, the proportion that is immature
(CD10+) is associated with the genotype of the membrane
metallo-endopeptidase (MME) gene (Figure 3B). (2) The propor-
tion of Th22 CD4 T cells (CXCR3–CCR4+CCR6+CCR10+) is
strongly associatedwith a single locus on chromosome 16,map-
ping to the SPG7 gene, which codes for paraplegin, an important
protein in mitochondrial function (Figure 3C). (3) Within natural
killer (NK) cells, the proportion of cells that express CD335 but
not CD314 (Figure 3D) maps to the KLRC4 gene (Figure 3E).
This association is much more profound for NK cells that are in
an early differentiation stage (CD56+CD16–) and becomes less
strong as the cells mature (Figure 3F). This indicates that amech-
anism evinced in a differentiation stage-specific manner. (4) The
proportion of T cells that are ‘‘stem cell memory’’ cells (TSCM; the
earliest memory stage) is heritable (Figure 3G) and associated
with a genetic locus containing FAS (CD95) (Figure 3H). This
Cell 161, 387–403, April 9, 2015 ª2015 Elsevier Inc. 391

A
C
D E F
B
Figure 2. Genetic Associations with Treg Phenotype Cells
(A) The correlation of the fraction of CD4 T cells that are CD39+ in dizygotic twins (top) and monozygotic twins (bottom). The linear correlation, r, is shown for each
comparison.
(B) Locus plot showing significant effect of individual SNPs on CD39 expression on CD4 T cells.
(C) Shown are the expression profiles of CD39 and CD25 for the subset of CD4 T cells that are CD45RO+CD127– for two pairs of dizygotic twins discordant for the
rs7096317 allele (in the CD39 gene locus). Within each graphic is shown the fraction of cells in the upper two quadrants and the surface protein expression level
(SPEL) of CD39 for the cells in the upper right quadrant, as well as the genotype of each individual.
(legend continued on next page)
392 Cell 161, 387–403, April 9, 2015 ª2015 Elsevier Inc.

association was much stronger for CD4 than for CD8 T cells.
TSCM are precursor cells that have tremendous proliferative ca-
pacity and can regenerate all other memory T cell populations
(Gattinoni et al., 2011; Lugli et al., 2013). Interestingly, this
same locus also has a significant association with the fraction
of T cells that are CD8 (Figure 3I), demonstrating multiple (pleio-
tropic) effects of the FAS gene on T cell differentiation.
Pleiotropic Impact of the FcRG2 LocusThe locus with the widest range of impacts on leukocyte subset
phenotype and frequency was on chromosome 1, a region
including the FcRG2 gene. This locus is well known for its
association with a variety of autoimmune and inflammatory dis-
eases, including systemic lupus erythematosus (SLE), Kawasa-
ki’s disease, inflammatory bowel disease, Crohn’s disease,
type 1 diabetes, and HIV disease progression. Despite the genes
in this locus being primarily expressed on myeloid and B
lymphoid cells, many of these diseases are traditionally associ-
ated with T cell dysregulation.
The strongest association (e.g., SNP rs1801274) we identified
for this locus was with the expression of CD32 (FcRG2a and/or
FcRG2b: these are indistinguishable by themonoclonal antibody
used in our panel) on the surface of inflammatory myeloid den-
dritic cells (imDC; Figures 4A and 4B). The heritability of this trait
was extremely high at 96% (CI: 81%–97%).
The genetic control of the expression of CD32 on imDCs was
not seen in all cell populations. For example, B cells showed no
control (Figure 4C), whereas the expression of CD32 on imDCs is
associated with the number of rs1801274 ‘‘T’’ alleles (Figures 4C
and 4D).
The rs1801274 genotype has been strongly associated with
susceptibility to SLE, as well as another SNP in the same locus,
rs10800309. This latter SNP has also been associatedwith ulcer-
ative colitis. The frequency of CD32+ iMDCs is strongly affected
by the genotypes at both of these loci (Figures 4D and 4E); how-
ever, the distribution of expression for either locus is not uniform:
high, intermediate, and low expressors can be found within all
genotypes with differing frequencies. However, when the two
genotypes are taken together as a diplotype, a powerful and
replicated association becomes evident for CD32+ imDCs (Fig-
ures 4E and S8C). The impact of this diplotype on CD32 expres-
sion extends to other myeloid subsets (Figures 4F and S8A).
Statistical significance of the association is greatest for mono-
cytes, although the dynamic range in the expression levels
is not as wide as it is for imDCs. Other subsets, such as the pro-
fessional antigen presenting mDC, show a muted control of
expression; CD11c+CD123+ DC, like B cells, show no differential
regulation of CD32 expression at all.
Given the profound impact of these genotypes on particular
subsets, it raises the possibility that part of the increased sus-
ceptibility to associated autoimmune diseases may be a conse-
quence of the altered function of cells like imDCs by virtue of a
differential expression of the activating (CD32a) or repressing
(D) The CD39 SPEL of CD39 positive cells is graphed by the genotype o
which a cell was considered CD39+. In the C/C genotype, relatively few cells a
robust.
(E and F) The fraction of CD4 T cells of the designated phenotype is graphed by
(CD32b) proteins that we identify here. This is perhaps driven
by a SNP in the promoter/enhancer areas in high linkage disequi-
librium to the commonly studied coding SNP rs1801274.
We also found a remarkable range of effects of the FcRG2 lo-
cus on a variety of lymphocyte subsets (Figure 5). For example,
the proportion of early NK cells that are CD2+CD158a+CD158b+
is strongly associated with SNP rs365264 (Figure 5A), located
between CD32a and CD16 (Figure 4B). The rs1801274 coding
SNP in the locuswas associatedwith phenotypes on both B cells
and T cells, including the fraction of memory IgG+ (Figure 5B) or
IgA+ (Figure S8B) B cells that express CD27, as well as the CD27
expression level on a per cell basis. Interestingly, in this case, the
higher surface expression levels of CD27 (SPEL) are associated
with lower frequencies of cells that express CD27 (CSF). Thus, in
contrast to the example of CD39+ TREG (Figure 2), differential
regulation of CD27 protein expression does not account for dif-
ferential frequency of these cell subsets.
T Cells, FcRG2, and Autoimmune DiseaseSimilar to the case for IgG+ B cells, CD8 T cells also exhibited
higher CD27 expression in association with rs1801274T allele
(Figure 5C); this was also true for other T cell lineages (Figure S8).
Furthermore, a population of CD4 T cells that express CD161 is
also strongly associated with this same genotype (Figure 5D).
Importantly, CD161+ T cells are either Th17 or mucosal-associ-
ated innate T (MAIT) cells, important for maintenance of mucosal
integrity. Thus, we define an impact of specific gene variants on
important T cell phenotypes closely related to their activation po-
tential, which may underlie the associations with T-cell-based
autoimmune diseases.
Finally, Starbeck-Miller et al. (2014) recently demonstrated
that CD8 T cells can express CD32b and that this expression
was functionally important in modulating cytolytic T cell re-
sponses. Here, we demonstrate that expression of CD32 on
CD8 T cells is low and variable between individuals (Figure 5E).
Notably, this expression shows a very strong association with
the rs1801274:rs10800309 diplotype of the FCRG2 gene locus
(Figure 5F). This suggests that the regulation of surface expres-
sion of this negative regulatory molecule on CD8 T cells (Star-
beck-Miller et al., 2014) has a common expression mechanism
to that in myeloid populations. Gene variants increasing suscep-
tibility to SLE also associate with lower levels of this negative
regulatory protein on CD8 T cells and imDC. Together, these
data provide a possible direct link between the SNPs highly
associated with autoimmune diseases and T cell phenotypes
that might account for the pathogenesis.
Overlap with Disease AssociationsThe Catalog of Published Genome-wide Association Studies
(http://www.genome.gov/gwastudies/) and ImmunoBase (http://
www.immunobase.org/) were used to evaluate the overlap be-
tween genetic variants associated with CSFs and SPELs in our
study and those reported to be suggestively or statistically
f rs7096317; the dotted line indicates the threshold of positivity above
re above this threshold and the median fluorescence intensity values are not
the rs7096317 genotype. Bars indicate interquartile range.
Cell 161, 387–403, April 9, 2015 ª2015 Elsevier Inc. 393
A
D
G H I
E F
B C
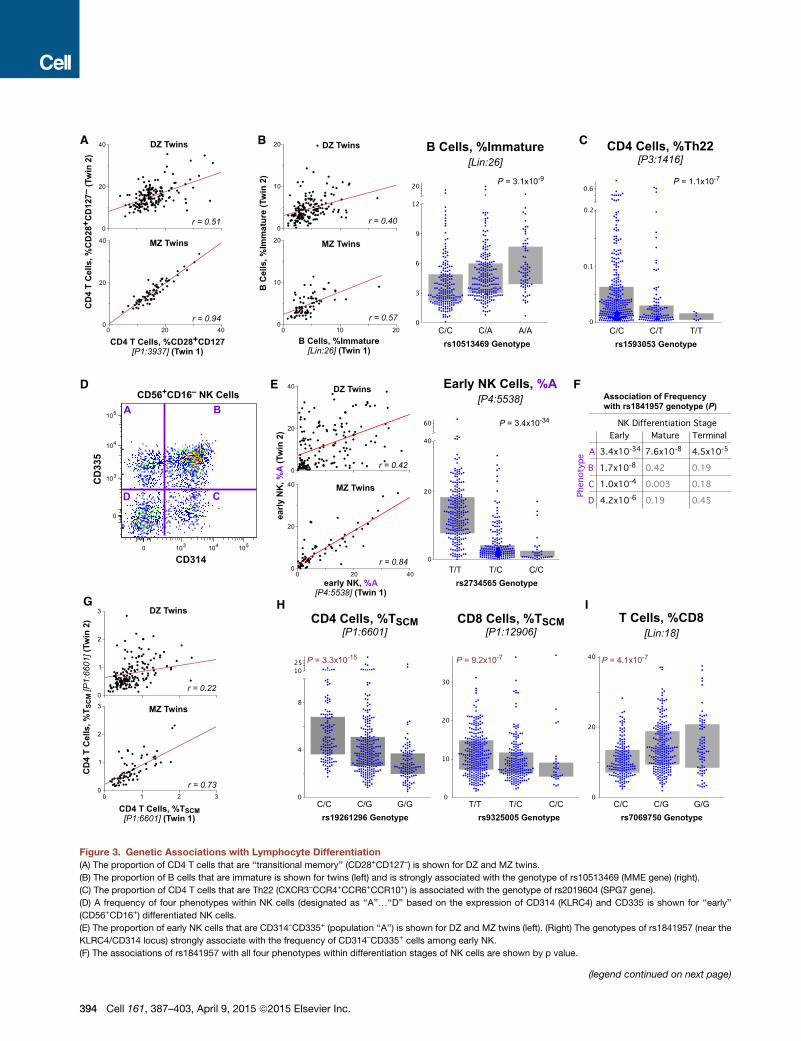
Figure 3. Genetic Associations with Lymphocyte Differentiation
(A) The proportion of CD4 T cells that are ‘‘transitional memory’’ (CD28+CD127–) is shown for DZ and MZ twins.
(B) The proportion of B cells that are immature is shown for twins (left) and is strongly associated with the genotype of rs10513469 (MME gene) (right).
(C) The proportion of CD4 T cells that are Th22 (CXCR3–CCR4+CCR6+CCR10+) is associated with the genotype of rs2019604 (SPG7 gene).
(D) A frequency of four phenotypes within NK cells (designated as ‘‘A’’.‘‘D’’ based on the expression of CD314 (KLRC4) and CD335 is shown for ‘‘early’’
(CD56+CD16+) differentiated NK cells.
(E) The proportion of early NK cells that are CD314–CD335+ (population ‘‘A’’) is shown for DZ and MZ twins (left). (Right) The genotypes of rs1841957 (near the
KLRC4/CD314 locus) strongly associate with the frequency of CD314–CD335+ cells among early NK.
(F) The associations of rs1841957 with all four phenotypes within differentiation stages of NK cells are shown by p value.
(legend continued on next page)
394 Cell 161, 387–403, April 9, 2015 ª2015 Elsevier Inc.

significant in candidate SNP, candidate gene, or genome-wide
association studies of complex and infectious diseases.
SNPs that were highly correlated variants (r2>0.8) with our sig-
nificant immune traits were also interrogated for overlap with re-
ported disease associations using the appropriate thresholds for
the number of tests. A number of gene variants significantly and
suggestively (p < 10�3) correlated with CSFs and SPELs have
been reported in associations of complex and infectious dis-
eases, as shown in Table 2. The different gene variants of
FCGR2A, associated with a range of myeloid and T cell pheno-
types in our data, were reported to be associated with increased
risk of a number of diseases, including inflammatory bowel dis-
ease, ulcerative colitis, SLE, Kawasaki disease, ankylosing-
spondylitis, and HIV progression (Table 2). An additional variant
of FCGR2A, rs10494359 (associated with P7:100 [CD64–CD274–
imDCs]), is closely correlated (in linkage disequilibrium) with
rs10494360 (r2 = 0.941) and has been associated with rheuma-
toid arthritis. Juvenile idiopathic arthritis and chronic lympho-
cytic leukemia susceptibility loci in the ACTA2/FAS region of
chromosome 10q23.31 were also associated with the frequency
of P1:6601 (CD4 TSCM) (p = 4.1 3 10�12; Table 2). The Behcet’s
disease susceptibility variant in the killer cell lectin-like receptors
gene region corresponded with the frequencies of P4:3551,
P4:4832, and P4:5538 (all three are CD314– subsets of NK cells).
The correlations of variants association with tuberculosis, ma-
laria, leprosy, HIV, and hepatitis B and C our immune traits are
presented in Table 2.
DISCUSSION
Understanding the fundamental principles of how the immune
system protects the host from infection yet also contributes to
autoimmunity and other disease pathogenesis is essential for
the development of novel diagnostics and medicines. There re-
mains a major gap in our understanding of genetic determinants
of a normal human immune system and its main coordinates
such as the frequency of immune cells and expression of rele-
vant proteins. Using 669 twins and the richest immunophenotyp-
ing performed to date, we investigated the genetic architecture
of immune traits. We describe multiple independent genetic var-
iants at several genetic loci explaining a substantial proportion
(up to 96%) of the genetic variation. We identify both pleiotropic
genetic loci that control multiple immune traits and single im-
mune traits under genetic influence by multiple loci. For certain
canonical immune traits, genetic control is exerted at the level
of immune cell-surface protein expression (i.e., a consequence
of promoter/enhancer or signaling mechanisms) rather than at
the level of cell subset frequency (i.e., homeostasis or differenti-
ation mechanisms). We further describe multiple genetic associ-
ations with common canonical immune traits related to leuko-
cyte lineage and differentiation of major immune cell subsets
such as B cells, T cells, and natural killer cells. Finally, we identify
genetic elements associated with both immune traits and auto-
(G) The proportion of CD4 T cells that are ‘‘stem cell memory’’ (TSCM: CD45RA+C
(H and I) The genotypes of rs7069750 (FAS gene) are associated with the proport
that are CD8.
Bars indicate interquartile ranges.
immune and infectious diseases. Providing the heritabilities of
thousands of cell subtypes plus a basis to uncover the genetic
architecture of the numerous gene-immune associations estab-
lishes this data set as an essential bioresource for researchers.
The remarkably strong associations we find for genetic traits
linked to disease illustrate the power of our approach by using
twins and optimized high-quality immune phenotyping.
Some limitations of our study should be noted: the cohort used
is all female, it is (for GWAS) a relatively limited sample size, and it
is relatively homogeneous in terms of environmental exposure.
The low numbers of genetic associations on chromosome 6
(the major histocompatibility region) is possibly explained by
the considerable complexity and polymorphism in this gene re-
gion, which would require larger sample sizes to obtain statisti-
cally significant genetic associations. With regard to immunolog-
ical traits, it should be noted that our discovery cohort ranges in
age from 41 to 77. It is possible that analysis of a younger cohort,
for which less environmental pressure on the immune system
has occurred, would reveal stronger associations; on the other
hand, it is likely that the greatest power to detect immune corre-
lates related to disease will come from measurements at a time
most proximal to the typical onset. Nevertheless, our success in
identifying a large number of genetic variants with genome-wide
significance validates our approach of focusing on well-defined
and curated immune phenotypes. It should be noted that
the 297 SNPs we report (Table S5) are those that attained
genome-wide significance (with a conservative correction for
multiple comparisons) in both the discovery and replication co-
horts. Many more associations are evident in the data set (e.g.,
Tables S2 andS3), which can serve to formulate new testable hy-
potheses and genetic studies.
An example of the power of the resource was in distinguishing
two important mechanisms that lead to differential representa-
tion of immune cell phenotypes (e.g., CD39+ CD4 T cells). The
first is homeostatic—i.e., mechanisms that control the recircula-
tion, proliferation, and elimination of a certain cell type in the
blood—a cellular mechanism expressed at thewhole-body level.
Such mechanisms, although unidentified, are known to exist for
regulating major subset numbers (such as CD4 T cell numbers).
A second, completely independent mechanism is the molecular
regulation of the protein expression at the cell level itself (e.g.,
promoter/enhancer variants). Thus, even in the presence of
intact homeostatic mechanisms regulating that cell type, a
reduction in the number of cells expressing a protein (perhaps
part of the defining phenotype) may be due to a specific pro-
moter variant that simply abrogates the expression of the
gene. Here, we show examples of both mechanisms.
An example of a major immune trait under genetic control is
the phenotype, but not frequency, of regulatory T (TREG) cells.
TREG cells are essential for maintenance of immune homeosta-
sis, and their dysregulation might lead to autoimmunity (Sakagu-
chi et al., 2010). A pleiotropic locus containing the ectonucleo-
side triphosphate diphosphohydrolase 1 (ENTPD1 and CD39)
D95+CD27+CD28+CD127+CD57–) is shown for DZ and MZ twins.
ion of CD4 and CD8 T cells that are TSCM, as well as the proportion of all T cells
Cell 161, 387–403, April 9, 2015 ª2015 Elsevier Inc. 395
A B
C
D
E F
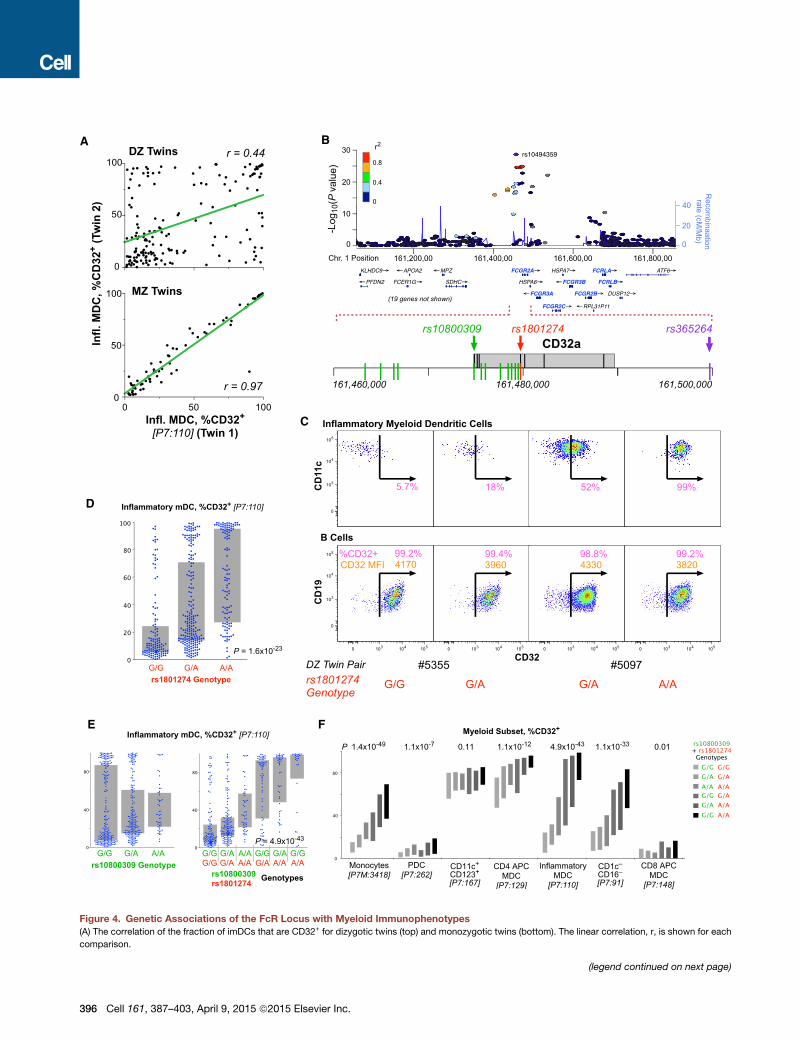
Figure 4. Genetic Associations of the FcR Locus with Myeloid Immunophenotypes
(A) The correlation of the fraction of imDCs that are CD32+ for dizygotic twins (top) and monozygotic twins (bottom). The linear correlation, r, is shown for each
comparison.
(legend continued on next page)
396 Cell 161, 387–403, April 9, 2015 ª2015 Elsevier Inc.
gene controls several phenotypic features of CD39+ TREG.
Although we confirm an apparent association of this gene locus
with the frequency of circulating CD39+ TREG (Orru et al., 2013),
we show here that this is a consequence solely of altered pheno-
type. Quantitative analysis of CD39 protein expression on the
cell surface demonstrates that the genetics of control of CD39+
TREG is exerted at the level of surface protein expression, rather
than cell frequency (homeostasis). This establishes a paradigm
for future studies of immune traits and points to the necessity
of including both cell frequency and cell protein expression ana-
lyses in immunogenetic studies of the human immune system.
We also describe the association of a genetic locus containing
the ecto-50-nucleotidase (NT5E and CD73) gene with a popula-
tion of CD73+ TREG. From a functional perspective, it is of interest
that both CD73 and CD39 are ectonucleotidases involved in the
generation of immunosuppressive adenosine that alters T cell
and NK cell activities (Deaglio et al., 2007). Thus, it appears
that the CD39 and CD73 adenosine immunosuppressive
pathway has been under evolutionary selection and might there-
fore be a critical determinant of functional TREG activity (Bastid
et al., 2013) and establishment of tissue homeostasis. Impor-
tantly, we conclude that there is no genetic control of the fre-
quency of TREG (i.e., CD127–CD25+ memory CD4 cells), but
rather, control is evinced at the level of their specific phenotype
and presumably function. Furthermore, the lack of a known dis-
ease association with this locus calls into question the impor-
tance of CD39 expression for TREG function.
We discovered several genetic associations with immune
traits relevant to lymphocyte lineage and differentiation. A ge-
netic locus containing the cell-surface death receptor FAS
(CD95) was associated with the frequency of circulating T stem
cell memory cells (TSCM). TSCM are a recently described infre-
quent and functionally important lymphocyte subset (Gattinoni
et al., 2011); these cells have a largely naive T cell phenotype
but are able to self-renew while displaying functional attributes
of memory cells. Genetic control at the level of CD95 suggests
a potential role of CD95 in the control of T stem cell homeostasis
for not only differentiation stages such as TSCM but total CD8 as
well (Figure 3). It further provides a possible link between human
autoimmune syndromes based on genetic CD95 deficiency
(Strasser et al., 2009) and TSCM.
A genetic locus within a cluster of genes referred to as the
‘‘NK complex’’ containing NKG2D (CD314 and KLRK1) was
associated with the frequency of a distinct population of
CD314–CD335+ ‘‘early’’ (CD56+CD16–) NK cells. The NKG2D
gene encodes for a C-type lectin protein preferentially expressed
in NK cells. It binds to a diverse family of stress-induced ligands
(B) Organization of the FcR locus of chromosome 1 showing the position of immu
rs1801274 and rs10800309 are the two that are most closely associated to susce
within the samples analyzed in our cohort.
(C) Sample expression profiles of CD32 on imDCs (top) and B cells (bottom). Show
SPEL (in orange). Two pairs of dizygotic twins discordant for the genotype at rs1
(D) The distribution of expression of CD32+ imDCs is shown by genotype at rs18
(E) The expression of CD32 on the imDCs is not significantly associated with the g
are clearly different by genotype. The combination of the genotype at rs10800309
imDC.
(F) The expression profile of CD32 on seven different myeloid populations is sho
interquartile range.
that include MHC class I chain-related A and B proteins (MICA
and MICB), essential for the activation of T cells and NK cells
(Raulet et al., 2013). These data establish an unexpected link be-
tween the genetic control of the frequency of a specific subset of
NK cells and a gene locus containingmajor genes with functional
relevance to NK cell activity and their activation by stressed
normal tissue cells or tumor cells.
One locus in chromosome1q23containingFCGR2A,FCGR2B,
and FCRLA was associated with multiple immune traits. FcGR
genes encode immunoglobulin Fc surface receptors found on
macrophages, dendritic cells, and neutrophils, as well as B and
NK cells, and are involved in the regulation of B cell antibody pro-
duction and phagocytosis of immune complexes. Themain asso-
ciated immune traitswere the frequencies of CD32+ inflammatory
dendritic cells and monocytes, as well as several T cell pheno-
types. Genetic variation in the FcGR gene locus is associated
withan increase in susceptibility to several autoimmuneand infec-
tious disease, including SLE, ankylosing spondylitis, HIV progres-
sion, and several other syndromes. Given the profound impact of
thisgene locusonparticular immunecell subsets, altered function
ofCD32+dendritic cells couldbekey to increasedsusceptibility to
these autoimmune and infectious diseases.
Indeed, our demonstration of an association between the
FCGR2A SNP and T cell phenotypes and/or inflammatory
myeloid cells (e.g., imDCs) provides a potential link between
this locus and autoimmune diseases with T cell etiology. This
coding SNP results in variants of the Fc receptor that have
different avidities for immunoglobulin and C-reactive protein;
consequently, much current research is aimed at understanding
the possible functional role of these alleles in autoimmunity.
However, our data suggest a different possibility with a more
proximal mechanistic link: that association is with a promoter/
enhancer SNP (in strong linkage disequilibrium with the coding
FCGR2A SNP) that modulates expression of the negative regu-
latory CD32b molecule on imDC, monocytes, and/or T cells.
In addition to the wide range of diseases associated with the
FcRG locus, further examples include a SNP within a genetic
locus associated with Behcet’s disease (Kirino et al., 2013) that
is in tight linkage disequilibrium with a SNP controlling the fre-
quency of CD314–CD335+ early NK cells. We also report that a
genetic locus containing FAS and associated with Juvenile idio-
pathic arthritis (Hinks et al., 2013) is also associated with func-
tionally important CD8+ T stem memory cells.
These findings illustrate a key value of our database and
approach: the identification of candidate immune traits associ-
atedwith genetic loci of relevance to autoimmunity and infection.
In summary, using one of the most comprehensive immune
nologically relevant genes. The positions of three SNPs are highlighted in color;
ptibility to SLE. SNPs shown in green were in complete linkage disequilibrium
n are the fraction of cells that are CD32+ (in pink) and, for the B cells, the CD32
801274 are shown.
01274.
enotype at rs10800309 by standard ANOVA (p = ns); however, the distributions
and rs1801274 provides a dramatic distinction for the expression of CD32 on
wn, broken down by the combined genotype of the two SNPs. Bars indicate
Cell 161, 387–403, April 9, 2015 ª2015 Elsevier Inc. 397
A
C
E F
D
B
(legend on next page)
398 Cell 161, 387–403, April 9, 2015 ª2015 Elsevier Inc.
phenotyping efforts to date, we identified numerous genetic loci
controlling key parameters of a normal human immune system.
This comprehensive human immune phenotyping bioresource
will allow the identification of critical immune phenotypes
associated with common autoimmune and infectious diseases,
ultimately leading to accelerated discovery of mechanisms of
disease and response to therapy.
EXPERIMENTAL PROCEDURES
Samples
This studywas approved by theNIAID (NIH) IRB and London-Westminster NHS
Research Ethics Committee; all participants provided informed consent. The
discovery stage comprised 497 female participants from the UK Adult Twin
Register, TwinsUK, with full genotyping data on 460 subjects. The TwinsUK
cohort is described in detail in (Moayyeri et al., 2012). Briefly, TwinsUK is a large
cohort of twins historically developed to study the heritability and genetics of
diseases with a higher prevalence among women. The study population is
not enriched for any particular disease or trait and is representative of theBritish
general population of Caucasian ethnicity. Selected twins were all female with
an age range of 41–77 (mean 61.4), and by self-report, 100% Caucasian with
most being UK ancestry. From the subsequent genotype data, we excluded
a few individuals showing evidence of non-European ancestry as assessed
by principal component analysis comparison with HapMap3.
The replication stage included a further unrelated 172 TwinsUK participants
with whole-genome genotyping data on 169. The samples for the discovery
samples were selected to match the characteristics (age and gender) of the
discovery data set. For this reason, the replication cohort included only Cauca-
sian women with an age range of 32–83 (mean 58.2). All subjects were nomi-
nally healthy at the time of sample collection.
A total of 746 PBMC vials were analyzed: PBMC from the 669 twin speci-
mens (plus 4 replicates) and 30 healthy controls from the US (two vials of
PBMC from blood drawn six months apart were analyzed for 29 subjects, a
replicate vial of PBMC from one of the two blood draws for 14 (of the 29),
and one vial only for 1 subject). The samples in each stage were ordered
such that twin or longitudinal control samples were analyzed in the same
experimental run (each comprising 15–30 vials), whereas replicate control
samples were analyzed in different experimental runs. Staining and data ana-
lyses were otherwise performed blinded to identity.
Immunophenotyping
See Extended Experimental Procedures for cell processing details.
Flow Cytometry and Data Analysis
Cells were analyzed in 96-well plate format on an 18-color LSR (BD Biosci-
ences) using an HTS unit. Each run on the flow cytometer was accompanied
by a set of compensation controls of antibody-stained IgG kappa beads (BD
Biosciences). Data were evaluated on FlowJo software v9.7 (FlowJo, LLC).
Post-processing of data and visualizations were done with JMP v10 (SAS)
and SPICE v5.3 (NIAID; Roederer et al., 2011).
Gating
A graphic depicting the fluorescence distribution of all samples in the discov-
ery cohort is shown in Figure S1. Figures S2 and S3 illustrate the gating hier-
archy for a single sample. The Extended Experimental Procedures describe
the generation of the �80,000 gates analyzed.
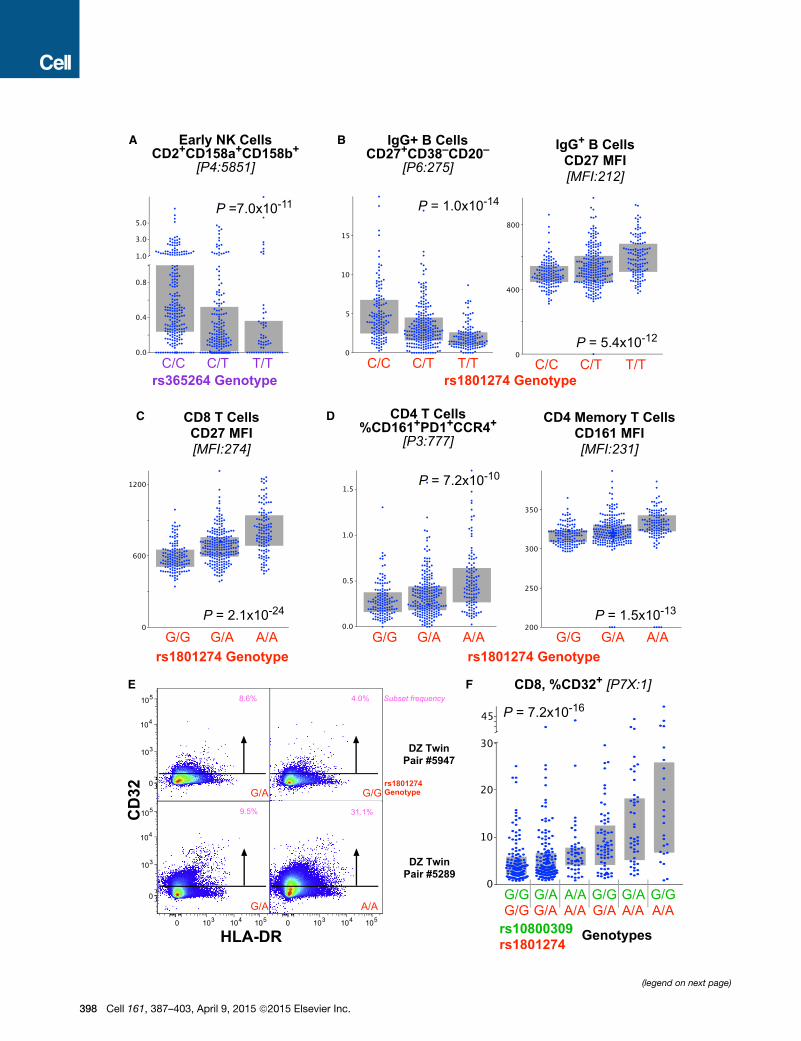
Figure 5. Genetic Associations of the FcR Locus with Lymphoid Immu
(A) The genotype of rs365264 (close to CD16a on chromosome 1) is strongly ass
(B) The genotype of rs1801274 is associated with the frequency of memory IgG+
that, for this case, a lower frequency of the subset (left) is associated with highe
(C) Similarly, the genotype of rs1801274 is strongly associated with the cell-surfa
(D) The genotype of rs1801274 is strongly associated with the cell-surface
CD161+PD1+CCR4+.
(E) CD8 T cells express low levels of CD32 depending on genotype as shown by
(F) The fraction of CD8 T cells that express CD32 is strongly associated with the
Bars indicate interquartile ranges.
For the discovery cohort, there were 20 experimental runs for 543 samples
(501 twin specimens from 497 subjects and 42 US control specimens from 14
subjects). Within each run, uniform scatter gating was used. Each sample was
gated on time (to eliminate spurious events from beginning or end of sample
run); this gate could vary by sample. With two major exceptions, all samples
received the same fluorescence gating, After the third run, we chose to replace
the CD4 reagent in panels 1, 2, and 5 due to poor performance; this necessi-
tated a different CD4 gating for those samples. Similarly, the reagents in the
‘‘dump’’ channel of panel 7 were modified after 6 runs.
For the replication cohort, there were 8 experimental runs for 203 samples
(172 twin specimens from 172 subjects and 31 US control specimens from
16 subjects). All analysis procedures were identical to the discovery cohort.
Minor modifications to the panels were necessitated by unavailability of the
same lots of reagents, but these did not impact enumeration of subsets. Spec-
imen processing for the replication cohort was initiated after final analysis of
the discovery cohort.
Genotyping
Genotyping was conducted with a combination of Illumina arrays
(HumanHap300 and HumanHap610Q) (Richards et al., 2008; Soranzo
et al., 2009). The Illuminus calling algorithm (Teo et al., 2007) was used to
assign genotypes. No calls were assigned if an individual’s most likely geno-
type was called with less than a posterior probability threshold of 0.95. Vali-
dation of pooling was achieved via a visual inspection of 100 random, shared
SNPs for overt batch effects. Finally, intensity cluster plots of significant
SNPs were visually inspected for over-dispersion, biased no calling, and/or
erroneous genotype assignment. SNPs exhibiting any of these characteris-
tics were discarded. Stringent QC measures were performed on the geno-
types prior to data analysis. The sample exclusion criteria were: (1) sample
call rate < 98%, (2) heterozygosity across all SNPs R 2 SD from the sample
mean; (3) evidence of non-European ancestry as assessed by principle
component analysis comparison with HapMap3 populations; (4) observed
pairwise identity by descent (IBD) probabilities suggestive of sample identity
errors; (5) misclassified monozygotic and dizygotic twins were corrected
based on IBD probabilities. The exclusion criteria for SNPs were: (1)
Hardy-Weinberg equilibrium (HWE) p value < 10�6, assessed in a set of un-
related samples; (2) minor allele frequency (MAF) < 1%, assessed in a set of
unrelated samples; (3) SNP call rate < 97% (SNPs with MAF R 5%) or < 99%
(for 1% % MAF < 5%). Alleles of both data sets from the genotyping
arrays were aligned to HapMap2 or HapMap3 forward strand alleles.
Imputation was performed using the IMPUTE v2 software package (Howie
et al., 2009). After imputation of the 2,986,407 SNPs available for analysis,
1,419,558 SNPs passed further QC (call rate R 95%, MAF R 0.05,
HWE R 10�4) and were used for analysis.
Statistical Analyses
Selection of Subsets for Heritability and GWAS Analysis
Full details are in the Extended Experimental Procedures. In brief, we elimi-
nated CSFs with frequencies below 0.1% or above 99% (Figure S4A). From
these, we selected�200 for in-depth analysis based on heritability or descrip-
tion in the literature (‘‘canonical’’).
Genome-wide Association Analysis
Because of relatedness in the TwinsUK cohort, we utilized the GenABEL soft-
ware package (Aulchenko et al., 2007), which is designed for GWAS analysis of
family-based data by incorporating pairwise kinship matrix calculated using
nophenotypes
ociated CD56+CD16– (‘‘early’’) NK cells that are CD2+CD158a+CD158b+.
B cells that are CD27+CD38–CD20– as well as the fraction of CD27+ cells. Note
r protein expression (right).
ce expression of CD27 on CD8 T cells.
expression of CD161 on CD4 T cells, as well as CD4 T cells that are
flow cytometry.
rs10800309:rs1801274 diplotype (see Figure 4).
Cell 161, 387–403, April 9, 2015 ª2015 Elsevier Inc. 399

Table 2. Overlapping Associations with Complex Diseases
Immune Trait Association Disease Association
Gene (Chr) Marker Trait ID Trait Phenotype Beta p Value Reported SNP Disease Best P Reference
FCGR2A (1) rs1801274 P7:110 iMDC: %CD32+ 0.2 1.6E�23 rs1801274 (A) IBD 2.1E�38 (Jostins et al., 2012)
MFI:189 CD27 on IgA+ B 0.13 6.5E�11 Kawasaki disease 7.4E�11 (Khor et al., 2011)
MFI:212 CD27 on IgG+ B 0.14 5.4E�12 ulcerative colitis 2.2E�20 (Anderson et al., 2011)
MFI:231 CD161 on CD4 T 0.13 2.6E�11 ankylosing-spondylitis 1.4E�09 (Cortes et al., 2013)
MFI:504 CD27 on CD4 T 0.15 5.4E�14 SLE 6.8E�07 (Harley et al., 2008)
MFI:552 CD27 on CD8 T 0.19 1.3E�21 HIV progression 1.0E�04* (Forthal et al., 2007)
P7:224 CD1c+ mDC: %CD32 0.12 4.4E�09 lymphoma 0.006* (Wang et al., 2006)
malaria 0.013* (Sinha et al., 2008)
FCGR2A (1) rs10494359 P7:110 iMDC: %CD32+ 0.34 2.5E�29 rs10494360 (r2 = 0. 94) rheumatoid arthritis 9.3E�05* (Eyre et al., 2012)
ZNF804A (2) rs6755404 P2:3367 Effector CD4: CD127�PD1� 0.09 3.8E�04 rs6755404 (A) malaria 1.2E�06 (Band et al., 2013)
MIR216B (2) rs6751715 P3:5372 CD8 T: %CXCR3�R4+R6+R10� �0.09 1.5E�05 rs6751715 HIV 1.1E�06 (Fellay et al., 2009)
P3:5661 CD8 T: %CD161+ �0.07 5.1E�04
P6:197 IgA+ B: %CD27�CD38� 0.07 7.0E�04
P3:5658 CD8 T: %CD161+PD1� �0.07 7.8E�04
LOC100505836 (3) rs2593321 Lin:19 %NKT 0.08 5.5E�04 rs2593321 HIV-1 control 7.7E�06 (Pelak et al., 2010)
MICA (6) rs4418214 P6:112 IgE+B: %CD20�CD27�CD38+ 0.12 7.6E�04 rs4418214 (C) HIV-1 control 1.4E�34 (Pereyra et al., 2010)
BTNL2 (6) rs3817963 P2:12609 CD8 T: %CD25+CD38+45RO+ �0.08 3.5E�04 rs3817963 (A) hepatitis C liver cirrhosis 1.3E�08 (Urabe et al., 2013)
P2:10486 CD8 T: %CD25+CD38+ �0.08 4.1E�04 (Urabe et al., 2013)
HLA-DQB1 (6) rs2856718 P2:12609 CD8 T: %CD25+CD38+45RO+ �0.08 5.3E�04 rs2856718 (A) hepatitis B 4.0E�37 (Mbarek et al., 2011)
P2:10486 CD8 T: %CD25+CD38+ �0.07 7.8E�04
EHMT2 (6) rs652888 MFI:578 CD3 on CD8 T �0.08 5.7E�04 rs652888 chronic hepatitis B 7.1E�13 (Kim et al., 2013)
MTCO3P1 - HLA-
DQA2 (62)
rs4273729 P2:10486 CD8 T: %CD25+CD38+ 0.08 1.4E�04 rs4273729 chronic hepatitis C 1.7E�16 (Duggal et al., 2013)
P2:12609 CD8 T: %CD25+CD38+45RO+ 0.08 2.3E�04
ADGB (6) rs2275606 P1:12906 CD8 T: %TSCM 0.13 6.3E�04 rs2275606 (A) leprosy 3.9E�14 (Zhang et al., 2011)
ABO (9) rs8176722 MFI:1 CD123 on mDC �0.14 1.4E�04 rs8176722 (A) malaria 8.9E�10 (Band et al., 2013)
ACTA2, FAS (10) rs7069750 P1:6601 CD8 T: %TSCM �0.14 4.1E�12 rs7069750 (C) juvenile idiopathic arthritis 2.9E�08 (Hinks et al., 2013)
rs2147420 (r2 = 1) CLL 3.1E�13 (Berndt et al., 2013)
KLRC4-KLRK1 (12) rs1049172 P4:3551 NK: %CD314�CD158a+ �0.13 8.8E�09 rs2617170 (r2 = 0.922) Behcet’s disease 1.3E�09 (Kirino et al., 2013)
P4:4832 NK: %CD314�CCR7� �0.23 7.6E�22
P4:5538 NK: %CD314�CD335+ �0.27 1.4E�30
MMP16 (8) rs160441 P4:3551 NK: %CD314�CD158a+ �0.08 2.3E�05 rs160441 tuberculosis 8.4E�06 (Thye et al., 2010)
ARHGAP20 (11) rs1469170 P4:3551 NK: %CD314�CD158a+ �0.08 5.6E�04 rs1469170 (A) malaria 8.0E�08 (Band et al., 2013)
Association results from the discovery cohort immune trait analyses are reported in the first six columns. The trait ID is fully described in Table S2. The disease-associated variant, pathology, the
disease-associated SNP’s best-reported p value are indicated in the 7th–9th columns, respectively. The risk alleles presented correlate with increased disease susceptibility and the r2 between
disease SNP and immune trait, if different, are reported in parentheses after the reported SNP. *Disease association is significant with candidate SNP method/gene approach.
400
Cell1
61,387–403,April9
,2015ª2015ElsevierInc.
genotyping data in the polygenic model to correct relatedness and hidden
population stratification. The score test implemented in the software was
used to test the association between a given SNP and the trait. Additional qual-
ity control was conducted on the association results: minor allele frequency
(MAF) > 0.1, Hardy-Weinberg equilibrium < 10�8, SNP call rate > 90%. For
our results, we used a genome-wide significance threshold of p < 3.3 3
10�10. This threshold represents a standard genome-wide significance
threshold (p < 53 10�8) further adjusted for 151 independent tests (the number
of traits analyzed for GWAS in the discovery cohort). Because there is a high
intercorrelation among some of the 151 analyzed traits, this is a very conser-
vative approach and ensures the robustness of our findings. Genome-wide
validations were also performed on normalized residuals (after corrections
for age), with GenABEL taking into account family structure in the model.
The validation p value threshold was set to p < 0.05.
Results from the genome-wide analyses of all the analyzed traits for both
the discovery and the replication cohorts were meta-analyzed. Fixed effects
inverse-variance weighted meta-analyses were conducted using METAL
(Willer et al., 2010), with significance evaluated at p < 5 3 10�8.
Finally, correlation against the FCRG ‘‘diplotype’’ shown in Figures 4 and S8
was done using JMP; ANOVA p values without correction for family structure
are reported.
Identifying Traits Correlated with SNPs
Once we had identified significant associations between the selected 151
traits and all SNPs based on standard analyses, we looked for pleiotropic
effects of those SNPs. Approximately 1,200 SNPs from about 18 unlinked
loci were correlated against all traits.
To correct for multiple comparisons, we evaluated the covariance among all
traits. As shown in Figure S4B, there are less than 1,800 traits that show a
covariance less than 0.7. Thus, Bonferroni correction sets a significance
threshold of p < 2.83 10�5. In our analyses, which covered about 20 unlinked
loci, we used a more conservative threshold, requiring a Wilcoxon rank asso-
ciation of trait values with SNP genotype to be significant if p < 10�7.
GWAS Catalog Look-Ups
In order to ascertain whether the variants from the associations of the immune
cell subsets analyses overlapped with significant disease associations,
the GWAS catalog (http://www.genome.gov/gwastudies/), Immunobase
(http://immunobase.org/page/Welcome/display), and SNPedia (http://www.
snpedia.com) repositories were used. Gene regions and variants reaching
genome-wide significance were searched on these repositories and overlap-
ping associations or correlations with proxy SNPs or those in strong LD are
reported in Table 2.
BioData Repository
Raw and summary data are available for downloading and analysis. Genotype
data are available upon request to the authors. See Extended Experimental
Procedures for detailed downloading instructions.
SUPPLEMENTAL INFORMATION
Supplemental Information includes Extended Experimental Procedures, eight
figures, and six tables and can be found with this article online at http://dx.doi.
org/10.1016/j.cell.2015.02.046.
AUTHOR CONTRIBUTIONS
M.R., T.D.S., and F.O.N. designed and supervised the study; I.T., L.N., M.T.B.,
and F.V. processed samples, which were coordinated by P.D.M.; M.H.B.,
Y.M., P.C., and P.D.M. performed experimental work; M.R., L.Q., M.M., and
M.H.B. performed primary data analysis; M.R., L.Q., M.M., and C.M. per-
formed statistical analyses; and M.R., L.Q., M.M., P.D.M., T.D.S., and F.O.N.
wrote the manuscript.
ACKNOWLEDGMENTS
This work was supported by the Vaccine Research Center (NIAID, NIH) intra-
mural research program and by the Department of Health via the National Insti-
tute for Health Research (NIHR) comprehensive Biomedical Research Centre
award to Guy’s & St. Thomas’ NHS Foundation Trust in partnership with King’s
College London, King’s College Hospital NHS Foundation (guysbrc-2012-1)
Trust, and Dunhill Medical Trust. TwinsUK is also supported by the Wellcome
Trust, and TDS is an ERC Advanced Researcher. We wish to thank Kaimei
Song, Steve Perfetto, Richard Nguyen, LyndaMyles, Gabriela Surdulescu, Dy-
lan Hodgkiss, and Ayrun Nessa for technical help with the samples, as well as
the TwinsUK volunteers for participation.
Received: October 9, 2014
Revised: December 22, 2014
Accepted: February 4, 2015
Published: March 12, 2015
REFERENCES
Ahmadi, K.R., Hall, M.A., Norman, P., Vaughan, R.W., Snieder, H., Spector,
T.D., and Lanchbury, J.S. (2001). Genetic determinism in the relationship be-
tween human CD4+ and CD8+ T lymphocyte populations? Genes Immun. 2,
381–387.
Amadori, A., Zamarchi, R., De Silvestro, G., Forza, G., Cavatton, G., Danieli,
G.A., Clementi, M., and Chieco-Bianchi, L. (1995). Genetic control of the
CD4/CD8 T-cell ratio in humans. Nat. Med. 1, 1279–1283.
Anderson, C.A., Boucher, G., Lees, C.W., Franke, A., D’Amato, M., Taylor,
K.D., Lee, J.C., Goyette, P., Imielinski, M., Latiano, A., et al. (2011). Meta-anal-
ysis identifies 29 additional ulcerative colitis risk loci, increasing the number of
confirmed associations to 47. Nat. Genet. 43, 246–252.
Antonioli, L., Pacher, P., Vizi, E.S., and Hasko, G. (2013). CD39 and CD73 in
immunity and inflammation. Trends Mol. Med. 19, 355–367.
Aulchenko, Y.S., Ripke, S., Isaacs, A., and van Duijn, C.M. (2007). GenABEL:
an R library for genome-wide association analysis. Bioinformatics 23, 1294–
1296.
Band, G., Le, Q.S., Jostins, L., Pirinen, M., Kivinen, K., Jallow, M., Sisay-Joof,
F., Bojang, K., Pinder, M., Sirugo, G., et al.; Malaria Genomic Epidemiology
Network (2013). Imputation-based meta-analysis of severe malaria in three
African populations. PLoS Genet. 9, e1003509.
Bastid, J., Cottalorda-Regairaz, A., Alberici, G., Bonnefoy, N., Eliaou, J.F., and
Bensussan, A. (2013). ENTPD1/CD39 is a promising therapeutic target in
oncology. Oncogene 32, 1743–1751.
Berndt, S.I., Skibola, C.F., Joseph, V., Camp, N.J., Nieters, A., Wang, Z.,
Cozen, W., Monnereau, A., Wang, S.S., Kelly, R.S., et al. (2013). Genome-
wide association study identifies multiple risk loci for chronic lymphocytic
leukemia. Nat. Genet. 45, 868–876.
Borsellino, G., Kleinewietfeld, M., Di Mitri, D., Sternjak, A., Diamantini, A., Gio-
metto, R., Hopner, S., Centonze, D., Bernardi, G., Dell’Acqua, M.L., et al.
(2007). Expression of ectonucleotidase CD39 by Foxp3+ Treg cells: hydrolysis
of extracellular ATP and immune suppression. Blood 110, 1225–1232.
Casanova, J.L., and Abel, L. (2004). The human model: a genetic dissection of
immunity to infection in natural conditions. Nat. Rev. Immunol. 4, 55–66.
Clementi, M., Forabosco, P., Amadori, A., Zamarchi, R., De Silvestro, G., Di
Gianantonio, E., Chieco-Bianchi, L., and Tenconi, R. (1999). CD4 and CD8 T
lymphocyte inheritance. Evidence for major autosomal recessive genes.
Hum. Genet. 105, 337–342.
Cortes, A., Hadler, J., Pointon, J.P., Robinson, P.C., Karaderi, T., Leo, P., Cre-
min, K., Pryce, K., Harris, J., Lee, S., et al.; International Genetics of Ankylosing
Spondylitis Consortium (IGAS); Australo-Anglo-American Spondyloarthritis
Consortium (TASC); Groupe Francaise d’Etude Genetique des Spondylar-
thrites (GFEGS); Nord-Trøndelag Health Study (HUNT); Spondyloarthritis
Research Consortium of Canada (SPARCC); Wellcome Trust Case Control
Consortium 2 (WTCCC2) (2013). Identification ofmultiple risk variants for anky-
losing spondylitis through high-density genotyping of immune-related loci.
Nat. Genet. 45, 730–738.
Cotsapas, C., and Hafler, D.A. (2013). Immune-mediated disease genetics: the
shared basis of pathogenesis. Trends Immunol. 34, 22–26.
Cell 161, 387–403, April 9, 2015 ª2015 Elsevier Inc. 401

Damoiseaux, J.G., Cautain, B., Bernard, I., Mas, M., van Breda Vriesman, P.J.,
Druet, P., Fournie, G., and Saoudi, A. (1999). A dominant role for the thymus
and MHC genes in determining the peripheral CD4/CD8 T cell ratio in the
rat. J. Immunol. 163, 2983–2989.
Deaglio, S., Dwyer, K.M., Gao, W., Friedman, D., Usheva, A., Erat, A., Chen,
J.F., Enjyoji, K., Linden, J., Oukka,M., et al. (2007). Adenosine generation cata-
lyzed by CD39 and CD73 expressed on regulatory T cells mediates immune
suppression. J. Exp. Med. 204, 1257–1265.
Duggal, P., Thio, C.L., Wojcik, G.L., Goedert, J.J., Mangia, A., Latanich, R.,
Kim, A.Y., Lauer, G.M., Chung, R.T., Peters, M.G., et al. (2013). Genome-
wide association study of spontaneous resolution of hepatitis C virus infection:
data from multiple cohorts. Ann. Intern. Med. 158, 235–245.
Evans, D.M., Frazer, I.H., and Martin, N.G. (1999). Genetic and environmental
causes of variation in basal levels of blood cells. Twin Res. 2, 250–257.
Eyre, S., Bowes, J., Diogo, D., Lee, A., Barton, A., Martin, P., Zhernakova, A.,
Stahl, E., Viatte, S., McAllister, K., et al.; Biologics in Rheumatoid Arthritis
Genetics and Genomics Study Syndicate; Wellcome Trust Case Control Con-
sortium (2012). High-density genetic mapping identifies new susceptibility loci
for rheumatoid arthritis. Nat. Genet. 44, 1336–1340.
Fellay, J., Ge, D., Shianna, K.V., Colombo, S., Ledergerber, B., Cirulli, E.T.,
Urban, T.J., Zhang, K., Gumbs, C.E., Smith, J.P., et al.; NIAID Center for
HIV/AIDS Vaccine Immunology (CHAVI) (2009). Common genetic variation
and the control of HIV-1 in humans. PLoS Genet. 5, e1000791.
Ferreira, M.A., Mangino, M., Brumme, C.J., Zhao, Z.Z., Medland, S.E., Wright,
M.J., Nyholt, D.R., Gordon, S., Campbell, M., McEvoy, B.P., et al.; Interna-
tional HIV Controllers Study (2010). Quantitative trait loci for CD4:CD8 lympho-
cyte ratio are associated with risk of type 1 diabetes and HIV-1 immune
control. Am. J. Hum. Genet. 86, 88–92.
Forthal, D.N., Landucci, G., Bream, J., Jacobson, L.P., Phan, T.B., and Mon-
toya, B. (2007). FcgammaRIIa genotype predicts progression of HIV infection.
J. Immunol. 179, 7916–7923.
Gattinoni, L., Lugli, E., Ji, Y., Pos, Z., Paulos, C.M., Quigley, M.F., Almeida,
J.R., Gostick, E., Yu, Z., Carpenito, C., et al. (2011). A human memory T cell
subset with stem cell-like properties. Nat. Med. 17, 1290–1297.
Hall, M.A., Ahmadi, K.R., Norman, P., Snieder, H., MacGregor, A.J., Vaughan,
R.W., Spector, T.D., and Lanchbury, J.S. (2000). Genetic influence on periph-
eral blood T lymphocyte levels. Genes Immun. 1, 423–427.
Harley, J.B., Alarcon-Riquelme, M.E., Criswell, L.A., Jacob, C.O., Kimberly,
R.P., Moser, K.L., Tsao, B.P., Vyse, T.J., Langefeld, C.D., Nath, S.K., et al.;
International Consortium for Systemic Lupus Erythematosus Genetics
(SLEGEN) (2008). Genome-wide association scan in women with systemic
lupus erythematosus identifies susceptibility variants in ITGAM, PXK,
KIAA1542 and other loci. Nat. Genet. 40, 204–210.
Hinks, A., Cobb, J., Marion, M.C., Prahalad, S., Sudman, M., Bowes, J., Mar-
tin, P., Comeau, M.E., Sajuthi, S., Andrews, R., et al.; Boston Children’s JIA
Registry; British Society of Paediatric and Adolescent Rheumatology (BSPAR)
Study Group; Childhood Arthritis Prospective Study (CAPS); Childhood
Arthritis Response to Medication Study (CHARMS); German Society for Pedi-
atric Rheumatology (GKJR); JIA Gene Expression Study; NIAMS JIA Genetic
Registry; TREAT Study; United Kingdom Juvenile Idiopathic Arthritis Genetics
Consortium (UKJIAGC) (2013). Dense genotyping of immune-related disease
regions identifies 14 new susceptibility loci for juvenile idiopathic arthritis.
Nat. Genet. 45, 664–669.
Howie, B.N., Donnelly, P., and Marchini, J. (2009). A flexible and accurate ge-
notype imputationmethod for the next generation of genome-wide association
studies. PLoS Genet. 5, e1000529.
Jostins, L., Ripke, S., Weersma, R.K., Duerr, R.H., McGovern, D.P., Hui, K.Y.,
Lee, J.C., Schumm, L.P., Sharma, Y., Anderson, C.A., et al.; International IBD
Genetics Consortium (IIBDGC) (2012). Host-microbe interactions have shaped
the genetic architecture of inflammatory bowel disease. Nature 491, 119–124.
Khor, C.C., Davila, S., Breunis, W.B., Lee, Y.C., Shimizu, C., Wright, V.J.,
Yeung, R.S., Tan, D.E., Sim, K.S., Wang, J.J., et al.; Hong Kong–Shanghai Ka-
wasaki Disease Genetics Consortium; Korean Kawasaki Disease Genetics
Consortium; Taiwan Kawasaki Disease Genetics Consortium; International
402 Cell 161, 387–403, April 9, 2015 ª2015 Elsevier Inc.
Kawasaki Disease Genetics Consortium; US Kawasaki Disease Genetics Con-
sortium; Blue Mountains Eye Study (2011). Genome-wide association study
identifies FCGR2A as a susceptibility locus for Kawasaki disease. Nat. Genet.
43, 1241–1246.
Kim, Y.J., Kim, H.Y., Lee, J.H., Yu, S.J., Yoon, J.H., Lee, H.S., Kim, C.Y.,
Cheong, J.Y., Cho, S.W., Park, N.H., et al. (2013). A genome-wide association
study identified new variants associated with the risk of chronic hepatitis B.
Hum. Mol. Genet. 22, 4233–4238.
Kirino, Y., Bertsias, G., Ishigatsubo, Y., Mizuki, N., Tugal-Tutkun, I., Seyahi, E.,
Ozyazgan, Y., Sacli, F.S., Erer, B., Inoko, H., et al. (2013). Genome-wide asso-
ciation analysis identifies new susceptibility loci for Behcet’s disease and epis-
tasis between HLA-B*51 and ERAP1. Nat. Genet. 45, 202–207.
Kraal, G., Weissman, I.L., and Butcher, E.C. (1983). Genetic control of T-cell
subset representation in inbred mice. Immunogenetics 18, 585–592.
Kyvic, K. (2000). Generalisability and assumptions of twin studies. In Advances
in Twin and Sib-Pair Analysis, T.D. Spector, H. Sneider, and A.J. MacGregor,
eds. (London: Greenwich Medical Media), pp. 67–77.
Lugli, E., Dominguez, M.H., Gattinoni, L., Chattopadhyay, P.K., Bolton, D.L.,
Song, K., Klatt, N.R., Brenchley, J.M., Vaccari, M., Gostick, E., et al. (2013).
Superior T memory stem cell persistence supports long-lived T cell memory.
J. Clin. Invest. 123, 594–599.
Mahnke, Y.D., Beddall, M.H., and Roederer, M. (2012). OMIP-013: differentia-
tion of human T-cells. Cytometry A 81, 935–936.
Mahnke, Y.D., Beddall, M.H., and Roederer, M. (2013a). OMIP-015: human
regulatory and activated T-cells without intracellular staining. Cytometry A
83, 179–181.
Mahnke, Y.D., Beddall, M.H., and Roederer, M. (2013b). OMIP-017: human
CD4(+) helper T-cell subsets including follicular helper cells. Cytometry A 83,
439–440.
Mahnke, Y.D., Beddall, M.H., and Roederer, M. (2013c). OMIP-019:
quantification of human gdT-cells, iNKT-cells, and hematopoietic precursors.
Cytometry A 83, 676–678.
Mbarek, H., Ochi, H., Urabe, Y., Kumar, V., Kubo, M., Hosono, N., Takahashi,
A., Kamatani, Y., Miki, D., Abe, H., et al. (2011). A genome-wide association
study of chronic hepatitis B identified novel risk locus in a Japanese popula-
tion. Hum. Mol. Genet. 20, 3884–3892.
Moayyeri, A., Hammond, C.J., Hart, D.J., and Spector, T.D. (2012). Effects of
age on genetic influence on bone loss over 17 years in women: the Healthy
Ageing Twin Study (HATS). J. Bone Miner. Res. 27, 2170–2178.
Nalls, M.A., Couper, D.J., Tanaka, T., van Rooij, F.J., Chen, M.H., Smith, A.V.,
Toniolo, D., Zakai, N.A., Yang, Q., Greinacher, A., et al. (2011). Multiple loci are
associated with white blood cell phenotypes. PLoS Genet. 7, e1002113.
Neale, M., and Cardon, L. (1992). Methodology for Genetic Studies of Twins
and Families (Dordrecht: Kluwer Academic Publishers).
Okada, Y., Hirota, T., Kamatani, Y., Takahashi, A., Ohmiya, H., Kumasaka, N.,
Higasa, K., Yamaguchi-Kabata, Y., Hosono, N., Nalls, M.A., et al. (2011).
Identification of nine novel loci associated with white blood cell subtypes in
a Japanese population. PLoS Genet. 7, e1002067.
Orru, V., Steri, M., Sole, G., Sidore, C., Virdis, F., Dei, M., Lai, S., Zoledziewska,
M., Busonero, F., Mulas, A., et al. (2013). Genetic variants regulating immune
cell levels in health and disease. Cell 155, 242–256.
Parkes, M., Cortes, A., van Heel, D.A., and Brown, M.A. (2013). Genetic
insights into common pathways and complex relationships among immune-
mediated diseases. Nat. Rev. Genet. 14, 661–673.
Pelak, K., Goldstein, D.B., Walley, N.M., Fellay, J., Ge, D., Shianna, K.V.,
Gumbs, C., Gao, X., Maia, J.M., Cronin, K.D., et al.; Infectious Disease Clinical
Research Program HIV Working Group; National Institute of Allergy and Infec-
tious Diseases Center for HIV/AIDS Vaccine Immunology (CHAVI) (2010). Host
determinants of HIV-1 control in African Americans. J. Infect. Dis. 201, 1141–
1149.
Pereyra, F., Jia, X., McLaren, P.J., Telenti, A., de Bakker, P.I., Walker, B.D.,
Ripke, S., Brumme, C.J., Pulit, S.L., Carrington, M., et al. (2010). The major

genetic determinants of HIV-1 control affect HLA class I peptide presentation.
Science 330, 1551–1557.
Raj, T., Rothamel, K., Mostafavi, S., Ye, C., Lee, M.N., Replogle, J.M., Feng, T.,
Lee, M., Asinovski, N., Frohlich, I., et al. (2014). Polarization of the effects of
autoimmune and neurodegenerative risk alleles in leukocytes. Science 344,
519–523.
Raulet, D.H., Gasser, S., Gowen, B.G., Deng, W., and Jung, H. (2013). Regu-
lation of ligands for the NKG2D activating receptor. Annu. Rev. Immunol. 31,
413–441.
Richards, J.B., Rivadeneira, F., Inouye, M., Pastinen, T.M., Soranzo, N., Wil-
son, S.G., Andrew, T., Falchi, M., Gwilliam, R., Ahmadi, K.R., et al. (2008).
Bone mineral density, osteoporosis, and osteoporotic fractures: a genome-
wide association study. Lancet 371, 1505–1512.
Roederer, M., Nozzi, J.L., and Nason, M.C. (2011). SPICE: exploration and
analysis of post-cytometric complex multivariate datasets. Cytometry A 79,
167–174.
Sakaguchi, S., Miyara, M., Costantino, C.M., and Hafler, D.A. (2010). FOXP3+
regulatory T cells in the human immune system. Nat. Rev. Immunol. 10,
490–500.
Sinha, S., Mishra, S.K., Sharma, S., Patibandla, P.K., Mallick, P.K., Sharma,
S.K., Mohanty, S., Pati, S.S., Mishra, S.K., Ramteke, B.K., et al.; Indian
Genome Variation Consortium (2008). Polymorphisms of TNF-enhancer and
gene for FcgammaRIIa correlate with the severity of falciparum malaria in
the ethnically diverse Indian population. Malar. J. 7, 13.
Soranzo, N., Rivadeneira, F., Chinappen-Horsley, U., Malkina, I., Richards,
J.B., Hammond, N., Stolk, L., Nica, A., Inouye, M., Hofman, A., et al. (2009).
Meta-analysis of genome-wide scans for human adult stature identifies novel
Loci and associations with measures of skeletal frame size. PLoS Genet. 5,
e1000445.
Starbeck-Miller, G.R., Badovinac, V.P., Barber, D.L., and Harty, J.T. (2014).
Cutting edge: Expression of FcgRIIB tempers memory CD8 T cell function
in vivo. J. Immunol. 192, 35–39.
Strasser, A., Jost, P.J., and Nagata, S. (2009). The many roles of FAS receptor
signaling in the immune system. Immunity 30, 180–192.
Teo, Y.Y., Inouye, M., Small, K.S., Gwilliam, R., Deloukas, P., Kwiatkowski,
D.P., and Clark, T.G. (2007). A genotype calling algorithm for the Illumina Bea-
dArray platform. Bioinformatics 23, 2741–2746.
Thye, T., Vannberg, F.O., Wong, S.H., Owusu-Dabo, E., Osei, I., Gyapong, J.,
Sirugo, G., Sisay-Joof, F., Enimil, A., Chinbuah, M.A., et al.; African TB Ge-
netics Consortium; Wellcome Trust Case Control Consortium (2010).
Genome-wide association analyses identifies a susceptibility locus for tuber-
culosis on chromosome 18q11.2. Nat. Genet. 42, 739–741.
Urabe, Y., Ochi, H., Kato, N., Kumar, V., Takahashi, A., Muroyama, R., Hosono,
N., Otsuka, M., Tateishi, R., Lo, P.H., et al. (2013). A genome-wide association
study of HCV-induced liver cirrhosis in the Japanese population identifies
novel susceptibility loci at the MHC region. J. Hepatol. 58, 875–882.
van Dongen, J., Slagboom, P.E., Draisma, H.H., Martin, N.G., and Boomsma,
D.I. (2012). The continuing value of twin studies in the omics era. Nat. Rev.
Genet. 13, 640–653.
Wang, S.S., Cerhan, J.R., Hartge, P., Davis, S., Cozen, W., Severson, R.K.,
Chatterjee, N., Yeager, M., Chanock, S.J., and Rothman, N. (2006). Common
genetic variants in proinflammatory and other immunoregulatory genes and
risk for non-Hodgkin lymphoma. Cancer Res. 66, 9771–9780.
Willer, C.J., Li, Y., and Abecasis, G.R. (2010). METAL: fast and efficient meta-
analysis of genomewide association scans. Bioinformatics 26, 2190–2191.
Zhang, F., Liu, H., Chen, S., Low, H., Sun, L., Cui, Y., Chu, T., Li, Y., Fu, X., Yu,
Y., et al. (2011). Identification of two new loci at IL23R and RAB32 that influ-
ence susceptibility to leprosy. Nat. Genet. 43, 1247–1251.
Cell 161, 387–403, April 9, 2015 ª2015 Elsevier Inc. 403

Supplemental Information
EXTENDED EXPERIMENTAL PROCEDURES
ImmunophenotypingPBMC Isolation, Cryopreservation, and Staining
PBMCs from the twin cohort were purified by blood centrifugation on a density gradient (Lymphoprep, PAA, Pasching, Austria). Cells
were viably frozen in RPMI 1640 (Life Technologies, Carlsbad, CA) supplementedwith 11.25%HSA (Gemini Bio-Products, West Sac-
ramento, CA)/10%DMSO (Sigma St. Louis, MO) and stored in liquid nitrogen until further use. Healthy control samples were drawn at
the NIH and also viably frozen using a similar protocol. Twin cohort samples were shipped in liquid nitrogen to the NIH laboratories
and processed in bulk.
Cell Processing
Cryopreserved vials of PBMCs were thawed in a 37C water bath for 1 min and resuspended in 10 mls of RPMI supplemented with
10% heat-inactivated newborn calf serum (Life Technologies), and 0.5 U/ml Benzonase (EMD Biosciences), pre-warmed to room
temperature. Tubes were centrifuged for 10 min at 700 x g in a tabletop Sorval centrifuge. After removal of the supernatant, cells
were resuspended in 10 ml of the RPMI supplemented as above, warmed to 37C and centrifuged for 3 min at 860 x g. PBMCs
were resuspended in 1 ml PBS (Life Technologies) and 10 ml were removed to a 96 well plate (Corning) containing a 10 ml solution
of ethidium bromide/acridine orange (EB/AO) (Life Technologies) for counting on a Nexcelom Cellometer. Cells were washed at
860 x g for 3 min and resuspended in 730 ml of PBS. 100 ml was transferred to each of 5 wells of a 96 well plate for room temperature
staining and each of 2 wells of another 96 well plate for 37C staining (see Table S1 for temperatures by Panel). The plates were centri-
fuged at 860 x g for 3 min and the PBS removed by aspiration.
Reagents
See Table S1 for a list of reagents used in each of the seven panels. Immunofluorescence reagents were purchased from Becton
Dickinson, BioLegend, eBiosciences, Life Technologies, Beckman Coulter, Fisher Scientific, or Miltenyi Biotec; or conjugated in
house. All reagents were titrated at the staining temperature used for any given panel. A full description of the optimization of
some panels is published: Panel P1 (Mahnke et al., 2012), P2 (Mahnke et al., 2013a), P3 (Mahnke et al., 2013b) and P5 (Mahnke
et al., 2013c).
Staining
Eachwell was resuspended in 50 ml containing an AquaBlue (Life Technologies) solution of a 1:39 stock (in water) diluted 1: 20 in PBS.
For stainingofmonocytes anddendritic cells theAquaBluewassupplementedwithFcblocking reagent at 2.5ml (Miltenyi). Plateswere
incubated for 15 min in the dark then centrifuged at 860 x g for 3 min. Supernatant was removed by aspiration. Master mixes were
prepared for each panel in staining buffer (RPMI without phenol red (Life Technologies) supplemented with 4% heat-inactivated fetal
calf serum) and centrifuged at 12,000 x g for 10 min (Eppendorf centrifuge 5415D) in order to remove aggregates. Cell pellets were
resuspended in 50 ml of the panel antibodies and incubated for 40 min at room temperature or 37C. All wells were washed, as above,
3 timeswith staining buffer and resuspended in 250 ml of PBS containing 1%paraformaldehyde (Tousimis ResearchCorporation Inc.).
Gating
A graphic depicting the fluorescence distribution of all samples in the discovery cohort is shown in Figure S1. Figures S2 and S3 illus-
trate the gating hierarchy for a single sample. As illustrated in these graphics (and also Figure S1), we generated a large number of
subsets for analysis that encompassed all combinations of certain markers. For each panel, we first identified major ‘‘lineages’’ or
parent subsets. For example, in Panels 1 and 2, these include CD4 T cells, CD8 T cells, double negative (CD4–CD8–) T cells, and dou-
ble positive (CD4+CD8+) T cells. In Panel 3, the parent subsets included naive or memory CD4 or CD8 T cells. Within each parent
subset, we then created Boolean combination gates for the set of markers that exhibited heterogeneous expression patterns within
the parent subsets. In addition, we computed themedian fluorescence intensity (MFI) for all markers of the parent subsets.MFIs were
only computed for cells positive for a given marker, so that the frequency of the positive cells did not influence the MFI. For example,
the CD27MFI on CD4 T cells was computed as the median expression of CD27 on CD4+CD27+ T cells. In the manuscript, we refer to
the MFI calculation as estimating the relative ‘‘surface protein expression level’’ (SPEL).
FlowJo was used to export MFI values, as well as cell subset frequencies (CSF) for all Boolean combination gates. These gates
comprise non-overlapping populations. For example, a Boolean combination of three markers ‘‘A,’’ ‘‘B,’’ and ‘‘C’’ leads to 8 subsets,
including A+B+C+, A+B+C�, A+B�C+, etc. Automated scripts in JMP further processed these data to generate all possible combina-
tions that ignored one or more markers. For example, A+B+ (also denoted as A+B+C0) was computed as the sum of A+B+C+ and
A+B+C�; A+B� (also denoted as A+B�C0) as the sum of A+B�C+ and A+B�C�; A+ (also denoted as A+B0C0) was computed as the
sum all four combinations of B and C with A+. Thus, this step creates all combinations of positive, negative, or ignored (‘‘0’’) for all
markers, which we refer to as ‘‘tri-boolean’’ combination gates. Given ‘‘n’’ markers, there are 2n Boolean gates and 3n tri-boolean
gates. Every tri-boolean gate was assigned a unique identifier, given as ‘‘Panel number:Serial number.’’ Thus, P1:336 is a unique sub-
set from Panel 1. The serial numbers have no meaning other than to distinguish gating used to define the subsets.
Note that any given cell belongs to only one Boolean gate, but belongs tomultiple tri-boolean gates. Thus, there is considerable co-
variation of tri-boolean frequencies. For the seven immunophenotyping panels, we created over 4,000 boolean subsets, resulting in
nearly 80,000 tri-boolean subsets. The combination of tri-boolean subset frequencies and MFI values comprise the 78,683 traits we
analyzed.
Cell 161, 387–403, April 9, 2015 ª2015 Elsevier Inc. S1

Statistical AnalysesSelection of Subsets for Heritability and GWAS Analysis
For genome-wide association analysis, we selected a subset of traits. First, we eliminated those CSFswhosemean frequency (within
their parent ‘‘lineage’’) was below 0.1% or above 99%. As shown in Figure S4A, this reduced the number of traits to below 50,000.
From these, we selected approximately 200 for in-depth analysis as follows.
First, we chose 97 functionally-distinct subsets based on our experience as well as definitions in the literature. These included dif-
ferentiation stages of T cells (naive, stem cell memory, central, transitional, effector and terminal effector memory) and B cells (imma-
ture, mature, etc.); lineages of CD4 T cells (Th1, Th2, Th17, Th22), and so forth. These are referred to as ‘‘canonical’’ subsets.
Next, we roughly estimated heritability for all traits based on Falconer’s formula based on the difference between the intra-class
correlation coefficients of the two zygosities (i.e., h2 = 2 x [rMZ – rDZ]). Of the 97 pre-defined canonical subsets, 46 showed no evidence
of heritability nor were of sufficient interest biologically and were not included in further genetic analysis. From the global trait list, we
then selected 100 highly-heritable, independent traits across all seven panels, choosing from highly related subsets the one with the
simplest definition (for example, if all of A+, A+B+, and A+B�were highly heritable, we chose only A+). These 100 traits, together with 51
canonical traits, were then submitted for GWAS analysis.
We then estimated heritability of the 151 traits using structural equation modeling (SEM) to separate the observed phenotypic vari-
ance into three latent sources of variation: additive genetic variance (A), shared/common environmental variance (C), and non-
shared/unique environmental variance (E) (Neale and Cardon, 1992). Additive genetic influences are indicated when monozygotic
(MZ) twins are more similar than dizygotic (DZ) twins. The common environmental component estimates the contribution of family
environment which is assumed to be equal in bothMZ and DZ twin pairs (Kyvic, 2000), whereas the unique environmental component
does not contribute to twin similarity, rather it estimates the effects that apply only to each individual and includesmeasurement error.
Any greater similarity between MZ twins than DZ twins is attributed to greater sharing of genetic influences. Heritability is defined as
the proportion of the phenotypic variation attributable to genetic factors, and using SEM is given by the equation, h2 = (A)/(A + C + E).
The heritability analysis was estimated on the inverse normalized trait values. Each trait was adjusted for age by linear regression
after removing the outliers (> 4 standard deviations). The residuals were then normalized using inverse normal transformation and
used for both the heritability and genome wide association analysis.
BioData RepositoryRaw and summary data is available for downloading and analysis. Genotype data is available upon request to the authors.
Flow Cytometry Data
FCS data files are deposited in the International Society for the Advancement of Cytometry public data repository. This includes 130
GB of data, comprising > 5,200 individual data files. In addition, the FlowJo workspaces used to analyze these files are also available,
providing the complete gating scheme, statistical analysis, and graphical analysis for every single data file. These files are available at
http://www.tinyurl.com/twinsFACSdata.
GWAS Summary
The detailed summary of all GWAS analyses performed on the 150 selected traits is provided; each trait is a separate file. These files
can be downloaded from ftp://twinr-ftp.kcl.ac.uk/ImmuneCellScience, in folder ‘‘2-GWASResults.’’
Demographics
Anonymized demographic information (anonymized unique family ID, age, twin type) for subjects is provided in a single file, ftp://
twinr-ftp.kcl.ac.uk/ImmuneCellScience, file name ‘‘3-Demographics.zip.’’
Heritability
Estimated heritability (Falconer’s) for all 78,000 traits, including a detailed definition of each of the traits, suitable for sorting and anal-
ysis is available in a single file. This file can be downloaded from ftp://twinr-ftp.kcl.ac.uk/ImmuneCellScience, file name ‘‘4-Trait
Analysis.zip.’’
Trait Values
Every measured trait value is in a single file, containing a table of 78,000 values for each individual. This file can be downloaded from
ftp://twinr-ftp.kcl.ac.uk/ImmuneCellScience, file name ‘‘5-Trait Values.zip.’’
S2 Cell 161, 387–403, April 9, 2015 ª2015 Elsevier Inc.
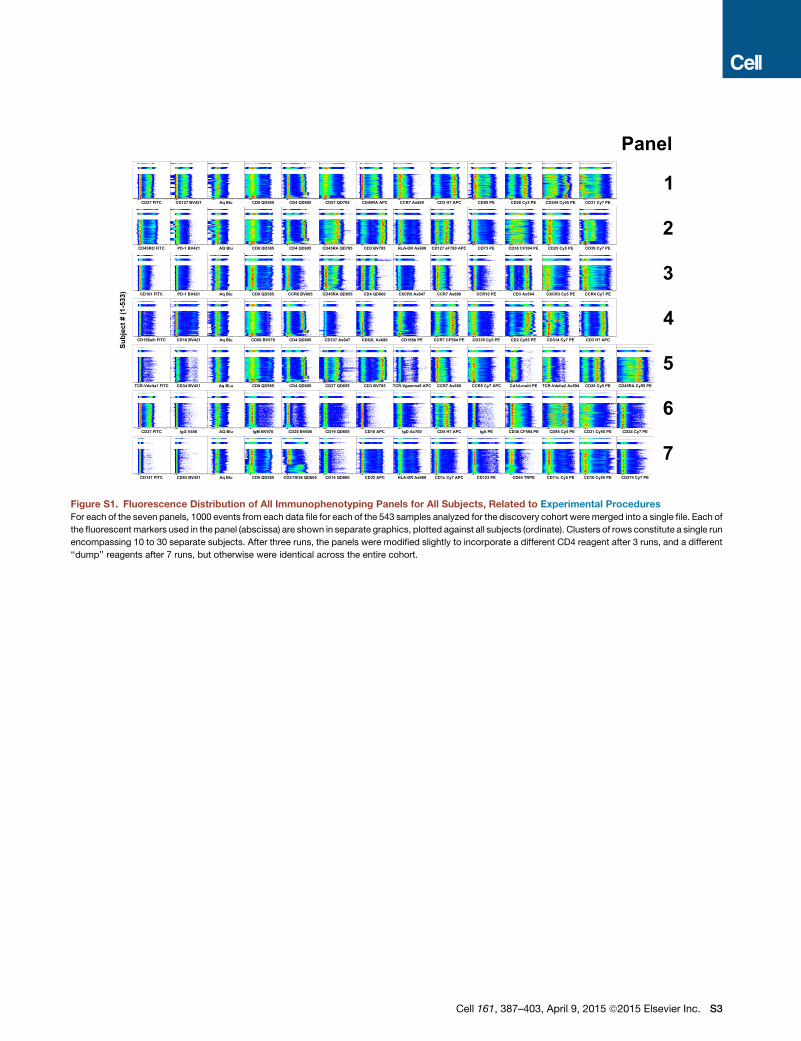
CD31 Cy7 PECD244 Cy55 PECD28 Cy5 PECD95 PECD3 H7 APCCCR7 Ax680CD45RA APCCD57 QD705CD4 QD605CD8 QD585Aq BluCD127 BV421CD27 FITC
CD39 Cy7 PECD25 Cy5 PECD38 CF594 PECD73 PECD127 eF780 APCHLA-DR Ax680CD3 BV785CD45RA QD705CD4 QD605CD8 QD585AQ BluPD-1 BV421CD45RO FITC
CCR4 Cy7 PECXCR3 Cy5 PECD3 Ax594CCR10 PECCR7 Ax680CXCR5 Ax647CD4 QD800CD45RA QD655CCR6 BV605CD8 QD585Aq BluPD-1 BV421CD161 FITC
CD314 Cy7 PECD2 Cy55 PECD335 Cy5 PECCR7 CF594 PECD158b PECD62L Ax680CD337 Ax647CD4 QD605CD56 BV570Aq BluCD16 BV421CD158a/h FITC
CD45RA Cy55 PECD28 Cy5 PETCR-Vdelta2 Ax594Cd1d-multi PECCR5 Cy7 APCCCR7 Ax680TCR-Vgamma9 APCCD3 BV785CD27 QD655CD4 QD605CD8 QD585Aq BLuCD34 BV421TCR-Vdelta1 FITC
CD24 Cy7 PECD21 Cy55 PECD95 Cy5 PECD38 CF594 PEIgA PECD5 H7 APCIgD Ax700CD10 APCCD19 QD655CD20 BV605IgM BV570AQ BluIgG V450CD27 FITC
CD274 Cy7 PECD16 Cy55 PECD11c Cy5 PECD64 TRPECD123 PECD1c Cy7 APCHLA-DR Ax680CD32 APCCD14 QD800CD3/19/56 QD605CD8 QD585Aq BluCD83 BV421CD141 FITC
Subj
ect #
(1-5
33)
1
2
3
4
5
6
7
CD3 H7 APC
Panel
Figure S1. Fluorescence Distribution of All Immunophenotyping Panels for All Subjects, Related to Experimental Procedures
For each of the seven panels, 1000 events from each data file for each of the 543 samples analyzed for the discovery cohort weremerged into a single file. Each of
the fluorescent markers used in the panel (abscissa) are shown in separate graphics, plotted against all subjects (ordinate). Clusters of rows constitute a single run
encompassing 10 to 30 separate subjects. After three runs, the panels were modified slightly to incorporate a different CD4 reagent after 3 runs, and a different
‘‘dump’’ reagents after 7 runs, but otherwise were identical across the entire cohort.
Cell 161, 387–403, April 9, 2015 ª2015 Elsevier Inc. S3
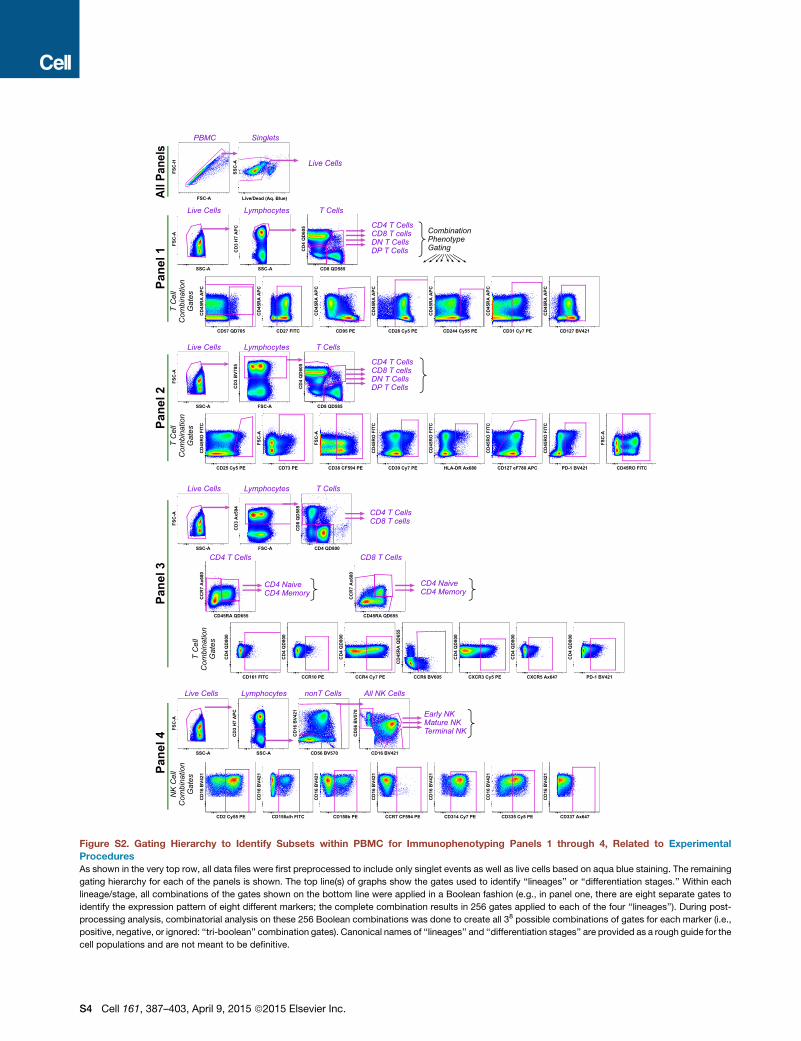
FSC
-H
FSC-A Live/Dead (Aq. Blue)
SSC
-A
SSC-A
FSC
-A
SSC-A
CD
3 H
7 A
PC
CD8 QD585
CD
4 Q
D60
5
CD127 BV421
CD
45R
A A
PC
CD31 Cy7 PE
CD
45R
A A
PC
CD244 Cy55 PE
CD
45R
A A
PC
CD28 Cy5 PE
CD
45R
A A
PC
CD95 PE
CD
45R
A A
PC
CD27 FITC
CD
45R
A A
PC
CD57 QD705
CD
45R
A A
PC
SSC-A
FSC
-A
FSC-A
CD
3 B
V785
CD8 QD585
CD
4 Q
D60
5
CD45RO FITC
FSC
-A
PD-1 BV421
CD
45R
O F
ITC
CD127 eF780 APC
CD
45R
O F
ITC
HLA-DR Ax680
CD
45R
O F
ITC
CD39 Cy7 PE
CD
45R
O F
ITC
CD38 CF594 PE
FSC
-A
CD73 PE
FSC
-A
CD25 Cy5 PE
CD
45R
O F
ITC
SSC-A
FSC
-A
FSC-A
CD
3 A
x594
CD4 QD800
CD
8 Q
D58
5
CD45RA QD655
CC
R7
Ax6
80
CD45RA QD655
CC
R7
Ax6
80
CD161 FITC
CD
4 Q
D80
0
CCR10 PE
CD
4 Q
D80
0
CCR4 Cy7 PE
CD
4 Q
D80
0
CCR6 BV605
CD
45R
A Q
D65
5
CXCR3 Cy5 PE
CD
4 Q
D80
0
CXCR5 Ax647
CD
4 Q
D80
0
PD-1 BV421
CD
4 Q
D80
0
SSC-A
FSC
-A
SSC-A
CD
3 H
7 A
PC
CD56 BV570
CD
16 B
V421
CD16 BV421
CD
56 B
V57 0
CD2 Cy55 PE
CD
16 B
V421
CD158a/h FITC
CD
16 B
V421
CD158b PE
CD
16 B
V421
CCR7 CF594 PE
CD
16 B
V421
CD314 Cy7 PE
CD
16 B
V421
CD335 Cy5 PE
CD
16 B
V421
CD337 Ax647
CD
16 B
V421
All P
anel
sPa
nel 1
Pane
l 2Pa
nel 3
Pane
l 4
PBMC Singlets
Live Cells Lymphocytes T Cells
CD4 T Cells CD8 T cells DN T Cells DP T Cells
Live Cells Lymphocytes T Cells
CD4 T Cells CD8 T cells DN T Cells DP T Cells
Live Cells Lymphocytes T Cells
CD4 Naive CD4 Memory
CD4 T Cells CD8 T Cells
CD4 T Cells CD8 T cells
CD4 Naive CD4 Memory
Live Cells Lymphocytes nonT Cells All NK Cells
Early NK Mature NK Terminal NK
Live Cells
Combination Phenotype Gating
T C
ell
Com
bina
tion
Gat
es
T C
ell
Com
bina
tion
Gat
esT
Cel
l C
ombi
natio
n G
ates
NK
Cel
l C
ombi
natio
n G
ates
Figure S2. Gating Hierarchy to Identify Subsets within PBMC for Immunophenotyping Panels 1 through 4, Related to Experimental
ProceduresAs shown in the very top row, all data files were first preprocessed to include only singlet events as well as live cells based on aqua blue staining. The remaining
gating hierarchy for each of the panels is shown. The top line(s) of graphs show the gates used to identify ‘‘lineages’’ or ‘‘differentiation stages.’’ Within each
lineage/stage, all combinations of the gates shown on the bottom line were applied in a Boolean fashion (e.g., in panel one, there are eight separate gates to
identify the expression pattern of eight different markers; the complete combination results in 256 gates applied to each of the four ‘‘lineages’’). During post-
processing analysis, combinatorial analysis on these 256 Boolean combinations was done to create all 38 possible combinations of gates for each marker (i.e.,
positive, negative, or ignored: ‘‘tri-boolean’’ combination gates). Canonical names of ‘‘lineages’’ and ‘‘differentiation stages’’ are provided as a rough guide for the
cell populations and are not meant to be definitive.
S4 Cell 161, 387–403, April 9, 2015 ª2015 Elsevier Inc.

Figure S3. Gating Hierarchy to Identify Subsets within PBMC for Immunophenotyping Panels 5 through 7, Related to Experimental
Procedures
Similar to Figure S2, cells were divided into subsets first by ‘‘lineage’’ gating as shown by the arrows, and then, as indicated, the combinatorial boolean gating was
applied to each of these. In panel six, mature memory B cells that are negative for IgM, IgA, and IgG are likely to be reasonably pure populations of IgE expressing
cells and are denoted as ‘‘(IgE+).’’ Canonical names of ‘‘lineages’’ and ‘‘differentiation stages’’ are provided as a rough guide for the cell populations and are not
meant to be definitive.
Cell 161, 387–403, April 9, 2015 ª2015 Elsevier Inc. S5
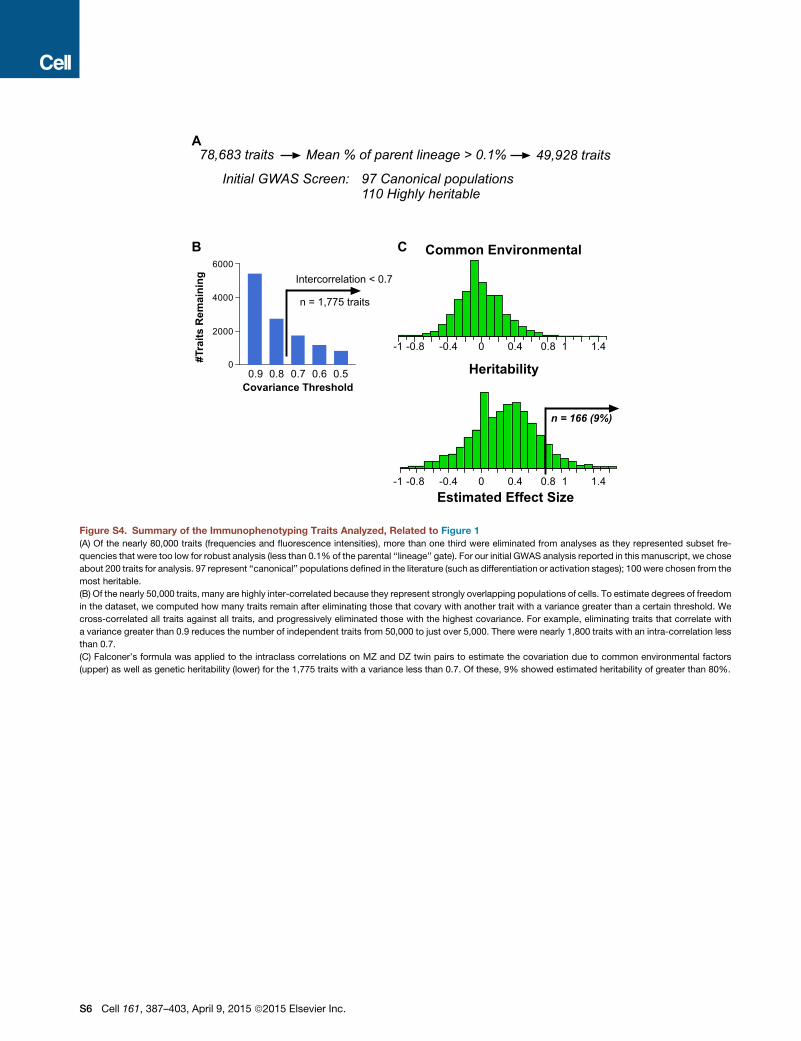
n = 1,775 traits
Intercorrelation < 0.7
0.9 0.8 0.7 0.6 0.50
2000
4000
6000
Covariance Threshold
#Tra
its R
emai
ning
-1 -0.8 -0.4 0 0.4 0.8 1 1.4
Common Environmental
Heritability
-1 -0.8 -0.4 0 0.4 0.8 1 1.4
n = 166 (9%)
78,683 traits Mean % of parent lineage > 0.1% 49,928 traits
Estimated Effect Size
A
B C
97 Canonical populations 110 Highly heritable
Initial GWAS Screen:
Figure S4. Summary of the Immunophenotyping Traits Analyzed, Related to Figure 1
(A) Of the nearly 80,000 traits (frequencies and fluorescence intensities), more than one third were eliminated from analyses as they represented subset fre-
quencies that were too low for robust analysis (less than 0.1% of the parental ‘‘lineage’’ gate). For our initial GWAS analysis reported in this manuscript, we chose
about 200 traits for analysis. 97 represent ‘‘canonical’’ populations defined in the literature (such as differentiation or activation stages); 100 were chosen from the
most heritable.
(B) Of the nearly 50,000 traits, many are highly inter-correlated because they represent strongly overlapping populations of cells. To estimate degrees of freedom
in the dataset, we computed how many traits remain after eliminating those that covary with another trait with a variance greater than a certain threshold. We
cross-correlated all traits against all traits, and progressively eliminated those with the highest covariance. For example, eliminating traits that correlate with
a variance greater than 0.9 reduces the number of independent traits from 50,000 to just over 5,000. There were nearly 1,800 traits with an intra-correlation less
than 0.7.
(C) Falconer’s formula was applied to the intraclass correlations on MZ and DZ twin pairs to estimate the covariation due to common environmental factors
(upper) as well as genetic heritability (lower) for the 1,775 traits with a variance less than 0.7. Of these, 9% showed estimated heritability of greater than 80%.
S6 Cell 161, 387–403, April 9, 2015 ª2015 Elsevier Inc.
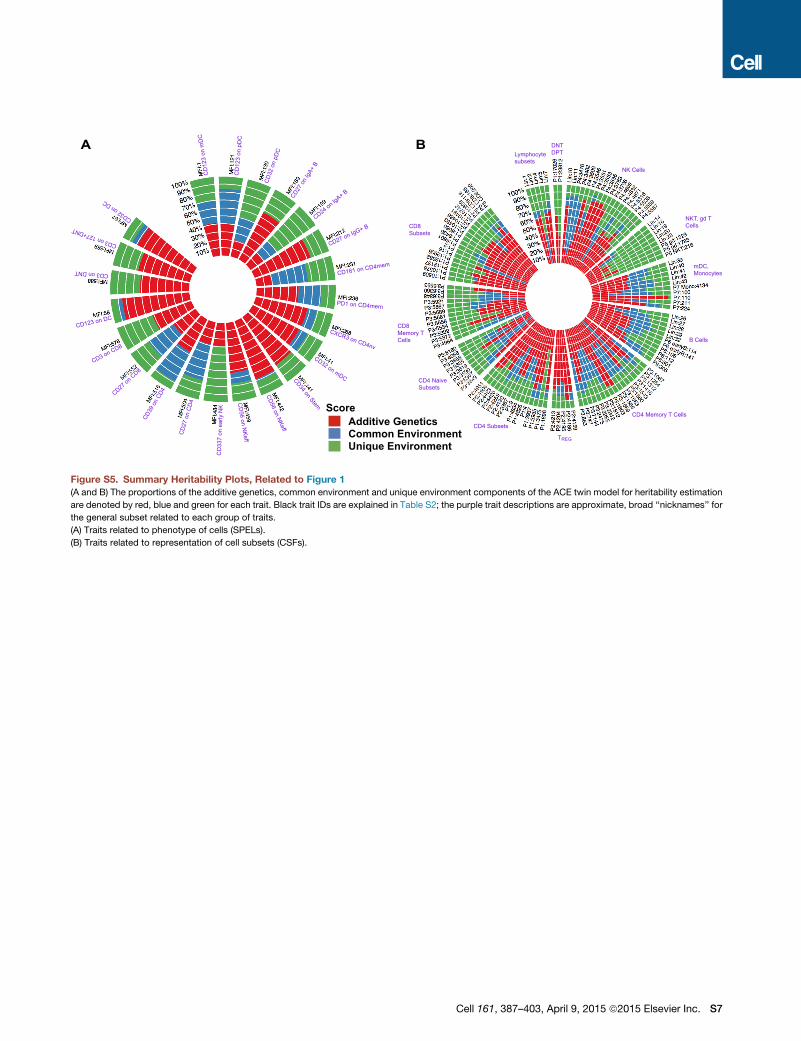
CD
123
on m
DC
CD
123
on p
DC
CD
32 o
n pD
C
CD27
on
IgA+
B
CD24 on IgA+ B
CD27 on IgG+ B
CD161 on CD4mem
PD1 on CD4mem
CXCR3 on CD4nv
CD32 on mDCCD34 on Stem
CD56 on NKeff
CD
56 on NKeff
CD
337
on e
arly
NK
CD
27 o
n C
D4
CD39
on
CD4CD27
on C
D8
CD3 on CD8
CD123 on DC
CD32 on DC
CD3 on 127+DNT
CD3 on DNT
Lymphocyte subsets
DNT DPT
NK Cells
NKT, gd T Cells
mDC, Monocytes
B Cells
CD4 Memory T Cells
TREG
CD4 Subsets
CD4 Naive Subsets
CD8 Memory T Cells
CD8 Subsets
ScoreAdditive Genetics Common Environment Unique Environment
A B
Figure S5. Summary Heritability Plots, Related to Figure 1
(A and B) The proportions of the additive genetics, common environment and unique environment components of the ACE twin model for heritability estimation
are denoted by red, blue and green for each trait. Black trait IDs are explained in Table S2; the purple trait descriptions are approximate, broad ‘‘nicknames’’ for
the general subset related to each group of traits.
(A) Traits related to phenotype of cells (SPELs).
(B) Traits related to representation of cell subsets (CSFs).
Cell 161, 387–403, April 9, 2015 ª2015 Elsevier Inc. S7
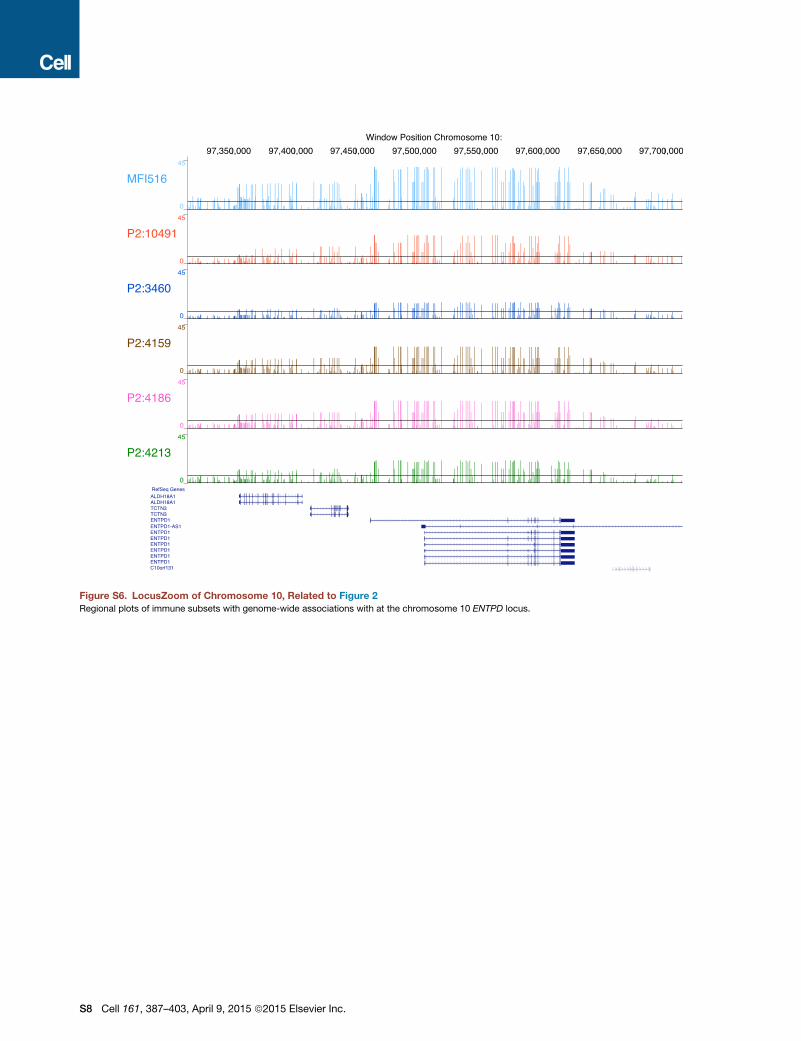
Figure S6. LocusZoom of Chromosome 10, Related to Figure 2
Regional plots of immune subsets with genome-wide associations with at the chromosome 10 ENTPD locus.
S8 Cell 161, 387–403, April 9, 2015 ª2015 Elsevier Inc.
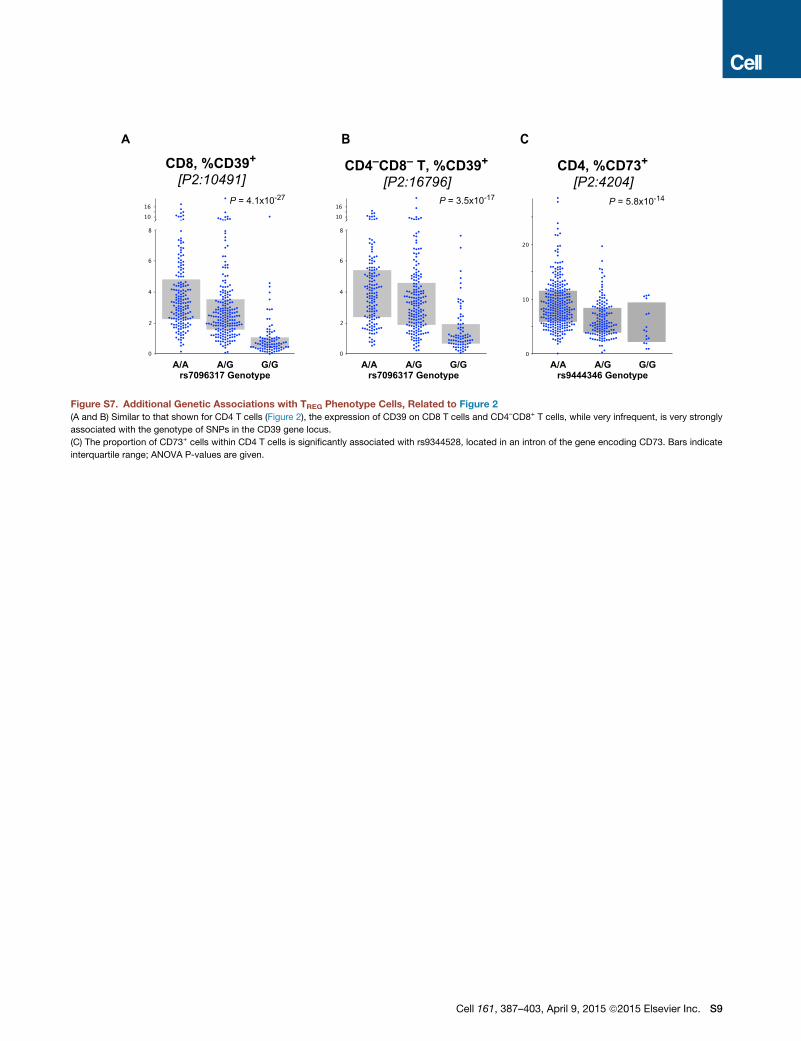
Figure S7. Additional Genetic Associations with TREG Phenotype Cells, Related to Figure 2
(A and B) Similar to that shown for CD4 T cells (Figure 2), the expression of CD39 on CD8 T cells and CD4–CD8+ T cells, while very infrequent, is very strongly
associated with the genotype of SNPs in the CD39 gene locus.
(C) The proportion of CD73+ cells within CD4 T cells is significantly associated with rs9344528, located in an intron of the gene encoding CD73. Bars indicate
interquartile range; ANOVA P-values are given.
Cell 161, 387–403, April 9, 2015 ª2015 Elsevier Inc. S9

Figure S8. Additional Genetic Associations of the FcR Locus with Immunophenotypes, Related to Figure 5
(A) Detailed bar charts showing individual data points for the summary graphs shown in Figure 4F. Bars indicate interquartile range; ANOVA P-values are given.
(B) The genotype of rs1801274 is strongly associated with the cell surface expression of CD27 on CD4 T cells, CD4–CD8– T cells, and CD4+CD8+ T cells, in a
similar pattern to that seen for CD8 T cells (Figure 5). Likewise, the genotype of rs1801274 is strongly associated with the cell surface expression of CD27 on IgA+
B cells, as for IgG+ B cells (Figure 5).
(C) Bar chart showing association between FcR diplotype and CD32+ imDC in the replication cohort (for this analysis, n = 130). Bars indicate interquartile range;
ANOVA P-values is given.
S10 Cell 161, 387–403, April 9, 2015 ª2015 Elsevier Inc.