Embed Size (px)
Citation preview
Perlegen Sciences, Inc.
Understanding the Genetic Architecture of Common Understanding the Genetic Architecture of Common Disease: A Comparison of Genome ScansDisease: A Comparison of Genome Scans
Dennis G. Ballinger, Ph.D.Dennis G. Ballinger, Ph.D.VP, bioinformaticsVP, bioinformatics
Perlegen Sciences Inc.Perlegen Sciences Inc.
[email protected]@perlegen.com
Perlegen Sciences, Inc.
Genes, through the proteins they encode, Genes, through the proteins they encode, interact with challenges from the interact with challenges from the
environmentenvironment

Perlegen Sciences, Inc.
…………………………..February, 2005
……………..October, 2005
Whole-Genome Patterns of Common Human DNA Variation Have Recently Been
Characterized
27 October 2005
18 February 2005
Perlegen Sciences, Inc.
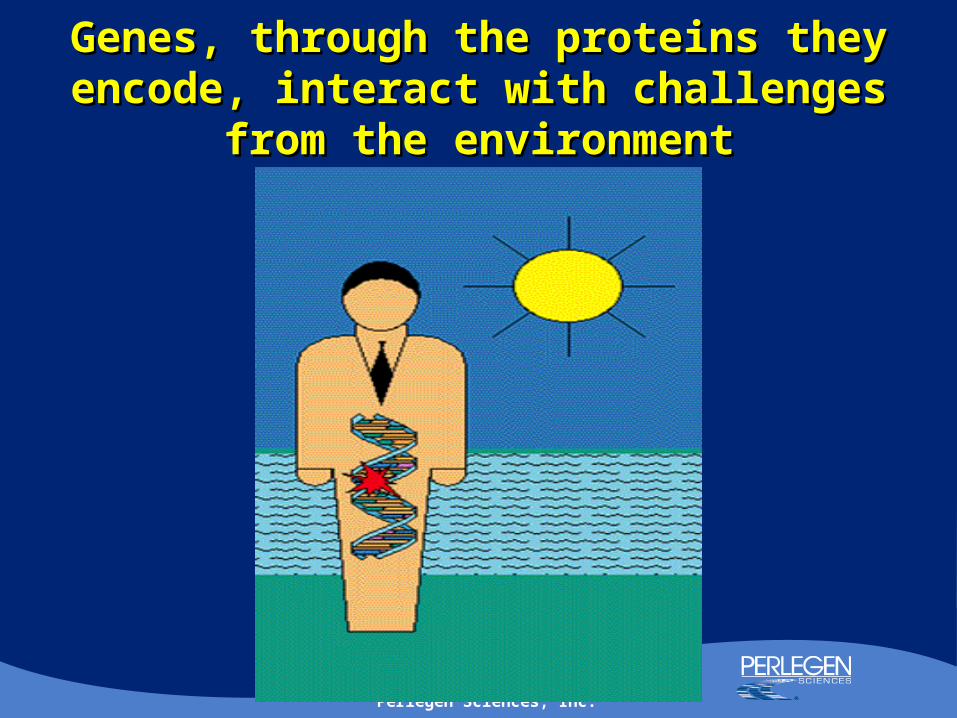
Common Human SNPsCommon Human SNPs
• Robust assays have been developed for more than 2.5 million of the total 9-10 million common SNPs estimated to be present in the humans.
• Although the vast majority of these SNPs are present in all human ethnic groups and geographic locations, the allele frequencies are more variable between than within ethnicities and geographies
• The correlation structure of more than 2.5 million SNPs has been empirically determined using small population samples from diverse geographic locations.
• The observed correlations between common SNPs reveal that by genotyping a selected subset of 300,000- 400,000 SNP (ie. TAG SNPs) in an individual, one obtains nearly the same genetic information as would be obtained by interrogating all 9 to10 million common human SNPs.
Perlegen Sciences, Inc.
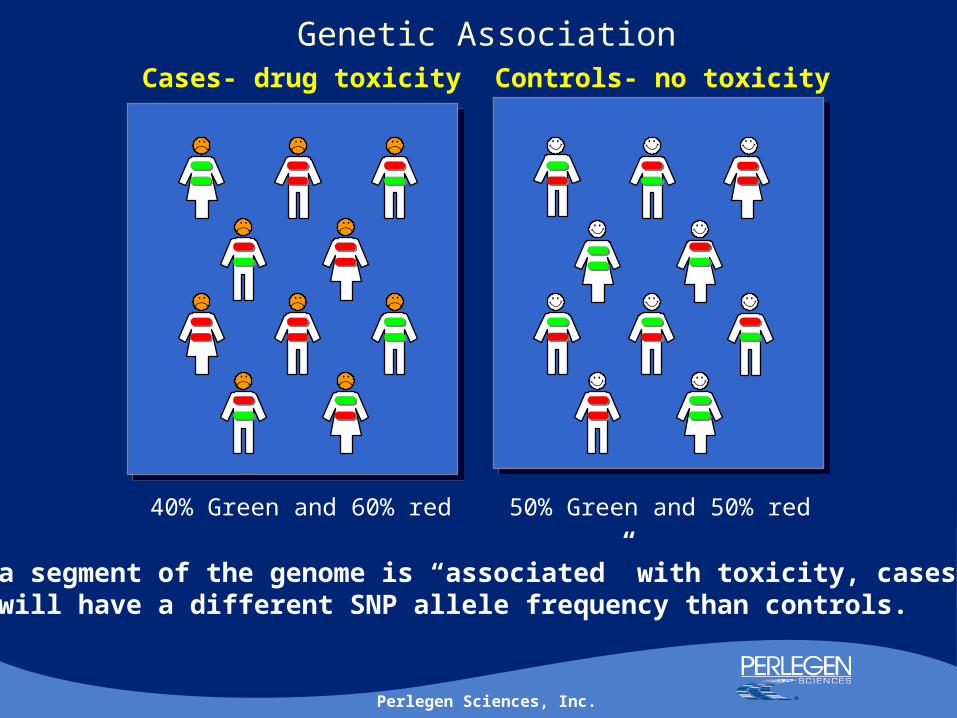
Genetic AssociationCases- drug toxicity Controls- no toxicity
If a segment of the genome is “associated” with toxicity, caseswill have a different SNP allele frequency than controls.
40% Green and 60% red 50% Green and 50% red
Perlegen Sciences, Inc.
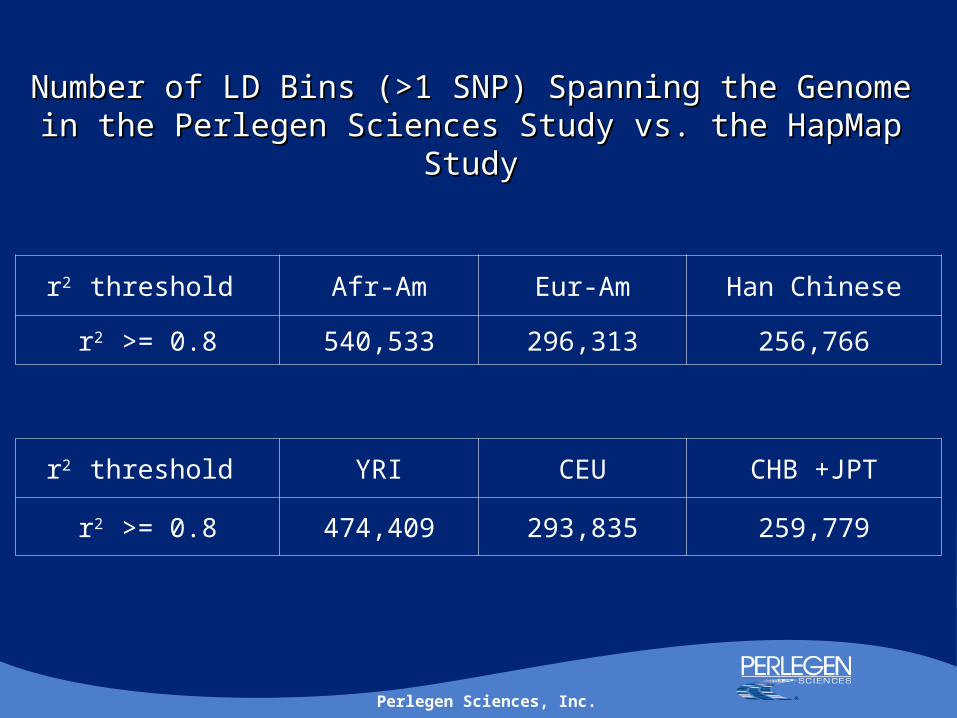
Number of LD Bins (>1 SNP) Spanning the Genome in the Number of LD Bins (>1 SNP) Spanning the Genome in the Perlegen Sciences Study vs. the HapMap StudyPerlegen Sciences Study vs. the HapMap Study
r2 threshold Afr-Am Eur-Am Han Chinese
r2 >= 0.8 540,533 296,313 256,766
r2 threshold YRI CEU CHB +JPT
r2 >= 0.8 474,409 293,835 259,779

Perlegen Sciences, Inc.
Questions That Remain Unanswered
What is the relative role of common versus rare What is the relative role of common versus rare genetic variation in complex human traits?genetic variation in complex human traits?
What is the relative role of population specific versus What is the relative role of population specific versus global genetic variation in complex human traits?global genetic variation in complex human traits?
Which segments of the human genome play the most Which segments of the human genome play the most important role in human phenotype variation?important role in human phenotype variation?
What is the size of individual genetic effects?What is the size of individual genetic effects?

Perlegen Sciences, Inc.
Small Sample Size Results in Large Variation in Observed Allele Frequency
ALLELE FREQUENCY 0.10 0.20 0.30
SAMPLE SIZE 95% confidence interval of allele frequency
10 +/- 0.13 +/- 0.18 +/- 0.20
20 +/- 0.09 +/- 0.12 +/- 0.14
50 +/- 0.06 +/- 0.08 +/- 0.09
100 +/- 0.04 +/- 0.06 +/- 0.06
200 +/- 0.03 +/- 0.04 +/- 0.04
400 +/- 0.02 +/- 0.03 +/- 0.03
600 +/- 0.02 +/- 0.02 +/- 0.03
800 +/- 0.01 +/- 0.02 +/- 0.02
1000 +/- 0.01 +/- 0.02 +/- 0.02
Perlegen Sciences, Inc.
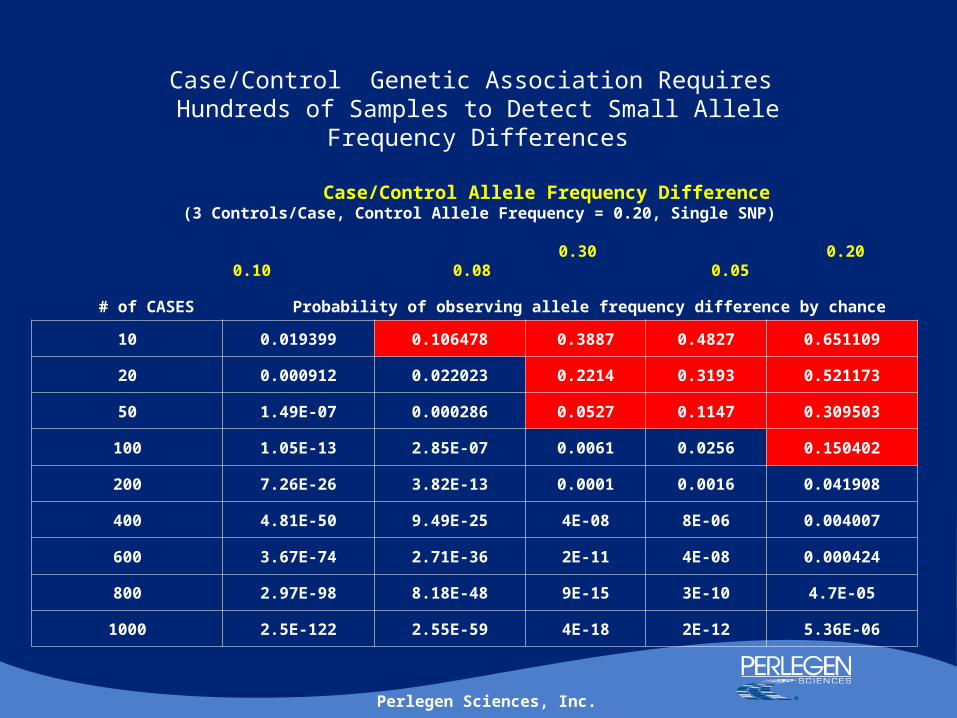
Case/Control Genetic Association Requires Hundreds of Samples to Detect Small Allele
Frequency Differences
Case/Control Allele Frequency Difference (3 Controls/Case, Control Allele Frequency = 0.20, Single SNP)
0.30 0.20 0.10 0.08 0.05
# of CASES Probability of observing allele frequency difference by chance
10 0.019399 0.106478 0.3887 0.4827 0.651109
20 0.000912 0.022023 0.2214 0.3193 0.521173
50 1.49E-07 0.000286 0.0527 0.1147 0.309503
100 1.05E-13 2.85E-07 0.0061 0.0256 0.150402
200 7.26E-26 3.82E-13 0.0001 0.0016 0.041908
400 4.81E-50 9.49E-25 4E-08 8E-06 0.004007
600 3.67E-74 2.71E-36 2E-11 4E-08 0.000424
800 2.97E-98 8.18E-48 9E-15 3E-10 4.7E-05
1000 2.5E-122 2.55E-59 4E-18 2E-12 5.36E-06

Perlegen Sciences, Inc.
Whole Genome Genetic Association Requires A Multiple Testing Penalty
Case/Control Allele Frequency Difference (3 Controls/Case; Control Allele Frequency = 0.20; 325,000 SNPs)
0.30 0.20 0.10 0.08 0.05
# of CASES Probability of observing allele frequency difference by chance
10 1 1 1 1 1
20 1 1 1 1 1
50 0.049 1 1 1 1
100 3.43E-08 0.093 1 1 1
200 2.36E-20 1.242E-07 1 1 1
400 1.56E-44 3.08E-19 0.013 1 1
600 1.19E-68 8.80E-31 5.98E-06 0.015 1
800 9.66E-93 2.66E-42 2.81E-09 8.64E-05 1
1000 8.1E-117 8.29E-54 1.36E-12 5.28E-07 1

Perlegen Sciences, Inc.
Definitions of SNP Association
Exploratory SNP association – non-significant association of an allele with the trait, when correctly adjusting for multiple tests
Valid SNP association - significant association of an allele with the trait in a single sample corrected for multiple testing
Replicated SNP association – significant association of an allele with the trait in multiple independent samples from a population of interest
Perlegen Sciences, Inc.

Perlegen Sciences, Inc.
The top 10 SNPs from joint analysis of all data
Maraganore et al. (Tier 1 and Tier 2) Meta-analysis, replication studies
MarkerAlleles
(high-risk allele)
cases controlsallele
frequency (controls)
Odds Ratio p cases controls
allele frequency (controls)
Odds Ratio p
(95% CI) (95% CI)
rs10200894 C/G (C) 772 772 0.88 1.84 (1.38–2.45) 1.70E-05 1566 1546 0.89 1.14 (0.96 - 1.35) 0.125
rs11737074 G/A (A) 764 764 0.19 1.50 (1.21–1.86) 1.55E-04 1563 1542 0.21 1.02 (0.9 - 1.15) 0.77
rs16851009 C/T (T) 741 741 0.08 1.84 (1.36–2.49) 4.17E-05 1539 1544 0.1 0.98 (0.83 - 1.16) 0.853
rs17329669 A/G (G) 768 768 0.12 1.71 (1.33–2.21) 2.30E-05 1554 1525 0.12 1.13 (0.97 - 1.32) 0.102
rs2245218 A/G (G) 770 770 0.12 1.67 (1.29–2.14) 4.61E-05 1571 1563 0.16 0.94 (0.82 - 1.08) 0.369
rs2313982 C/T (T) 740 740 0.07 2.01 (1.44–2.79) 1.79E-05 1562 1554 0.09 0.88 (0.73 - 1.04) 0.138
rs7520966 C/T (C) 769 769 0.7 0.67 (0.55–0.81) 2.96E-05 1563 1550 0.72 1.07 (0.96 - 1.2) 0.242
rs7702187 T/A (T) 761 761 0.81 1.74 (1.36–2.24) 7.62E-06 1541 1541 0.83 1.07 (0.93 - 1.22) 0.334
rs7723605 T/C (C) 773 773 0.11 1.78 (1.35–2.35) 3.30E-05 1567 1571 0.13 1.03 (0.89 - 1.19) 0.684
ss46548856 G/C (G) 765 765 0.9 1.88 (1.38–2.57) 3.65E-05 1551 1528 0.9 1.12 (0.94 - 1.33) 0.196
Four replication studies published in AJHG August 2006
Perlegen Sciences, Inc.
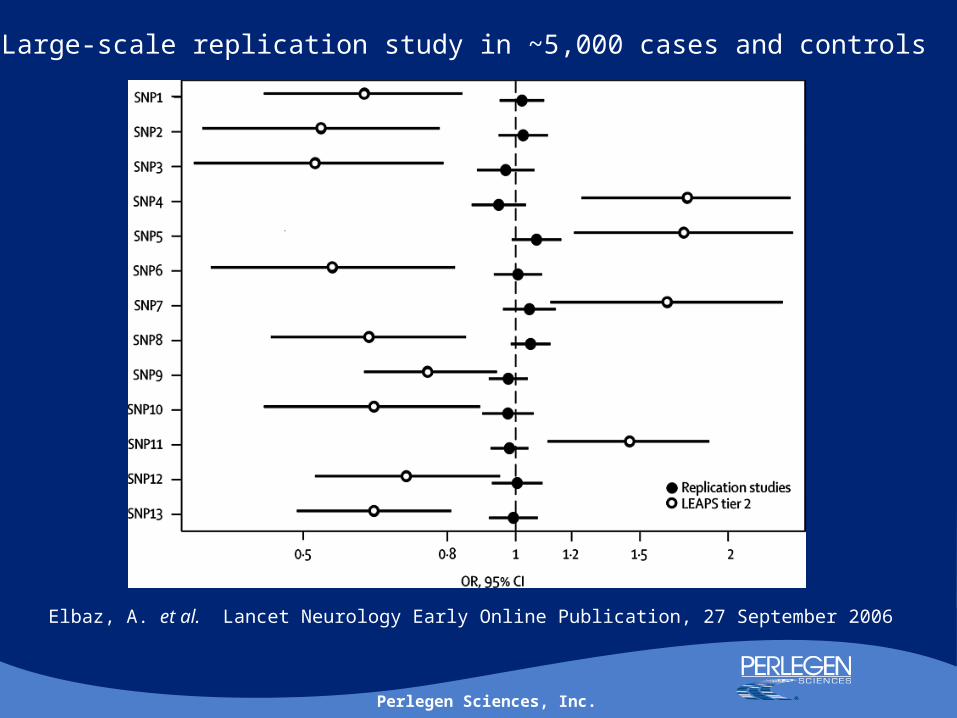
Elbaz, A. et al. Lancet Neurology Early Online Publication, 27 September 2006
Large-scale replication study in ~5,000 cases and controls

Perlegen Sciences, Inc.
SNP Associations with HDL levelsSNP Associations with HDL levels
“Replication” Population- 83 Low HDL, 78 High HDL
Original Population- 345 Low HDL, 321 High HDL
All four CETP SNPs significantly associated with HDL levelAll four CETP SNPs significantly associated with HDL levelin the original population are also significantlyin the original population are also significantly associated with HDL level in the “replication populationassociated with HDL level in the “replication population
Hinds et. al., Human Genomics 1:421-434, 2004
4 SNPs, all of which are in the same gene (CETP), havesignificantly different allele frequencies between high and low HDL individuals
Perlegen Sciences, Inc.
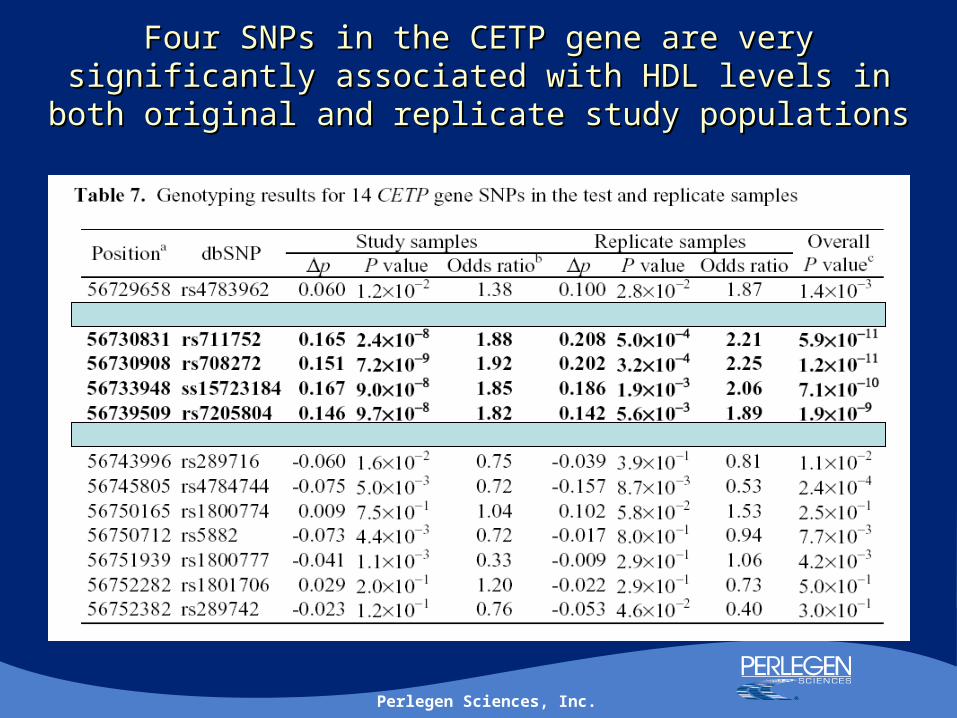
Four SNPs in the CETP gene are very significantly Four SNPs in the CETP gene are very significantly associated with HDL levels in both original and replicate associated with HDL levels in both original and replicate
study populationsstudy populations
Perlegen Sciences, Inc.
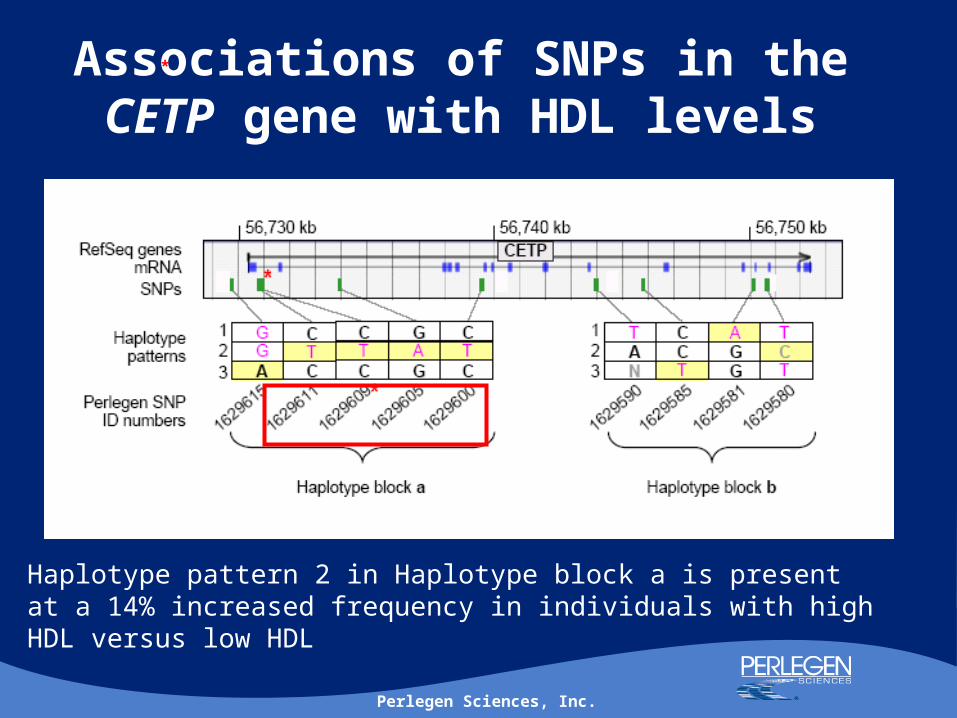
Associations of SNPs in the CETP gene with HDL levels
*
Haplotype pattern 2 in Haplotype block a is present at a 14% increased frequency in individuals with high HDL versus low HDL
Perlegen Sciences, Inc.
A genome-wide association study in breast cancer
Douglas F Easton, Alison M Dunning, Karen Pooley, Paul DP Pharoah, David R Cox, Dennis G Ballinger, Deborah Thompson, D Gareth Evans, Diana Eccles, Nazneen Rahman, Michael R Stratton, Julian Peto, Olivia Fletcher, Bruce AJ Ponder, The Breast Cancer Association Consortium
Perlegen Sciences, Inc.
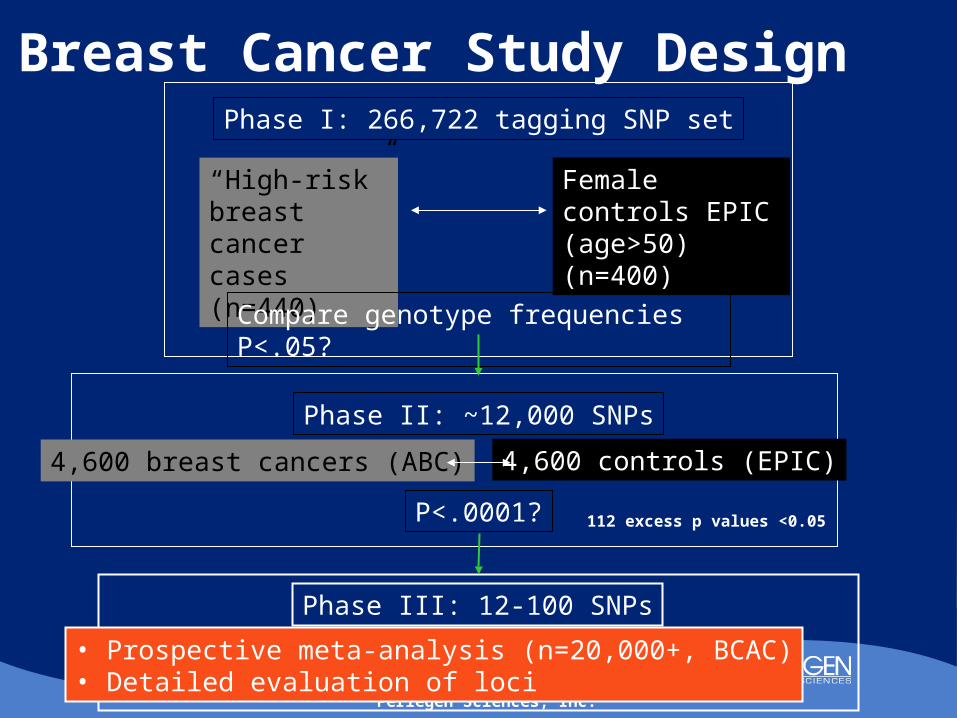
Breast Cancer Study Design
“High-risk” breast cancer cases (n=440)
Compare genotype frequencies P<.05?
Phase I: 266,722 tagging SNP set
Female controls EPIC (age>50) (n=400)
• Prospective meta-analysis (n=20,000+, BCAC)• Detailed evaluation of loci
Phase III: 12-100 SNPs
P<.0001?
4,600 controls (EPIC)4,600 breast cancers (ABC)
Phase II: ~12,000 SNPs
112 excess p values <0.05

Perlegen Sciences, Inc.
LocusHeterozygote
OR (95%CI)
Homozygote
OR (95% CI)
P-trend
(1df)P-het (2df)
A 1.24 (1.12-1.36) 1.56 (1.36-1.77) 5x10-17 4.7x10⁻¹⁶
B 1.30 (1.14-1.47) 1.38 (1.21-1.58) 2x10⁻⁶ 3.7x10⁻⁸
C 1.19 (1.05-1.36) 1.45 (1.26-1.66) 4.1x10⁻⁸ 1.4x10⁻⁷
D 1.18 (1.06-1.31) 1.33 (1.17-1.50) 8.5x10⁻⁸ 1.9x10⁻⁷
E 1.25 (1.12-1.39) 1.55 (1.18-2.04) 1.0x10⁻⁷ 6.4x10⁻⁷
F 1.13 (1.03-1.24) 1.42 (1.22-1.66) 1.9x10⁻⁷ 4.7x10⁻⁷
G 1.07 (0.97-1.18) 1.38 (1.21-1.57) 6.7x10⁻⁷ 3.8x10⁻⁷
H 1.13 (1.03-1.23) 1.27 (1.08-1.49) 3.9x10⁻⁷ 2.5x10⁻⁶
I 1.07 (0.97-1.18) 1.35 (1.19-1.53) 6.2x10⁻⁷ 7.0x10⁻⁷
J 1.19 (1.08-1.32) 1.43 (1.20-1.72) 8.3x10⁻⁷ 4.9x10⁻⁶
SNP Associations with Breast Cancer
K, L and T also replicate in phase 3
Perlegen Sciences, Inc.
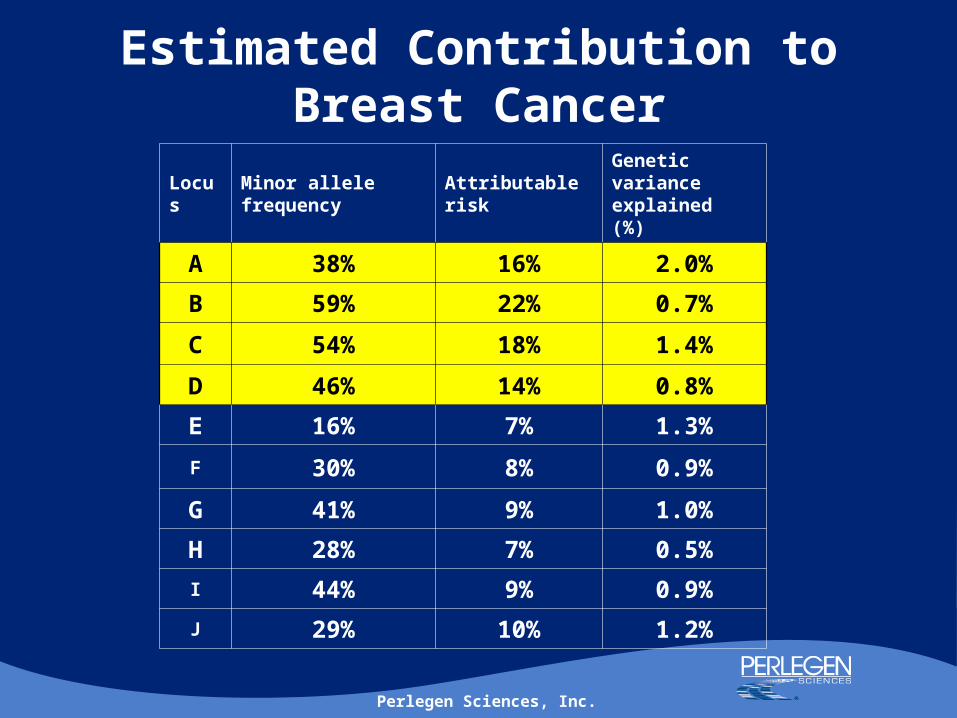
Estimated Contribution to Breast Cancer
Locus Minor allele frequency Attributable risk Genetic variance explained (%)
A 38% 16% 2.0%
B 59% 22% 0.7%
C 54% 18% 1.4%
D 46% 14% 0.8%
E 16% 7% 1.3%
F 30% 8% 0.9%
G 41% 9% 1.0%
H 28% 7% 0.5%
I 44% 9% 0.9%
J 29% 10% 1.2%

Perlegen Sciences, Inc.
Conclusions
• Genome-wide study successful at identifying novel breast cancer predisposition loci
• No loci of major effect (RR>2)
• Many loci of small effect (10s-100s)and many probably missed
• Little overlap with previously suggested candidate loci
• Little evidence of dominance
• Little evidence of age-dependent relative risks
• No evidence yet of (non-multiplicative) interactions
Perlegen Sciences, Inc.
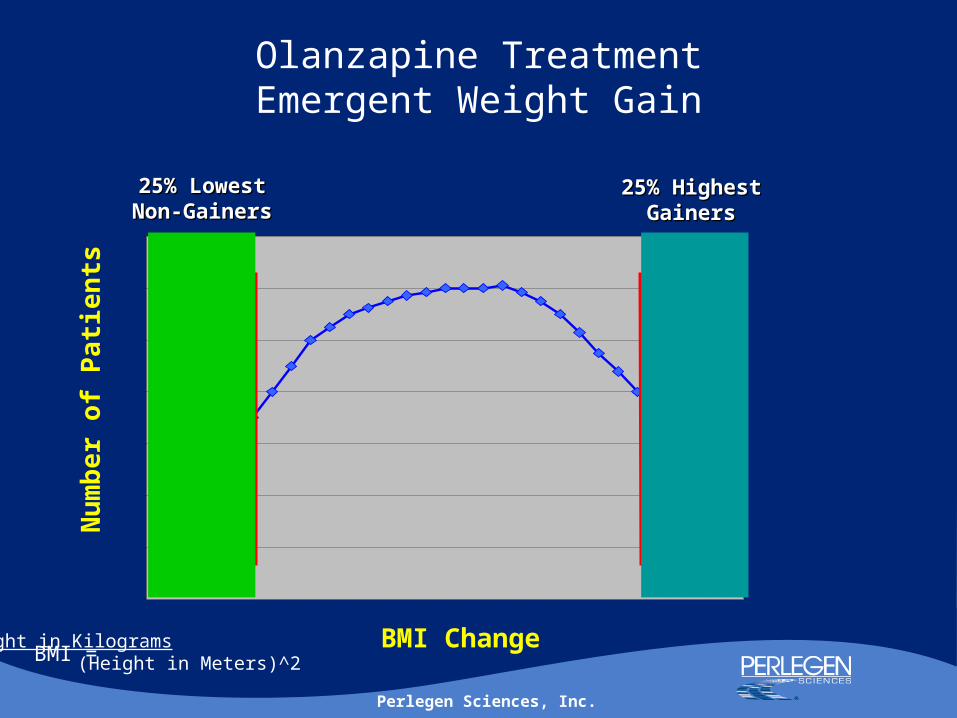
Olanzapine TreatmentEmergent Weight Gain
25% Highest25% HighestGainersGainers
25% Lowest25% LowestNon-GainersNon-Gainers
N=255N=258
Mean BMI
change 7.8
Mean BMI
change -1.9
BMI Change
Nu
mb
er
of
Pa
tie
nts
BMI =Weight in Kilograms
(Height in Meters)^2

Perlegen Sciences, Inc.
Genetic Association with Treatment Emergent Weight Gain
SNP P-VALUE ALLELE FREQ. DIFFERENCE
1 1.4E-06 0.15
2 5.4E-06 0.10
3 5.4E-06 0.12
4 5.8E-06 0.10
5 6.5E-06 0.11
6 6.9E-06 0.10
7 1.2E-05 0.14
8 1.3E-05 0.14
9 1.6E-05 0.13
10 2.1E-05 0.13
11 3.3E-05 0.13

Perlegen Sciences, Inc.
Follow-up of whole genome association results
Test the hypothesis that some genes associated with olanzapine emergent weight gain are also associated with familial obesity
Perform a genetic association study using samples from an independent set of individuals with familial obesity and 11 SNPs from the eight genes that had the strongest evidence for association with treatment-emergent weight gain in the genome-wide study

Perlegen Sciences, Inc.
Extreme Obesity:Extreme Obesity:Proband: BMI≥35Proband: BMI≥35
Normal Weight:Normal Weight: Parent: BMI<27Parent: BMI<27
Optional:Optional:Obese Sibling (BMI>30)Obese Sibling (BMI>30)
Thin Sibling (BMI<25)Thin Sibling (BMI<25)
348 Independent Families 348 Independent Families Optional
Ascertainment of Familial ObesityAscertainment of Familial Obesity

Perlegen Sciences, Inc.
PKHD1 Genetic Association with ObesityPKHD1 Genetic Association with Obesity
Frequency of SNP allele predisposing to weight gain = 0.52 50% of individuals in population have one predisposing allele27% of individuals in population have two predisposing alleles
Relative risk of obesity with one copy of allele = 1.30 (0.93 - 1.81)
Relative risk of obesity with two copies of allele = 1.62 (1.05 - 2.51)
Fraction of obesity attributable to SNP allele = 0.24 (0.027- 0.453)

Perlegen Sciences, Inc.
PKHD1 Mutant Mouse ModelPKHD1 Mutant Mouse Model(Greg Germino, JHU School of Medicine)(Greg Germino, JHU School of Medicine)
The mutant mouse PKHD1 gene lacks exons 3 and 4
Homozygote mutants develop kidney and pancreatic cysts
Heterozygous male mutants are obese, 50.7 +/- 2.9 gversus age and strain matched controls, 36.3 +/- 1.3 g(ANCOVA p= 0.0001)
Heterozygous mutants have increased abdominal andretroperitoneal fat deposits
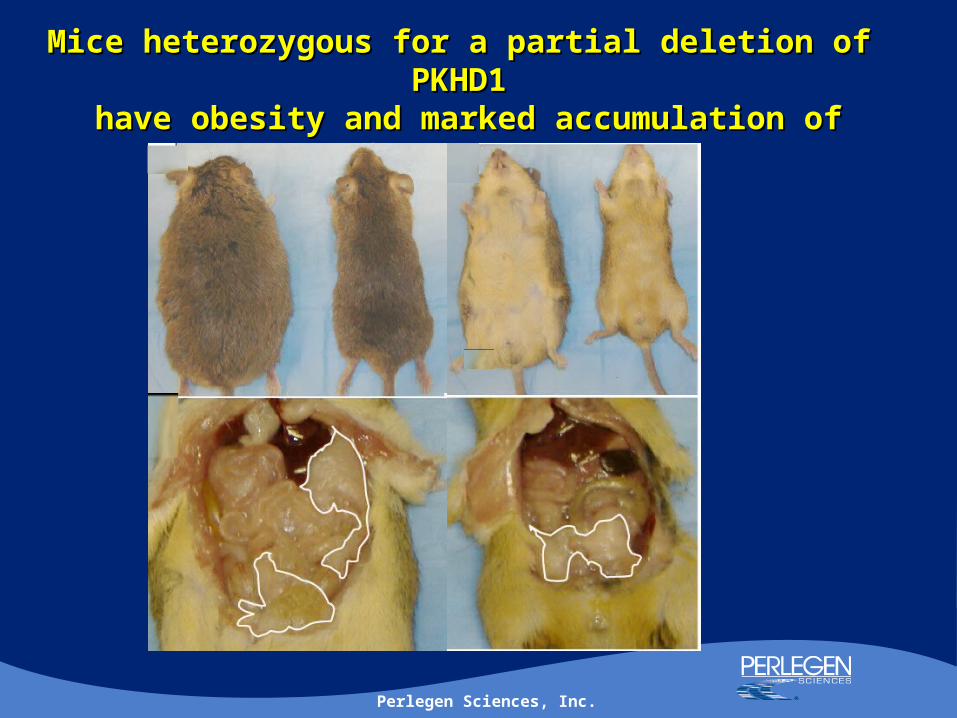
Perlegen Sciences, Inc.
Mice heterozygous for a partial deletion of PKHD1Mice heterozygous for a partial deletion of PKHD1 have obesity and marked accumulation of visceral fathave obesity and marked accumulation of visceral fat
Perlegen Sciences, Inc.
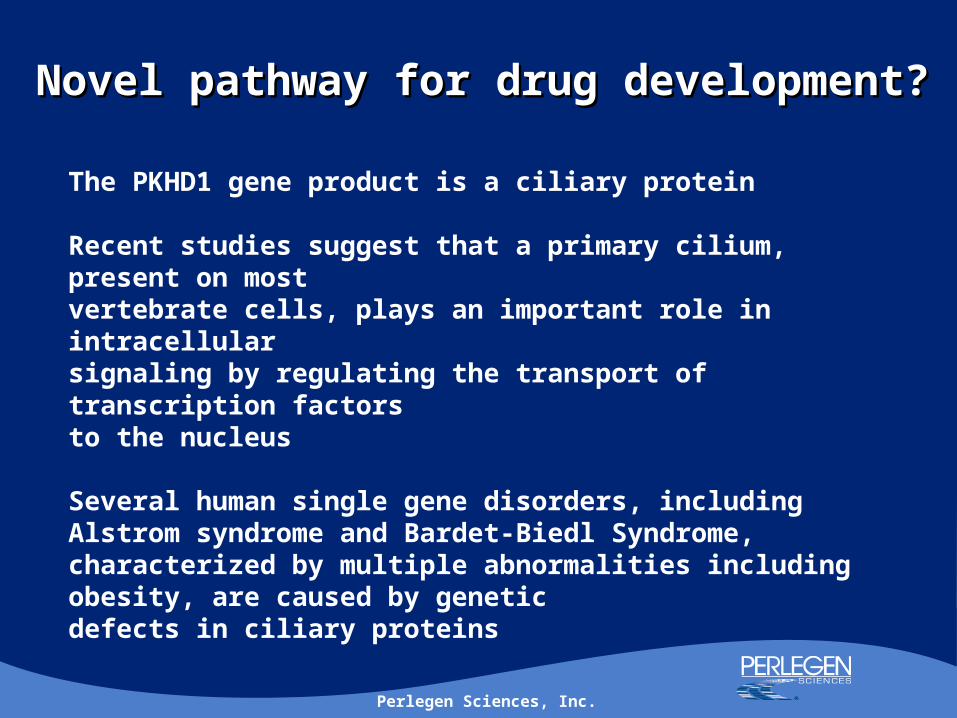
Novel pathway for drug development?Novel pathway for drug development?
The PKHD1 gene product is a ciliary protein
Recent studies suggest that a primary cilium, present on mostvertebrate cells, plays an important role in intracellularsignaling by regulating the transport of transcription factorsto the nucleus
Several human single gene disorders, including Alstrom syndrome and Bardet-Biedl Syndrome, characterized by multiple abnormalities including obesity, are caused by geneticdefects in ciliary proteins

Perlegen Sciences, Inc.
Lessons Learned From SNPAssociation Studies To Date
SNP associations can lead to novel biological insights
It is not possible to predict the fraction of variation of a complex trait determined by a SNP prior to performing an association study
The majority of SNP associations account fora small fraction trait variability
Independent SNP associations, each accounting for asmall fraction of trait variability, can be used in combination to provide clinically useful information
Perlegen Sciences, Inc.
1 1
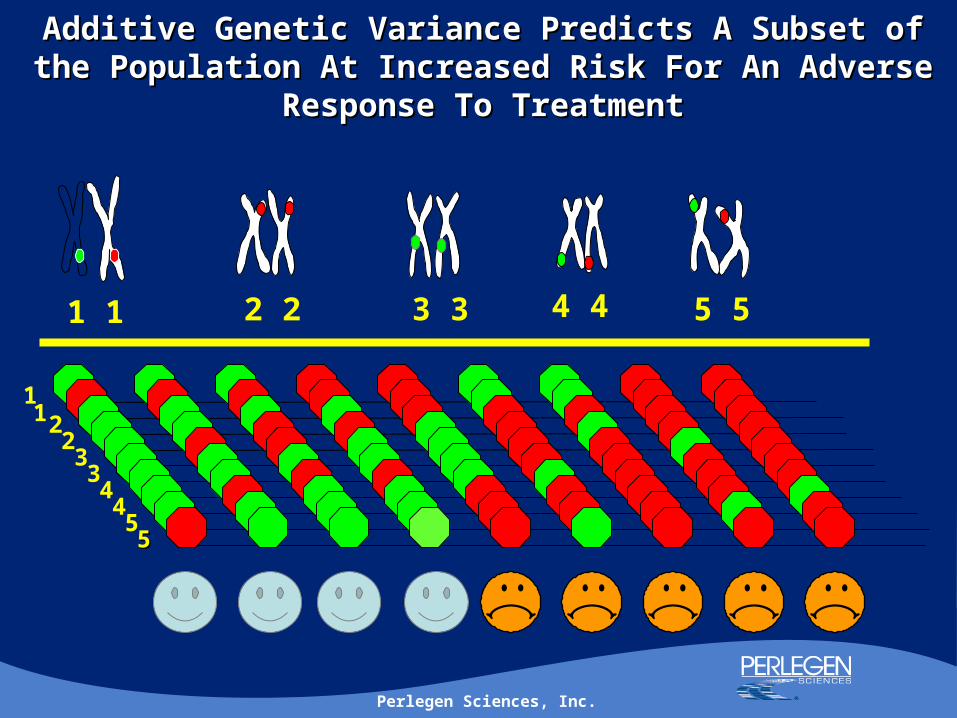
Additive Genetic Variance Predicts A Subset of the Population Additive Genetic Variance Predicts A Subset of the Population At Increased Risk For An Adverse Response To TreatmentAt Increased Risk For An Adverse Response To Treatment
112
23344555
2 2 3 3 4 4 5 5

Perlegen Sciences, Inc.
StratifierStratifier
Ris
k or
Ben
efit
Low
Hig
h

Perlegen Sciences, Inc.