Embed Size (px)
Citation preview

INVESTIGATION
Genetic Architecture of Contemporary Adaptationto Biotic Invasions: Quantitative Trait LocusMapping of Beak Reduction in Soapberry BugsY. Yu1 and Jose A. AndrésDepartment of Biology, University of Saskatchewan, Saskatoon, SK S7N-5E2, Canada
ABSTRACT Biological invasions can result in new selection pressures driven by the establishment of newbiotic interactions. The response of exotic and native species to selection depends critically on the geneticarchitecture of ecologically relevant traits. In the Florida peninsula, the soapberry bug (Jadera haematoloma)has colonized the recently introduced Chinese flametree, Koelreuteria elegans, as a host plant. Driven byfeeding efficiency, the populations associated with this new host have differentiated into a new bug eco-morph characterized by short beaks more appropriate for feeding on the flattened pods of the Chineseflametree. In this study, we have generated a three-generation pedigree from crossing the long-beakedand short-beaked ecomorphs to construct a de novo linkage map and to locate putative quantitative traitlocus (QTL) controlling beak length and body size in J. haematoloma. Using amplified fragment-length poly-morphism markers and a two-way pseudo-testcross design, we have produced two parental maps in sixlinkage groups, covering the known number of chromosomes. QTL analysis revealed one significant QTLfor beak length on a maternal linkage group and the corresponding paternal linkage group. Three QTL werefound for body size. Through single marker regression analysis, nine single markers that could not be placedon the map were also found to be significantly associated with one or both of the two traits. Interestingly, themost significant body size QTL co-localized with the beak length QTL, suggesting linkage disequilibrium orpleiotropic effects of related traits. Our results suggest an oligogenic control of beak length.
KEYWORDSquantitativegenetics
rapid evolutiondiversificationhost associationhemiptera
Adaptive evolution plays a key role in biotic invasions. When a speciesis introduced to a new habitat, it is likely to experience new selectivepressures, and populations of invaders frequently experience rapidevolutionary changes (e.g., Mooney and Cleland 2001; Lee 2002;Lambrinos 2004; Suarez and Tsutsui 2008; Shine 2012). Simulta-neously, invaders also act as selective agents, often driving evolutionarychanges in the exposed native populations (reviewed in Strauss et al.2006). Both evolvability (i.e., the ability of the genetic system to pro-duce and maintain potentially adaptive genetic variants; Hansen 2006)
and the response of invasive and native species to selection dependcritically on the genetic architecture of ecologically relevant traits(see Colautti et al. 2010, 2012).
There are three main approaches to measuring the genetic architec-ture of functional traits. One measure is the G matrix (Lynch and Walsh1998), which is composed of genetic variances and covariances amongtraits sharing developmental and genetic processes. The G matrix canrapidly evolve in natural populations (Doroszuk et al. 2008). However,the only study comparing G matrices between native and invasivepopulations (Calsbeek et al. 2011) to our knowledge found similarmolecular-genetic underpinnings of the matrix elements between in-vasive and native populations. A second measure of genetic architec-ture is the estimate of the relative effects of additive and nonadditive(dominant, epistatic, and pleiotropic) genetic variances on individualtraits. Although generally it is assumed that the response to selectionrelies only on the existence of additive genetic variance, gene inter-actions may play a central role in contemporary evolution becausedirectional epistasis makes gene effects become evolvable and enablesrapid changes in additive effects and evolvability (Carter et al. 2005;Hansen 2006). In invasive species, nonadditive genetic variance seems
Copyright © 2014 Yu and Andrésdoi: 10.1534/g3.113.008334Manuscript received August 25, 2013; accepted for publication December 2, 2013;published Early Online December 17, 2013.This is an open-access article distributed under the terms of the CreativeCommons Attribution Unported License (http://creativecommons.org/licenses/by/3.0/), which permits unrestricted use, distribution, and reproduction in anymedium, provided the original work is properly cited.Supporting information is available online at http://www.g3journal.org/lookup/suppl/doi:10.1534/g3.113.008334/-/DC1.1Corresponding author: Department of Biology, University of Saskatchewan, 112Science Place, Saskatoon, SK S7N-5E2, Canada. E-mail: [email protected]
Volume 4 | February 2014 | 255
Dow
nloaded from https://academ
ic.oup.com/g3journal/article/4/2/255/6028823 by guest on 03 February 2022
to play a key role during the colonization of new habitats (see Lee2002). Similarly, research on native phytophagous insects shiftingonto introduced hosts has highlighted the role of epistasis and othernon-additive genetic effects in the rapid colonization of the invasivehosts (Carroll et al. 2001, 2003; Carroll and Loye 2012). The thirdmeasure of genetic architecture is the dissection of trait variation intoits genomic components facilitated by advances in molecular genetics.Quantitative trait locus (QTL) mapping can reveal the number andtype of genomic regions, and potentially genes, affecting quantitativevariation as well as the number of possible gene interactions. To date,only a few studies have used QTL to look at the genetic basis of“invasiveness” (Linde et al. 2001; Weinig et al. 2007) and to ourknowledge QTL mapping has not yet been used to look at evolution-ary responses of native species to invasions.
Host shifts of phytophagous insects represent the best body ofevidence for the rapid evolution of native species in response to theintroduction of novel species (Strauss et al. 2006). In this article, wefocus on an anthropogenic host-shift in the soapberry bug, Jaderahaematoloma, and use a QTL approach to study the genetic architec-ture of “beak” length, a complex, heritable trait that is closely associ-ated with the species’ ability to colonize new hosts.
Adaptations to biotic invasions in soapberry bugsSoapberry bugs comprise a subfamily of three widespread genera ofseed predator bugs that have become a textbook example of evolutionin action (e.g., Moore and Moore 2006; Futuyma 2013; Freeman andHerron 2013). These insects exploit a broad variety of host plantsfrom the family Sapindaceae (Carroll 2007). In North America andAustralia, different species of soapberry bug show ongoing rapid evo-lution of their mouthparts (stylets or “beaks”) to better match the seeddefense structures of newly introduced hosts (Carroll and Boyd 1992;
Carroll et al. 1997; Dingle et al. 2009). On the Florida peninsula,populations of the Neotropical soapberry bug J. haematoloma feedon the seeds of both the native balloon vine (Cardiospermum corin-dum) and the invasive Chinese flametree (Koelreuteria elegans), whichwas introduced into urban areas about 70 years ago. These two hostsdiffer in fruit size, phenology, and seed chemical defenses (Seigler andKawahara 1976; Carroll and Boyd 1992; Carroll et al. 1998, 2003).Driven by selection as the result of these differences the populationsfeeding on the newly colonized tree (K. elegans) have evolved into the“derived” ecomorph. Several morphological, physiological, and behav-ioral differences exist between the ancestral and derived J. haemato-loma ecomorphs. Possibly the most striking one is the reduction ofbeak length appropriate to exploit the flatter fruits of the invasive tree(Carroll et al. 1998, 2001, 2003; Dingle et al. 2009). Controlled crosses,common garden and artificial selection experiments have shown thatbeak size differences are heritable, that beak length is controlled bymultiple genes, and that epistatic interactions are likely to play a keyrole in the evolution of shorter beaks (Carroll et al. 2001; Carroll 2007;Dingle et al. 2009). This study represents the first attempt to identifythe location, number, and effect of the genomic regions associatedwith beak length, a trait that plays a central role in the trophic di-versification of heteropterans.
MATERIALS AND METHODS
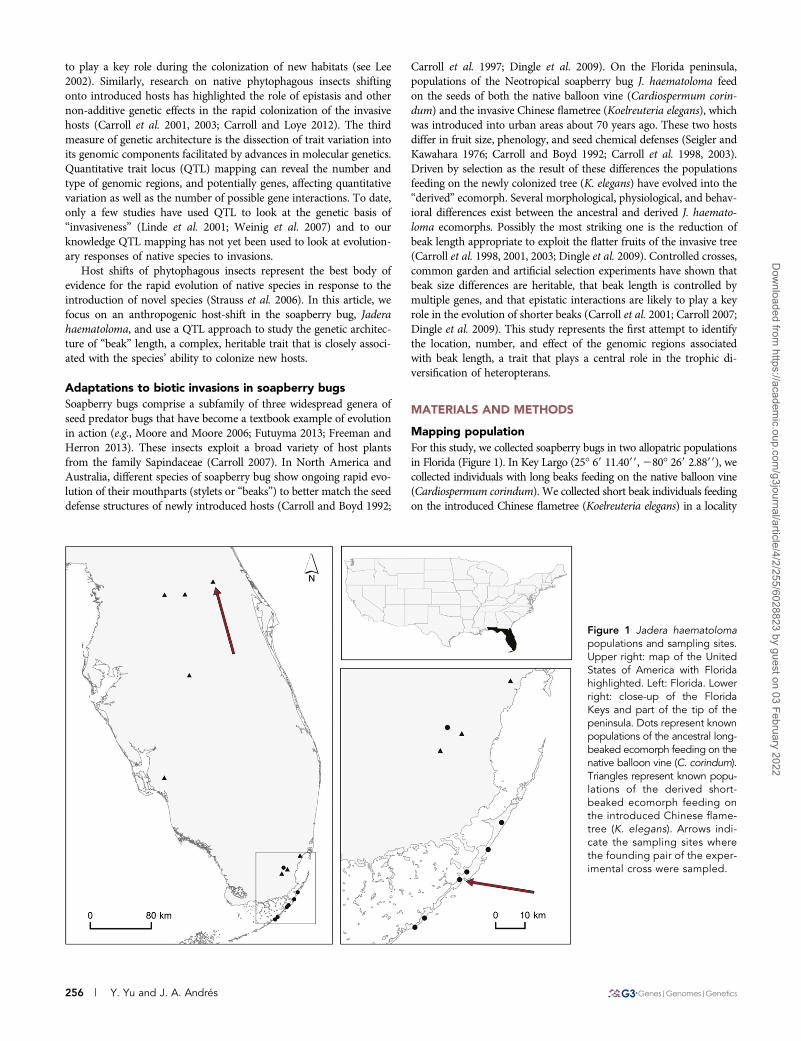
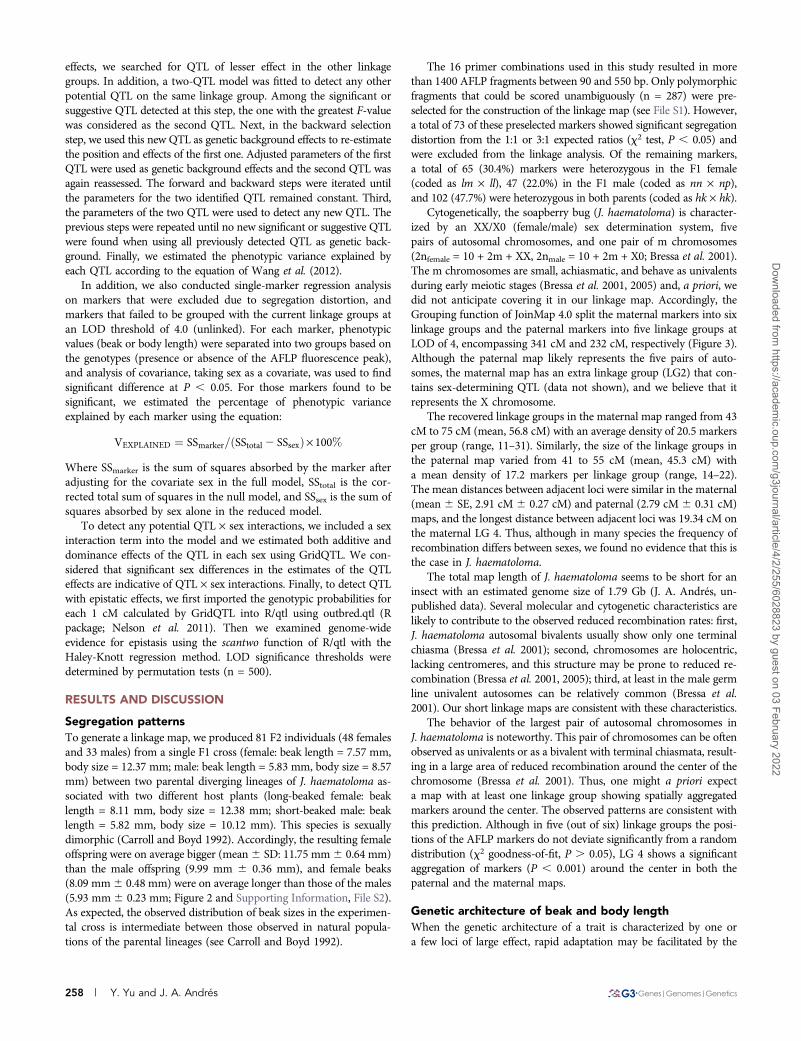
Mapping populationFor this study, we collected soapberry bugs in two allopatric populationsin Florida (Figure 1). In Key Largo (25� 69 11.4099,280� 269 2.8899), wecollected individuals with long beaks feeding on the native balloon vine(Cardiospermum corindum). We collected short beak individuals feedingon the introduced Chinese flametree (Koelreuteria elegans) in a locality
Figure 1 Jadera haematolomapopulations and sampling sites.Upper right: map of the UnitedStates of America with Floridahighlighted. Left: Florida. Lowerright: close-up of the FloridaKeys and part of the tip of thepeninsula. Dots represent knownpopulations of the ancestral long-beaked ecomorph feeding on thenative balloon vine (C. corindum).Triangles represent known popu-lations of the derived short-beaked ecomorph feeding onthe introduced Chinese flame-tree (K. elegans). Arrows indi-cate the sampling sites wherethe founding pair of the exper-imental cross were sampled.
256 | Y. Yu and J. A. Andrés
Dow
nloaded from https://academ
ic.oup.com/g3journal/article/4/2/255/6028823 by guest on 03 February 2022
near Orange City (northern Florida; 28� 579’ 8.5299 281� 189 19.5099).The Euclidean distance between these two populations is 437 km.Therefore, although adult bugs are relatively good flyers, gene flowbetween these two populations is likely to be negligible.
Field-collected individuals were maintained in the laboratory oncommercially available seeds of Koelreuteria paniculata under con-trolled light and temperature conditions similar to those of the fieldcollection sites (13.5 hr of daylight at 29�, 10.5 hr of night time at 20�,fluorescent tubes). Previous second generation cross-rearing experi-ments have shown that rearing long-beaked (ancestral ecomorph)individuals on Koelreuteria seeds affects their developmental timebut has little effects on the beak length of females (Carroll et al. 1997,2001). For mapping purposes we produced an F2 mapping populationfrom a single pair of F1 full sibling in a cross between a first-generation,lab-reared, long-beaked female and short-beaked male. We sexed theresulting offspring at adulthood and measured the body and beak(labial) lengths using a digitally calibrated Leica MZ16A stereomicro-scope (retest correlation = 0.998). All individuals were then stored at220� in 100% ethanol for subsequent genetic analyses.
Fluorescent amplified fragment-length polymorphism(AFLP) methodsWe developed AFLP markers following Vos et al. (1995) with fluo-rescently labeled primers (Hartl and Seefelder 1998; Huang and Sun1999; Ashikawa et al. 1999; Trybush et al. 2006). For each individualbug, we extracted genomic DNA from the thorax using MasterPureDNA Purification Kit (Epicentre) following manufacturer’s instruc-tions. Approximately 100 ng of DNA of each sample was digestedwith 5 U EcoRI and 5 U MseI (New England BioLabs) for 30 min at37� in 1x NEB buffer 4 and bovine serum albumin in a total reactionvolume of 30 mL. Next, to ligate the resulting fragments to the adapt-ers, we added 0.5 mM EcoRI adapter, 5 mM MseI adapter, and 60cohesive end units of T4 DNA ligase (New England Biolabs) in a totalvolume of 10 mL to the 30 mL of digestion reaction mixture. Afterincubation (30� for 90 min), we diluted the samples 10 times withdouble-distilled water and used 2.5 mL of each sample as a template toconduct the preselective polymerase chain reactions (PCRs) in a totalreaction volume of 10 mL (1x PCR buffer, 0.5 mM each of eitherEcoRI-C or EcoRI-G combined with each of MseI-C, MseI-G, orMseI-TC primers, 0.2 mM dNTPs, and 0.5 U QIAGEN Top-TaqDNA polymerase; 72� for 150 sec followed by 94� for 3 min, then22 cycles of [94� for 30 sec, 56� for 1 min, and 72� for 1 min], andfinally 72� for 10 min). We diluted these preamplified products 1:20and used them as template for selective PCR amplifications in 10 mL(1x PCR buffer, 0.5 mM of an EcoRI selective primer and an MseIselective primer, 0.2 mM dNTPs, and 0.5 U QIAGEN Top-Taq DNApolymerase) using a touchdown protocol (95� for 3 min, 13 cycles of[94� for 30 sec, 65� for 30 s with 20.7�/cycle, and 72� for 1 min], 12cycles of [94� for 30 sec, 56� for 30 sec, and 72� for 1 min], and finally72� for 10 min). After prescreening, we selected 16 combinations ofEcoRI 6-FAM2MseI primers that generated clear fluorescence peaks(CTC-CAAG, CTC-CCTA, CTC-CGAC, CTC-CTGC, GAC-CAAG,GAC-CCTA, GAC-CGAC, GAC-CTGC, CAT-GGAT, CAT-GATC,CAT-GCCA, CAT-GTTC, CCA-TCCA, CCA-TCGC, CCA-TCAT,CCA-TCTG). These primers are similar to those designed for otherinsect species butMseI primers contained four selective nucleotidesto help reduce fragment size homoplasy. To assess the reproduc-ibility of our fingerprinting method, the aforementioned protocol(including DNA extractions) was repeated on both parents andgrandparents. Only clearly repeatable peaks were used in the con-struction of the map.
To prepare DNA fragments for separation by capillary electro-phoresis, a sample loading solution was prepared by mixing 0.1 mL of600-LIZ size standard (Applied Biosystems) with 8.9 mL of Hi-DiFormamide (Applied Biosystems), and 1 mL of 1:30 dilution of selec-tive PCR amplification product. Samples were analyzed in ABI 3130xlGenetic Analyzer (Applied Biosystems). The presence or absence offragments was initially scored automatically using GeneMapper v4.1(Applied Biosystems) with a minimum relative fluorescence unit of30; other parameters were left at default. To further reduce size ho-moplasy we only scored fragments within the 90–550 bp size range(Caballero et al. 2008; Paris et al. 2010). Bin and peak calls were thenconfirmed upon manual inspection.
Genetic linkage analysis and map constructionPolymorphic, repeatable AFLP markers were classified into differentsegregation classes depending on the allele patterns of the parents. Intotal, we defined three marker classes using the CP (outbreedingspecies full-sibling family) population type implemented in JoinMap4.0 (Van Ooijen 2006): (1) markers that segregate only in the mother(lm · ll), (2) markers that segregate only in the father (nn · np), and(3) markers that segregate in both parents (hk · hk). The expectedsegregation ratios were 1:1 for the first two classes and 3:1 for the lastone. To evaluate any discrepancy from the expected segregation ratioswe used the x2 goodness-of-fit method as implemented in JoinMap4.0. Markers showing segregation distortion at the significance level ofP = 0.05 were excluded from further analyses. Linkage groups weredetermined using a logarithm of odds (LOD) threshold of 4.0. Mapconstruction was performed using the Kosambi mapping functionand the regression mapping algorithm. Two independent (mater-nal and paternal) maps were generated using lm · ll and nn · npmarkers, respectively, employing a two-way pseudo-testcross strat-egy (Grattapaglia and Sederoff 1994). The positions of thesemarkers were taken to be fixed orders to further populate the pa-rental maps with hk · hk markers segregating in both parents. Thehk · hk markers were then used to compare maternal and paternallinkage groups. To test whether the AFLP markers were randomlydistributed within linkage groups we used the x2 goodness-of-fitmethod proposed by Rouppe van der Voort et al. (1997).
QTL analysisFor our QTL analyses, we used the BCF2 module of GridQTL (Seatonet al. 2006) available online at http://www.gridqtl.org.uk. The statisti-cal approach of this module adopts the methods of Haley et al. (1994).It is suitable for crosses between outbred lines and assumes that thealternative alleles at major QTL affecting the traits of interest are fixed(e.g., lineages with different selection histories). QTL analyses usingthe TREE module, which does not assume fixed QTL, found QTL ofsimilar size on the same linkage groups (data not shown). Significancethresholds were obtained from permutation tests (n = 10,000) as de-scribed in Churchill and Doerge (1994). We considered a QTL sig-nificant if it was detected at either P , 0.01 at the chromosome-widelevel or P , 0.05 at the experiment-wide level. We considered a QTLsuggestive if it was only detected at P, 0.05 at the chromosome-widelevel.
We used a forward and backward selection interval mappingapproach for QTL analysis (Guo et al. 2008; Leach et al. 2012): First,a one-QTL model that included the additive and dominant effects ofa QTL was fitted at each 1 cM by least square methods for beak andbody lengths. If one or more significant or suggestive QTL weredetected, the one showing the highest F-value was considered to bethe first QTL. Second, by using the first QTL as genetic background
Volume 4 February 2014 | Genetics of an Anthropogenic Host Shift | 257
Dow
nloaded from https://academ
ic.oup.com/g3journal/article/4/2/255/6028823 by guest on 03 February 2022
effects, we searched for QTL of lesser effect in the other linkagegroups. In addition, a two-QTL model was fitted to detect any otherpotential QTL on the same linkage group. Among the significant orsuggestive QTL detected at this step, the one with the greatest F-valuewas considered as the second QTL. Next, in the backward selectionstep, we used this new QTL as genetic background effects to re-estimatethe position and effects of the first one. Adjusted parameters of the firstQTL were used as genetic background effects and the second QTL wasagain reassessed. The forward and backward steps were iterated untilthe parameters for the two identified QTL remained constant. Third,the parameters of the two QTL were used to detect any new QTL. Theprevious steps were repeated until no new significant or suggestive QTLwere found when using all previously detected QTL as genetic back-ground. Finally, we estimated the phenotypic variance explained byeach QTL according to the equation of Wang et al. (2012).
In addition, we also conducted single-marker regression analysison markers that were excluded due to segregation distortion, andmarkers that failed to be grouped with the current linkage groups atan LOD threshold of 4.0 (unlinked). For each marker, phenotypicvalues (beak or body length) were separated into two groups based onthe genotypes (presence or absence of the AFLP fluorescence peak),and analysis of covariance, taking sex as a covariate, was used to findsignificant difference at P , 0.05. For those markers found to besignificant, we estimated the percentage of phenotypic varianceexplained by each marker using the equation:
VEXPLAINED ¼ SSmarker=ðSStotal2 SSsexÞ· 100%Where SSmarker is the sum of squares absorbed by the marker afteradjusting for the covariate sex in the full model, SStotal is the cor-rected total sum of squares in the null model, and SSsex is the sum ofsquares absorbed by sex alone in the reduced model.
To detect any potential QTL · sex interactions, we included a sexinteraction term into the model and we estimated both additive anddominance effects of the QTL in each sex using GridQTL. We con-sidered that significant sex differences in the estimates of the QTLeffects are indicative of QTL · sex interactions. Finally, to detect QTLwith epistatic effects, we first imported the genotypic probabilities foreach 1 cM calculated by GridQTL into R/qtl using outbred.qtl (Rpackage; Nelson et al. 2011). Then we examined genome-wideevidence for epistasis using the scantwo function of R/qtl with theHaley-Knott regression method. LOD significance thresholds weredetermined by permutation tests (n = 500).
RESULTS AND DISCUSSION
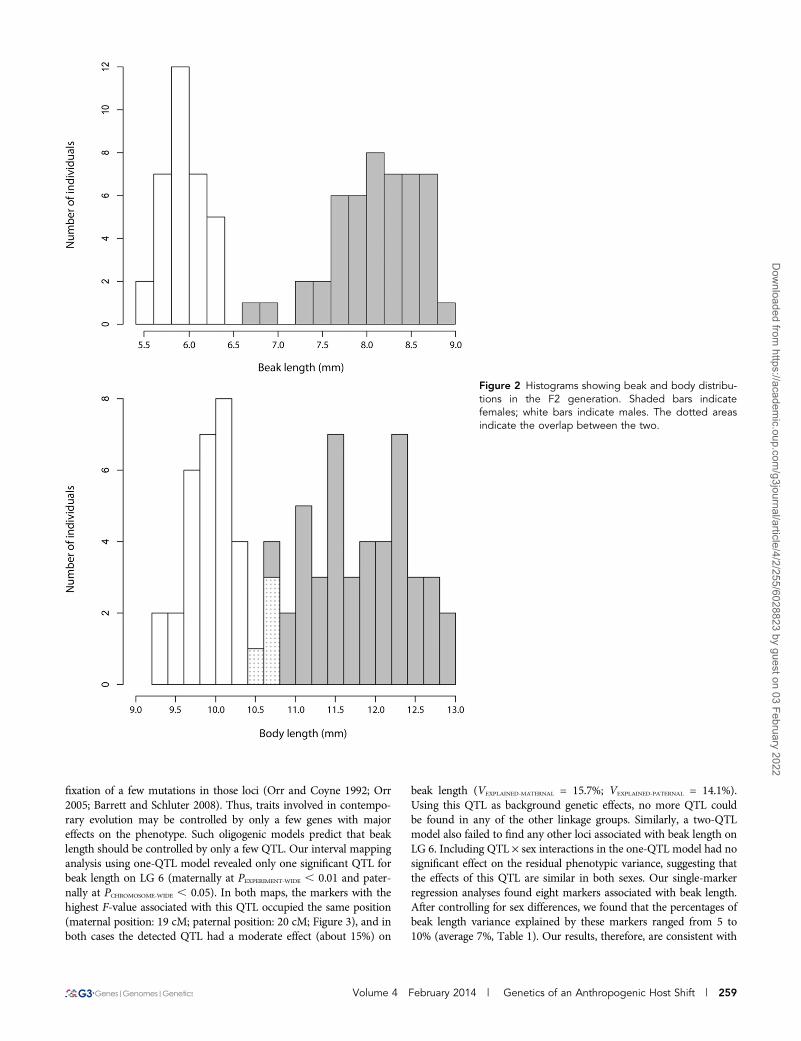
Segregation patternsTo generate a linkage map, we produced 81 F2 individuals (48 femalesand 33 males) from a single F1 cross (female: beak length = 7.57 mm,body size = 12.37 mm; male: beak length = 5.83 mm, body size = 8.57mm) between two parental diverging lineages of J. haematoloma as-sociated with two different host plants (long-beaked female: beaklength = 8.11 mm, body size = 12.38 mm; short-beaked male: beaklength = 5.82 mm, body size = 10.12 mm). This species is sexuallydimorphic (Carroll and Boyd 1992). Accordingly, the resulting femaleoffspring were on average bigger (mean6 SD: 11.75 mm6 0.64 mm)than the male offspring (9.99 mm 6 0.36 mm), and female beaks(8.09 mm6 0.48 mm) were on average longer than those of the males(5.93 mm6 0.23 mm; Figure 2 and Supporting Information, File S2).As expected, the observed distribution of beak sizes in the experimen-tal cross is intermediate between those observed in natural popula-tions of the parental lineages (see Carroll and Boyd 1992).
The 16 primer combinations used in this study resulted in morethan 1400 AFLP fragments between 90 and 550 bp. Only polymorphicfragments that could be scored unambiguously (n = 287) were pre-selected for the construction of the linkage map (see File S1). However,a total of 73 of these preselected markers showed significant segregationdistortion from the 1:1 or 3:1 expected ratios (x2 test, P , 0.05) andwere excluded from the linkage analysis. Of the remaining markers,a total of 65 (30.4%) markers were heterozygous in the F1 female(coded as lm · ll), 47 (22.0%) in the F1 male (coded as nn · np),and 102 (47.7%) were heterozygous in both parents (coded as hk · hk).
Cytogenetically, the soapberry bug (J. haematoloma) is character-ized by an XX/X0 (female/male) sex determination system, fivepairs of autosomal chromosomes, and one pair of m chromosomes(2nfemale = 10 + 2m + XX, 2nmale = 10 + 2m + X0; Bressa et al. 2001).The m chromosomes are small, achiasmatic, and behave as univalentsduring early meiotic stages (Bressa et al. 2001, 2005) and, a priori, wedid not anticipate covering it in our linkage map. Accordingly, theGrouping function of JoinMap 4.0 split the maternal markers into sixlinkage groups and the paternal markers into five linkage groups atLOD of 4, encompassing 341 cM and 232 cM, respectively (Figure 3).Although the paternal map likely represents the five pairs of auto-somes, the maternal map has an extra linkage group (LG2) that con-tains sex-determining QTL (data not shown), and we believe that itrepresents the X chromosome.
The recovered linkage groups in the maternal map ranged from 43cM to 75 cM (mean, 56.8 cM) with an average density of 20.5 markersper group (range, 11–31). Similarly, the size of the linkage groups inthe paternal map varied from 41 to 55 cM (mean, 45.3 cM) witha mean density of 17.2 markers per linkage group (range, 14–22).The mean distances between adjacent loci were similar in the maternal(mean 6 SE, 2.91 cM 6 0.27 cM) and paternal (2.79 cM 6 0.31 cM)maps, and the longest distance between adjacent loci was 19.34 cM onthe maternal LG 4. Thus, although in many species the frequency ofrecombination differs between sexes, we found no evidence that this isthe case in J. haematoloma.
The total map length of J. haematoloma seems to be short for aninsect with an estimated genome size of 1.79 Gb (J. A. Andrés, un-published data). Several molecular and cytogenetic characteristics arelikely to contribute to the observed reduced recombination rates: first,J. haematoloma autosomal bivalents usually show only one terminalchiasma (Bressa et al. 2001); second, chromosomes are holocentric,lacking centromeres, and this structure may be prone to reduced re-combination (Bressa et al. 2001, 2005); third, at least in the male germline univalent autosomes can be relatively common (Bressa et al.2001). Our short linkage maps are consistent with these characteristics.
The behavior of the largest pair of autosomal chromosomes inJ. haematoloma is noteworthy. This pair of chromosomes can be oftenobserved as univalents or as a bivalent with terminal chiasmata, result-ing in a large area of reduced recombination around the center of thechromosome (Bressa et al. 2001). Thus, one might a priori expecta map with at least one linkage group showing spatially aggregatedmarkers around the center. The observed patterns are consistent withthis prediction. Although in five (out of six) linkage groups the posi-tions of the AFLP markers do not deviate significantly from a randomdistribution (x2 goodness-of-fit, P . 0.05), LG 4 shows a significantaggregation of markers (P , 0.001) around the center in both thepaternal and the maternal maps.
Genetic architecture of beak and body lengthWhen the genetic architecture of a trait is characterized by one ora few loci of large effect, rapid adaptation may be facilitated by the
258 | Y. Yu and J. A. Andrés
Dow
nloaded from https://academ
ic.oup.com/g3journal/article/4/2/255/6028823 by guest on 03 February 2022
fixation of a few mutations in those loci (Orr and Coyne 1992; Orr2005; Barrett and Schluter 2008). Thus, traits involved in contempo-rary evolution may be controlled by only a few genes with majoreffects on the phenotype. Such oligogenic models predict that beaklength should be controlled by only a few QTL. Our interval mappinganalysis using one-QTL model revealed only one significant QTL forbeak length on LG 6 (maternally at PEXPERIMENT-WIDE , 0.01 and pater-nally at PCHROMOSOME-WIDE , 0.05). In both maps, the markers with thehighest F-value associated with this QTL occupied the same position(maternal position: 19 cM; paternal position: 20 cM; Figure 3), and inboth cases the detected QTL had a moderate effect (about 15%) on
beak length (VEXPLAINED-MATERNAL = 15.7%; VEXPLAINED-PATERNAL = 14.1%).Using this QTL as background genetic effects, no more QTL couldbe found in any of the other linkage groups. Similarly, a two-QTLmodel also failed to find any other loci associated with beak length onLG 6. Including QTL · sex interactions in the one-QTL model had nosignificant effect on the residual phenotypic variance, suggesting thatthe effects of this QTL are similar in both sexes. Our single-markerregression analyses found eight markers associated with beak length.After controlling for sex differences, we found that the percentages ofbeak length variance explained by these markers ranged from 5 to10% (average 7%, Table 1). Our results, therefore, are consistent with
Figure 2 Histograms showing beak and body distribu-tions in the F2 generation. Shaded bars indicatefemales; white bars indicate males. The dotted areasindicate the overlap between the two.
Volume 4 February 2014 | Genetics of an Anthropogenic Host Shift | 259
Dow
nloaded from https://academ
ic.oup.com/g3journal/article/4/2/255/6028823 by guest on 03 February 2022
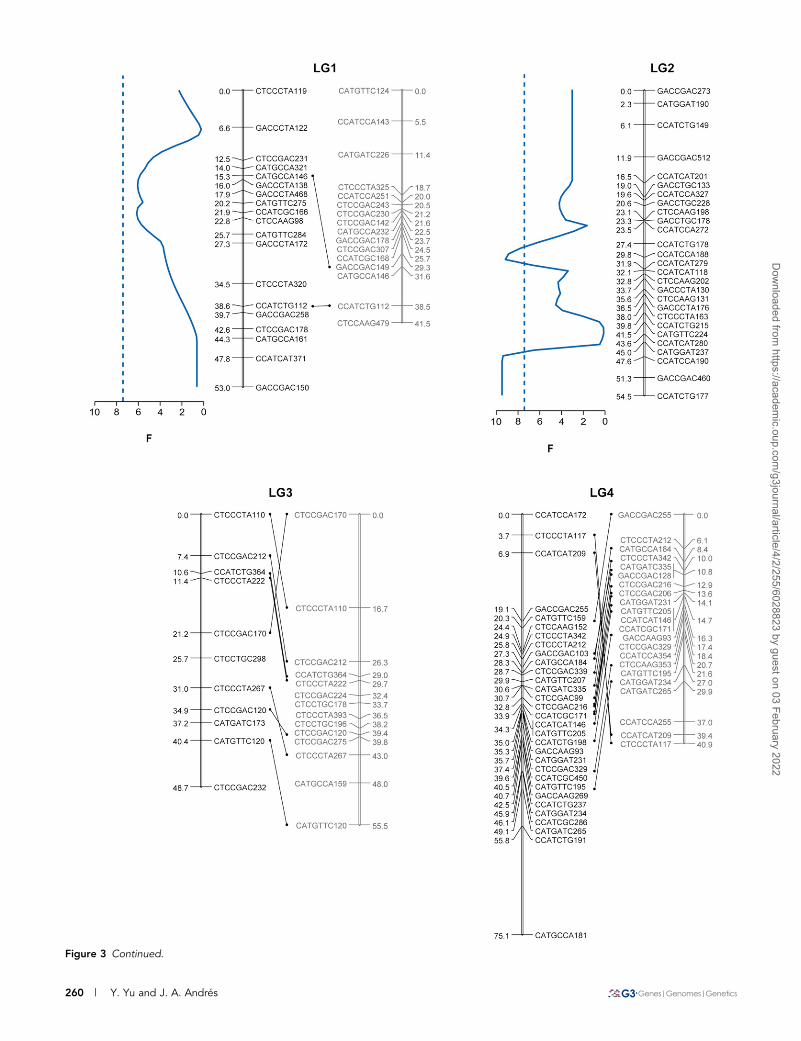
Figure 3 Continued.
260 | Y. Yu and J. A. Andrés
Dow
nloaded from https://academ
ic.oup.com/g3journal/article/4/2/255/6028823 by guest on 03 February 2022
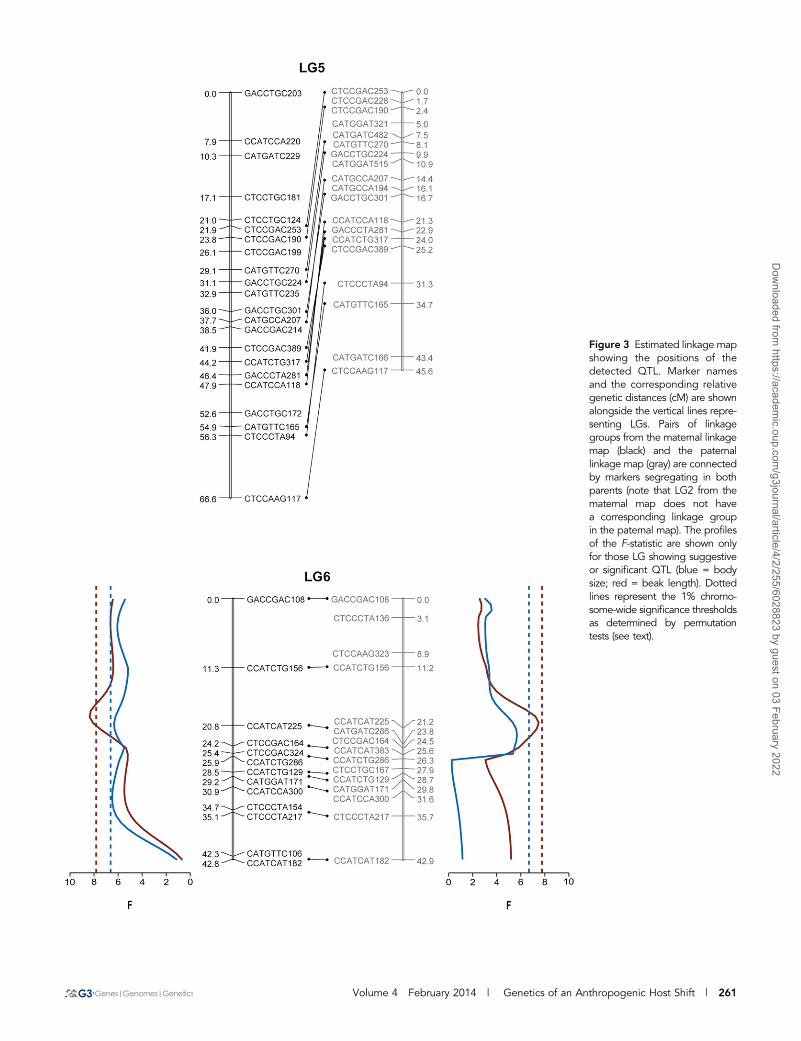
Figure 3 Estimated linkage mapshowing the positions of thedetected QTL. Marker namesand the corresponding relativegenetic distances (cM) are shownalongside the vertical lines repre-senting LGs. Pairs of linkagegroups from the maternal linkagemap (black) and the paternallinkage map (gray) are connectedby markers segregating in bothparents (note that LG2 from thematernal map does not havea corresponding linkage groupin the paternal map). The profilesof the F-statistic are shown onlyfor those LG showing suggestiveor significant QTL (blue = bodysize; red = beak length). Dottedlines represent the 1% chromo-some-wide significance thresholdsas determined by permutationtests (see text).
Volume 4 February 2014 | Genetics of an Anthropogenic Host Shift | 261
Dow
nloaded from https://academ
ic.oup.com/g3journal/article/4/2/255/6028823 by guest on 03 February 2022

an oligogenic model in which the rapid evolution of beak length tobetter match the fruit size of a newly introduced host is controlled bya limited number of loci of substantial effect.
However, the number and effect of QTL observed in our studyhave to be interpreted cautiously. First, the relatively small size of ourmapping family results in a limited power to detect QTL of smalleffect and in an overestimate of the effect of the detected ones (Beavis1998; Xu 2003). This is also true for QTL found in regions showinglow recombination rates (Noor et al. 2001). Second, the number,position, and effect of QTL may be specific for the parental popula-tions analyzed and further QTL may be found in different geneticbackgrounds. Therefore, the located QTL could reflect simple within-population variation rather than evolved differentiation betweenecomorphs (Bradshaw et al. 2012). These potential caveats do notnecessarily compromise our results. However, further studies involv-ing several crosses (and possibly recombinant inbred line populations)are needed to get a definitive picture of the number of genetic ele-ments determining beak length in soapberry bugs.
From an adaptive perspective, differences in beak length are themost interesting because of the clear ecological relevance of this trait.Yet, bugs colonizing the introduced tree differ from the ancestral bugsin a variety of morphological and physiological traits. Previous studieshave shown that although there are no significant differences in bodysize between bugs feeding on the introduced and native host (Carrolland Boyd 1992), hybrid lines with relatively longer beaks tend to bebigger (Carroll et al. 2001), suggesting that these two traits are notfully independent. The beak length QTL found on LG 6 colocalizeswith a suggestive QTL for body size (PCHROMOSOME-WIDE = 0.02, VEXPLAINED =12.2%; Figure 3), indicating either linkage disequilibrium betweentwo different beak and body length QTL or a single QTL withpleiotropic effects. In this case, including QTL · sex interactionsin the one-QTL model had significant effect on the residual bodylength variance, indicating that the effects of this QTL are differentbetween sexes. Controlling for the effect of this QTL on LG 6, wefound two more QTL related to overall body size differences in thematernal map (Figure 3). The first of these QTL is located on theputative X chromosome (LG 2) and had a moderate effect on bodylength (PEXPERIMENT-WIDE , 0.01, VEXPLAINED = 11.8%). The second one islocated in LG1 (PCHROMOSOME-WIDE , 0.01, VEXPLAINED = 5.9%). Single-
marker regression analyses found three markers significantly asso-ciated with body length. After controlling for sex, we found thatthe percentages of body size variance explained by these markersranged from 8 to 13% (average 9%). Interestingly, two of them(CCATCAT186 and CCATCTG199, Table 1) had significant effectson both beak length and body size. Even more interestingly,CCATCTG199 showed opposite effects on the two traits. This find-ing again shows that though developmentally and/or genetically in-terrelated, these two traits have different genetic architectures.
Our findings altogether revealed a complex genetic architectureunderlying beak diversification in soapberry bugs. Former studiesshowed that differences in beak length involved a substantial amountof both additive and nonadditive, particularly epistatic, geneticvariation (Carroll et al. 2001; Carroll 2007). Thus a priori, we expectedto detect significant QTL · QTL interactions. In contrast, with thetwo-dimensional two-QTL genome scan using the Haley-Knott re-gression method in R/qtl, we could not find any potential QTL inter-actions for beak length. This apparent contradiction between ourresults and those of previous studies is likely to be the result of ourlow power to detect epistasis. Detecting epistasis is far more difficultthan detecting single QTL and requires relatively big samples sizes(n . 400), especially in the case of interactions involving dominanceeffects (Mao and Da 2005; Wei et al. 2010). Dominance is an impor-tant component of variance in beak length in soapberry bugs (Carrollet al. 2001; Carroll 2007). Therefore, it is not entirely surprising thatwe could not detect any significant epistatic effects. Similarly, our two-dimensional two-QTL genome scan for body size could not detect anysignificant QTL interactions.
To conclude, contrasting views still exist on the number ofunderlying loci and magnitude of allelic effects involved in adaptationin natural populations. At the two ends of a continuum, adaptiveevolution can be driven by changes in many genes of minor effect(polygenic model), or by mutations in a few genes of major effect(oligogenic model; Orr and Coyne 1992; Orr 2005). Although rapidlarge phenotypic shifts observed in Jadera beaks suggest the existenceof loci of relatively large effects (Orr 2005; Barrett and Schluter 2008),comparative and experimental evidence (Carroll et al. 2003; Stern andOrgogozo 2009) also point toward the presence of small effect andepistatic loci. A major contribution of our work is the assessment ofthe number of loci involved in beak reduction. Our results suggest anoligogenic control of beak length.
Finally, our findings provide a framework for future identificationof the genes responsible for rapid beak length differentiation usinga combination of fine-mapping, a candidate gene approach, andfunctional analysis. Ultimately, these experiments will help us tounderstand the evolution of beak length differences associated withother anthropogenic host-shifts, such as the Australian red-eyedbug, Leptocoris tagalicus, which has colonized two introduced spe-cies of invasive balloon vines that have much larger fruits than thenative hosts (Carroll 2007).
ACKNOWLEDGMENTSWe thank Scott P. Carroll for all his support and comments on anearly version of this manuscript. We also thank Aaron Beattie for hishelpful comments and discussion. We are indebted to OmidTavassoly, Jeff Hudson, Yves Plante, and Pamela Hind for helpingus with the bug colonies, morphological measurements, and AFLPgenotyping. We also thank the associate editor, James Holland, andthe two anonymous reviewers for their detailed reviews and insights.This study was funded by a Discovery-grant (Natural Sciences andEngineering Research Council of Canada) to J.A.A.
n Table 1 Results of single-marker analysis using analysis ofcovariance on markers that were unlinked at LOD ,4 (in bold)and markers with significant segregation distortion
MarkerBeak Length Body Size
Allele Effect P Value %a Allele Effect P Value %a
CCATCAT186 20.08 0.021 6.7 0.11 0.009b 8.4CCATCTG199 20.09 0.036 5.5 20.32 0.001 13.0CCATCTG241 20.34 0.020 6.4 ns ns nsCTCCCTA146 20.34 0.005 9.7 ns ns nsCTCCCTA204 20.18 0.022 6.6 ns ns nsCTCCAAG178 20.11 0.048 4.9 ns ns nsCCATCGC293 20.03 0.017 7.1 ns ns nsGACCGAC234 0.18 0.008b 8.7 ns ns nsCATGTTC148 ns ns ns 20.28 0.035 5.6
Allele effect: a positive value indicates that the “dominant” allele (peak present)increases the trait value, and a negative value indicates that the dominant alleledecreases the trait value; allele effect in italics: indistinguishable additive anddominance effects. Note that allele origins are unknown due to using of outbredlines. LOD, logarithm of odds; ns, nonsignificant.a
Percentage of the trait variation explained by this marker.b
A significant interaction between sex and marker was present.
262 | Y. Yu and J. A. Andrés
Dow
nloaded from https://academ
ic.oup.com/g3journal/article/4/2/255/6028823 by guest on 03 February 2022

LITERATURE CITEDAshikawa, I., Y. Fukuta, K. Tamura, and T. Yagi, 1999 Application of AFLP
technique that uses non-radioactive fluorescent primers to the detectionof genetic diversity in Japanese rice cultivars and cloning of DNA se-quences derived from an Indica genome. Breed. Sci. 49: 225–231.
Barrett, R. D. H., and D. Schluter, 2008 Adaptation from standing geneticvariation. Trends Ecol. Evol. 23: 38–44.
Beavis, W. D., 1998 QTL Analyses: Power, Precision, and Accuracy, pp.145–161 in Molecular Dissection of Complex Traits, edited by A. H.Paterson. CRC Press, Boca Raton, FL.
Bradshaw, W. E., K. J. Emerson, J. M. Catchen, W. A. Cresko, and C. M.Holzapfel, 2012 Footprints in time: comparative quantitative trait locimapping of the pitcher-plant mosquito, Wyeomyia smithii. Proc. R. Soc.B Biol. Sci. 279: 4551–4558.
Bressa, M. J., A. G. Papeschi, and M. L. Larramendy, 2001 Autosomalunivalents as a common meiotic feature in Jadera haematoloma (Herrich-Schaeffer, 1847) and Jadera sanguinolenta (Fabricius, 1775) (Heteroptera:Rhopalidae: Serinethinae). Eur. J. Entomol. 98: 151–157.
Bressa, M. J., M. L. Larramendy, and A. G. Papeschi, 2005 Heterochromatincharacterization in five species of Heteroptera. Genetica 124: 307–317.
Caballero, A., H. Quesada, and E. Rolán-Alvarez, 2008 Impact of amplifiedfragment length polymorphism size homoplasy on the estimation ofpopulation genetic diversity and the detection of selective loci. Genetics179: 539–554.
Calsbeek, B., S. Lavergne, M. Patel, and J. Molofsky, 2011 Comparing thegenetic architecture and potential response to selection of invasive andnative populations of reed canary grass. Evol. Appl. 4: 726–735.
Carroll, S. P., 2007 Natives adapting to invasive species: ecology, genes, andthe sustainability of conservation. Ecol. Res. 22: 892–901.
Carroll, S. P., and C. Boyd, 1992 Host race radiation in the soapberry bug:natural history with the history. Evolution 46: 1052–1069.
Carroll, S. P., and J. E. Loye, 2012 Soapberry bug (Hemiptera: Rhopalidae:Serinethinae) native and introduced host plants: biogeographic back-ground of anthropogenic evolution. Ann. Entomol. Soc. Am. 105: 671–684.
Carroll, S. P., H. Dingle, and S. P. Klassen, 1997 Genetic differentiation offitness-associated traits among rapidly evolving populations of thesoapberry bug. Evolution 51: 1182–1188.
Carroll, S. P., S. P. Klassen, and H. Dingle, 1998 Rapidly evolving adapta-tions to host ecology and nutrition in the soapberry bug. Evol. Ecol. 12:955–968.
Carroll, S. P., H. Dingle, T. R. Famula, and C. W. Fox, 2001 Genetic ar-chitecture of adaptive differentiation in evolving host races of the soap-berry bug, Jadera haematoloma. Genetica 112–113: 257–272.
Carroll, S. P., H. Dingle, and T. R. Famula, 2003 Rapid appearance ofepistasis during adaptive divergence following colonization. Proc. Biol.Sci. 270: S80–S83.
Carter, A. J. R., J. Hermisson, and T. F. Hansen, 2005 The role of epistaticgene interactions in the response to selection and the evolution ofevolvability. Theor. Popul. Biol. 68: 179–196.
Churchill, G. A., and R. W. Doerge, 1994 Empirical threshold values forquantitative trait mapping. Genetics 138: 963–971.
Colautti, R. I., C. G. Eckert, and S. C. H. Barrett, 2010 Evolutionary con-straints on adaptive evolution during range expansion in an invasiveplant. Proc. R. Soc. B Biol. Sci. 277: 1799–1806.
Colautti, R. I., C.-R. Lee, and T. Mitchell-Olds, 2012 Origin, fate, andarchitecture of ecologically relevant genetic variation. Curr. Opin. PlantBiol. 15: 199–204.
Dingle, H., S. P. Carroll, and T. R. Famula, 2009 Influence of genetic ar-chitecture on contemporary local evolution in the soapberry bug, Jaderahaematoloma: artificial selection on beak length. J. Evol. Biol. 22: 2031–2040.
Doroszuk, A., M. W. Wojewodzic, G. Gort, and J. E. Kammenga,2008 Rapid divergence of genetic variance—covariance matrix withina natural population. Am. Nat. 171: 291–304.
Freeman, S., and J. C. Herron, 2013 Evolutionary Analysis. Pearson Edu-cation, Limited, Hong Kong.
Futuyma, D. J., 2013 Evolution. Sinauer Associates, Inc., Publishers, Sun-derland, MA.
Grattapaglia, D., and R. Sederoff, 1994 Genetic linkage maps of Eucalyptusgrandis and Eucalyptus urophylla using a pseudo-testcross: mappingstrategy and RAPD markers. Genetics 137: 1121–1137.
Guo, Y.-M., G. J. Lee, A. L. Archibald, and C. S. Haley, 2008 Quantitativetrait loci for production traits in pigs: a combined analysis of twoMeishan · Large White populations. Anim. Genet. 39: 486–495.
Haley, C. S., S. A. Knott, and J. M. Elsen, 1994 Mapping quantitative traitloci in crosses between outbred lines using least squares. Genetics 136:1195–1207.
Hansen, T. F., 2006 The evolution of genetic architecture. Annu. Rev. Ecol.Evol. Syst. 37: 123–157.
Hartl, L., and S. Seefelder, 1998 Diversity of selected hop cultivars detectedby fluorescent AFLPs. Theor. Appl. Genet. 96: 112–116.
Huang, J., and M. Sun, 1999 A modified AFLP with fluorescence-labelledprimers and automated DNA sequencer detection for efficient finger-printing analysis in plants. Biotechnol. Tech. 13: 277–278.
Lambrinos, J. G., 2004 How interactions between ecology and evolutioninfluence contemporary invasion dynamics. Ecology 85: 2061–2070.
Leach, R. J., R. G. O’Neill, J. L. Fitzpatrick, J. L. Williams, and E. J. Glass,2012 Quantitative trait loci associated with the immune response toa bovine respiratory syncytial virus vaccine. PLoS ONE 7: e33526.
Lee, C. E., 2002 Evolutionary genetics of invasive species. Trends Ecol. Evol.17: 386–391.
Linde, M., S. Diel, and B. Neuffer, 2001 Flowering ecotypes of Capsellabursa-pastoris(L.) Medik. (Brassicaceae) analysed by a cosegregation ofphenotypic characters (QTL) and molecular markers. Ann. Bot. (Lond.)87: 91–99.
Lynch, M., and B. Walsh, 1998 Genetics and Analysis of Quantitative Traits.Sinauer Associates, Incorporated, Sunderland, MA.
Mao, Y., and Y. Da, 2005 Statistical power for detecting epistasis QTLeffects under the F-2 design. Genet. Sel. Evol. 37: 129.
Mooney, H. A., and E. E. Cleland, 2001 The evolutionary impact of invasivespecies. Proc. Natl. Acad. Sci. USA 98: 5446–5451.
Moore, J., and R. Moore, 2006 Evolution 101. Greenwood PublishingGroup, Westport, CT.
Nelson, R. M., X. Shen, and Ö. Carlborg, 2011 qtl.outbred: interfacing outbredline cross data with the R/qtl mapping software. BMC Res. Notes 4: 154.
Noor, M. A. F., A. L. Cunningham, and J. C. Larkin, 2001 Consequences ofrecombination rate variation on quantitative trait locus mapping studies:simulations based on the Drosophila melanogaster genome. Genetics 159:581–588.
Orr, H. A., 2005 The genetic theory of adaptation: a brief history. Nat. Rev.Genet. 6: 119–127.
Orr, H. A., and J. A. Coyne, 1992 The genetics of adaptation: a reassess-ment. Am. Nat. 140: 725.
Paris, M., B. Bonnes, G. F. Ficetola, B. N. Poncet, and L. Després,2010 Amplified fragment length homoplasy: in silico analysis for modeland non-model species. BMC Genomics 11: 287.
Rouppe van der Voort, J. N. A. M., P. van Zandvoort, H. J. van Eck, R. T.Folkertsma, R. C. Hutten et al., 1997 Use of allele specificity of comi-grating AFLP markers to align genetic maps from different potato gen-otypes. Mol. Gen. Genet. MGG 255: 438–447.
Seaton, G., J. Hernandez, J.-A. Grunchec, I. White, J. Allen et al.,2006 GridQTL: a grid portal for QTL mapping of compute intensivedatasets, in Proceedings of the 8th World Congress on Genetics Applied toLivestock Production, Belo Horizonte, Brazil.
Seigler, D. S., and W. Kawahara, 1976 New reports of cyanolipids fromsapindaceous plants. Biochem. Syst. Ecol. 4: 263–265.
Shine, R., 2012 Invasive species as drivers of evolutionary change: canetoads in tropical Australia. Evol. Appl. 5: 107–116.
Stern, D. L., and V. Orgogozo, 2009 Is genetic evolution predictable? Sci-ence 323: 746–751.
Strauss, S. Y., J. A. Lau, and S. P. Carroll, 2006 Evolutionary responses ofnatives to introduced species: what do introductions tell us about naturalcommunities? Ecol. Lett. 9: 357–374.
Volume 4 February 2014 | Genetics of an Anthropogenic Host Shift | 263
Dow
nloaded from https://academ
ic.oup.com/g3journal/article/4/2/255/6028823 by guest on 03 February 2022
Suarez, A. V., and N. D. Tsutsui, 2008 The evolutionary consequences ofbiological invasions. Mol. Ecol. 17: 351–360.
Trybush, S., S. Hanley, K.-H. Cho, �S. Jahodová, M. Grimmer et al.,2006 Getting the most out of fluorescent amplified fragment lengthpolymorphism. Can. J. Bot. 84: 1347–1354.
Van Ooijen, J. W., 2006 JoinMap 4, Software for the Calculation of Gene Tic LinkageMaps In Experimental Populations. Kyazma B. V., Wageningen, Netherlands.
Vos, P., R. Hogers, M. Bleeker, M. Reijans, T. van de Lee et al., 1995 AFLP:a new technique for DNA fingerprinting. Nucleic Acids Res. 23: 4407–4414.
Wang, S. Z., X. X. Hu, Z. P. Wang, X. C. Li, Q. G. Wang et al.,2012 Quantitative trait loci associated with body weight and abdominal
fat traits on chicken chromosomes 3, 5 and 7. Genet. Mol. Res. GMR 11:956–965.
Wei, W.-H., S. Knott, C. S. Haley, and D.-J. de Koning, 2010 Controllingfalse positives in the mapping of epistatic QTL. Heredity 104: 401–409.
Weinig, C., M. T. Brock, J. A. Dechaine, and S. M. Welch, 2007 Resolvingthe genetic basis of invasiveness and predicting invasions. Genetica 129:205–216.
Xu, S., 2003 Estimating polygenic effects using markers of the entire genome.Genetics 163: 789–801.
Communicating editor: J. B. Holland
264 | Y. Yu and J. A. Andrés
Dow
nloaded from https://academ
ic.oup.com/g3journal/article/4/2/255/6028823 by guest on 03 February 2022


![adityatekkali.edu.inadityatekkali.edu.in/autonomous/cserevised.doc · Web viewUnderstand dynamic scheduling methods and their adaptation to contemporary Microprocessor design. [3,5]](https://img.pdfslide.us/doc/110x75/5aa523e27f8b9ae7438cfd0f/viewunderstand-dynamic-scheduling-methods-and-their-adaptation-to-contemporary-microprocessor.jpg)