Embed Size (px)
Citation preview
IEEE TRANSACTIONS ON VISUALIZATION AND COMPUTER GRAPHICS 1
The General Pinhole Camera: Effective and
Efficient Non-Uniform Sampling for VisualizationVoicu Popescu, Paul Rosen, Laura Arns, Xavier Tricoche
Chris Wyman, Member, IEEE, and Christoph Hoffmann
Abstract—We introduce the general pinhole camera (GPC), defined by a center of projection (i.e. the pinhole), an
image plane, and a set of sampling locations in the image plane. We demonstrate the advantages of the GPC in
the contexts of remote visualization, of focus plus context visualization, and of extreme antialiasing, which benefit
from the GPC sampling flexibility. For remote visualization we describe a GPC that allows zooming-in at the client
without the need for transferring additional data from the server. For focus plus context visualization we describe a
GPC with multiple regions of interest with sampling rate continuity to the surrounding areas. For extreme
antialiasing we describe a GPC variant that allows supersampling locally with a very high number of color samples
per output pixel (e.g. 1024x), supersampling levels that are out of reach for conventional approaches that
supersample the entire image. The GPC supports many types of data, including surface geometry, volumetric, and
image data, as well as many rendering modes, including highly view-dependent effects such as volume rendering.
Finally GPC visualization is efficient—GPC images are rendered and resampled with the help of graphics
hardware at interactive rates.
Index Terms—Non-uniform sampled images, interactive visualization, remote visualization, focus plus context,
antialiasing.
INTRODUCTION
HE camera model most frequently used in visualization is the planar pinhole camera (PPC) which samples the data to be visualized with rays
defined by a center of projection (i.e. the pinhole) and a regular grid on an image plane. The PPC model has three main limitations. First, the PPC has a limited field of view. Second, all rays are required to pass through the pinhole. Third, the entire field of view is sampled uniformly, without sampling rate flexibility.
This paper addresses the problem of providing a flexible sampling rate. Of course, one could chose to resample a conventional PPC image to any desired set of sampling locations, but such an approach is only approximate since it computes the desired samples by interpolation and not by actually sampling the data to be visualized. The approximation is particularly poor for large sampling rate variations when an adequate approximation by interpolation requires a prohibitively high resolution for the input image.
We present a general pinhole camera (GPC) model that supports any set of sampling locations on the image plane. The GPC rays are defined by a pinhole and the
desired image plane sampling locations. The GPC image is rendered by directly sampling the data to be visualized at the desired sampling locations. GPC visualization is versatile—it supports many types of data, including surface geometry, volume, and image data. GPC visualization is also efficient—complex datasets are rendered interactively with the help of graphics hardware. Moreover, if the application demands it, a GPC image can be resampled at little cost into a conventional PPC image. We demonstrate the advantages of the non-uniform sampling afforded by the GPC in three contexts: remote visualization, focus plus context visualization, and antialiasing (please also see accompanying video).
In order to visualize a dataset at a site other than the site where it was computed or acquired, one approach is to transfer the data. However, data transfers become more and more challenging as data size increases continue to outpace networking bandwidth increases. Moreover, replicating visualization capabilities at all user sites also scales poorly. A second approach overcomes these disadvantages by computing the desired visualization image at the remote site, followed by transferring the image to the local user site. No dataset transfer or replication of visualization capabilities is required. However, such a remote visualization approach suffers from reduced interactivity. Even though the bandwidth requirement for transferring an image is greatly reduced compared to transferring a large dataset, the image has to be transferred in real time and bandwidth remains a bottleneck, affecting the frame rate. The solutions of
T
————————————————
• V. Popescu is with the Computer Science Department, Purdue University, West-Lafayette, IN 47907. Email: [email protected].
• P. Rosen is with the Computer Science Department, Purdue University, West-Lafayette, IN 47907. Email: [email protected].
• L. Arns is with NAWCWD, Lethality Analysis, 4J3300D, NAVAIR, China Lake, CA 93555. Email: [email protected].
• X. Tricoche is with the Computer Science Department, Purdue University, West-Lafayette, IN 47907. Email: [email protected].
• C. Wyman is with the Computer Science Department, University of Iowa, Iowa City, IA 52242. Email: [email protected].
• C. Hoffmann is with the Computer Science Department, Purdue University, West-Lafayette, IN 47907. Email: [email protected].
2 IEEE TRANSACTIONS ON VISUALIZATION AND COMPUTER GRAPHICS
reducing image resolution or of aggressive compression are only palliative.
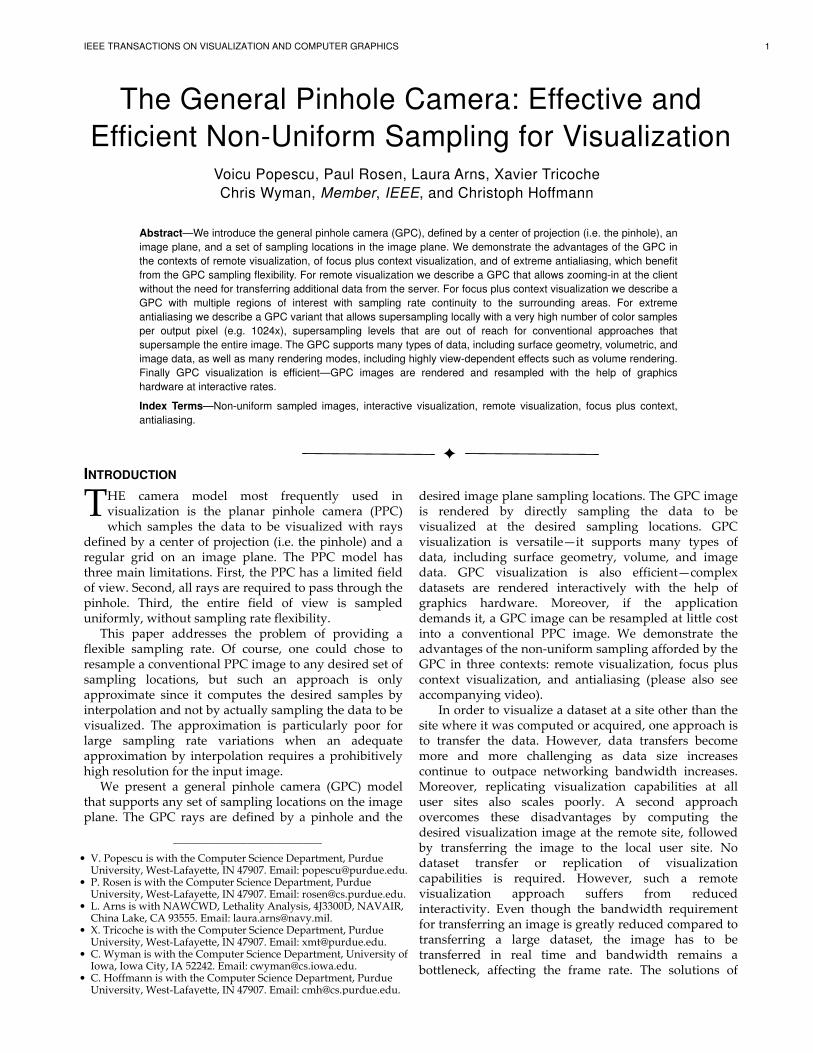
We propose to improve interactivity in remote visualization by transferring GPC images instead of conventional PPC images. The idea is to reuse a GPC image at the local site to compute several high-quality output frames, without the need of any additional data from the remote site. The GPC is designed to produce images with a sampling rate higher at the center and lower at the periphery. The resulting image has size and coherence similar to those of a PPC image, thus the transfer costs are comparable. At the local site the GPC image is resampled into a conventional PPC output frame at interactive rates. The higher sampling rate at the GPC image center allows the user to zoom in with little quality loss. Once the output frame sampling rate exceeds that provided by the GPC image, a new GPC image is requested and transferred from the remote site. The GPC also has a larger field of view than the output frame, which allows the user to rotate the view direction without the need of transferring new images. Like the PPC, the GPC is a pinhole so a GPC reference image cannot accurately support viewpoint translation due to occlusions. However, the approximate translation support provided is sufficient to allow the user to select a novel viewpoint for which a new GPC image is rendered and transferred.
In Figure 1 the PPC and GPC reference images have the same size (800x480) and field of view (90o). The frames are 600x360 in size and have a smaller, variable field of view. The GPC allows zooming in with good results. Frames are computed from a GPC at the rate of 525 frames per second.
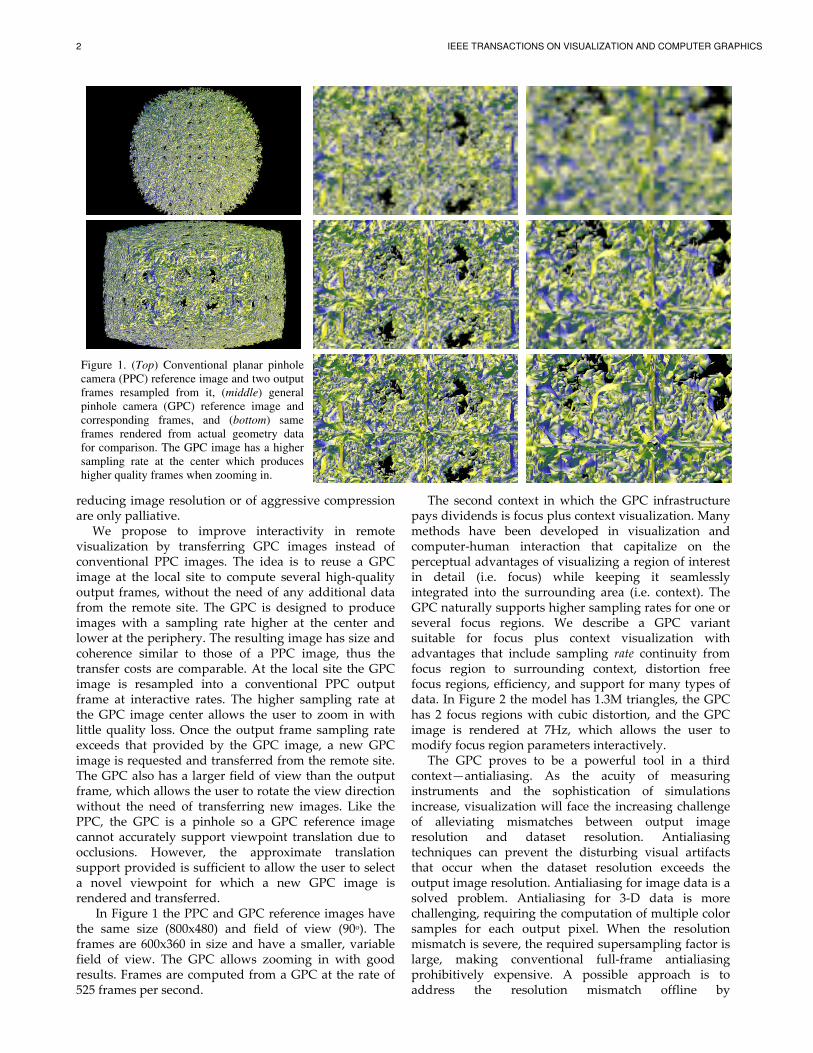
The second context in which the GPC infrastructure pays dividends is focus plus context visualization. Many methods have been developed in visualization and computer-human interaction that capitalize on the perceptual advantages of visualizing a region of interest in detail (i.e. focus) while keeping it seamlessly integrated into the surrounding area (i.e. context). The GPC naturally supports higher sampling rates for one or several focus regions. We describe a GPC variant suitable for focus plus context visualization with advantages that include sampling rate continuity from focus region to surrounding context, distortion free focus regions, efficiency, and support for many types of data. In Figure 2 the model has 1.3M triangles, the GPC has 2 focus regions with cubic distortion, and the GPC image is rendered at 7Hz, which allows the user to modify focus region parameters interactively.
The GPC proves to be a powerful tool in a third context—antialiasing. As the acuity of measuring instruments and the sophistication of simulations increase, visualization will face the increasing challenge of alleviating mismatches between output image resolution and dataset resolution. Antialiasing techniques can prevent the disturbing visual artifacts that occur when the dataset resolution exceeds the output image resolution. Antialiasing for image data is a solved problem. Antialiasing for 3-D data is more challenging, requiring the computation of multiple color samples for each output pixel. When the resolution mismatch is severe, the required supersampling factor is large, making conventional full-frame antialiasing prohibitively expensive. A possible approach is to address the resolution mismatch offline by
Figure 1. (Top) Conventional planar pinhole
camera (PPC) reference image and two output
frames resampled from it, (middle) general
pinhole camera (GPC) reference image and
corresponding frames, and (bottom) same
frames rendered from actual geometry data
for comparison. The GPC image has a higher
sampling rate at the center which produces
higher quality frames when zooming in.
POPESCU ET AL.: THE
precomputing lower levels of detail (LoDs), which is challenging and delays the visualization of realdatasets.
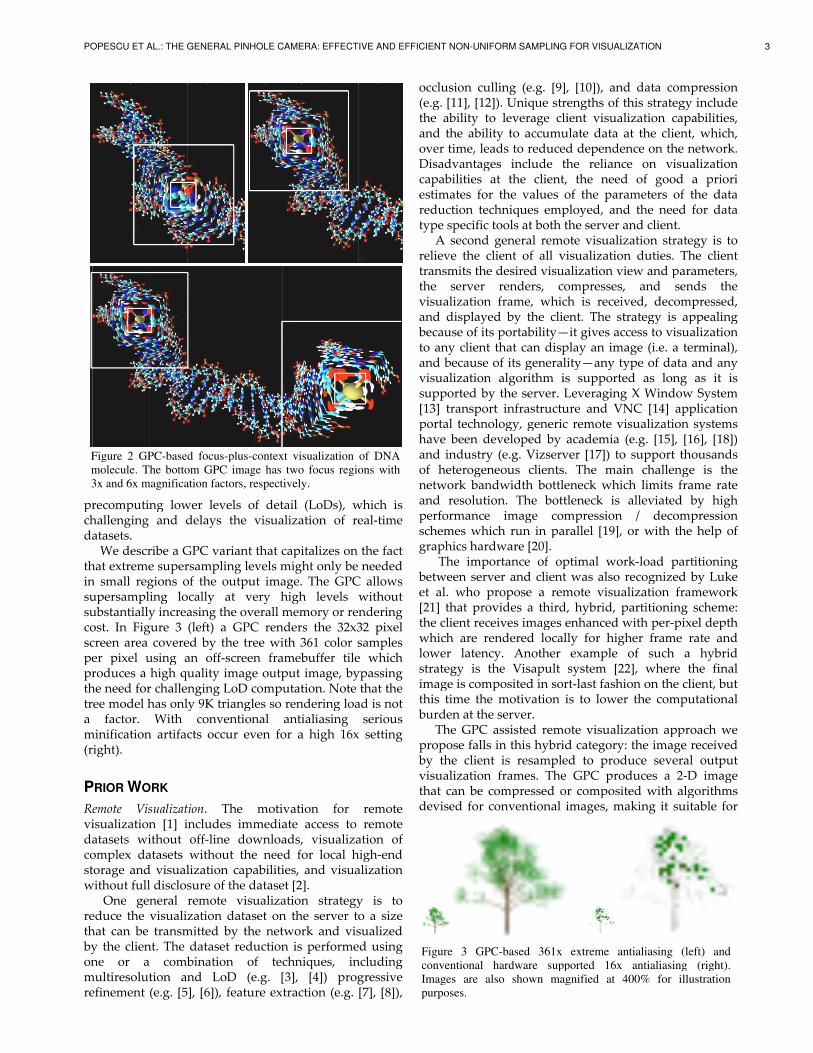
that extreme supersampling levels might only be needed in small regions of the output image. The GPC supersampling substantially increasing the overall memory costscreen area covered by the tree with 361 color samples per pixel produces a high quality imagethe need for challenging LoD computation. Note that the tree model has only 9K triangles so rendering load is not a factor. With conventional antialiasing serious minification artifacts occu(right).
P
Remote Visualizationvisualization datasets without offcomplex datasets without the need for local highstorage and visualization capabilities, and visualization without full disclosure of the dataset
reduce the visualization dataset on the server to a size that can be transmitted by the network and by the client. one or multiresolution and refinement
Figure
molecule. The bottom GPC image has two focus regions with
3x and 6x magnification factors, respectively.
POPESCU ET AL.: THE
precomputing lower levels of detail (LoDs), which is challenging and delays the visualization of realdatasets.
We describe a that extreme supersampling levels might only be needed in small regions of the output image. The GPC supersampling substantially increasing the overall memory cost. screen area covered by the tree with 361 color samples per pixel produces a high quality imagethe need for challenging LoD computation. Note that the tree model has only 9K triangles so rendering load is not a factor. With conventional antialiasing serious minification artifacts occu(right).
PRIOR
Remote Visualizationvisualization datasets without offcomplex datasets without the need for local highstorage and visualization capabilities, and visualization without full disclosure of the dataset
One reduce the visualization dataset on the server to a size that can be transmitted by the network and by the client. one or multiresolution and refinement
Figure
molecule. The bottom GPC image has two focus regions with
3x and 6x magnification factors, respectively.
POPESCU ET AL.: THE
precomputing lower levels of detail (LoDs), which is challenging and delays the visualization of realdatasets.
We describe a that extreme supersampling levels might only be needed in small regions of the output image. The GPC supersampling substantially increasing the overall memory
In screen area covered by the tree with 361 color samples per pixel produces a high quality imagethe need for challenging LoD computation. Note that the tree model has only 9K triangles so rendering load is not a factor. With conventional antialiasing serious minification artifacts occu(right).
RIOR W
Remote Visualizationvisualization datasets without offcomplex datasets without the need for local highstorage and visualization capabilities, and visualization without full disclosure of the dataset
One reduce the visualization dataset on the server to a size that can be transmitted by the network and by the client. one or multiresolution and refinement
Figure 2
molecule. The bottom GPC image has two focus regions with
3x and 6x magnification factors, respectively.
POPESCU ET AL.: THE
precomputing lower levels of detail (LoDs), which is challenging and delays the visualization of realdatasets.
We describe a that extreme supersampling levels might only be needed in small regions of the output image. The GPC supersampling substantially increasing the overall memory
In Figure screen area covered by the tree with 361 color samples per pixel using produces a high quality imagethe need for challenging LoD computation. Note that the tree model has only 9K triangles so rendering load is not a factor. With conventional antialiasing serious minification artifacts occu
WORK
Remote Visualizationvisualization datasets without offcomplex datasets without the need for local highstorage and visualization capabilities, and visualization without full disclosure of the dataset
One general reduce the visualization dataset on the server to a size that can be transmitted by the network and by the client. one or a multiresolution and refinement (
2 GPC
molecule. The bottom GPC image has two focus regions with
3x and 6x magnification factors, respectively.
POPESCU ET AL.: THE
precomputing lower levels of detail (LoDs), which is challenging and delays the visualization of real
We describe a that extreme supersampling levels might only be needed in small regions of the output image. The GPC supersampling substantially increasing the overall memory
Figure screen area covered by the tree with 361 color samples
using produces a high quality imagethe need for challenging LoD computation. Note that the tree model has only 9K triangles so rendering load is not a factor. With conventional antialiasing serious minification artifacts occu
ORK
Remote Visualizationvisualization [1]datasets without offcomplex datasets without the need for local highstorage and visualization capabilities, and visualization without full disclosure of the dataset
general reduce the visualization dataset on the server to a size that can be transmitted by the network and by the client. The dataset reduction is performed using
a combinationmultiresolution and
(e.g.
GPC-based focus
molecule. The bottom GPC image has two focus regions with
3x and 6x magnification factors, respectively.
POPESCU ET AL.: THE GENERAL PINHOLE CAME
precomputing lower levels of detail (LoDs), which is challenging and delays the visualization of real
We describe a GPC variant that that extreme supersampling levels might only be needed in small regions of the output image. The GPC supersampling locally at very high levelssubstantially increasing the overall memory
Figure 3 (left) a GPC rendersscreen area covered by the tree with 361 color samples
using an produces a high quality imagethe need for challenging LoD computation. Note that the tree model has only 9K triangles so rendering load is not a factor. With conventional antialiasing serious minification artifacts occu
Remote Visualization[1] includes immediate access to remote
datasets without offcomplex datasets without the need for local highstorage and visualization capabilities, and visualization without full disclosure of the dataset
general remote visualization reduce the visualization dataset on the server to a size that can be transmitted by the network and
The dataset reduction is performed using combination
multiresolution and e.g. [5]
based focus
molecule. The bottom GPC image has two focus regions with
3x and 6x magnification factors, respectively.
GENERAL PINHOLE CAME
precomputing lower levels of detail (LoDs), which is challenging and delays the visualization of real
GPC variant that that extreme supersampling levels might only be needed in small regions of the output image. The GPC
locally at very high levelssubstantially increasing the overall memory
(left) a GPC rendersscreen area covered by the tree with 361 color samples
an offproduces a high quality imagethe need for challenging LoD computation. Note that the tree model has only 9K triangles so rendering load is not a factor. With conventional antialiasing serious minification artifacts occu
Remote Visualization. The motivation for remote includes immediate access to remote
datasets without off-complex datasets without the need for local highstorage and visualization capabilities, and visualization without full disclosure of the dataset
remote visualization reduce the visualization dataset on the server to a size that can be transmitted by the network and
The dataset reduction is performed using combination
multiresolution and [5], [6]
based focus
molecule. The bottom GPC image has two focus regions with
3x and 6x magnification factors, respectively.
GENERAL PINHOLE CAME
precomputing lower levels of detail (LoDs), which is challenging and delays the visualization of real
GPC variant that that extreme supersampling levels might only be needed in small regions of the output image. The GPC
locally at very high levelssubstantially increasing the overall memory
(left) a GPC rendersscreen area covered by the tree with 361 color samples
off-screen framebufferproduces a high quality imagethe need for challenging LoD computation. Note that the tree model has only 9K triangles so rendering load is not a factor. With conventional antialiasing serious minification artifacts occu
. The motivation for remote includes immediate access to remote
-line downloads, visualization of complex datasets without the need for local highstorage and visualization capabilities, and visualization without full disclosure of the dataset
remote visualization reduce the visualization dataset on the server to a size that can be transmitted by the network and
The dataset reduction is performed using combination
multiresolution and LoD [6]), feature extraction
based focus-
molecule. The bottom GPC image has two focus regions with
3x and 6x magnification factors, respectively.
GENERAL PINHOLE CAME
precomputing lower levels of detail (LoDs), which is challenging and delays the visualization of real
GPC variant that that extreme supersampling levels might only be needed in small regions of the output image. The GPC
locally at very high levelssubstantially increasing the overall memory
(left) a GPC rendersscreen area covered by the tree with 361 color samples
screen framebufferproduces a high quality imagethe need for challenging LoD computation. Note that the tree model has only 9K triangles so rendering load is not a factor. With conventional antialiasing serious minification artifacts occur even for a high 16x setting
. The motivation for remote includes immediate access to remote
line downloads, visualization of complex datasets without the need for local highstorage and visualization capabilities, and visualization without full disclosure of the dataset
remote visualization reduce the visualization dataset on the server to a size that can be transmitted by the network and
The dataset reduction is performed using combination
LoD , feature extraction
-plus
molecule. The bottom GPC image has two focus regions with
3x and 6x magnification factors, respectively.
GENERAL PINHOLE CAME
precomputing lower levels of detail (LoDs), which is challenging and delays the visualization of real
GPC variant that that extreme supersampling levels might only be needed in small regions of the output image. The GPC
locally at very high levelssubstantially increasing the overall memory
(left) a GPC rendersscreen area covered by the tree with 361 color samples
screen framebufferproduces a high quality image output image, bypassing the need for challenging LoD computation. Note that the tree model has only 9K triangles so rendering load is not a factor. With conventional antialiasing serious
r even for a high 16x setting
. The motivation for remote includes immediate access to remote
line downloads, visualization of complex datasets without the need for local highstorage and visualization capabilities, and visualization without full disclosure of the dataset
remote visualization reduce the visualization dataset on the server to a size that can be transmitted by the network and
The dataset reduction is performed using of techniques
LoD (e.g., feature extraction
plus-context visualization of DNA
molecule. The bottom GPC image has two focus regions with
3x and 6x magnification factors, respectively.
GENERAL PINHOLE CAME
precomputing lower levels of detail (LoDs), which is challenging and delays the visualization of real
GPC variant that capitalizes on the fact that extreme supersampling levels might only be needed in small regions of the output image. The GPC
locally at very high levelssubstantially increasing the overall memory
(left) a GPC rendersscreen area covered by the tree with 361 color samples
screen framebufferoutput image, bypassing
the need for challenging LoD computation. Note that the tree model has only 9K triangles so rendering load is not a factor. With conventional antialiasing serious
r even for a high 16x setting
. The motivation for remote includes immediate access to remote
line downloads, visualization of complex datasets without the need for local highstorage and visualization capabilities, and visualization without full disclosure of the dataset
remote visualization reduce the visualization dataset on the server to a size that can be transmitted by the network and
The dataset reduction is performed using of techniques(e.g. [3]
, feature extraction
context visualization of DNA
molecule. The bottom GPC image has two focus regions with
3x and 6x magnification factors, respectively.
GENERAL PINHOLE CAME
precomputing lower levels of detail (LoDs), which is challenging and delays the visualization of real
capitalizes on the fact that extreme supersampling levels might only be needed in small regions of the output image. The GPC
locally at very high levelssubstantially increasing the overall memory
(left) a GPC rendersscreen area covered by the tree with 361 color samples
screen framebufferoutput image, bypassing
the need for challenging LoD computation. Note that the tree model has only 9K triangles so rendering load is not a factor. With conventional antialiasing serious
r even for a high 16x setting
. The motivation for remote includes immediate access to remote
line downloads, visualization of complex datasets without the need for local highstorage and visualization capabilities, and visualization without full disclosure of the dataset [2]
remote visualization reduce the visualization dataset on the server to a size that can be transmitted by the network and
The dataset reduction is performed using of techniques
[3], , feature extraction
context visualization of DNA
molecule. The bottom GPC image has two focus regions with
3x and 6x magnification factors, respectively.
GENERAL PINHOLE CAMERA: EFFECTIVE AND EF
precomputing lower levels of detail (LoDs), which is challenging and delays the visualization of real
capitalizes on the fact that extreme supersampling levels might only be needed in small regions of the output image. The GPC
locally at very high levelssubstantially increasing the overall memory
(left) a GPC renders the 32x32 pixel screen area covered by the tree with 361 color samples
screen framebufferoutput image, bypassing
the need for challenging LoD computation. Note that the tree model has only 9K triangles so rendering load is not a factor. With conventional antialiasing serious
r even for a high 16x setting
. The motivation for remote includes immediate access to remote
line downloads, visualization of complex datasets without the need for local highstorage and visualization capabilities, and visualization
[2]. remote visualization strategy
reduce the visualization dataset on the server to a size that can be transmitted by the network and
The dataset reduction is performed using of techniques
, [4], feature extraction
context visualization of DNA
molecule. The bottom GPC image has two focus regions with
3x and 6x magnification factors, respectively.
RA: EFFECTIVE AND EF
precomputing lower levels of detail (LoDs), which is challenging and delays the visualization of real
capitalizes on the fact that extreme supersampling levels might only be needed in small regions of the output image. The GPC
locally at very high levelssubstantially increasing the overall memory or rendering
the 32x32 pixel screen area covered by the tree with 361 color samples
screen framebuffer output image, bypassing
the need for challenging LoD computation. Note that the tree model has only 9K triangles so rendering load is not a factor. With conventional antialiasing serious
r even for a high 16x setting
. The motivation for remote includes immediate access to remote
line downloads, visualization of complex datasets without the need for local highstorage and visualization capabilities, and visualization
strategy reduce the visualization dataset on the server to a size that can be transmitted by the network and
The dataset reduction is performed using of techniques, including
[4]) progressive , feature extraction (e.g.
context visualization of DNA
molecule. The bottom GPC image has two focus regions with
RA: EFFECTIVE AND EF
precomputing lower levels of detail (LoDs), which is challenging and delays the visualization of real
capitalizes on the fact that extreme supersampling levels might only be needed in small regions of the output image. The GPC
locally at very high levels without or rendering
the 32x32 pixel screen area covered by the tree with 361 color samples
tile output image, bypassing
the need for challenging LoD computation. Note that the tree model has only 9K triangles so rendering load is not a factor. With conventional antialiasing serious
r even for a high 16x setting
. The motivation for remote includes immediate access to remote
line downloads, visualization of complex datasets without the need for local highstorage and visualization capabilities, and visualization
strategy reduce the visualization dataset on the server to a size that can be transmitted by the network and visualize
The dataset reduction is performed using , including progressive
(e.g. [7]
context visualization of DNA
molecule. The bottom GPC image has two focus regions with
RA: EFFECTIVE AND EF
precomputing lower levels of detail (LoDs), which is challenging and delays the visualization of real-
capitalizes on the fact that extreme supersampling levels might only be needed in small regions of the output image. The GPC allows
without or rendering
the 32x32 pixel screen area covered by the tree with 361 color samples
tile which output image, bypassing
the need for challenging LoD computation. Note that the tree model has only 9K triangles so rendering load is not a factor. With conventional antialiasing serious
r even for a high 16x setting
. The motivation for remote includes immediate access to remote
line downloads, visualization of complex datasets without the need for local high-storage and visualization capabilities, and visualization
strategy is reduce the visualization dataset on the server to a size
visualizeThe dataset reduction is performed using
, including progressive
[7],
context visualization of DNA
molecule. The bottom GPC image has two focus regions with
RA: EFFECTIVE AND EF
precomputing lower levels of detail (LoDs), which is -time
capitalizes on the fact that extreme supersampling levels might only be needed
allows without
or rendering the 32x32 pixel
screen area covered by the tree with 361 color samples which
output image, bypassing the need for challenging LoD computation. Note that the tree model has only 9K triangles so rendering load is not a factor. With conventional antialiasing serious
r even for a high 16x setting
. The motivation for remote includes immediate access to remote
line downloads, visualization of -end
storage and visualization capabilities, and visualization
is to reduce the visualization dataset on the server to a size
visualized The dataset reduction is performed using
, including progressive
[8])
context visualization of DNA
molecule. The bottom GPC image has two focus regions with
RA: EFFECTIVE AND EFFICIENT NON
precomputing lower levels of detail (LoDs), which is time
capitalizes on the fact that extreme supersampling levels might only be needed
allows without
or rendering the 32x32 pixel
screen area covered by the tree with 361 color samples which
output image, bypassing the need for challenging LoD computation. Note that the tree model has only 9K triangles so rendering load is not a factor. With conventional antialiasing serious
r even for a high 16x setting
. The motivation for remote includes immediate access to remote
line downloads, visualization of end
storage and visualization capabilities, and visualization
to reduce the visualization dataset on the server to a size
d The dataset reduction is performed using
, including progressive
),
context visualization of DNA
molecule. The bottom GPC image has two focus regions with
FICIENT NON
occlusion culling (e.g. the ability to leverage client viand the ability to accumulate data at the client, which, over time, leads to reduced dependence on the network. Disadvantages include the capabilities at the client, the need of good a priori estimates reduction techniques employed, and the need for data type specific tools at both the server and client.
relieve the transmits the desired visualization view and parameters, the server visualization frame, which is received, decompressed, and displayed by the client.because of its portabilityto any client that can display an image (i.e. a terminal), and because of its generalityvisualization algorithm is supported as long as it is suppo[13]portal technology, generic remote visualization systems have been developed by academia (e.g. and industryof heterogeneous clients.network bandwidth bottleneck which limits frame rate and resolution. The bottleneck is alleviated performance image compression / decompression schemes which run in parallel graphics hardware
between server and client was also recognized by Luke et al. who propose a remote visualization framework [21]the client receives images enhanced with perwhich are rendered locally for higher frame rate and lower latency. Another example of such a hybrid strategy is the Visapult systemimage is composited in sortthis time the motivation is to lower the computational burden at the server.
proposeby the client is resampled to produce several output visualization frames. The GPC that can be compressed or composited with algorithms devise
Figure
conventional hardware supported 16x antialiasing (right).
Images are also shown magnified at 400% for illustration
purposes.
FICIENT NON
occlusion culling (e.g. [11]the ability to leverage client viand the ability to accumulate data at the client, which, over time, leads to reduced dependence on the network. Disadvantages include the capabilities at the client, the need of good a priori estimates reduction techniques employed, and the need for data type specific tools at both the server and client.
A second relieve the transmits the desired visualization view and parameters, the server visualization frame, which is received, decompressed, and displayed by the client.because of its portabilityto any client that can display an image (i.e. a terminal), and because of its generalityvisualization algorithm is supported as long as it is suppo[13] transport infrastructure and VNC portal technology, generic remote visualization systems have been developed by academia (e.g. and industryof heterogeneous clients.network bandwidth bottleneck which limits frame rate and resolution. The bottleneck is alleviated performance image compression / decompression schemes which run in parallel graphics hardware
The importance ofbetween server and client was also recognized by Luke et al. who propose a remote visualization framework [21] that providesthe client receives images enhanced with perwhich are rendered locally for higher frame rate and lower latency. Another example of such a hybrid strategy is the Visapult systemimage is composited in sortthis time the motivation is to lower the computational burden at the server.
The GPC assisteproposeby the client is resampled to produce several output visualization frames. The GPC that can be compressed or composited with algorithms devise
Figure
conventional hardware supported 16x antialiasing (right).
Images are also shown magnified at 400% for illustration
purposes.
FICIENT NON-
occlusion culling [11],
the ability to leverage client viand the ability to accumulate data at the client, which, over time, leads to reduced dependence on the network. Disadvantages include the capabilities at the client, the need of good a priori estimates reduction techniques employed, and the need for data type specific tools at both the server and client.
A second relieve the transmits the desired visualization view and parameters, the server visualization frame, which is received, decompressed, and displayed by the client.because of its portabilityto any client that can display an image (i.e. a terminal), and because of its generalityvisualization algorithm is supported as long as it is supported by the server.
transport infrastructure and VNC portal technology, generic remote visualization systems have been developed by academia (e.g. and industryof heterogeneous clients.network bandwidth bottleneck which limits frame rate and resolution. The bottleneck is alleviated performance image compression / decompression schemes which run in parallel graphics hardware
The importance ofbetween server and client was also recognized by Luke et al. who propose a remote visualization framework
that providesthe client receives images enhanced with perwhich are rendered locally for higher frame rate and lower latency. Another example of such a hybrid strategy is the Visapult systemimage is composited in sortthis time the motivation is to lower the computational burden at the server.
The GPC assistepropose falls in this hybrid category: the image received by the client is resampled to produce several output visualization frames. The GPC that can be compressed or composited with algorithms devised for conventional images, making it suitable for
Figure 3
conventional hardware supported 16x antialiasing (right).
Images are also shown magnified at 400% for illustration
purposes.
-UNIFORM SAMPLING FOR
occlusion culling , [12]
the ability to leverage client viand the ability to accumulate data at the client, which, over time, leads to reduced dependence on the network. Disadvantages include the capabilities at the client, the need of good a priori estimates for the reduction techniques employed, and the need for data type specific tools at both the server and client.
A second relieve the client of transmits the desired visualization view and parameters, the server visualization frame, which is received, decompressed, and displayed by the client.because of its portabilityto any client that can display an image (i.e. a terminal), and because of its generalityvisualization algorithm is supported as long as it is
rted by the server.transport infrastructure and VNC
portal technology, generic remote visualization systems have been developed by academia (e.g. and industryof heterogeneous clients.network bandwidth bottleneck which limits frame rate and resolution. The bottleneck is alleviated performance image compression / decompression schemes which run in parallel graphics hardware
The importance ofbetween server and client was also recognized by Luke et al. who propose a remote visualization framework
that providesthe client receives images enhanced with perwhich are rendered locally for higher frame rate and lower latency. Another example of such a hybrid strategy is the Visapult systemimage is composited in sortthis time the motivation is to lower the computational burden at the server.
The GPC assistefalls in this hybrid category: the image received
by the client is resampled to produce several output visualization frames. The GPC that can be compressed or composited with algorithms
d for conventional images, making it suitable for
GPC
conventional hardware supported 16x antialiasing (right).
Images are also shown magnified at 400% for illustration
UNIFORM SAMPLING FOR
occlusion culling [12]). Unique strengths of this strategy include
the ability to leverage client viand the ability to accumulate data at the client, which, over time, leads to reduced dependence on the network. Disadvantages include the capabilities at the client, the need of good a priori
for the reduction techniques employed, and the need for data type specific tools at both the server and client.
A second general remote visualization client of
transmits the desired visualization view and parameters, the server rendersvisualization frame, which is received, decompressed, and displayed by the client.because of its portabilityto any client that can display an image (i.e. a terminal), and because of its generalityvisualization algorithm is supported as long as it is
rted by the server.transport infrastructure and VNC
portal technology, generic remote visualization systems have been developed by academia (e.g. and industry (e.g. of heterogeneous clients.network bandwidth bottleneck which limits frame rate and resolution. The bottleneck is alleviated performance image compression / decompression schemes which run in parallel graphics hardware
The importance ofbetween server and client was also recognized by Luke et al. who propose a remote visualization framework
that providesthe client receives images enhanced with perwhich are rendered locally for higher frame rate and lower latency. Another example of such a hybrid strategy is the Visapult systemimage is composited in sortthis time the motivation is to lower the computational burden at the server.
The GPC assistefalls in this hybrid category: the image received
by the client is resampled to produce several output visualization frames. The GPC that can be compressed or composited with algorithms
d for conventional images, making it suitable for
GPC-based 361x extreme antialiasing (left) and
conventional hardware supported 16x antialiasing (right).
Images are also shown magnified at 400% for illustration
UNIFORM SAMPLING FOR
occlusion culling (e.g. Unique strengths of this strategy include
the ability to leverage client viand the ability to accumulate data at the client, which, over time, leads to reduced dependence on the network. Disadvantages include the capabilities at the client, the need of good a priori
for the valuesreduction techniques employed, and the need for data type specific tools at both the server and client.
general remote visualization client of
transmits the desired visualization view and parameters, renders
visualization frame, which is received, decompressed, and displayed by the client.because of its portabilityto any client that can display an image (i.e. a terminal), and because of its generalityvisualization algorithm is supported as long as it is
rted by the server.transport infrastructure and VNC
portal technology, generic remote visualization systems have been developed by academia (e.g.
(e.g. Vizserver of heterogeneous clients.network bandwidth bottleneck which limits frame rate and resolution. The bottleneck is alleviated performance image compression / decompression schemes which run in parallel graphics hardware [20]
The importance ofbetween server and client was also recognized by Luke et al. who propose a remote visualization framework
that provides a third, hybrid, partitioning scheme: the client receives images enhanced with perwhich are rendered locally for higher frame rate and lower latency. Another example of such a hybrid strategy is the Visapult systemimage is composited in sortthis time the motivation is to lower the computational burden at the server.
The GPC assisted remote visualization approach falls in this hybrid category: the image received
by the client is resampled to produce several output visualization frames. The GPC that can be compressed or composited with algorithms
d for conventional images, making it suitable for
based 361x extreme antialiasing (left) and
conventional hardware supported 16x antialiasing (right).
Images are also shown magnified at 400% for illustration
UNIFORM SAMPLING FOR
(e.g. Unique strengths of this strategy include
the ability to leverage client viand the ability to accumulate data at the client, which, over time, leads to reduced dependence on the network. Disadvantages include the capabilities at the client, the need of good a priori
valuesreduction techniques employed, and the need for data type specific tools at both the server and client.
general remote visualization client of all
transmits the desired visualization view and parameters, renders, compresses, and sends the
visualization frame, which is received, decompressed, and displayed by the client.because of its portabilityto any client that can display an image (i.e. a terminal), and because of its generalityvisualization algorithm is supported as long as it is
rted by the server.transport infrastructure and VNC
portal technology, generic remote visualization systems have been developed by academia (e.g.
Vizserver of heterogeneous clients.network bandwidth bottleneck which limits frame rate and resolution. The bottleneck is alleviated performance image compression / decompression schemes which run in parallel
[20]. The importance of
between server and client was also recognized by Luke et al. who propose a remote visualization framework
a third, hybrid, partitioning scheme: the client receives images enhanced with perwhich are rendered locally for higher frame rate and lower latency. Another example of such a hybrid strategy is the Visapult systemimage is composited in sortthis time the motivation is to lower the computational burden at the server.
d remote visualization approach falls in this hybrid category: the image received
by the client is resampled to produce several output visualization frames. The GPC that can be compressed or composited with algorithms
d for conventional images, making it suitable for
based 361x extreme antialiasing (left) and
conventional hardware supported 16x antialiasing (right).
Images are also shown magnified at 400% for illustration
UNIFORM SAMPLING FOR
(e.g. [9], Unique strengths of this strategy include
the ability to leverage client viand the ability to accumulate data at the client, which, over time, leads to reduced dependence on the network. Disadvantages include the capabilities at the client, the need of good a priori
values of the parameters of the data reduction techniques employed, and the need for data type specific tools at both the server and client.
general remote visualization all visualization dut
transmits the desired visualization view and parameters, , compresses, and sends the
visualization frame, which is received, decompressed, and displayed by the client.because of its portability—to any client that can display an image (i.e. a terminal), and because of its generalityvisualization algorithm is supported as long as it is
rted by the server. Leveraging X Window System transport infrastructure and VNC
portal technology, generic remote visualization systems have been developed by academia (e.g.
Vizserver of heterogeneous clients. network bandwidth bottleneck which limits frame rate and resolution. The bottleneck is alleviated performance image compression / decompression schemes which run in parallel
. optimal
between server and client was also recognized by Luke et al. who propose a remote visualization framework
a third, hybrid, partitioning scheme: the client receives images enhanced with perwhich are rendered locally for higher frame rate and lower latency. Another example of such a hybrid strategy is the Visapult systemimage is composited in sortthis time the motivation is to lower the computational
d remote visualization approach falls in this hybrid category: the image received
by the client is resampled to produce several output visualization frames. The GPC that can be compressed or composited with algorithms
d for conventional images, making it suitable for
based 361x extreme antialiasing (left) and
conventional hardware supported 16x antialiasing (right).
Images are also shown magnified at 400% for illustration
UNIFORM SAMPLING FOR
, [10]Unique strengths of this strategy include
the ability to leverage client viand the ability to accumulate data at the client, which, over time, leads to reduced dependence on the network. Disadvantages include the capabilities at the client, the need of good a priori
of the parameters of the data reduction techniques employed, and the need for data type specific tools at both the server and client.
general remote visualization visualization dut
transmits the desired visualization view and parameters, , compresses, and sends the
visualization frame, which is received, decompressed, and displayed by the client.
—it gives access to visualization to any client that can display an image (i.e. a terminal), and because of its generality—visualization algorithm is supported as long as it is
Leveraging X Window System transport infrastructure and VNC
portal technology, generic remote visualization systems have been developed by academia (e.g.
Vizserver [17] The main challenge is the
network bandwidth bottleneck which limits frame rate and resolution. The bottleneck is alleviated performance image compression / decompression schemes which run in parallel
optimalbetween server and client was also recognized by Luke et al. who propose a remote visualization framework
a third, hybrid, partitioning scheme: the client receives images enhanced with perwhich are rendered locally for higher frame rate and lower latency. Another example of such a hybrid strategy is the Visapult systemimage is composited in sort-last fashion on the client, but this time the motivation is to lower the computational
d remote visualization approach falls in this hybrid category: the image received
by the client is resampled to produce several output visualization frames. The GPC that can be compressed or composited with algorithms
d for conventional images, making it suitable for
based 361x extreme antialiasing (left) and
conventional hardware supported 16x antialiasing (right).
Images are also shown magnified at 400% for illustration
UNIFORM SAMPLING FOR VISUALIZATION
[10]), Unique strengths of this strategy include
the ability to leverage client visualization capabilities, and the ability to accumulate data at the client, which, over time, leads to reduced dependence on the network. Disadvantages include the reliance on capabilities at the client, the need of good a priori
of the parameters of the data reduction techniques employed, and the need for data type specific tools at both the server and client.
general remote visualization visualization dut
transmits the desired visualization view and parameters, , compresses, and sends the
visualization frame, which is received, decompressed, The
it gives access to visualization to any client that can display an image (i.e. a terminal),
—any type of data and any visualization algorithm is supported as long as it is
Leveraging X Window System transport infrastructure and VNC
portal technology, generic remote visualization systems have been developed by academia (e.g.
[17]The main challenge is the
network bandwidth bottleneck which limits frame rate and resolution. The bottleneck is alleviated performance image compression / decompression schemes which run in parallel [19]
optimal between server and client was also recognized by Luke et al. who propose a remote visualization framework
a third, hybrid, partitioning scheme: the client receives images enhanced with perwhich are rendered locally for higher frame rate and lower latency. Another example of such a hybrid strategy is the Visapult system
last fashion on the client, but this time the motivation is to lower the computational
d remote visualization approach falls in this hybrid category: the image received
by the client is resampled to produce several output visualization frames. The GPC that can be compressed or composited with algorithms
d for conventional images, making it suitable for
based 361x extreme antialiasing (left) and
conventional hardware supported 16x antialiasing (right).
Images are also shown magnified at 400% for illustration
VISUALIZATION
, and Unique strengths of this strategy include
sualization capabilities, and the ability to accumulate data at the client, which, over time, leads to reduced dependence on the network.
reliance on capabilities at the client, the need of good a priori
of the parameters of the data reduction techniques employed, and the need for data type specific tools at both the server and client.
general remote visualization visualization dut
transmits the desired visualization view and parameters, , compresses, and sends the
visualization frame, which is received, decompressed, e strategy is appealing
it gives access to visualization to any client that can display an image (i.e. a terminal),
any type of data and any visualization algorithm is supported as long as it is
Leveraging X Window System transport infrastructure and VNC
portal technology, generic remote visualization systems have been developed by academia (e.g.
[17]) to support thousands The main challenge is the
network bandwidth bottleneck which limits frame rate and resolution. The bottleneck is alleviated performance image compression / decompression
[19], or with the help of
workbetween server and client was also recognized by Luke et al. who propose a remote visualization framework
a third, hybrid, partitioning scheme: the client receives images enhanced with perwhich are rendered locally for higher frame rate and lower latency. Another example of such a hybrid strategy is the Visapult system [22]
last fashion on the client, but this time the motivation is to lower the computational
d remote visualization approach falls in this hybrid category: the image received
by the client is resampled to produce several output visualization frames. The GPC produces a that can be compressed or composited with algorithms
d for conventional images, making it suitable for
based 361x extreme antialiasing (left) and
conventional hardware supported 16x antialiasing (right).
Images are also shown magnified at 400% for illustration
VISUALIZATION
and data Unique strengths of this strategy include
sualization capabilities, and the ability to accumulate data at the client, which, over time, leads to reduced dependence on the network.
reliance on capabilities at the client, the need of good a priori
of the parameters of the data reduction techniques employed, and the need for data type specific tools at both the server and client.
general remote visualization visualization dut
transmits the desired visualization view and parameters, , compresses, and sends the
visualization frame, which is received, decompressed, strategy is appealing
it gives access to visualization to any client that can display an image (i.e. a terminal),
any type of data and any visualization algorithm is supported as long as it is
Leveraging X Window System transport infrastructure and VNC
portal technology, generic remote visualization systems have been developed by academia (e.g.
) to support thousands The main challenge is the
network bandwidth bottleneck which limits frame rate and resolution. The bottleneck is alleviated performance image compression / decompression
, or with the help of
work-load partitioning between server and client was also recognized by Luke et al. who propose a remote visualization framework
a third, hybrid, partitioning scheme: the client receives images enhanced with perwhich are rendered locally for higher frame rate and lower latency. Another example of such a hybrid
[22], where the final last fashion on the client, but
this time the motivation is to lower the computational
d remote visualization approach falls in this hybrid category: the image received
by the client is resampled to produce several output produces a
that can be compressed or composited with algorithms d for conventional images, making it suitable for
based 361x extreme antialiasing (left) and
conventional hardware supported 16x antialiasing (right).
Images are also shown magnified at 400% for illustration
VISUALIZATION
data Unique strengths of this strategy include
sualization capabilities, and the ability to accumulate data at the client, which, over time, leads to reduced dependence on the network.
reliance on capabilities at the client, the need of good a priori
of the parameters of the data reduction techniques employed, and the need for data type specific tools at both the server and client.
general remote visualization strategy is visualization duties
transmits the desired visualization view and parameters, , compresses, and sends the
visualization frame, which is received, decompressed, strategy is appealing
it gives access to visualization to any client that can display an image (i.e. a terminal),
any type of data and any visualization algorithm is supported as long as it is
Leveraging X Window System transport infrastructure and VNC [14]
portal technology, generic remote visualization systems have been developed by academia (e.g. [15]
) to support thousands The main challenge is the
network bandwidth bottleneck which limits frame rate and resolution. The bottleneck is alleviated performance image compression / decompression
, or with the help of
load partitioning between server and client was also recognized by Luke et al. who propose a remote visualization framework
a third, hybrid, partitioning scheme: the client receives images enhanced with perwhich are rendered locally for higher frame rate and lower latency. Another example of such a hybrid
, where the final last fashion on the client, but
this time the motivation is to lower the computational
d remote visualization approach falls in this hybrid category: the image received
by the client is resampled to produce several output produces a
that can be compressed or composited with algorithms d for conventional images, making it suitable for
based 361x extreme antialiasing (left) and
conventional hardware supported 16x antialiasing (right).
Images are also shown magnified at 400% for illustration
data compression Unique strengths of this strategy include
sualization capabilities, and the ability to accumulate data at the client, which, over time, leads to reduced dependence on the network.
reliance on visualization capabilities at the client, the need of good a priori
of the parameters of the data reduction techniques employed, and the need for data type specific tools at both the server and client.
strategy is ies. The client
transmits the desired visualization view and parameters, , compresses, and sends the
visualization frame, which is received, decompressed, strategy is appealing
it gives access to visualization to any client that can display an image (i.e. a terminal),
any type of data and any visualization algorithm is supported as long as it is
Leveraging X Window System [14] application
portal technology, generic remote visualization systems [15],
) to support thousands The main challenge is the
network bandwidth bottleneck which limits frame rate and resolution. The bottleneck is alleviated performance image compression / decompression
, or with the help of
load partitioning between server and client was also recognized by Luke et al. who propose a remote visualization framework
a third, hybrid, partitioning scheme: the client receives images enhanced with per-pixel depth which are rendered locally for higher frame rate and lower latency. Another example of such a hybrid
, where the final last fashion on the client, but
this time the motivation is to lower the computational
d remote visualization approach falls in this hybrid category: the image received
by the client is resampled to produce several output produces a 2
that can be compressed or composited with algorithms d for conventional images, making it suitable for
based 361x extreme antialiasing (left) and
conventional hardware supported 16x antialiasing (right).
Images are also shown magnified at 400% for illustration
compression Unique strengths of this strategy include
sualization capabilities, and the ability to accumulate data at the client, which, over time, leads to reduced dependence on the network.
visualization capabilities at the client, the need of good a priori
of the parameters of the data reduction techniques employed, and the need for data
strategy is
. The client transmits the desired visualization view and parameters,
, compresses, and sends the visualization frame, which is received, decompressed,
strategy is appealing it gives access to visualization
to any client that can display an image (i.e. a terminal), any type of data and any
visualization algorithm is supported as long as it is Leveraging X Window System
application portal technology, generic remote visualization systems
, [16]) to support thousands
The main challenge is the network bandwidth bottleneck which limits frame rate and resolution. The bottleneck is alleviated by performance image compression / decompression
, or with the help of
load partitioning between server and client was also recognized by Luke et al. who propose a remote visualization framework
a third, hybrid, partitioning scheme: pixel depth
which are rendered locally for higher frame rate and lower latency. Another example of such a hybrid
, where the final last fashion on the client, but
this time the motivation is to lower the computational
d remote visualization approach falls in this hybrid category: the image received
by the client is resampled to produce several output 2-D image
that can be compressed or composited with algorithms d for conventional images, making it suitable for
based 361x extreme antialiasing (left) and
conventional hardware supported 16x antialiasing (right).
Images are also shown magnified at 400% for illustration
compression Unique strengths of this strategy include
sualization capabilities, and the ability to accumulate data at the client, which, over time, leads to reduced dependence on the network.
visualization capabilities at the client, the need of good a priori
of the parameters of the data reduction techniques employed, and the need for data
strategy is . The client
transmits the desired visualization view and parameters, , compresses, and sends the
visualization frame, which is received, decompressed, strategy is appealing
it gives access to visualization to any client that can display an image (i.e. a terminal),
any type of data and any visualization algorithm is supported as long as it is
Leveraging X Window System application
portal technology, generic remote visualization systems [16], [18]
) to support thousands The main challenge is the
network bandwidth bottleneck which limits frame rate by high
performance image compression / decompression , or with the help of
load partitioning between server and client was also recognized by Luke et al. who propose a remote visualization framework
a third, hybrid, partitioning scheme: pixel depth
which are rendered locally for higher frame rate and lower latency. Another example of such a hybrid
, where the final last fashion on the client, but
this time the motivation is to lower the computational
d remote visualization approach falls in this hybrid category: the image received
by the client is resampled to produce several output D image
that can be compressed or composited with algorithms d for conventional images, making it suitable for
based 361x extreme antialiasing (left) and
conventional hardware supported 16x antialiasing (right).
Images are also shown magnified at 400% for illustration
compression Unique strengths of this strategy include
sualization capabilities, and the ability to accumulate data at the client, which, over time, leads to reduced dependence on the network.
visualization capabilities at the client, the need of good a priori
of the parameters of the data reduction techniques employed, and the need for data
strategy is to . The client
transmits the desired visualization view and parameters, , compresses, and sends the
visualization frame, which is received, decompressed, strategy is appealing
it gives access to visualization to any client that can display an image (i.e. a terminal),
any type of data and any visualization algorithm is supported as long as it is
Leveraging X Window System application
portal technology, generic remote visualization systems [18])
) to support thousands The main challenge is the
network bandwidth bottleneck which limits frame rate high
performance image compression / decompression , or with the help of
load partitioning between server and client was also recognized by Luke et al. who propose a remote visualization framework
a third, hybrid, partitioning scheme: pixel depth
which are rendered locally for higher frame rate and lower latency. Another example of such a hybrid
, where the final last fashion on the client, but
this time the motivation is to lower the computational
d remote visualization approach we falls in this hybrid category: the image received
by the client is resampled to produce several output D image
that can be compressed or composited with algorithms d for conventional images, making it suitable for
based 361x extreme antialiasing (left) and
conventional hardware supported 16x antialiasing (right).
Images are also shown magnified at 400% for illustration
compression Unique strengths of this strategy include
sualization capabilities, and the ability to accumulate data at the client, which, over time, leads to reduced dependence on the network.
visualization capabilities at the client, the need of good a priori
of the parameters of the data reduction techniques employed, and the need for data
to . The client
transmits the desired visualization view and parameters, , compresses, and sends the
visualization frame, which is received, decompressed, strategy is appealing
it gives access to visualization to any client that can display an image (i.e. a terminal),
any type of data and any visualization algorithm is supported as long as it is
Leveraging X Window System application
portal technology, generic remote visualization systems )
) to support thousands The main challenge is the
network bandwidth bottleneck which limits frame rate high
performance image compression / decompression , or with the help of
load partitioning between server and client was also recognized by Luke et al. who propose a remote visualization framework
a third, hybrid, partitioning scheme: pixel depth
which are rendered locally for higher frame rate and lower latency. Another example of such a hybrid
, where the final last fashion on the client, but
this time the motivation is to lower the computational
we falls in this hybrid category: the image received
by the client is resampled to produce several output D image
that can be compressed or composited with algorithms d for conventional images, making it suitable for
3
4 IEEE TRANSACTIONS ON VISUALIZATION AND COMPUTER GRAPHICS
straight-forward integration within existing remote visualization frameworks.
Focus plus Context. Focus plus context visualization uses an inequitable screen real estate allocation favoring data subsets deemed more important, idea introduced by the fisheye views visualization technique [23]. The approach is supported by the way our visual system works, both at high level—we concentrate on a small part of what we see and rely on the background for general situational awareness, and at low level—the density of receptors on the retina is non-uniform. Focus plus context has been applied to 2-D image data, either acquired or rendered from 2-D primitives, including hierarchies [24], graphs [25], and maps [26]. While these techniques apply a 2-D magnification lens to emphasize the focus region, the Mélange system resorts to mapping the 2-D image data to a 3-D surface designed to emphasize several focus regions, while compressing less interesting connecting context.
The magnification of the focus region implies an increased sampling rate. However, most computer displays are designed for a uniform sampling rate and mapping a focus plus context image to such a conventional display requires distortion. An alternative is to build displays with a variable pixel density that can display a focus plus context image directly [28]. The challenges are difficulty in changing pixel density, abrupt pixel density changes, and bulkiness.
Focus plus context techniques for 3-D surface geometry data typically apply a 3-D space distortion followed by conventional visualization [29]. The distortion has the potential to reveal subsets of interest otherwise occluded [30], but has the disadvantages of difficult distortion design and of a distorted focus region. These difficulties are avoided by distorting the camera rays as opposed to the geometry data, as demonstrated by Wang et al. for volume data [31]. The context and focus regions are essentially rendered with conventional cameras with various resolutions while the distortion is confined to the transition area. Our GPC focus plus context technique is similar to the Wang et al. approach in that the distortion is applied at camera model level. However, the GPC is a general method that supports many types of data, including surface geometry data and that offers great flexibility for designing the transition region, including for achieving sampling rate continuity. Compared to space distortion techniques the GPC is a pinhole thus it has no disocclusion capability, but the GPC avoids the disadvantages of difficult distortion design and of a distorted focus region.
Antialiasing. Mip-mapping [32] is an effective hardware supported technique for avoiding minification artifacts when rendering from image data. Antialiasing surface geometry however remains challenging. By combining supersampling with multisampling, which only supersamples coverage and shades once per fragment, today’s ultra high-end NVIDIA [33] and ATI [34] GPUs achieve a full-screen total antialiasing level of
64x (i.e. 8x8). While this is adequate for smoothing triangle edges in most cases, it is insufficient for avoiding minification artifacts when rendering triangles with a small screen footprint. For such triangles a higher level of true supersampling is needed. Full-screen true supersampling at extreme levels (e.g. 1,024x) will remain impractical for the foreseeable future. However, extreme supersampling is only needed for the screen areas with extreme complexity. The GPC enables feed-forward rendering with adaptive supersampling, a practice reserved so far for ray tracing [35]. Finally we note that both NVIDIA and ATI have exposed functionality for per primitive antialiasing setting, but the supersampling level cannot be locally adapted.
Non-Uniformly Sampled Images. One of the early uses of non-conventional camera models and the resulting non-uniformly sampled images was to produce panoramic 2-D images to be used as environment maps. These single-image panoramas were gradually supplanted by cube maps modeled with six PPCs only to be recently reconsidered [36] in light of the great programmability and power of today’s GPUs. Researchers have also developed non-pinhole cameras (e.g. the general linear camera [37], the occlusion camera [38]) in order to capture in a single 2-D image more than what is visible from a single viewpoint. Both single-image panoramas and non-pinhole camera images share with the GPC the challenge of non-linear rasterization—the image projection of a triangle is curved and conventional linear rasterization does not apply [47].
Non-uniformly sampled images were also encountered in the context of image-based rendering by 3-D warping [39] and of shadow map antialiasing ([40], [41]). In both cases a z-buffer is re-projected to a novel view, and the re-projected samples form an irregular pattern. The shadow mapping application has to render the irregular z-buffer from the light viewpoint. The irregular z-buffer locations are defined independently by scene geometry and the z-buffer cannot be rendered efficiently in feed-forward fashion by projection followed by rasterization. As shown in the next sections, the GPCs we have developed do provide efficient projection which ensures interactive rendering rates.
THE GENERAL PINHOLE CAMERA
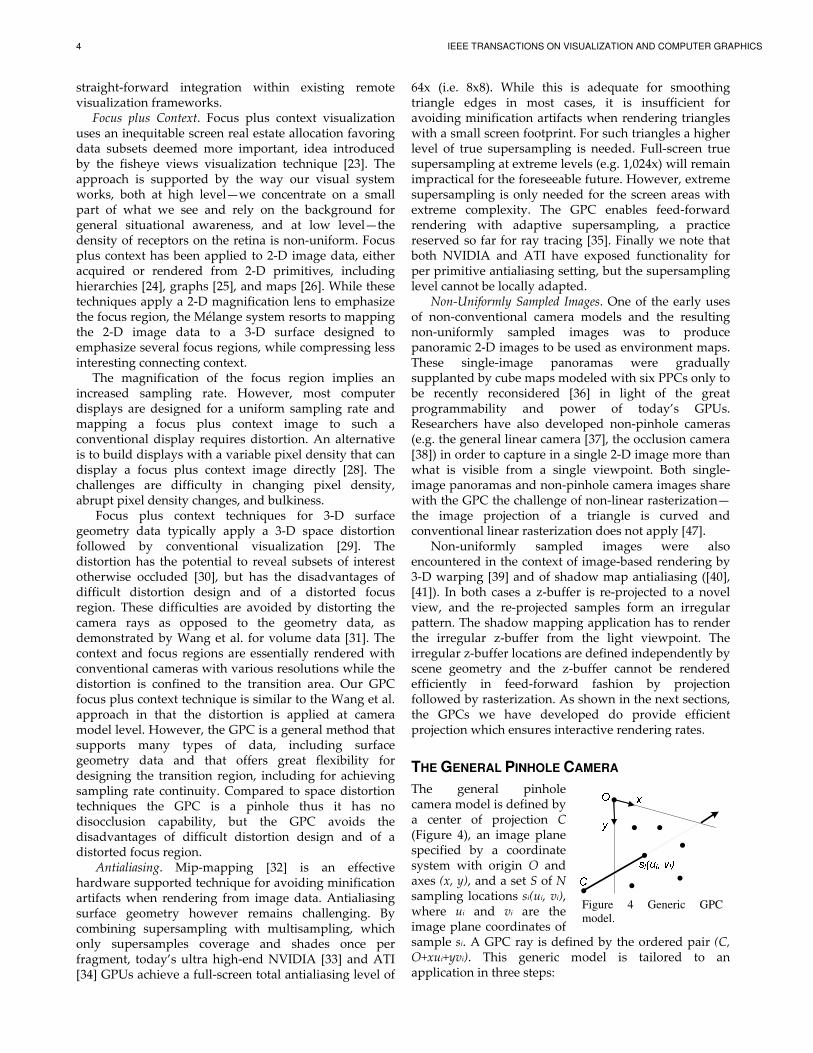
The general pinhole camera model is defined by a center of projection C (Figure 4), an image plane specified by a coordinate system with origin O and axes (x, y), and a set S of N sampling locations si(ui, vi), where ui and vi are the image plane coordinates of sample si. A GPC ray is defined by the ordered pair (C, O+xui+yvi). This generic model is tailored to an application in three steps:
Figure 4 Generic GPC
model.
POPESCU ET AL.: THE GENERAL PINHOLE CAMERA: EFFECTIVE AND EFFICIENT NON-UNIFORM SAMPLING FOR VISUALIZATION 5
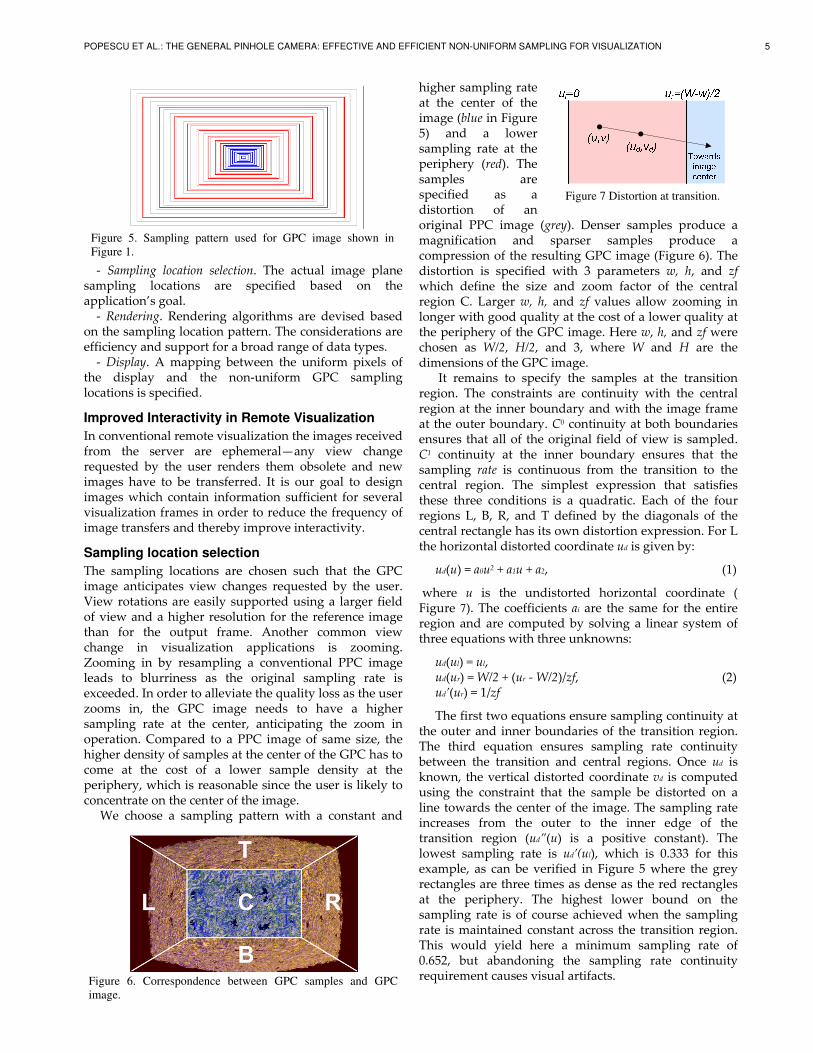
- Sampling location selection. The actual image plane sampling locations are specified based on the application’s goal. - Rendering. Rendering algorithms are devised based on the sampling location pattern. The considerations are efficiency and support for a broad range of data types. - Display. A mapping between the uniform pixels of the display and the non-uniform GPC sampling locations is specified.
Improved Interactivity in Remote Visualization
In conventional remote visualization the images received from the server are ephemeral—any view change requested by the user renders them obsolete and new images have to be transferred. It is our goal to design images which contain information sufficient for several visualization frames in order to reduce the frequency of image transfers and thereby improve interactivity.
Sampling location selection
The sampling locations are chosen such that the GPC image anticipates view changes requested by the user. View rotations are easily supported using a larger field of view and a higher resolution for the reference image than for the output frame. Another common view change in visualization applications is zooming. Zooming in by resampling a conventional PPC image leads to blurriness as the original sampling rate is exceeded. In order to alleviate the quality loss as the user zooms in, the GPC image needs to have a higher sampling rate at the center, anticipating the zoom in operation. Compared to a PPC image of same size, the higher density of samples at the center of the GPC has to come at the cost of a lower sample density at the periphery, which is reasonable since the user is likely to concentrate on the center of the image.
We choose a sampling pattern with a constant and
higher sampling rate at the center of the image (blue in Figure 5) and a lower sampling rate at the periphery (red). The samples are specified as a distortion of an original PPC image (grey). Denser samples produce a magnification and sparser samples produce a compression of the resulting GPC image (Figure 6). The distortion is specified with 3 parameters w, h, and zf which define the size and zoom factor of the central region C. Larger w, h, and zf values allow zooming in longer with good quality at the cost of a lower quality at the periphery of the GPC image. Here w, h, and zf were chosen as W/2, H/2, and 3, where W and H are the dimensions of the GPC image.
It remains to specify the samples at the transition region. The constraints are continuity with the central region at the inner boundary and with the image frame at the outer boundary. C0 continuity at both boundaries ensures that all of the original field of view is sampled. C1 continuity at the inner boundary ensures that the sampling rate is continuous from the transition to the central region. The simplest expression that satisfies these three conditions is a quadratic. Each of the four regions L, B, R, and T defined by the diagonals of the central rectangle has its own distortion expression. For L the horizontal distorted coordinate ud is given by:
ud(u) = a0u2 + a1u + a2, (1)
where u is the undistorted horizontal coordinate ( Figure 7). The coefficients ai are the same for the entire region and are computed by solving a linear system of three equations with three unknowns:
ud(ul) = ul, ud(ur) = W/2 + (ur - W/2)/zf, (2) ud’(ur) = 1/zf
The first two equations ensure sampling continuity at the outer and inner boundaries of the transition region. The third equation ensures sampling rate continuity between the transition and central regions. Once ud is known, the vertical distorted coordinate vd is computed using the constraint that the sample be distorted on a line towards the center of the image. The sampling rate increases from the outer to the inner edge of the transition region (ud”(u) is a positive constant). The lowest sampling rate is ud’(ul), which is 0.333 for this example, as can be verified in Figure 5 where the grey rectangles are three times as dense as the red rectangles at the periphery. The highest lower bound on the sampling rate is of course achieved when the sampling rate is maintained constant across the transition region. This would yield here a minimum sampling rate of 0.652, but abandoning the sampling rate continuity requirement causes visual artifacts.
Figure 5. Sampling pattern used for GPC image shown in
Figure 1.
Figure 6. Correspondence between GPC samples and GPC
image.
Figure 7 Distortion at transition.
6 IEEE TRANSACTIONS ON VISUALIZATION AND COMPUTER GRAPHICS
In summary, a GPC with WxH sampling locations is defined by a PPC with resolution WxH, a central rectangular region with a magnification factor, and 4 quadratic distortion expressions, one for each of the sub-regions of the transition region.
Rendering
Ray casting
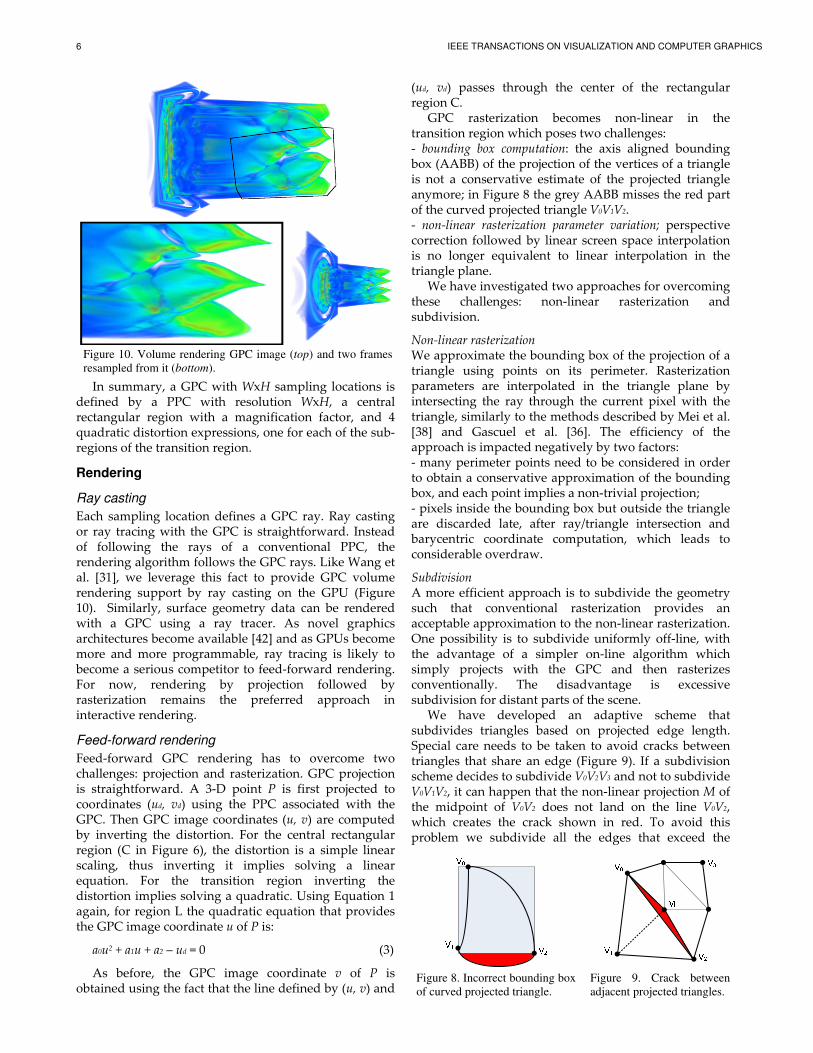
Each sampling location defines a GPC ray. Ray casting or ray tracing with the GPC is straightforward. Instead of following the rays of a conventional PPC, the rendering algorithm follows the GPC rays. Like Wang et al. [31], we leverage this fact to provide GPC volume rendering support by ray casting on the GPU (Figure 10). Similarly, surface geometry data can be rendered with a GPC using a ray tracer. As novel graphics architectures become available [42] and as GPUs become more and more programmable, ray tracing is likely to become a serious competitor to feed-forward rendering. For now, rendering by projection followed by rasterization remains the preferred approach in interactive rendering.
Feed-forward rendering
Feed-forward GPC rendering has to overcome two challenges: projection and rasterization. GPC projection is straightforward. A 3-D point P is first projected to coordinates (ud, vd) using the PPC associated with the GPC. Then GPC image coordinates (u, v) are computed by inverting the distortion. For the central rectangular region (C in Figure 6), the distortion is a simple linear scaling, thus inverting it implies solving a linear equation. For the transition region inverting the distortion implies solving a quadratic. Using Equation 1 again, for region L the quadratic equation that provides the GPC image coordinate u of P is:
a0u2 + a1u + a2 – ud = 0 (3)
As before, the GPC image coordinate v of P is obtained using the fact that the line defined by (u, v) and
(ud, vd) passes through the center of the rectangular region C.
GPC rasterization becomes non-linear in the transition region which poses two challenges: - bounding box computation: the axis aligned bounding box (AABB) of the projection of the vertices of a triangle is not a conservative estimate of the projected triangle anymore; in Figure 8 the grey AABB misses the red part of the curved projected triangle V0V1V2. - non-linear rasterization parameter variation; perspective correction followed by linear screen space interpolation is no longer equivalent to linear interpolation in the triangle plane.
We have investigated two approaches for overcoming these challenges: non-linear rasterization and subdivision.
Non-linear rasterization We approximate the bounding box of the projection of a triangle using points on its perimeter. Rasterization parameters are interpolated in the triangle plane by intersecting the ray through the current pixel with the triangle, similarly to the methods described by Mei et al. [38] and Gascuel et al. [36]. The efficiency of the approach is impacted negatively by two factors: - many perimeter points need to be considered in order to obtain a conservative approximation of the bounding box, and each point implies a non-trivial projection; - pixels inside the bounding box but outside the triangle are discarded late, after ray/triangle intersection and barycentric coordinate computation, which leads to considerable overdraw.
Subdivision A more efficient approach is to subdivide the geometry such that conventional rasterization provides an acceptable approximation to the non-linear rasterization. One possibility is to subdivide uniformly off-line, with the advantage of a simpler on-line algorithm which simply projects with the GPC and then rasterizes conventionally. The disadvantage is excessive subdivision for distant parts of the scene.
We have developed an adaptive scheme that subdivides triangles based on projected edge length. Special care needs to be taken to avoid cracks between triangles that share an edge (Figure 9). If a subdivision scheme decides to subdivide V0V2V3 and not to subdivide V0V1V2, it can happen that the non-linear projection M of the midpoint of V0V2 does not land on the line V0V2, which creates the crack shown in red. To avoid this problem we subdivide all the edges that exceed the
Figure 8. Incorrect bounding box
of curved projected triangle.
Figure 9. Crack between
adjacent projected triangles.
Figure 10. Volume rendering GPC image (top) and two frames
resampled from it (bottom).
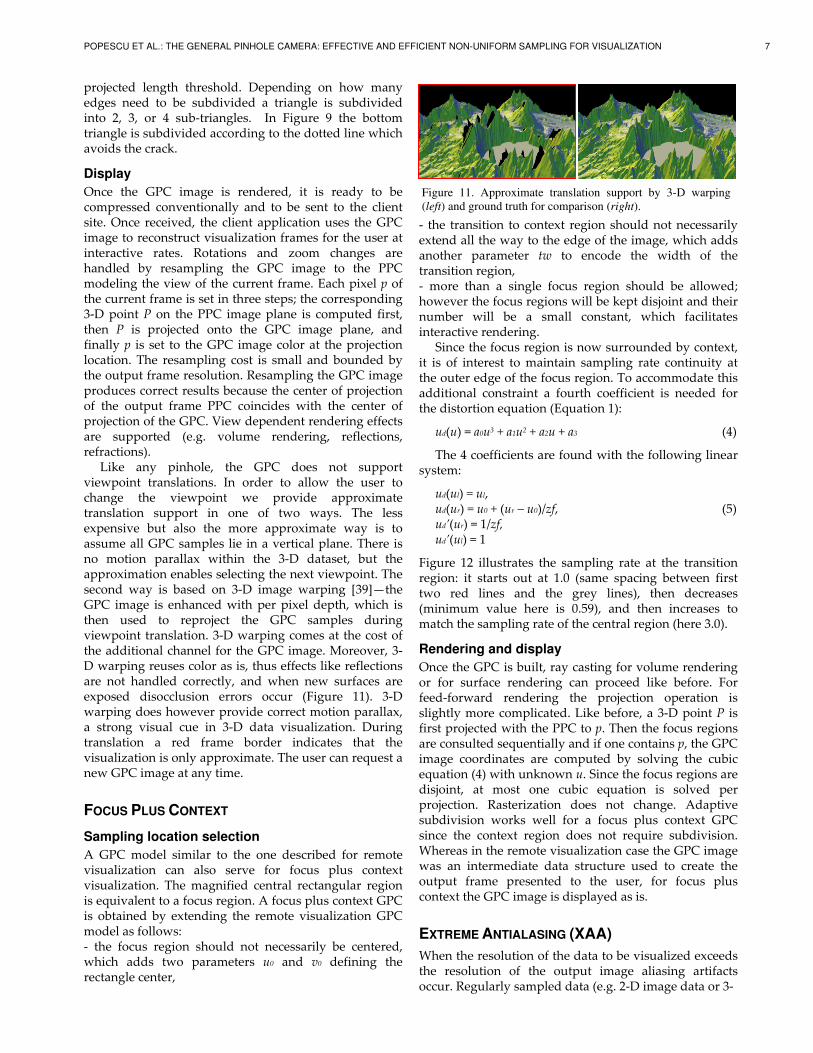
POPESCU ET AL.: THE GENERAL PINHOLE CAMERA: EFFECTIVE AND EFFICIENT NON-UNIFORM SAMPLING FOR VISUALIZATION 7
projected length threshold. Depending on how many edges need to be subdivided a triangle is subdivided into 2, 3, or 4 sub-triangles. In Figure 9 the bottom triangle is subdivided according to the dotted line which avoids the crack.
Display
Once the GPC image is rendered, it is ready to be compressed conventionally and to be sent to the client site. Once received, the client application uses the GPC image to reconstruct visualization frames for the user at interactive rates. Rotations and zoom changes are handled by resampling the GPC image to the PPC modeling the view of the current frame. Each pixel p of the current frame is set in three steps; the corresponding 3-D point P on the PPC image plane is computed first, then P is projected onto the GPC image plane, and finally p is set to the GPC image color at the projection location. The resampling cost is small and bounded by the output frame resolution. Resampling the GPC image produces correct results because the center of projection of the output frame PPC coincides with the center of projection of the GPC. View dependent rendering effects are supported (e.g. volume rendering, reflections, refractions).
Like any pinhole, the GPC does not support viewpoint translations. In order to allow the user to change the viewpoint we provide approximate translation support in one of two ways. The less expensive but also the more approximate way is to assume all GPC samples lie in a vertical plane. There is no motion parallax within the 3-D dataset, but the approximation enables selecting the next viewpoint. The second way is based on 3-D image warping [39]—the GPC image is enhanced with per pixel depth, which is then used to reproject the GPC samples during viewpoint translation. 3-D warping comes at the cost of the additional channel for the GPC image. Moreover, 3-D warping reuses color as is, thus effects like reflections are not handled correctly, and when new surfaces are exposed disocclusion errors occur (Figure 11). 3-D warping does however provide correct motion parallax, a strong visual cue in 3-D data visualization. During translation a red frame border indicates that the visualization is only approximate. The user can request a new GPC image at any time.
FOCUS PLUS CONTEXT
Sampling location selection
A GPC model similar to the one described for remote visualization can also serve for focus plus context visualization. The magnified central rectangular region is equivalent to a focus region. A focus plus context GPC is obtained by extending the remote visualization GPC model as follows: - the focus region should not necessarily be centered, which adds two parameters u0 and v0 defining the rectangle center,
- the transition to context region should not necessarily extend all the way to the edge of the image, which adds another parameter tw to encode the width of the transition region, - more than a single focus region should be allowed; however the focus regions will be kept disjoint and their number will be a small constant, which facilitates interactive rendering.
Since the focus region is now surrounded by context, it is of interest to maintain sampling rate continuity at the outer edge of the focus region. To accommodate this additional constraint a fourth coefficient is needed for the distortion equation (Equation 1):
ud(u) = a0u3 + a1u2 + a2u + a3 (4)
The 4 coefficients are found with the following linear system:
ud(ul) = ul, ud(ur) = u0 + (ur – u0)/zf, (5) ud’(ur) = 1/zf, ud’(ul) = 1
Figure 12 illustrates the sampling rate at the transition region: it starts out at 1.0 (same spacing between first two red lines and the grey lines), then decreases (minimum value here is 0.59), and then increases to match the sampling rate of the central region (here 3.0).
Rendering and display
Once the GPC is built, ray casting for volume rendering or for surface rendering can proceed like before. For feed-forward rendering the projection operation is slightly more complicated. Like before, a 3-D point P is first projected with the PPC to p. Then the focus regions are consulted sequentially and if one contains p, the GPC image coordinates are computed by solving the cubic equation (4) with unknown u. Since the focus regions are disjoint, at most one cubic equation is solved per projection. Rasterization does not change. Adaptive subdivision works well for a focus plus context GPC since the context region does not require subdivision. Whereas in the remote visualization case the GPC image was an intermediate data structure used to create the output frame presented to the user, for focus plus context the GPC image is displayed as is.
EXTREME ANTIALASING (XAA)
When the resolution of the data to be visualized exceeds the resolution of the output image aliasing artifacts occur. Regularly sampled data (e.g. 2-D image data or 3-
Figure 11. Approximate translation support by 3-D warping
(left) and ground truth for comparison (right).
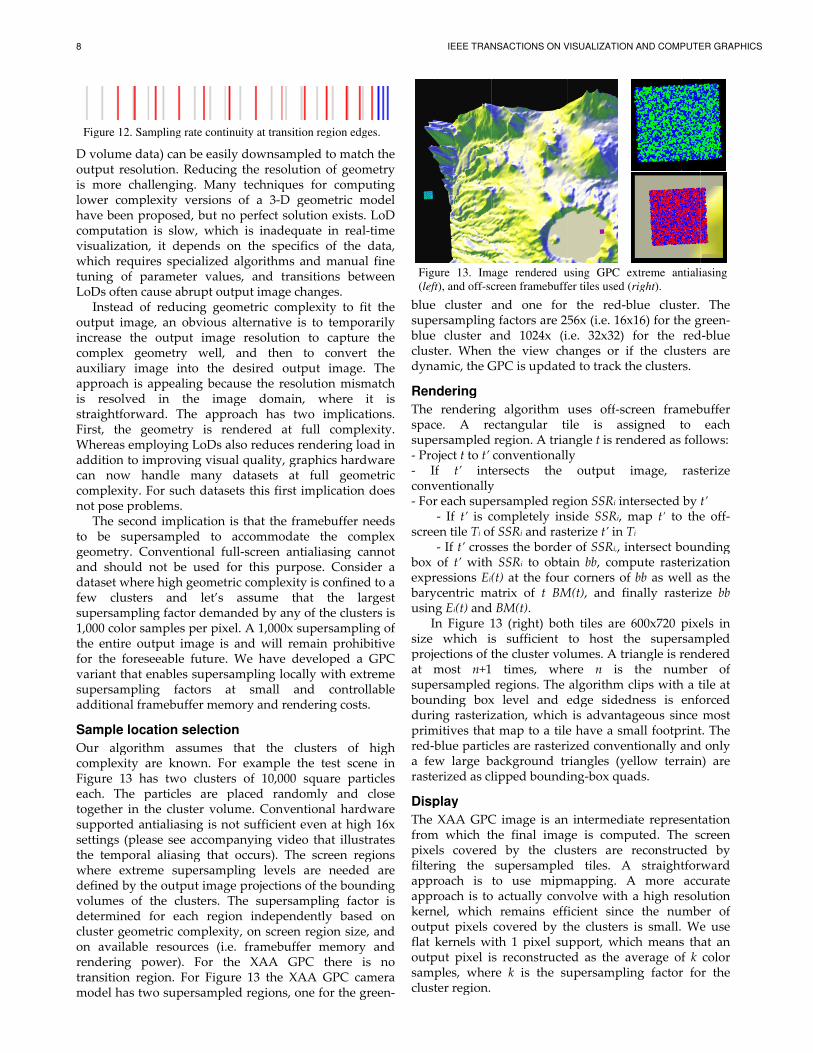
8
D volume data) can be easily downsampled to match the output resolution. Reducing the resolution of geometry is more challenging. Many techniques for computing lower complexity versions of a 3have computation is slow, which is inadequate in realvisualization, it depends on the specifics of the data, which requires specialized algorithms and manual fine tuning of parameter values, and transitioLoDs often
Instead of reducing geometric complexity to fit the output image, an obvious alternative is to temporarily increase the output image resolution to capture the complex geometry well, and then to conveauxiliary image into the desired output image. The approach is appealing because the resolution mismatch is resolved in the image domain, where it is straightforward. First, the geometry is rendered at full complexWhereas additioncan now complexity.not pose problems.
The second to be supersampled to accommodate the complex geometry. Cand should not dataset where high geometric complexity is confined to a few supersampling factor demanded by any of the clusters is 1,000 the entire output image for the foreseeable future. variant that enables supersampling locally supersampling factors additional framebuffer memory and rendering costs.
Sample location selection
Our algorithm assumes that the clusters of high complexity are knownFigure each. The particles are placed randomly and close together in the cluster volume. Conventional hardware supported antialiasing is not sufficient evsettings (please see accompanying video that illustrates the where extreme supersampling levels are needed are defined by the output image projectionvolumes of the clustersdetermined for each region independently cluster on rendering power)transition regionmodel has two supersampled regions, one for the green
Figure
D volume data) can be easily downsampled to match the output resolution. Reducing the resolution of geometry is more challenging. Many techniques for computing lower complexity versions of a 3have been proposed, but no perfect solution exists. LoD computation is slow, which is inadequate in realvisualization, it depends on the specifics of the data, which requires specialized algorithms and manual fine tuning of parameter values, and transitioLoDs often
Instead of reducing geometric complexity to fit the output image, an obvious alternative is to temporarily increase the output image resolution to capture the complex geometry well, and then to conveauxiliary image into the desired output image. The approach is appealing because the resolution mismatch is resolved in the image domain, where it is straightforward. First, the geometry is rendered at full complexWhereas additioncan now complexity.not pose problems.
The second to be supersampled to accommodate the complex geometry. Cand should not dataset where high geometric complexity is confined to a few clusterssupersampling factor demanded by any of the clusters is 1,000 color the entire output image for the foreseeable future. variant that enables supersampling locally supersampling factors additional framebuffer memory and rendering costs.
Sample location selection
Our algorithm assumes that the clusters of high complexity are knownFigure each. The particles are placed randomly and close together in the cluster volume. Conventional hardware supported antialiasing is not sufficient evsettings (please see accompanying video that illustrates the temporal aliasingwhere extreme supersampling levels are needed are defined by the output image projectionvolumes of the clustersdetermined for each region independently cluster on available rendering power)transition regionmodel has two supersampled regions, one for the green
Figure
D volume data) can be easily downsampled to match the output resolution. Reducing the resolution of geometry is more challenging. Many techniques for computing lower complexity versions of a 3
been proposed, but no perfect solution exists. LoD computation is slow, which is inadequate in realvisualization, it depends on the specifics of the data, which requires specialized algorithms and manual fine tuning of parameter values, and transitioLoDs often
Instead of reducing geometric complexity to fit the output image, an obvious alternative is to temporarily increase the output image resolution to capture the complex geometry well, and then to conveauxiliary image into the desired output image. The approach is appealing because the resolution mismatch is resolved in the image domain, where it is straightforward. First, the geometry is rendered at full complexWhereas employing addition to improving visual quality, graphics hardware can now complexity.not pose problems.
The second to be supersampled to accommodate the complex geometry. Cand should not dataset where high geometric complexity is confined to a
clusterssupersampling factor demanded by any of the clusters is
color the entire output image for the foreseeable future. variant that enables supersampling locally supersampling factors additional framebuffer memory and rendering costs.
Sample location selection
Our algorithm assumes that the clusters of high complexity are knownFigure 13each. The particles are placed randomly and close together in the cluster volume. Conventional hardware supported antialiasing is not sufficient evsettings (please see accompanying video that illustrates
temporal aliasingwhere extreme supersampling levels are needed are defined by the output image projectionvolumes of the clustersdetermined for each region independently cluster geometric complexity
available rendering power)transition regionmodel has two supersampled regions, one for the green
Figure 12. Sampling rate
D volume data) can be easily downsampled to match the output resolution. Reducing the resolution of geometry is more challenging. Many techniques for computing lower complexity versions of a 3
been proposed, but no perfect solution exists. LoD computation is slow, which is inadequate in realvisualization, it depends on the specifics of the data, which requires specialized algorithms and manual fine tuning of parameter values, and transitioLoDs often cause
Instead of reducing geometric complexity to fit the output image, an obvious alternative is to temporarily increase the output image resolution to capture the complex geometry well, and then to conveauxiliary image into the desired output image. The approach is appealing because the resolution mismatch is resolved in the image domain, where it is straightforward. First, the geometry is rendered at full complex
employing to improving visual quality, graphics hardware
can now handle many datasets at full geometric complexity. For such datasets this first implication does not pose problems.
The second to be supersampled to accommodate the complex geometry. Conventional fulland should not dataset where high geometric complexity is confined to a
clusterssupersampling factor demanded by any of the clusters is
color samples per pixel. the entire output image for the foreseeable future. variant that enables supersampling locally supersampling factors additional framebuffer memory and rendering costs.
Sample location selection
Our algorithm assumes that the clusters of high complexity are known
13 has two clusters of 10,000 square particles each. The particles are placed randomly and close together in the cluster volume. Conventional hardware supported antialiasing is not sufficient evsettings (please see accompanying video that illustrates
temporal aliasingwhere extreme supersampling levels are needed are defined by the output image projectionvolumes of the clustersdetermined for each region independently
geometric complexityavailable
rendering power)transition regionmodel has two supersampled regions, one for the green
. Sampling rate
D volume data) can be easily downsampled to match the output resolution. Reducing the resolution of geometry is more challenging. Many techniques for computing lower complexity versions of a 3
been proposed, but no perfect solution exists. LoD computation is slow, which is inadequate in realvisualization, it depends on the specifics of the data, which requires specialized algorithms and manual fine tuning of parameter values, and transitio
cause Instead of reducing geometric complexity to fit the
output image, an obvious alternative is to temporarily increase the output image resolution to capture the complex geometry well, and then to conveauxiliary image into the desired output image. The approach is appealing because the resolution mismatch is resolved in the image domain, where it is straightforward. First, the geometry is rendered at full complex
employing to improving visual quality, graphics hardware
handle many datasets at full geometric For such datasets this first implication does
not pose problems. The second implication is that the framebuffer needs
to be supersampled to accommodate the complex onventional full
and should not dataset where high geometric complexity is confined to a
clusters and let’s supersampling factor demanded by any of the clusters is
samples per pixel. the entire output image for the foreseeable future. variant that enables supersampling locally supersampling factors additional framebuffer memory and rendering costs.
Sample location selection
Our algorithm assumes that the clusters of high complexity are known
has two clusters of 10,000 square particles each. The particles are placed randomly and close together in the cluster volume. Conventional hardware supported antialiasing is not sufficient evsettings (please see accompanying video that illustrates
temporal aliasingwhere extreme supersampling levels are needed are defined by the output image projectionvolumes of the clustersdetermined for each region independently
geometric complexityavailable resources
rendering power)transition regionmodel has two supersampled regions, one for the green
. Sampling rate
D volume data) can be easily downsampled to match the output resolution. Reducing the resolution of geometry is more challenging. Many techniques for computing lower complexity versions of a 3
been proposed, but no perfect solution exists. LoD computation is slow, which is inadequate in realvisualization, it depends on the specifics of the data, which requires specialized algorithms and manual fine tuning of parameter values, and transitio
cause abrupt Instead of reducing geometric complexity to fit the
output image, an obvious alternative is to temporarily increase the output image resolution to capture the complex geometry well, and then to conveauxiliary image into the desired output image. The approach is appealing because the resolution mismatch is resolved in the image domain, where it is straightforward. The approach has two implications. First, the geometry is rendered at full complex
employing to improving visual quality, graphics hardware
handle many datasets at full geometric For such datasets this first implication does
not pose problems. implication is that the framebuffer needs
to be supersampled to accommodate the complex onventional full
and should not be used dataset where high geometric complexity is confined to a
and let’s supersampling factor demanded by any of the clusters is
samples per pixel. the entire output image for the foreseeable future. variant that enables supersampling locally supersampling factors additional framebuffer memory and rendering costs.
Sample location selection
Our algorithm assumes that the clusters of high complexity are known
has two clusters of 10,000 square particles each. The particles are placed randomly and close together in the cluster volume. Conventional hardware supported antialiasing is not sufficient evsettings (please see accompanying video that illustrates
temporal aliasingwhere extreme supersampling levels are needed are defined by the output image projectionvolumes of the clustersdetermined for each region independently
geometric complexityresources
rendering power). transition region. Fomodel has two supersampled regions, one for the green
. Sampling rate
D volume data) can be easily downsampled to match the output resolution. Reducing the resolution of geometry is more challenging. Many techniques for computing lower complexity versions of a 3
been proposed, but no perfect solution exists. LoD computation is slow, which is inadequate in realvisualization, it depends on the specifics of the data, which requires specialized algorithms and manual fine tuning of parameter values, and transitio
abrupt Instead of reducing geometric complexity to fit the
output image, an obvious alternative is to temporarily increase the output image resolution to capture the complex geometry well, and then to conveauxiliary image into the desired output image. The approach is appealing because the resolution mismatch is resolved in the image domain, where it is
The approach has two implications. First, the geometry is rendered at full complex
employing LoDto improving visual quality, graphics hardware
handle many datasets at full geometric For such datasets this first implication does
implication is that the framebuffer needs
to be supersampled to accommodate the complex onventional full
be used dataset where high geometric complexity is confined to a
and let’s supersampling factor demanded by any of the clusters is
samples per pixel. the entire output image for the foreseeable future. variant that enables supersampling locally supersampling factors additional framebuffer memory and rendering costs.
Sample location selection
Our algorithm assumes that the clusters of high complexity are known
has two clusters of 10,000 square particles each. The particles are placed randomly and close together in the cluster volume. Conventional hardware supported antialiasing is not sufficient evsettings (please see accompanying video that illustrates
temporal aliasing that occurswhere extreme supersampling levels are needed are defined by the output image projectionvolumes of the clustersdetermined for each region independently
geometric complexityresources
. For the XAA GPC there is no . For Figure
model has two supersampled regions, one for the green
. Sampling rate continuity at transition region edges.
D volume data) can be easily downsampled to match the output resolution. Reducing the resolution of geometry is more challenging. Many techniques for computing lower complexity versions of a 3
been proposed, but no perfect solution exists. LoD computation is slow, which is inadequate in realvisualization, it depends on the specifics of the data, which requires specialized algorithms and manual fine tuning of parameter values, and transitio
abrupt output image changes.Instead of reducing geometric complexity to fit the
output image, an obvious alternative is to temporarily increase the output image resolution to capture the complex geometry well, and then to conveauxiliary image into the desired output image. The approach is appealing because the resolution mismatch is resolved in the image domain, where it is
The approach has two implications. First, the geometry is rendered at full complex
LoDs also reduces rendering load in to improving visual quality, graphics hardware
handle many datasets at full geometric For such datasets this first implication does
implication is that the framebuffer needs to be supersampled to accommodate the complex
onventional fullbe used
dataset where high geometric complexity is confined to a and let’s
supersampling factor demanded by any of the clusters is samples per pixel.
the entire output image is and will remain prohibitive for the foreseeable future. variant that enables supersampling locally supersampling factors at small and controllable additional framebuffer memory and rendering costs.
Sample location selection
Our algorithm assumes that the clusters of high complexity are known. For example the test scene in
has two clusters of 10,000 square particles each. The particles are placed randomly and close together in the cluster volume. Conventional hardware supported antialiasing is not sufficient evsettings (please see accompanying video that illustrates
that occurswhere extreme supersampling levels are needed are defined by the output image projectionvolumes of the clusters. The supersampling factor is determined for each region independently
geometric complexityresources (i.e. framebuffer m
For the XAA GPC there is no Figure
model has two supersampled regions, one for the green
continuity at transition region edges.
D volume data) can be easily downsampled to match the output resolution. Reducing the resolution of geometry is more challenging. Many techniques for computing lower complexity versions of a 3
been proposed, but no perfect solution exists. LoD computation is slow, which is inadequate in realvisualization, it depends on the specifics of the data, which requires specialized algorithms and manual fine tuning of parameter values, and transitio
output image changes.Instead of reducing geometric complexity to fit the
output image, an obvious alternative is to temporarily increase the output image resolution to capture the complex geometry well, and then to conveauxiliary image into the desired output image. The approach is appealing because the resolution mismatch is resolved in the image domain, where it is
The approach has two implications. First, the geometry is rendered at full complex
also reduces rendering load in to improving visual quality, graphics hardware
handle many datasets at full geometric For such datasets this first implication does
implication is that the framebuffer needs to be supersampled to accommodate the complex
onventional full-screen antialiasing cannot be used for this purpose
dataset where high geometric complexity is confined to a and let’s assume that the largest
supersampling factor demanded by any of the clusters is samples per pixel.
is and will remain prohibitive for the foreseeable future. We have developedvariant that enables supersampling locally
at small and controllable additional framebuffer memory and rendering costs.
Sample location selection
Our algorithm assumes that the clusters of high For example the test scene in
has two clusters of 10,000 square particles each. The particles are placed randomly and close together in the cluster volume. Conventional hardware supported antialiasing is not sufficient evsettings (please see accompanying video that illustrates
that occurswhere extreme supersampling levels are needed are defined by the output image projection
. The supersampling factor is determined for each region independently
geometric complexity, (i.e. framebuffer m
For the XAA GPC there is no Figure
model has two supersampled regions, one for the green
continuity at transition region edges.
D volume data) can be easily downsampled to match the output resolution. Reducing the resolution of geometry is more challenging. Many techniques for computing lower complexity versions of a 3
been proposed, but no perfect solution exists. LoD computation is slow, which is inadequate in realvisualization, it depends on the specifics of the data, which requires specialized algorithms and manual fine tuning of parameter values, and transitio
output image changes.Instead of reducing geometric complexity to fit the
output image, an obvious alternative is to temporarily increase the output image resolution to capture the complex geometry well, and then to conveauxiliary image into the desired output image. The approach is appealing because the resolution mismatch is resolved in the image domain, where it is
The approach has two implications. First, the geometry is rendered at full complex
also reduces rendering load in to improving visual quality, graphics hardware
handle many datasets at full geometric For such datasets this first implication does
implication is that the framebuffer needs to be supersampled to accommodate the complex
screen antialiasing cannot for this purpose
dataset where high geometric complexity is confined to a assume that the largest
supersampling factor demanded by any of the clusters is samples per pixel. A 1,000x s
is and will remain prohibitive We have developed
variant that enables supersampling locally at small and controllable
additional framebuffer memory and rendering costs.
Our algorithm assumes that the clusters of high For example the test scene in
has two clusters of 10,000 square particles each. The particles are placed randomly and close together in the cluster volume. Conventional hardware supported antialiasing is not sufficient evsettings (please see accompanying video that illustrates
that occurswhere extreme supersampling levels are needed are defined by the output image projection
. The supersampling factor is determined for each region independently
, on screen region size, and (i.e. framebuffer m
For the XAA GPC there is no Figure 13
model has two supersampled regions, one for the green
continuity at transition region edges.
D volume data) can be easily downsampled to match the output resolution. Reducing the resolution of geometry is more challenging. Many techniques for computing lower complexity versions of a 3-D geometric model
been proposed, but no perfect solution exists. LoD computation is slow, which is inadequate in realvisualization, it depends on the specifics of the data, which requires specialized algorithms and manual fine tuning of parameter values, and transitio
output image changes.Instead of reducing geometric complexity to fit the
output image, an obvious alternative is to temporarily increase the output image resolution to capture the complex geometry well, and then to conveauxiliary image into the desired output image. The approach is appealing because the resolution mismatch is resolved in the image domain, where it is
The approach has two implications. First, the geometry is rendered at full complex
also reduces rendering load in to improving visual quality, graphics hardware
handle many datasets at full geometric For such datasets this first implication does
implication is that the framebuffer needs to be supersampled to accommodate the complex
screen antialiasing cannot for this purpose
dataset where high geometric complexity is confined to a assume that the largest
supersampling factor demanded by any of the clusters is A 1,000x s
is and will remain prohibitive We have developed
variant that enables supersampling locally at small and controllable
additional framebuffer memory and rendering costs.
Our algorithm assumes that the clusters of high For example the test scene in
has two clusters of 10,000 square particles each. The particles are placed randomly and close together in the cluster volume. Conventional hardware supported antialiasing is not sufficient evsettings (please see accompanying video that illustrates
that occurs). where extreme supersampling levels are needed are defined by the output image projection
. The supersampling factor is determined for each region independently
on screen region size, and (i.e. framebuffer m
For the XAA GPC there is no the XAA GPC camera
model has two supersampled regions, one for the green
continuity at transition region edges.
D volume data) can be easily downsampled to match the output resolution. Reducing the resolution of geometry is more challenging. Many techniques for computing
D geometric model been proposed, but no perfect solution exists. LoD
computation is slow, which is inadequate in realvisualization, it depends on the specifics of the data, which requires specialized algorithms and manual fine tuning of parameter values, and transitio
output image changes.Instead of reducing geometric complexity to fit the
output image, an obvious alternative is to temporarily increase the output image resolution to capture the complex geometry well, and then to conveauxiliary image into the desired output image. The approach is appealing because the resolution mismatch is resolved in the image domain, where it is
The approach has two implications. First, the geometry is rendered at full complex
also reduces rendering load in to improving visual quality, graphics hardware
handle many datasets at full geometric For such datasets this first implication does
implication is that the framebuffer needs to be supersampled to accommodate the complex
screen antialiasing cannot for this purpose
dataset where high geometric complexity is confined to a assume that the largest
supersampling factor demanded by any of the clusters is A 1,000x s
is and will remain prohibitive We have developed
variant that enables supersampling locally at small and controllable
additional framebuffer memory and rendering costs.
Our algorithm assumes that the clusters of high For example the test scene in
has two clusters of 10,000 square particles each. The particles are placed randomly and close together in the cluster volume. Conventional hardware supported antialiasing is not sufficient evsettings (please see accompanying video that illustrates
). The screen regions where extreme supersampling levels are needed are defined by the output image projections
. The supersampling factor is determined for each region independently
on screen region size, and (i.e. framebuffer m
For the XAA GPC there is no the XAA GPC camera
model has two supersampled regions, one for the green
continuity at transition region edges.
D volume data) can be easily downsampled to match the output resolution. Reducing the resolution of geometry is more challenging. Many techniques for computing
D geometric model been proposed, but no perfect solution exists. LoD
computation is slow, which is inadequate in realvisualization, it depends on the specifics of the data, which requires specialized algorithms and manual fine tuning of parameter values, and transitio
output image changes.Instead of reducing geometric complexity to fit the
output image, an obvious alternative is to temporarily increase the output image resolution to capture the complex geometry well, and then to conveauxiliary image into the desired output image. The approach is appealing because the resolution mismatch is resolved in the image domain, where it is
The approach has two implications. First, the geometry is rendered at full complex
also reduces rendering load in to improving visual quality, graphics hardware
handle many datasets at full geometric For such datasets this first implication does
implication is that the framebuffer needs to be supersampled to accommodate the complex
screen antialiasing cannot for this purpose
dataset where high geometric complexity is confined to a assume that the largest
supersampling factor demanded by any of the clusters is A 1,000x supersampling
is and will remain prohibitive We have developed
variant that enables supersampling locally with extreme at small and controllable
additional framebuffer memory and rendering costs.
Our algorithm assumes that the clusters of high For example the test scene in
has two clusters of 10,000 square particles each. The particles are placed randomly and close together in the cluster volume. Conventional hardware supported antialiasing is not sufficient even at high 16x settings (please see accompanying video that illustrates
The screen regions where extreme supersampling levels are needed are
of the bounding . The supersampling factor is
determined for each region independently on screen region size, and
(i.e. framebuffer mFor the XAA GPC there is no
the XAA GPC camera model has two supersampled regions, one for the green
continuity at transition region edges.
D volume data) can be easily downsampled to match the output resolution. Reducing the resolution of geometry is more challenging. Many techniques for computing
D geometric model been proposed, but no perfect solution exists. LoD
computation is slow, which is inadequate in realvisualization, it depends on the specifics of the data, which requires specialized algorithms and manual fine tuning of parameter values, and transitions between
output image changes.Instead of reducing geometric complexity to fit the
output image, an obvious alternative is to temporarily increase the output image resolution to capture the complex geometry well, and then to conveauxiliary image into the desired output image. The approach is appealing because the resolution mismatch is resolved in the image domain, where it is
The approach has two implications. First, the geometry is rendered at full complex
also reduces rendering load in to improving visual quality, graphics hardware
handle many datasets at full geometric For such datasets this first implication does
implication is that the framebuffer needs to be supersampled to accommodate the complex
screen antialiasing cannot for this purpose. Consider a
dataset where high geometric complexity is confined to a assume that the largest
supersampling factor demanded by any of the clusters is upersampling
is and will remain prohibitive We have developed
with extreme at small and controllable
additional framebuffer memory and rendering costs.
Our algorithm assumes that the clusters of high For example the test scene in
has two clusters of 10,000 square particles each. The particles are placed randomly and close together in the cluster volume. Conventional hardware
en at high 16x settings (please see accompanying video that illustrates
The screen regions where extreme supersampling levels are needed are
of the bounding . The supersampling factor is
determined for each region independently on screen region size, and
(i.e. framebuffer memory and For the XAA GPC there is no
the XAA GPC camera model has two supersampled regions, one for the green
continuity at transition region edges.
D volume data) can be easily downsampled to match the output resolution. Reducing the resolution of geometry is more challenging. Many techniques for computing
D geometric model been proposed, but no perfect solution exists. LoD
computation is slow, which is inadequate in realvisualization, it depends on the specifics of the data, which requires specialized algorithms and manual fine
ns between output image changes.
Instead of reducing geometric complexity to fit the output image, an obvious alternative is to temporarily increase the output image resolution to capture the complex geometry well, and then to convert the auxiliary image into the desired output image. The approach is appealing because the resolution mismatch is resolved in the image domain, where it is
The approach has two implications. First, the geometry is rendered at full complex
also reduces rendering load in to improving visual quality, graphics hardware
handle many datasets at full geometric For such datasets this first implication does
implication is that the framebuffer needs to be supersampled to accommodate the complex
screen antialiasing cannot Consider a
dataset where high geometric complexity is confined to a assume that the largest
supersampling factor demanded by any of the clusters is upersampling
is and will remain prohibitive We have developed a GPC
with extreme at small and controllable
additional framebuffer memory and rendering costs.
Our algorithm assumes that the clusters of high For example the test scene in
has two clusters of 10,000 square particles each. The particles are placed randomly and close together in the cluster volume. Conventional hardware
en at high 16x settings (please see accompanying video that illustrates
The screen regions where extreme supersampling levels are needed are
of the bounding . The supersampling factor is
determined for each region independently based on on screen region size, and
emory and For the XAA GPC there is no
the XAA GPC camera model has two supersampled regions, one for the green
continuity at transition region edges.
D volume data) can be easily downsampled to match the output resolution. Reducing the resolution of geometry is more challenging. Many techniques for computing
D geometric model been proposed, but no perfect solution exists. LoD
computation is slow, which is inadequate in real-time visualization, it depends on the specifics of the data, which requires specialized algorithms and manual fine
ns between
Instead of reducing geometric complexity to fit the output image, an obvious alternative is to temporarily increase the output image resolution to capture the
rt the auxiliary image into the desired output image. The approach is appealing because the resolution mismatch is resolved in the image domain, where it is
The approach has two implications. First, the geometry is rendered at full complexity.
also reduces rendering load in to improving visual quality, graphics hardware
handle many datasets at full geometric For such datasets this first implication does
implication is that the framebuffer needs to be supersampled to accommodate the complex
screen antialiasing cannot Consider a
dataset where high geometric complexity is confined to a assume that the largest
supersampling factor demanded by any of the clusters is upersampling
is and will remain prohibitive a GPC
with extreme at small and controllable
additional framebuffer memory and rendering costs.
Our algorithm assumes that the clusters of high For example the test scene in
has two clusters of 10,000 square particles each. The particles are placed randomly and close together in the cluster volume. Conventional hardware
en at high 16x settings (please see accompanying video that illustrates
The screen regions where extreme supersampling levels are needed are
of the bounding . The supersampling factor is
based on on screen region size, and
emory and For the XAA GPC there is no
the XAA GPC camera model has two supersampled regions, one for the green
continuity at transition region edges.
D volume data) can be easily downsampled to match the output resolution. Reducing the resolution of geometry is more challenging. Many techniques for computing
D geometric model been proposed, but no perfect solution exists. LoD
time visualization, it depends on the specifics of the data, which requires specialized algorithms and manual fine
ns between
Instead of reducing geometric complexity to fit the output image, an obvious alternative is to temporarily increase the output image resolution to capture the
rt the auxiliary image into the desired output image. The approach is appealing because the resolution mismatch is resolved in the image domain, where it is
The approach has two implications. ity.
also reduces rendering load in to improving visual quality, graphics hardware
handle many datasets at full geometric For such datasets this first implication does
implication is that the framebuffer needs to be supersampled to accommodate the complex
screen antialiasing cannot Consider a
dataset where high geometric complexity is confined to a assume that the largest
supersampling factor demanded by any of the clusters is upersampling of
is and will remain prohibitive a GPC
with extreme at small and controllable
Our algorithm assumes that the clusters of high For example the test scene in
has two clusters of 10,000 square particles each. The particles are placed randomly and close together in the cluster volume. Conventional hardware
en at high 16x settings (please see accompanying video that illustrates
The screen regions where extreme supersampling levels are needed are
of the bounding . The supersampling factor is
based on on screen region size, and
emory and For the XAA GPC there is no
the XAA GPC camera model has two supersampled regions, one for the green-
continuity at transition region edges.
D volume data) can be easily downsampled to match the output resolution. Reducing the resolution of geometry is more challenging. Many techniques for computing
D geometric model been proposed, but no perfect solution exists. LoD
time visualization, it depends on the specifics of the data, which requires specialized algorithms and manual fine
ns between
Instead of reducing geometric complexity to fit the output image, an obvious alternative is to temporarily increase the output image resolution to capture the
rt the auxiliary image into the desired output image. The approach is appealing because the resolution mismatch is resolved in the image domain, where it is
The approach has two implications. ity.
also reduces rendering load in to improving visual quality, graphics hardware
handle many datasets at full geometric For such datasets this first implication does
implication is that the framebuffer needs to be supersampled to accommodate the complex
screen antialiasing cannot Consider a
dataset where high geometric complexity is confined to a assume that the largest
supersampling factor demanded by any of the clusters is of
is and will remain prohibitive a GPC
with extreme at small and controllable
Our algorithm assumes that the clusters of high For example the test scene in
has two clusters of 10,000 square particles each. The particles are placed randomly and close together in the cluster volume. Conventional hardware
en at high 16x settings (please see accompanying video that illustrates
The screen regions where extreme supersampling levels are needed are
of the bounding . The supersampling factor is
based on on screen region size, and
emory and For the XAA GPC there is no
the XAA GPC camera
blue cluster and one for the redsupersampling fblue cluster and 1024x (i.e. 32x32) for the redcluster.dynamic, the
Rendering
The rendering space. supersampled region- - conventionally- screen tile box of expressions barycentric matrix of using
size which is sufficient to host the supersampled projectionat most supersampled regions. The algorithm bounding box level and edge sidedness is enforced during rasterization, primitives that map to a tile have a small footprint. The reda few large background triangles (yellow terrain) are rasterized as
Display
The from which the final image is computed. The screen pixels covered by the clfiltering the supersampled tiles. A straightforward approach is to use mipmapping. A more accurate approach is to actually convolve kernel, which remains efficient since the number of output pixels coveredflat output pixel is reconstructed as the samples, where cluster region.
blue cluster and one for the redsupersampling fblue cluster and 1024x (i.e. 32x32) for the redcluster.dynamic, the
Rendering
The rendering space. supersampled region Project If
conventionally For each supersampled region
screen tile box of expressions barycentric matrix of using
In size which is sufficient to host the supersampled projectionat most supersampled regions. The algorithm bounding box level and edge sidedness is enforced during rasterization, primitives that map to a tile have a small footprint. The red-blue particles are rasterizeda few large background triangles (yellow terrain) are rasterized as
Display
The from which the final image is computed. The screen pixels covered by the clfiltering the supersampled tiles. A straightforward approach is to use mipmapping. A more accurate approach is to actually convolve kernel, which remains efficient since the number of output pixels coveredlat
output pixel is reconstructed as the samples, where cluster region.
Figure
(left
IEEE TRANSACTIONS ON
blue cluster and one for the redsupersampling fblue cluster and 1024x (i.e. 32x32) for the redcluster. dynamic, the
Rendering
The rendering space. supersampled region
Project If
conventionallyFor each supersampled region
- If screen tile - If box of t’ expressions barycentric matrix of using Ei
In Figure size which is sufficient to host the supersampled projectionat most supersampled regions. The algorithm bounding box level and edge sidedness is enforced during rasterization, primitives that map to a tile have a small footprint. The
blue particles are rasterizeda few large background triangles (yellow terrain) are rasterized as
Display
The XAA GPC image is an intermediate representation from which the final image is computed. The screen pixels covered by the clfiltering the supersampled tiles. A straightforward approach is to use mipmapping. A more accurate approach is to actually convolve kernel, which remains efficient since the number of output pixels coveredlat kernels wi
output pixel is reconstructed as the samples, where cluster region.
Figure
left), and off
IEEE TRANSACTIONS ON
blue cluster and one for the redsupersampling fblue cluster and 1024x (i.e. 32x32) for the red
When the view changes or if the clusters are dynamic, the
Rendering
The rendering space. A supersampled region
Project t to If t’
conventionallyFor each supersampled region
If t’ screen tile T
If t’ crosses the border of t’ with
expressions barycentric matrix of
i(t) and Figure
size which is sufficient to host the supersampled projectionsat most nsupersampled regions. The algorithm bounding box level and edge sidedness is enforced during rasterization, primitives that map to a tile have a small footprint. The
blue particles are rasterizeda few large background triangles (yellow terrain) are rasterized as
Display
XAA GPC image is an intermediate representation from which the final image is computed. The screen pixels covered by the clfiltering the supersampled tiles. A straightforward approach is to use mipmapping. A more accurate approach is to actually convolve kernel, which remains efficient since the number of output pixels covered
kernels wioutput pixel is reconstructed as the samples, where cluster region.
Figure 13.
), and off
IEEE TRANSACTIONS ON
blue cluster and one for the redsupersampling fblue cluster and 1024x (i.e. 32x32) for the red
When the view changes or if the clusters are dynamic, the GPC is updated to track the clusters
Rendering
The rendering A rectangular tile
supersampled regionto t’
intersects the conventionally
For each supersampled region is completely inside Ti of crosses the border of with
expressions Ei(t)barycentric matrix of
and Figure 13
size which is sufficient to host the supersampled s of the cluster volumes. A triangle is rendered n+1 times, where
supersampled regions. The algorithm bounding box level and edge sidedness is enforced during rasterization, primitives that map to a tile have a small footprint. The
blue particles are rasterizeda few large background triangles (yellow terrain) are rasterized as clipped
XAA GPC image is an intermediate representation from which the final image is computed. The screen pixels covered by the clfiltering the supersampled tiles. A straightforward approach is to use mipmapping. A more accurate approach is to actually convolve kernel, which remains efficient since the number of output pixels covered
kernels wioutput pixel is reconstructed as the samples, where cluster region.
. Image rendered using GPC extreme antialiasing
), and off-screen framebuffer tiles used (
IEEE TRANSACTIONS ON
blue cluster and one for the redsupersampling factors are 256x (i.e. 16x16) for the greenblue cluster and 1024x (i.e. 32x32) for the red
When the view changes or if the clusters are GPC is updated to track the clusters
The rendering algorithm rectangular tile
supersampled region conventionally
intersects the conventionally
For each supersampled region is completely inside
of SSRcrosses the border of with SSR
(t) at the four corners of barycentric matrix of
and BM(t)13 (right)
size which is sufficient to host the supersampled of the cluster volumes. A triangle is rendered +1 times, where
supersampled regions. The algorithm bounding box level and edge sidedness is enforced during rasterization, primitives that map to a tile have a small footprint. The
blue particles are rasterizeda few large background triangles (yellow terrain) are
clipped
XAA GPC image is an intermediate representation from which the final image is computed. The screen pixels covered by the clfiltering the supersampled tiles. A straightforward approach is to use mipmapping. A more accurate approach is to actually convolve kernel, which remains efficient since the number of output pixels covered
kernels with 1 pixel support, which means that an output pixel is reconstructed as the samples, where k
Image rendered using GPC extreme antialiasing
screen framebuffer tiles used (
IEEE TRANSACTIONS ON
blue cluster and one for the redactors are 256x (i.e. 16x16) for the green
blue cluster and 1024x (i.e. 32x32) for the redWhen the view changes or if the clusters are
GPC is updated to track the clusters
algorithm rectangular tile
supersampled regionconventionally
intersects the
For each supersampled region is completely inside
SSRi and rasterize crosses the border of
SSRi to obtain at the four corners of
barycentric matrix of BM(t).
(right) size which is sufficient to host the supersampled
of the cluster volumes. A triangle is rendered +1 times, where
supersampled regions. The algorithm bounding box level and edge sidedness is enforced during rasterization, primitives that map to a tile have a small footprint. The
blue particles are rasterizeda few large background triangles (yellow terrain) are
clipped
XAA GPC image is an intermediate representation from which the final image is computed. The screen pixels covered by the clfiltering the supersampled tiles. A straightforward approach is to use mipmapping. A more accurate approach is to actually convolve kernel, which remains efficient since the number of output pixels covered
th 1 pixel support, which means that an output pixel is reconstructed as the
k is the supersampling factor for the
Image rendered using GPC extreme antialiasing
screen framebuffer tiles used (
IEEE TRANSACTIONS ON
blue cluster and one for the redactors are 256x (i.e. 16x16) for the green
blue cluster and 1024x (i.e. 32x32) for the redWhen the view changes or if the clusters are
GPC is updated to track the clusters
algorithm rectangular tile
supersampled region. A triangle conventionally
intersects the
For each supersampled region is completely inside
and rasterize crosses the border of
to obtain at the four corners of
barycentric matrix of t .
(right) size which is sufficient to host the supersampled
of the cluster volumes. A triangle is rendered +1 times, where
supersampled regions. The algorithm bounding box level and edge sidedness is enforced during rasterization, which is advantageous since most primitives that map to a tile have a small footprint. The
blue particles are rasterizeda few large background triangles (yellow terrain) are
clipped bounding
XAA GPC image is an intermediate representation from which the final image is computed. The screen pixels covered by the clfiltering the supersampled tiles. A straightforward approach is to use mipmapping. A more accurate approach is to actually convolve kernel, which remains efficient since the number of output pixels covered by the clusters is small.
th 1 pixel support, which means that an output pixel is reconstructed as the
is the supersampling factor for the
Image rendered using GPC extreme antialiasing
screen framebuffer tiles used (
IEEE TRANSACTIONS ON VISUALIZATION AND CO
blue cluster and one for the redactors are 256x (i.e. 16x16) for the green
blue cluster and 1024x (i.e. 32x32) for the redWhen the view changes or if the clusters are
GPC is updated to track the clusters
algorithm uses rectangular tile
A triangle conventionally
intersects the
For each supersampled region is completely inside
and rasterize crosses the border of
to obtain at the four corners of
t BM(t)
(right) both size which is sufficient to host the supersampled
of the cluster volumes. A triangle is rendered +1 times, where
supersampled regions. The algorithm bounding box level and edge sidedness is enforced
which is advantageous since most primitives that map to a tile have a small footprint. The
blue particles are rasterizeda few large background triangles (yellow terrain) are
bounding
XAA GPC image is an intermediate representation from which the final image is computed. The screen pixels covered by the clusters are reconstructed by filtering the supersampled tiles. A straightforward approach is to use mipmapping. A more accurate approach is to actually convolve kernel, which remains efficient since the number of
by the clusters is small. th 1 pixel support, which means that an
output pixel is reconstructed as the is the supersampling factor for the
Image rendered using GPC extreme antialiasing
screen framebuffer tiles used (
VISUALIZATION AND CO
blue cluster and one for the redactors are 256x (i.e. 16x16) for the green
blue cluster and 1024x (i.e. 32x32) for the redWhen the view changes or if the clusters are
GPC is updated to track the clusters
uses rectangular tile
A triangle conventionally
intersects the output image, rasterize
For each supersampled region is completely inside
and rasterize crosses the border of
to obtain bbat the four corners of
BM(t), and
both tiles are 600x720 pixels in size which is sufficient to host the supersampled
of the cluster volumes. A triangle is rendered +1 times, where
supersampled regions. The algorithm bounding box level and edge sidedness is enforced
which is advantageous since most primitives that map to a tile have a small footprint. The
blue particles are rasterizeda few large background triangles (yellow terrain) are
bounding-
XAA GPC image is an intermediate representation from which the final image is computed. The screen
usters are reconstructed by filtering the supersampled tiles. A straightforward approach is to use mipmapping. A more accurate approach is to actually convolve kernel, which remains efficient since the number of
by the clusters is small. th 1 pixel support, which means that an
output pixel is reconstructed as the is the supersampling factor for the
Image rendered using GPC extreme antialiasing
screen framebuffer tiles used (
VISUALIZATION AND CO
blue cluster and one for the redactors are 256x (i.e. 16x16) for the green
blue cluster and 1024x (i.e. 32x32) for the redWhen the view changes or if the clusters are
GPC is updated to track the clusters
uses offrectangular tile is assigned to each
A triangle t is rendered as follows:
output image, rasterize
For each supersampled region SSRis completely inside SSR
and rasterize t’crosses the border of SSR
bb, cat the four corners of
, and
tiles are 600x720 pixels in size which is sufficient to host the supersampled
of the cluster volumes. A triangle is rendered +1 times, where n
supersampled regions. The algorithm bounding box level and edge sidedness is enforced
which is advantageous since most primitives that map to a tile have a small footprint. The
blue particles are rasterized conventionally a few large background triangles (yellow terrain) are
-box quads.
XAA GPC image is an intermediate representation from which the final image is computed. The screen
usters are reconstructed by filtering the supersampled tiles. A straightforward approach is to use mipmapping. A more accurate approach is to actually convolve with a high resolution kernel, which remains efficient since the number of
by the clusters is small. th 1 pixel support, which means that an
output pixel is reconstructed as the is the supersampling factor for the
Image rendered using GPC extreme antialiasing
screen framebuffer tiles used (
VISUALIZATION AND CO
blue cluster and one for the red-actors are 256x (i.e. 16x16) for the green
blue cluster and 1024x (i.e. 32x32) for the redWhen the view changes or if the clusters are
GPC is updated to track the clusters
off-screen framebuffer is assigned to each
is rendered as follows:
output image, rasterize
SSRi intersected by SSRi, map
t’ in SSRi,, intersect bounding , compute rasterization
at the four corners of , and finally
tiles are 600x720 pixels in size which is sufficient to host the supersampled
of the cluster volumes. A triangle is rendered n is the number
supersampled regions. The algorithm bounding box level and edge sidedness is enforced
which is advantageous since most primitives that map to a tile have a small footprint. The
conventionally a few large background triangles (yellow terrain) are
box quads.
XAA GPC image is an intermediate representation from which the final image is computed. The screen
usters are reconstructed by filtering the supersampled tiles. A straightforward approach is to use mipmapping. A more accurate
with a high resolution kernel, which remains efficient since the number of
by the clusters is small. th 1 pixel support, which means that an
output pixel is reconstructed as the is the supersampling factor for the
Image rendered using GPC extreme antialiasing
screen framebuffer tiles used (
VISUALIZATION AND CO
-blue cluster. The actors are 256x (i.e. 16x16) for the green
blue cluster and 1024x (i.e. 32x32) for the redWhen the view changes or if the clusters are
GPC is updated to track the clusters
screen framebuffer is assigned to each
is rendered as follows:
output image, rasterize
intersected by , map
in Ti , intersect bounding
ompute rasterization at the four corners of bb
finally
tiles are 600x720 pixels in size which is sufficient to host the supersampled
of the cluster volumes. A triangle is rendered is the number
supersampled regions. The algorithm clips with a tile at bounding box level and edge sidedness is enforced
which is advantageous since most primitives that map to a tile have a small footprint. The
conventionally a few large background triangles (yellow terrain) are
box quads.
XAA GPC image is an intermediate representation from which the final image is computed. The screen
usters are reconstructed by filtering the supersampled tiles. A straightforward approach is to use mipmapping. A more accurate
with a high resolution kernel, which remains efficient since the number of
by the clusters is small. th 1 pixel support, which means that an
output pixel is reconstructed as the average is the supersampling factor for the
Image rendered using GPC extreme antialiasing
screen framebuffer tiles used (right
VISUALIZATION AND CO
blue cluster. The actors are 256x (i.e. 16x16) for the green
blue cluster and 1024x (i.e. 32x32) for the redWhen the view changes or if the clusters are
GPC is updated to track the clusters
screen framebuffer is assigned to each
is rendered as follows:
output image, rasterize
intersected by , map t’
, intersect bounding
ompute rasterization bb as well as the
finally
tiles are 600x720 pixels in size which is sufficient to host the supersampled
of the cluster volumes. A triangle is rendered is the number
clips with a tile at bounding box level and edge sidedness is enforced
which is advantageous since most primitives that map to a tile have a small footprint. The
conventionally a few large background triangles (yellow terrain) are
box quads.
XAA GPC image is an intermediate representation from which the final image is computed. The screen
usters are reconstructed by filtering the supersampled tiles. A straightforward approach is to use mipmapping. A more accurate
with a high resolution kernel, which remains efficient since the number of
by the clusters is small. th 1 pixel support, which means that an
average is the supersampling factor for the
Image rendered using GPC extreme antialiasing
right).
VISUALIZATION AND COMPUTER GRAPHICS
blue cluster. The actors are 256x (i.e. 16x16) for the green
blue cluster and 1024x (i.e. 32x32) for the redWhen the view changes or if the clusters are
GPC is updated to track the clusters
screen framebuffer is assigned to each
is rendered as follows:
output image, rasterize
intersected by t’ to the off
, intersect bounding ompute rasterization
as well as the finally rasterize
tiles are 600x720 pixels in size which is sufficient to host the supersampled
of the cluster volumes. A triangle is rendered is the number
clips with a tile at bounding box level and edge sidedness is enforced
which is advantageous since most primitives that map to a tile have a small footprint. The
conventionally and only a few large background triangles (yellow terrain) are
XAA GPC image is an intermediate representation from which the final image is computed. The screen
usters are reconstructed by filtering the supersampled tiles. A straightforward approach is to use mipmapping. A more accurate
with a high resolution kernel, which remains efficient since the number of
by the clusters is small. th 1 pixel support, which means that an
average of is the supersampling factor for the
Image rendered using GPC extreme antialiasing
MPUTER GRAPHICS
blue cluster. The actors are 256x (i.e. 16x16) for the green
blue cluster and 1024x (i.e. 32x32) for the redWhen the view changes or if the clusters are
GPC is updated to track the clusters.
screen framebuffer is assigned to each
is rendered as follows:
output image, rasterize
intersected by t’to the off
, intersect bounding ompute rasterization
as well as the rasterize
tiles are 600x720 pixels in size which is sufficient to host the supersampled
of the cluster volumes. A triangle is rendered is the number
clips with a tile at bounding box level and edge sidedness is enforced
which is advantageous since most primitives that map to a tile have a small footprint. The
and only a few large background triangles (yellow terrain) are
XAA GPC image is an intermediate representation from which the final image is computed. The screen
usters are reconstructed by filtering the supersampled tiles. A straightforward approach is to use mipmapping. A more accurate
with a high resolution kernel, which remains efficient since the number of
by the clusters is small. We use th 1 pixel support, which means that an
of k is the supersampling factor for the
Image rendered using GPC extreme antialiasing
MPUTER GRAPHICS
blue cluster. The actors are 256x (i.e. 16x16) for the green
blue cluster and 1024x (i.e. 32x32) for the red-blue When the view changes or if the clusters are
screen framebuffer is assigned to each
is rendered as follows:
output image, rasterize
t’ to the off
, intersect bounding ompute rasterization
as well as the rasterize bb
tiles are 600x720 pixels in size which is sufficient to host the supersampled
of the cluster volumes. A triangle is rendered is the number of
clips with a tile at bounding box level and edge sidedness is enforced
which is advantageous since most primitives that map to a tile have a small footprint. The
and only a few large background triangles (yellow terrain) are
XAA GPC image is an intermediate representation from which the final image is computed. The screen
usters are reconstructed by filtering the supersampled tiles. A straightforward approach is to use mipmapping. A more accurate
with a high resolution kernel, which remains efficient since the number of
We use th 1 pixel support, which means that an
color is the supersampling factor for the
Image rendered using GPC extreme antialiasing
MPUTER GRAPHICS
blue cluster. The actors are 256x (i.e. 16x16) for the green-
blue When the view changes or if the clusters are
screen framebuffer is assigned to each
is rendered as follows:
output image, rasterize
to the off-
, intersect bounding ompute rasterization
as well as the bb
tiles are 600x720 pixels in size which is sufficient to host the supersampled
of the cluster volumes. A triangle is rendered of
clips with a tile at bounding box level and edge sidedness is enforced
which is advantageous since most primitives that map to a tile have a small footprint. The
and only a few large background triangles (yellow terrain) are
XAA GPC image is an intermediate representation from which the final image is computed. The screen
usters are reconstructed by filtering the supersampled tiles. A straightforward approach is to use mipmapping. A more accurate
with a high resolution kernel, which remains efficient since the number of
We use th 1 pixel support, which means that an
color is the supersampling factor for the
Image rendered using GPC extreme antialiasing
MPUTER GRAPHICSMPUTER GRAPHICS
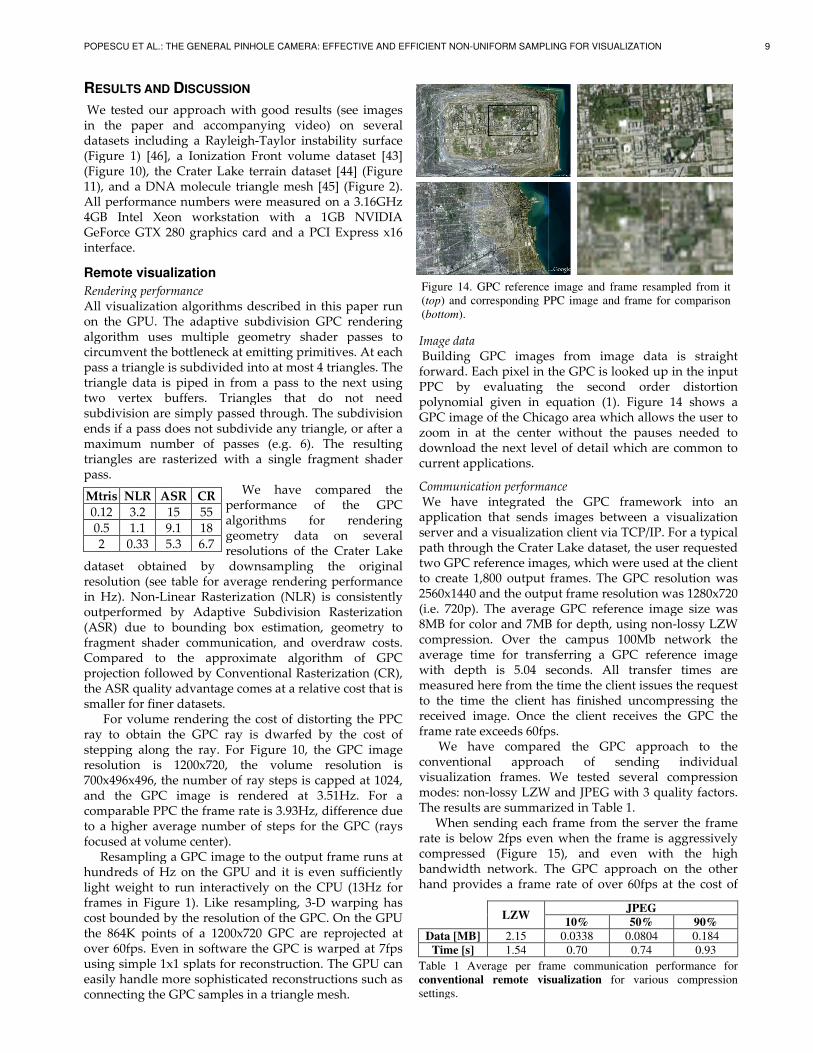
POPESCU ET AL.: THE
R
We tested in the paper and accompanying video) datasets(Figure (Figure 11All performance numbers wer4GB Intel Xeon workstation with a 1GB NVIDIA GeForce GTX 280 graphics card and a PCI Express x16 interface.
Remote visualization
Rendering performanceAll visualization algorithms described in this paper run on the GPU. algorithm uses multiple geometry shader passes to circumvent the bottleneck at emitting primitives. At each pass a triangle is subdivided into at most 4 triangles. The triangle data is piped in from a pass to the next using two vsubdivision are simply passed through. The subdivision ends if a pass does not subdivide any triangle, or after a maximum number of passes (e.g. 6). The resulting triangles are rasterized with a single fragment shapass.
dataset obtained by downsampling the original resolutionin Hzoutperformed by Adaptive Subdivision Rasterization (ASR) fragment shader communication, and overdraw Compared to the approximateprojection followed by Conventional Rasterization (CR)the smaller for finer datasets.
ray to obtain the GPC ray is dwarfed by the cost of stepping along the ray. For resolution is 1200x720, the volume resolution is 700x496x496, the number of ray steps is capped at 1024, and the GPC image is recomparable PPC the frame rate is 3.93Hz, difference due to a higher average number of steps for the GPC (rays focused at volume center).
hundreds of Hz on the GPU and it is even suflight weight to run interactively on the CPU (13Hz for frames in cost the 864K points of a 1200x720 GPC are reprojected at over 60fps. Even in software the GPC is warped at 7fps using simple 1x1 splats for reconstruction. The GPU can easily handle more sophisticated reconstructions such as connecting t
Mtris
0.12
POPESCU ET AL.: THE
RESULTS AND
We tested in the paper and accompanying video) datasetsFigure Figure
11), and All performance numbers wer4GB Intel Xeon workstation with a 1GB NVIDIA GeForce GTX 280 graphics card and a PCI Express x16 interface.
Remote visualization
Rendering performanceAll visualization algorithms described in this paper run on the GPU. algorithm uses multiple geometry shader passes to circumvent the bottleneck at emitting primitives. At each pass a triangle is subdivided into at most 4 triangles. The triangle data is piped in from a pass to the next using two vsubdivision are simply passed through. The subdivision ends if a pass does not subdivide any triangle, or after a maximum number of passes (e.g. 6). The resulting triangles are rasterized with a single fragment shapass.
dataset obtained by downsampling the original resolutionin Hzoutperformed by Adaptive Subdivision Rasterization (ASR) fragment shader communication, and overdraw Compared to the approximateprojection followed by Conventional Rasterization (CR)the ASR smaller for finer datasets.
For volume rendering the cost of distorting the PPC ray to obtain the GPC ray is dwarfed by the cost of stepping along the ray. For resolution is 1200x720, the volume resolution is 700x496x496, the number of ray steps is capped at 1024, and the GPC image is recomparable PPC the frame rate is 3.93Hz, difference due to a higher average number of steps for the GPC (rays focused at volume center).
Resampling a GPC image to the output frame runs at hundreds of Hz on the GPU and it is even suflight weight to run interactively on the CPU (13Hz for frames in cost bounded by the resolution the 864K points of a 1200x720 GPC are reprojected at over 60fps. Even in software the GPC is warped at 7fps using simple 1x1 splats for reconstruction. The GPU can easily handle more sophisticated reconstructions such as connecting t
Mtris
0.120.5 2
POPESCU ET AL.: THE
ESULTS AND
We tested in the paper and accompanying video) datasets Figure 1Figure 10
and All performance numbers wer4GB Intel Xeon workstation with a 1GB NVIDIA GeForce GTX 280 graphics card and a PCI Express x16 interface.
Remote visualization
Rendering performanceAll visualization algorithms described in this paper run on the GPU. algorithm uses multiple geometry shader passes to circumvent the bottleneck at emitting primitives. At each pass a triangle is subdivided into at most 4 triangles. The triangle data is piped in from a pass to the next using two vertex buffers. Triangles that do not need subdivision are simply passed through. The subdivision ends if a pass does not subdivide any triangle, or after a maximum number of passes (e.g. 6). The resulting triangles are rasterized with a single fragment sha
dataset obtained by downsampling the original resolutionin Hz). Nonoutperformed by Adaptive Subdivision Rasterization (ASR) due to fragment shader communication, and overdraw Compared to the approximateprojection followed by Conventional Rasterization (CR)
ASR smaller for finer datasets.
For volume rendering the cost of distorting the PPC ray to obtain the GPC ray is dwarfed by the cost of stepping along the ray. For resolution is 1200x720, the volume resolution is 700x496x496, the number of ray steps is capped at 1024, and the GPC image is recomparable PPC the frame rate is 3.93Hz, difference due to a higher average number of steps for the GPC (rays focused at volume center).
Resampling a GPC image to the output frame runs at hundreds of Hz on the GPU and it is even suflight weight to run interactively on the CPU (13Hz for frames in
bounded by the resolution the 864K points of a 1200x720 GPC are reprojected at over 60fps. Even in software the GPC is warped at 7fps using simple 1x1 splats for reconstruction. The GPU can easily handle more sophisticated reconstructions such as connecting t
Mtris NLR
0.12 3.2 1.1
0.33
POPESCU ET AL.: THE
ESULTS AND
We tested our approach in the paper and accompanying video)
including1) [46]10), the Crater Lake terrain dataset
and a DNA molecule triangle mesh All performance numbers wer4GB Intel Xeon workstation with a 1GB NVIDIA GeForce GTX 280 graphics card and a PCI Express x16 interface.
Remote visualization
Rendering performanceAll visualization algorithms described in this paper run on the GPU. algorithm uses multiple geometry shader passes to circumvent the bottleneck at emitting primitives. At each pass a triangle is subdivided into at most 4 triangles. The triangle data is piped in from a pass to the next using
ertex buffers. Triangles that do not need subdivision are simply passed through. The subdivision ends if a pass does not subdivide any triangle, or after a maximum number of passes (e.g. 6). The resulting triangles are rasterized with a single fragment sha
dataset obtained by downsampling the original resolution (see table for average rendering performance
. Nonoutperformed by Adaptive Subdivision Rasterization
due to fragment shader communication, and overdraw Compared to the approximateprojection followed by Conventional Rasterization (CR)
ASR quality advantage comes at a relative cost that is smaller for finer datasets.
For volume rendering the cost of distorting the PPC ray to obtain the GPC ray is dwarfed by the cost of stepping along the ray. For resolution is 1200x720, the volume resolution is 700x496x496, the number of ray steps is capped at 1024, and the GPC image is recomparable PPC the frame rate is 3.93Hz, difference due to a higher average number of steps for the GPC (rays focused at volume center).
Resampling a GPC image to the output frame runs at hundreds of Hz on the GPU and it is even suflight weight to run interactively on the CPU (13Hz for frames in Figure
bounded by the resolution the 864K points of a 1200x720 GPC are reprojected at over 60fps. Even in software the GPC is warped at 7fps using simple 1x1 splats for reconstruction. The GPU can easily handle more sophisticated reconstructions such as connecting t
NLR
3.2 1.1 0.33
POPESCU ET AL.: THE
ESULTS AND
our approach in the paper and accompanying video)
including[46], a
), the Crater Lake terrain dataset a DNA molecule triangle mesh
All performance numbers wer4GB Intel Xeon workstation with a 1GB NVIDIA GeForce GTX 280 graphics card and a PCI Express x16
Remote visualization
Rendering performanceAll visualization algorithms described in this paper run on the GPU. The adaptivealgorithm uses multiple geometry shader passes to circumvent the bottleneck at emitting primitives. At each pass a triangle is subdivided into at most 4 triangles. The triangle data is piped in from a pass to the next using
ertex buffers. Triangles that do not need subdivision are simply passed through. The subdivision ends if a pass does not subdivide any triangle, or after a maximum number of passes (e.g. 6). The resulting triangles are rasterized with a single fragment sha
dataset obtained by downsampling the original (see table for average rendering performance
. Non-Linear Rasterization outperformed by Adaptive Subdivision Rasterization
due to fragment shader communication, and overdraw Compared to the approximateprojection followed by Conventional Rasterization (CR)
quality advantage comes at a relative cost that is smaller for finer datasets.
For volume rendering the cost of distorting the PPC ray to obtain the GPC ray is dwarfed by the cost of stepping along the ray. For resolution is 1200x720, the volume resolution is 700x496x496, the number of ray steps is capped at 1024, and the GPC image is recomparable PPC the frame rate is 3.93Hz, difference due to a higher average number of steps for the GPC (rays focused at volume center).
Resampling a GPC image to the output frame runs at hundreds of Hz on the GPU and it is even suflight weight to run interactively on the CPU (13Hz for
Figure bounded by the resolution
the 864K points of a 1200x720 GPC are reprojected at over 60fps. Even in software the GPC is warped at 7fps using simple 1x1 splats for reconstruction. The GPU can easily handle more sophisticated reconstructions such as connecting the GPC samples in a triangle mesh.
NLR ASR
15 9.1 5.3
POPESCU ET AL.: THE GENERAL PINHOLE CAME
ESULTS AND DISCUSSION
our approach in the paper and accompanying video)
including, a
), the Crater Lake terrain dataset a DNA molecule triangle mesh
All performance numbers wer4GB Intel Xeon workstation with a 1GB NVIDIA GeForce GTX 280 graphics card and a PCI Express x16
Remote visualization
Rendering performanceAll visualization algorithms described in this paper run
The adaptivealgorithm uses multiple geometry shader passes to circumvent the bottleneck at emitting primitives. At each pass a triangle is subdivided into at most 4 triangles. The triangle data is piped in from a pass to the next using
ertex buffers. Triangles that do not need subdivision are simply passed through. The subdivision ends if a pass does not subdivide any triangle, or after a maximum number of passes (e.g. 6). The resulting triangles are rasterized with a single fragment sha
dataset obtained by downsampling the original (see table for average rendering performance
Linear Rasterization outperformed by Adaptive Subdivision Rasterization
due to bounding box estimation, geometry to fragment shader communication, and overdraw Compared to the approximateprojection followed by Conventional Rasterization (CR)
quality advantage comes at a relative cost that is smaller for finer datasets.
For volume rendering the cost of distorting the PPC ray to obtain the GPC ray is dwarfed by the cost of stepping along the ray. For resolution is 1200x720, the volume resolution is 700x496x496, the number of ray steps is capped at 1024, and the GPC image is recomparable PPC the frame rate is 3.93Hz, difference due to a higher average number of steps for the GPC (rays focused at volume center).
Resampling a GPC image to the output frame runs at hundreds of Hz on the GPU and it is even suflight weight to run interactively on the CPU (13Hz for
Figure 1bounded by the resolution
the 864K points of a 1200x720 GPC are reprojected at over 60fps. Even in software the GPC is warped at 7fps using simple 1x1 splats for reconstruction. The GPU can easily handle more sophisticated reconstructions such as
he GPC samples in a triangle mesh.
ASR
15 9.1 5.3
GENERAL PINHOLE CAME
ISCUSSION
our approach in the paper and accompanying video)
including a Rayleigh, a Ionization
), the Crater Lake terrain dataset a DNA molecule triangle mesh
All performance numbers wer4GB Intel Xeon workstation with a 1GB NVIDIA GeForce GTX 280 graphics card and a PCI Express x16
Remote visualization
Rendering performance All visualization algorithms described in this paper run
The adaptivealgorithm uses multiple geometry shader passes to circumvent the bottleneck at emitting primitives. At each pass a triangle is subdivided into at most 4 triangles. The triangle data is piped in from a pass to the next using
ertex buffers. Triangles that do not need subdivision are simply passed through. The subdivision ends if a pass does not subdivide any triangle, or after a maximum number of passes (e.g. 6). The resulting triangles are rasterized with a single fragment sha
dataset obtained by downsampling the original (see table for average rendering performance
Linear Rasterization outperformed by Adaptive Subdivision Rasterization
bounding box estimation, geometry to fragment shader communication, and overdraw Compared to the approximateprojection followed by Conventional Rasterization (CR)
quality advantage comes at a relative cost that is smaller for finer datasets.
For volume rendering the cost of distorting the PPC ray to obtain the GPC ray is dwarfed by the cost of stepping along the ray. For resolution is 1200x720, the volume resolution is 700x496x496, the number of ray steps is capped at 1024, and the GPC image is recomparable PPC the frame rate is 3.93Hz, difference due to a higher average number of steps for the GPC (rays focused at volume center).
Resampling a GPC image to the output frame runs at hundreds of Hz on the GPU and it is even suflight weight to run interactively on the CPU (13Hz for
1). Like resampling, 3bounded by the resolution
the 864K points of a 1200x720 GPC are reprojected at over 60fps. Even in software the GPC is warped at 7fps using simple 1x1 splats for reconstruction. The GPU can easily handle more sophisticated reconstructions such as
he GPC samples in a triangle mesh.
CR
55186.7
GENERAL PINHOLE CAME
ISCUSSION
our approach in the paper and accompanying video)
a Rayleighonization
), the Crater Lake terrain dataset a DNA molecule triangle mesh
All performance numbers wer4GB Intel Xeon workstation with a 1GB NVIDIA GeForce GTX 280 graphics card and a PCI Express x16
Remote visualization
All visualization algorithms described in this paper run
The adaptivealgorithm uses multiple geometry shader passes to circumvent the bottleneck at emitting primitives. At each pass a triangle is subdivided into at most 4 triangles. The triangle data is piped in from a pass to the next using
ertex buffers. Triangles that do not need subdivision are simply passed through. The subdivision ends if a pass does not subdivide any triangle, or after a maximum number of passes (e.g. 6). The resulting triangles are rasterized with a single fragment sha
performance of the GPC algorithms for rendering geometry data on several resolutions of the Crater Lake
dataset obtained by downsampling the original (see table for average rendering performance
Linear Rasterization outperformed by Adaptive Subdivision Rasterization
bounding box estimation, geometry to fragment shader communication, and overdraw Compared to the approximateprojection followed by Conventional Rasterization (CR)
quality advantage comes at a relative cost that is smaller for finer datasets.
For volume rendering the cost of distorting the PPC ray to obtain the GPC ray is dwarfed by the cost of stepping along the ray. For resolution is 1200x720, the volume resolution is 700x496x496, the number of ray steps is capped at 1024, and the GPC image is recomparable PPC the frame rate is 3.93Hz, difference due to a higher average number of steps for the GPC (rays focused at volume center).
Resampling a GPC image to the output frame runs at hundreds of Hz on the GPU and it is even suflight weight to run interactively on the CPU (13Hz for
Like resampling, 3bounded by the resolution
the 864K points of a 1200x720 GPC are reprojected at over 60fps. Even in software the GPC is warped at 7fps using simple 1x1 splats for reconstruction. The GPU can easily handle more sophisticated reconstructions such as
he GPC samples in a triangle mesh.
CR
55 18 6.7
GENERAL PINHOLE CAME
ISCUSSION
our approach with good results (see images in the paper and accompanying video)
a Rayleighonization
), the Crater Lake terrain dataset a DNA molecule triangle mesh
All performance numbers wer4GB Intel Xeon workstation with a 1GB NVIDIA GeForce GTX 280 graphics card and a PCI Express x16
All visualization algorithms described in this paper run The adaptive subdivision GPC rendering
algorithm uses multiple geometry shader passes to circumvent the bottleneck at emitting primitives. At each pass a triangle is subdivided into at most 4 triangles. The triangle data is piped in from a pass to the next using
ertex buffers. Triangles that do not need subdivision are simply passed through. The subdivision ends if a pass does not subdivide any triangle, or after a maximum number of passes (e.g. 6). The resulting triangles are rasterized with a single fragment sha
We performance of the GPC algorithms for rendering geometry data on several resolutions of the Crater Lake
dataset obtained by downsampling the original (see table for average rendering performance
Linear Rasterization outperformed by Adaptive Subdivision Rasterization
bounding box estimation, geometry to fragment shader communication, and overdraw Compared to the approximateprojection followed by Conventional Rasterization (CR)
quality advantage comes at a relative cost that is
For volume rendering the cost of distorting the PPC ray to obtain the GPC ray is dwarfed by the cost of stepping along the ray. For resolution is 1200x720, the volume resolution is 700x496x496, the number of ray steps is capped at 1024, and the GPC image is recomparable PPC the frame rate is 3.93Hz, difference due to a higher average number of steps for the GPC (rays focused at volume center).
Resampling a GPC image to the output frame runs at hundreds of Hz on the GPU and it is even suflight weight to run interactively on the CPU (13Hz for
Like resampling, 3bounded by the resolution
the 864K points of a 1200x720 GPC are reprojected at over 60fps. Even in software the GPC is warped at 7fps using simple 1x1 splats for reconstruction. The GPU can easily handle more sophisticated reconstructions such as
he GPC samples in a triangle mesh.
GENERAL PINHOLE CAME
ISCUSSION
with good results (see images in the paper and accompanying video)
a Rayleigh-Taylor instability surface onization Front volume dataset
), the Crater Lake terrain dataset a DNA molecule triangle mesh
All performance numbers were measured on a 3.16GHz 4GB Intel Xeon workstation with a 1GB NVIDIA GeForce GTX 280 graphics card and a PCI Express x16
All visualization algorithms described in this paper run subdivision GPC rendering
algorithm uses multiple geometry shader passes to circumvent the bottleneck at emitting primitives. At each pass a triangle is subdivided into at most 4 triangles. The triangle data is piped in from a pass to the next using
ertex buffers. Triangles that do not need subdivision are simply passed through. The subdivision ends if a pass does not subdivide any triangle, or after a maximum number of passes (e.g. 6). The resulting triangles are rasterized with a single fragment sha
We performance of the GPC algorithms for rendering geometry data on several resolutions of the Crater Lake
dataset obtained by downsampling the original (see table for average rendering performance
Linear Rasterization outperformed by Adaptive Subdivision Rasterization
bounding box estimation, geometry to fragment shader communication, and overdraw Compared to the approximateprojection followed by Conventional Rasterization (CR)
quality advantage comes at a relative cost that is
For volume rendering the cost of distorting the PPC ray to obtain the GPC ray is dwarfed by the cost of stepping along the ray. For Figure resolution is 1200x720, the volume resolution is 700x496x496, the number of ray steps is capped at 1024, and the GPC image is rendered at 3.51Hz. For a comparable PPC the frame rate is 3.93Hz, difference due to a higher average number of steps for the GPC (rays
Resampling a GPC image to the output frame runs at hundreds of Hz on the GPU and it is even suflight weight to run interactively on the CPU (13Hz for
Like resampling, 3bounded by the resolution of the GPC. On the GPU
the 864K points of a 1200x720 GPC are reprojected at over 60fps. Even in software the GPC is warped at 7fps using simple 1x1 splats for reconstruction. The GPU can easily handle more sophisticated reconstructions such as
he GPC samples in a triangle mesh.
GENERAL PINHOLE CAME
with good results (see images in the paper and accompanying video)
Taylor instability surface ront volume dataset
), the Crater Lake terrain dataset a DNA molecule triangle mesh
e measured on a 3.16GHz 4GB Intel Xeon workstation with a 1GB NVIDIA GeForce GTX 280 graphics card and a PCI Express x16
All visualization algorithms described in this paper run subdivision GPC rendering
algorithm uses multiple geometry shader passes to circumvent the bottleneck at emitting primitives. At each pass a triangle is subdivided into at most 4 triangles. The triangle data is piped in from a pass to the next using
ertex buffers. Triangles that do not need subdivision are simply passed through. The subdivision ends if a pass does not subdivide any triangle, or after a maximum number of passes (e.g. 6). The resulting triangles are rasterized with a single fragment sha
We have performance of the GPC algorithms for rendering geometry data on several resolutions of the Crater Lake
dataset obtained by downsampling the original (see table for average rendering performance
Linear Rasterization (NLR) outperformed by Adaptive Subdivision Rasterization
bounding box estimation, geometry to fragment shader communication, and overdraw Compared to the approximate projection followed by Conventional Rasterization (CR)
quality advantage comes at a relative cost that is
For volume rendering the cost of distorting the PPC ray to obtain the GPC ray is dwarfed by the cost of
Figure resolution is 1200x720, the volume resolution is 700x496x496, the number of ray steps is capped at 1024,
ndered at 3.51Hz. For a comparable PPC the frame rate is 3.93Hz, difference due to a higher average number of steps for the GPC (rays
Resampling a GPC image to the output frame runs at hundreds of Hz on the GPU and it is even suflight weight to run interactively on the CPU (13Hz for
Like resampling, 3of the GPC. On the GPU
the 864K points of a 1200x720 GPC are reprojected at over 60fps. Even in software the GPC is warped at 7fps using simple 1x1 splats for reconstruction. The GPU can easily handle more sophisticated reconstructions such as
he GPC samples in a triangle mesh.
GENERAL PINHOLE CAME
with good results (see images in the paper and accompanying video)
Taylor instability surface ront volume dataset
), the Crater Lake terrain dataset a DNA molecule triangle mesh
e measured on a 3.16GHz 4GB Intel Xeon workstation with a 1GB NVIDIA GeForce GTX 280 graphics card and a PCI Express x16
All visualization algorithms described in this paper run subdivision GPC rendering
algorithm uses multiple geometry shader passes to circumvent the bottleneck at emitting primitives. At each pass a triangle is subdivided into at most 4 triangles. The triangle data is piped in from a pass to the next using
ertex buffers. Triangles that do not need subdivision are simply passed through. The subdivision ends if a pass does not subdivide any triangle, or after a maximum number of passes (e.g. 6). The resulting triangles are rasterized with a single fragment sha
have performance of the GPC algorithms for rendering geometry data on several resolutions of the Crater Lake
dataset obtained by downsampling the original (see table for average rendering performance
(NLR) outperformed by Adaptive Subdivision Rasterization
bounding box estimation, geometry to fragment shader communication, and overdraw
algorithm of projection followed by Conventional Rasterization (CR)
quality advantage comes at a relative cost that is
For volume rendering the cost of distorting the PPC ray to obtain the GPC ray is dwarfed by the cost of
Figure 10resolution is 1200x720, the volume resolution is 700x496x496, the number of ray steps is capped at 1024,
ndered at 3.51Hz. For a comparable PPC the frame rate is 3.93Hz, difference due to a higher average number of steps for the GPC (rays
Resampling a GPC image to the output frame runs at hundreds of Hz on the GPU and it is even suflight weight to run interactively on the CPU (13Hz for
Like resampling, 3of the GPC. On the GPU
the 864K points of a 1200x720 GPC are reprojected at over 60fps. Even in software the GPC is warped at 7fps using simple 1x1 splats for reconstruction. The GPU can easily handle more sophisticated reconstructions such as
he GPC samples in a triangle mesh.
GENERAL PINHOLE CAMERA: EFFECTIVE AND EF
with good results (see images in the paper and accompanying video)
Taylor instability surface ront volume dataset
), the Crater Lake terrain dataset a DNA molecule triangle mesh [45]
e measured on a 3.16GHz 4GB Intel Xeon workstation with a 1GB NVIDIA GeForce GTX 280 graphics card and a PCI Express x16
All visualization algorithms described in this paper run subdivision GPC rendering
algorithm uses multiple geometry shader passes to circumvent the bottleneck at emitting primitives. At each pass a triangle is subdivided into at most 4 triangles. The triangle data is piped in from a pass to the next using
ertex buffers. Triangles that do not need subdivision are simply passed through. The subdivision ends if a pass does not subdivide any triangle, or after a maximum number of passes (e.g. 6). The resulting triangles are rasterized with a single fragment sha
have compared the performance of the GPC algorithms for rendering geometry data on several resolutions of the Crater Lake
dataset obtained by downsampling the original (see table for average rendering performance
(NLR) outperformed by Adaptive Subdivision Rasterization
bounding box estimation, geometry to fragment shader communication, and overdraw
algorithm of projection followed by Conventional Rasterization (CR)
quality advantage comes at a relative cost that is
For volume rendering the cost of distorting the PPC ray to obtain the GPC ray is dwarfed by the cost of
10, the GPC image resolution is 1200x720, the volume resolution is 700x496x496, the number of ray steps is capped at 1024,
ndered at 3.51Hz. For a comparable PPC the frame rate is 3.93Hz, difference due to a higher average number of steps for the GPC (rays
Resampling a GPC image to the output frame runs at hundreds of Hz on the GPU and it is even suflight weight to run interactively on the CPU (13Hz for
Like resampling, 3-D warping has of the GPC. On the GPU
the 864K points of a 1200x720 GPC are reprojected at over 60fps. Even in software the GPC is warped at 7fps using simple 1x1 splats for reconstruction. The GPU can easily handle more sophisticated reconstructions such as
he GPC samples in a triangle mesh.
RA: EFFECTIVE AND EF
with good results (see images in the paper and accompanying video) on several
Taylor instability surface ront volume dataset
), the Crater Lake terrain dataset [44][45]
e measured on a 3.16GHz 4GB Intel Xeon workstation with a 1GB NVIDIA GeForce GTX 280 graphics card and a PCI Express x16
All visualization algorithms described in this paper run subdivision GPC rendering
algorithm uses multiple geometry shader passes to circumvent the bottleneck at emitting primitives. At each pass a triangle is subdivided into at most 4 triangles. The triangle data is piped in from a pass to the next using
ertex buffers. Triangles that do not need subdivision are simply passed through. The subdivision ends if a pass does not subdivide any triangle, or after a maximum number of passes (e.g. 6). The resulting triangles are rasterized with a single fragment sha
compared the performance of the GPC algorithms for rendering geometry data on several resolutions of the Crater Lake
dataset obtained by downsampling the original (see table for average rendering performance
(NLR) is consistently outperformed by Adaptive Subdivision Rasterization
bounding box estimation, geometry to fragment shader communication, and overdraw
algorithm of projection followed by Conventional Rasterization (CR)
quality advantage comes at a relative cost that is
For volume rendering the cost of distorting the PPC ray to obtain the GPC ray is dwarfed by the cost of
, the GPC image resolution is 1200x720, the volume resolution is 700x496x496, the number of ray steps is capped at 1024,
ndered at 3.51Hz. For a comparable PPC the frame rate is 3.93Hz, difference due to a higher average number of steps for the GPC (rays
Resampling a GPC image to the output frame runs at hundreds of Hz on the GPU and it is even suflight weight to run interactively on the CPU (13Hz for
D warping has of the GPC. On the GPU
the 864K points of a 1200x720 GPC are reprojected at over 60fps. Even in software the GPC is warped at 7fps using simple 1x1 splats for reconstruction. The GPU can easily handle more sophisticated reconstructions such as
he GPC samples in a triangle mesh.
RA: EFFECTIVE AND EF
with good results (see images on several
Taylor instability surface ront volume dataset
[44] (Figure
e measured on a 3.16GHz 4GB Intel Xeon workstation with a 1GB NVIDIA GeForce GTX 280 graphics card and a PCI Express x16
All visualization algorithms described in this paper run subdivision GPC rendering
algorithm uses multiple geometry shader passes to circumvent the bottleneck at emitting primitives. At each pass a triangle is subdivided into at most 4 triangles. The triangle data is piped in from a pass to the next using
ertex buffers. Triangles that do not need subdivision are simply passed through. The subdivision ends if a pass does not subdivide any triangle, or after a maximum number of passes (e.g. 6). The resulting triangles are rasterized with a single fragment sha
compared the performance of the GPC algorithms for rendering geometry data on several resolutions of the Crater Lake
dataset obtained by downsampling the original (see table for average rendering performance
is consistently outperformed by Adaptive Subdivision Rasterization
bounding box estimation, geometry to fragment shader communication, and overdraw
algorithm of projection followed by Conventional Rasterization (CR)
quality advantage comes at a relative cost that is
For volume rendering the cost of distorting the PPC ray to obtain the GPC ray is dwarfed by the cost of
, the GPC image resolution is 1200x720, the volume resolution is 700x496x496, the number of ray steps is capped at 1024,
ndered at 3.51Hz. For a comparable PPC the frame rate is 3.93Hz, difference due to a higher average number of steps for the GPC (rays
Resampling a GPC image to the output frame runs at hundreds of Hz on the GPU and it is even sufficiently light weight to run interactively on the CPU (13Hz for
D warping has of the GPC. On the GPU
the 864K points of a 1200x720 GPC are reprojected at over 60fps. Even in software the GPC is warped at 7fps using simple 1x1 splats for reconstruction. The GPU can easily handle more sophisticated reconstructions such as
he GPC samples in a triangle mesh.
RA: EFFECTIVE AND EF
with good results (see images on several
Taylor instability surface ront volume dataset
(Figure Figure
e measured on a 3.16GHz 4GB Intel Xeon workstation with a 1GB NVIDIA GeForce GTX 280 graphics card and a PCI Express x16
All visualization algorithms described in this paper run subdivision GPC rendering
algorithm uses multiple geometry shader passes to circumvent the bottleneck at emitting primitives. At each pass a triangle is subdivided into at most 4 triangles. The triangle data is piped in from a pass to the next using
ertex buffers. Triangles that do not need subdivision are simply passed through. The subdivision ends if a pass does not subdivide any triangle, or after a maximum number of passes (e.g. 6). The resulting triangles are rasterized with a single fragment sha
compared the performance of the GPC algorithms for rendering geometry data on several resolutions of the Crater Lake
dataset obtained by downsampling the original (see table for average rendering performance
is consistently outperformed by Adaptive Subdivision Rasterization
bounding box estimation, geometry to fragment shader communication, and overdraw costs.
algorithm of GPC projection followed by Conventional Rasterization (CR)
quality advantage comes at a relative cost that is
For volume rendering the cost of distorting the PPC ray to obtain the GPC ray is dwarfed by the cost of
, the GPC image resolution is 1200x720, the volume resolution is 700x496x496, the number of ray steps is capped at 1024,
ndered at 3.51Hz. For a comparable PPC the frame rate is 3.93Hz, difference due to a higher average number of steps for the GPC (rays
Resampling a GPC image to the output frame runs at ficiently
light weight to run interactively on the CPU (13Hz for D warping has
of the GPC. On the GPU the 864K points of a 1200x720 GPC are reprojected at over 60fps. Even in software the GPC is warped at 7fps using simple 1x1 splats for reconstruction. The GPU can easily handle more sophisticated reconstructions such as
RA: EFFECTIVE AND EF
with good results (see images on several
Taylor instability surface ront volume dataset [43]
Figure Figure 2)
e measured on a 3.16GHz 4GB Intel Xeon workstation with a 1GB NVIDIA GeForce GTX 280 graphics card and a PCI Express x16
All visualization algorithms described in this paper run subdivision GPC rendering
algorithm uses multiple geometry shader passes to circumvent the bottleneck at emitting primitives. At each pass a triangle is subdivided into at most 4 triangles. The triangle data is piped in from a pass to the next using
ertex buffers. Triangles that do not need subdivision are simply passed through. The subdivision ends if a pass does not subdivide any triangle, or after a maximum number of passes (e.g. 6). The resulting triangles are rasterized with a single fragment shader
compared the performance of the GPC algorithms for rendering geometry data on several resolutions of the Crater Lake
dataset obtained by downsampling the original (see table for average rendering performance
is consistently outperformed by Adaptive Subdivision Rasterization
bounding box estimation, geometry to costs. GPC
projection followed by Conventional Rasterization (CR)quality advantage comes at a relative cost that is
For volume rendering the cost of distorting the PPC ray to obtain the GPC ray is dwarfed by the cost of
, the GPC image resolution is 1200x720, the volume resolution is 700x496x496, the number of ray steps is capped at 1024,
ndered at 3.51Hz. For a comparable PPC the frame rate is 3.93Hz, difference due to a higher average number of steps for the GPC (rays
Resampling a GPC image to the output frame runs at ficiently
light weight to run interactively on the CPU (13Hz for D warping has
of the GPC. On the GPU the 864K points of a 1200x720 GPC are reprojected at over 60fps. Even in software the GPC is warped at 7fps using simple 1x1 splats for reconstruction. The GPU can easily handle more sophisticated reconstructions such as
RA: EFFECTIVE AND EFFICIENT NON
with good results (see images on several
Taylor instability surface [43]
Figure ).
e measured on a 3.16GHz 4GB Intel Xeon workstation with a 1GB NVIDIA GeForce GTX 280 graphics card and a PCI Express x16
All visualization algorithms described in this paper run subdivision GPC rendering
algorithm uses multiple geometry shader passes to circumvent the bottleneck at emitting primitives. At each pass a triangle is subdivided into at most 4 triangles. The triangle data is piped in from a pass to the next using
ertex buffers. Triangles that do not need subdivision are simply passed through. The subdivision ends if a pass does not subdivide any triangle, or after a maximum number of passes (e.g. 6). The resulting
der
compared the performance of the GPC algorithms for rendering geometry data on several resolutions of the Crater Lake
dataset obtained by downsampling the original (see table for average rendering performance
is consistently outperformed by Adaptive Subdivision Rasterization
bounding box estimation, geometry to costs. GPC
projection followed by Conventional Rasterization (CR), quality advantage comes at a relative cost that is
For volume rendering the cost of distorting the PPC ray to obtain the GPC ray is dwarfed by the cost of
, the GPC image resolution is 1200x720, the volume resolution is 700x496x496, the number of ray steps is capped at 1024,
ndered at 3.51Hz. For a comparable PPC the frame rate is 3.93Hz, difference due to a higher average number of steps for the GPC (rays
Resampling a GPC image to the output frame runs at ficiently
light weight to run interactively on the CPU (13Hz for D warping has
of the GPC. On the GPU the 864K points of a 1200x720 GPC are reprojected at over 60fps. Even in software the GPC is warped at 7fps using simple 1x1 splats for reconstruction. The GPU can easily handle more sophisticated reconstructions such as
FICIENT NON
Image data Building GPC images from image data is straight forward. Each pixel in the GPC is looked up in the input PPC by evaluating the second order distortion polynomial given in equation (1). GPC image of the Chicago area which allows the user to zoom in at the center without the pauses needed to download the next level of detail which are common current applications.
Communication performance We have integrated the GPC framework into an application that sends images between a visualization server and a visualization client via TCP/IP. path through the Crater Lake dataset, the user requested two GPC reference images, which were used at the client to create 1,800 output frames. The GPC resolution was 2560x1440 and the output frame resolution was 1280x720 (i.e. 720p). The ave8MB for color and 7MB for depth, compression. Over the campus 100Mb network the average time for transferring a GPC reference image with depth is 5.04 seconds. All transfer times are measured here from to the time the client has finished uncompressing the received image.frame rate exceeds 60fps.
conventional approach of sending individual visualization frames. We tested several compression modes: nonThe results are summarized in
rate is below 2fps even when the frame is aggressively compressedbandwidth network. hand provides a frame rate of over 60fps at the cost
Figure
(top
(bottom
Data [MB]
Time [s]
Table
conventional remote visualization
settings.
FICIENT NON
Image dataBuilding GPC images from image data is straight
forward. Each pixel in the GPC is looked up in the input PPC by evaluating the second order distortion polynomial given in equation (1). GPC image of the Chicago area which allows the user to zoom in at the center without the pauses needed to download the next level of detail which are common current applications.
Communication performanceWe have integrated the GPC framework into an
application that sends images between a visualization server and a visualization client via TCP/IP. path through the Crater Lake dataset, the user requested two GPC reference images, which were used at the client to create 1,800 output frames. The GPC resolution was 2560x1440 and the output frame resolution was 1280x720 (i.e. 720p). The ave8MB for color and 7MB for depth, compression. Over the campus 100Mb network the average time for transferring a GPC reference image with depth is 5.04 seconds. All transfer times are measured here from to the time the client has finished uncompressing the received image.frame rate exceeds 60fps.
We have compared the GPC approach to the conventional approach of sending individual visualization frames. We tested several compression modes: nonThe results are summarized in
When sending each frame from the server the frame rate is below 2fps even when the frame is aggressively compressedbandwidth network. hand provides a frame rate of over 60fps at the cost
Figure
top) and corresponding PPC image and frame for comparison
bottom
Data [MB]
Time [s]
Table 1
conventional remote visualization
settings.
FICIENT NON-
Image dataBuilding GPC images from image data is straight
forward. Each pixel in the GPC is looked up in the input PPC by evaluating the second order distortion polynomial given in equation (1). GPC image of the Chicago area which allows the user to zoom in at the center without the pauses needed to download the next level of detail which are common current applications.
Communication performanceWe have integrated the GPC framework into an
application that sends images between a visualization server and a visualization client via TCP/IP. path through the Crater Lake dataset, the user requested two GPC reference images, which were used at the client to create 1,800 output frames. The GPC resolution was 2560x1440 and the output frame resolution was 1280x720 (i.e. 720p). The ave8MB for color and 7MB for depth, compression. Over the campus 100Mb network the average time for transferring a GPC reference image with depth is 5.04 seconds. All transfer times are measured here from to the time the client has finished uncompressing the received image.frame rate exceeds 60fps.
We have compared the GPC approach to the conventional approach of sending individual visualization frames. We tested several compression modes: nonThe results are summarized in
When sending each frame from the server the frame rate is below 2fps even when the frame is aggressively compressedbandwidth network. hand provides a frame rate of over 60fps at the cost
Figure 14. GPC reference
) and corresponding PPC image and frame for comparison
bottom).
Data [MB]
Time [s]
1 Average per frame communication performance for
conventional remote visualization
settings.
-UNIFORM SAMPLING FOR
Image data Building GPC images from image data is straight forward. Each pixel in the GPC is looked up in the input PPC by evaluating the second order distortion polynomial given in equation (1). GPC image of the Chicago area which allows the user to zoom in at the center without the pauses needed to download the next level of detail which are common current applications.
Communication performanceWe have integrated the GPC framework into an application that sends images between a visualization server and a visualization client via TCP/IP. path through the Crater Lake dataset, the user requested two GPC reference images, which were used at the client to create 1,800 output frames. The GPC resolution was 2560x1440 and the output frame resolution was 1280x720 (i.e. 720p). The ave8MB for color and 7MB for depth, compression. Over the campus 100Mb network the average time for transferring a GPC reference image with depth is 5.04 seconds. All transfer times are measured here from to the time the client has finished uncompressing the received image.frame rate exceeds 60fps.
We have compared the GPC approach to the conventional approach of sending individual visualization frames. We tested several compression modes: non-lossy LZW and JPEG with 3 quality factors. The results are summarized in
When sending each frame from the server the frame rate is below 2fps even when the frame is aggressively compressed bandwidth network. hand provides a frame rate of over 60fps at the cost
. GPC reference
) and corresponding PPC image and frame for comparison
Data [MB]
Time [s]
Average per frame communication performance for
conventional remote visualization
UNIFORM SAMPLING FOR
Building GPC images from image data is straight forward. Each pixel in the GPC is looked up in the input PPC by evaluating the second order distortion polynomial given in equation (1). GPC image of the Chicago area which allows the user to zoom in at the center without the pauses needed to download the next level of detail which are common current applications.
Communication performanceWe have integrated the GPC framework into an
application that sends images between a visualization server and a visualization client via TCP/IP. path through the Crater Lake dataset, the user requested two GPC reference images, which were used at the client to create 1,800 output frames. The GPC resolution was 2560x1440 and the output frame resolution was 1280x720 (i.e. 720p). The ave8MB for color and 7MB for depth, compression. Over the campus 100Mb network the average time for transferring a GPC reference image with depth is 5.04 seconds. All transfer times are measured here from to the time the client has finished uncompressing the received image. frame rate exceeds 60fps.
We have compared the GPC approach to the conventional approach of sending individual visualization frames. We tested several compression
lossy LZW and JPEG with 3 quality factors. The results are summarized in
When sending each frame from the server the frame rate is below 2fps even when the frame is aggressively
(Figure bandwidth network. hand provides a frame rate of over 60fps at the cost
. GPC reference
) and corresponding PPC image and frame for comparison
LZW
2.15
1.54
Average per frame communication performance for
conventional remote visualization
UNIFORM SAMPLING FOR
Building GPC images from image data is straight forward. Each pixel in the GPC is looked up in the input PPC by evaluating the second order distortion polynomial given in equation (1). GPC image of the Chicago area which allows the user to zoom in at the center without the pauses needed to download the next level of detail which are common current applications.
Communication performanceWe have integrated the GPC framework into an
application that sends images between a visualization server and a visualization client via TCP/IP. path through the Crater Lake dataset, the user requested two GPC reference images, which were used at the client to create 1,800 output frames. The GPC resolution was 2560x1440 and the output frame resolution was 1280x720 (i.e. 720p). The ave8MB for color and 7MB for depth, compression. Over the campus 100Mb network the average time for transferring a GPC reference image with depth is 5.04 seconds. All transfer times are measured here from to the time the client has finished uncompressing the
Once the client receives the GPC the frame rate exceeds 60fps.
We have compared the GPC approach to the conventional approach of sending individual visualization frames. We tested several compression
lossy LZW and JPEG with 3 quality factors. The results are summarized in
When sending each frame from the server the frame rate is below 2fps even when the frame is aggressively
Figure bandwidth network. hand provides a frame rate of over 60fps at the cost
. GPC reference
) and corresponding PPC image and frame for comparison
LZW
2.15
1.54
Average per frame communication performance for
conventional remote visualization
UNIFORM SAMPLING FOR
Building GPC images from image data is straight forward. Each pixel in the GPC is looked up in the input PPC by evaluating the second order distortion polynomial given in equation (1). GPC image of the Chicago area which allows the user to zoom in at the center without the pauses needed to download the next level of detail which are common current applications.
Communication performanceWe have integrated the GPC framework into an
application that sends images between a visualization server and a visualization client via TCP/IP. path through the Crater Lake dataset, the user requested two GPC reference images, which were used at the client to create 1,800 output frames. The GPC resolution was 2560x1440 and the output frame resolution was 1280x720 (i.e. 720p). The average GPC reference image size was 8MB for color and 7MB for depth, compression. Over the campus 100Mb network the average time for transferring a GPC reference image with depth is 5.04 seconds. All transfer times are measured here from the time the client issues the request to the time the client has finished uncompressing the
Once the client receives the GPC the frame rate exceeds 60fps.
We have compared the GPC approach to the conventional approach of sending individual visualization frames. We tested several compression
lossy LZW and JPEG with 3 quality factors. The results are summarized in
When sending each frame from the server the frame rate is below 2fps even when the frame is aggressively
Figure 15bandwidth network. The GPC approach on the other hand provides a frame rate of over 60fps at the cost
. GPC reference
) and corresponding PPC image and frame for comparison
LZW
Average per frame communication performance for
conventional remote visualization
UNIFORM SAMPLING FOR
Building GPC images from image data is straight forward. Each pixel in the GPC is looked up in the input PPC by evaluating the second order distortion polynomial given in equation (1). GPC image of the Chicago area which allows the user to zoom in at the center without the pauses needed to download the next level of detail which are common
Communication performance We have integrated the GPC framework into an
application that sends images between a visualization server and a visualization client via TCP/IP. path through the Crater Lake dataset, the user requested two GPC reference images, which were used at the client to create 1,800 output frames. The GPC resolution was 2560x1440 and the output frame resolution was 1280x720
rage GPC reference image size was 8MB for color and 7MB for depth, compression. Over the campus 100Mb network the average time for transferring a GPC reference image with depth is 5.04 seconds. All transfer times are
the time the client issues the request to the time the client has finished uncompressing the
Once the client receives the GPC the frame rate exceeds 60fps.
We have compared the GPC approach to the conventional approach of sending individual visualization frames. We tested several compression
lossy LZW and JPEG with 3 quality factors. The results are summarized in
When sending each frame from the server the frame rate is below 2fps even when the frame is aggressively
15), The GPC approach on the other
hand provides a frame rate of over 60fps at the cost
. GPC reference image and frame resampled from it
) and corresponding PPC image and frame for comparison
10%
0.0338
0.70
Average per frame communication performance for
conventional remote visualization
UNIFORM SAMPLING FOR
Building GPC images from image data is straight forward. Each pixel in the GPC is looked up in the input PPC by evaluating the second order distortion polynomial given in equation (1). GPC image of the Chicago area which allows the user to zoom in at the center without the pauses needed to download the next level of detail which are common
We have integrated the GPC framework into an application that sends images between a visualization server and a visualization client via TCP/IP. path through the Crater Lake dataset, the user requested two GPC reference images, which were used at the client to create 1,800 output frames. The GPC resolution was 2560x1440 and the output frame resolution was 1280x720
rage GPC reference image size was 8MB for color and 7MB for depth, compression. Over the campus 100Mb network the average time for transferring a GPC reference image with depth is 5.04 seconds. All transfer times are
the time the client issues the request to the time the client has finished uncompressing the
Once the client receives the GPC the
We have compared the GPC approach to the conventional approach of sending individual visualization frames. We tested several compression
lossy LZW and JPEG with 3 quality factors. The results are summarized in
When sending each frame from the server the frame rate is below 2fps even when the frame is aggressively
), and even wThe GPC approach on the other
hand provides a frame rate of over 60fps at the cost
image and frame resampled from it
) and corresponding PPC image and frame for comparison
10%
0.0338
0.70
Average per frame communication performance for
conventional remote visualization
UNIFORM SAMPLING FOR VISUALIZATION
Building GPC images from image data is straight forward. Each pixel in the GPC is looked up in the input PPC by evaluating the second order distortion polynomial given in equation (1). GPC image of the Chicago area which allows the user to zoom in at the center without the pauses needed to download the next level of detail which are common
We have integrated the GPC framework into an application that sends images between a visualization server and a visualization client via TCP/IP. path through the Crater Lake dataset, the user requested two GPC reference images, which were used at the client to create 1,800 output frames. The GPC resolution was 2560x1440 and the output frame resolution was 1280x720
rage GPC reference image size was 8MB for color and 7MB for depth, compression. Over the campus 100Mb network the average time for transferring a GPC reference image with depth is 5.04 seconds. All transfer times are
the time the client issues the request to the time the client has finished uncompressing the
Once the client receives the GPC the
We have compared the GPC approach to the conventional approach of sending individual visualization frames. We tested several compression
lossy LZW and JPEG with 3 quality factors. The results are summarized in Table
When sending each frame from the server the frame rate is below 2fps even when the frame is aggressively
and even wThe GPC approach on the other
hand provides a frame rate of over 60fps at the cost
image and frame resampled from it
) and corresponding PPC image and frame for comparison
10%
0.0338
0.70
Average per frame communication performance for
conventional remote visualization
VISUALIZATION
Building GPC images from image data is straight forward. Each pixel in the GPC is looked up in the input PPC by evaluating the second order distortion polynomial given in equation (1). GPC image of the Chicago area which allows the user to zoom in at the center without the pauses needed to download the next level of detail which are common
We have integrated the GPC framework into an application that sends images between a visualization server and a visualization client via TCP/IP. path through the Crater Lake dataset, the user requested two GPC reference images, which were used at the client to create 1,800 output frames. The GPC resolution was 2560x1440 and the output frame resolution was 1280x720
rage GPC reference image size was 8MB for color and 7MB for depth, usingcompression. Over the campus 100Mb network the average time for transferring a GPC reference image with depth is 5.04 seconds. All transfer times are
the time the client issues the request to the time the client has finished uncompressing the
Once the client receives the GPC the
We have compared the GPC approach to the conventional approach of sending individual visualization frames. We tested several compression
lossy LZW and JPEG with 3 quality factors. Table
When sending each frame from the server the frame rate is below 2fps even when the frame is aggressively
and even wThe GPC approach on the other
hand provides a frame rate of over 60fps at the cost
image and frame resampled from it
) and corresponding PPC image and frame for comparison
Average per frame communication performance for
for various compression
VISUALIZATION
Building GPC images from image data is straight forward. Each pixel in the GPC is looked up in the input PPC by evaluating the second order distortion polynomial given in equation (1). Figure GPC image of the Chicago area which allows the user to zoom in at the center without the pauses needed to download the next level of detail which are common
We have integrated the GPC framework into an application that sends images between a visualization server and a visualization client via TCP/IP. path through the Crater Lake dataset, the user requested two GPC reference images, which were used at the client to create 1,800 output frames. The GPC resolution was 2560x1440 and the output frame resolution was 1280x720
rage GPC reference image size was using
compression. Over the campus 100Mb network the average time for transferring a GPC reference image with depth is 5.04 seconds. All transfer times are
the time the client issues the request to the time the client has finished uncompressing the
Once the client receives the GPC the
We have compared the GPC approach to the conventional approach of sending individual visualization frames. We tested several compression
lossy LZW and JPEG with 3 quality factors. Table 1.
When sending each frame from the server the frame rate is below 2fps even when the frame is aggressively
and even wThe GPC approach on the other
hand provides a frame rate of over 60fps at the cost
image and frame resampled from it
) and corresponding PPC image and frame for comparison
JPEG
50%
0.0804
0.74
Average per frame communication performance for
for various compression
VISUALIZATION
Building GPC images from image data is straight forward. Each pixel in the GPC is looked up in the input PPC by evaluating the second order distortion
Figure GPC image of the Chicago area which allows the user to zoom in at the center without the pauses needed to download the next level of detail which are common
We have integrated the GPC framework into an application that sends images between a visualization server and a visualization client via TCP/IP. path through the Crater Lake dataset, the user requested two GPC reference images, which were used at the client to create 1,800 output frames. The GPC resolution was 2560x1440 and the output frame resolution was 1280x720
rage GPC reference image size was using non
compression. Over the campus 100Mb network the average time for transferring a GPC reference image with depth is 5.04 seconds. All transfer times are
the time the client issues the request to the time the client has finished uncompressing the
Once the client receives the GPC the
We have compared the GPC approach to the conventional approach of sending individual visualization frames. We tested several compression
lossy LZW and JPEG with 3 quality factors.
When sending each frame from the server the frame rate is below 2fps even when the frame is aggressively
and even with the high The GPC approach on the other
hand provides a frame rate of over 60fps at the cost
image and frame resampled from it
) and corresponding PPC image and frame for comparison
JPEG
50%
0.0804
0.74
Average per frame communication performance for
for various compression
Building GPC images from image data is straight forward. Each pixel in the GPC is looked up in the input PPC by evaluating the second order distortion
Figure 14GPC image of the Chicago area which allows the user to zoom in at the center without the pauses needed to download the next level of detail which are common
We have integrated the GPC framework into an application that sends images between a visualization server and a visualization client via TCP/IP. For a typical path through the Crater Lake dataset, the user requested two GPC reference images, which were used at the client to create 1,800 output frames. The GPC resolution was 2560x1440 and the output frame resolution was 1280x720
rage GPC reference image size was non-lossy LZW
compression. Over the campus 100Mb network the average time for transferring a GPC reference image with depth is 5.04 seconds. All transfer times are
the time the client issues the request to the time the client has finished uncompressing the
Once the client receives the GPC the
We have compared the GPC approach to the conventional approach of sending individual visualization frames. We tested several compression
lossy LZW and JPEG with 3 quality factors.
When sending each frame from the server the frame rate is below 2fps even when the frame is aggressively
ith the high The GPC approach on the other
hand provides a frame rate of over 60fps at the cost
image and frame resampled from it
) and corresponding PPC image and frame for comparison
Average per frame communication performance for
for various compression
Building GPC images from image data is straight forward. Each pixel in the GPC is looked up in the input PPC by evaluating the second order distortion
14 shows a GPC image of the Chicago area which allows the user to zoom in at the center without the pauses needed to download the next level of detail which are common
We have integrated the GPC framework into an application that sends images between a visualization
For a typical path through the Crater Lake dataset, the user requested two GPC reference images, which were used at the client to create 1,800 output frames. The GPC resolution was 2560x1440 and the output frame resolution was 1280x720
rage GPC reference image size was lossy LZW
compression. Over the campus 100Mb network the average time for transferring a GPC reference image with depth is 5.04 seconds. All transfer times are
the time the client issues the request to the time the client has finished uncompressing the
Once the client receives the GPC the
We have compared the GPC approach to the conventional approach of sending individual visualization frames. We tested several compression
lossy LZW and JPEG with 3 quality factors.
When sending each frame from the server the frame rate is below 2fps even when the frame is aggressively
ith the high The GPC approach on the other
hand provides a frame rate of over 60fps at the cost
image and frame resampled from it
) and corresponding PPC image and frame for comparison
90%
0.184
0.93
Average per frame communication performance for
for various compression
Building GPC images from image data is straight forward. Each pixel in the GPC is looked up in the input PPC by evaluating the second order distortion
shows a GPC image of the Chicago area which allows the user to zoom in at the center without the pauses needed to download the next level of detail which are common
We have integrated the GPC framework into an application that sends images between a visualization
For a typical path through the Crater Lake dataset, the user requested two GPC reference images, which were used at the client to create 1,800 output frames. The GPC resolution was 2560x1440 and the output frame resolution was 1280x720
rage GPC reference image size was lossy LZW
compression. Over the campus 100Mb network the average time for transferring a GPC reference image with depth is 5.04 seconds. All transfer times are
the time the client issues the request to the time the client has finished uncompressing the
Once the client receives the GPC the
We have compared the GPC approach to the conventional approach of sending individual visualization frames. We tested several compression
lossy LZW and JPEG with 3 quality factors.
When sending each frame from the server the frame rate is below 2fps even when the frame is aggressively
ith the high The GPC approach on the other
hand provides a frame rate of over 60fps at the cost
image and frame resampled from it
) and corresponding PPC image and frame for comparison
90%
0.184
0.93
Average per frame communication performance for
for various compression
Building GPC images from image data is straight forward. Each pixel in the GPC is looked up in the input PPC by evaluating the second order distortion
shows a GPC image of the Chicago area which allows the user to zoom in at the center without the pauses needed to download the next level of detail which are common to
We have integrated the GPC framework into an application that sends images between a visualization
For a typical path through the Crater Lake dataset, the user requested two GPC reference images, which were used at the client to create 1,800 output frames. The GPC resolution was 2560x1440 and the output frame resolution was 1280x720
rage GPC reference image size was lossy LZW
compression. Over the campus 100Mb network the average time for transferring a GPC reference image with depth is 5.04 seconds. All transfer times are
the time the client issues the request to the time the client has finished uncompressing the
Once the client receives the GPC the
We have compared the GPC approach to the conventional approach of sending individual visualization frames. We tested several compression
lossy LZW and JPEG with 3 quality factors.
When sending each frame from the server the frame rate is below 2fps even when the frame is aggressively
ith the high The GPC approach on the other
hand provides a frame rate of over 60fps at the cost of
image and frame resampled from it
) and corresponding PPC image and frame for comparison
Average per frame communication performance for
for various compression
Building GPC images from image data is straight forward. Each pixel in the GPC is looked up in the input PPC by evaluating the second order distortion
shows a GPC image of the Chicago area which allows the user to zoom in at the center without the pauses needed to
to
We have integrated the GPC framework into an application that sends images between a visualization
For a typical path through the Crater Lake dataset, the user requested two GPC reference images, which were used at the client to create 1,800 output frames. The GPC resolution was 2560x1440 and the output frame resolution was 1280x720
rage GPC reference image size was lossy LZW
compression. Over the campus 100Mb network the average time for transferring a GPC reference image with depth is 5.04 seconds. All transfer times are
the time the client issues the request to the time the client has finished uncompressing the
Once the client receives the GPC the
We have compared the GPC approach to the conventional approach of sending individual visualization frames. We tested several compression
lossy LZW and JPEG with 3 quality factors.
When sending each frame from the server the frame rate is below 2fps even when the frame is aggressively
ith the high The GPC approach on the other
of
9
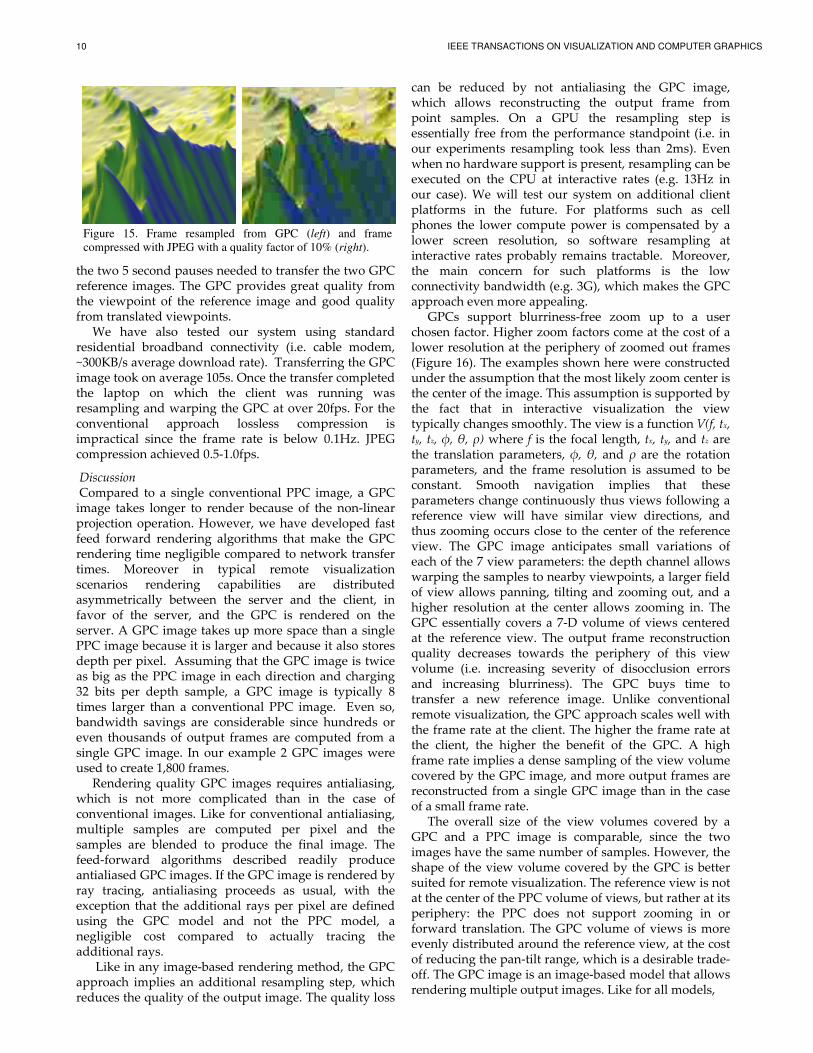
10 IEEE TRANSACTIONS ON VISUALIZATION AND COMPUTER GRAPHICS
the two 5 second pauses needed to transfer the two GPC reference images. The GPC provides great quality from the viewpoint of the reference image and good quality from translated viewpoints.
We have also tested our system using standard residential broadband connectivity (i.e. cable modem, ~300KB/s average download rate). Transferring the GPC image took on average 105s. Once the transfer completed the laptop on which the client was running was resampling and warping the GPC at over 20fps. For the conventional approach lossless compression is impractical since the frame rate is below 0.1Hz. JPEG compression achieved 0.5-1.0fps.
Discussion Compared to a single conventional PPC image, a GPC image takes longer to render because of the non-linear projection operation. However, we have developed fast feed forward rendering algorithms that make the GPC rendering time negligible compared to network transfer times. Moreover in typical remote visualization scenarios rendering capabilities are distributed asymmetrically between the server and the client, in favor of the server, and the GPC is rendered on the server. A GPC image takes up more space than a single PPC image because it is larger and because it also stores depth per pixel. Assuming that the GPC image is twice as big as the PPC image in each direction and charging 32 bits per depth sample, a GPC image is typically 8 times larger than a conventional PPC image. Even so, bandwidth savings are considerable since hundreds or even thousands of output frames are computed from a single GPC image. In our example 2 GPC images were used to create 1,800 frames.
Rendering quality GPC images requires antialiasing, which is not more complicated than in the case of conventional images. Like for conventional antialiasing, multiple samples are computed per pixel and the samples are blended to produce the final image. The feed-forward algorithms described readily produce antialiased GPC images. If the GPC image is rendered by ray tracing, antialiasing proceeds as usual, with the exception that the additional rays per pixel are defined using the GPC model and not the PPC model, a negligible cost compared to actually tracing the additional rays.
Like in any image-based rendering method, the GPC approach implies an additional resampling step, which reduces the quality of the output image. The quality loss
can be reduced by not antialiasing the GPC image, which allows reconstructing the output frame from point samples. On a GPU the resampling step is essentially free from the performance standpoint (i.e. in our experiments resampling took less than 2ms). Even when no hardware support is present, resampling can be executed on the CPU at interactive rates (e.g. 13Hz in our case). We will test our system on additional client platforms in the future. For platforms such as cell phones the lower compute power is compensated by a lower screen resolution, so software resampling at interactive rates probably remains tractable. Moreover, the main concern for such platforms is the low connectivity bandwidth (e.g. 3G), which makes the GPC approach even more appealing.
GPCs support blurriness-free zoom up to a user chosen factor. Higher zoom factors come at the cost of a lower resolution at the periphery of zoomed out frames (Figure 16). The examples shown here were constructed under the assumption that the most likely zoom center is the center of the image. This assumption is supported by the fact that in interactive visualization the view typically changes smoothly. The view is a function V(f, tx, ty, tz, φ, θ, ρ) where f is the focal length, tx, ty, and tz are the translation parameters, φ, θ, and ρ are the rotation parameters, and the frame resolution is assumed to be constant. Smooth navigation implies that these parameters change continuously thus views following a reference view will have similar view directions, and thus zooming occurs close to the center of the reference view. The GPC image anticipates small variations of each of the 7 view parameters: the depth channel allows warping the samples to nearby viewpoints, a larger field of view allows panning, tilting and zooming out, and a higher resolution at the center allows zooming in. The GPC essentially covers a 7-D volume of views centered at the reference view. The output frame reconstruction quality decreases towards the periphery of this view volume (i.e. increasing severity of disocclusion errors and increasing blurriness). The GPC buys time to transfer a new reference image. Unlike conventional remote visualization, the GPC approach scales well with the frame rate at the client. The higher the frame rate at the client, the higher the benefit of the GPC. A high frame rate implies a dense sampling of the view volume covered by the GPC image, and more output frames are reconstructed from a single GPC image than in the case of a small frame rate.
The overall size of the view volumes covered by a GPC and a PPC image is comparable, since the two images have the same number of samples. However, the shape of the view volume covered by the GPC is better suited for remote visualization. The reference view is not at the center of the PPC volume of views, but rather at its periphery: the PPC does not support zooming in or forward translation. The GPC volume of views is more evenly distributed around the reference view, at the cost of reducing the pan-tilt range, which is a desirable trade-off. The GPC image is an image-based model that allows rendering multiple output images. Like for all models,
Figure 15. Frame resampled from GPC (left) and frame
compressed with JPEG with a quality factor of 10% (right).
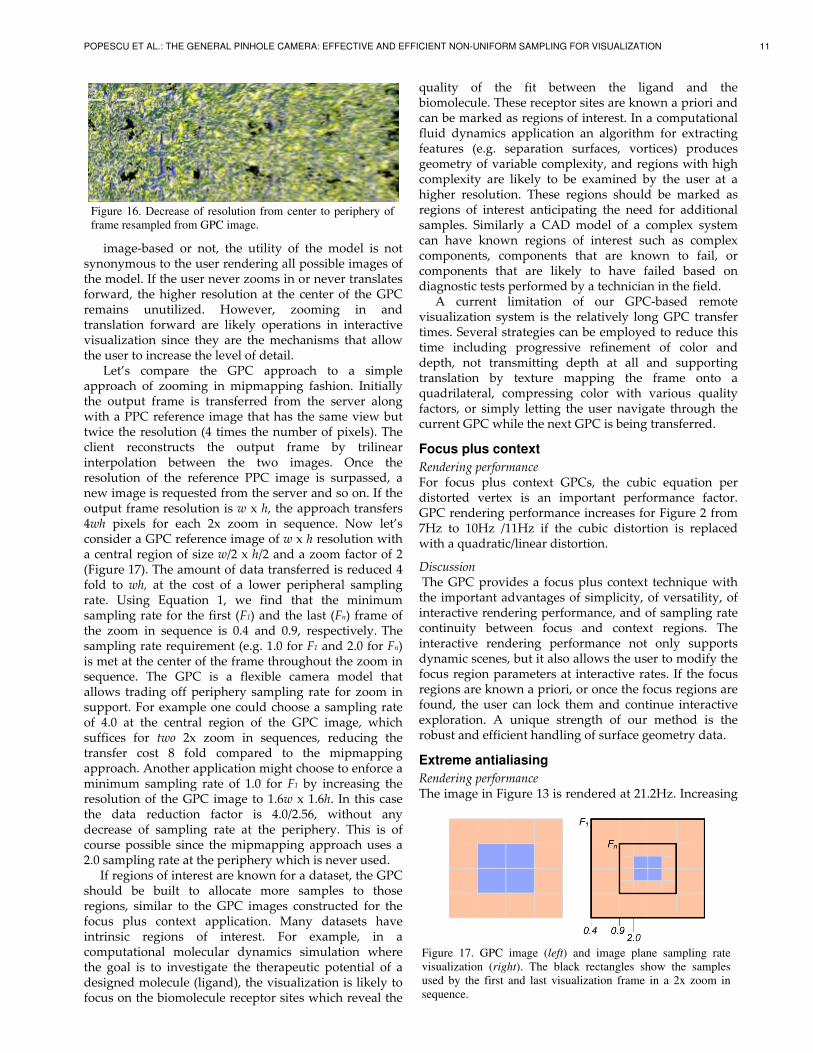
POPESCU ET AL.: THE GENERAL PINHOLE CAMERA: EFFECTIVE AND EFFICIENT NON-UNIFORM SAMPLING FOR VISUALIZATION 11
image-based or not, the utility of the model is not synonymous to the user rendering all possible images of the model. If the user never zooms in or never translates forward, the higher resolution at the center of the GPC remains unutilized. However, zooming in and translation forward are likely operations in interactive visualization since they are the mechanisms that allow the user to increase the level of detail.
Let’s compare the GPC approach to a simple approach of zooming in mipmapping fashion. Initially the output frame is transferred from the server along with a PPC reference image that has the same view but twice the resolution (4 times the number of pixels). The client reconstructs the output frame by trilinear interpolation between the two images. Once the resolution of the reference PPC image is surpassed, a new image is requested from the server and so on. If the output frame resolution is w x h, the approach transfers 4wh pixels for each 2x zoom in sequence. Now let’s consider a GPC reference image of w x h resolution with a central region of size w/2 x h/2 and a zoom factor of 2 (Figure 17). The amount of data transferred is reduced 4 fold to wh, at the cost of a lower peripheral sampling rate. Using Equation 1, we find that the minimum sampling rate for the first (F1) and the last (Fn) frame of the zoom in sequence is 0.4 and 0.9, respectively. The sampling rate requirement (e.g. 1.0 for F1 and 2.0 for Fn) is met at the center of the frame throughout the zoom in sequence. The GPC is a flexible camera model that allows trading off periphery sampling rate for zoom in support. For example one could choose a sampling rate of 4.0 at the central region of the GPC image, which suffices for two 2x zoom in sequences, reducing the transfer cost 8 fold compared to the mipmapping approach. Another application might choose to enforce a minimum sampling rate of 1.0 for F1 by increasing the resolution of the GPC image to 1.6w x 1.6h. In this case the data reduction factor is 4.0/2.56, without any decrease of sampling rate at the periphery. This is of course possible since the mipmapping approach uses a 2.0 sampling rate at the periphery which is never used.
If regions of interest are known for a dataset, the GPC should be built to allocate more samples to those regions, similar to the GPC images constructed for the focus plus context application. Many datasets have intrinsic regions of interest. For example, in a computational molecular dynamics simulation where the goal is to investigate the therapeutic potential of a designed molecule (ligand), the visualization is likely to focus on the biomolecule receptor sites which reveal the
quality of the fit between the ligand and the biomolecule. These receptor sites are known a priori and can be marked as regions of interest. In a computational fluid dynamics application an algorithm for extracting features (e.g. separation surfaces, vortices) produces geometry of variable complexity, and regions with high complexity are likely to be examined by the user at a higher resolution. These regions should be marked as regions of interest anticipating the need for additional samples. Similarly a CAD model of a complex system can have known regions of interest such as complex components, components that are known to fail, or components that are likely to have failed based on diagnostic tests performed by a technician in the field.
A current limitation of our GPC-based remote visualization system is the relatively long GPC transfer times. Several strategies can be employed to reduce this time including progressive refinement of color and depth, not transmitting depth at all and supporting translation by texture mapping the frame onto a quadrilateral, compressing color with various quality factors, or simply letting the user navigate through the current GPC while the next GPC is being transferred.
Focus plus context
Rendering performance For focus plus context GPCs, the cubic equation per distorted vertex is an important performance factor. GPC rendering performance increases for Figure 2 from 7Hz to 10Hz /11Hz if the cubic distortion is replaced with a quadratic/linear distortion.
Discussion The GPC provides a focus plus context technique with the important advantages of simplicity, of versatility, of interactive rendering performance, and of sampling rate continuity between focus and context regions. The interactive rendering performance not only supports dynamic scenes, but it also allows the user to modify the focus region parameters at interactive rates. If the focus regions are known a priori, or once the focus regions are found, the user can lock them and continue interactive exploration. A unique strength of our method is the robust and efficient handling of surface geometry data.
Extreme antialiasing
Rendering performance The image in Figure 13 is rendered at 21.2Hz. Increasing
Figure 16. Decrease of resolution from center to periphery of
frame resampled from GPC image.
Figure 17. GPC image (left) and image plane sampling rate
visualization (right). The black rectangles show the samples
used by the first and last visualization frame in a 2x zoom in
sequence.
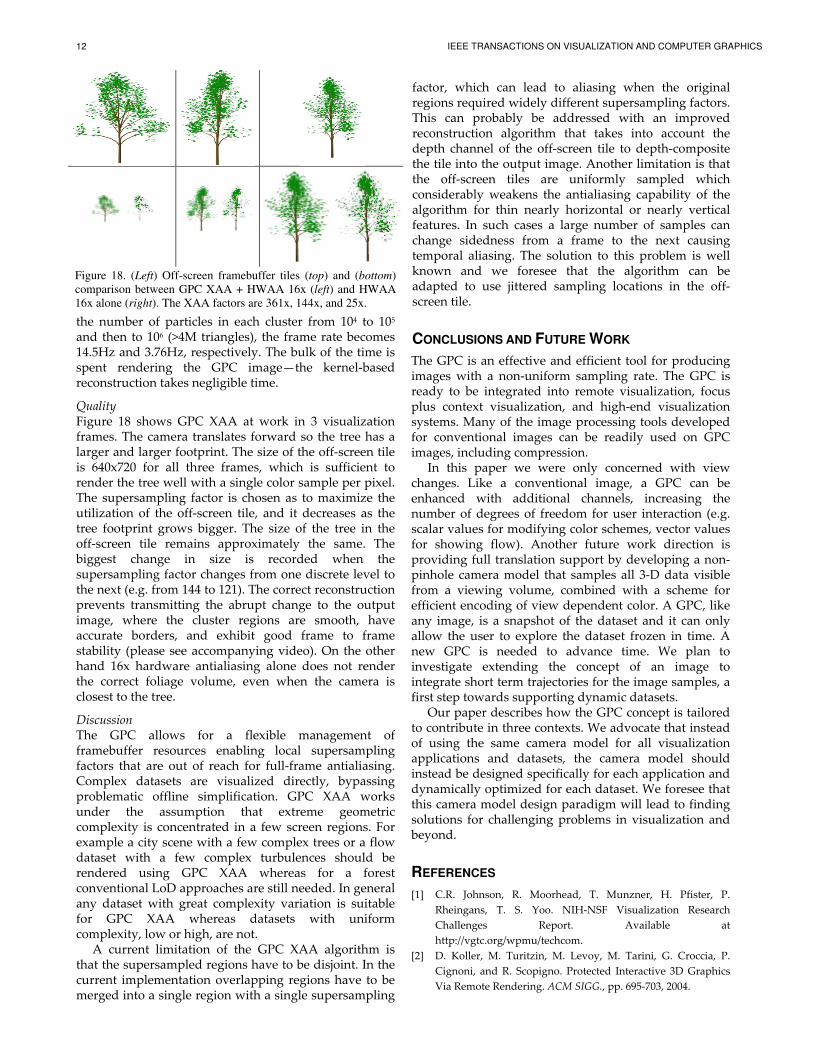
12 IEEE TRANSACTIONS ON VISUALIZATION AND COMPUTER GRAPHICS
the number of particles in each cluster from 104 to 105 and then to 106 (>4M triangles), the frame rate becomes 14.5Hz and 3.76Hz, respectively. The bulk of the time is spent rendering the GPC image—the kernel-based reconstruction takes negligible time.
Quality Figure 18 shows GPC XAA at work in 3 visualization frames. The camera translates forward so the tree has a larger and larger footprint. The size of the off-screen tile is 640x720 for all three frames, which is sufficient to render the tree well with a single color sample per pixel. The supersampling factor is chosen as to maximize the utilization of the off-screen tile, and it decreases as the tree footprint grows bigger. The size of the tree in the off-screen tile remains approximately the same. The biggest change in size is recorded when the supersampling factor changes from one discrete level to the next (e.g. from 144 to 121). The correct reconstruction prevents transmitting the abrupt change to the output image, where the cluster regions are smooth, have accurate borders, and exhibit good frame to frame stability (please see accompanying video). On the other hand 16x hardware antialiasing alone does not render the correct foliage volume, even when the camera is closest to the tree.
Discussion The GPC allows for a flexible management of framebuffer resources enabling local supersampling factors that are out of reach for full-frame antialiasing. Complex datasets are visualized directly, bypassing problematic offline simplification. GPC XAA works under the assumption that extreme geometric complexity is concentrated in a few screen regions. For example a city scene with a few complex trees or a flow dataset with a few complex turbulences should be rendered using GPC XAA whereas for a forest conventional LoD approaches are still needed. In general any dataset with great complexity variation is suitable for GPC XAA whereas datasets with uniform complexity, low or high, are not.
A current limitation of the GPC XAA algorithm is that the supersampled regions have to be disjoint. In the current implementation overlapping regions have to be merged into a single region with a single supersampling
factor, which can lead to aliasing when the original regions required widely different supersampling factors. This can probably be addressed with an improved reconstruction algorithm that takes into account the depth channel of the off-screen tile to depth-composite the tile into the output image. Another limitation is that the off-screen tiles are uniformly sampled which considerably weakens the antialiasing capability of the algorithm for thin nearly horizontal or nearly vertical features. In such cases a large number of samples can change sidedness from a frame to the next causing temporal aliasing. The solution to this problem is well known and we foresee that the algorithm can be adapted to use jittered sampling locations in the off-screen tile.
CONCLUSIONS AND FUTURE WORK
The GPC is an effective and efficient tool for producing images with a non-uniform sampling rate. The GPC is ready to be integrated into remote visualization, focus plus context visualization, and high-end visualization systems. Many of the image processing tools developed for conventional images can be readily used on GPC images, including compression.
In this paper we were only concerned with view changes. Like a conventional image, a GPC can be enhanced with additional channels, increasing the number of degrees of freedom for user interaction (e.g. scalar values for modifying color schemes, vector values for showing flow). Another future work direction is providing full translation support by developing a non-pinhole camera model that samples all 3-D data visible from a viewing volume, combined with a scheme for efficient encoding of view dependent color. A GPC, like any image, is a snapshot of the dataset and it can only allow the user to explore the dataset frozen in time. A new GPC is needed to advance time. We plan to investigate extending the concept of an image to integrate short term trajectories for the image samples, a first step towards supporting dynamic datasets.
Our paper describes how the GPC concept is tailored to contribute in three contexts. We advocate that instead of using the same camera model for all visualization applications and datasets, the camera model should instead be designed specifically for each application and dynamically optimized for each dataset. We foresee that this camera model design paradigm will lead to finding solutions for challenging problems in visualization and beyond.
REFERENCES
[1] C.R. Johnson, R. Moorhead, T. Munzner, H. Pfister, P.
Rheingans, T. S. Yoo. NIH-NSF Visualization Research
Challenges Report. Available at
http://vgtc.org/wpmu/techcom.
[2] D. Koller, M. Turitzin, M. Levoy, M. Tarini, G. Croccia, P.
Cignoni, and R. Scopigno. Protected Interactive 3D Graphics
Via Remote Rendering. ACM SIGG., pp. 695-703, 2004.
Figure 18. (Left) Off-screen framebuffer tiles (top) and (bottom)
comparison between GPC XAA + HWAA 16x (left) and HWAA
16x alone (right). The XAA factors are 361x, 144x, and 25x.
POPESCU ET AL.: THE GENERAL PINHOLE CAMERA: EFFECTIVE AND EFFICIENT NON-UNIFORM SAMPLING FOR VISUALIZATION 13
[3] S. P. Callahan, J. L. D. Comba, P. Shirley, and C. T. Silva.
Interactive Rendering of Large Unstructured Grids using
Dynamic Level-of-Detail. IEEE Vis.’05, pp. 199-206, 2005.
[4] D. Luebke, M. Reddy, J. Cohen, A. Varshney, et al. Level of
Detail for 3-D Graphics. Morgan-Kaufmann Publishers, 2002.
[5] S. P. Callahan, L. Bavoil, V. Pascucci, and C. T. Silva.
Progressive Volume Rendering of Large Unstructured Grids.
IEEE TVCG, pp. 1307-1314, 2006.
[6] H. Hoppe. Progressive Meshes. ACM SIGG., pp. 99-108, 1996.
[7] Y. Livnat, S.G. Parker, C.R. Johnson. Fast Isosurface Extraction
Methods for Large Image Data Sets. In Handbook of Medical
Imaging, Academic Press, pp. 731--745, 2000.
[8] A. Gyulassy, V. Natarajan, V. Pascucci, P.-T. Bremer, and B.
Hamann. Topology-Based Simplification for Feature
Extraction from 3-D Scalar Fields. IEEE Vis. ‘05, pp. 272-280,
2005.
[9] S. Pesco, P. Lindstrom, V. Pascucci, and C. Silva. Implicit
Occluders. In IEEE/SIGGRAPH Symp. on Volume Visualization,
pp. 47-54, 2004.
[10] J. Gao and H.-W. Shen. Parallel View-Dependent Isosurface
Extraction Using Multi-Pass Occlusion Culling. In IEEE Symp.
on Parallel and Large Data Vis. and Graphics, pp. 67-74, 2001.
[11] L. Lippert, M. H. Gross, and C. Kurmann. Compression
Domain Volume Rendering for Distributed Environments.
Computer Graphics Forum, 16(3):C95-C107, 1997.
[12] M. Isenburg, P. Lindstrom, and J. Snoeyink. Streaming
Compression of Triangle Meshes. Symp. on Geometry
Processing, pp. 111-118, 2005.
[13] A. Nye, editor. X Protocol Reference Manual. X Window
System Series. O’Reilly & Associates, 4th edition, January 1995.
[14] T. Richardson, Q. Stafford-Fraser, K. R. Wood, and A. Hopper.
Virtual Network Computing. IEEE Internet Computing, 2(1):33-
38, 1998.
[15] G. Klimeck, M. McLennan, S. P. Brophy, G. B. Adams III, M. S.
Lundstrom. nanoHUB.org: Advancing Education and
Research in Nanotech. Computing in Sci. and Engineering, 10(5),
pp. 17-23, 2008.
[16] S. Stegmaier, M. Magallón, and T. Ertl. A Generic Solution for
Hardware-Accelerated Remote Visualization. In EG/IEEE
TCVG Symp. on Data Visualization’02, pp. 87-94, 2002.
[17] Silicon Graphics, Inc. OpenGL Vizserver 3.0—Application-
Transparent Remote Interactive Vis. and Collaboration, 2003.
[18] F. Lamberti and A. Sanna. A Streaming-Based Solution for
Remote Vis. of 3-D Graphics on Mobile Devices. IEEE TVCG,
pp. 247-260, 2007.
[19] K.-L. Ma and D. M. Camp. High Performance Visualization of
Time-Varying Volume Data over a Wide-Area Network. In
SC’00.
[20] S. Stegmaier, J. Diepstraten, M. Weiler, and T. Ertl. Widening
the Remote Visualization Bottleneck. IEEE ISPA, pp. 1-6, 2003.
[21] E. J. Luke, C. D. Hansen. Semotus Visum: a Flexible Remote
Visualization Network. In Proceedings of the IEEE Conference on
Visualization ’02, pp. 61-68, 2002.
[22] W. Bethel, B. Tierney, J. Lee, D. Gunter, and S. Lau. Using
High-Speed WANs and Network Data Caches to enable
Remote and Distributed Visualization. In SC ’00, Article No.
28, 2000.
[23] G. W. Furnas. Generalized fisheye views. ACM CHI’86
Conference on Human Factors in Computer Systems, 16–23,
1986.
[24] J. Lamping and R. Rao. The Hyperbolic Browser: A focus +
context technique for visualizing large hierarchies. Journal of
Visual Languages and Computing, 7(1):33–35, 1996.
[25] N. Wong, M. S. T. Carpendale, and S. Greenberg. EdgeLens:
An interactive method for managing edge congestion in
graphs. IEEE Symposium on Information Visualization 2003, pp.
51–58, 2003.
[26] E. Pietriga and C. Appert. Sigma Lenses: Focus-Context
Transitions Combining Space, Time, and Translucence. In
Proceedings of 26th CHI’08, pp. 1343-1352, 2008.
[27] N. Elmqvist, N. Henry, Y. Riche, and J.-D. Fekete. Mélange:
Space Folding for Multi-Focus Interaction. CHI’08, 1333-1342.
[28] P. Baudisch, N. Good, and P. Stewart. Focus Plus Context
Screens: Combining Display Technology with Visualization
Techniques. In Proceedings of UIST 2001, pp. 31-40, 2001.
[29] M. S. T. Carpendale, D. J. Cowperthwaite, and D. F. Fracchia.
Distortion Viewing Techniques for 3-Dimensional Data. IEEE
Symposium on Information Visualization ’96, pp. 46-, 1996.
[30] N. Elmqvist. BalloonProbe: Reducing Occlusion in 3D using
Interactive Space Distortion. ACM Symposium on Virtual Reality
Software and Technology 2005, pp. 134-137, 2005.
[31] L. Wang, Y. Zhao, K. Mueller, and A. Kaufman. The Magic
Volume Lens: An Interactive Focus+Context Technique for
Volume Rendering. IEEE Visualization ’05, pp. 367-374, 2005.
[32] L. Williams. Pyramidal Parametrics. SIGG. ’83, 17(3), pp. 1-11,
1983.
[33] NVIDIA Corporation, http://www.nvidia.com
[34] ATI, AMD Corporation,
http://ati.amd.com/products/index.html
[35] A. Glassner. An Introduction to Ray Tracing. Acad Press,
1989.
[36] J.-D. Gascuel, N. Holzschuch, G. Fournier, and B. Péroche.
Fast Non-Linear Projections using Graphics Hardware. ACM
Symposium on Interactive 3-D Graphics, pp. 107-114, 2008.
[37] J. Yu and L. McMillan. General Linear Cameras. ECCV’04, pp.
14-27.
[38] C. Mei, V. Popescu, and E. Sacks. The Occlusion Camera.
Eurographics ‘05, CG Forum. vol. 24, issue 3, 2005.
[39] L. McMillan and G. Bishop. Plenoptic Modeling: an Image-
Based Rendering System. SIGGRAPH ’95, pp. 39-46, 1995.
[40] G. Johnson, J. Lee, C. A. Burns, W. R. Mark. The Irregular Z-
Buffer. ACM ToG, Volume 24, Issue 4, pp. 1462-1482, 2005.
[41] T. Aila and S. Laine. Alias-Free Shadow Maps. In Proceedings of
Eurographics Symposium on Rendering, pp. 161-166, 2004.
[42] L. Seiler et al. Larrabee: a Many-Core x86 Architecture for
Visual Computing. ACM Trans. on Graphics, (27):3, 2008.
[43] D. Whalen and M. L. Norman, "Competition data set and
description," in 2008 IEEE Visualization Design Contest, 2008
[44] USGS, Crater Lake National Park Digital Elevation Model,
http://oregonexplorer.info/craterlake/dem.html
[45] University of Illinois at Urbana-Champaign, Visual Molecular
Dynamics, http://www.ks.uiuc.edu/Research/vmd
[46] D. Laney, P.-T Bremer, A. Mascarenhas, P. Miller, and V.
Pascucci. Understanding the Structure of the Turbulent
Mixing Layer in Hydrodyn. Instabilities. In IEEE TVGG.,
(12):5, pp. 1053-1060, 2006.
[47] J. Yu, L. McMillan, and P. Sturm. State of the Art Report:
Multiperspective Rendering, Modeling, and Imaging. In
Eurographics 2008.
14
Computer Science Department of Purdue University. His research interests lie in the areas of computer graphics, computer vision, and visprojects include camera model design, perceptual evaluation of rendered imagery and 3D displays, research and development of 3D scene acquisition systems, and research, development, and assessment of next generation distance learnin
Paul's thesis project is on camera model design, but he has also participated in projects related to highvisualization of largecomputation using the fully programmable graphics processors, among other projects
Mathematics from Wartburg College. Prior to joining NAVAIR, Dr. Arns was the Associate Director and Research Scientist for the Envision Center at Purdue, and also held a courtesy Assistant Professor appointmGraphics Technology, where she taught a graduate course on virtual environments. Her research interests are in the areas of applied virtual environments, human factors and usability in virtual environments, and retime graphics.
Computer Science Department of Purdue University. His research interests lie in the areas of computer graphics, computer vision, and visprojects include camera model design, perceptual evaluation of rendered imagery and 3D displays, research and development of 3D scene acquisition systems, and research, development, and assessment of next generation distance learnin
Paul's thesis project is on camera model design, but he has also participated in projects related to highvisualization of largecomputation using the fully programmable graphics processors, among other projects
Mathematics from Wartburg College. Prior to joining NAVAIR, Dr. Arns was the Associate Director and Research Scientist for the Envision Center at Purdue, and also held a courtesy Assistant Professor appointment with the Purdue Department of Computer Graphics Technology, where she taught a graduate course on virtual environments. Her research interests are in the areas of applied virtual environments, human factors and usability in virtual environments, and retime graphics.
Computer Science Department of Purdue University. His research interests lie in the areas of computer graphics, computer vision, and visprojects include camera model design, perceptual evaluation of rendered imagery and 3D displays, research and development of 3D scene acquisition systems, and research, development, and assessment of next generation distance learnin
Paul's thesis project is on camera model design, but he has also participated in projects related to highvisualization of largecomputation using the fully programmable graphics processors, among other projects
Mathematics from Wartburg College. Prior to joining NAVAIR, Dr. Arns was the Associate Director and Research Scientist for the Envision Center at Purdue, and also held a courtesy Assistant Professor
ent with the Purdue Department of Computer Graphics Technology, where she taught a graduate course on virtual environments. Her research interests are in the areas of applied virtual environments, human factors and usability in virtual environments, and retime graphics.
Voicu Popescudegree in computer science from the Technical University of ClujRomania in 1995, and a Ph.D. degree in coUniversity of North Carolina at Chapel Hill, USA in 2001. He is an associate professor with the
Computer Science Department of Purdue University. His research interests lie in the areas of computer graphics, computer vision, and visprojects include camera model design, perceptual evaluation of rendered imagery and 3D displays, research and development of 3D scene acquisition systems, and research, development, and assessment of next generation distance learnin
Paul RosenPh.D. program in computer science at Purdue University. His research interests lie primarily in computer graphics and visualization, but also in computer vision, computerhuman interaction, and highperformance desktop computi
Paul's thesis project is on camera model design, but he has also participated in projects related to highvisualization of largecomputation using the fully programmable graphics processors, among other projects
Laura Arnsfor the Weapons Lethality Analysis Branch of the NAWCWD, NAVAIR, China Lake. Dr. Arns received her Ph.D. in Computer Science from Iowa State University in 2002, and also holds an M.S. in Computer Science from Iowa Staand a B.A. in Computer Science and
Mathematics from Wartburg College. Prior to joining NAVAIR, Dr. Arns was the Associate Director and Research Scientist for the Envision Center at Purdue, and also held a courtesy Assistant Professor
ent with the Purdue Department of Computer Graphics Technology, where she taught a graduate course on virtual environments. Her research interests are in the areas of applied virtual environments, human factors and usability in virtual environments, and re
Voicu Popescudegree in computer science from the Technical University of ClujRomania in 1995, and a Ph.D. degree in coUniversity of North Carolina at Chapel Hill, USA in 2001. He is an associate professor with the
Computer Science Department of Purdue University. His research interests lie in the areas of computer graphics, computer vision, and visprojects include camera model design, perceptual evaluation of rendered imagery and 3D displays, research and development of 3D scene acquisition systems, and research, development, and assessment of next generation distance learnin
Paul RosenPh.D. program in computer science at Purdue University. His research interests lie primarily in computer graphics and visualization, but also in computer vision, computerhuman interaction, and highperformance desktop computi
Paul's thesis project is on camera model design, but he has also participated in projects related to highvisualization of large-scale simulations and advanced computation using the fully programmable graphics processors, among other projects
Laura Arnsfor the Weapons Lethality Analysis Branch of the NAWCWD, NAVAIR, China Lake. Dr. Arns received her Ph.D. in Computer Science from Iowa State University in 2002, and also holds an M.S. in Computer Science from Iowa Staand a B.A. in Computer Science and
Mathematics from Wartburg College. Prior to joining NAVAIR, Dr. Arns was the Associate Director and Research Scientist for the Envision Center at Purdue, and also held a courtesy Assistant Professor
ent with the Purdue Department of Computer Graphics Technology, where she taught a graduate course on virtual environments. Her research interests are in the areas of applied virtual environments, human factors and usability in virtual environments, and re
Voicu Popescudegree in computer science from the Technical University of ClujRomania in 1995, and a Ph.D. degree in computer science from the University of North Carolina at Chapel Hill, USA in 2001. He is an associate professor with the
Computer Science Department of Purdue University. His research interests lie in the areas of computer graphics, computer vision, and visprojects include camera model design, perceptual evaluation of rendered imagery and 3D displays, research and development of 3D scene acquisition systems, and research, development, and assessment of next generation distance learnin
Paul RosenPh.D. program in computer science at Purdue University. His research interests lie primarily in computer graphics and visualization, but also in computer vision, computerhuman interaction, and highperformance desktop computi
Paul's thesis project is on camera model design, but he has also participated in projects related to high
scale simulations and advanced computation using the fully programmable graphics processors, among other projects
Laura Arnsfor the Weapons Lethality Analysis Branch of the NAWCWD, NAVAIR, China Lake. Dr. Arns received her Ph.D. in Computer Science from Iowa State University in 2002, and also holds an M.S. in Computer Science from Iowa Staand a B.A. in Computer Science and
Mathematics from Wartburg College. Prior to joining NAVAIR, Dr. Arns was the Associate Director and Research Scientist for the Envision Center at Purdue, and also held a courtesy Assistant Professor
ent with the Purdue Department of Computer Graphics Technology, where she taught a graduate course on virtual environments. Her research interests are in the areas of applied virtual environments, human factors and usability in virtual environments, and re
Voicu Popescudegree in computer science from the Technical University of ClujRomania in 1995, and a Ph.D. degree
mputer science from the University of North Carolina at Chapel Hill, USA in 2001. He is an associate professor with the
Computer Science Department of Purdue University. His research interests lie in the areas of computer graphics, computer vision, and visprojects include camera model design, perceptual evaluation of rendered imagery and 3D displays, research and development of 3D scene acquisition systems, and research, development, and assessment of next generation distance learning systems.
Paul Rosen is in the final year of his Ph.D. program in computer science at Purdue University. His research interests lie primarily in computer graphics and visualization, but also in computer vision, computerhuman interaction, and highperformance desktop computi
Paul's thesis project is on camera model design, but he has also participated in projects related to high
scale simulations and advanced computation using the fully programmable graphics processors, among other projects.
Laura Arns is a Computer Scientist for the Weapons Lethality Analysis Branch of the NAWCWD, NAVAIR, China Lake. Dr. Arns received her Ph.D. in Computer Science from Iowa State University in 2002, and also holds an M.S. in Computer Science from Iowa Staand a B.A. in Computer Science and
Mathematics from Wartburg College. Prior to joining NAVAIR, Dr. Arns was the Associate Director and Research Scientist for the Envision Center at Purdue, and also held a courtesy Assistant Professor
ent with the Purdue Department of Computer Graphics Technology, where she taught a graduate course on virtual environments. Her research interests are in the areas of applied virtual environments, human factors and usability in virtual environments, and re
Voicu Popescu degree in computer science from the Technical University of ClujRomania in 1995, and a Ph.D. degree
mputer science from the University of North Carolina at Chapel Hill, USA in 2001. He is an associate professor with the
Computer Science Department of Purdue University. His research interests lie in the areas of computer graphics, computer vision, and visualization. His current projects include camera model design, perceptual evaluation of rendered imagery and 3D displays, research and development of 3D scene acquisition systems, and research, development, and assessment of
g systems.
is in the final year of his Ph.D. program in computer science at Purdue University. His research interests lie primarily in computer graphics and visualization, but also in computer vision, computerhuman interaction, and highperformance desktop computi
Paul's thesis project is on camera model design, but he has also participated in projects related to high
scale simulations and advanced computation using the fully programmable graphics
is a Computer Scientist for the Weapons Lethality Analysis Branch of the NAWCWD, NAVAIR, China Lake. Dr. Arns received her Ph.D. in Computer Science from Iowa State University in 2002, and also holds an M.S. in Computer Science from Iowa Staand a B.A. in Computer Science and
Mathematics from Wartburg College. Prior to joining NAVAIR, Dr. Arns was the Associate Director and Research Scientist for the Envision Center at Purdue, and also held a courtesy Assistant Professor
ent with the Purdue Department of Computer Graphics Technology, where she taught a graduate course on virtual environments. Her research interests are in the areas of applied virtual environments, human factors and usability in virtual environments, and re
received a B.S. degree in computer science from the Technical University of ClujRomania in 1995, and a Ph.D. degree
mputer science from the University of North Carolina at Chapel Hill, USA in 2001. He is an associate professor with the
Computer Science Department of Purdue University. His research interests lie in the areas of computer
ualization. His current projects include camera model design, perceptual evaluation of rendered imagery and 3D displays, research and development of 3D scene acquisition systems, and research, development, and assessment of
g systems.
is in the final year of his Ph.D. program in computer science at Purdue University. His research interests lie primarily in computer graphics and visualization, but also in computer vision, computerhuman interaction, and highperformance desktop computi
Paul's thesis project is on camera model design, but he has also participated in projects related to high
scale simulations and advanced computation using the fully programmable graphics
is a Computer Scientist for the Weapons Lethality Analysis Branch of the NAWCWD, NAVAIR, China Lake. Dr. Arns received her Ph.D. in Computer Science from Iowa State University in 2002, and also holds an M.S. in Computer Science from Iowa State University and a B.A. in Computer Science and
Mathematics from Wartburg College. Prior to joining NAVAIR, Dr. Arns was the Associate Director and Research Scientist for the Envision Center at Purdue, and also held a courtesy Assistant Professor
ent with the Purdue Department of Computer Graphics Technology, where she taught a graduate course on virtual environments. Her research interests are in the areas of applied virtual environments, human factors and usability in virtual environments, and re
received a B.S. degree in computer science from the Technical University of ClujRomania in 1995, and a Ph.D. degree
mputer science from the University of North Carolina at Chapel Hill, USA in 2001. He is an associate professor with the
Computer Science Department of Purdue University. His research interests lie in the areas of computer
ualization. His current projects include camera model design, perceptual evaluation of rendered imagery and 3D displays, research and development of 3D scene acquisition systems, and research, development, and assessment of
is in the final year of his Ph.D. program in computer science at Purdue University. His research interests lie primarily in computer graphics and visualization, but also in computer vision, computerhuman interaction, and highperformance desktop computi
Paul's thesis project is on camera model design, but he has also participated in projects related to high
scale simulations and advanced computation using the fully programmable graphics
is a Computer Scientist for the Weapons Lethality Analysis Branch of the NAWCWD, NAVAIR, China Lake. Dr. Arns received her Ph.D. in Computer Science from Iowa State University in 2002, and also holds an M.S. in Computer
te University and a B.A. in Computer Science and
Mathematics from Wartburg College. Prior to joining NAVAIR, Dr. Arns was the Associate Director and Research Scientist for the Envision Center at Purdue, and also held a courtesy Assistant Professor
ent with the Purdue Department of Computer Graphics Technology, where she taught a graduate course on virtual environments. Her research interests are in the areas of applied virtual environments, human factors and usability in virtual environments, and re
received a B.S. degree in computer science from the Technical University of Cluj-Napoca, Romania in 1995, and a Ph.D. degree
mputer science from the University of North Carolina at Chapel Hill, USA in 2001. He is an associate professor with the
Computer Science Department of Purdue University. His research interests lie in the areas of computer
ualization. His current projects include camera model design, perceptual evaluation of rendered imagery and 3D displays, research and development of 3D scene acquisition systems, and research, development, and assessment of
is in the final year of his Ph.D. program in computer science at Purdue University. His research interests lie primarily in computer graphics and visualization, but also in computer vision, computerhuman interaction, and highperformance desktop computi
Paul's thesis project is on camera model design, but he has also participated in projects related to high-fidelity
scale simulations and advanced computation using the fully programmable graphics
is a Computer Scientist for the Weapons Lethality Analysis Branch of the NAWCWD, NAVAIR, China Lake. Dr. Arns received her Ph.D. in Computer Science from Iowa State University in 2002, and also holds an M.S. in Computer
te University and a B.A. in Computer Science and
Mathematics from Wartburg College. Prior to joining NAVAIR, Dr. Arns was the Associate Director and Research Scientist for the Envision Center at Purdue, and also held a courtesy Assistant Professor
ent with the Purdue Department of Computer Graphics Technology, where she taught a graduate course on virtual environments. Her research interests are in the areas of applied virtual environments, human factors and usability in virtual environments, and re
received a B.S. degree in computer science from the
Napoca, Romania in 1995, and a Ph.D. degree
mputer science from the University of North Carolina at Chapel Hill, USA in 2001. He is an associate professor with the
Computer Science Department of Purdue University. His research interests lie in the areas of computer
ualization. His current projects include camera model design, perceptual evaluation of rendered imagery and 3D displays, research and development of 3D scene acquisition systems, and research, development, and assessment of
is in the final year of his Ph.D. program in computer science at Purdue University. His research interests lie primarily in computer graphics and visualization, but also in computer vision, computerhuman interaction, and highperformance desktop computing.
Paul's thesis project is on camera model design, but he fidelity
scale simulations and advanced computation using the fully programmable graphics
is a Computer Scientist for the Weapons Lethality Analysis Branch of the NAWCWD, NAVAIR, China Lake. Dr. Arns received her Ph.D. in Computer Science from Iowa State University in 2002, and also holds an M.S. in Computer
te University and a B.A. in Computer Science and
Mathematics from Wartburg College. Prior to joining NAVAIR, Dr. Arns was the Associate Director and Research Scientist for the Envision Center at Purdue, and also held a courtesy Assistant Professor
ent with the Purdue Department of Computer Graphics Technology, where she taught a graduate course on virtual environments. Her research interests are in the areas of applied virtual environments, human factors and usability in virtual environments, and re
received a B.S. degree in computer science from the
Napoca, Romania in 1995, and a Ph.D. degree
mputer science from the University of North Carolina at Chapel Hill, USA in 2001. He is an associate professor with the
Computer Science Department of Purdue University. His research interests lie in the areas of computer
ualization. His current projects include camera model design, perceptual evaluation of rendered imagery and 3D displays, research and development of 3D scene acquisition systems, and research, development, and assessment of
is in the final year of his Ph.D. program in computer science at Purdue University. His research interests lie primarily in computer graphics and visualization, but also in computer vision, computer-human interaction, and high-
ng. Paul's thesis project is on camera model design, but he
fidelity scale simulations and advanced
computation using the fully programmable graphics
is a Computer Scientist for the Weapons Lethality Analysis Branch of the NAWCWD, NAVAIR, China Lake. Dr. Arns received her Ph.D. in Computer Science from Iowa State University in 2002, and also holds an M.S. in Computer
te University and a B.A. in Computer Science and
Mathematics from Wartburg College. Prior to joining NAVAIR, Dr. Arns was the Associate Director and Research Scientist for the Envision Center at Purdue, and also held a courtesy Assistant Professor
ent with the Purdue Department of Computer Graphics Technology, where she taught a graduate course on virtual environments. Her research interests are in the areas of applied virtual environments, human factors and usability in virtual environments, and real-
received a B.S. degree in computer science from the
Napoca, Romania in 1995, and a Ph.D. degree
mputer science from the University of North Carolina at Chapel Hill, USA in 2001. He is an associate professor with the
Computer Science Department of Purdue University. His research interests lie in the areas of computer
ualization. His current projects include camera model design, perceptual evaluation of rendered imagery and 3D displays, research and development of 3D scene acquisition systems, and research, development, and assessment of
is in the final year of his Ph.D. program in computer science at Purdue University. His research interests lie primarily in computer graphics and visualization, but also
ng. Paul's thesis project is on camera model design, but he
fidelity scale simulations and advanced
computation using the fully programmable graphics
is a Computer Scientist for the Weapons Lethality Analysis Branch of the NAWCWD, NAVAIR, China Lake. Dr. Arns received her Ph.D. in Computer Science from Iowa State University in 2002, and also holds an M.S. in Computer
te University and a B.A. in Computer Science and
Mathematics from Wartburg College. Prior to joining NAVAIR, Dr. Arns was the Associate Director and Research Scientist for the Envision Center at Purdue, and also held a courtesy Assistant Professor
ent with the Purdue Department of Computer Graphics Technology, where she taught a graduate course on virtual environments. Her research interests are in the areas of applied virtual environments, human
MSc in Applied Mathematics from Grenoble University ('98), both in Grenoble, France. He obtained his PhD in Computer Science ('02) from the University of Kaiserslautern, Germanymethods in vector and tensor vis concerned with the scalable visual analysis of very large multivariate datasets using powerful and versatile mathematical models. His research has found recent applications in fluid dynamics, solid mechanics, highenergy physianalysis.
illumination, including both diffuse color bleeding and specular focusing of light, but also extend to other interactive and realistic rendering prvisualization, and perceptual issues in rendering.
CAGD, geometric constraint solving, and applications in manufacturing and physical simulations. He led an interdisciplinary team to simulate and visualize the 9/11 attacks, most recentlTrade Center impact that was viewed on YouTube more than 7 million times. Hoffmann is the author of numerous articles and book chapters, and is on the editorial board of CAD, CAD&A, and CAGD.
IEEE TRANSACTIONS ON
MSc in Applied Mathematics from Grenoble University ('98), both in Grenoble, France. He obtained his PhD in Computer Science ('02) from the University of Kaiserslautern, Germanymethods in vector and tensor vis concerned with the scalable visual analysis of very large multivariate datasets using powerful and versatile mathematical models. His research has found recent applications in fluid dynamics, solid mechanics, highenergy physics, bioengineering, and medical image
illumination, including both diffuse color bleeding and specular focusing of light, but also extend to other interactive and realistic rendering prvisualization, and perceptual issues in rendering.
CAGD, geometric constraint solving, and applications in manufacturing and physical simulations. He led an interdisciplinary team to simulate and visualize the 9/11 attacks, most recentlTrade Center impact that was viewed on YouTube more than 7 million times. Hoffmann is the author of numerous articles and book chapters, and is on the editorial board of CAD, CAD&A, and CAGD.
IEEE TRANSACTIONS ON
MSc in Applied Mathematics from Grenoble University ('98), both in Grenoble, France. He obtained his PhD in Computer Science ('02) from the University of Kaiserslautern, Germanymethods in vector and tensor vis concerned with the scalable visual analysis of very large multivariate datasets using powerful and versatile mathematical models. His research has found recent applications in fluid dynamics, solid mechanics, high
cs, bioengineering, and medical image
illumination, including both diffuse color bleeding and specular focusing of light, but also extend to other interactive and realistic rendering prvisualization, and perceptual issues in rendering.
CAGD, geometric constraint solving, and applications in manufacturing and physical simulations. He led an interdisciplinary team to simulate and visualize the 9/11 attacks, most recentlTrade Center impact that was viewed on YouTube more than 7 million times. Hoffmann is the author of numerous articles and book chapters, and is on the editorial board of CAD, CAD&A, and CAGD.
IEEE TRANSACTIONS ON
Xavier TricocheProfessor of Computer Science at Purdue University. He was previously affiliated with the Scientific Computing and Imaging Institute at the University of Utah. He received a MSc in Computer Science from
MSc in Applied Mathematics from Grenoble University ('98), both in Grenoble, France. He obtained his PhD in Computer Science ('02) from the University of Kaiserslautern, Germanymethods in vector and tensor vis concerned with the scalable visual analysis of very large multivariate datasets using powerful and versatile mathematical models. His research has found recent applications in fluid dynamics, solid mechanics, high
cs, bioengineering, and medical image
Chris Wymanmathematics and computer science from the University of Minnesota in 1999 and a PhD in computer science from the University of Utah in 2004. He is currently an Assistant Professor of Computer Science at the University of Iowa. His research interests focus on interactive global
illumination, including both diffuse color bleeding and specular focusing of light, but also extend to other interactive and realistic rendering prvisualization, and perceptual issues in rendering.
Christoph M. Hoffmannof Computer Science at Purdue University. He graduated with a Ph.D. in computer science from the University of Wisconsin. The author of two monographs, Hoffmainterests span geometric modeling and computing, including MCAD,
CAGD, geometric constraint solving, and applications in manufacturing and physical simulations. He led an interdisciplinary team to simulate and visualize the 9/11 attacks, most recently the North Tower of the World Trade Center impact that was viewed on YouTube more than 7 million times. Hoffmann is the author of numerous articles and book chapters, and is on the editorial board of CAD, CAD&A, and CAGD.
IEEE TRANSACTIONS ON VISUALIZATION AND CO
Xavier TricocheProfessor of Computer Science at Purdue University. He was previously affiliated with the Scientific Computing and Imaging Institute at the University of Utah. He received a MSc in Computer Science from
MSc in Applied Mathematics from Grenoble University ('98), both in Grenoble, France. He obtained his PhD in Computer Science ('02) from the University of Kaiserslautern, Germany for his work on topological methods in vector and tensor vis concerned with the scalable visual analysis of very large multivariate datasets using powerful and versatile mathematical models. His research has found recent applications in fluid dynamics, solid mechanics, high
cs, bioengineering, and medical image
Chris Wymanmathematics and computer science from the University of Minnesota in 1999 and a PhD in computer science from the University of Utah in 2004. He is currently an Assistant Professor of Computer Science at the University of Iowa. His research interests focus on interactive global
illumination, including both diffuse color bleeding and specular focusing of light, but also extend to other interactive and realistic rendering prvisualization, and perceptual issues in rendering.
Christoph M. Hoffmannof Computer Science at Purdue University. He graduated with a Ph.D. in computer science from the University of Wisconsin. The author of two monographs, Hoffmainterests span geometric modeling and computing, including MCAD,
CAGD, geometric constraint solving, and applications in manufacturing and physical simulations. He led an interdisciplinary team to simulate and visualize the 9/11
y the North Tower of the World Trade Center impact that was viewed on YouTube more than 7 million times. Hoffmann is the author of numerous articles and book chapters, and is on the editorial board of CAD, CAD&A, and CAGD.
VISUALIZATION AND CO
Xavier TricocheProfessor of Computer Science at Purdue University. He was previously affiliated with the Scientific Computing and Imaging Institute at the University of Utah. He received a MSc in Computer Science from
MSc in Applied Mathematics from Grenoble University ('98), both in Grenoble, France. He obtained his PhD in Computer Science ('02) from the University of
for his work on topological methods in vector and tensor vis concerned with the scalable visual analysis of very large multivariate datasets using powerful and versatile mathematical models. His research has found recent applications in fluid dynamics, solid mechanics, high
cs, bioengineering, and medical image
Chris Wymanmathematics and computer science from the University of Minnesota in 1999 and a PhD in computer science from the University of Utah in 2004. He is currently an Assistant Professor of Computer Science at the University of Iowa. His research interests focus on interactive global
illumination, including both diffuse color bleeding and specular focusing of light, but also extend to other interactive and realistic rendering prvisualization, and perceptual issues in rendering.
Christoph M. Hoffmannof Computer Science at Purdue University. He graduated with a Ph.D. in computer science from the University of Wisconsin. The author of two monographs, Hoffmainterests span geometric modeling and computing, including MCAD,
CAGD, geometric constraint solving, and applications in manufacturing and physical simulations. He led an interdisciplinary team to simulate and visualize the 9/11
y the North Tower of the World Trade Center impact that was viewed on YouTube more than 7 million times. Hoffmann is the author of numerous articles and book chapters, and is on the editorial board of CAD, CAD&A, and CAGD.
VISUALIZATION AND CO
Xavier TricocheProfessor of Computer Science at Purdue University. He was previously affiliated with the Scientific Computing and Imaging Institute at the University of Utah. He received a MSc in Computer Science from ENSIMAG ('98) and a
MSc in Applied Mathematics from Grenoble University ('98), both in Grenoble, France. He obtained his PhD in Computer Science ('02) from the University of
for his work on topological methods in vector and tensor visualization. His research is concerned with the scalable visual analysis of very large multivariate datasets using powerful and versatile mathematical models. His research has found recent applications in fluid dynamics, solid mechanics, high
cs, bioengineering, and medical image
Chris Wyman received BS degrees in mathematics and computer science from the University of Minnesota in 1999 and a PhD in computer science from the University of Utah in 2004. He is currently an Assistant Professor of Computer Science at the University of Iowa. His research interests focus on interactive global
illumination, including both diffuse color bleeding and specular focusing of light, but also extend to other interactive and realistic rendering prvisualization, and perceptual issues in rendering.
Christoph M. Hoffmannof Computer Science at Purdue University. He graduated with a Ph.D. in computer science from the University of Wisconsin. The author of two monographs, Hoffmainterests span geometric modeling and computing, including MCAD,
CAGD, geometric constraint solving, and applications in manufacturing and physical simulations. He led an interdisciplinary team to simulate and visualize the 9/11
y the North Tower of the World Trade Center impact that was viewed on YouTube more than 7 million times. Hoffmann is the author of numerous articles and book chapters, and is on the editorial board of CAD, CAD&A, and CAGD.
VISUALIZATION AND CO
Xavier Tricoche Professor of Computer Science at Purdue University. He was previously affiliated with the Scientific Computing and Imaging Institute at the University of Utah. He received a MSc in Computer
ENSIMAG ('98) and a MSc in Applied Mathematics from Grenoble University ('98), both in Grenoble, France. He obtained his PhD in Computer Science ('02) from the University of
for his work on topological isualization. His research
is concerned with the scalable visual analysis of very large multivariate datasets using powerful and versatile mathematical models. His research has found recent applications in fluid dynamics, solid mechanics, high
cs, bioengineering, and medical image
received BS degrees in mathematics and computer science from the University of Minnesota in 1999 and a PhD in computer science from the University of Utah in 2004. He is currently an Assistant Professor of Computer Science at the University of Iowa. His research interests focus on interactive global
illumination, including both diffuse color bleeding and specular focusing of light, but also extend to other interactive and realistic rendering prvisualization, and perceptual issues in rendering.
Christoph M. Hoffmannof Computer Science at Purdue University. He graduated with a Ph.D. in computer science from the University of Wisconsin. The author of two monographs, Hoffmainterests span geometric modeling and computing, including MCAD,
CAGD, geometric constraint solving, and applications in manufacturing and physical simulations. He led an interdisciplinary team to simulate and visualize the 9/11
y the North Tower of the World Trade Center impact that was viewed on YouTube more than 7 million times. Hoffmann is the author of numerous articles and book chapters, and is on the editorial board of CAD, CAD&A, and CAGD.
VISUALIZATION AND CO
is an Assistant Professor of Computer Science at Purdue University. He was previously affiliated with the Scientific Computing and Imaging Institute at the University of Utah. He received a MSc in Computer
ENSIMAG ('98) and a MSc in Applied Mathematics from Grenoble University ('98), both in Grenoble, France. He obtained his PhD in Computer Science ('02) from the University of
for his work on topological isualization. His research
is concerned with the scalable visual analysis of very large multivariate datasets using powerful and versatile mathematical models. His research has found recent applications in fluid dynamics, solid mechanics, high
cs, bioengineering, and medical image
received BS degrees in mathematics and computer science from the University of Minnesota in 1999 and a PhD in computer science from the University of Utah in 2004. He is currently an Assistant Professor of Computer Science at the University of Iowa. His research interests focus on interactive global
illumination, including both diffuse color bleeding and specular focusing of light, but also extend to other interactive and realistic rendering prvisualization, and perceptual issues in rendering.
Christoph M. Hoffmann of Computer Science at Purdue University. He graduated with a Ph.D. in computer science from the University of Wisconsin. The author of two monographs, Hoffmainterests span geometric modeling and computing, including MCAD,
CAGD, geometric constraint solving, and applications in manufacturing and physical simulations. He led an interdisciplinary team to simulate and visualize the 9/11
y the North Tower of the World Trade Center impact that was viewed on YouTube more than 7 million times. Hoffmann is the author of numerous articles and book chapters, and is on the editorial board of CAD, CAD&A, and CAGD.
VISUALIZATION AND COMPUTER GRAPHICS
is an Assistant Professor of Computer Science at Purdue University. He was previously affiliated with the Scientific Computing and Imaging Institute at the University of Utah. He received a MSc in Computer
ENSIMAG ('98) and a MSc in Applied Mathematics from Grenoble University ('98), both in Grenoble, France. He obtained his PhD in Computer Science ('02) from the University of
for his work on topological isualization. His research
is concerned with the scalable visual analysis of very large multivariate datasets using powerful and versatile mathematical models. His research has found recent applications in fluid dynamics, solid mechanics, high
cs, bioengineering, and medical image
received BS degrees in mathematics and computer science from the University of Minnesota in 1999 and a PhD in computer science from the University of Utah in 2004. He is currently an Assistant Professor of Computer Science at the University of Iowa. His research interests focus on interactive global
illumination, including both diffuse color bleeding and specular focusing of light, but also extend to other interactive and realistic rendering prvisualization, and perceptual issues in rendering.
is professor of Computer Science at Purdue University. He graduated with a Ph.D. in computer science from the University of Wisconsin. The author of two monographs, Hoffmainterests span geometric modeling and computing, including MCAD,
CAGD, geometric constraint solving, and applications in manufacturing and physical simulations. He led an interdisciplinary team to simulate and visualize the 9/11
y the North Tower of the World Trade Center impact that was viewed on YouTube more than 7 million times. Hoffmann is the author of numerous articles and book chapters, and is on the editorial board of CAD, CAD&A, and CAGD.
MPUTER GRAPHICS
is an Assistant Professor of Computer Science at Purdue University. He was previously affiliated with the Scientific Computing and Imaging Institute at the University of Utah. He received a MSc in Computer
ENSIMAG ('98) and a MSc in Applied Mathematics from Grenoble University ('98), both in Grenoble, France. He obtained his PhD in Computer Science ('02) from the University of
for his work on topological isualization. His research
is concerned with the scalable visual analysis of very large multivariate datasets using powerful and versatile mathematical models. His research has found recent applications in fluid dynamics, solid mechanics, high
cs, bioengineering, and medical image
received BS degrees in mathematics and computer science from the University of Minnesota in 1999 and a PhD in computer science from the University of Utah in 2004. He is currently an Assistant Professor of Computer Science at the University of Iowa. His research interests focus on interactive global
illumination, including both diffuse color bleeding and specular focusing of light, but also extend to other interactive and realistic rendering problems, visualization, and perceptual issues in rendering.
is professor of Computer Science at Purdue University. He graduated with a Ph.D. in computer science from the University of Wisconsin. The author of two monographs, Hoffmainterests span geometric modeling and computing, including MCAD,
CAGD, geometric constraint solving, and applications in manufacturing and physical simulations. He led an interdisciplinary team to simulate and visualize the 9/11
y the North Tower of the World Trade Center impact that was viewed on YouTube more than 7 million times. Hoffmann is the author of numerous articles and book chapters, and is on the
MPUTER GRAPHICS
is an Assistant Professor of Computer Science at Purdue University. He was previously affiliated with the Scientific Computing and Imaging Institute at the University of Utah. He received a MSc in Computer
ENSIMAG ('98) and a MSc in Applied Mathematics from Grenoble University ('98), both in Grenoble, France. He obtained his PhD in Computer Science ('02) from the University of
for his work on topological isualization. His research
is concerned with the scalable visual analysis of very large multivariate datasets using powerful and versatile mathematical models. His research has found recent applications in fluid dynamics, solid mechanics, high
cs, bioengineering, and medical image
received BS degrees in mathematics and computer science from the University of Minnesota in 1999 and a PhD in computer science from the University of Utah in 2004. He is currently an Assistant Professor of Computer Science at the University of Iowa. His research interests focus on interactive global
illumination, including both diffuse color bleeding and specular focusing of light, but also extend to other
oblems,
is professor of Computer Science at Purdue University. He graduated with a Ph.D. in computer science from the University of Wisconsin. The author of two monographs, Hoffmann’s interests span geometric modeling and computing, including MCAD,
CAGD, geometric constraint solving, and applications in manufacturing and physical simulations. He led an interdisciplinary team to simulate and visualize the 9/11
y the North Tower of the World Trade Center impact that was viewed on YouTube more than 7 million times. Hoffmann is the author of numerous articles and book chapters, and is on the
MPUTER GRAPHICS
is an Assistant Professor of Computer Science at Purdue University. He was previously affiliated with the Scientific Computing and Imaging Institute at the University of Utah. He received a MSc in Computer
ENSIMAG ('98) and a MSc in Applied Mathematics from Grenoble University ('98), both in Grenoble, France. He obtained his PhD in Computer Science ('02) from the University of
for his work on topological isualization. His research
is concerned with the scalable visual analysis of very large multivariate datasets using powerful and versatile mathematical models. His research has found recent applications in fluid dynamics, solid mechanics, high-
cs, bioengineering, and medical image
received BS degrees in mathematics and computer science from the University of Minnesota in 1999 and a PhD in computer science from the University of Utah in 2004. He is currently an Assistant Professor of Computer Science at the University of Iowa. His research interests focus on interactive global
illumination, including both diffuse color bleeding and specular focusing of light, but also extend to other
oblems,
is professor of Computer Science at Purdue University. He graduated with a Ph.D. in computer science from the University of Wisconsin. The author
nn’s interests span geometric modeling and computing, including MCAD,
CAGD, geometric constraint solving, and applications in manufacturing and physical simulations. He led an interdisciplinary team to simulate and visualize the 9/11
y the North Tower of the World Trade Center impact that was viewed on YouTube more than 7 million times. Hoffmann is the author of numerous articles and book chapters, and is on the
MPUTER GRAPHICSMPUTER GRAPHICS